Abstract
A statistical study is conducted to understand how the Mascarene High (MH) of the southwest Indian Ocean affects the springtime climate of southeastern Africa, in response to global teleconnections. A temporal index of sea-level air pressure is formed and correlated with large-scale fields of sea temperature, winds, and rainfall in the period 1980–2024. The results suggests that the MH tends to intensify and shift westward during Pacific El Niño conditions via a standing wave train in the subtropical jet stream over the South Atlantic. As this happens, anticyclonic airflow draws moisture from the Mozambique Channel and drives it onto the Kalahari plateau via low-level jets over the Limpopo and Zambezi River valleys. The Sep–Nov rainfall increases ~1 mm/day across southern Africa, accompanied by cooler temperatures and lower potential evaporation. So the spring season starts with a smaller water deficit that could favor early-planted, short-cycle crops. Outstanding questions remain on the stability of Pacific teleconnections and coupling with the Indian Ocean Dipole.
1. Introduction
The climate of southeast (SE) Africa falls under the influence of subtropical anticyclones characterized by weak subsidence. The semi-permanent high-pressure cells of the South Atlantic and Southwest (SW) Indian Oceans join over SE Africa during the cold winter months (Jun–Aug) and part during the warm summer months (Dec–Feb). Subtropical trade winds are generated [1], but the large mountainous island of Madagascar (cf. Figure 1a,b) alters the airflow, so moisture advection to SE Africa is pulsed at intra-seasonal to inter-decadal timescales [2,3]. During the spring season (Sep–Nov) transition, the Mascarene High (MH) of the SW Indian Ocean intensifies and shifts poleward [4], redirecting trade winds around southern Madagascar and across the Mozambique Channel. The MH sustains an oceanic gyre which drives the warm Agulhas Current down the coast of SE Africa, moistening the lower atmosphere. However the unstable air often convects over the ocean, of little benefit to terrestrial food and water resources.
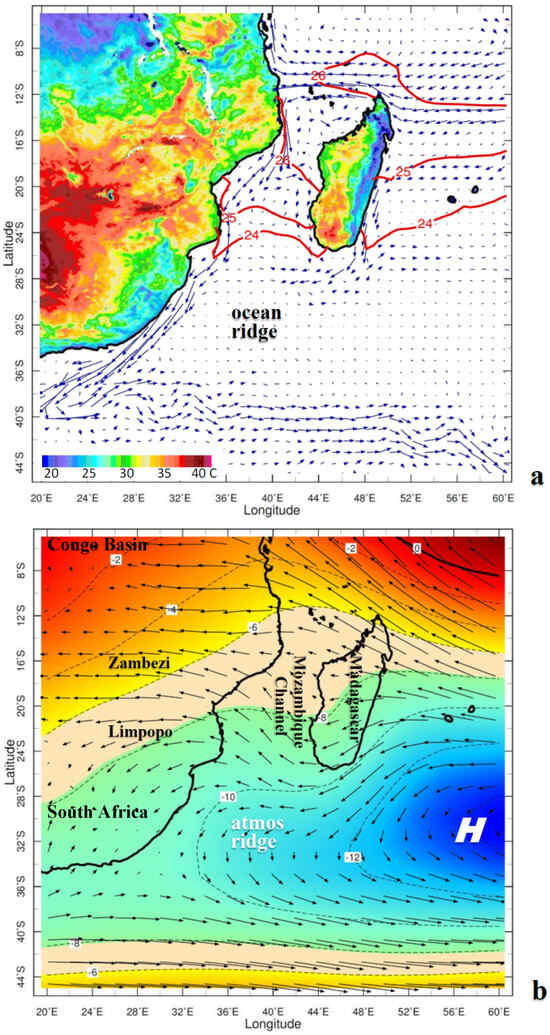
Figure 1.
Regional Sep–Nov 1990–2024 climatology of the study area: (a) satellite vegetation temperature, upper ocean currents (vector largest 1 m/s), and sea temperature > 24 °C (red contour); (b) average near-surface stream function (blue anticyclonic × 106 m2/s) and winds (vector largest 7 m/s). Ridge refers to the highest sea level forming the Agulhas Gyre.
The role of the MH in the springtime climate of SE Africa has not received much attention [5]. Sep–Nov is the warm dry windy season over most of the region, characterized by potential evaporation rates ~7 mm/day across the Zambezi Valley and Kalahari Plateau, which desiccate the vegetation and contribute to pyrogenic smoke plumes [6,7]. There is little agricultural productivity during springtime due to a lack of soil moisture. Although Pacific El Niño and warm/west Indian Ocean conditions bring rains to Tanzania in Sep–Nov [8], those seldom reach SE Africa. The background influence of global warming has led to increased potential evaporation [9] and poleward expansion of bi-modal convection [10], which could offer a path to offset risk.
Scientific advances in numerical data assimilation enable an improved understanding of feedback between global and regional circulations, and bring new insights to old questions. The objectives of this study are to (i) quantify springtime changes in the location and strength of the MH near SE Africa, (ii) determine whether air pressure changes are related to global forcing by sea temperatures and jet streams, and (iii) analyze the regional consequences for SE Africa climate. Section 2 outlines the data and methods; statistical outcomes are reported in Section 3 using an index of the MH. Section 4 closes with a summarizing discussion. This work is novel in that it considers how the global climate conspires with local weather conditions to alter the surface water balance and associated environmental resources.
2. Data and Methods
The study area of SE Africa and the SW Indian Ocean (Figure 1a) is well observed and offers an accurate 45 year history (1980–2024) of changes in the location and intensity of the Mascarene High at a spatial resolution of 10–50 km.
2.1. Data Sources
The satellite products employed here include NOAA vegetation temperature at a 10 km resolution [11] and net outgoing longwave radiation (OLR) at a 25 km resolution [12]. Rainfall is analyzed with the Chirps3 rain gauge satellite product [13] at a 5 km resolution. NASA’s Merra2 meteorological reanalysis [14] is used to describe the sea-level air pressure (SLP), potential evaporation, wind, vertical motion, surface temperature, velocity potential, and stream function at a 50 km resolution. The upper ocean (1–100 m) temperature and currents are analyzed from Soda4 reanalysis [15]. These references point to validations that support scientific interpretations; internet sources are listed in the acknowledgements. The analysis commences with SE Africa–SW Indian Ocean regional Sep–Nov climatology maps for vegetation temperature, ocean/atmosphere circulation, and wind stream function.
2.2. Statistical Methods
Springtime averages are used to evaluate year-to-year fluctuations of the MH near SE Africa in the period 1980–2024. First the Sep–Nov average and standard deviation of Merra2 SLP were calculated over the study area. High year-to-year variance emerged in the area 25–31° S, 28–31° E, (cf. Figure 2b, also in ERA5), which aligns with the atmospheric ridge that drives the oceanic gyre and Agulhas Current. SLP values were averaged over this MH index area, and a time series was formed for statistical analysis. The Sep–Nov SLP record was lag-correlated with the Pacific Nino3 SST index, wherein 43 degrees of freedom requires a Pearson’s product–moment R > |0.29| for 95% confidence.
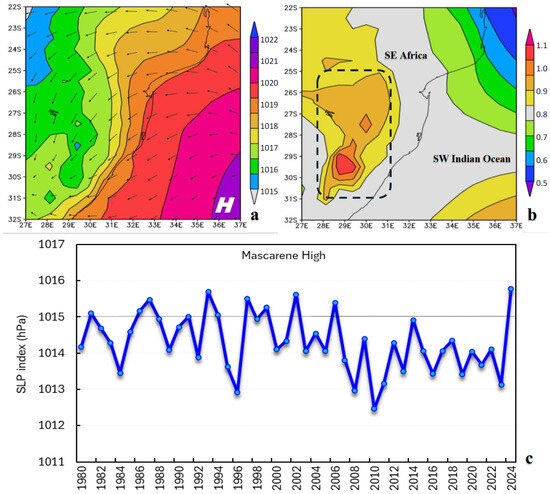
Figure 2.
Springtime (Sep–Nov) 1990–2024 air pressure reduced to sea level (SLP): (a) average and (b) standard deviation (hPa); near-surface wind vectors in (a) largest 5 m/s, index area dashed in (b). (c) Sep–Nov time series of the (SLP) MH index, indicating Mascarene High advance and retreat over SE Africa. Ten spring seasons above 1015 hPa (line) form the composites.
Point-to-field regressions were performed to identify global and regional associations with the MH index time series Sep–Nov 1980–2024. These included Sep–Nov fields of surface temperature, 500 hPa zonal wind, potential evaporation, and SLP. The same statistical threshold applies: R > |0.29| for 95% confidence. Within the time series, Sep–Nov values > 1015 hPa were identified as the top 10 spring seasons: 1981, 1986, 1987, 1993, 1994, 1997, 1999, 2002, 2006, and 2024, when the MH advances toward SE Africa. These years were employed to calculate composite anomaly maps and height sections of surface temperature, net OLR, upper level winds and velocity potential, zonal and meridional circulations (involving vertical motion), and rainfall departures. A case study was made of Sep–Nov 2024, using daily values of the MH index. SLP values reached 1033 hPa on 3 October 2024, and low-level wind, latent heat flux, net OLR, and height sections were analyzed for meteorological conditions, and back-trajectories were calculated over a 3-day period. Note that the MH index refers to coastal not mid-ocean intensification (cf. Figure 2b), and statistical outcomes suggest linkages, not causality.
3. Results
3.1. Climatology Maps and Temporal Character
The Sep–Nov climatology of vegetation temperature, ocean currents, sea temperature, surface wind, and stream function are presented in Figure 1a,b. Springtime surface temperatures over land are quite high: the dry subtropical zone (15–30° S) exceeds 35 °C. The southern fringe of Africa, the Congo basin, and eastern Madagascar are cloudy and cooler during the Sep–Nov season. Anticyclonic currents of the ocean gyre tend to split around Madagascar, more northwest than southwest. The poleward Agulhas Current hugs the SE coast and retroflects eastward in mid-latitudes. Although upper ocean temperatures reach 26 °C in the Mozambique Channel, deep convection is minimal during springtime.
Near-surface winds rotate counter-clockwise around the MH, forming an anticyclonic conveyor belt of easterlies north of and westerlies south of Madagascar. The entire SW Indian Ocean and SE Africa experiences negative stream function, which induces atmospheric subsidence. Diffluent trade winds impinging on Madagascar form a lee-side trough over the Mozambique Channel. As the airflow proceeds westward, the African escarpment tends to funnel the trade winds into the Limpopo and Zambezi River valleys. Enhanced MH conditions would redirect the circulation away from the Indian Monsoon, as it weakens during springtime. Thus northeasterly winds are prevalent over SE Africa in Sep–Nov.
Regional SLP maps of Sep–Nov average and standard deviation are presented in Figure 2a,b. The MH is evident off the coast of SE Africa with an average pressure of 1021 hPa at 31° S, 37° E. Variance exceeds 1 hPa over the SE Africa highlands. The Sep–Nov SLP index time series (Figure 2c) quantifies the advance and retreat of the MH, and reveals year-to-year fluctuations of 1012–1016 hPa that provide a basis for statistical analysis.
3.2. Point-to-Field Regression Maps
The MH index regression onto regional surface temperature and potential evaporation is presented in Figure 3a,b. Both show a similar response: when the MH advances toward SE Africa, cooler and cloudier springtime weather prevails across the Kalahari plateau and Madagascar. Only the SW coastal plains (Namib) experience downslope airflow and anomalous warm dry weather. Thus MH encroachment acts to limit the springtime surface water deficit over SE Africa.
Figure 3.
SE Africa SLP index regression onto Sep–Nov 1980–2024 field of: (a) surface temperature (°C), (b) potential evaporation (mm/day)—the double line delimits a bi-modal climate having two rainy seasons. Areas below 95% confidence are neutrally shaded.
Point-to-field regressions onto global sea temperature, SLP, and mid-tropospheric zonal wind are presented in Figure 4a–c. We find a dipole pattern in the Pacific consistent with El Niño conditions: warm in the equatorial east and cool in the Maritime Continent. The SLP regression features low-pressure cells in mid-latitudes of the South Pacific (150° W) and South Atlantic (20° W), and a high-pressure cell southeast of Africa (as expected). The 500 hPa zonal wind regression reveals an accelerated (+U) subtropical jet in the South Pacific and South Atlantic, and an opposing signal over SE Africa. Lag correlation of the Sep–Nov MH index with Nino3 SST (Figure 4d) demonstrates a significant positive correlation (R ~ 0.4) at a 0–6 month lead time: westward intensification of the MH precedes the relaxation of upwelling in the equatorial east Pacific. These patterns suggest that the linkage of El Niño and springtime MH derives from the mid-latitude Pacific South America (PSA) standing Rossby wave train [16].
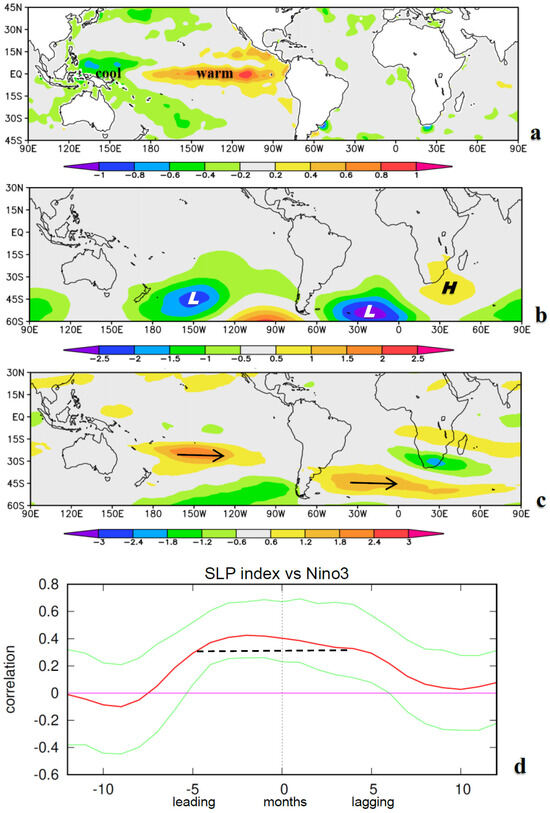
Figure 4.
SE Africa SLP index regression onto Sep–Nov 1980–2024 field of: (a) upper ocean temperatures (°C), (b) SL pressure (hPa), (c) 500 hPa zonal wind (m/s), areas below 95% confidence are neutrally shaded. (d) Temporal lag correlation of Sep–Nov SLP index and Pacific Nino3 SST 1980–2024, the Mascarene High leads. Dashed line refers to a statistical threshold, green lines are the tercile range.
3.3. Composite Anomaly Maps and Sections
The above point-to-field regressions involve all years, while anomalies below focus on the top-10 MH index composite (nearest SE Africa). Figure 5a–c presents global maps for net OLR, upper ocean temperature, upper level wind, and velocity potential. The El Niño dipole clearly emerges in these Sep–Nov composites: cool sea temperature, reduced convection, and upper convergence over the Maritime Continent (90–150° E); and opposing warm sea temperature, increased convection and upper divergence over the equatorial Pacific (100–170° W). The subtropical jet tends to accelerate over the South Pacific and South Atlantic during MH encroachment. The anomalous PSA wave train swerves equatorward over SE Africa, creating a standing mid-latitude ridge/subtropical trough pattern. There are zonal dipole patterns in upper velocity potential to the south of Africa (– at 0° E/+ at 50° E) and in net OLR anomalies across the equatorial Indian Ocean (– at 60° E/+ at 100° E). However there is no sea temperature dipole in the Indian Ocean, associated with the MH over SE Africa, thus IOD may be dissociated.
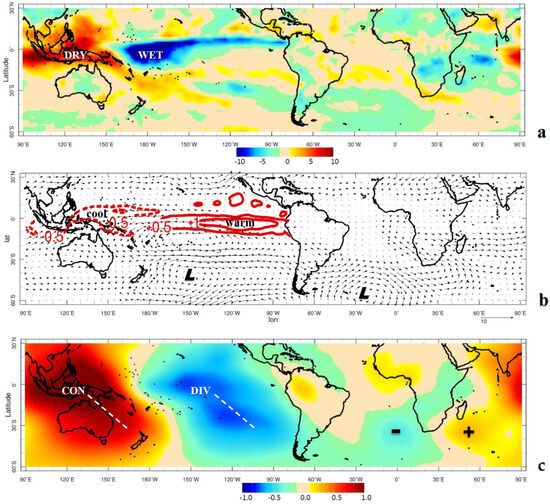
Figure 5.
Global composite of anomalies for top 10 Sep–Nov seasons based on the SLP index: (a) satellite net OLR (W/m2); (b) 250 hPa winds (vector largest 5 m/s) and 1–100 m sea temp > 0.5 °C (red contour) for top 10 Sep–Nov seasons; (c) global 250 hPa velocity potential (blue divergent × 106 m2/s) with labels and dashed lines for El Niño dipole in Sep–Nov season. Areas below 95% confidence are neutrally shaded or have small vectors.
The consequences of upper level PSA forcing emerge in regional composite anomaly maps and sections (Figure 6a–d). Low- and mid-level wind anomalies are easterly over SE Africa. An anomalous 500 hPa low-pressure cell forms over Botswana (20° S, 23° E) that instills cyclonic vorticity and uplifting motion. The result is a modest ~ 1 mm/day increase in rainfall across southern Africa and Madagascar, except for the SW coastal zone. Coupled with a decrease in surface temperature and potential evaporation, this represents an opportunity to sustain environmental resources during springtime, prior to the onset of El Niño-induced drought.
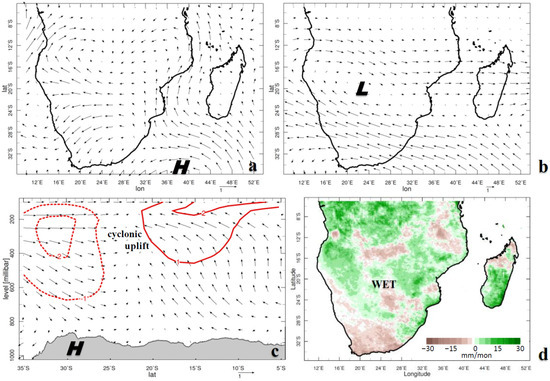
Figure 6.
Regional composite of anomalies for top 10 Sep–Nov seasons based on the SLP index: (a) near-surface wind (largest vector 1.5 m/s); (b) 500 hPa wind (largest vector 3 m/s; (c) height–latitude section on 25–32° E of meridional circulation (vector) and zonal wind anomalies (red contour) with elevation profile; and (d) SE Africa rainfall anomalies (mm/month)—green areas benefit from the Mascarene High during springtime. Areas below 95% confidence are neutrally shaded or have small vectors.
3.4. Case Study
The air–sea interactions and meteorological processes by which moisture is delivered to SE Africa by the Mascarene High deserve consideration. A case study is presented for Sep–Nov 2024, wherein the daily MH index (Figure 7a) reached 1033 hPa on 3 October. Weather maps of 925 hPa wind, latent heat flux, net OLR anomaly, and height sections of airflow are presented in Figure 7b–e. Anticyclonic winds of the MH sweep across the Mozambique Channel (cf. trajectories in Figure A1). The equatorward airflow is shallow and accelerates > 16 m/s next to Madagascar, generating a moisture flux > 400 W/m2 over the area 20–30° S, 35–45° E. A cloud band penetrates the Zambezi River valley (net OLR anomaly < −60 W/m2), supported by 20 m/s low-level jets at 22° S and 16° S. NE winds over the plateau during springtime (cf. Figure A2) are strengthened by the MH, providing topographically enhanced moisture advection and showers that ameliorate the surface water deficit.
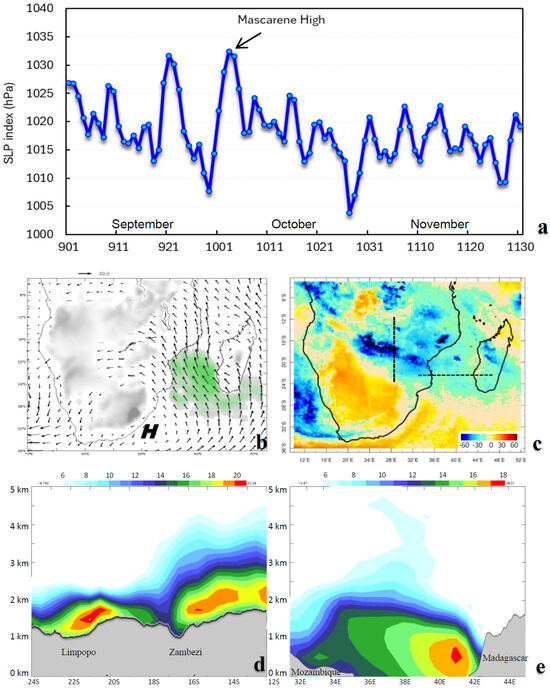
Figure 7.
(a) Sep–Nov 2024 daily record of SLP index, the arrow indicates our case study. Maps on 3 October 2024 of: (b) 925 hPa winds (vector), latent heat flux > 400 W/m2 (green shaded), highlands (gray shaded); (c) net OLR anomaly (W/m2), cloudy (blue) in the Zambezi valley; (d) 3 October 2024 height sections of westward airflow on 28° E; and (e) northward airflow on 22° S, along dashed lines in (c).
3.5. Seasonal Transition and Research Limitation
With a focus on Sep–Nov, a question remains: how does the PSA pattern (seen in Figure 4b,c and Figure 5b,c) evolve from austral spring to summer? During El Niño intensification, a Kelvin wave sweeps across the Pacific Ocean. Warmer equatorial temperatures further accelerate the southern subtropical jet and the atmospheric Rossby wave train shifts 30° downstream [17]. The MH retreats from SE Africa, leaving dry summer weather and anomalous southwesterly winds.
Although the this research provides a clear narrative, multi-year gaps in springtime MH response to PSA forcing (e.g., 2006–2024, cf. Figure 2c) bring uncertainty to the teleconnection and its benefits. A weak signal for the Indian Ocean Dipole (cf. Figure 4a and Figure 5b) suggests unstable coupling that deserves attention [18]. A further limitation is the dearth of research on springtime changes in the MH ridge near SE Africa.
4. Summarizing Discussion
An index of sea-level air pressure was formed to characterize the advance and retreat of the Mascarene High over SE Africa during springtime, based on Merra2 and comparative ERA5 reanalysis (Figure A3). This index was correlated with global and regional fields of sea temperature, winds, and rainfall in the period 1980–2024. Unexpectedly, a westward shift in the MH in Sep–Nov was found to be linked with the global ENSO phase. The statistical results suggested that the Mascarene High reacts to a standing PSA wave train in the southern hemisphere subtropical jet, thereby linking Pacific El Niño to spring rains over SE Africa.
The standing upper Rossby wave generates a mid-latitude ridge, subtropical trough, cyclonic vorticity, and widespread uplift over southern Africa. As the MH intensifies, up to 500 TW of latent heat is drawn from the warm Mozambique Channel. The moisture is driven onto the plateau via low-level jets over the Limpopo and Zambezi River valleys. The convection is shallow due to a long equatorward trajectory (cf. Figure A1) that instills subsidence, so precipitation is light but accompanied by cooler temperatures and lower potential evaporation. Hence the spring season starts with a smaller water deficit that could favor early-planted, short-cycle crops. The amplification of bi-modal rains during future El Niño events suggests that agricultural efforts in SE Africa could occasionally shift to the Sep–Nov months and take advantage of a westward-intensified Mascarene High.
An important caveat is that correlative metrics such as those presented herein, provide statistical evidence of links among processes, but do not imply causal dependence nor direct influence. Scientific questions remain on the stability of Pacific teleconnections and coupling with the Indian Ocean Dipole, and motivate ongoing research.
Funding
No direct funding was received for this work.
Data Availability Statement
The original contributions presented in this study are included in the article. Further inquiries can be directed to the corresponding author. A spreadsheet of data analysis is available by email request.
Acknowledgments
Outcome-based support from the South Africa Dept of Higher Education is acknowledged. Data were analyzed online via the IRI Climate Library, KNMI Climate Explorer, Univ Hawaii APDRC. An excel spreadsheet of data analysis is available on request.
Conflicts of Interest
The author declares no conflict of interest.
Appendix A

Figure A1.
Back-trajectory analysis over the period 2–4 October 2024, supporting the case study when the MH caused airflow towards Victoria Falls; map and height section (lower). Steady trajectories indicate quasi-stationary intensification of the MH.
Figure A1.
Back-trajectory analysis over the period 2–4 October 2024, supporting the case study when the MH caused airflow towards Victoria Falls; map and height section (lower). Steady trajectories indicate quasi-stationary intensification of the MH.


Figure A2.
Sep-Nov 1990–2020 wind rose at Polokwane airport (red dot in A1), demonstrating a prevalence for northeasterly winds from MH influence during spring-time.
Figure A2.
Sep-Nov 1990–2020 wind rose at Polokwane airport (red dot in A1), demonstrating a prevalence for northeasterly winds from MH influence during spring-time.


Figure A3.
ERA5 SLP standard deviation Sep-Nov 1990–2024, for comparison with Figure 2b.
Figure A3.
ERA5 SLP standard deviation Sep-Nov 1990–2024, for comparison with Figure 2b.

References
- Zhao, Y.; Wen, Z.; Li, X.; Chen, R.; Chen, G. Structure and maintenance mechanisms of the Mascarene High in austral winter. Int. J. Climatol. 2022, 42, 4700–4715. [Google Scholar] [CrossRef]
- Cook, K.H. The South Indian convergence zone and interannual rainfall variability over Southern Africa. J. Clim. 2000, 13, 3789–3804. [Google Scholar] [CrossRef]
- Morioka, Y.; Tozuka, T.; Yamagata, T. Climate variability in the southern Indian Ocean as revealed by self-organizing maps. Clim. Dyn. 2010, 35, 1075–1088. [Google Scholar] [CrossRef]
- Lee, S.; Mechoso, C.R.; Wang, C.; Neelin, J.D. Interhemispheric influence of the northern summer monsoons on southern subtropical anticyclones. J. Clim. 2013, 26, 10193–10204. [Google Scholar] [CrossRef]
- Xulu, N.G.; Chikoore, H.; Bopape, M.-J.; Nethengwe, N.S. Climatology of the Mascarene High and its influence on weather and climate over southern Africa. Climate 2020, 8, 86. [Google Scholar] [CrossRef]
- Jury, M.R. The dry season climate of tropical southern Africa and implications for pyrogenic emissions. S. Afr. J. Sci. 2000, 96, 387–390. [Google Scholar]
- Wang, Y.; Li, K.; Chen, X.; Yang, Z.; Tang, M.; Campos, P.M.D.; Yang, Y.; Yue, X.; Liao, H. Revisiting the high tropospheric ozone over southern Africa: Role of biomass burning and anthropogenic emissions. Atmos. Chem. Phys. 2025, 25, 4455–4475. [Google Scholar]
- Ficchi, A.; Cloke, H.; Neves, C.; Woolnough, S.; de Perez, E.C.; Zsoter, E.; Pinto, I.; Meque, A.; Stephens, E. Beyond El Niño: Unsung climate modes drive African floods. Weather Clim. Extrem. 2021, 33, 100345. [Google Scholar] [CrossRef]
- Cook, K.H.; Liu, Y.; Vizy, E.K. Congo Basin drying associated with poleward shifts of the African thermal lows. Clim. Dyn. 2020, 54, 863–883. [Google Scholar] [CrossRef]
- Engelbrecht, F.A.; Steinkopf, J.; Padavatan, J.; Midgley, G.F. Projections of future climate change in southern Africa and the potential for regional tipping points. In Sustainability of Southern African Ecosystems Under Global Change; Ecological Studies; Springer: Cham, Switzerland, 2024; Volume 248, pp. 169–190. [Google Scholar]
- NESDIS. Vegetation Condition Products Based on NOAA Satellite Radiance. 2021. Available online: https://www.star.nesdis.noaa.gov/smcd/emb/vci/VH/VH-Syst_10ap30.php (accessed on 1 August 2025).
- Lee, H.-T. Climate Algorithm Theoretical Basis Document: Outgoing Longwave Radiation (OLR); NOAA CDR program, ATBD-0526; NOAA: Washington, DC, USA, 2014; 46p. Available online: https://www.ncei.noaa.gov/pub/data/sds/cdr/CDRs/Outgoing%20Longwave%20Radiation%20-%20Daily/AlgorithmDescription_01B-21.pdf (accessed on 1 August 2025).
- Funk, C.; Verdin, A.; Michaelsen, J.; Peterson, P.; Pedreros, D.; Husak, G. CHIRPS: A global satellite-assisted precipitation climatology. Earth Syst. Sci. Data 2015, 7, 275–287. [Google Scholar] [CrossRef]
- Gelaro, R.; McCarty, W.; Suárez, M.J.; Todling, R.; Molod, A.; Takacs, L.; Randles, C.A.; Darmenov, A.; Bosilovich, M.G.; Reichle, R.; et al. The modern-era retrospective analysis for research and applications v2 (Merra2). J. Clim. 2017, 30, 5419–5454. [Google Scholar] [CrossRef] [PubMed]
- Carton, J.A.; Chepurin, G.A. SODA4, a mesoscale ocean-sea ice reanalysis. ESS Open Arch. 2023, 22541, 63382399. [Google Scholar]
- Mo, K.C.; Paegle, J.N. The Pacific–South American modes and their downstream effects. Int. J. Climatol. 2001, 21, 1211–1229. [Google Scholar] [CrossRef]
- Chikoore, H.; Jury, M.R. South African drought, deconstructed. Weather Clim. Extrem. 2021, 33, 100334. [Google Scholar] [CrossRef]
- Manatsa, D.; Morioka, Y.; Behera, S.K.; Matarira, C.H.; Yamagata, T. Impact of Mascarene high variability on the East African short rains. Clim. Dyn. 2014, 42, 1259–1274. [Google Scholar] [CrossRef]


Disclaimer/Publisher’s Note: The statements, opinions and data contained in all publications are solely those of the individual author(s) and contributor(s) and not of MDPI and/or the editor(s). MDPI and/or the editor(s) disclaim responsibility for any injury to people or property resulting from any ideas, methods, instructions or products referred to in the content. |
© 2025 by the author. Licensee MDPI, Basel, Switzerland. This article is an open access article distributed under the terms and conditions of the Creative Commons Attribution (CC BY) license (https://creativecommons.org/licenses/by/4.0/).