Abstract
The increasing occurrence of extreme rainfall events often leads to flash floods, infrastructure damage, loss of human life, and significant economic impacts. There is a pressing need for data-driven assessments and the application of robust analytical approaches to better understand these changes. Analyzing ground-level daily rainfall data from 1985 to 2023 from 26 monitoring stations, this study first employs the Mann–Kendall test using robust statistics including minimum, median, various quartiles, and maximum rainfall values for detecting long-term trends across Saudi Arabia. Next, the k-means clustering technique is applied to characterize the annual rainfall cycles across different regions of the country. Finally, the Peaks Over Threshold (POT) approach within Extreme Value Theory (EVT) is employed to identify site-specific thresholds for extreme rainfall using the Generalized Pareto Distribution (GPD). This automated, data-driven method offers a more objective alternative to the commonly used ad hoc percentile-based threshold selection, thereby enhancing the rigour and reproducibility of extreme rainfall analysis. Local specific thresholds were computed ranging from about 16 to 47 mm from Arar and Jazan, respectively. These thresholds were then used to calculate the frequency and intensity of extreme rainfall events. The fitted GPD parameters were further used to estimate return levels (RLs) for different return periods (2-, 5-, 10-, 20-, 50-, and 100-year) into the future. The results underscore considerable spatial variability in extreme rainfall behaviour across Saudi Arabia, with a higher likelihood of intense and infrequent precipitation events in the coming decades.
1. Introduction
Climate change is frequently manifested through changes in both the intensity and frequency of hydro-meteorological extremes, such as intense rainfall events. Climate change can profoundly affect precipitation regimes, leading to notable alterations in precipitation extremes through enhanced variability, shifts in distribution, changing drivers of climate, and widespread sectoral impacts, with vulnerable populations being especially at risk [1]. Global warming is projected to intensify the occurrence of extreme rainfall events in multiple regions worldwide [2]. Considerable modification in the recurrence of extreme events can be associated with small changes in variability rather than any change in the mean [3]. An evaluation of the trend in extremes on different timescales is vital to develop the adaptation policies that can address the future occurrence of extreme events for a country like Saudi Arabia [4].
Saharwardi et al. [5] reported that the droughts in the northern regions of the Arabian Peninsula (AP) followed a relatively similar temporal evolution to that in the southern regions. The Arabian Peninsula exhibited a significant drying trend with an abrupt acceleration in drought recurrence and severity during the last 20 years. The rise in drought occurrences has been linked to diminished synoptic activity and enhanced high-pressure systems over the AP [5]. Throughout history, prolonged droughts in the Arabian Peninsula have triggered large scale migration and even reshaped the course of civilization [6,7], as severe water shortages led to widespread food scarcity affecting both human communities and their livestock, undermining pastoral systems, agricultural productivity, and trade networks. Over the past few decades, the AP has experienced a marked rise in drought frequency and intensity, reflecting broader shifts in regional climate variability and increasing aridity [8,9,10]. This rise in drought is consistent with the lengthening of summer seasons over the same period [11] and a persistent increasing trend in regional temperatures [12]. However, precipitation patterns across the AP display considerable spatiotemporal variability [13,14].
Saudi Arabia falls within a semi-arid to arid climatic zone, characterized by low annual precipitation, extreme temperatures, scarce groundwater resources, and the absence of perennial rivers [15], with projections indicating an increased likelihood of future extreme climatic events [16]. Munir et al. [17] and ElKenawy and McCabe [18] analyzed the rainfall climatology, and trends in Saudi Arabia and reported that annual mean precipitation over Saudi Arabia was generally low and exhibited pronounced spatial and temporal variability across the country. The southwestern regions of the country typically received comparatively higher precipitation than the central and northern regions [18]. Intensified flash floods and prolonged droughts have had severe impacts on Saudi Arabia, and the impacts have been more severe in recent years [19]. The eastern, northern, and southwestern regions of the country have been more suffering from intensified flash floods in the last ten years or so [1,19]. In Saudi Arabia, episodes of extreme precipitation are typically caused by intense local convective activity, often enhanced by the combined influence of Mediterranean storm systems and the Active Red Sea Trough [20]. Such extreme precipitation events can have devastating effects on life and property in major Saudi Arabian cities. For instance, numerous heavy precipitations episodes recently have led to significant flooding [1,21], including the seventy four (74) mm/day rainfall that occurred on 25 November 2009, and the hundred and eleven (111) mm/day rainfall on 26 January 2011, both of which resulted in severe floods in the city of Jeddah [22]. Recently, Islam et al. [1] analyzed precipitation trend in Jazan, Saudi Arabia and reported that the average annual precipitation increased by 34.3 mm from the earlier decades (1978–2000) to recent decades (2001–2024), indicating a significant increasing trend in the amount of precipitation. Furthermore, Islam et al. [1] reported a significant move in the peak rainfall season from autumn (October) to summer (August) in recent decades, accompanied by a considerable increase in rainfall amount during August from 15.4 mm to 54.9 mm in recent decades.
Previously, Almazroui [4] analyzed rainfall trends and extremes in Saudi Arabia by quantifying as to how much extreme rainfall episodes contributed to total rainfall in the country. Almazroui [4] also quantified changes in both mean and extreme rainfall across five distinct climate regions. Almazroui [4] defined the threshold for extreme rainfall events using percentile values, identifying a daily rainfall exceeding 26 mm as an extreme event across Saudi Arabia. In this study, we present a data-driven automated approach for calculating thresholds based on Extreme Value Theory (EVT). Unlike conventional approaches that often rely on arbitrary thresholds, this study employs EVT with automated threshold selection using Generalized Pareto Distribution (GPD), enhancing objectivity and reproducibility. The automated method is important because it chooses thresholds for extreme rainfall based on the data itself, not based on personal judgement or using a fixed rule. This makes the analysis: (i) More accurate, which reflects what is actually happening at each location; (ii) More objective, which is less influenced by personal judgement or guesswork; and (iii) More consistent and repeatable, so other researchers can follow the same method and obtain similar results. This leads to more trustworthy results when studying extreme weather events like heavy rainfall.
While global studies have extensively explored the impacts of climate change on extreme precipitation, research focusing on Saudi Arabia remains relatively limited and fragmented. Most existing investigations rely on short-term records or reanalysis datasets, often lacking the spatial and temporal resolution needed to characterize localized extremes. Moreover, previous analyses have typically employed subjective or fixed percentile-based thresholds, which may not accurately capture spatial variations in rainfall intensity across the Kingdom’s diverse climatic zones. Addressing these gaps, the present study introduces an automated EVT-based thresholding framework applied to long-term station observations, providing a more objective and regionally consistent assessment of rainfall variability and extremes in Saudi Arabia.
This study aims to enhance the understanding of rainfall trends and extreme rainfall events in Saudi Arabia by pursuing the following objectives:
- To develop a data-driven, automated method for threshold estimation of extreme rainfall events using the Peaks Over Threshold (POT) approach within Extreme Value Theory (EVT), based on the Generalized Pareto Distribution (GPD), thereby improving objectivity, accuracy, and reproducibility compared to traditional percentile-based methods.
- To detect long-term trends in rainfall using the non-parametric Mann–Kendall test applied to robust statistical measures, including the first quartile (Q1), median (Q2), third quartile (Q3), and maximum rainfall values.
- To characterize regional rainfall patterns across Saudi Arabia by applying the k-means clustering algorithm to annual rainfall cycles, offering a data-driven classification beyond conventional regional divisions.
- To estimate site-specific return levels for extreme rainfall events for return periods of 2, 5, 10, 20, 50, and 100 years using the fitted GPD parameters.
- To analyze extreme rainfall trends in both the frequency and intensity exceeding the site-specific EVT-based thresholds.
Collectively, these advanced analytical methods improve the detection of subtle trends and emerging patterns in extreme rainfall events, offering valuable insights to inform climate adaptation strategies and hydrometeorological planning in vulnerable arid and semi-arid regions.
2. Methodology
2.1. Meteorological Monitoring Network
In this study, rainfall trends and cycles are characterized during the last four decades (1985–2023) utilizing ground level daily meteorological data from 26 monitoring stations across Saudi Arabia (Figure 1). The figure also shows the elevation of the monitoring stations, which presents a general east to west gradient. Munir et al. [17] have provided a detailed overview of the meteorological monitoring network and the prevailing climatic conditions across Saudi Arabia. This background is essential for understanding the spatial distribution of observational data and the broader climatic context within which this study’s analysis of rainfall trends and extremes is conducted. Comprehensive quality assurance and quality control (QA/QC) procedures were applied to all datasets used in this study. This included a thorough visual inspection of the rainfall time series data to identify anomalies, along with the removal of outliers that could skew the analysis. Standardized protocols as per World Meteorological Organization (WMO) recommendations were strictly followed during the installation and calibration of instruments, as well as during data collection, transmission, and storage, to ensure data reliability and consistency. Furthermore, homogeneity of the rainfall time series was assessed using the Standard Normal Homogeneity Test (SNHT), following Alexandersson [23] and its subsequent applications and evaluations [24,25]. The aim of the SNHT is to identify potential inhomogeneities or abrupt shifts in climatic time series, which may result from changes in instrumentation, observation practices, or station relocations. The results (Table 1) indicated that most stations (22 stations) showed low SNHT statistics (<10), suggesting that the rainfall series are largely homogeneous. Minor discontinuities were detected in a few stations (3 stations) with estimated SNHT statistics 10–15 (moderate inhomogeneity) and only Arar has SNHT value greater than 15 (inhomogeneity). More details are provided in Table 1.
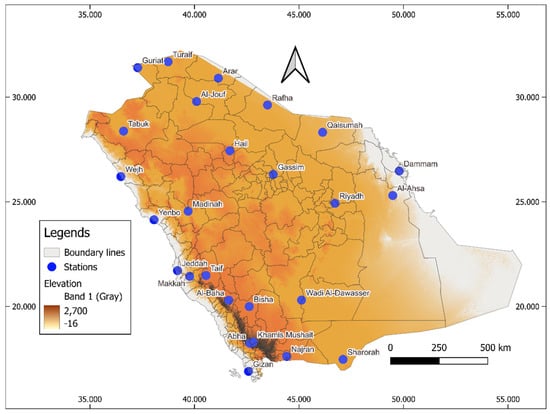
Figure 1.
Maps of elevation (m, from mean sea level) and location of meteorological monitoring stations in Saudi Arabia. The blue points show the location of the monitoring stations.

Table 1.
Standard Normal Homogeneity Test (SNHT) results for annual rainfall time series at 26 meteorological stations in Saudi Arabia. The table includes SNHT statistics and detected break years for stations with minor inhomogeneities.
It is important to acknowledge that all meteorological instruments have inherent measurement uncertainties, and this applies to precipitation sensors as well, which are particularly susceptible to external influences such as wind-induced undercatch and temperature-driven evaporation losses. Furthermore, the monitoring network across the study region is relatively sparse, which may have contributed to limitations in spatial coverage. This spatial variability could lead to an underrepresentation of localized microclimatic variations or site-specific drought conditions, potentially affecting the interpretation of extreme rainfall patterns and regional hydrological responses.
To achieve the study objectives, a combination of robust statistical techniques, trend analysis, clustering methods, and extreme value theory were applied, as described in the following subsections.
2.2. Descriptive Statistics for Skewed Rainfall Distributions
To help understand characteristics of rainfall in Saudi Arabia, in addition to mean and total rain, this study employed a range of robust statistical measures including minimum, first quartile (Q1), median (Q2), third quartile (Q3), and maximum. Relying solely on the mean can sometimes offer a limited and misleading view, especially when the dataset contains outliers or is skewed, which is often the case in rainfall data where extreme events occur sporadically. By incorporating multiple statistics, the analysis captures both the central tendency (median and mean) and the variability and extremities (minimum, Q1, Q3, and maximum) of rainfall patterns. Quartiles provide a more robust summary of the data, minimizing the influence of extreme values and giving a clearer depiction of the spread and distribution of rainfall amounts. This robust statistical framework ensures a more accurate and resilient assessment of rainfall behaviour over time.
2.3. Mann–Kendall Test
The Mann–Kendall (MK) is a widely used non-parametric test for detecting long-term trends in time series data [26,27], such as rainfall. The non-parametric Mann–Kendall test is used to determine whether the analyzed variable exhibits a statistically significant increasing or decreasing trend, or if no trend is present. Unlike linear regression, which assumes a specific model form and normal distribution of errors, the MK requires no assumptions about the data distribution, making it more suitable for environmental and hydrological datasets that often contain outliers and follow non-normal distributions.
The test statistic S (trend) is computed as (Equations (1) and (2)):
Here, n is the number of data points, and xi and xj are the sequential data values. A positive S value shows an increasing, whereas a negative S value indicates a decreasing trend.
For large sample sizes greater than 10 (n > 10), S is nearly normally distributed with a mean value of zero and variance Var (S), computed based on the number of tied groups. The variance in S is calculated using the following formula
where ti is the amount of data with equal values in certain group i and m is the number of groups that contain equal values in the time series.
A standardized test statistic Z can be calculated to assess the significance of the trend (Equation (4)):
The null hypothesis (no trend) is rejected if the absolute value of Z exceeds the critical value from the standard normal distribution at the desired significance level.
2.4. K-Means Clustering
K-means clustering is a type of unsupervised machine learning techniques that divides a dataset into ‘k’ distinct, non-overlapping clusters [28]. It aims to minimize intra-cluster variability. Initially, k centroids are chosen randomly, and each data point is assigned to the nearest centroid. Then, the centroids are updated based on the mean of the assigned points, and the process is iterated until convergence.
The objective function to be minimized is J (Equation (5)):
where
- k = number of clusters
- Ci = set of points belonging to cluster i
- xj = a data point
- μi = centroid of cluster i
- ∥xj − μi∥ = Euclidean distance between data point xj and centroid μi
The algorithm iteratively assigns points to the nearest centroid and recalculates the centroids until the assignments no longer change or the reduction in the objective function J becomes negligible.
2.5. Extreme Value Theory: Peaks over Threshold (POT) Model
Extreme Value Theory (EVT) provides a statistical framework for modelling and analyzing rare events, such as extreme rainfall [29]. In this study, the Peaks Over Threshold (POT) approach was employed to identify and model extreme rainfall events at each monitoring station, following the framework proposed by Davison and Smith [30]. The POT method focuses on data points that exceed a selected threshold, assuming that these exceedances follow a Generalized Pareto Distribution (GPD) [31]. The GPD is especially useful in this context because it is designed to model the tail behaviour of distributions, making it well-suited for capturing the frequency and magnitude of extreme rainfall events beyond a high threshold. Its flexibility allows it to accommodate a wide range of tail behaviours, such as light, exponential, or heavy through its shape parameter, making it a robust tool for estimating the risk of rare but impactful precipitation events. The cumulative distribution function (CDF) of the GPD is given by Equations (6) and (7):
and
where
y = x − u represents the exceedance over the threshold u,
σ > 0 is the scale parameter,
ξ is the shape parameter, determining the tail behaviour.
The choice of an appropriate threshold is critical for the POT method, as it determines which rainfall events are classified as ‘extreme’. From a physical perspective, the threshold separates ordinary rainfall events from those produced by rare, high-intensity systems, such as mesoscale convective complexes or tropical intrusions, that dominate the tail of the rainfall distribution. To ensure robust threshold selection, Mean Residual Life (MRL) plots and Parameter Stability (PS) plots are usually employed. The MRL plot aids in identifying a threshold beyond which the mean of exceedances increases approximately linearly, suggesting the data is suitable for Generalized Pareto Distribution (GPD) modelling. In parallel, the PS plot assesses the stability of the GPD’s estimated scale (σ) and shape (ξ) parameters across a range of thresholds, helping to identify the interval where these parameters remain relatively constant. This stability implies that the chosen threshold adequately captures the underlying physical process governing extreme rainfall.
The GPD, introduced by Pickands [31], offers a flexible probabilistic framework for modelling the distribution of exceedances beyond a high threshold. Its parameters control the tail heaviness and the rate at which extreme events decay in frequency, making it an effective tool for quantifying the likelihood of rare, high-intensity precipitation events. A schematic representation of the POT concept and the corresponding GPD tail (Figure 2) is included to visually illustrate how rainfall data exceeding the threshold are modelled to estimate the probability of future extremes.
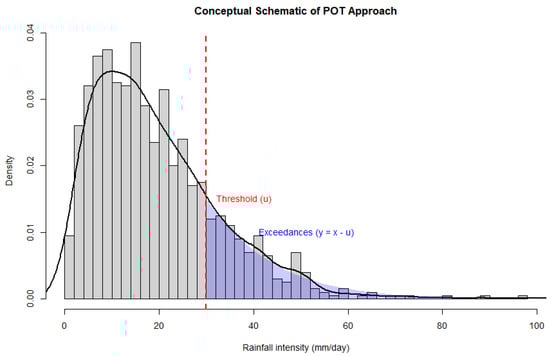
Figure 2.
Conceptual schematic of the Peaks Over Threshold (POT) approach.
The shape parameter (ξ) plays a key role in determining the physical nature of the tail. Specifically:
- -
- ξ < 0 → light-tailed (bounded) distribution, implying an upper limit to rainfall intensity;
- -
- ξ = 0 → exponential (medium-tailed) distribution, corresponding to a rapid decay of probability for extreme events;
- -
- ξ > 0 → heavy-tailed distribution, suggesting a higher probability of rare but very intense rainfall, often associated with convective or tropical moisture-driven systems.
Hence, understanding ξ provides insight into the dominant rainfall-generating mechanisms and their potential to produce extreme precipitation. In this study, ξ, σ, and u were estimated using the maximum likelihood method. The threshold was selected based on MRL and PS diagnostics to ensure parameter stability and consistency with physical rainfall regimes.
To complement the description, Figure 2 provides a conceptual schematic of the POT approach, showing how rainfall exceedances beyond the threshold (u) are modelled using the GPD tail to estimate the probability of future extremes.
Figure 3 shows the schmetatic workflow of the data analyses and their outputs. In this study, the threshold selection process was automated using a custom R script for each monitoring site. In simple terms, we did not manually inspect and select thresholds using MRL and PS plots for each station; instead, this step was performed programmatically, ensuring consistency and objectivity across the entire network. After the threshold was established, the Generalized Pareto Distribution (GPD) was fitted to the exceedance values using Maximum Likelihood Estimation (MLE). Model fitting was performed using the fevd() function from the extRemes package [32] in R programming language [33]. Once the threshold and GPD parameters were determined, key metrics such as the frequency and intensity of extreme rainfall events were estimated. Furthermore, trends in the frequency and magnitude of extreme events were analyzed over time, offering insights into possible changes in extreme rainfall behaviour across different regions. To assess temporal changes in extreme precipitation, the number of threshold exceedances per year was computed for each station. A non-parametric Mann–Kendall trend test was then applied to detect the presence of statistically significant monotonic trends in the annual exceedance frequencies and intensity. Using the fitted GPD models, return levels were estimated for various return periods (2-, 5-, 10-, 20-, 50-, and 100-year events). Return levels indicate the magnitude of precipitation expected to be exceeded, on average, once every specified number of years.
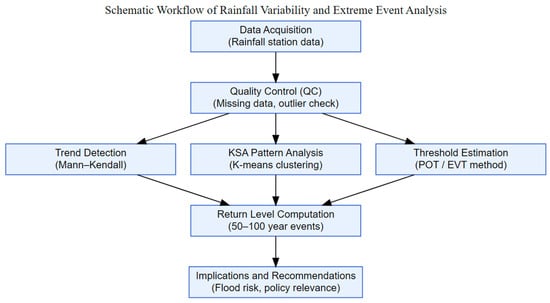
Figure 3.
The methodological framework showing the workflow from data acquisition and quality control to trend detection, clustering, EVT-based threshold estimation, return level computation, and final implications and recommendations for flood risk and resilience planning.
This automated and statistically principled method provides an objective alternative to ad hoc percentile-based thresholding, improving the reproducibility, rigour, and reliability of extreme rainfall analyses in arid and semi-arid environments.
2.6. Software and Data Analysis
All data analysis and visualization tasks in this study were performed using the R programming language (version 4.3.1) [33], a widely used open-source platform for statistical computing and graphics. Several specialized R packages were employed to implement different analytical methods. For robust statistical analysis, including the calculation of minimum, quartiles, median and maximum rainfall values, the base functions of R were utilized. The non-parametric Mann–Kendall trend test was conducted using the Kendall package [34], which offers functions tailored for detecting monotonic trends in time series data. The k-means clustering algorithm for classifying rainfall annual cycles across stations was implemented using built-in kmeans (), the base function of R. For extreme value analysis, specifically the Peaks Over Threshold (POT) method and fitting the Generalized Pareto Distribution (GPD), the ‘extRemes’ package [32] was used, which provides comprehensive tools for extreme value modelling. Data visualization, including plotting thresholds, trends, and cluster results, was primarily carried out using the ggplot2 package [35]. The ‘dplyr’ package [36] was used for data manipulation, such as summarizing data by station, year or month. In addition, ‘readr’ [37] was used for importing CSV data to R and ‘lubridate’ [38] was used for date and time processing. The use of R and its extensive libraries ensured reproducibility, flexibility, and robust statistical rigour throughout the study.
3. Results
3.1. Rainfall Spatial Variability
In Figure 4 a map of total precipitations (mm), summed up over the study period (1985–2023) is presented, which shows the spatial variability of rainfall in Saudi Arabia. Details of annual precipitation climatology (average 1985–2023 mm) data are provided in Table 2, which shows that during the study period highest rainfall was observed in Abha (209.50 mm), followed by Khamis Mushait (184.59 mm) and Taif (173.18 mm). These cities are located in the southwest region of the country and are among the cities with highest elevations. In contrast, lowest rainfall was observed in Wadi Aldawasser (23.93 mm), Tabuk (33.26 mm) and Wejh (33.65 mm). All sites experienced temporal variability and the amount of rainfall varied from year to year. Figure 5 shows a box plot and a time plot with smooth curve. Box plots depict distribution of rainfall during the study period at each site, showing their first quartile, median, third quartile and maximum. Time plots show temporal variability of rainfall during the study period (1985–2023) at each site, except Dammam (2000–2023) and Wadi Aldawasser (1990–2023). The smoothed precipitation trend curves shown in Figure 5 were generated using a 5-year centred moving average applied to the total precipitation time series for each station. This smoothing interval was selected to reduce short-term interannual variability and emphasize multi-year fluctuations and long-term trends in rainfall behaviour. A 5-year window provides an optimal balance between smoothing noise and retaining important climatic signals. As expected, there are considerable variations among different monitoring sites demonstrating variability in the amount and pattern of rainfall.
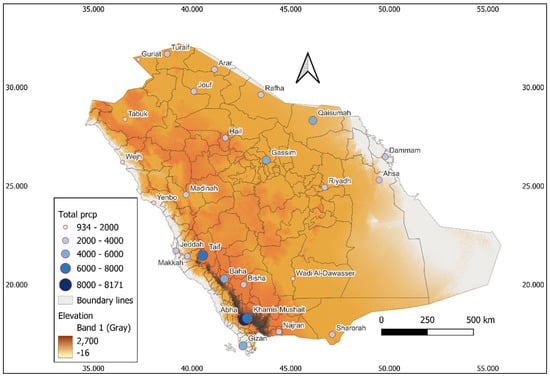
Figure 4.
Total precipitation (mm) from 1985 to 2023 at various monitoring stations in Saudi Arabia. The points show the amount of precipitation across Saudi Arabia.
Table 2.
Total precipitation (mm), latitude (degrees), longitude (degrees) and elevation (m) of different meteorological monitoring stations in Saudi Arabia. Total precipitation is the sum of precipitation (mm) from 1985 to 2023.
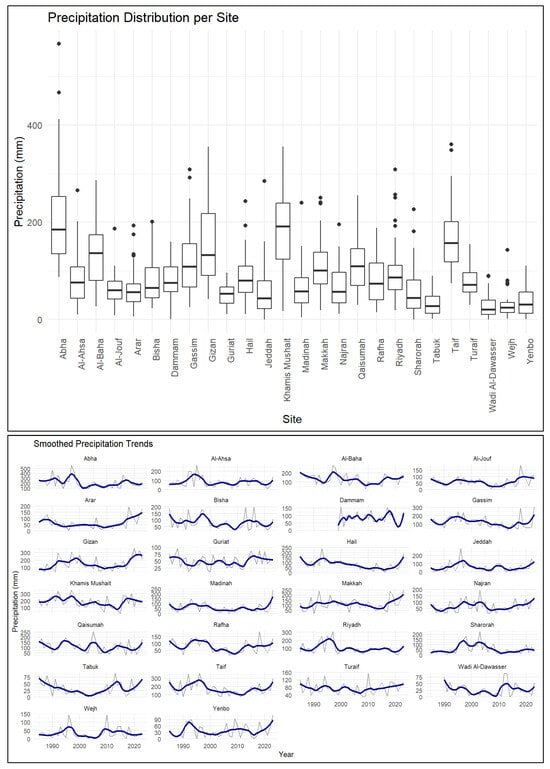
Figure 5.
Box plots and time plots (with smooth curve) of precipitations (mm), presenting cumulated precipitation (1985–2023) at different sites. In the time plots actual annual precipitation is presented by grey line and the smoothed trend by blue line. The blue line represents a 5-year centred moving average applied to total precipitation to highlight multi-year variability and long-term trends. Note: Dammam and Wadi Aldawasser stations have a shorter record 2000–2023 and 1990–2023, respectively, due to data availability limitations.
3.2. Annual Rainfall Cycle and K-Means Clustering Analysis
Figure 6 depicts the annual cycle of rainfall in Saudi Arabia, aggregated across all monitoring sites and years. Overall, rainfall tends to be greater during the winter and spring seasons compared to summer and autumn, with the highest totals observed in April, followed by November, March, and January. The lowest rainfall amounts were recorded in June, September, and July. However, it is important to note that this plot combines data from sites distributed across the entire country. As a result, the typical summer low and winter high rainfall pattern is not very distinct, and inconsistencies are evident, for example, some winter months show relatively lower rainfall, and some summer months exhibit comparatively higher rainfall. This variability reflects the regional differences in rainfall regimes across Saudi Arabia and suggests that national-scale seasonal summaries may obscure important spatial patterns. Therefore, to better characterize these patterns, a clustering approach such as k-means can be useful to group stations with similar annual rainfall behaviours. K-means cluster analysis identified 4 main clusters (Figure 7, upper-panel), where cluster-1: Al-Ahsa, Al-Jouf, Al-Qaysumah, Arar, Dammam, Gassim, Guriat, Hail, Jeddah, Madinah, Rafha, Riyadh, Turaif, Wejh, Yenbo; cluster-2: Jazan, Makkah, Taif; cluster-3: Al-Baha, Bisha, Najran, Sharurah, Tabuk, Wadi Aldawasser; and cluster-4: Abha, Khamis-Mushait. Out of the 26 meteorological monitoring stations analyzed, cluster-1 included 15 sites, cluster-2 comprised 3 sites, cluster-3 consisted of 6 sites, and cluster-4 had only 2 sites. Given the unequal number of monitoring sites within each cluster, rainfall amounts were normalized before plotting, to emphasize the seasonal patterns rather than absolute magnitudes. The annual precipitation cycles of the four clusters are illustrated in Figure 7, where the middle-panel presents a line plot showing the mean monthly precipitation patterns, and the lower-panel presents boxplots summarizing the monthly variability within each cluster.
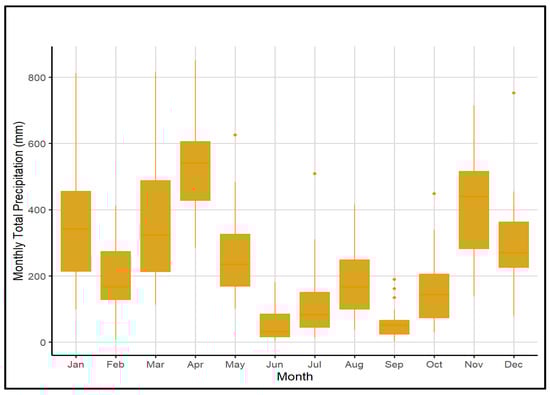
Figure 6.
Annual cycle showing monthly total rainfall, summed up over the study period (1985–2023) in Saudi Arabia. Box-and-whisker plots illustrate the monthly variability in total precipitation across Saudi Arabia. Each box represents the interquartile range (IQR), showing first quartile (Q1) (lower end of the box), median (horizontal line within the box), and third quartile (Q3) (upper end of the box). Whiskers extend to 1.5 times the IQR, and individual points beyond this range represent outliers.
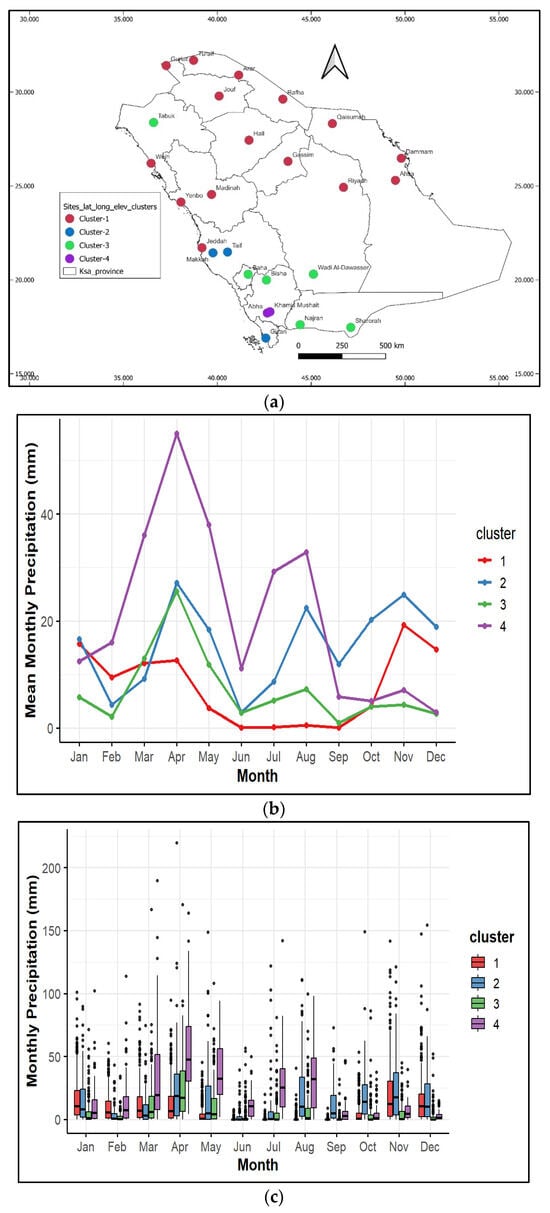
Figure 7.
Geographical distribution of clusters (a), annual cycles of rainfall clusters (b), where cluster-1: Al-Ahsa, Al-Jouf, Al-Qaysumah, Arar, Dammam, Gassim, Guriat, Hail, Jeddah, Madinah, Rafha, Riyadh, Turaif, Wejh, Yenbo; cluster-2: Jazan, Makkah, Taif; cluster-3: Al-Baha, Bisha, Najran, Sharurah, Tabuk, Wadi-Aldawasser; and cluster-4: Abha, Khamis-Mushait. Box-and-whisker plots (c) illustrate the monthly variability in total precipitation across Saudi Arabia. Each box represents the interquartile range (IQR), showing first quartile (Q1) (lower end of the box), median (horizontal line within the box), and third quartile (Q3) (upper end of the box). Whiskers extend to 1.5 times the IQR, and individual points beyond this range represent outliers.
The results highlight distinct seasonal dissimilarities among the clusters. Cluster-1 exhibits a clear annual cycle characterized by higher rainfall during the colder months (January, February, March, November, and December) and lower during the hotter months (April to October), reflecting a typical winter-dominated rainfall regime. Cluster-2 and cluster-3 both show peak rainfall in April, suggesting a springtime maximum. Between February and July, their precipitation levels are relatively similar; however, from August onward, cluster-2 maintains relatively higher rainfall levels compared to cluster-3, suggesting subtle differences in late summer and autumn precipitation dynamics. In contrast, cluster-4 shows markedly higher mean monthly precipitation throughout the year compared to other clusters. This cluster peaks sharply in April, with additional elevated rainfall in March, May, and August, and records its lowest rainfall during October, November, and December. The higher precipitation rates and bimodal peaks (spring and late summer) in cluster-4 could indicate areas influenced by more complex meteorological systems, such as the interaction between the warm, moist tropical air mass associated with the Intertropical Convergence Zone (ITCZ) and the colder, drier subtropical air mass enhances atmospheric instability, thereby increasing the likelihood of convective cloud development and associated rainfall.
Although the K-means clustering was performed based solely on rainfall values, the resulting spatial groupings reflect distinct meteorological regimes across Saudi Arabia. The southern and southwestern clusters are primarily influenced by orographic uplift associated with the Asir and Hejaz mountain ranges, where moist air from the Red Sea is lifted to produce enhanced rainfall. In contrast, the northern and central regions experience limited precipitation, predominantly controlled by mid-latitude frontal systems and occasional Mediterranean cyclonic intrusions. The southeastern and eastern clusters are influenced by the seasonal migration of the ITCZ and continental air masses, leading to sparse and irregular rainfall. Collectively, these atmospheric mechanisms explain the regional differentiation in precipitation regimes revealed by the clustering analysis. Overall, the clustering revealed distinct annual precipitation regimes that differ from traditional administrative or regional classifications, emphasizing the importance of data-driven methods in identifying rainfall patterns relevant to hydrological and climate impact studies.
3.3. Long-Term Trends in Rainfall Using Mann–Kendall Test
In this section, long-term trends in precipitations from 1985 to 2023 (except Dammam 2000–2023 and Wadi Aldawasser 1990–2023) at various monitoring stations are quantified. Slopes are computed for minimum, first quartile (Q1), mean, median, third quartile (Q3), maximum, and total precipitation using the Mann–Kendall trend test, which is a non-parametric method widely used for detecting monotonic trends in environmental time series [39].
A positive slope indicates an increasing trend in precipitations over time, suggesting potential intensification of rainfall or a shift toward wetter conditions at the station. Conversely, a negative slope signifies a decreasing trend, indicating possible drying trends or a reduction in precipitation extremes or totals. The results (Table 3) show considerable spatial variability across the stations. Several stations, such as Jazan, Makkah, Jeddah, Turaif, and Najran, exhibit positive trends across several precipitation metrics, suggesting a general tendency towards increasing rainfall in these locations. For example, Jazan shows positive slopes in mean, median, and maximum precipitation, with significant increases in some metrics (noted by * and ** symbols). In case a trend value has no ‘+’ or ‘*’ symbol, this means the trend is non-significant. On the other hand, many stations show widespread decreasing trends. Stations like Hail, Gassim, Qaysumah, and Abha recorded strong negative slopes, particularly in the mean and total precipitation, indicating a persistent decline in rainfall over the study period. Stations such as Hail and Gassim are notable for having significantly negative trends (highlighted with * or ** symbols) in both central tendency (mean, median) and extremes (maximum or minimum precipitation). Some stations, such as Sharurah, Tabuk, Wadi Aldawasser and Rafha, exhibit mixed behaviour, where certain precipitation metrics (e.g., maximum and Q1) suggest increases, while others (e.g., mean or total) suggest decreases, pointing to shifts in rainfall distribution patterns rather than consistent overall increases or decreases. Interestingly, major urban centres like Riyadh and Dammam show modest decreasing trends or mixed patterns, with negative slopes for means and totals, possibly reflecting regional drying but not strongly significant across all percentiles.
Table 3.
Mann–Kendall trend slopes for precipitation at each site from 1985 to 2023. Slopes are computed for minimum, 1st quartile (Q1), mean, median, third quartile (Q3), maximum, and total precipitations. Negative slopes show decreasing trends and positive slopes show increasing trends in precipitation. The empty cells (-) mean there were not enough non-zero data to calculate the trends. Note Dammam and Wadi Aldawasser data were 2000–2023 and 1990–2023, respectively.
It is important to highlight that significance levels (noted by * and ** in the table) reveal that some trends are statistically significant, while others are more subtle and may require further investigation in terms of meteorological drivers such as temperature increases, changes in atmospheric circulation, or anthropogenic influences. Overall, these findings demonstrate heterogeneity in rainfall trends across Saudi Arabia, with some regions becoming wetter and others drier over the past four decades. Understanding these trends is vital for the management of water resource, agriculture planning, and climate adaptation strategies in the region.
Figure 8 summarize the monthly precipitation trends across the monitoring sites in Saudi Arabia, using a heatmap plot. The results reveal notable seasonal variability, highlighting a swing in rainfall patterns throughout the year. The period from January to April is predominantly characterized by declining trends, with March standing out as the month with the most widespread and pronounced decreases. Significant negative trends in March are evident at stations such as Gassim (−0.277 *), Abha (−0.250 *), and Qaysumah (−0.251 *). Similarly, April maintains negative tendencies across several locations, particularly at Bisha (−0.198 +) and Khamis Mushait (−0.177). These findings suggest a consistent drying trend during the early months of the year.
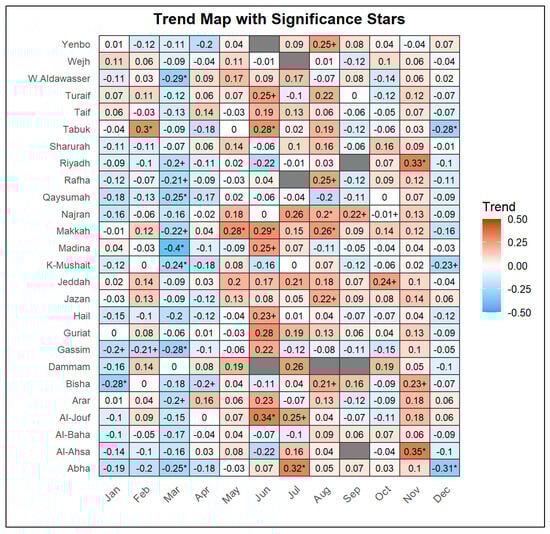
Figure 8.
Heatmap showing the monthly variation in trend values across 26 sites. Warmer colours represent higher (positive) values, and cooler colours represent lower (negative) values. Note: p-value < 0.05 (*) indicates statistically significance at the 5% level, which corresponds to a 95% confidence level. p-value between 0.05 and 0.1 (0.05 ≤ p < 0.1) (+) indicates statistically significance at 10% level, which corresponds to a 90% confidence level. p-value ≥ 0.1 (values with no * or + signs) indicates statistically non-significance, which corresponds to a confidence level of less than 90%. The blank dark cells indicate insufficient non-zero data to compute the trends.
In contrast, the summer months (June to August) display a clear reversal towards increasing precipitation, with significant positive trends recorded at Al-Jouf (0.338 *), Tabuk (0.284 *), and Makkah (0.288 *) in June, and continued positive anomalies at stations such as Abha (0.324 *) and Najran (0.200 *) during July and August. Toward the end of the year, November also shows a strong shift toward wetter conditions, with notable positive trends at Al-Ahsa (0.347 *) and Riyadh (0.334 *). However, December marks a return to negative trends, especially at Abha (−0.309 *) and Tabuk (−0.281 *). Overall, the results indicate that March and December experience the most consistent and significant declines, while June, July, and November emerge as the months with the most widespread increases in precipitation.
3.4. Extreme Values Theory (EVT) for Determining Extreme Rainfall Events
Table 4 shows the threshold values derived using the Peak Over Threshold (POT) method, along with the corresponding percentiles and estimated return levels (RL) for the return period of 2-, 5-, 10-, 20-, 50-, and 100-year periods across all monitoring stations. Return levels for several sites as an example are also depicted in Figure 9. These cities include the capital city of Riyadh, the two Holy Cities of Makkah and Madinah, and the economy hubs Jeddah and Dammam. Thresholds were first identified by applying the POT approach, which models only the extreme exceedances above a selected threshold based on the Generalized Pareto Distribution (GPD). After determining the thresholds, they were compared with the rainfall distribution to identify their corresponding percentiles (Table 4). This percentile information is presented for interpretative purposes only, to indicate the rarity of the threshold exceedances; it should not be confused with the method used for threshold selection, which was based on EVT principles, not percentile matching. The return levels refer to the magnitude of rainfall expected to be exceeded on average once every specified number of years. These RLs were predicted by fitting the GPD to the exceedances over the selected threshold at each station. The fitted GPD parameters were then used to estimate RLs for different return periods (2-, 5-, 10-, 20-, 50-, and 100-years), following extreme value theory formulas.
Table 4.
Threshold and return levels (RL) for the return period of 2, 5, 10, 20, 50 and 100 years into the future. Percentiles are provided for comparison only.
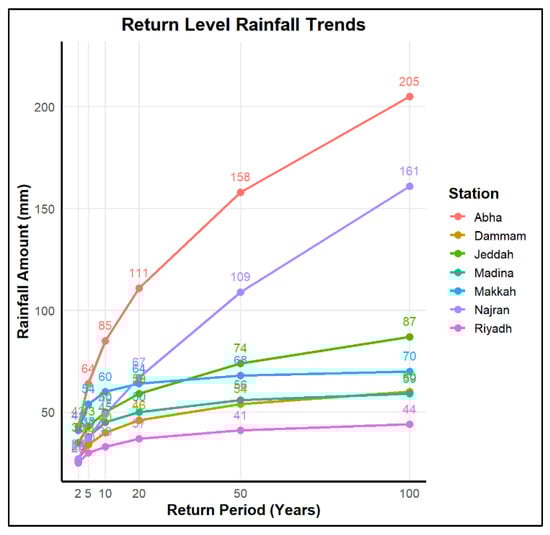
Figure 9.
Return level plots showing the rainfall amounts (mm/year) expected to be exceeded once every N years for selected stations in Saudi Arabia, where N is 2, 5, 10, 20, 50 and 100 years.
As expected, RLs increase with longer return periods, reflecting the intensification of rarer events. Threshold values vary widely across stations, with Jazan recording the highest threshold (47.04 mm) and Turaif the lowest (17.58 mm) one. Coastal stations like Jeddah also show relatively high thresholds, indicating a greater tendency toward intense rainfall events. Notably, stations such as Abha and Najran show sharp increases in rainfall magnitude from the 2-year to the 100-year return periods, with RL100 values reaching 205 mm and 161 mm, respectively. In contrast, northern stations like Arar, Guriat, and Rafha exhibit lower RLs even at longer return periods, indicating comparatively milder extremes. An unusual case is observed at Tabuk, where the RL2 is negative, suggesting a potential limitation or instability in the model fit at short return periods, though the RLs for longer periods become positive and plausible.
The GPD model includes three key parameters: location (μ), scale (σ), and shape (ξ). In this study, thresholds and return levels were estimated using the fitted GPD parameters derived from the excesses over the threshold at each station. While the location and scale parameters were used to compute return levels (Table 4), the shape parameter (ξ), which controls the tail heaviness of the distribution, was not reported here, as the analysis primarily focused on spatial variability in return magnitudes. In general, preliminary fitting results indicated small positive ξ values (typically between 0.05 and 0.25) across most stations, consistent with a heavy-tailed Fréchet-type behaviour, implying that extreme rainfall events are possible but infrequent.
Overall, these results emphasize the considerable spatial variability in extreme rainfall behaviour across Saudi Arabia. Regions such as the southwestern highlands and parts of the western coastal belt are projected to experience stronger swings in rainfall patterns, with a higher likelihood of intense and rare precipitation events in the coming decades.
Table 5 and Figure 10 present the trends in the frequency and intensity of exceedances above threshold values determined by the POT model across various stations. Overall, the results show substantial spatial variability. Both Arar and Taif exhibited statistically significant trends: Arar showed a significant increasing trend in both the frequency (τ = 0.508, p = 0.044) and intensity (τ = 0.545, p = 0.016) of exceedances, indicating a notable rise in extreme events in that region. In contrast, Taif showed a significant decreasing trend in both frequency (τ = −0.347, p = 0.042) and intensity (τ = −0.336, p = 0.027), suggesting a reduction in extremes over time. Other stations, such as Al-Baha, also showed a significant negative trend in frequency (τ = −0.358, p = 0.043), but all other locations exhibited non-significant trends, reflecting either stable conditions or high interannual variability.
Table 5.
Trends in frequency and intensity of exceedances above the threshold value (POT Model). p-values with ‘*’ indicate significant trends, while p-values with no ‘*’ show non-significant trends. NAs show that not enough exceedances data was available for calculating the trends.
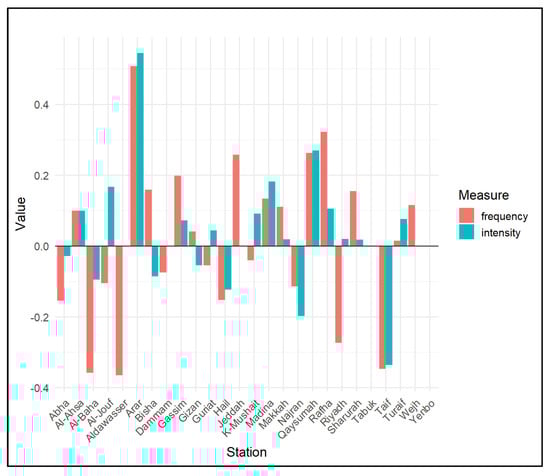
Figure 10.
Trends in frequency and intensity of exceedances over the thresholds at different sites. On y-axis, the ‘Value’ presents the trend values, where intensity is in mm/year and frequency is in counts of exceedances per year.
Spatially, northern stations such as Arar and Rafha tended to show positive (increasing) trends, while southwestern stations such as Al-Baha and Taif indicated declining trends, particularly in frequency. Coastal and central stations like Jeddah, Madina, and Riyadh generally showed non-significant trends, highlighting a lack of strong directional changes in extreme precipitation in those regions. NAs show that not enough exceedances data was available for calculating the trends (min. 10 years). These results suggest that regional climatic differences play a major role in the behaviour of extreme events, and therefore would require local specific action for mitigating the effects of these extreme events.
The analysis of rainfall exceedance percentages across the monitoring sites is depicted in Figure 11, which reveals notable spatial variability. Wejh recorded the highest exceedance at 33%, indicating a greater frequency of extreme rainfall events, followed closely by Abha and Najran at 28%. In contrast, Riyadh showed the lowest exceedance at 19%, suggesting fewer extreme events in this area. Most sites, however, fall within a moderate exceedance range of 21–26%, reflecting more typical rainfall behaviour. These variations may be influenced by local topography and prevailing weather patterns, highlighting the importance of site-specific analysis when assessing rainfall extremes. Almazroui [4] reported that the contribution of extreme rainfall events to total monthly precipitation varies significantly across regions and seasons in Saudi Arabia. The study found contributions as high as 56% in the southern region during June and an average of 47% in the coastal region between October and February, peaking at 53% in November. Nationally, extreme rainfall contributed most in November (52%) and least in July (20%), with station-level contributions ranging from 8% to 50%. However, the relatively higher exceedance percentages reported in that study are largely attributable to the use of a uniform threshold of 26 mm across all regions. In contrast, our study applied region-specific automated thresholds that better reflect the local precipitation climatology, ranging from 17 mm to 47 mm. This more tailored approach allows for a more accurate representation of regional extremes but results in lower overall exceedance percentages, as it accounts for the natural variability in rainfall intensity across different parts of the country.
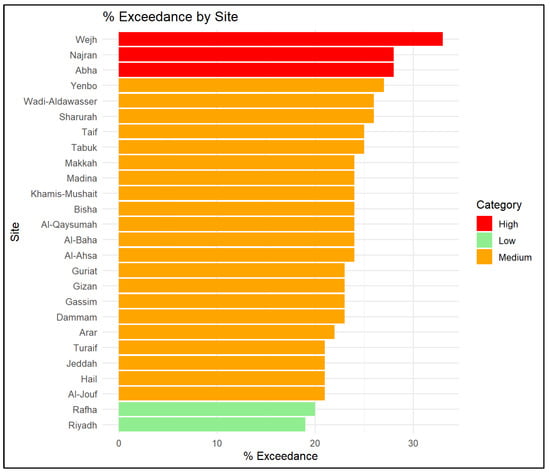
Figure 11.
Percentage of exceedance for rainfall events across monitoring sites. Sites with high exceedance values (≥28%) are highlighted in red, indicating more frequent extreme rainfall events. Sites with low exceedance values (≤20%) are shown in green, suggesting fewer such events. The remaining sites fall within a moderate range (orange), reflecting typical exceedance levels.
4. Discussion
The present study provides a comprehensive assessment of rainfall variability and extreme precipitation behaviour across Saudi Arabia by integrating non-parametric trend analysis, clustering, and an automated EVT framework. The application of the POT approach with GPD enabled the objective estimation of site-specific thresholds and return levels, enhancing reproducibility and minimizing the subjectivity associated with conventional percentile-based approaches. The results revealed considerable spatial heterogeneity in rainfall trends and extreme event characteristics, consistent with the complex climatic and topographic conditions of the Arabian Peninsula.
4.1. Regional and Global Context of Rainfall Trends
To place the rainfall trends observed in Saudi Arabia within a broader regional and global context, numerous studies from other parts of the world have reported similar spatially heterogeneous and temporally variable patterns in precipitation. In the Iberian Peninsula, Garcia et al. [40] and Gallego et al. [41] analyzed long-term rainfall records at multiple stations, revealing negative trends in extreme rainfall for western and southwestern areas and a dipolar pattern in autumn, with contrasting behaviour between the first and second halves of the twentieth century. In the Aegean region of Turkey, Asikoglu and Ciftlik [42] detected significant downward trends in annual rainfall at coastal and inland stations, with the magnitude of decline dependent on longitude, highlighting the influence of regional geography and interdecadal variability. Similarly, in China, Zhang et al. [43] demonstrated that bias-corrected precipitation trends differed substantially from raw measurements, with decreasing trends in Southwest and North China and increasing trends in Northeast China and the lower Yangtze River basin, emphasizing the impact of measurement biases and local climatic factors on trend detection. In South America, Haylock et al. [44] found coherent increases in rainfall in southern Brazil, Paraguay, Uruguay, and northern Argentina, alongside decreases in southern Chile, which were linked to large-scale ocean-atmosphere interactions such as El Niño–Southern Oscillation (ENSO) and shifts in storm tracks. More broadly, a global assessment by Nazeri Tahroudi [45] highlighted pronounced spatial heterogeneity and temporal non-stationarity in precipitation trends, with substantial changes in statistical distribution characteristics observed across multiple continents, including Asia, South America, the Middle East, and Africa. Collectively, these studies illustrate that precipitation trends are highly location-specific and sensitive to both regional climatic drivers and methodological considerations. This broader context supports the relevance of our Saudi Arabia analysis, which similarly reveals marked spatial variability in extreme rainfall, with higher likelihoods of intense and infrequent events in some regions, reinforcing the need for site-specific threshold estimation and robust trend detection using approaches such as Mann–Kendall tests and Extreme Value Theory.
Furthermore, several studies have been carried out in the Sahara Desert, which lies roughly between 15° N and 30° N latitude and shares a similar latitude with the Arabian Peninsula. Historical and model-based analyses of the Sahara indicate substantial variability in rainfall patterns over the twentieth century. For example, Liu et al. [46] used the Parallel Climate Model to simulate twentieth century climatology in the Sahara and reported a decreasing rainfall trend from the late 1940s to the end of the 1980s, accompanied by an eastward expansion of the desert boundary while surface temperature and meridional limits remained relatively stable. These findings are in agreement with our findings and highlight that even within Sahara arid regions, precipitation patterns exhibit both spatial and temporal heterogeneity. Similarly, Biasutti [47] examined Sahel rainfall and found that interannual to multidecadal variability is strongly linked to the global Hadley circulation and regional monsoon dynamics. Ocean warming and Sahara heating influence the structure and intensity of convective systems, affecting seasonal rainfall accumulation. Observations and simulations indicate that rainfall in recent decades has become more intermittent and concentrated in the late rainy season, with subseasonal and subregional differences reflecting both natural variability and anthropogenic forcing. These studies emphasize that extreme rainfall events in arid regions are strongly influenced by remote oceanic and atmospheric drivers, a pattern consistent with teleconnections observed in the Arabian Peninsula. Incorporating these findings provides a broader context for our results, demonstrating that the spatial variability and trends of extreme rainfall across Saudi Arabia reflect both regional climatic dynamics and broader latitudinal teleconnections with other arid regions at similar latitudes.
4.2. Comparison with Previous EVT-Based Rainfall Studies
The findings of this work align with a growing body of literature employing the POT–GPD framework for rainfall extremes in diverse climatic regions. For example, Acero et al. [48] applied a time-varying threshold to 52 stations across the Iberian Peninsula and found spatially distinct clustering of rainfall exceedances, more clustered along the Atlantic coast during winter and along the Mediterranean coast in autumn. Similarly, the present study revealed substantial spatial variability in the behaviour of extremes across Saudi Arabia, with the southwestern and western coastal regions (e.g., Abha, Najran, and Jeddah) exhibiting higher thresholds and return levels, consistent with the influence of orographic uplift and tropical–Mediterranean air mass interactions.
In Singirankabo and Iyamuremye [49], the POT–GPD model applied to daily rainfall in Kigali demonstrated that return levels increased monotonically with return periods, indicating intensifying extremes. This pattern was also observed in Saudi Arabia, where longer return periods (50- and 100-year) yielded disproportionately higher rainfall magnitudes. However, in contrast to Kigali, where the increase was spatially consistent, Saudi Arabia exhibited a mixture of upward and downward trends in exceedance frequency and intensity, underscoring the influence of complex regional dynamics such as the Red Sea Trough, ITCZ variability, and subtropical high-pressure systems.
Kołodziejczyk and Rutkowska [50] compared the POT–GPD and annual-maxima methods in Poland’s Upper Vistula Basin and demonstrated the superiority of the POT model for characterizing high-intensity rainfall and spatial diversity. The present study supports this conclusion: the automated EVT-based thresholds ranging from 17 to 47 mm effectively captured regional variability that would be obscured by uniform thresholds. Similarly, the relationship between altitude and return level observed in Poland was mirrored here, where high-elevation stations such as Abha and Taif exhibited greater rainfall intensities, reflecting orographic enhancement.
Likewise, Phoophiwfa et al. [51] applied the GPD to cumulative rainfall in Thailand’s Chi watershed, identifying spatial patterns of high return levels corresponding to elevated flood risk areas. The spatial gradient observed across Saudi Arabia, with extreme rainfall concentrated in southwestern highlands and along coastal zones, demonstrates similar topographic and convective controls. Integrating GPD-based results with GIS tools, as performed in the Thai study, would be beneficial for developing localized flood hazard maps in Saudi Arabia, where rapid urban expansion heightens exposure to flash floods.
Recent studies have demonstrated the broad applicability of the POT and GPD frameworks for analyzing extreme rainfall under diverse climatic conditions. Garba and Abdourahamane [52] applied both stationary and non-stationary forms of the POT–GPD model to characterize pluvial flooding in Niamey, Niger, incorporating covariates such as temperature and population growth to capture evolving rainfall extremes under climate change. Kim et al. [53] used long-term simulations from the Community Earth System Model to investigate extreme daily, illustrating the robustness of the POT–GPD approach in assessing the spatial and temporal variability of climatic extremes. More recently, Vicente-Serrano et al. [54] employed the GPD framework to develop probabilistic hazard maps for extreme rainfall in Spain, showing its growing utility in regional climate-risk assessment. Collectively, these studies confirm that the POT–GPD method remains a powerful and widely used tool for quantifying and mapping precipitation extremes across multiple temporal and spatial scales.
4.3. Methodological and Practical Implications
From a methodological perspective, the automated EVT framework developed here provides a consistent, objective, and reproducible approach to threshold estimation, aligning with recommendations from recent POT–GPD studies [50,51]. By replacing subjective threshold selection with algorithmic estimation, the method enhances statistical rigour and comparability across diverse climatic settings. Practically, the identification of high-return-level zones, particularly in the southwestern highlands and western coastal regions, has direct implications for flood risk management, infrastructure design, and climate adaptation in Saudi Arabia. Future studies could extend this framework by integrating reanalysis and remote-sensing rainfall data, linking POT–GPD outputs with spatial flood hazard mapping, and incorporating large-scale teleconnection indices to elucidate the drivers of extreme rainfall variability under changing climatic conditions.
The automated EVT-based threshold estimation applied in this study provides a consistent and objective framework for identifying extreme rainfall events across diverse climatic zones of Saudi Arabia. By avoiding subjectivity in threshold selection, this approach enhances the reliability of spatial and temporal comparisons of extreme precipitation, which is critical for accurate flood frequency and severity assessment. The resulting insights are highly relevant for national planning and policy development, particularly in updating flood design standards, guiding urban drainage and stormwater management, and strengthening disaster preparedness and infrastructure resilience. The integration of automated EVT methods with regional trend and clustering analyses therefore bridges the gap between scientific understanding and practical decision-making, supporting climate adaptation strategies and sustainable water resource planning at the national scale.
Although this study focuses on ground-based rainfall variability and extremes, regional precipitation patterns in Saudi Arabia are also influenced by large-scale atmospheric and oceanic processes. Previous studies [10,55,56] have highlighted the role of global teleconnections, such as the El Niño–Southern Oscillation (ENSO), the Indian Ocean Dipole (IOD), and the North Atlantic Oscillation (NAO), in modulating rainfall across the Arabian Peninsula. Incorporating such teleconnection indices into future analyses could further strengthen understanding of the physical mechanisms driving extreme rainfall variability and improve the predictive capability of regional flood risk assessments.
5. Conclusions
This study employed a variety of statistical approaches combining robust statistical measures, non-parametric trend analysis (Mann–Kendall test), k-means clustering, and Extreme Value Theory (EVT) using the Peak Over Threshold (POT) method to assess rainfall variability and extremes across Saudi Arabia. The Mann–Kendall test was systematically applied not only to mean values but also to key distributional metrics, i.e., minimum, first quartile (Q1), median, third quartile (Q3), maximum, and total precipitation, which provided a detailed assessment of long-term trends across the full rainfall distribution. Furthermore, k-means clustering allowed the grouping of stations with similar rainfall characteristics, helping in the spatial interpretation of these trends. The Mann–Kendall analysis revealed considerable spatial variability: stations such as Jazan, Makkah, Jeddah, Turaif, and Najran showed positive trends across several precipitation metrics, indicating a shift toward wetter conditions, while stations like Hail, Gassim, Qaysumah, and Abha recorded strong negative trends, suggesting a drying tendency. Some locations exhibited mixed behaviour across different rainfall percentiles, highlighting a complex pattern of rainfall redistribution rather than uniform increases or decreases. These swings in rainfall patterns, with certain months and locations shifting between wet and dry trends, underscore the growing irregularity of precipitation regimes across the region.
The application of EVT and POT further enabled the estimation of thresholds and prediction of return levels for extreme rainfall events. Thresholds were first determined using the POT method and subsequently compared to corresponding percentiles for reference. Return levels for 2, 5, 10, 20, 50, and 100 years were predicted using the fitted generalized Pareto distribution. These estimates provide critical insights into the magnitude and frequency of extreme rainfall events at different stations, with southwestern and coastal regions (such as Abha, Najran, and Jeddah) found to be particularly vulnerable to more intense events.
Given these findings, it is recommended that future infrastructure planning, urban development, and flood risk mitigation efforts incorporate the identified trends and predicted return levels. Areas with strong positive trends and high return levels should be prioritized for flood resilience initiatives. Meanwhile, regions experiencing drying trends should consider strategies for water conservation and drought preparedness. The evident swings in rainfall patterns emphasize the need for adaptive and flexible management strategies. Future research is encouraged to continue building upon this framework by integrating updated datasets, high-resolution modelling, and climate projections to better anticipate and manage rainfall extremes under changing climate conditions. These results not only highlight localized changes but also reflect broader regional climate variability and potential climate change impacts across the Arabian Peninsula, emphasizing the urgent need for integrated monitoring and adaptive management frameworks.
Author Contributions
Conceptualization, S.M., T.M.A.H., A.O.Z. and M.M.A.A.; Methodology, S.M.; Software, S.M.; Validation, S.M., M.I. and T.M.A.H.; Formal Analysis, S.M.; Investigation, S.M.; Resources, A.O.Z., T.M.A.H. and A.S.G.; Data Curation, S.M. and M.I.; Writing—Original Draft Preparation, S.M.; Writing—Review & Editing, S.M., T.M.A.H., A.O.Z., M.M.A.A., M.I., A.A.K., A.A.B., M.N.I., S.J. and A.S.G.; Visualization, S.M.; Supervision, A.O.Z., T.M.A.H. and A.S.G.; Project Administration, A.O.Z.; Funding Acquisition NA. All authors have read and agreed to the published version of the manuscript.
Funding
This project received no internal or external fundings.
Data Availability Statement
Data is available upon request.
Acknowledgments
We acknowledge the collaboration of the Deanship of Scientific Research at Imam Mohammad Ibn Saud Islamic University (IMSIU). We are also thankful to the National Center for Meteorology for their continuous support and providing ground level meteorological data.
Conflicts of Interest
The authors declare no conflicts of interest.
References
- Islam, M.N.; Zamreeq, A.O.; Ismail, M.; Habeebullah, T.M.A.; Ghulam, A.S. Jazan Rainfall’s Seasonal Shift in Saudi Arabia: Evidence of a Changing Regional Climate. Atmosphere 2025, 16, 300. [Google Scholar] [CrossRef]
- IPCC. Climate Change: The Physical Science Basis. Contribution of Working Group I to the Fifth Assessment Report of the Intergovernmental Panel on Climate Change; Cambridge University Press: Cambridge, UK, 2013. [Google Scholar]
- Katz, R.W.; Brown, B. Extreme Events in a Changing Climate: Variability Is More Important Than Averages. Clim. Change 1992, 21, 289–302. [Google Scholar] [CrossRef]
- Almazroui, M. Rainfall Trends and Extremes in Saudi Arabia in Recent Decades. Atmosphere 2020, 11, 964. [Google Scholar] [CrossRef]
- Saharwardi, M.S.; Dasari, H.P.; Gandham, H.; Ashok, K.; Hoteit, I. Spatiotemporal Variability of Hydro-Meteorological Droughts over the Arabian Peninsula and Associated Mechanisms. Sci. Rep. 2024, 14, 20296. [Google Scholar] [CrossRef]
- Kaniewski, D.; Van Campo, E.; Weiss, H. Drought Is a Recurring Challenge in the Middle East. Proc. Natl. Acad. Sci. USA 2012, 109, 3862–3867. [Google Scholar] [CrossRef]
- Petraglia, M.D.; Groucutt, H.S.; Guagnin, M.; Breeze, P.S.; Boivin, N. Human Responses to Climate and Ecosystem Change in Ancient Arabia. Proc. Natl. Acad. Sci. USA 2020, 117, 8263–8270. [Google Scholar] [CrossRef]
- Almazroui, M. Assessment of Meteorological Droughts over Saudi Arabia Using Surface Rainfall Observations during the Period 1978–2017. Arab. J. Geosci. 2019, 12, 694. [Google Scholar] [CrossRef]
- Fleitmann, D.; Mudelsee, M.; Burns, S.J.; Kramers, J.; Neff, U.; Mangini, A.; Matter, A. Droughts and Societal Change: The Environmental Context for the Emergence of Islam in Late Antique Arabia. Science 2022, 376, 1317–1321. [Google Scholar] [CrossRef] [PubMed]
- Syed, F.S.; Adnan, S.; Zamreeq, A.; Ghulam, A. Identification of Droughts over Saudi Arabia and Global Teleconnections. Nat. Hazards 2022, 112, 2717–2737. [Google Scholar] [CrossRef]
- Ajjur, S.B.; Al-Ghamdi, S.G. Seventy-Year Disruption of Seasons Characteristics in the Arabian Peninsula. Int. J. Climatol. 2021, 41, 5920–5937. [Google Scholar] [CrossRef]
- Amin, T.M.; Mahmoud, S.H.; Alazba, A.A. Observations, Projections and Impacts of Climate Change on Water Resources in Arabian Peninsula: Current and Future Scenarios. Environ. Earth Sci. 2016, 75, 864. [Google Scholar] [CrossRef]
- Donat, M.G.; Alexander, L.V.; Yang, H.; Durre, I.; Vose, R.; Caesar, J. Changes in Extreme Temperature and Precipitation in the Arab Region: Long-Term Trends and Variability Related to ENSO and NAO. Int. J. Climatol. 2014, 34, 581–592. [Google Scholar] [CrossRef]
- Hasanean, H.; Almazroui, M. Rainfall: Features and Variations over Saudi Arabia—A Review. Climate 2015, 3, 578–626. [Google Scholar] [CrossRef]
- Chowdhury, S.; Al-Zahrani, M. Implications of Climate Change on Water Resources in Saudi Arabia. Arab. J. Sci. Eng. 2013, 38, 1959–1971. [Google Scholar] [CrossRef]
- Almazroui, M.; Saeed, S. Contribution of Extreme Daily Precipitation to Total Rainfall over the Arabian Peninsula. Atmos. Res. 2020, 231, 104672. [Google Scholar] [CrossRef]
- Munir, S.; Kamil, S.; Habeebullah, T.M.; Zaidi, S.; Alhajji, Z.; Siddiqui, M.H. Drought Variabilities in Saudi Arabia: Unveiling Spatiotemporal Trends through Observations and Projections. Earth Syst. Environ. 2025, 9, 563–587. [Google Scholar] [CrossRef]
- ElKenawy, A.M.; McCabe, M.F. A Multi-Decadal Assessment of the Performance of Gauge- and Model-Based Rainfall Products over Saudi Arabia: Climatology, Anomalies and Trends. Int. J. Climatol. 2016, 36, 656–674. [Google Scholar] [CrossRef]
- Almazroui, M.; Islam, M.N. Coupled Model Inter-comparison Project Database to Calculate Drought Indices for Saudi Arabia: A Preliminary Assessment. Earth Syst. Environ. 2019, 3, 419–428. [Google Scholar] [CrossRef]
- Martius, O.; Sodemann, H.; Joos, H.; Pfahl, S.; Winschall, A.; Croci-Maspoli, M.; Graf, H.-F.; Sprenger, M.; Schwierz, C. The Role of Upper-Level Dynamics and Surface Processes for the Pakistan Flood of July 2010. Q. J. R. Meteorol. Soc. 2013, 139, 1780–1797. [Google Scholar] [CrossRef]
- Almazroui, M. The Life Cycle of Extreme Rainfall Events over Western Saudi Arabia Simulated by a Regional Climate Model: Case Study of November 1996. Atmósfera 2012, 25, 23–41. [Google Scholar]
- Almazroui, M.; Islam, M.N.; Athar, H.; Jones, P.D.; Rahman, M.A. Recent Climate Change in the Arabian Peninsula: Annual Rainfall and Temperature Analysis of Saudi Arabia for 1978–2009. Int. J. Climatol. 2012, 32, 953–966. [Google Scholar] [CrossRef]
- Alexandersson, H. A homogeneity test applied to precipitation data. J. Climatol. 1986, 6, 661–675. [Google Scholar] [CrossRef]
- Khaliq, M.N.; Ouarda, T.B.M.J. On the critical values of the standard normal homogeneity test (SNHT). Int. J. Climatol. 2007, 27, 681–687. [Google Scholar] [CrossRef]
- Toreti, A.; Kuglitsch, F.G.; Xoplaki, E.; Della-Marta, P.M.; Aguilar, E.; Prohom, M.; Luterbacher, J. A note on the use of the standard normal homogeneity test (SNHT) to detect inhomogeneities in climatic time series. Int. J. Climatol. 2010, 31, 630–632. [Google Scholar] [CrossRef]
- Mann, H.B. Nonparametric tests against trend. Econometrica 1945, 13, 245–259. [Google Scholar] [CrossRef]
- Kendall, M.G. Rank Correlation Methods, 4th ed.; Charles Griffin: London, UK, 1975. [Google Scholar]
- MacQueen, J. Some Methods for Classification and Analysis of Multivariate Observations. In Proceedings of the Fifth Berkeley Symposium on Mathematical Statistics and Probability, Berkeley, CA, USA, 21 June–18 July 1965; University of California Press: Berkeley, CA, USA, 1967; Volume 1, pp. 281–297. [Google Scholar]
- Coles, S. An Introduction to Statistical Modeling of Extreme Values; Springer Series in Statistics; Springer: London, UK, 2001. [Google Scholar]
- Davison, A.C.; Smith, R.L. Models for Exceedances over High Thresholds. J. R. Stat. Soc. Ser. B Stat. Methodol. 1990, 52, 393–442. [Google Scholar] [CrossRef]
- Pickands, J. Statistical inference using extreme order statistics. Ann. Stat. 1975, 3, 119–131. [Google Scholar] [CrossRef]
- Gilleland, E.; Katz, R.W. extRemes 2.0: An Extreme Value Analysis Package in R. J. Stat. Softw. 2016, 72, 1–39. [Google Scholar] [CrossRef]
- R Core Team. R: A Language and Environment for Statistical Computing; R Foundation for Statistical Computing: Vienna, Austria, 2023; Available online: https://www.R-project.org/ (accessed on 2 May 2025).
- McLeod, A.I. Kendall: Kendall Rank Correlation and Mann-Kendall Trend Test, R Package Version 2.2.1; R Foundation for Statistical Computing: Vienna, Austria, 2022; Available online: https://CRAN.R-project.org/package=Kendall (accessed on 3 June 2025).
- Wickham, H. ggplot2: Elegant Graphics for Data Analysis; Springer: New York, NY, USA, 2016; Available online: https://cran.r-project.org/web/packages/ggplot2/ (accessed on 3 June 2025).
- Wickham, H.; François, R.; Henry, L.; Müller, K.; Vaughan, D. dplyr: A Grammar of Data Manipulation, R Package Version 1.1.4; Posit PBC: Boston, MA, USA, 2023; Available online: https://CRAN.R-project.org/package=dplyr (accessed on 23 August 2025).
- Wickham, H.; Hester, J.; Bryan, J. readr: Read Rectangular Text Data, R Package Version 2.1.5; CRAN: Detroit, MI, USA, 2024; Available online: https://CRAN.R-project.org/package=readr (accessed on 23 August 2025).
- Grolemund, G.; Wickham, H. Dates and Times Made Easy with lubridate. J. Stat. Softw. 2011, 40, 1–25. Available online: https://www.jstatsoft.org/v40/i03/ (accessed on 23 August 2025). [CrossRef]
- Yue, S.; Pilon, P.; Cavadias, G. Power of the Mann–Kendall and Spearman’s Rho Tests for Detecting Monotonic Trends in Hydrological Series. J. Hydrol. 2002, 259, 254–271. [Google Scholar] [CrossRef]
- García, J.A.; Gallego, M.C.; Serrano, A.; Vaquero, J.M. Trends in block-seasonal extreme rainfall over the Iberian Peninsula in the second half of the twentieth century. J. Clim. 2007, 20, 113–120. [Google Scholar] [CrossRef]
- Gallego, M.C.; Trigo, R.M.; Vaquero, J.M.; Brunet, M.; García, J.A.; Sigró, J.; Valente, M.A. Trends in frequency indices of daily precipitation over the Iberian Peninsula during the last century. J. Geophys. Res. Atmos. 2011, 116, D02109. [Google Scholar] [CrossRef]
- Asikoglu, O.L.; Ciftlik, D. Recent Rainfall Trends in the Aegean Region of Turkey. J. Hydrometeorol. 2015, 16, 1873–1885. [Google Scholar] [CrossRef]
- Zhang, Y.; Ren, Y.; Ren, G.; Wang, G. Precipitation trends over mainland China from 1961–2016 after removal of measurement biases. J. Geophys. Res. Atmos. 2020, 125, e2019JD031728. [Google Scholar] [CrossRef]
- Haylock, M.R.; Peterson, T.C.; Alves, L.M.; Ambrizzi, T.; Anunciação, Y.M.T.; Baez, J.; Vincent, L. Trends in total and extreme South American rainfall in 1960–2000 and links with sea surface temperature. J. Clim. 2006, 19, 1490–1512. [Google Scholar] [CrossRef]
- Nazeri Tahroudi, M. Comprehensive global assessment of precipitation trend and pattern variability considering their distribution dynamics. Sci. Rep. 2025, 15, 22458. [Google Scholar] [CrossRef] [PubMed]
- Liu, P.; Washington, W.M.; Meehl, G.A.; Wu, G.; Potter, G.L. Historical and future trends of the Sahara Desert. Geophys. Res. Lett. 2001, 28, 239–242. [Google Scholar] [CrossRef]
- Biasutti, M. Rainfall Trends in the African Sahel: Characteristics, Processes, and Causes. WIREs Clim. Change 2019, 10, e591. [Google Scholar] [CrossRef]
- Acero, F.J.; García, J.A.; Gallego, M.C. Peaks-over-Threshold Study of Trends in Extreme Rainfall over the Iberian Peninsula. J. Clim. 2011, 24, 1089–1105. [Google Scholar] [CrossRef]
- Singirankabo, E.; Iyamuremye, E. Modelling Extreme Rainfall Events in Kigali City Using Generalized Pareto Distribution. Meteorol. Appl. 2022, 29, e2076. [Google Scholar] [CrossRef]
- Kołodziejczyk, K.; Rutkowska, A. Estimation of the Peak over Threshold-Based Design Rainfall and Its Spatial Variability in the Upper Vistula River Basin, Poland. Water 2023, 15, 1316. [Google Scholar] [CrossRef]
- Phoophiwfa, T.; Chomphuwiset, P.; Prahadchai, T.; Park, J.-S.; Apichottanakul, A.; Theppang, W.; Busababodhin, P. Employing the Generalized Pareto Distribution to Analyze Extreme Rainfall Events on Consecutive Rainy Days in Thailand’s Chi Watershed: Implications for Flood Management. Hydrol. Earth Syst. Sci. 2024, 28, 801–816. [Google Scholar] [CrossRef]
- Garba, I.; Abdourahamane, Z.S. Extreme rainfall characterisation under climate change and rapid population growth in the city of Niamey, Niger. Heliyon 2023, 9, e13326. [Google Scholar] [CrossRef] [PubMed]
- Kim, W.M.; Blender, R.; Sigl, M.; Messmer, M.; Raible, C.C. Statistical characteristics of extreme daily precipitation during 1501 BCE–1849 CE in the Community Earth System Model. Clim. Past 2021, 17, 2031–2053. [Google Scholar] [CrossRef]
- Vicente-Serrano, S.M.; Beguería, S.; Reig, F.; Royo, A.; Arretxea, M.; Gil, M.; Latorre, B.; El Kenawy, A.; Franquesa, A.; Halifa-Marin, A.; et al. Developing science-informed maps and climate service for extreme rainfall in Spain. Nat. Hazards 2025, 1–22. [Google Scholar] [CrossRef]
- Latif, M.; Syed, F.S.; Hannachi, A. Rainfall trends in the South Asian summer monsoon and its related large-scale dynamics with focus over Pakistan. Clim. Dyn. 2017, 48, 3565–3581. [Google Scholar] [CrossRef]
- Elfeki, A.; Bahrawi, J.; Latif, M.; Hannachi, A. Spatiotemporal analysis of monthly rainfall over Saudi Arabia and global teleconnections. Geomat. Nat. Hazards Risk 2022, 13, 2618–2648. [Google Scholar] [CrossRef]
Disclaimer/Publisher’s Note: The statements, opinions and data contained in all publications are solely those of the individual author(s) and contributor(s) and not of MDPI and/or the editor(s). MDPI and/or the editor(s) disclaim responsibility for any injury to people or property resulting from any ideas, methods, instructions or products referred to in the content. |
© 2025 by the authors. Licensee MDPI, Basel, Switzerland. This article is an open access article distributed under the terms and conditions of the Creative Commons Attribution (CC BY) license (https://creativecommons.org/licenses/by/4.0/).