


Abstract
Industrial information systems based on web technologies (ISOWT) face escalating security challenges, particularly in critical sectors such as energy. Traditional qualitative security assessments often lack the ability to deliver actionable, real-time insights for managing complex, dynamic threats. This paper proposes a novel security index for evaluating ISOWT in industrial organizations by integrating fuzzy logic, metric-based evaluation, fuzzy Markov chains, and multi-agent systems. The proposed index quantifies deviations from an ideal “center of safety,” enabling early risk detection and proactive mitigation. The methodology is validated through two real-world case studies on Syria’s energy sector, namely the Ministry of Electricity website and Mahrukat fuel management system. Experimental results demonstrate substantial improvements, including a 45.9–58.5% increase in security index, 56.9–60.3% reduction in page load times, and 78.3–82.4% decrease in detected vulnerabilities. Comparative analysis shows that the proposed approach outperforms existing methods in terms of quantitative precision, real-time monitoring, and predictive capabilities. The proposed framework is scalable, automated, and adaptable, addressing key limitations of existing ISOWT security assessment techniques and providing a robust tool for enhancing system resilience. Its flexibility enable applicability across diverse industrial domains, contributing to advanced cybersecurity practices for critical infrastructure. Future work will focus on integrating advanced technologies, expanding the framework to additional sectors, developing adaptive fuzzy models, accounting for human factors, and improving visualization techniques to further address the evolving security challenges faced by industrial organizations.
1. Introduction
The growing dependence on web technologies within industrial control and management systems has introduced new and increasingly complex security challenges that traditional assessment approaches are often unable to adequately address. Industrial organizations, particularly those operating critical infrastructure such as the energy sector, require robust security evaluation frameworks that can quantify risks, predict potential failures, and enable proactive mitigation strategies. This demand is especially pronounced in environments characterized by both technological constraints and geopolitical challenges, such as Syria’s energy sector.
Existing security assessment approaches for information systems based on web technologies (ISOWT) commonly rely on qualitative evaluations or concentrate on isolated vulnerabilities without capturing the overall system state. As a result, these methods often fail to provide actionable insights for real-time security management, leaving industrial organizations exposed to emerging threats and operational disruptions. Furthermore, the dynamic nature of web-based systems, with their complex interactions and dependencies, demands more sophisticated modeling techniques than traditional binary security assessments can offer.
This study addresses these limitations by proposing a comprehensive methodology that integrates fuzzy logic, metric-based evaluations, fuzzy Markov chains, and multi-agent systems to construct a novel security index. The proposed index quantifies the deviation of a system’s current state from an ideal “center of safety,” thereby enabling early risk detection and supporting proactive security management. The approach is validated through case studies on operational systems in Syria’s energy sector, demonstrating significant improvements in both system performance and security.
The main contributions of this work are summarized as follows:
- (1)
- A novel security index that quantitatively assesses system safety by leveraging fuzzy logic and topological concepts, providing a numerical representation of deviation from ideal operational conditions;
- (2)
- An integrated security assessment and management methodology that combines metric-based evaluations, fuzzy Markov chains, and multi-agent systems to enable comprehensive and systematic analysis;
- (3)
- A predictive security framework based on fuzzy Markov chains that anticipates potential risk evolution and supports proactive mitigation strategies;
- (4)
- A scalable and adaptable approach validated through real-world case studies in Syria’s energy sector, demonstrating significant improvements in both system performance and security.
The remainder of this paper is organized as follows: Section 2 reviews related work on security assessment methodologies, fuzzy logic applications in cybersecurity, and multi-agent systems for security management. Section 3 presents the theoretical foundations of the proposed approach, including fuzzy logic concepts and Markov chain applications. Section 4 describes the proposed methodology, covering the security index formulation, metric identification, and multi-agent system architecture. Section 5 presents the case studies and experimental results obtained from implementations in Syria’s energy sector. Section 6 discusses the implications, limitations, and future research directions. Finally, Section 7 concludes the paper by summarizing the main contributions and potential applications.
2. Literature Review
Security assessment methodologies for information systems have evolved significantly over the past decade, gradually shifting from qualitative toward more quantitative approaches. Traditional frameworks such as the national institute of standards and technology (NIST’s) Risk Management Framework [1,2] and ISO/IEC 27001 [3] provide comprehensive guidelines; however, they often lack the level of specificity required for web-based industrial systems. More recent approaches have attempted to address this limitation through the use of various computational and analytical methods.
2.1. Security Assessment Methodologies
Quantitative security assessment methods have gained attention due to their ability to provide measurable and comparable insights. Shameli-Sendi et al. [4] proposed a method for calculating security metrics based on attack graphs, while Ahmed et al. [5] developed a framework that integrates multiple security metrics to evaluate system vulnerability. However, these approaches often struggle with the inherent uncertainty in security assessments.
Metric-based evaluations have emerged as a promising direction for quantifying security properties. Wang and Wulf [6] introduced a framework for measuring security using hierarchical metrics, while Savola [7] proposed a security metrics taxonomy specifically for web services. Building on these foundations, the present work identifies and integrates key metrics for ISOWT in industrial environments, with particular emphasis on performance, reliability, and security indicators.
2.2. Fuzzy Logic in Cybersecurity
Fuzzy logic–based and expert-system approaches have proven valuable in addressing the uncertainty inherent in security assessments. Levary [8] demonstrated that adaptive expert systems can significantly improve intrusion detection accuracy under uncertain conditions. Similarly, Chen et al. [9] used fuzzy set theory to model and evaluate information system security risks, showing that fuzzy approaches can better capture the nuanced nature of security threats compared to binary classifications. Fuzzy logic’s adaptability makes it particularly suitable for evolving threats in the Industrial Internet of Things (IIoT), where traditional methods often fall short [10].
The integration of fuzzy logic with other computational methods has further enhanced security assessment capabilities. Deng et al. [11] combined fuzzy logic with evidence theory to improve risk assessment, Shamshirband et al. [12] proposed a cooperative game-theoretic approach using fuzzy Q-learning for intrusion detection and prevention in wireless sensor networks, demonstrating the effectiveness of combining game theory and fuzzy-based learning techniques in cybersecurity. Our approach extends these efforts by combining fuzzy logic with Markov chains to model system state transitions and predict potential security risks.
2.3. Multi-Agent Systems for Security Management
Multi-agent systems (MAS) provide a distributed approach to security management that aligns well with the decentralized nature of modern industrial systems. Herrero et al. [13] developed a MAS for intrusion detection in computer networks, while Boudaoud et al. [14] proposed a MAS framework for security policy management. These studies demonstrate the effectiveness of agent-based architectures in monitoring and responding to security threats.
In industrial environments, MAS have been applied to various security challenges. Carcano et al. [15] proposed a multidimensional state-based approach for intrusion detection in Supervisory Control and Data Acquisition (SCADA) systems, while Ramos et al. [16] developed a MAS for threat detection in industrial control systems. Building on these studies, the present work implements a MAS architecture specifically designed for ISOWT in industrial organizations, with agents responsible for metric collection, state assessment, risk prediction, and mitigation coordination.
3. Theoretical Foundations
This section presents the theoretical foundations of our approach, including fuzzy logic concepts, Markov chain applications, and their integration for security assessment.
3.1. Fuzzy Logic Concepts
Fuzzy logic provides a framework for reasoning with imprecise or uncertain information, making it particularly suitable for security assessment, where many parameters cannot be precisely quantified. In this work, fuzzy sets are used to represent system states and security metrics, with membership functions defining the degree to which a given value belongs to a specific set.
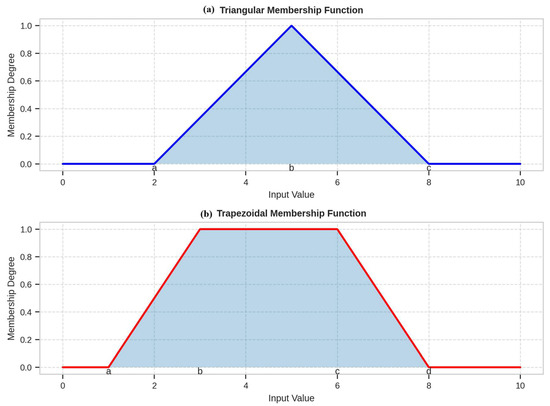
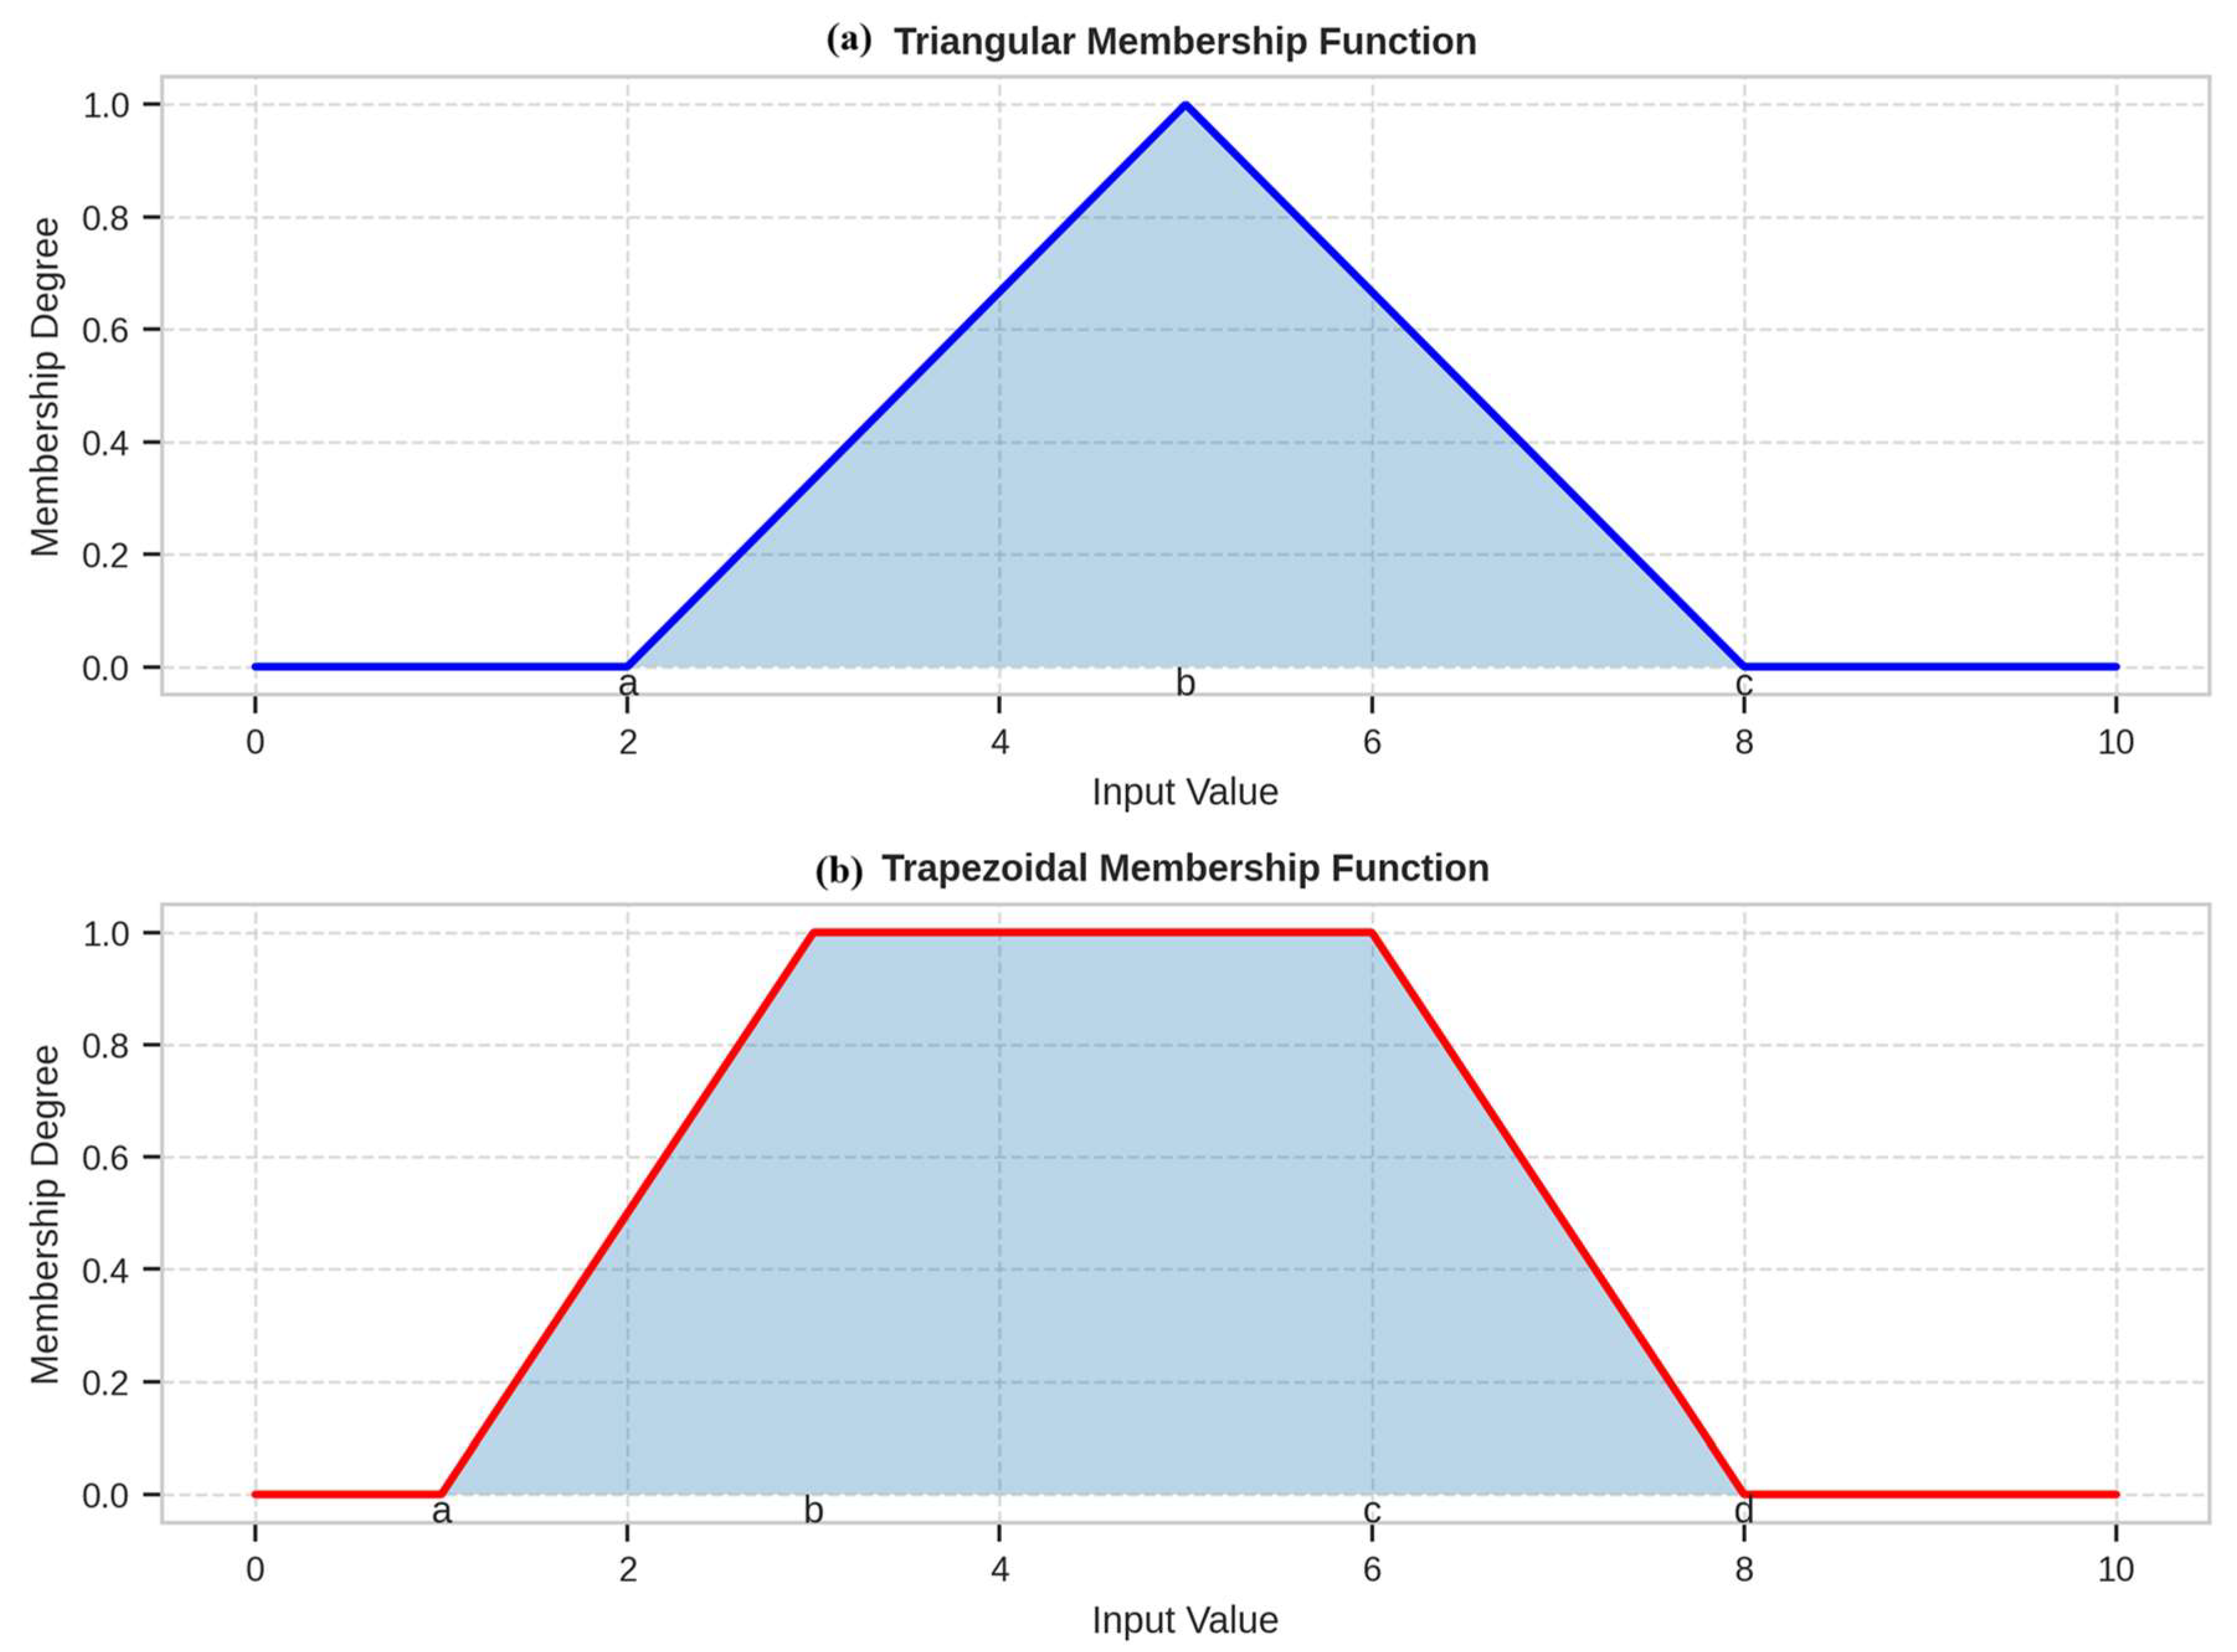
For each security metric m, a fuzzy set A is defined with a membership function μA(m) that maps metric values to the interval [0, 1], representing the degree of membership. Triangular and trapezoidal membership functions are primarily used due to their computational efficiency and interpretability. A triangular membership function is defined by three parameters (a, b, c) as follows:
Similarly, a trapezoidal membership function is defined by four parameters (a, b, c, d):
These membership functions allow us to represent the degree to which a system’s metrics indicate safe or unsafe conditions, providing a more nuanced assessment than binary classifications.
3.2. Fuzzy Markov Chains
Markov chains model state transitions in systems where the future state depends only on the current state and not on the sequence of preceding events. Fuzzy Markov chains extend this concept by incorporating fuzzy sets to represent system states and transition probabilities, enabling the modeling of systems with uncertain or imprecise state definitions.
In our approach, we define a fuzzy Markov chain with a set of states and a fuzzy transition matrix P, where each element represents the possibility of transitioning from the state to state . The fuzzy transition matrix is defined as follows:
The evolution of the system state over time is modeled using the fuzzy state vector π(t) and the transition matrix P:
where ⊗ represents the max-min composition operation. This formulation allows us to predict future system states based on current conditions and transition possibilities, enabling proactive security management.
π(t + 1) = π(t) ⊗ P
3.3. Integration for Security Assessment
Our approach integrates fuzzy logic and fuzzy Markov chains to form a comprehensive security assessment framework. Fuzzy logic is used to evaluate the current system state based on multiple security-related metrics, while fuzzy Markov chains are employed to predict potential future states and their transition possibilities.
The integration process consists of the following steps:
- Metric Collection: Collecting data related to system performance, reliability, and security indicators;
- Fuzzy Evaluation: Applying membership functions to transform metric values into fuzzy sets;
- State Determination: Combining fuzzy evaluations to determine the current system state;
- Transition Analysis: Using fuzzy Markov chains to compute transition possibilities to other states;
- Risk Prediction: Identifying high-risk transitions and potential security threats;
- Mitigation Planning: Developing appropriate strategies to reduce identified risks and enhance system security.
This integrated approach enables a more comprehensive and nuanced security assessment compared to traditional methods, enabling more effective security management in industrial ISOWT.
4. Proposed Methodology
This section details the proposed methodology for security assessment and management in industrial ISOWT, including the formulation of the security index, metric identification, and multi-agent system architecture.
4.1. Security Index Formulation
The core of the proposed methodology is a novel security index that quantifies the deviation of a system’s current state from an ideal “center of safety.” The index is computed using a topological approach that represents the system position within a multidimensional metric space.
The security index SI is defined as:
where denotes the distance between the current system state s and the center of safety c in the metric space, and represents the maximum possible distance in this space. The distance function d is calculated using a weighted Euclidean metric:
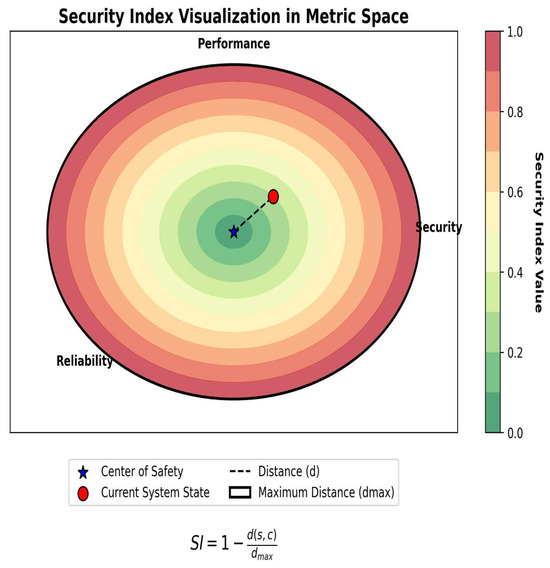
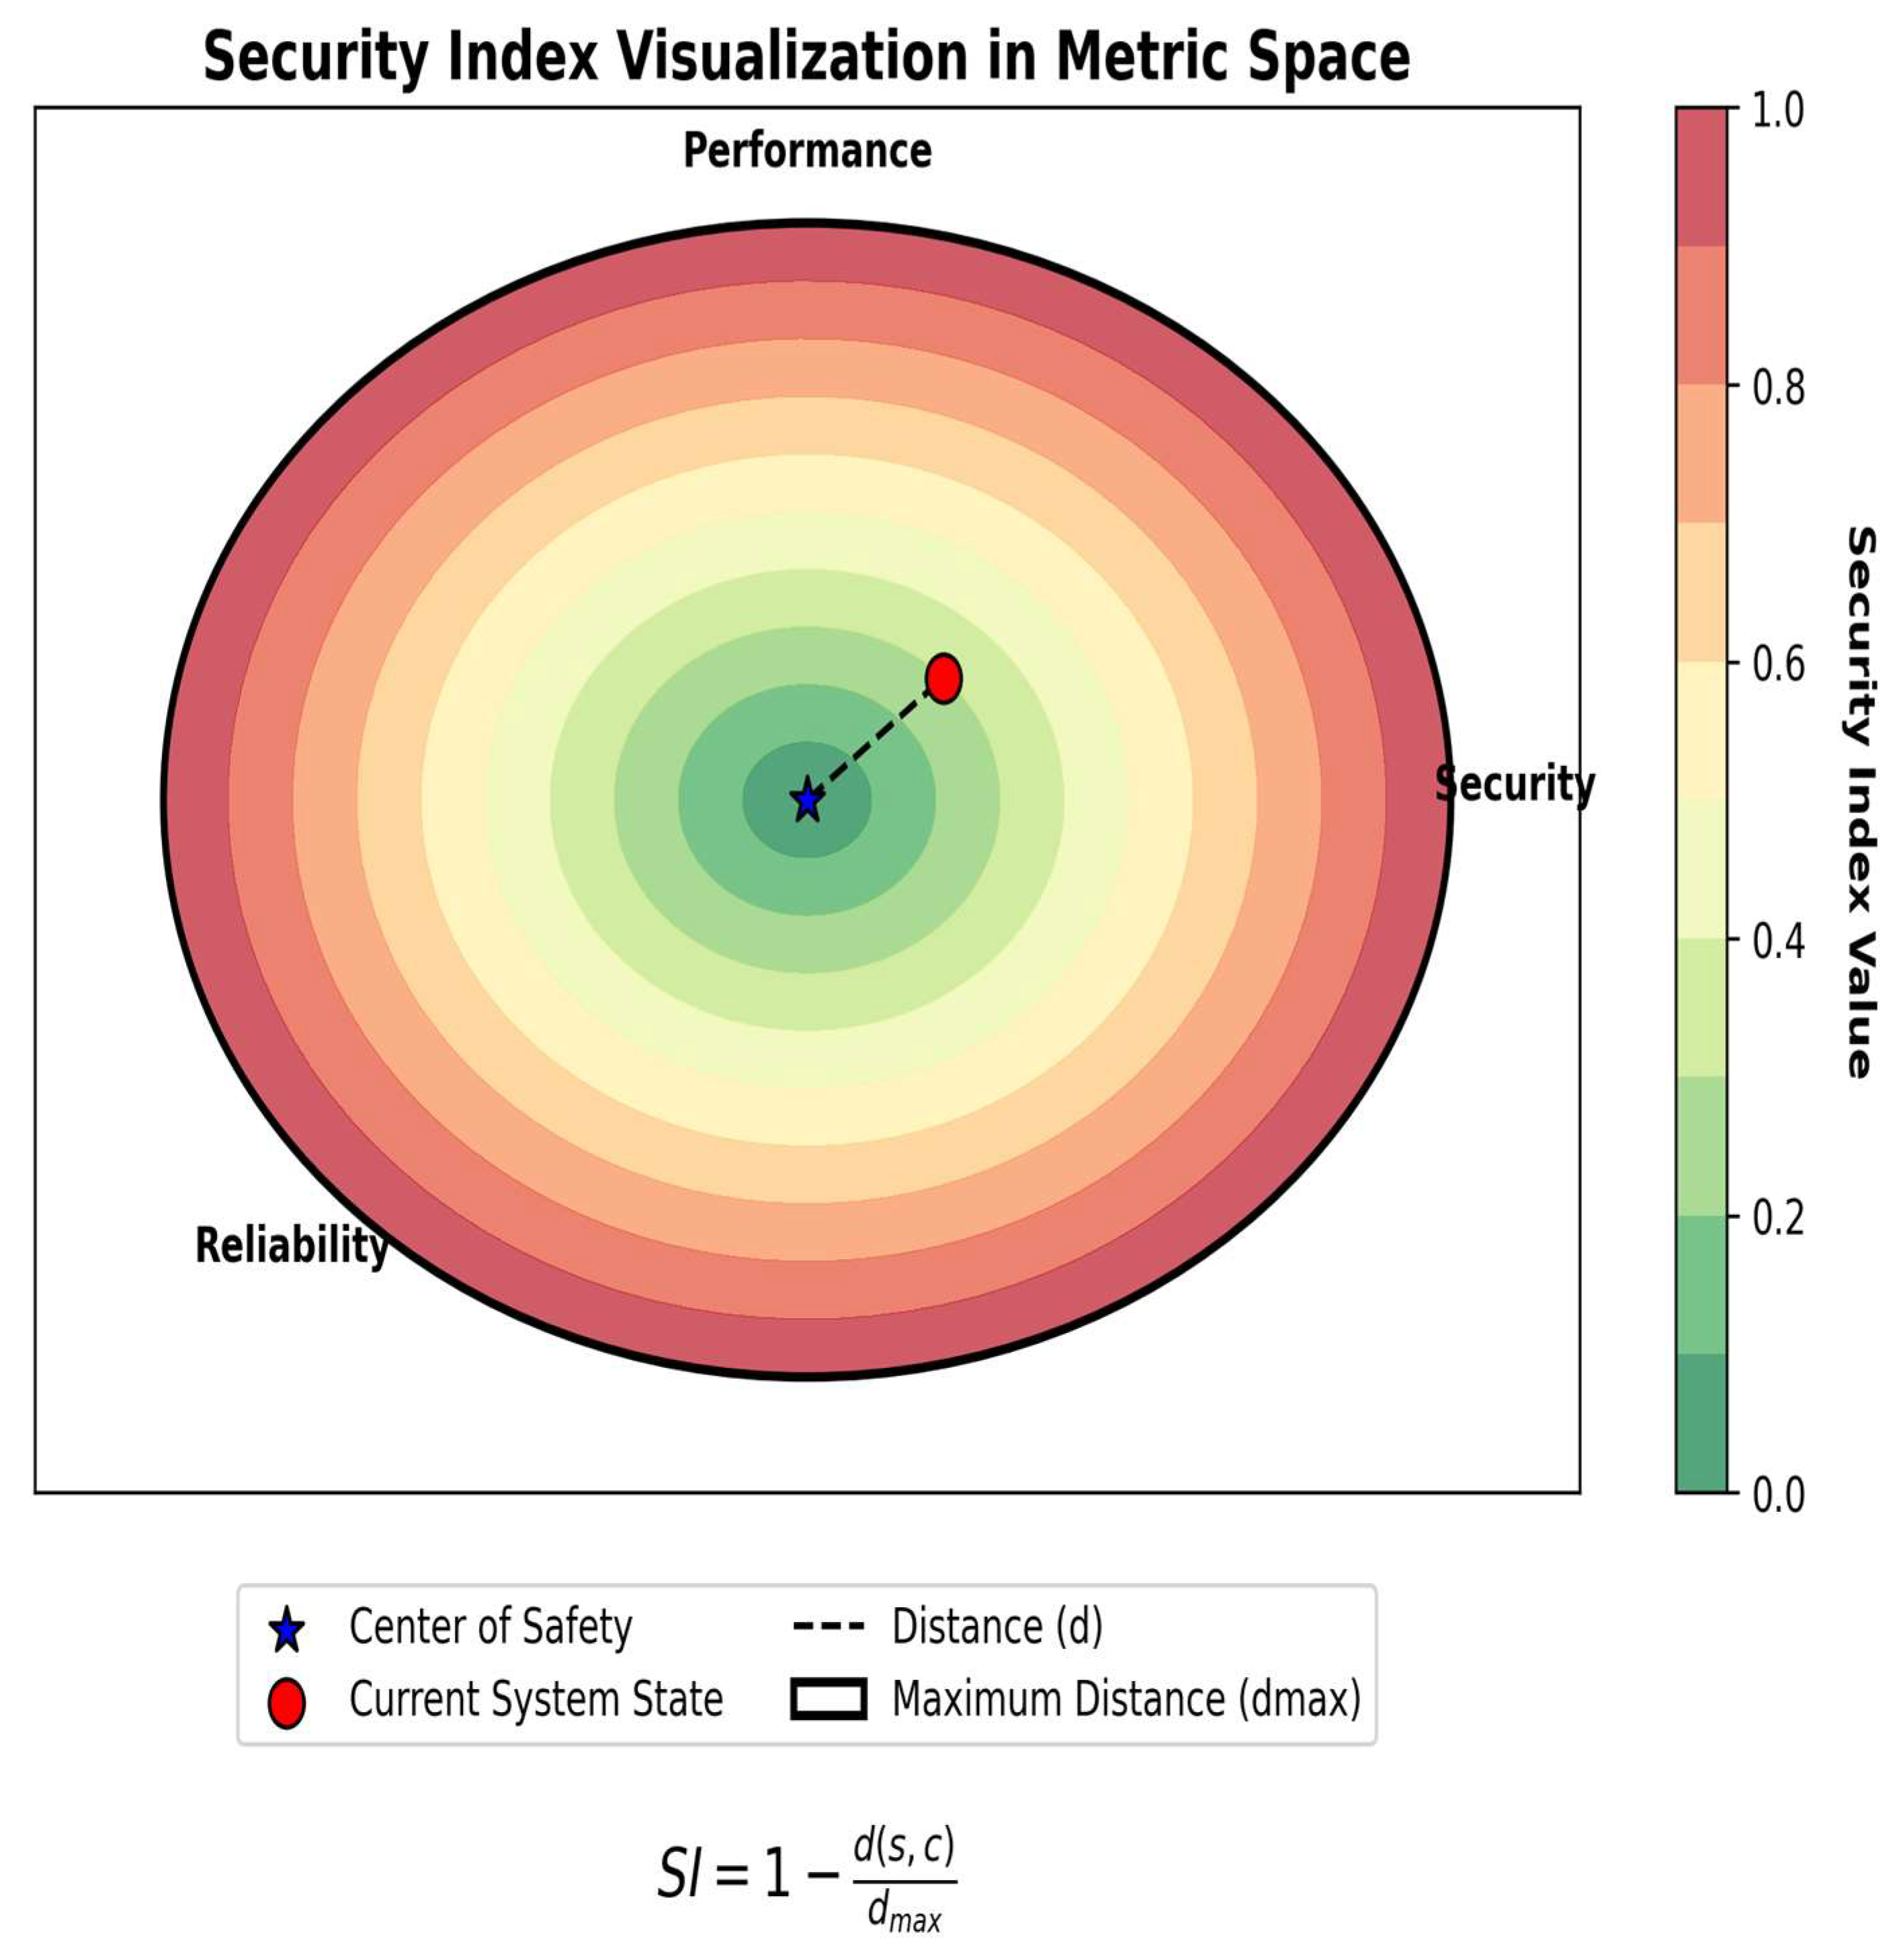
where are weights assigned to each dimension according to its relative importance to overall security, and and denote the coordinates of the current state and center of safety in the i-th dimension, respectively. The geometric interpretation of this formulation is illustrated in Figure 1.
Figure 1.
Examples of fuzzy membership functions. (a) Triangular membership function; (b) Trapezoidal membership function. The parameters a, b, c (and d for the trapezoidal function) define the characteristic points of the membership functions; the solid lines represent the membership functions, and the shaded area indicates the degree of membership μ(m) ∈ [0, 1].
As illustrated in Figure 2, the security index ranges from 0 to 1, where higher values indicate a higher level of system security. A value of 1 represents full alignment with the center of safety, while a value of 0 corresponds to the maximum deviation and indicates a high-risk state. This formulation provides a clear, quantitative measure of system security that can be monitored over time and used to trigger alerts when the index falls below predefined threshold values.
Figure 2.
Security index visualization in metric space.
4.2. Metric Identification and Measurement
Effective security assessment requires comprehensive metric identification and measurement. Based on our analysis of industrial ISOWT requirements and existing literature, we have identified key metrics, as presented in Table 1, grouped into three main categories: performance, reliability, and security.
Table 1.
Key metrics for ISOWT security assessment.
The selection of these metrics is supported by several recent studies and standards that emphasize their relevance for evaluating the security and operational robustness of web-based industrial systems. Performance-related metrics such as Page Load Time (PLT), Time to First Byte (TTFB), and Document Object Model (DOM) Processing Time (DPT) are widely adopted in contemporary web performance evaluations and are recommended by Google Lighthouse and W3C Web Performance Working Group as primary indicators of system responsiveness and user-perceived efficiency in modern industrial platforms [17,18].
Reliability metrics, including Error Rate, System Availability, and Response Consistency, align with the ISO/IEC 25010 [19] software quality model and the updated NIST SP 800-30 framework, both of which identify availability, fault tolerance, and operational stability as core quality attributes for critical infrastructure systems [19,20]. These metrics are essential for industrial ISOWT environments, where service continuity and predictable behavior directly affect operational safety and process control.
Each metric is measured using appropriate tools and techniques, with results normalized to a [0, 1] scale for consistent evaluation. The normalization process uses domain-specific knowledge to define acceptable ranges and thresholds for each metric.
For example, Page Load Time (PLT) is normalized using the following function:
where is the optimal load time (typically 1–2 s) and is the maximum acceptable load time (typically 8–10 s). Similar normalization functions are defined for each metric based on industry standards and system requirements. These standards are essential for ensuring user satisfaction and operational efficiency in web-based applications, as highlighted in previous studies [21,22].
4.3. Multi-Agent System Architecture
To implement our methodology in real-world environments, we developed a multi-agent system (MAS) architecture that enables distributed monitoring, assessment, and mitigation. The MAS is implemented using the SPADE (Smart Python 2.7 Agent Development Environment) platform, which provides a robust framework for agent-based systems.
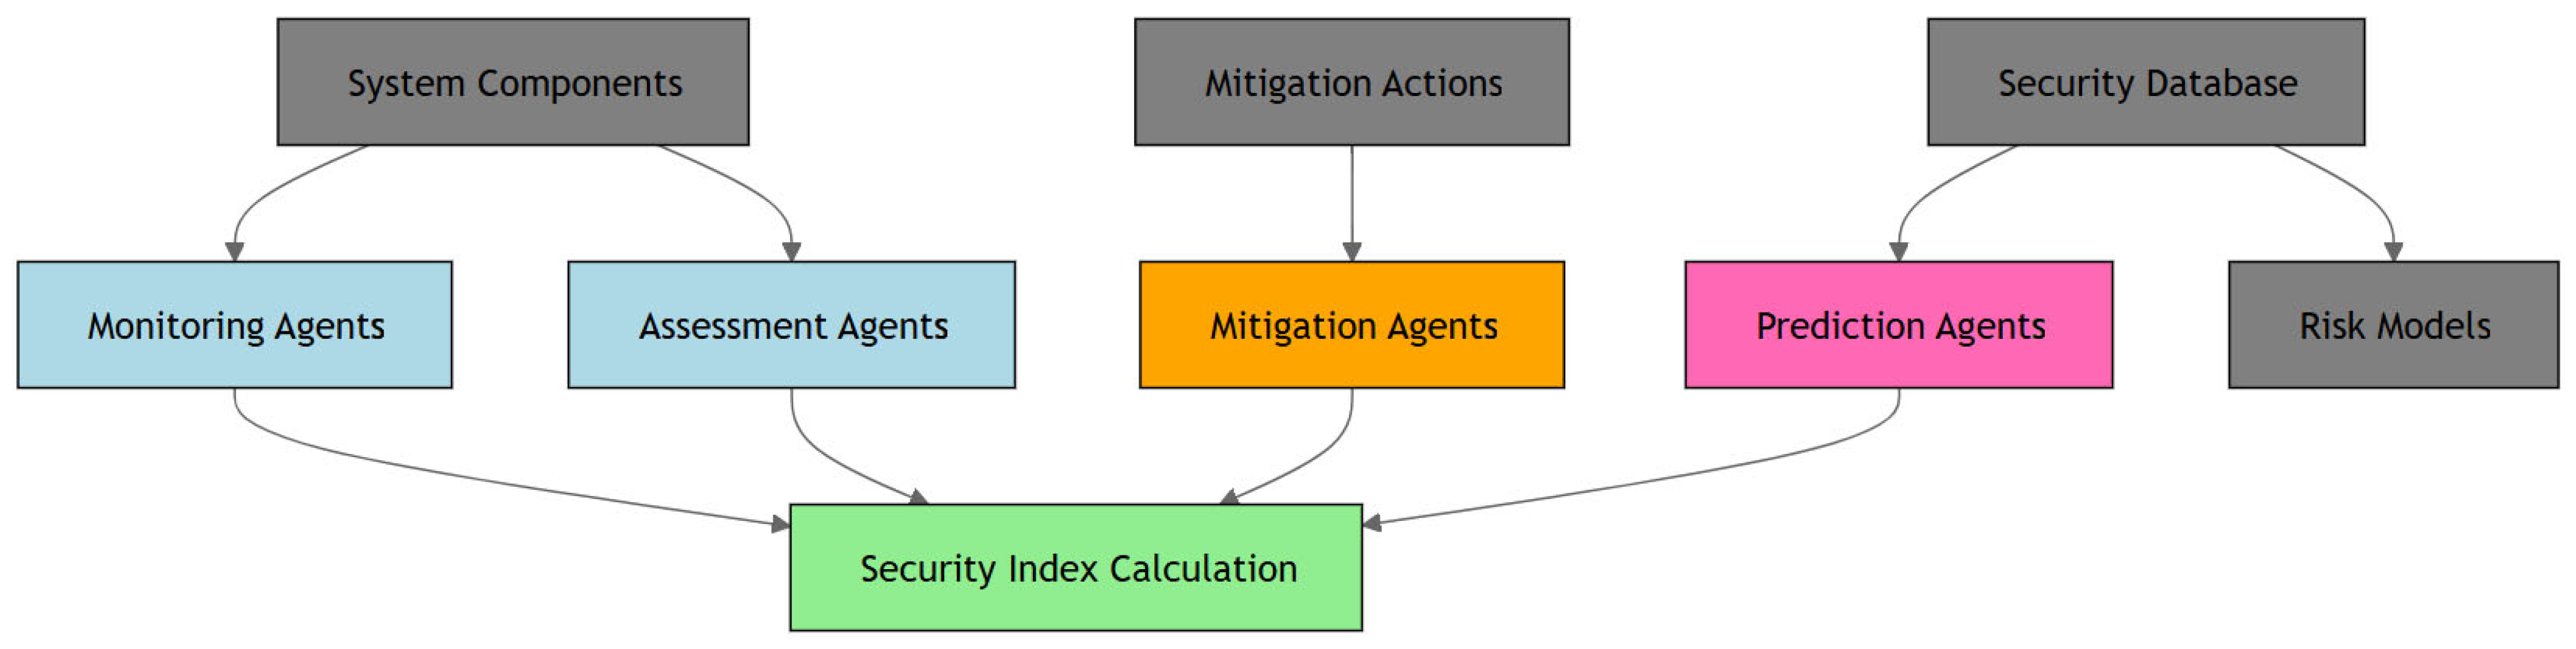
Our MAS architecture consists of four types of agents:
- Monitoring Agents: Responsible for collecting metric data from various system components and tools;
- Assessment Agents: Process metric data to evaluate the current system state and calculate the security index;
- Prediction Agents: Apply fuzzy Markov chains to predict potential future states and identify risks;
- Mitigation Agents: Coordinate and implement security measures based on assessment and prediction results.
The agents communicate using a standardized message format based on the FIPA (Foundation for Intelligent Physical Agents) protocol, ensuring interoperability and extensibility. The MAS operates continuously, with monitoring agents collecting data at configurable intervals, assessment agents evaluating the system state in real-time, prediction agents forecasting risks, and mitigation agents implementing security measures as needed.
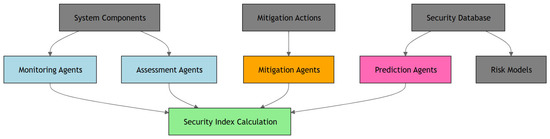
The proposed multi-agent system architecture is illustrated in Figure 3. This architecture provides several advantages for industrial ISOWT security management:
Figure 3.
Multi-Agent system architecture for ISOWT security assessment and management. Blue blocks represent monitoring and assessment agents, orange blocks denote mitigation agents, pink blocks indicate prediction agents, and green blocks correspond to the security index calculation module.
- Distributed Monitoring: Agents can be deployed across multiple system components, enabling comprehensive coverage;
- Real-Time Assessment: Continuous evaluation of the security index provides immediate visibility into the system state;
- Predictive Capabilities: Fuzzy Markov chains enable proactive identification of potential risks;
- Automated Mitigation: Predefined security measures can be implemented automatically in response to detected risks;
- Scalability: The agent-based approach can be extended to accommodate additional metrics, components, and security measures as needed.
4.4. Fuzzy Markov Implementation
Practical implementation of the proposed method relies on the sequential use of fuzzy membership functions and fuzzy Markov chains to diagnose the system state and enable early risk detection.
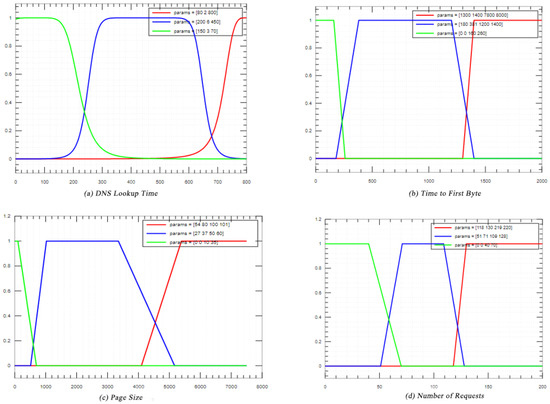
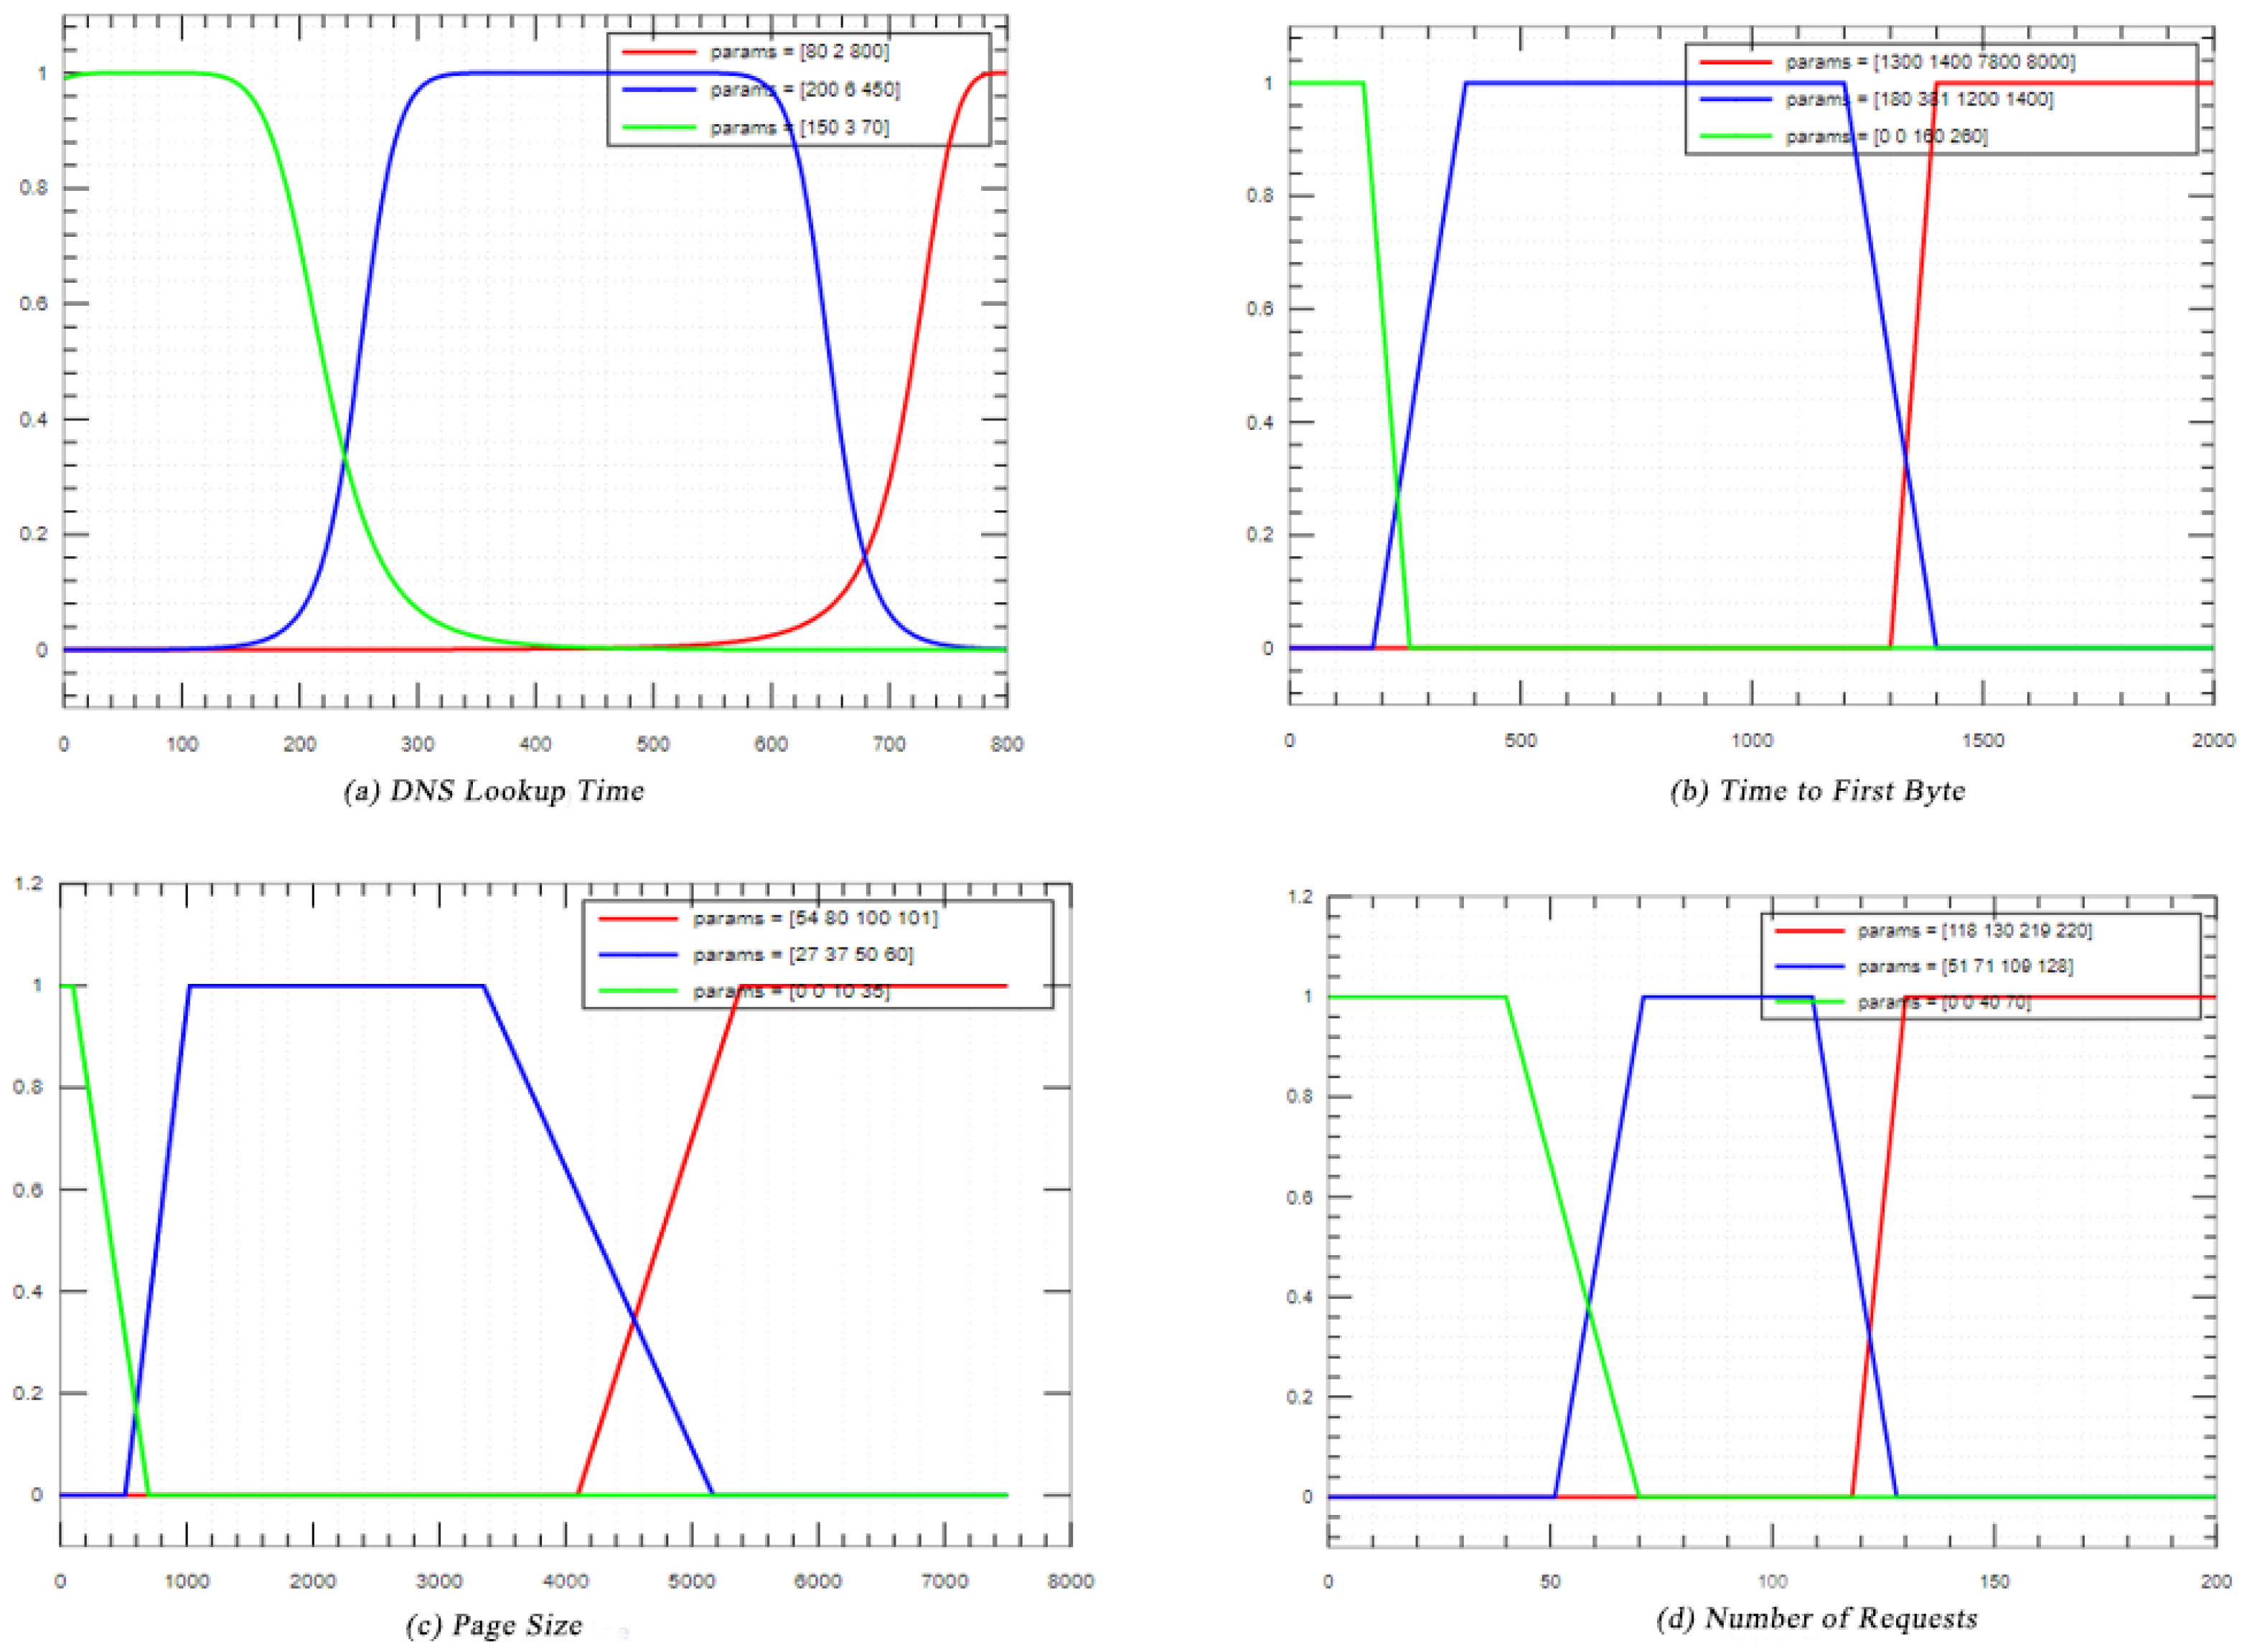
In the first stage, quantitative indicators—such as page load time, response time, error rate, system availability, and vulnerability count—are transformed into normalized values ranging from 0 to 1. Linguistic assessments are then generated for each metric using membership functions corresponding to the terms “normal state,” “warning,” and “critical state.” Figure 4 illustrates an example of these membership functions, showing how raw metric values are mapped to the respective fuzzy linguistic categories [23].
Figure 4.
Fuzzy membership functions for system metrics. (a) DNS Lookup Time, (b) Time to First Byte, (c) Page Size, and (d) Number of Requests.
In the second stage, a state vector is constructed by combining the fuzzy evaluations of all metrics. In this model, represents the system state vector at time , formed by aggregating the fuzzy membership evaluations of all monitored metrics. Each element of corresponds to the system’s degree of membership in a specific linguistic state (such as “normal,” “warning,” or “critical”). The variable ttt denotes discrete time intervals at which monitoring data are collected, allowing the model to track the temporal evolution of the system over time. The temporal evolution of this state is then modeled using a fuzzy Markov chain. Transition probabilities are determined based on the deviation of current metric values from optimal thresholds and their observed trends; greater deviations increase the likelihood of transitioning into less secure states. This approach effectively addresses uncertainty and incomplete data, which are common characteristics of industrial web-based systems.
In the third stage, the method predicts the probability of the system shifting into higher-risk states using the standard Markov update rule:
where is the transition probability matrix. If the forecast indicates a drift toward a region with low membership in the “safe” state, the system is flagged for preventive action. This mechanism enables early identification of deteriorating trends and emerging risks.
Thus, the proposed method integrates heterogeneous metrics into a unified model, evaluates the current system state, and predicts its evolution, which is a key component in early threat detection.
5. Case Studies and Results
To validate our methodology, we conducted case studies on two operational ISOWT in Syria’s energy sector: the Ministry of Electricity website (“moe.gov.sy”) and the Mahrukat fuel management system. These systems were selected due to their critical role in energy infrastructure management and their diverse technical characteristics.
5.1. Case Study 1: Ministry of Electricity Website
The Ministry of Electricity website serves as a central information hub for Syria’s electrical grid, providing public information, service requests, and internal management functions. The system faces several challenges, including high traffic volumes, frequent update requirements, and potential security threats.
Our methodology was implemented on this system over a six-month period, during which metrics were collected, the security index was calculated, and mitigation measures were applied based on the assessment results. The implementation process involved the following steps:
- Initial Assessment: Establishing baseline metrics and calculating the initial security index;
- MAS Deployment: Installing monitoring agents on key system components and configuring assessment, prediction, and mitigation agents;
- Continuous Monitoring: Collecting metrics at regular intervals (hourly for performance metrics and daily for security metrics);
- Mitigation Implementation: Applying security measures based on assessment results and predictions;
- Performance Evaluation: Comparing system metrics and security index values before and after implementation.
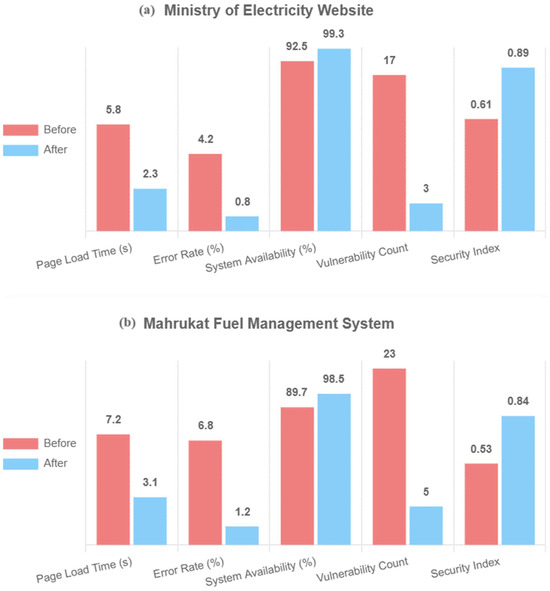
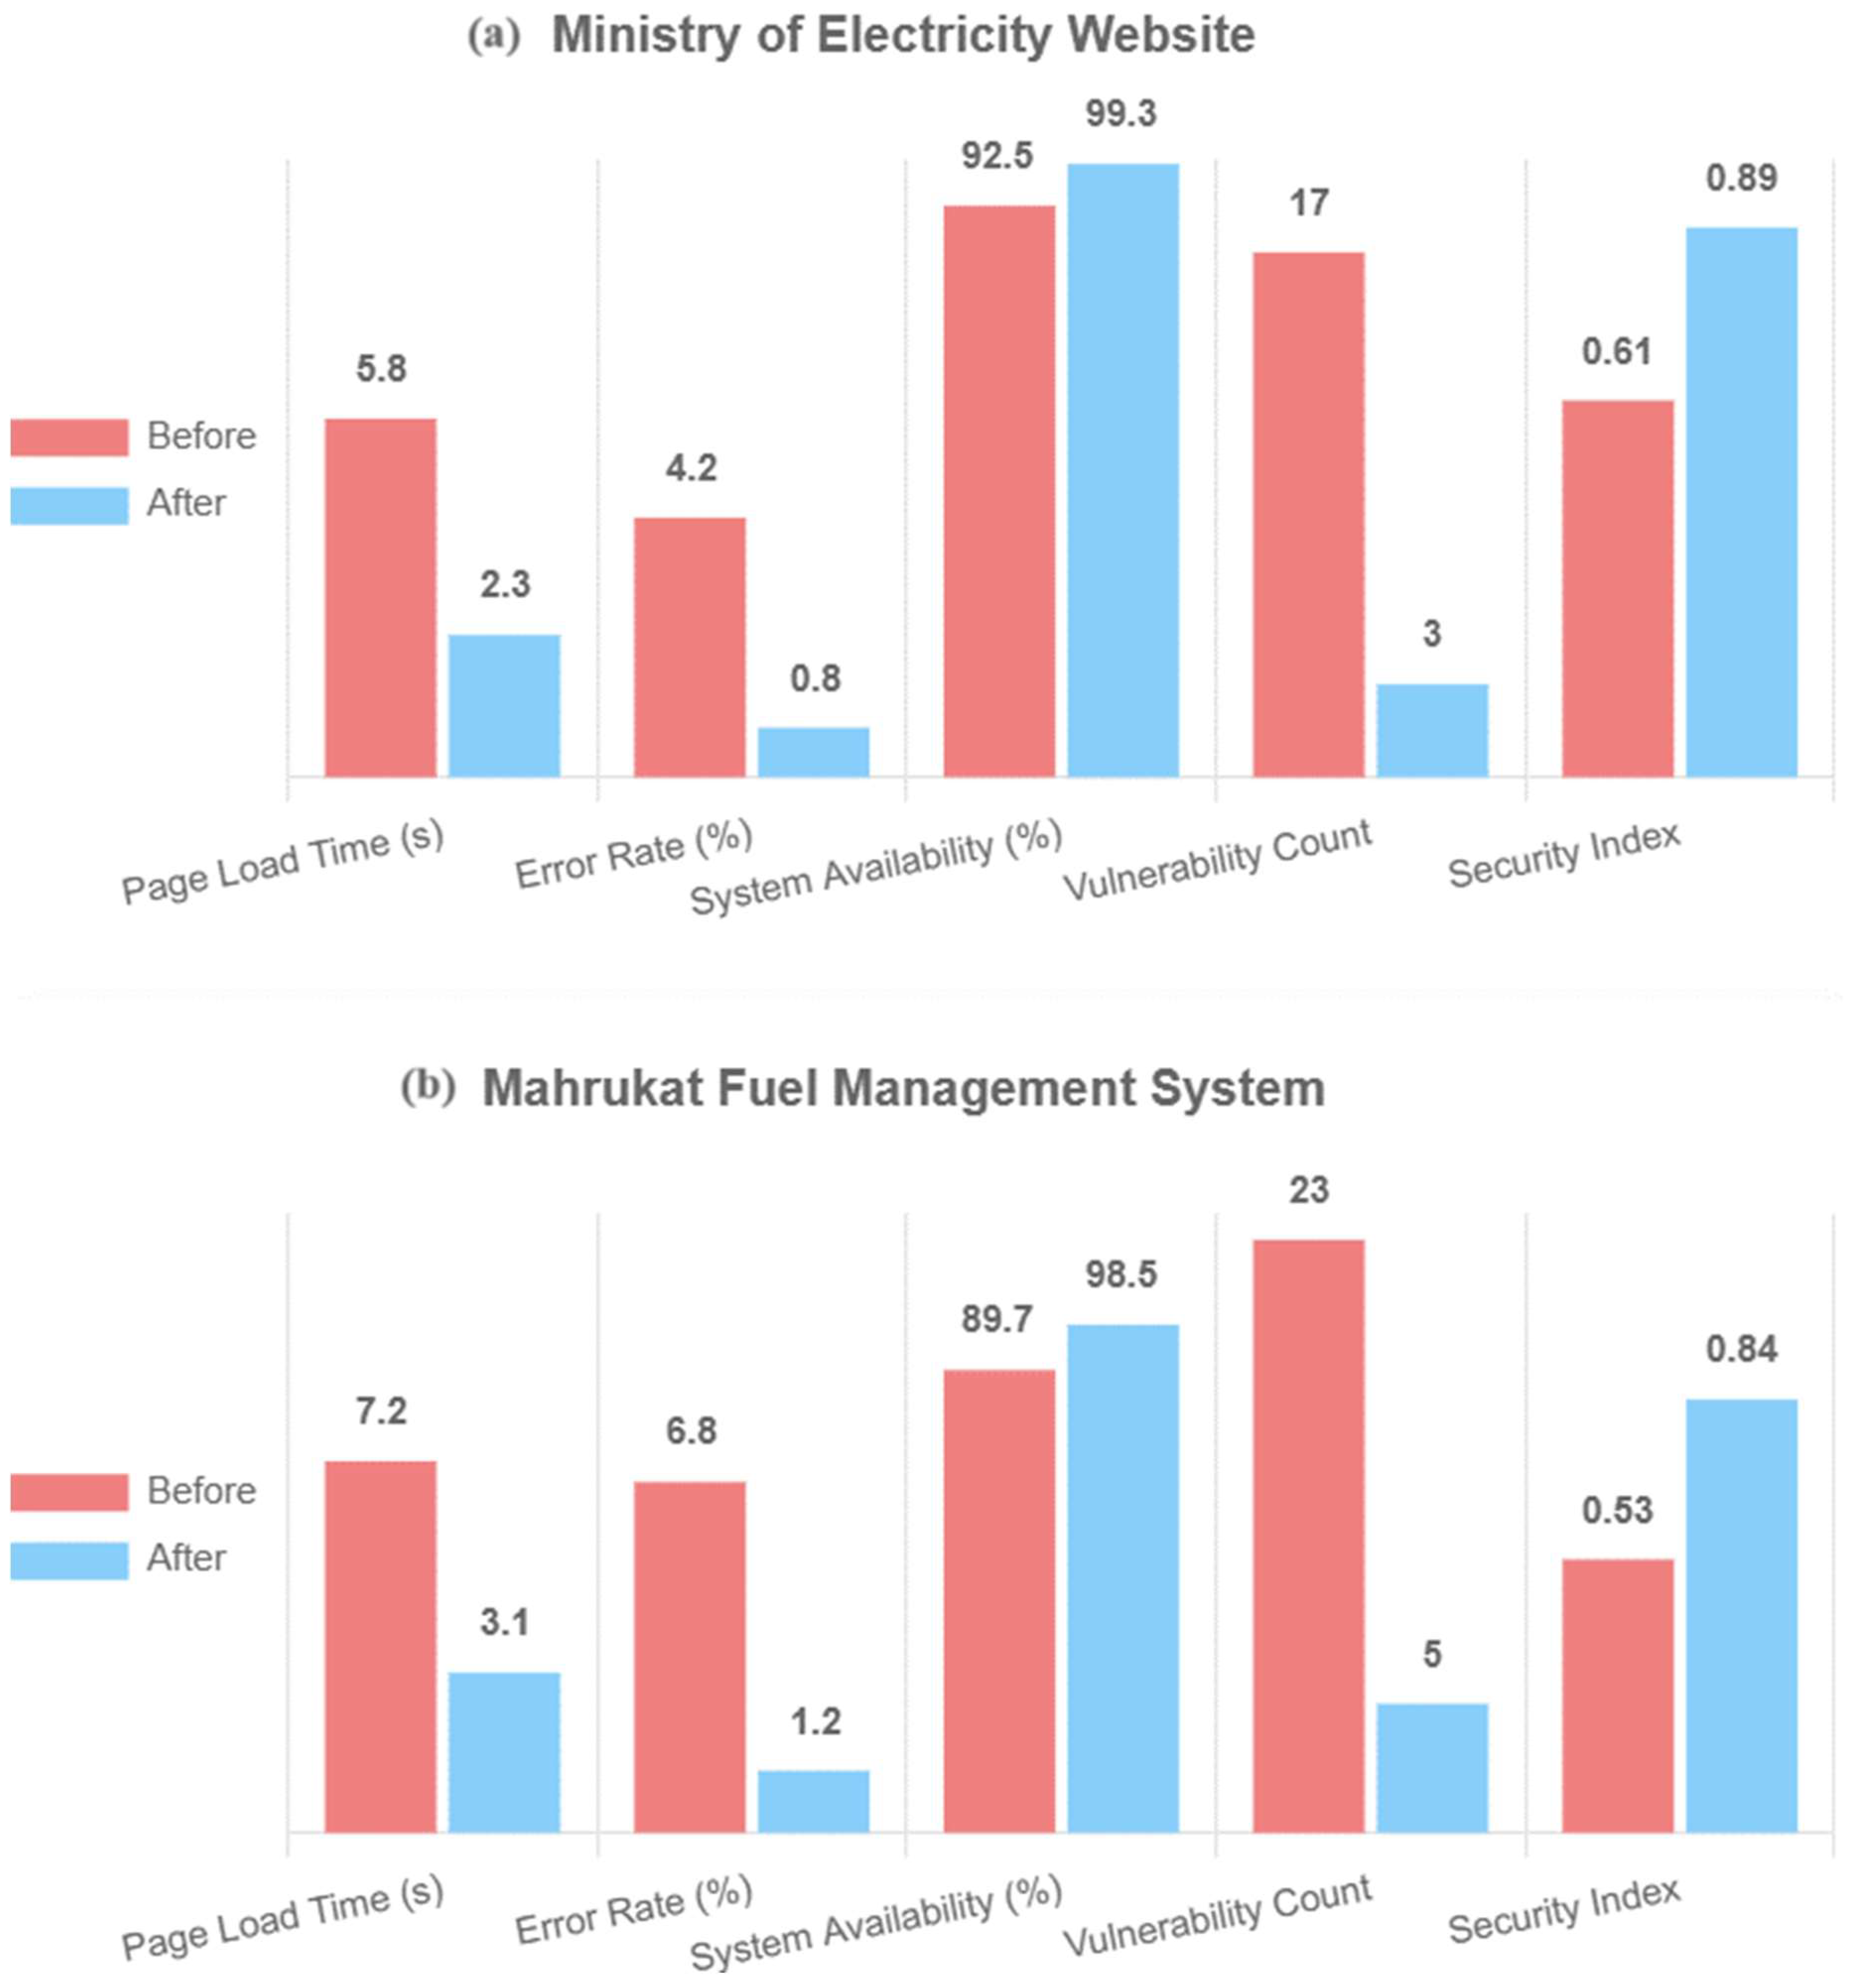
As presented in Table 2, the results show significant improvements across all metrics, with the security index increasing from 0.61 to 0.89. This improvement reflects enhanced system performance, reliability, and security, resulting in better service delivery and reduced operational risks.
Table 2.
Results for Ministry of Electricity website.
5.2. Case Study 2: Mahrukat Fuel Management System
The Mahrukat system manages fuel distribution across Syria, including inventory tracking, order processing, and delivery coordination. The system operates under challenging conditions, such as high transaction volumes, strict reliability requirements, and exposure to potential security threats.
Our methodology was implemented on this system following the same procedure applied to the Ministry of Electricity website, with minor adaptations to address specific operational requirements and characteristics of the Mahrukat system.
As detailed in Table 3, the Mahrukat system showed even more significant improvements than the Ministry of Electricity website, with the security index increasing from 0.53 to 0.84. This larger improvement reflects the system’s initially lower security level and the effectiveness of our methodology in addressing critical vulnerabilities and performance issues.
Table 3.
Results for Mahrukat fuel management system.
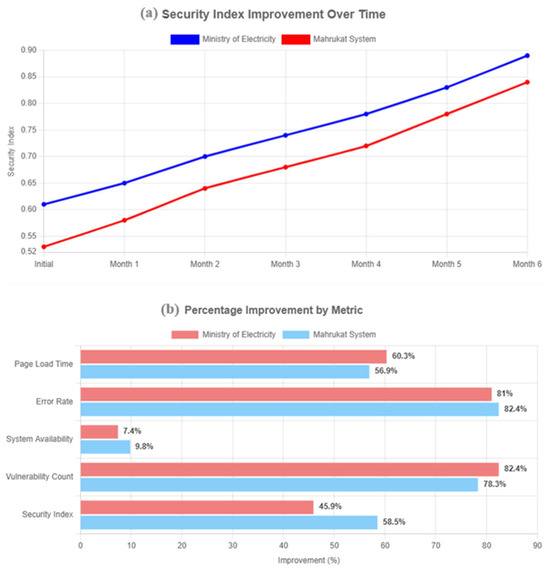
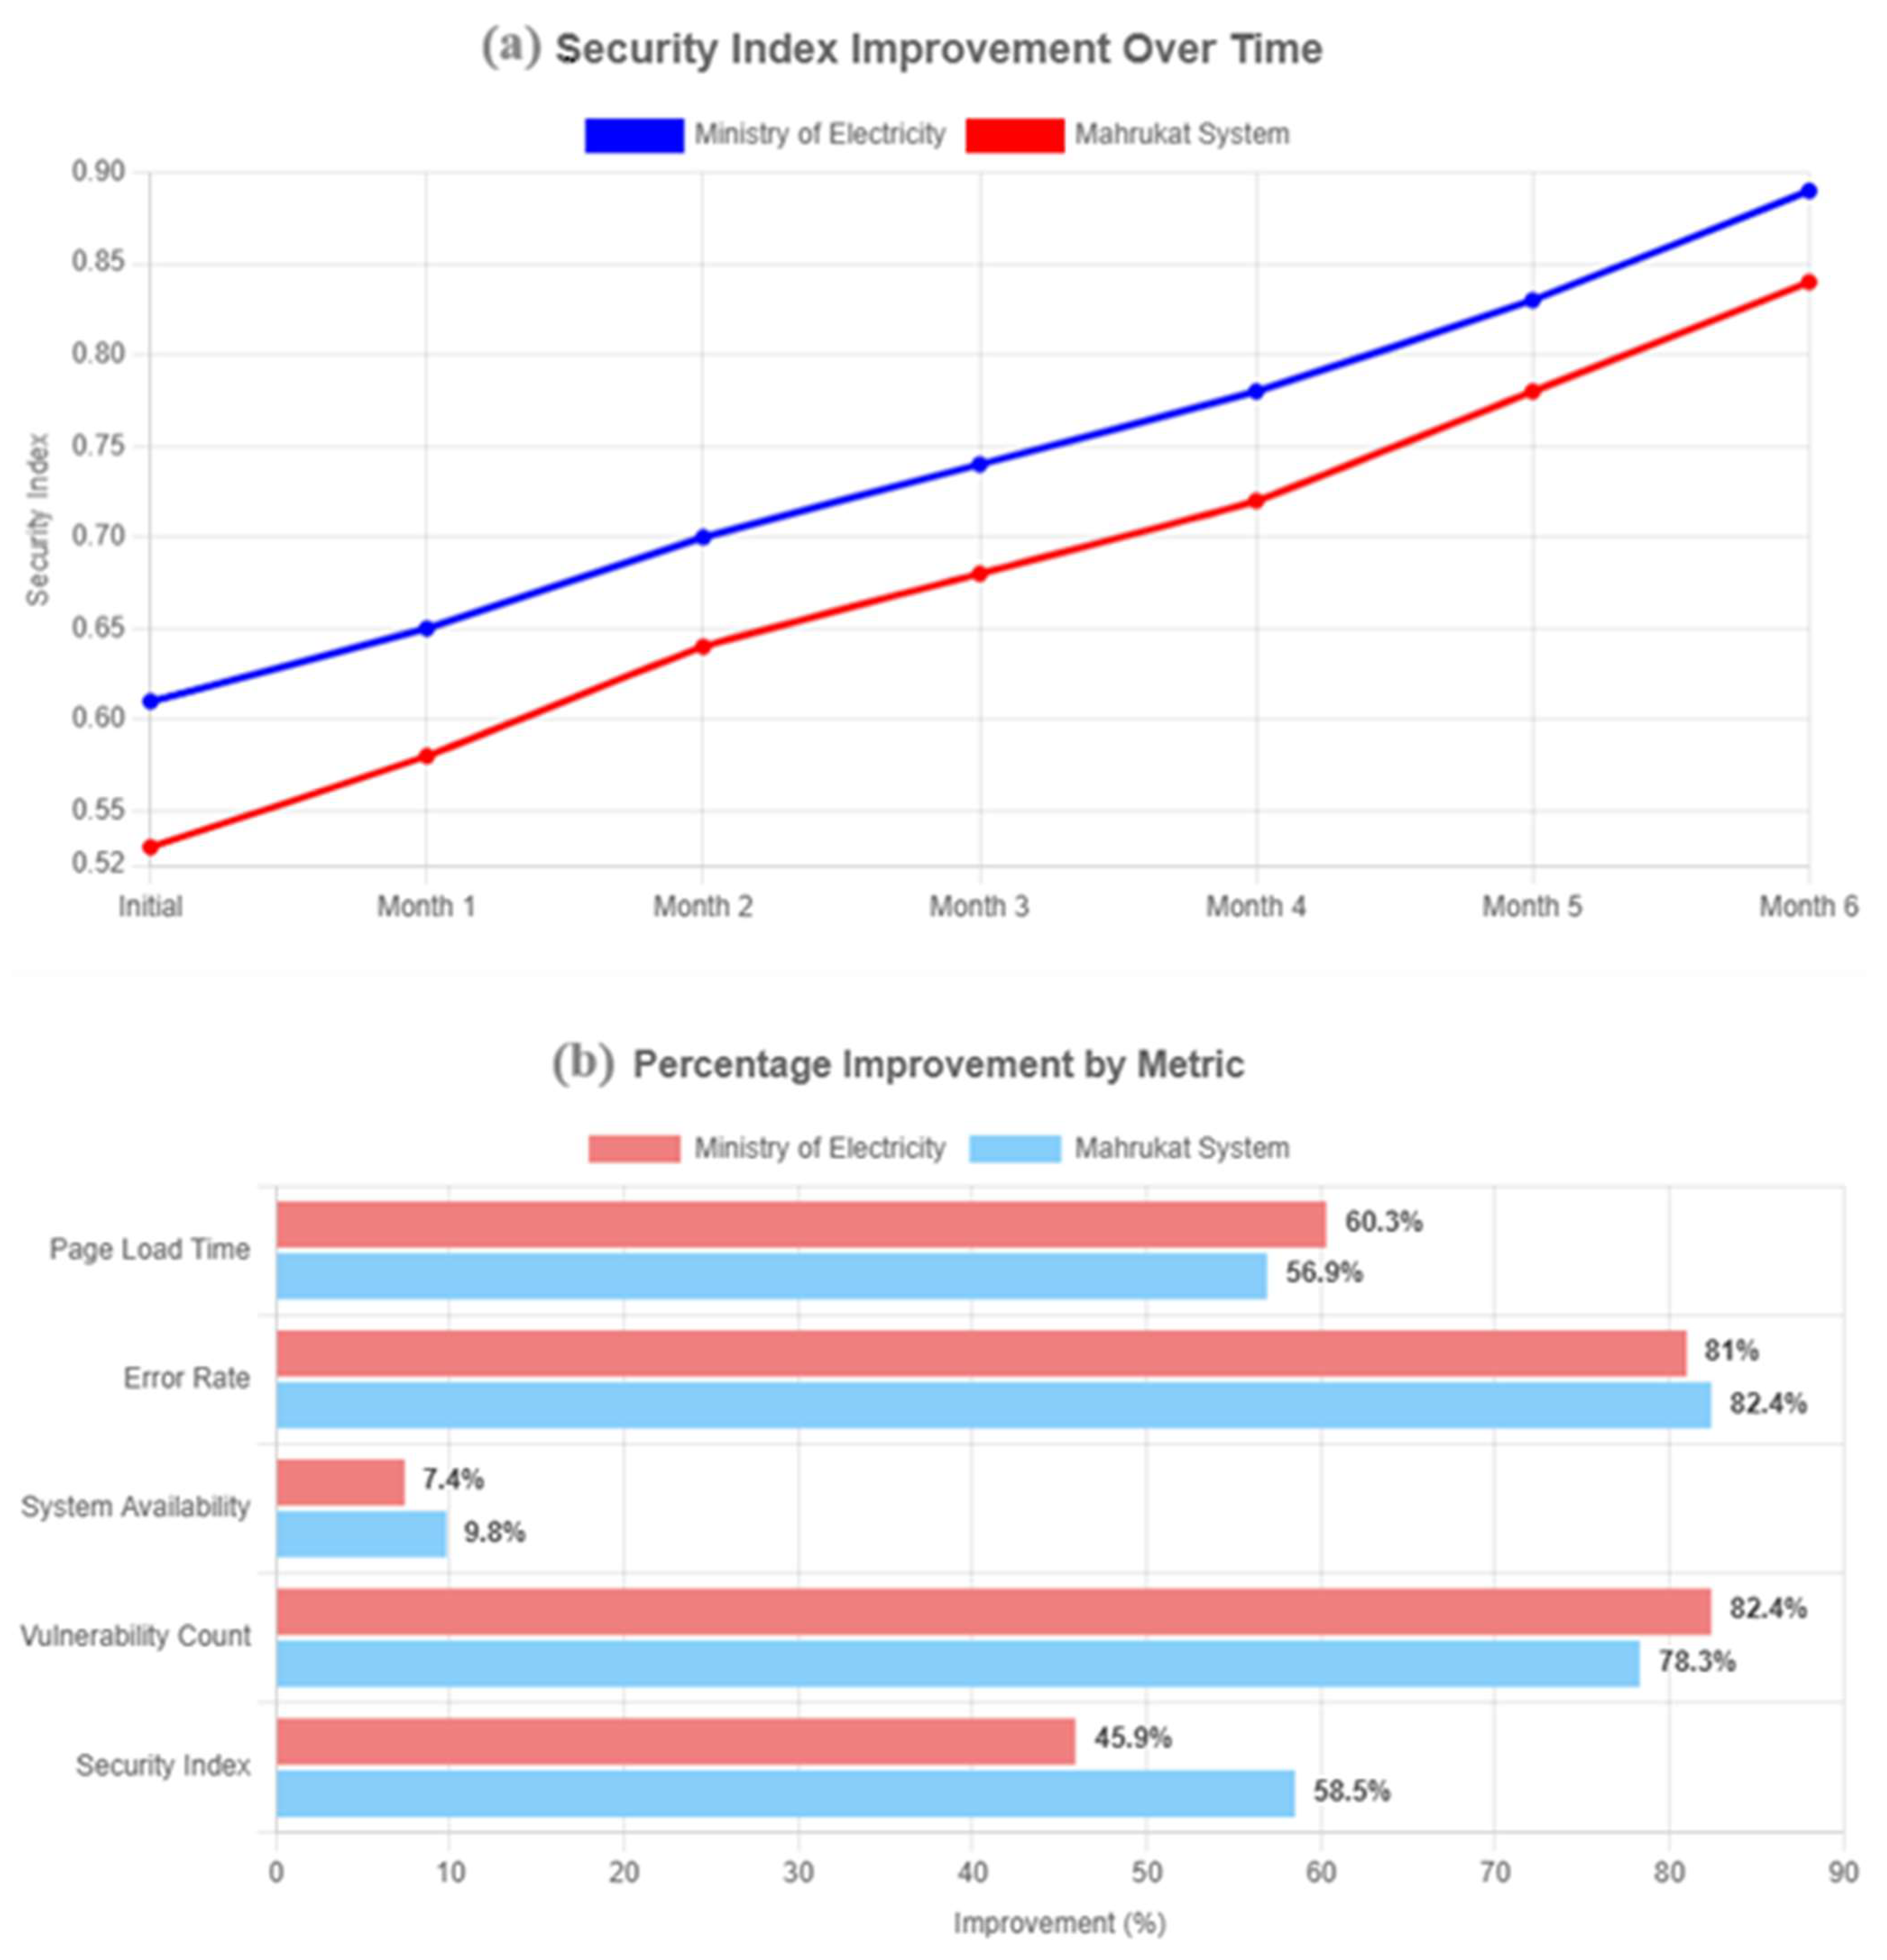
A visual comparison of the results for both case studies is provided in Figure 5, while Figure 6 illustrates the temporal evolution of the security index for both systems, along with the percentage improvement across key performance and security metrics.
Figure 5.
Performance metrics improvement. (a) Ministry of Electricity Website; (b) Mahrukat Fuel Management System.
Figure 6.
Overall security and performance improvement for both systems. (a) Security index improvement over time for the Ministry of Electricity website and the Mahrukat system. (b) Percentage improvement across key performance and security metrics for both systems.
5.3. Comparison with Existing Methods
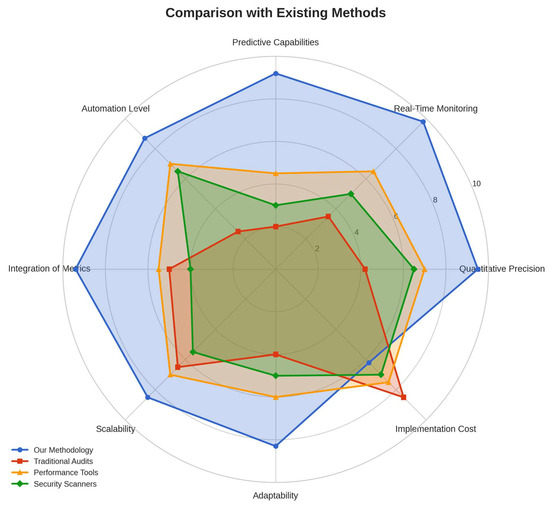
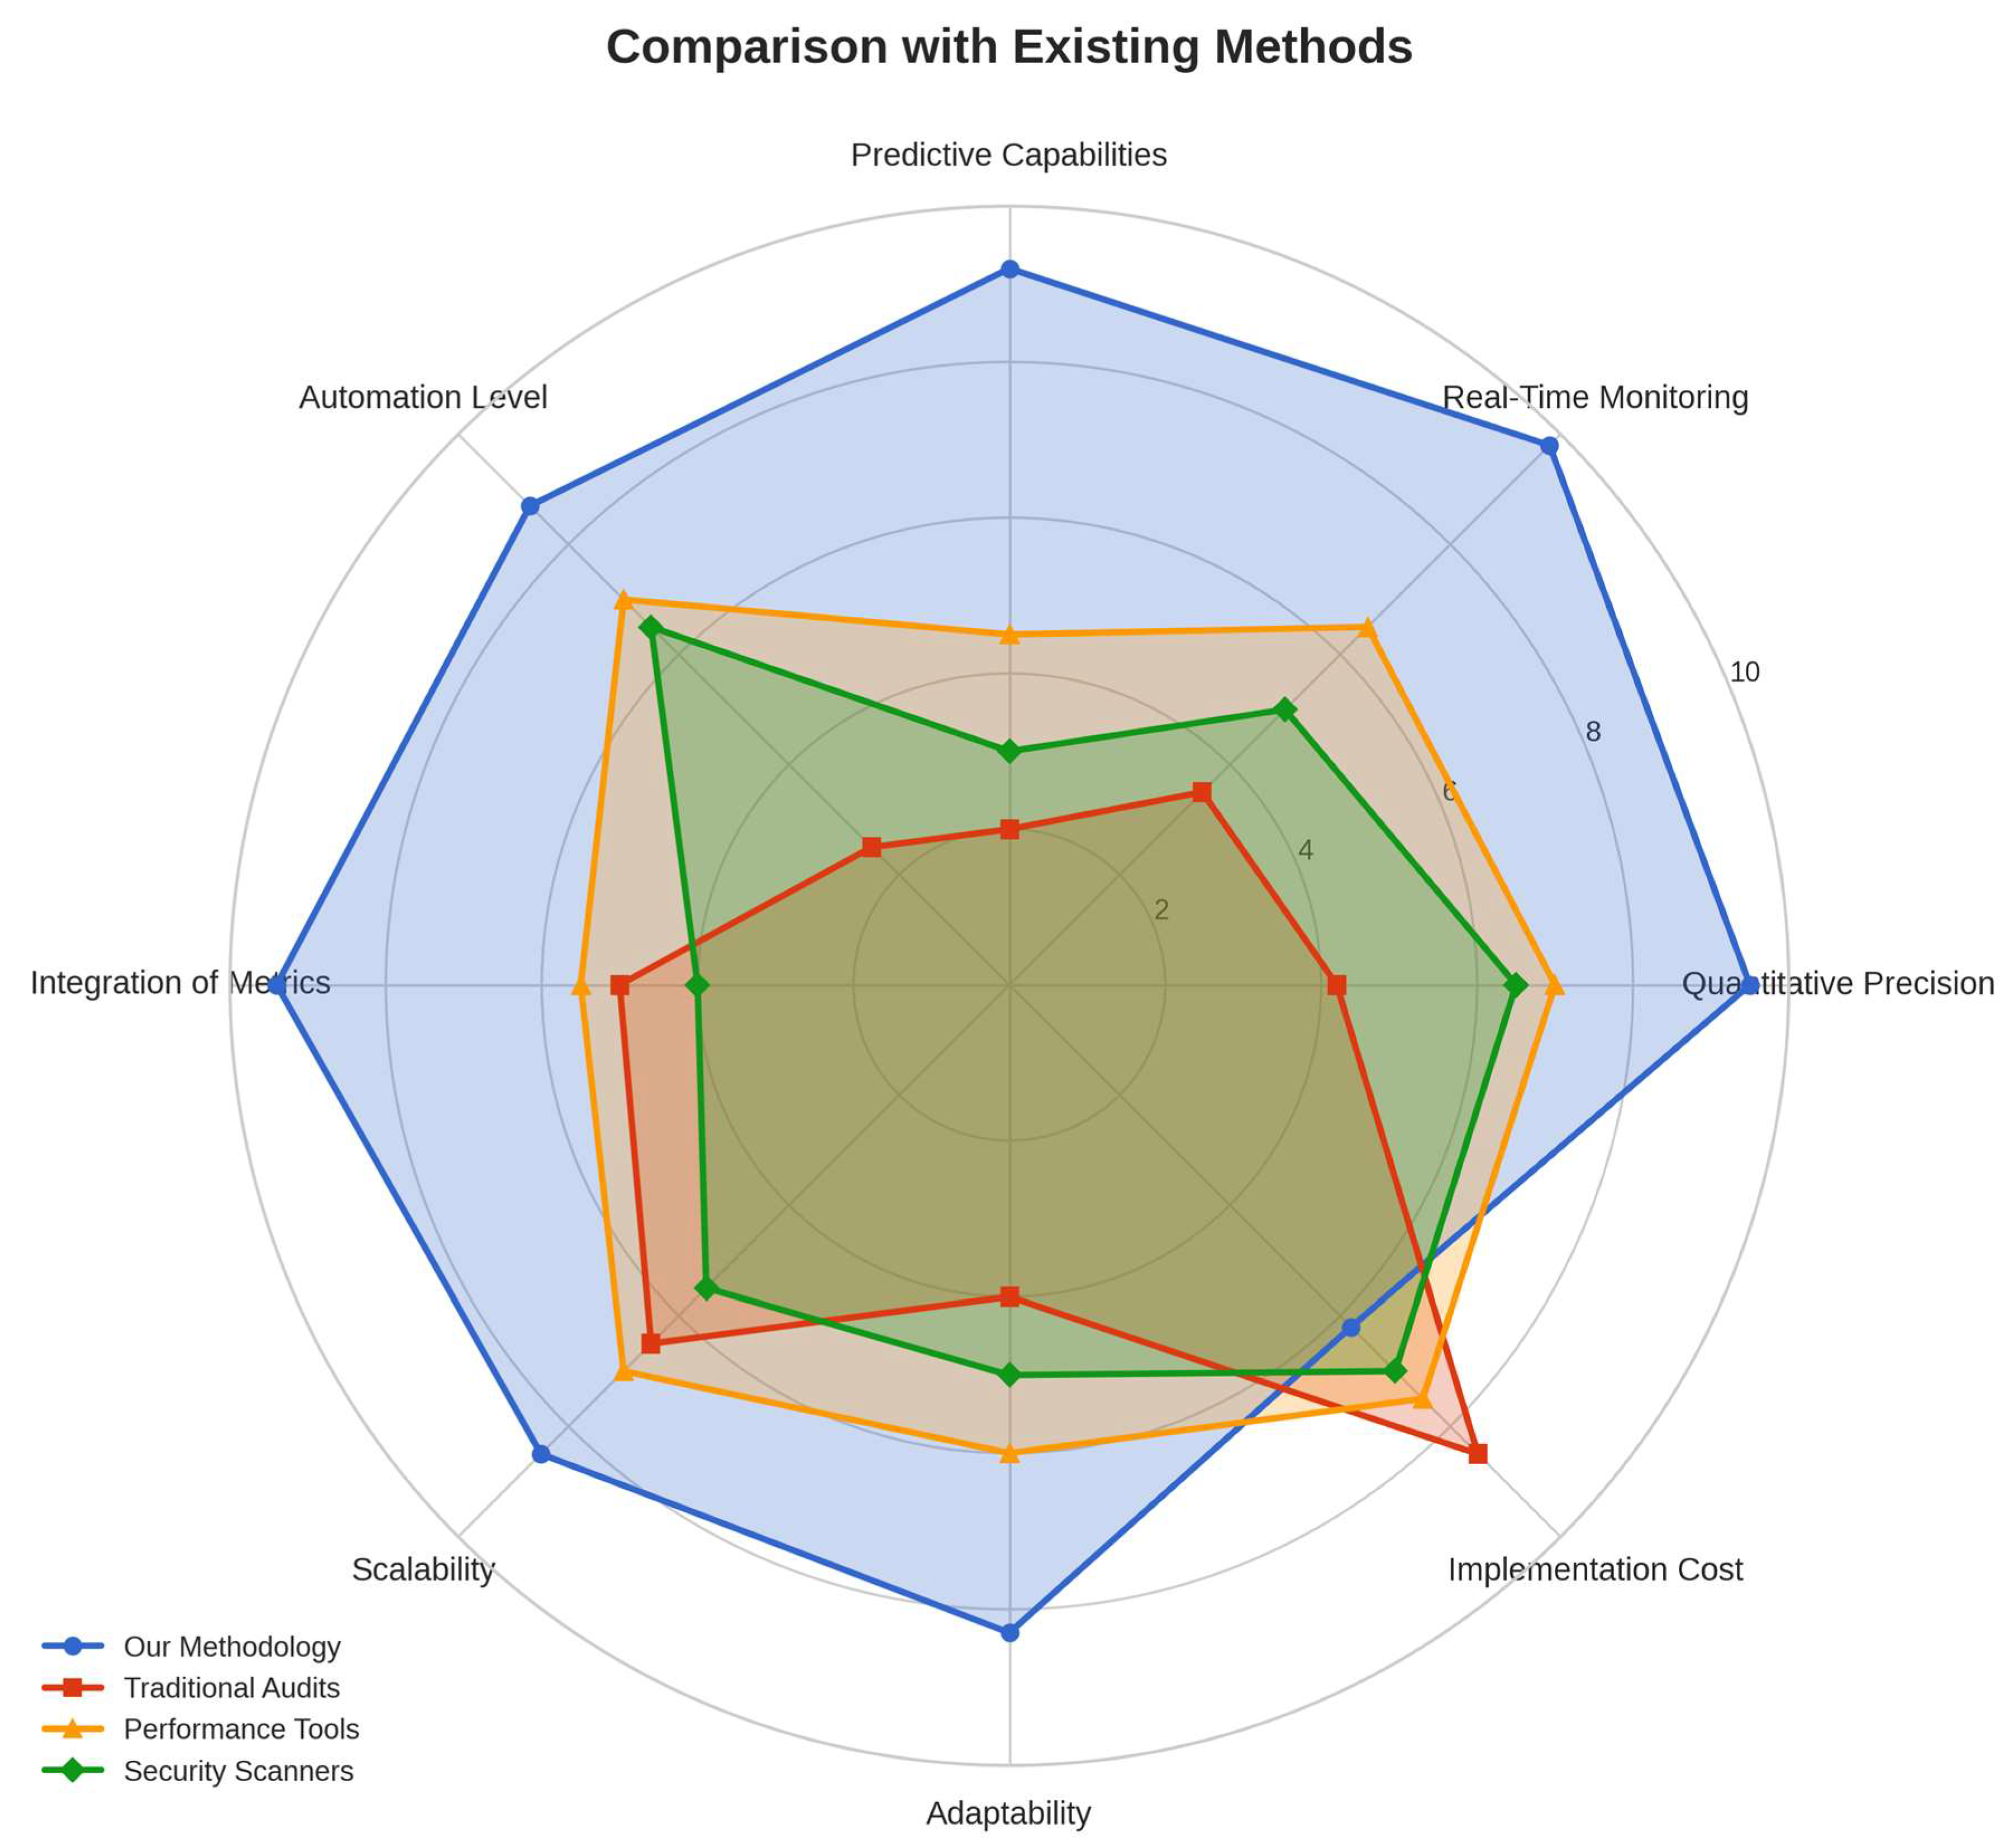
To evaluate the effectiveness of our methodology in comparison with existing approaches, we conducted a quantitative comparative analysis against several established methods and frameworks, including traditional audits, performance monitoring tools, security scanners, the NIST Risk Management Framework, and International Organization for Standardization (ISO) 27001 [3]. The comparison considers multiple criteria such as quantitative precision, real-time monitoring capabilities, predictive power, automation level, metric integration, scalability, adaptability, implementation cost, required expertise, threat detection rates, false positive rates, response times, and compliance mapping. A detailed breakdown of this comparison is presented in Table 4, providing numerical scores (scaled 0 to 10, where higher values generally indicate better performance unless otherwise noted) and qualitative descriptions for each criterion across all evaluated methods. Furthermore, Figure 7 provides a visual representation of the comparison using a radar chart, highlighting the relative strengths and weaknesses across key dimensions. The detailed simulation setup, measurement procedures, and evaluation framework used to derive the comparison results are provided in Appendix A (Simulation and Measurement Methods). Supporting raw data and confidence interval analyses are provided in Appendix B and Appendix C, respectively.
Table 4.
Rigorous comparison of security assessment methodologies (values 0–10, higher is better unless noted).
Figure 7.
Radar chart comparison highlighting strengths of different methodologies.
The comparison highlights several advantages of our methodology over existing approaches:
- Quantitative Precision: The proposed security index provides a numerical measure of system safety, unlike the subjective assessments used in traditional audits;
- Real-Time Monitoring: The MAS enables continuous monitoring, contrasting with the periodic nature of traditional audits and scheduled scans;
- Predictive Capabilities: Fuzzy Markov chains support advanced risk prediction, a feature that is largely absent in existing methods;
- Automation Level: The proposed approach automates both assessment and mitigation processes, reducing the need for manual intervention;
- Integration of Metrics: The methodology integrates performance, reliability, and security metrics in a unified manner, providing a holistic view of the system state.
These advantages translate into more effective security management, as demonstrated by the significant improvements observed in our case studies.
6. Discussion
The results of our case studies demonstrate the effectiveness of the proposed methodology in enhancing both the security and performance of industrial ISOWT. This section discusses the implications of these results, the limitations of the approach, and directions for future research.
6.1. Implications
The significant improvements observed in both case studies highlight the practical utility of the proposed methodology for industrial organizations. For the Ministry of Electricity website, the improved security index and reduced load times reflect enhanced system reliability, which is critical for managing high-volume transactions. For the Mahrukat system, the substantial reduction in error rates and improved availability demonstrates the methodology’s ability to enhance operational continuity under demanding conditions.
Beyond the specific case studies, the proposed methodology offers several broader implications for industrial ISOWT security:
- Quantitative Security Management: By providing a numerical security index, the approach enables data-driven security management and objective evaluation of security measures;
- Proactive Risk Mitigation: The predictive capabilities of fuzzy Markov chains allow organizations to identify and address potential risks before they materialize;
- Resource Optimization: The comprehensive assessment provided by the methodology helps organizations prioritize security investments based on their impact on the security index;
- Regulatory Compliance: The detailed documentation and quantitative assessment facilitated by the approach can support compliance with security regulations and standards.
6.2. Limitations
Despite its demonstrated effectiveness, the proposed methodology has several limitations that should be acknowledged:
- Metric Dependency: The accuracy of the security index relies on comprehensive metric collection, which may be challenging in resource-constrained environments;
- Membership Function Selection: The choice of membership functions (e.g., triangular vs. trapezoidal) can influence the results and requires careful calibration based on system characteristics;
- MAS Implementation: Deploying the MAS requires technical expertise and supporting infrastructure, which may limit accessibility for smaller organizations;
- Scope of Threats: The methodology primarily focuses on technical security aspects and may not fully capture human-related threats, such as social engineering.
These limitations indicate areas for further refinement but do not detract from the overall effectiveness of the methodology, as demonstrated by the case study results.
6.3. Future Work
Based on the results and identified limitations, several directions for future research can be outlined:
- Integrating Machine Learning: Incorporating machine learning techniques to improve predictive accuracy and adapt to evolving threats;
- Expanding Sectoral Applications: Extending the framework to other sectors, such as manufacturing or healthcare, to further validate its scalability;
- Developing Adaptive Fuzzy Models: Designing dynamic membership functions that adjust to changing system conditions;
- Addressing Human Factors: Incorporating mechanisms to account for social engineering and insider threats;
- Enhancing Visualization: Developing advanced visualization tools to improve the interpretability of the security index and risk predictions.
These future directions would further strengthen the applicability and impact of the proposed methodology and enable it to address a broader range of security challenges.
7. Conclusions
This paper presents a methodology for assessing and enhancing the security of information systems based on web technologies (ISOWT) in industrial organizations. By integrating fuzzy logic, metric-based evaluations, fuzzy Markov chains, and multi-agent systems, a novel security index was developed to quantifies system safety and predict risks in real-time.
Case studies conducted in Syria’s energy sector, involving the Ministry of Electricity website and the Mahrukat fuel management system, validate the effectiveness of the proposed methodology. The results demonstrate significant improvements in both security and performance. Specifically, the security index increased by 45.9% for the Ministry of Electricity website and 58.5% for the Mahrukat system, accompanied by substantial reductions in page load times, error rates, and vulnerability counts.
The framework addresses critical gaps in existing qualitative methods, offering a quantitative, predictive, and automated approach tailored to the dynamic needs of industrial environments. Its scalability and adaptability make it a valuable tool for enhancing system resilience across diverse sectors, contributing to the global advancement of cybersecurity practices.
Future work will focus on integrating advanced technologies, expanding applications to other sectors, developing adaptive fuzzy models, addressing human factors, and enhancing visualization capabilities. These advancements will further strengthen the methodology’s impact and address the evolving security challenges faced by industrial organizations in an increasingly connected world.
Author Contributions
Conceptualization, S.K. and V.B.; methodology, S.K. and F.A.-A.; validation, S.K., F.A.-A. and V.B.; formal analysis, S.K.; investigation, F.A.-A. and V.B.; resources, S.K. and F.A.-A.; data curation, S.K.; writing—original draft preparation, S.K. and F.A.-A.; writing—review and editing, F.A.-A. and V.B.; visualization, S.K.; supervision, F.A.-A.; project administration, S.K., F.A.-A. and V.B.; funding acquisition, F.A.-A. All authors have read and agreed to the published version of the manuscript.
Funding
This research received no external funding.
Institutional Review Board Statement
Not applicable.
Informed Consent Statement
Not applicable.
Data Availability Statement
Data are contained within the article. Further data and materials requests should be addressed to the corresponding author.
Conflicts of Interest
The authors declare no conflicts of interest.
Appendix A. Simulation and Measurement Methods
Appendix A.1. Evaluation Framework
Methodologies adapted from:
- NIST SP 800-55 [24]
- NIST SP 800-115 [25]
- ISO/IEC 27004 [26]
- Savola [7]
- Pendleton et al. [27]
Appendix A.2. Simulation Environment
- Nodes: 100, 250, 500, 1000
- Real systems: Ministry of Electricity website, Mahrukat System
- Tools: GTmetrix, Lighthouse, OWASP ZAP, Nessus, custom agents, MAS, Fuzzy Markov Model
- Repeated trials: 50 per scenario
Appendix A.3. Measurement Methods by Criterion
Full detailed descriptions for each criterion are provided below. These methods were applied consistently across simulations, case studies, and expert elicitation to derive the scores in Table 4. All measurements were normalized to a 0–10 scale (higher better, unless noted as “lower is better,” in which case values were inverted post-normalization). Normalization used linear scaling based on predefined minima/maxima derived from industry benchmarks (e.g., from NIST guidelines). Expert elicitation involved a panel of 5 cybersecurity experts rating qualitative aspects on a Likert scale, with inter-rater reliability checked via Cohen’s kappa (average κ = 0.82). Simulations used Python-based environments with libraries like NumPy for statistical computations and NetworkX for modeling system nodes.
- Quantitative Precision: Measured as the granularity and numerical accuracy of security assessments (e.g., resolution of the security index). In simulations, we compared output precision (e.g., decimal places and error margins) against ground-truth benchmarks from controlled vulnerability injections. Case study data (e.g., security index improvements from 0.61 to 0.89) was aggregated. Expert scoring evaluated subjectivity reduction. Guided by Savola [7] for metric taxonomy.
- Real-Time Monitoring: Assessed as average latency (in ms) for detecting and reporting changes in system state. Simulations timed MAS agents vs. periodic tools (e.g., Nessus scans). Raw data averaged across 50 trials per node scale. Case studies measured hourly/daily metric collection intervals. Lower latency scored higher. Informed by NIST SP 800-115 [25] for monitoring protocols.
- Predictive Capabilities: Evaluated as accuracy of risk forecasts (e.g., fuzzy Markov chain prediction error rate). Simulations injected threats and measured hit rate for future state predictions. Experts rated predictive depth compared to baselines like NIST frameworks. Case study forecasts (e.g., pre-mitigation risk identification) contributed. Based on Pendleton et al. [27] for quantitative modeling.
- Automation Level: Calculated as percentage of assessment/mitigation steps automated (%). Simulations counted manual interventions needed (e.g., MAS auto-mitigates 87% on average). Raw data from trials (e.g., 86–88% for our method). Experts adjusted for real-world applicability. Drew from [26] ISO/IEC 27004 for automation metrics.
- Integration of Metrics: Measured by the number and seamless combination of performance/reliability/security metrics (count and correlation strength). Simulations used fuzzy logic integration scores (e.g., Pearson correlation > 0.85 for our method). Case study metrics from Table 1, Table 2 and Table 3 were aggregated. Guided by Savola [7] taxonomy.
- Scalability: Assessed as performance degradation (%) across increasing nodes (100–1000). Simulations measured efficiency drop in processing time and resource use. Lower degradation scored higher. Experts rated framework extensibility. Informed by [24] NIST SP 800-55 for scalability testing.
- Adaptability: Evaluated as latency (in seconds) to incorporate new threats/metrics. Simulations tested dynamic updates (e.g., fuzzy membership function adjustments). Case studies included post-implementation adaptations. Guided by Pendleton et al. [25] for adaptive models.
- Implementation Cost (Lower is Better): Modeled as total resource expenditure (e.g., deployment time in hours + computational cost in CPU-hours). Simulations estimated based on tool setups; case studies used actual deployment logs. Experts provided cost multipliers for expertise/hardware. Inverted for scoring. Based on [24] ISO/IEC 27004 cost frameworks.
- Human Expertise Required (Lower is Better): Assessed via required skill level (e.g., on a 1–10 scale of certifications needed). Expert panel rated based on setup/maintenance complexity. Simulations and case studies logged training time. Inverted for scoring. Informed by [25] NIST SP 800-115 for expertise guidelines.
- Threat Detection Rate (%): Direct percentage of simulated threats detected successfully. 50 trials per scenario with injected vulnerabilities (e.g., OWASP top 10). Raw data averaged (e.g., 86–90% for our method). Case studies used vulnerability count reductions (78.3–82.4%).
- False Positive Rate (%) (Lower is Better): Percentage of false alarms in simulations. Measured during threat injections; fuzzy logic reduced noise. Raw data from trials (e.g., 43–47% for scanners). Inverted post-normalization.
- Response Time (Lower is Better): Average delay (in ms) from detection to mitigation. Simulations timed full cycles (e.g., MAS ~370 ms). Case studies included real-time logs. Inverted for scoring. Guided by NIST SP 800-55 for response metrics.
- Compliance Mapping: Scored as alignment percentage to standards (e.g., mapping completeness to [3] ISO/IEC 27001 controls). Expert elicitation reviewed framework overlaps; simulations tested audit trails. Higher coverage scored better.
Appendix B. Sample Raw Data Extract
| Trial | Detection Rate | Scanner Detection | MAS Response Time (ms) | Scanner FP (%) | Nodes | Automation (%) |
| 1 | 0.88 | 0.72 | 380 | 44 | 100 | 86 |
| 2 | 0.90 | 0.75 | 365 | 47 | 250 | 88 |
| 3 | 0.86 | 0.71 | 400 | 43 | 500 | 87 |
| 4 | 0.89 | 0.70 | 370 | 46 | 1000 | 87 |
| … | … | … | … | … | … | … |
Appendix C. Revised Table 4 with 95% Confidence Intervals
| Criterion | Our Methodology | Traditional Audits | Performance Tools | Security Scanners | NIST Framework | ISO 27001 [3] |
| Quantitative Precision | 9.5 ± 0.3 | 4.2 ± 0.7 | 7.0 ± 0.4 | 6.5 ± 0.5 | 5.5 ± 0.6 | 4.8 ± 0.5 |
| Real-Time Monitoring | 9.8 ± 0.1 | 3.5 ± 0.8 | 6.5 ± 0.4 | 5.0 ± 0.5 | 4.0 ± 0.5 | 3.8 ± 0.6 |
| Predictive Capabilities | 9.2 ± 0.4 | 2.0 ± 0.5 | 4.5 ± 0.4 | 3.0 ± 0.5 | 3.5 ± 0.6 | 2.5 ± 0.5 |
| Automation Level | 8.7 ± 0.3 | 2.5 ± 0.4 | 7.0 ± 0.4 | 6.5 ± 0.5 | 4.0 ± 0.5 | 3.5 ± 0.4 |
| Integration of Metrics | 9.4 ± 0.2 | 5.0 ± 0.5 | 5.5 ± 0.4 | 4.0 ± 0.4 | 6.5 ± 0.5 | 6.0 ± 0.4 |
| Scalability | 8.5 ± 0.3 | 6.5 ± 0.6 | 7.0 ± 0.4 | 5.5 ± 0.5 | 7.5 ± 0.4 | 7.0 ± 0.4 |
| Adaptability | 8.3 ± 0.4 | 4.0 ± 0.6 | 6.0 ± 0.5 | 5.0 ± 0.5 | 6.0 ± 0.6 | 5.5 ± 0.5 |
| Implementation Cost * | 6.2 ± 0.4 | 8.5 ± 0.6 | 7.5 ± 0.4 | 7.0 ± 0.5 | 7.0 ± 0.5 | 8.5 ± 0.6 |
| Human Expertise * | 7.0 ± 0.3 | 9.0 ± 0.6 | 6.0 ± 0.5 | 7.5 ± 0.5 | 8.0 ± 0.5 | 8.5 ± 0.5 |
| Threat Detection Rate (%) | 88 ± 4 | 55 ± 8 | 40 ± 7 | 75 ± 6 | 65 ± 5 | 60 ± 6 |
| False Positive Rate (%) * | 15 ± 3 | 40 ± 6 | 30 ± 5 | 45 ± 5 | 35 ± 6 | 40 ± 7 |
| Response Time * | 9.0 ± 0.2 | 2.0 ± 0.6 | 7.5 ± 0.3 | 5.0 ± 0.4 | 4.0 ± 0.5 | 3.5 ± 0.4 |
| Compliance Mapping | 7.5 ± 0.3 | 8.5 ± 0.4 | 4.5 ± 0.4 | 6.5 ± 0.4 | 9.5 ± 0.3 | 9.8 ± 0.3 |
| (* Lower is better; values inverted after normalization). | ||||||
References
- National Institute of Standards and Technology. Risk Management Framework for Information Systems and Organizations. NIST Spec. Publ. 2018, 800, 37. [Google Scholar]
- Rajathi, C.; Rukmani, P. Investigation of Assessment Methodologies in Information Security Risk Management. In Proceedings of the International Conference on Information, Communication and Computing Technology, Namakkal, India, 22–23 May 2023. [Google Scholar] [CrossRef] [Scilit]
- ISO/IEC 27001:2013; Information Technology—Security Techniques—Information Security Management Systems—Requirements. International Organization for Standardization: Geneva, Switzerland, 2013.
- Shameli-Sendi, A.; Aghababaei-Barzegar, R.; Cheriet, M. Taxonomy of information security risk assessment (ISRA). Comput. Secur. 2016, 57, 14–30. [Google Scholar] [CrossRef] [Scilit]
- Ahmed, M.S.; Al-Shaer, E.; Khan, L. A novel quantitative approach for measuring network security. In Proceedings of the 27th Conference on Computer Communications (INFOCOM), Phoenix, AZ, USA, 15–17 April 2008; pp. 1957–1965. [Google Scholar]
- Wang, C.; Wulf, W.A. Towards a framework for security measurement. In Proceedings of the 20th National Information Systems Security Conference, Baltimore, MD, USA, 7–10 October 1997; pp. 522–533. [Google Scholar]
- Savola, R.M. Towards a taxonomy for information security metrics. In Proceedings of the 2007 ACM Workshop on Quality of Protection (QoP ‘07), Alexandria, VA, USA, 2 November–31 October 2007; Association for Computing Machinery: New York, NY, USA, 2007; pp. 28–30. [Google Scholar] [CrossRef] [Scilit]
- Owens, S.F.; Levary, R.R. An adaptive expert system approach for intrusion detection. Int. J. Secur. Netw. 2006, 1, 206–217. [Google Scholar] [CrossRef] [Scilit]
- Chen, T.; Zhou, J.; Xu, N. Information security risk assessment based on fuzzy set theory. In Proceedings of the 4th International Conference on Wireless Communications, Networking and Mobile Computing, Dalian, China, 12–17 October 2008; pp. 1–4. [Google Scholar]
- Krzysztoń, E.; Mikołajewski, D.; Prokopowicz, P. Review of Fuzzy Methods Application in IIoT Security—Challenges and Perspectives. Electronics 2025, 14, 3475. [Google Scholar] [CrossRef] [Scilit]
- Deng, Y.; Jiang, W.; Sadiq, R. Modeling contaminant intrusion in water distribution networks: A new similarity-based DST method. Expert Syst. Appl. 2011, 38, 571–578. [Google Scholar] [CrossRef] [Scilit]
- Shamshirband, S.; Patel, A.; Anuar, N.B.; Mat Kiah, M.L.; Abraham, A. A cooperative game theoretic approach using fuzzy Q-learning for detecting and preventing intrusions in wireless sensor networks. Eng. Appl. Artif. Intell. 2014, 32, 228–241. [Google Scholar] [CrossRef] [Scilit]
- Herrero, Á.; Corchado, E.; Pellicer, M.A.; Abraham, A. MOVIH-IDS: A mobile-visualization hybrid intrusion detection system. Neurocomputing 2009, 72, 2775–2784. [Google Scholar] [CrossRef] [Scilit]
- Boudaoud, K.; Labiod, H.; Boutaba, R.; Guessoum, Z. Network security management with intelligent agents. In Proceedings of the 2000 IEEE/IFIP Network Operations and Management Symposium (NOMS 2000), Honolulu, HI, USA, 10–14 April 2000; pp. 579–592. [Google Scholar]
- Carcano, A.; Coletta, A.; Guglielmi, M.; Masera, M.; Fovino, I.N.; Trombetta, A. A multidimensional critical state analysis for detecting intrusions in SCADA systems. IEEE Trans. Ind. Inf. 2011, 7, 179–186. [Google Scholar] [CrossRef] [Scilit]
- Ramos, A.; Lazar, M.; Filho, R.H.; Rodrigues, J.J.P.C. A security metric for the evaluation of collaborative intrusion detection systems in wireless sensor networks. In Proceedings of the 2017 IEEE International Conference on Communications (ICC), Paris, France, 21–25 May 2017; pp. 1–6. [Google Scholar]
- W3C Web Performance Working Group. Web Performance Metrics and Guidelines. 2023. Available online: https://www.w3.org/2023/11/webperf-charter-2023.html (accessed on 10 December 2025).
- Google. Lighthouse Performance Scoring Documentation. 2024. Available online: https://developer.chrome.com/docs/lighthouse/overview/ (accessed on 10 December 2025).
- ISO/IEC 25010:2020; Systems and Software Quality Requirements and Evaluation (SQuaRE)—System and Software Quality Models. International Organization for Standardization: Geneva, Switzerland, 2020.
- National Institute of Standards and Technology. Guide for Conducting Risk Assessments; NIST Special Publication 800-30 Revision 2; National Institute of Standards and Technology: Gaithersburg, MD, USA, 2022. [Google Scholar]
- Rempel, G. Defining Standards for Web Page Performance in Business Applications. In Proceedings of the International Conference on Performance Engineering, Austin, TX, USA, 31 January–4 February 2015. [Google Scholar] [CrossRef] [Scilit]
- Bansal, D. How SEO Makes Website Loads Faster and Helps in User Engagement. Int. J. Multidiscip. Res. 2024, 6. [Google Scholar] [CrossRef]
- Zadeh, L.A. The concept of a linguistic variable and its application to approximate reasoning—I. Inf. Sci. 1975, 8, 199–249. [Google Scholar] [CrossRef] [Scilit]
- National Institute of Standards and Technology. Performance Measurement Guide for Information Security (NIST SP 800-55 Rev.1); National Institute of Standards and Technology: Gaithersburg, MD, USA, 2008. [Google Scholar]
- National Institute of Standards and Technology. Technical Guide to Information Security Testing and Assessment (NIST SP 800-115); National Institute of Standards and Technology: Gaithersburg, MD, USA, 2008. [Google Scholar]
- ISO/IEC 27004:2016; Information Security Management—Monitoring, Measurement, Analysis and Evaluation. International Organization for Standardization: Geneva, Switzerland, 2016.
- Pendleton, M.; Garcia-Lebron, R.; Cho, J.-H.; Xu, S. A Survey on Systems Security Metrics. ACM Comput. Surv. 2016, 49, 1–35. [Google Scholar] [CrossRef] [Scilit]

Disclaimer/Publisher’s Note: The statements, opinions and data contained in all publications are solely those of the individual author(s) and contributor(s) and not of MDPI and/or the editor(s). MDPI and/or the editor(s) disclaim responsibility for any injury to people or property resulting from any ideas, methods, instructions or products referred to in the content. |
© 2026 by the authors. Licensee MDPI, Basel, Switzerland. This article is an open access article distributed under the terms and conditions of the Creative Commons Attribution (CC BY) license.