A Novel Security Index for Assessing Information Systems in Industrial Organizations Using Web Technologies and Fuzzy Logic †



Abstract
1. Introduction
- (1)
- A novel security index that quantitatively assesses system safety by leveraging fuzzy logic and topological concepts, providing a numerical representation of deviation from ideal operational conditions;
- (2)
- An integrated security assessment and management methodology that combines metric-based evaluations, fuzzy Markov chains, and multi-agent systems to enable comprehensive and systematic analysis;
- (3)
- A predictive security framework based on fuzzy Markov chains that anticipates potential risk evolution and supports proactive mitigation strategies;
- (4)
- A scalable and adaptable approach validated through real-world case studies in Syria’s energy sector, demonstrating significant improvements in both system performance and security.
2. Literature Review
2.1. Security Assessment Methodologies
2.2. Fuzzy Logic in Cybersecurity
2.3. Multi-Agent Systems for Security Management
3. Theoretical Foundations
3.1. Fuzzy Logic Concepts
3.2. Fuzzy Markov Chains
3.3. Integration for Security Assessment
- Metric Collection: Collecting data related to system performance, reliability, and security indicators;
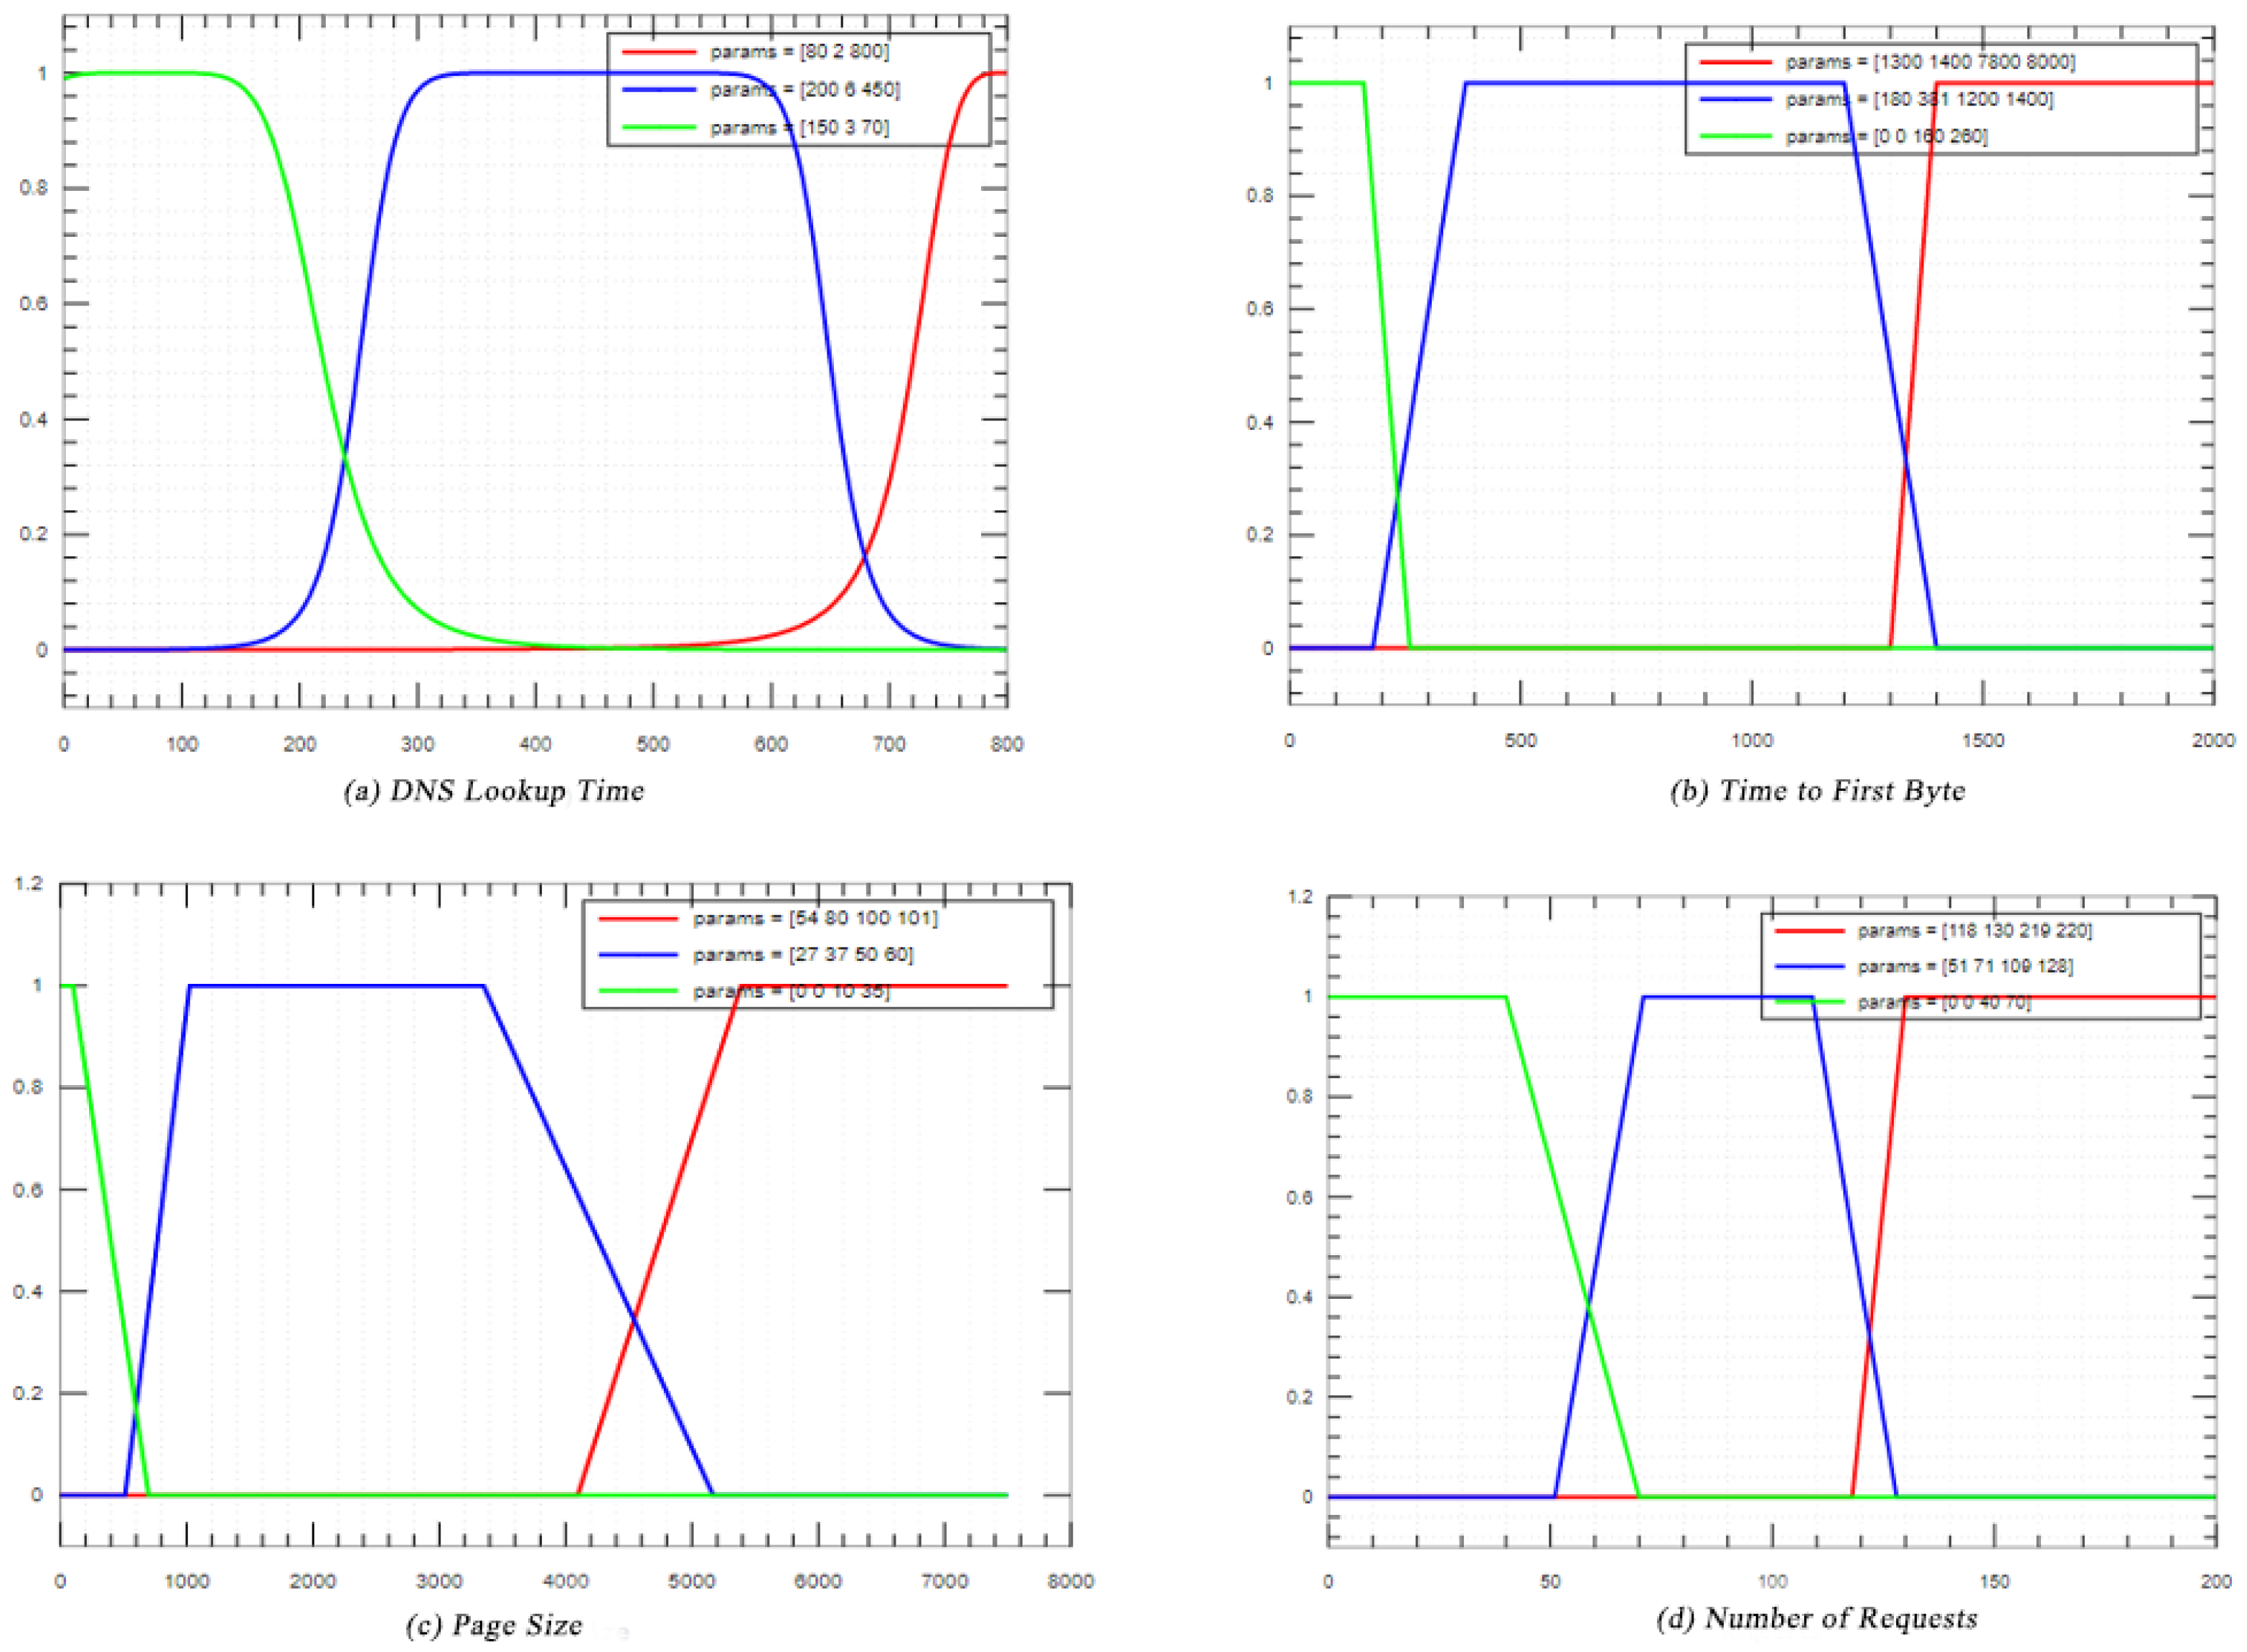
- Fuzzy Evaluation: Applying membership functions to transform metric values into fuzzy sets;
- State Determination: Combining fuzzy evaluations to determine the current system state;
- Transition Analysis: Using fuzzy Markov chains to compute transition possibilities to other states;
- Risk Prediction: Identifying high-risk transitions and potential security threats;
- Mitigation Planning: Developing appropriate strategies to reduce identified risks and enhance system security.
4. Proposed Methodology
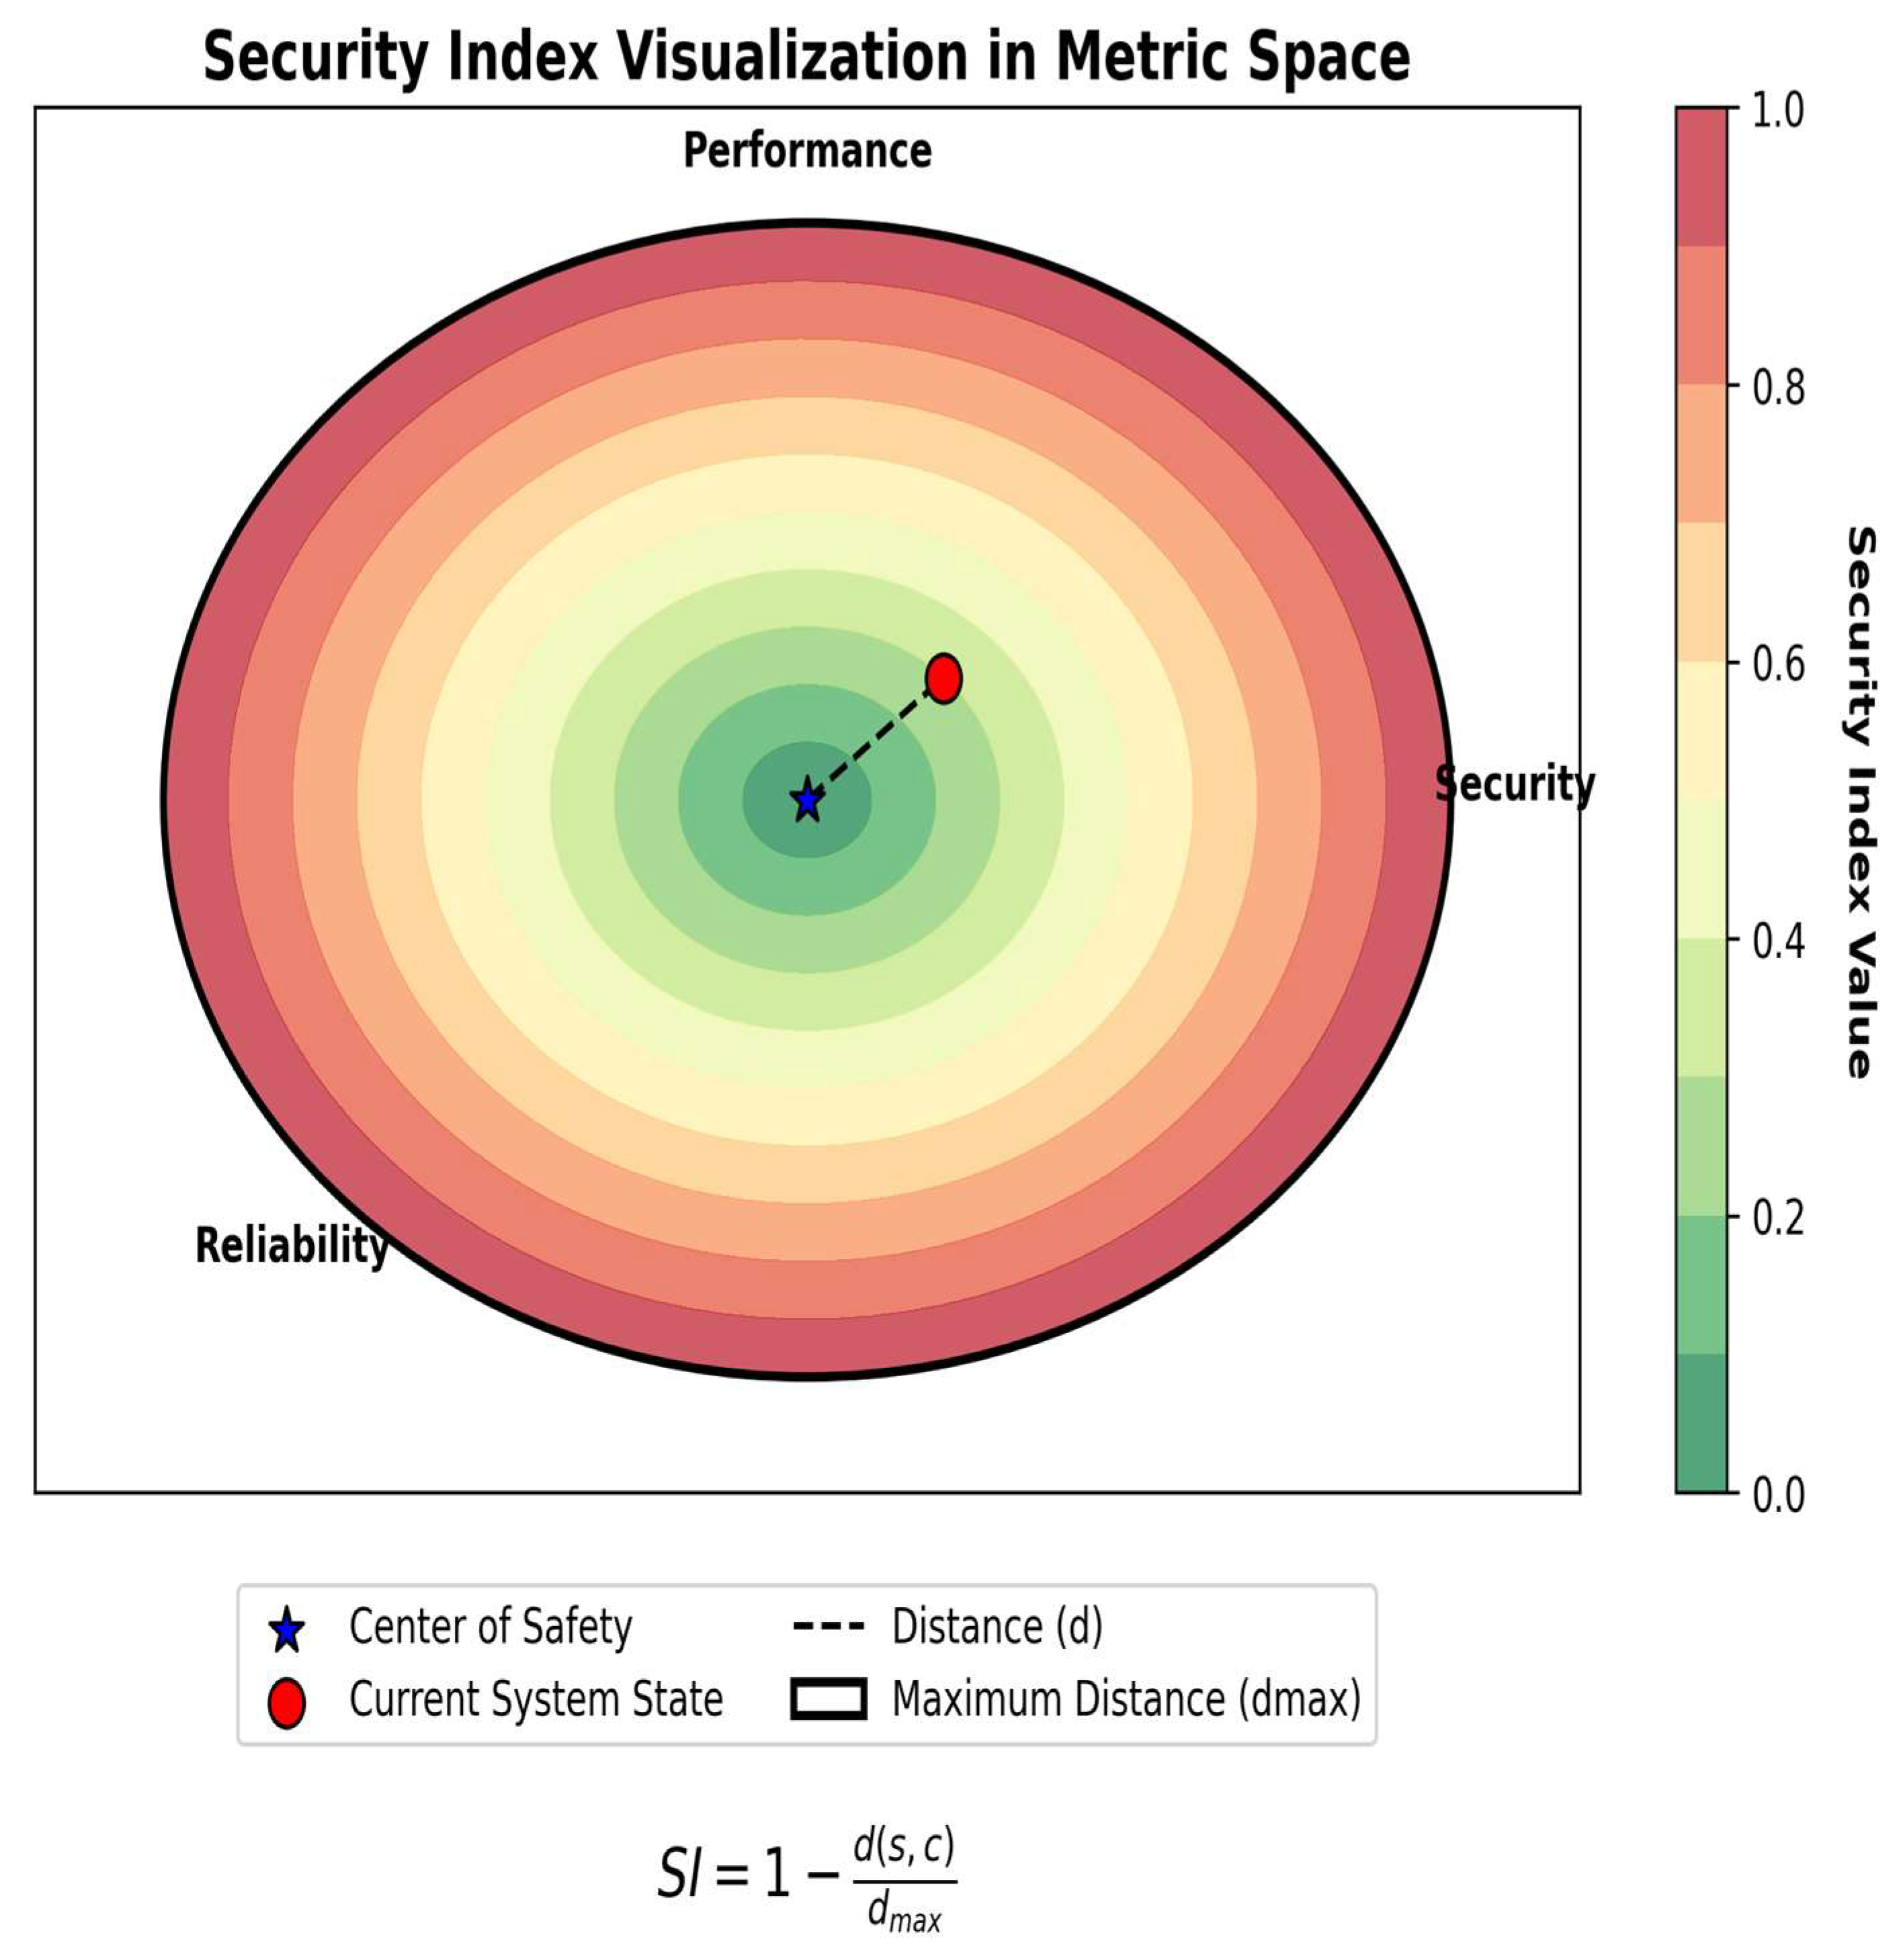
4.1. Security Index Formulation
4.2. Metric Identification and Measurement
4.3. Multi-Agent System Architecture
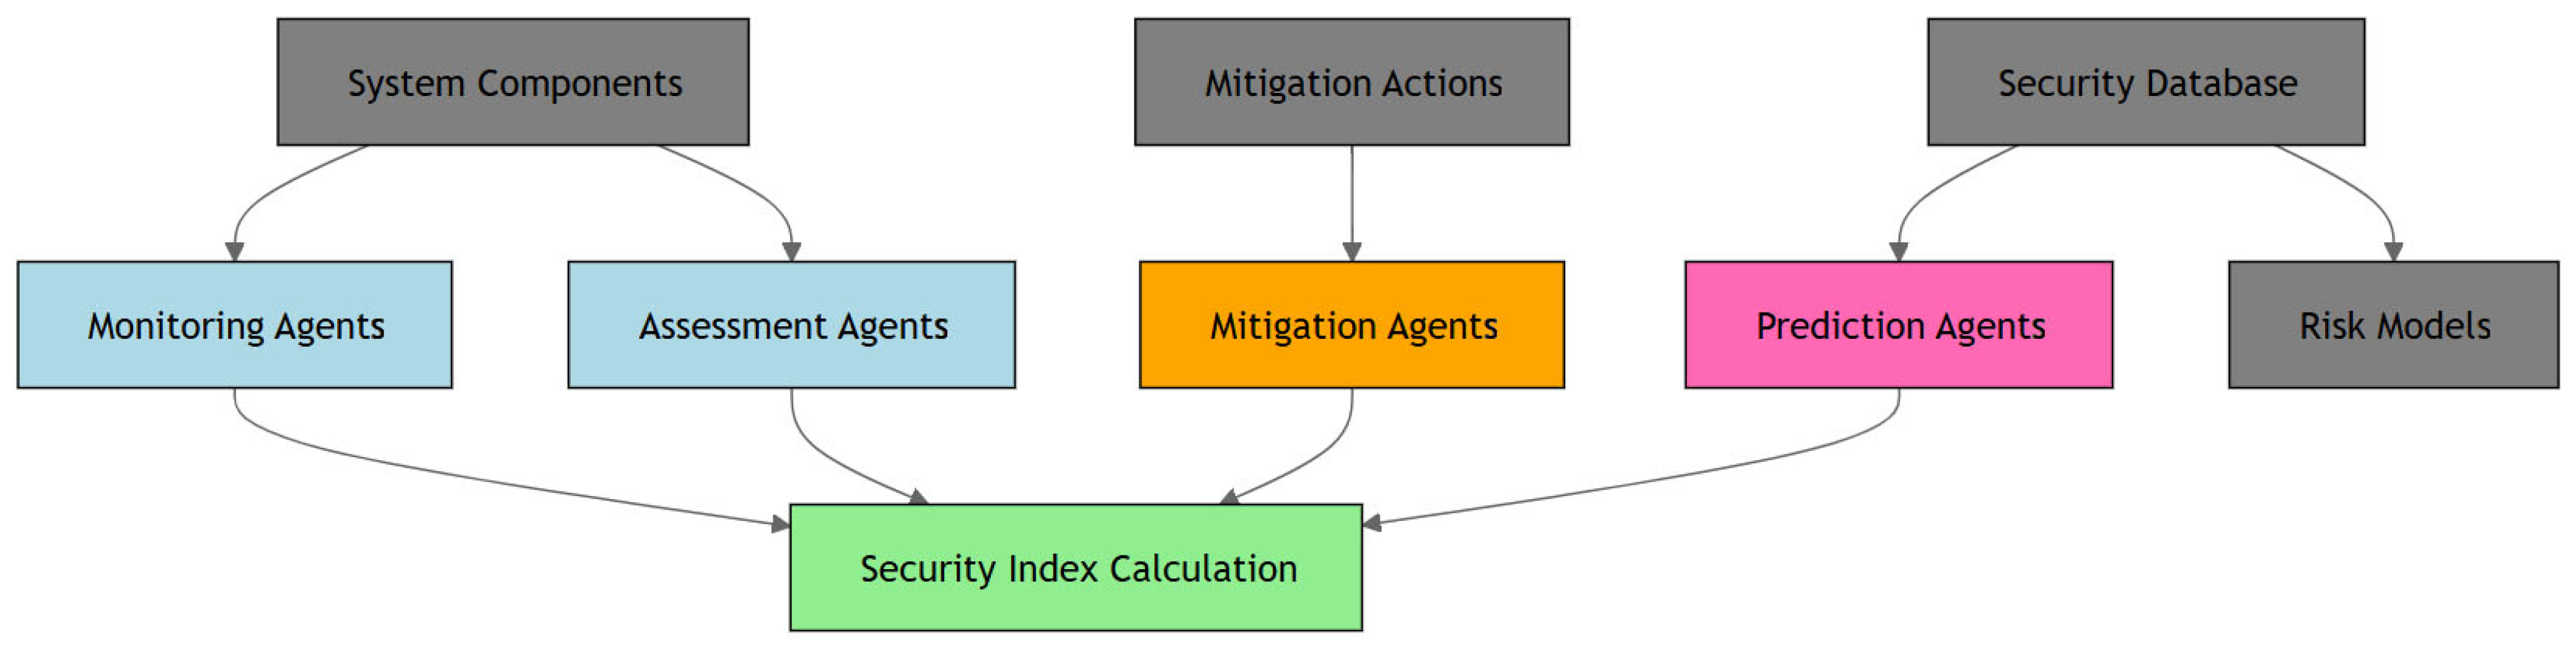
- Monitoring Agents: Responsible for collecting metric data from various system components and tools;
- Assessment Agents: Process metric data to evaluate the current system state and calculate the security index;
- Prediction Agents: Apply fuzzy Markov chains to predict potential future states and identify risks;
- Mitigation Agents: Coordinate and implement security measures based on assessment and prediction results.
- Distributed Monitoring: Agents can be deployed across multiple system components, enabling comprehensive coverage;
- Real-Time Assessment: Continuous evaluation of the security index provides immediate visibility into the system state;
- Predictive Capabilities: Fuzzy Markov chains enable proactive identification of potential risks;
- Automated Mitigation: Predefined security measures can be implemented automatically in response to detected risks;
- Scalability: The agent-based approach can be extended to accommodate additional metrics, components, and security measures as needed.
4.4. Fuzzy Markov Implementation
5. Case Studies and Results
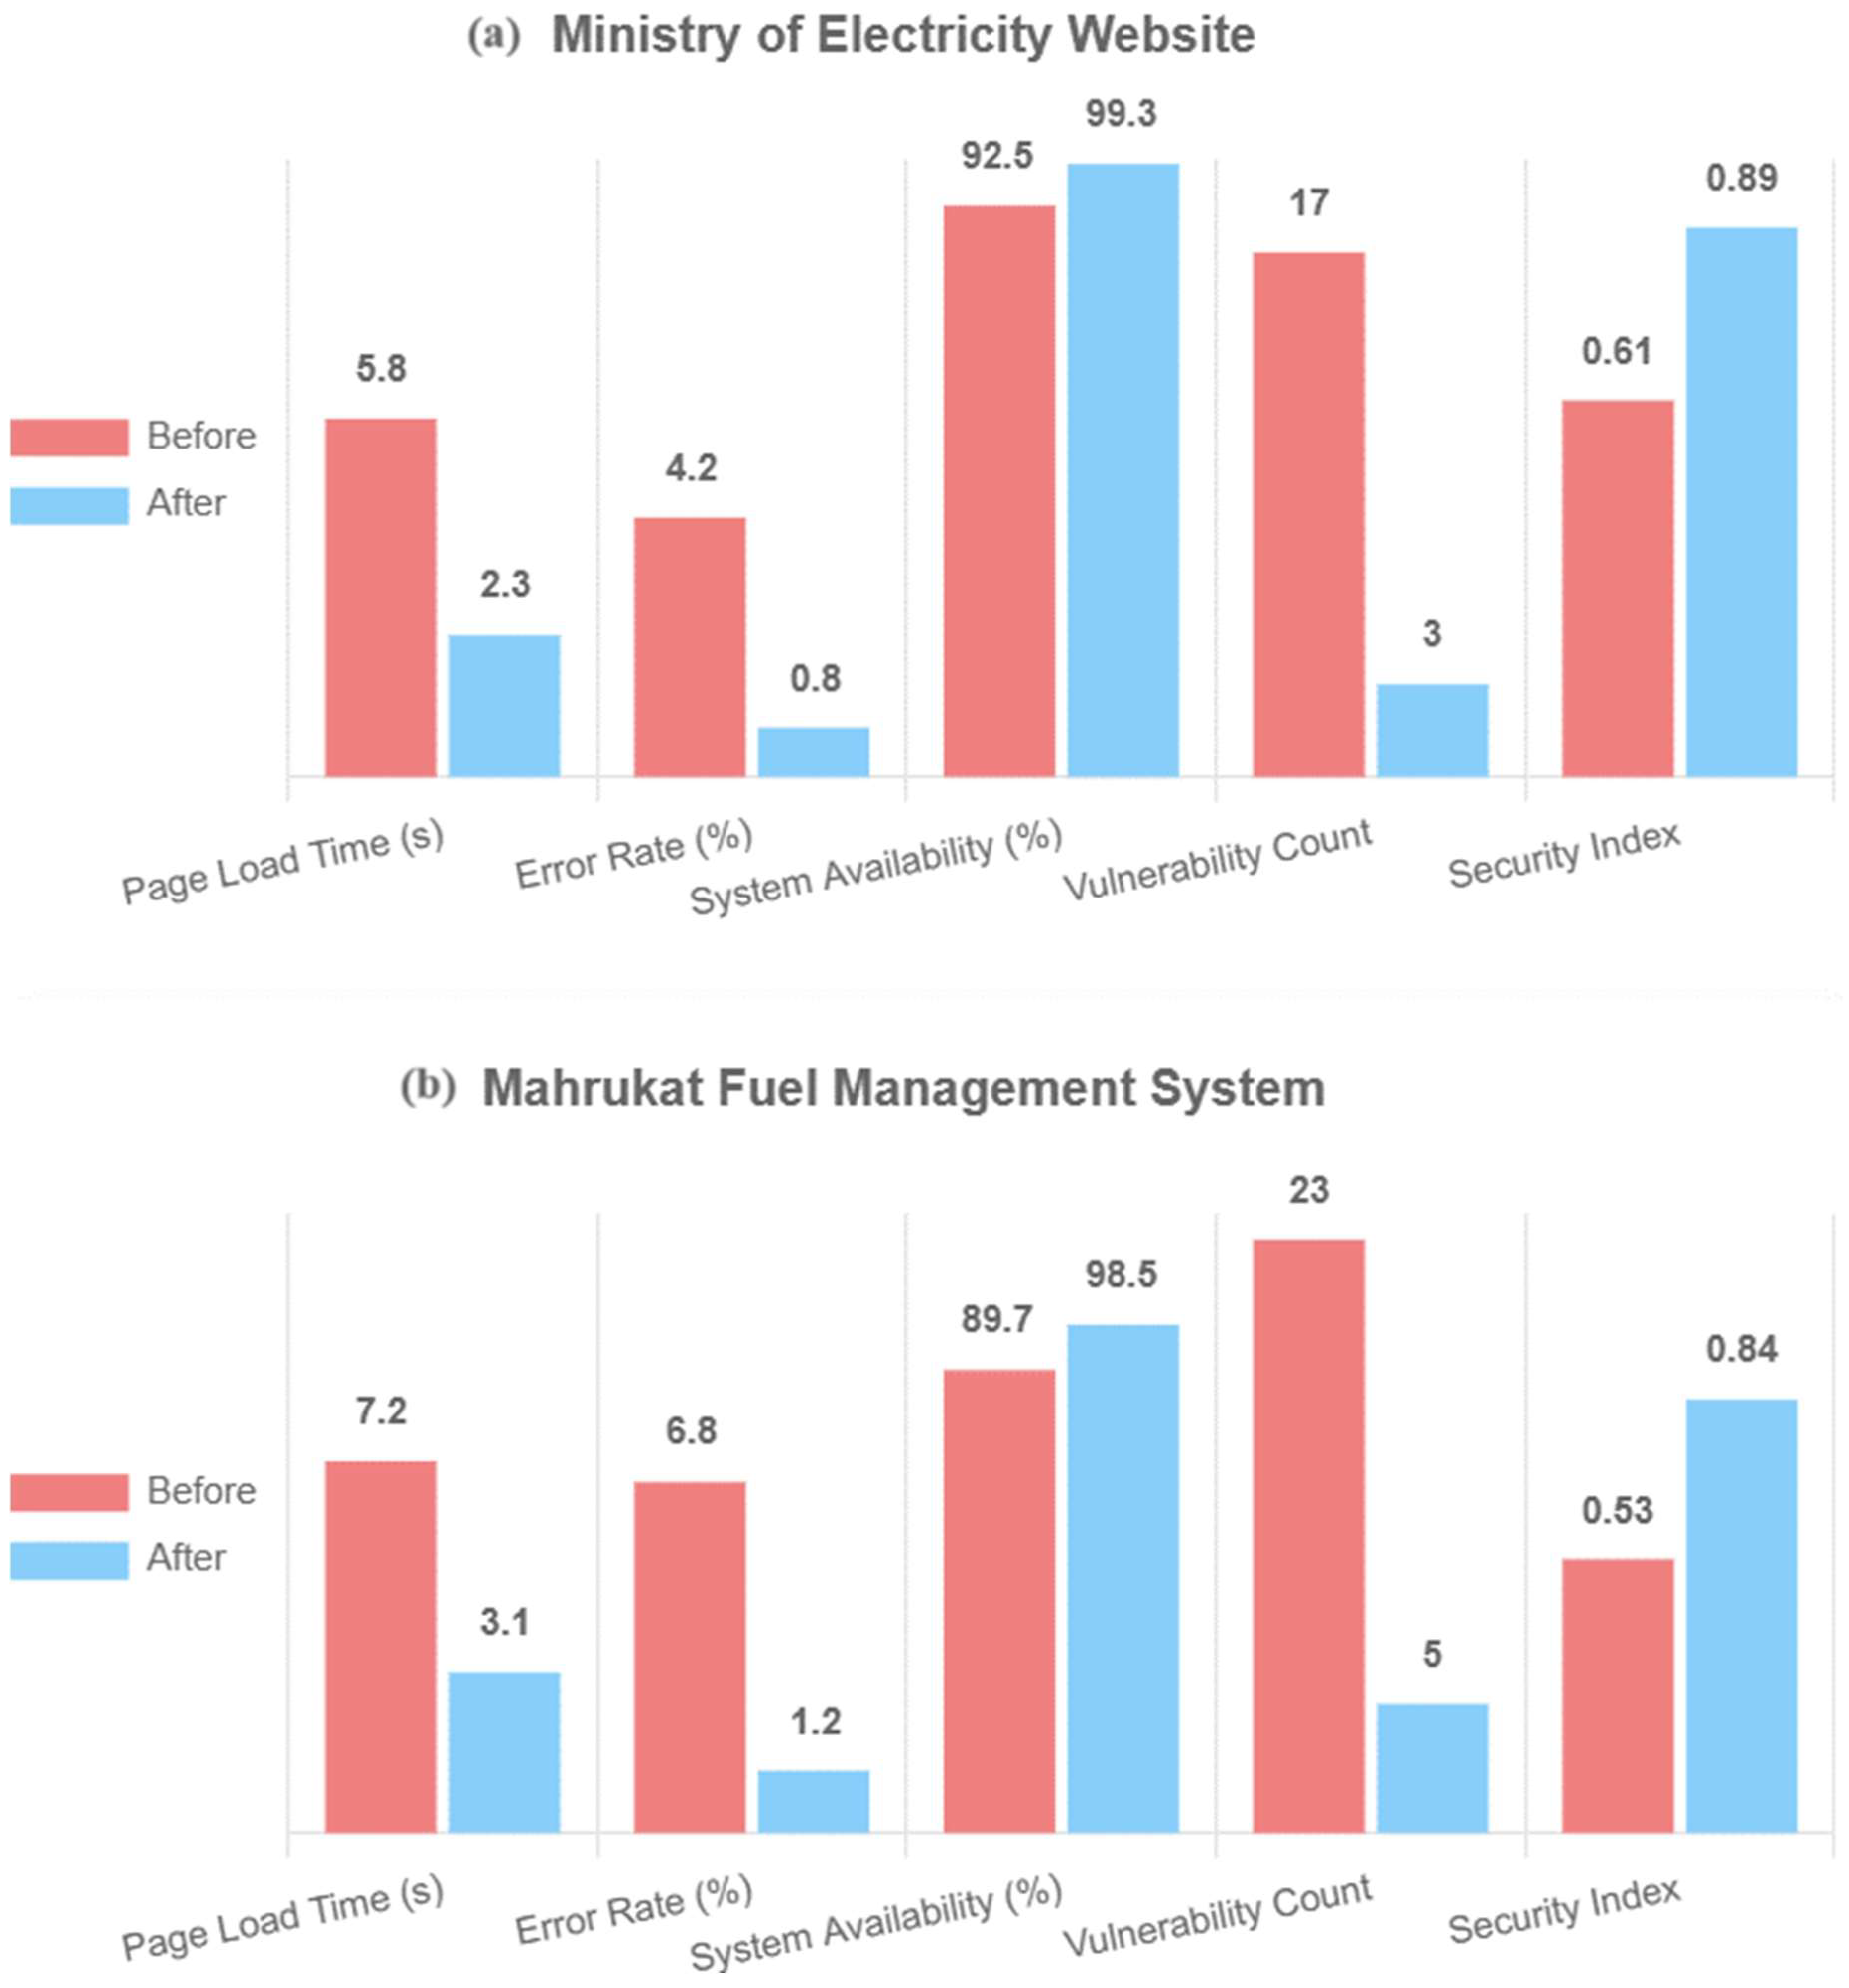
5.1. Case Study 1: Ministry of Electricity Website
- Initial Assessment: Establishing baseline metrics and calculating the initial security index;
- MAS Deployment: Installing monitoring agents on key system components and configuring assessment, prediction, and mitigation agents;
- Continuous Monitoring: Collecting metrics at regular intervals (hourly for performance metrics and daily for security metrics);
- Mitigation Implementation: Applying security measures based on assessment results and predictions;
- Performance Evaluation: Comparing system metrics and security index values before and after implementation.
5.2. Case Study 2: Mahrukat Fuel Management System
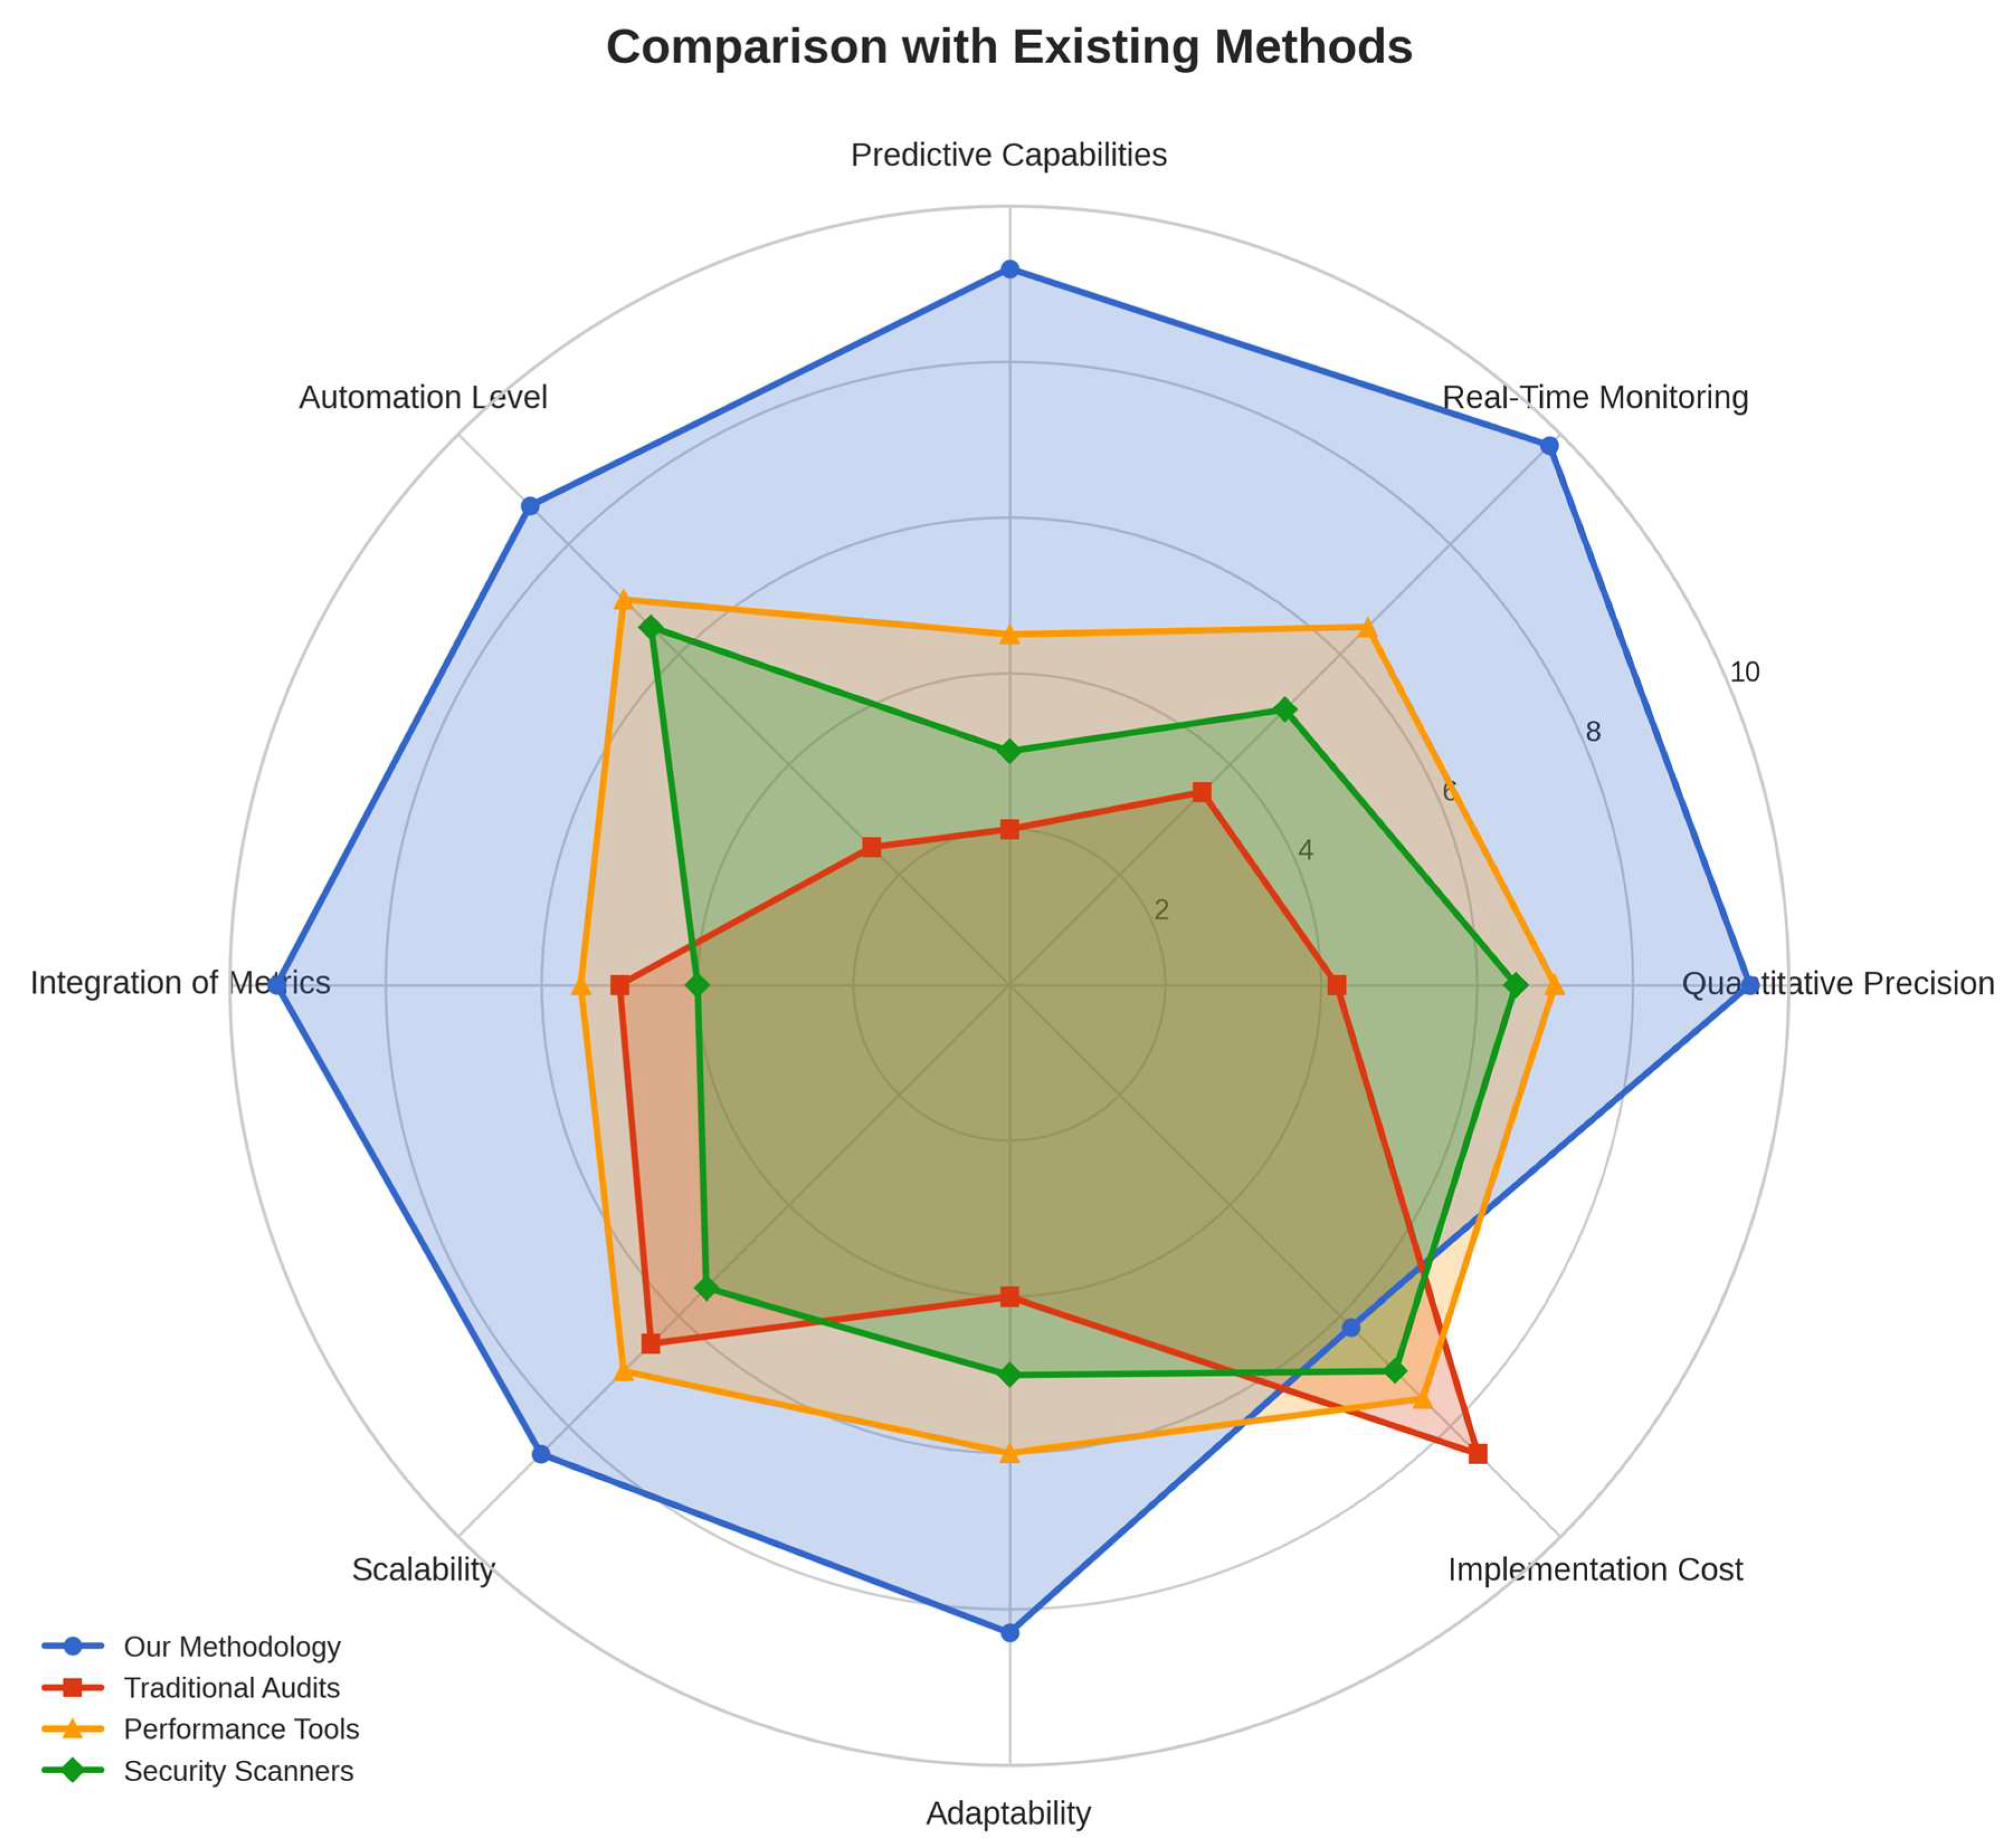
5.3. Comparison with Existing Methods
- Quantitative Precision: The proposed security index provides a numerical measure of system safety, unlike the subjective assessments used in traditional audits;
- Real-Time Monitoring: The MAS enables continuous monitoring, contrasting with the periodic nature of traditional audits and scheduled scans;
- Predictive Capabilities: Fuzzy Markov chains support advanced risk prediction, a feature that is largely absent in existing methods;
- Automation Level: The proposed approach automates both assessment and mitigation processes, reducing the need for manual intervention;
- Integration of Metrics: The methodology integrates performance, reliability, and security metrics in a unified manner, providing a holistic view of the system state.
6. Discussion
6.1. Implications
- Quantitative Security Management: By providing a numerical security index, the approach enables data-driven security management and objective evaluation of security measures;
- Proactive Risk Mitigation: The predictive capabilities of fuzzy Markov chains allow organizations to identify and address potential risks before they materialize;
- Resource Optimization: The comprehensive assessment provided by the methodology helps organizations prioritize security investments based on their impact on the security index;
- Regulatory Compliance: The detailed documentation and quantitative assessment facilitated by the approach can support compliance with security regulations and standards.
6.2. Limitations
- Metric Dependency: The accuracy of the security index relies on comprehensive metric collection, which may be challenging in resource-constrained environments;
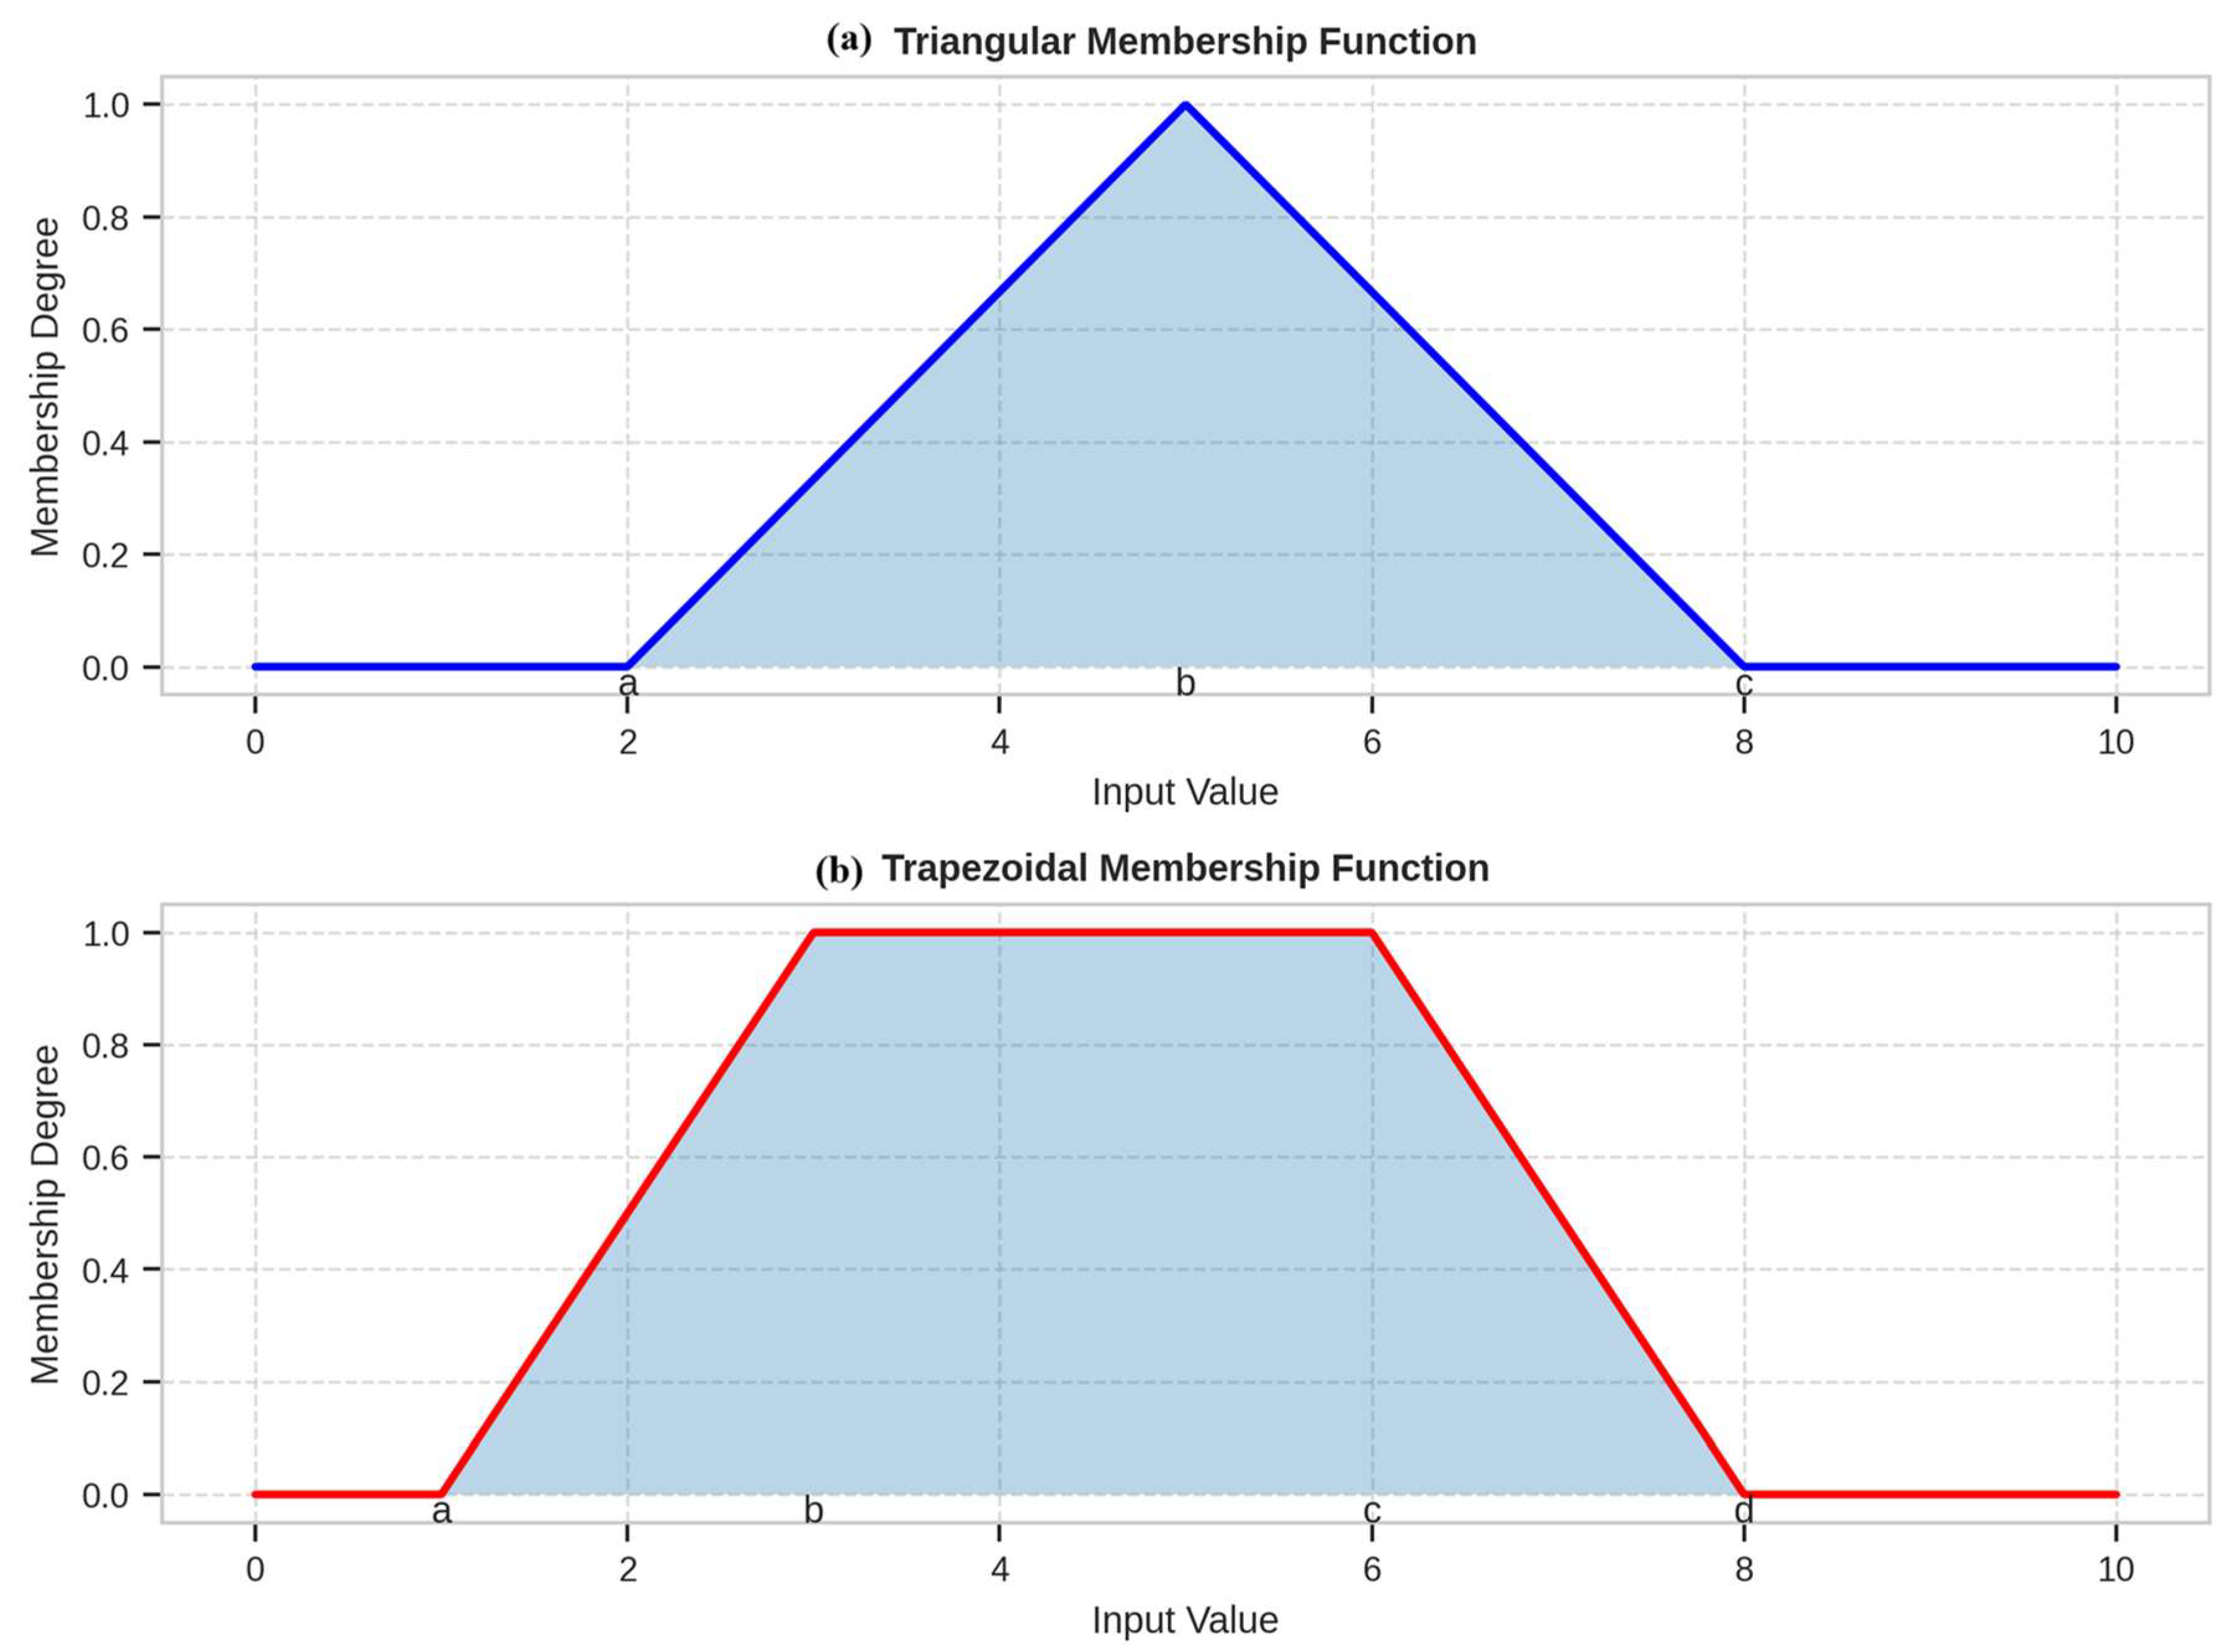
- Membership Function Selection: The choice of membership functions (e.g., triangular vs. trapezoidal) can influence the results and requires careful calibration based on system characteristics;
- MAS Implementation: Deploying the MAS requires technical expertise and supporting infrastructure, which may limit accessibility for smaller organizations;
- Scope of Threats: The methodology primarily focuses on technical security aspects and may not fully capture human-related threats, such as social engineering.
6.3. Future Work
- Integrating Machine Learning: Incorporating machine learning techniques to improve predictive accuracy and adapt to evolving threats;
- Expanding Sectoral Applications: Extending the framework to other sectors, such as manufacturing or healthcare, to further validate its scalability;
- Developing Adaptive Fuzzy Models: Designing dynamic membership functions that adjust to changing system conditions;
- Addressing Human Factors: Incorporating mechanisms to account for social engineering and insider threats;
- Enhancing Visualization: Developing advanced visualization tools to improve the interpretability of the security index and risk predictions.
7. Conclusions
Author Contributions
Funding
Institutional Review Board Statement
Informed Consent Statement
Data Availability Statement
Conflicts of Interest
Appendix A. Simulation and Measurement Methods
Appendix A.1. Evaluation Framework
Appendix A.2. Simulation Environment
- Nodes: 100, 250, 500, 1000
- Real systems: Ministry of Electricity website, Mahrukat System
- Tools: GTmetrix, Lighthouse, OWASP ZAP, Nessus, custom agents, MAS, Fuzzy Markov Model
- Repeated trials: 50 per scenario
Appendix A.3. Measurement Methods by Criterion
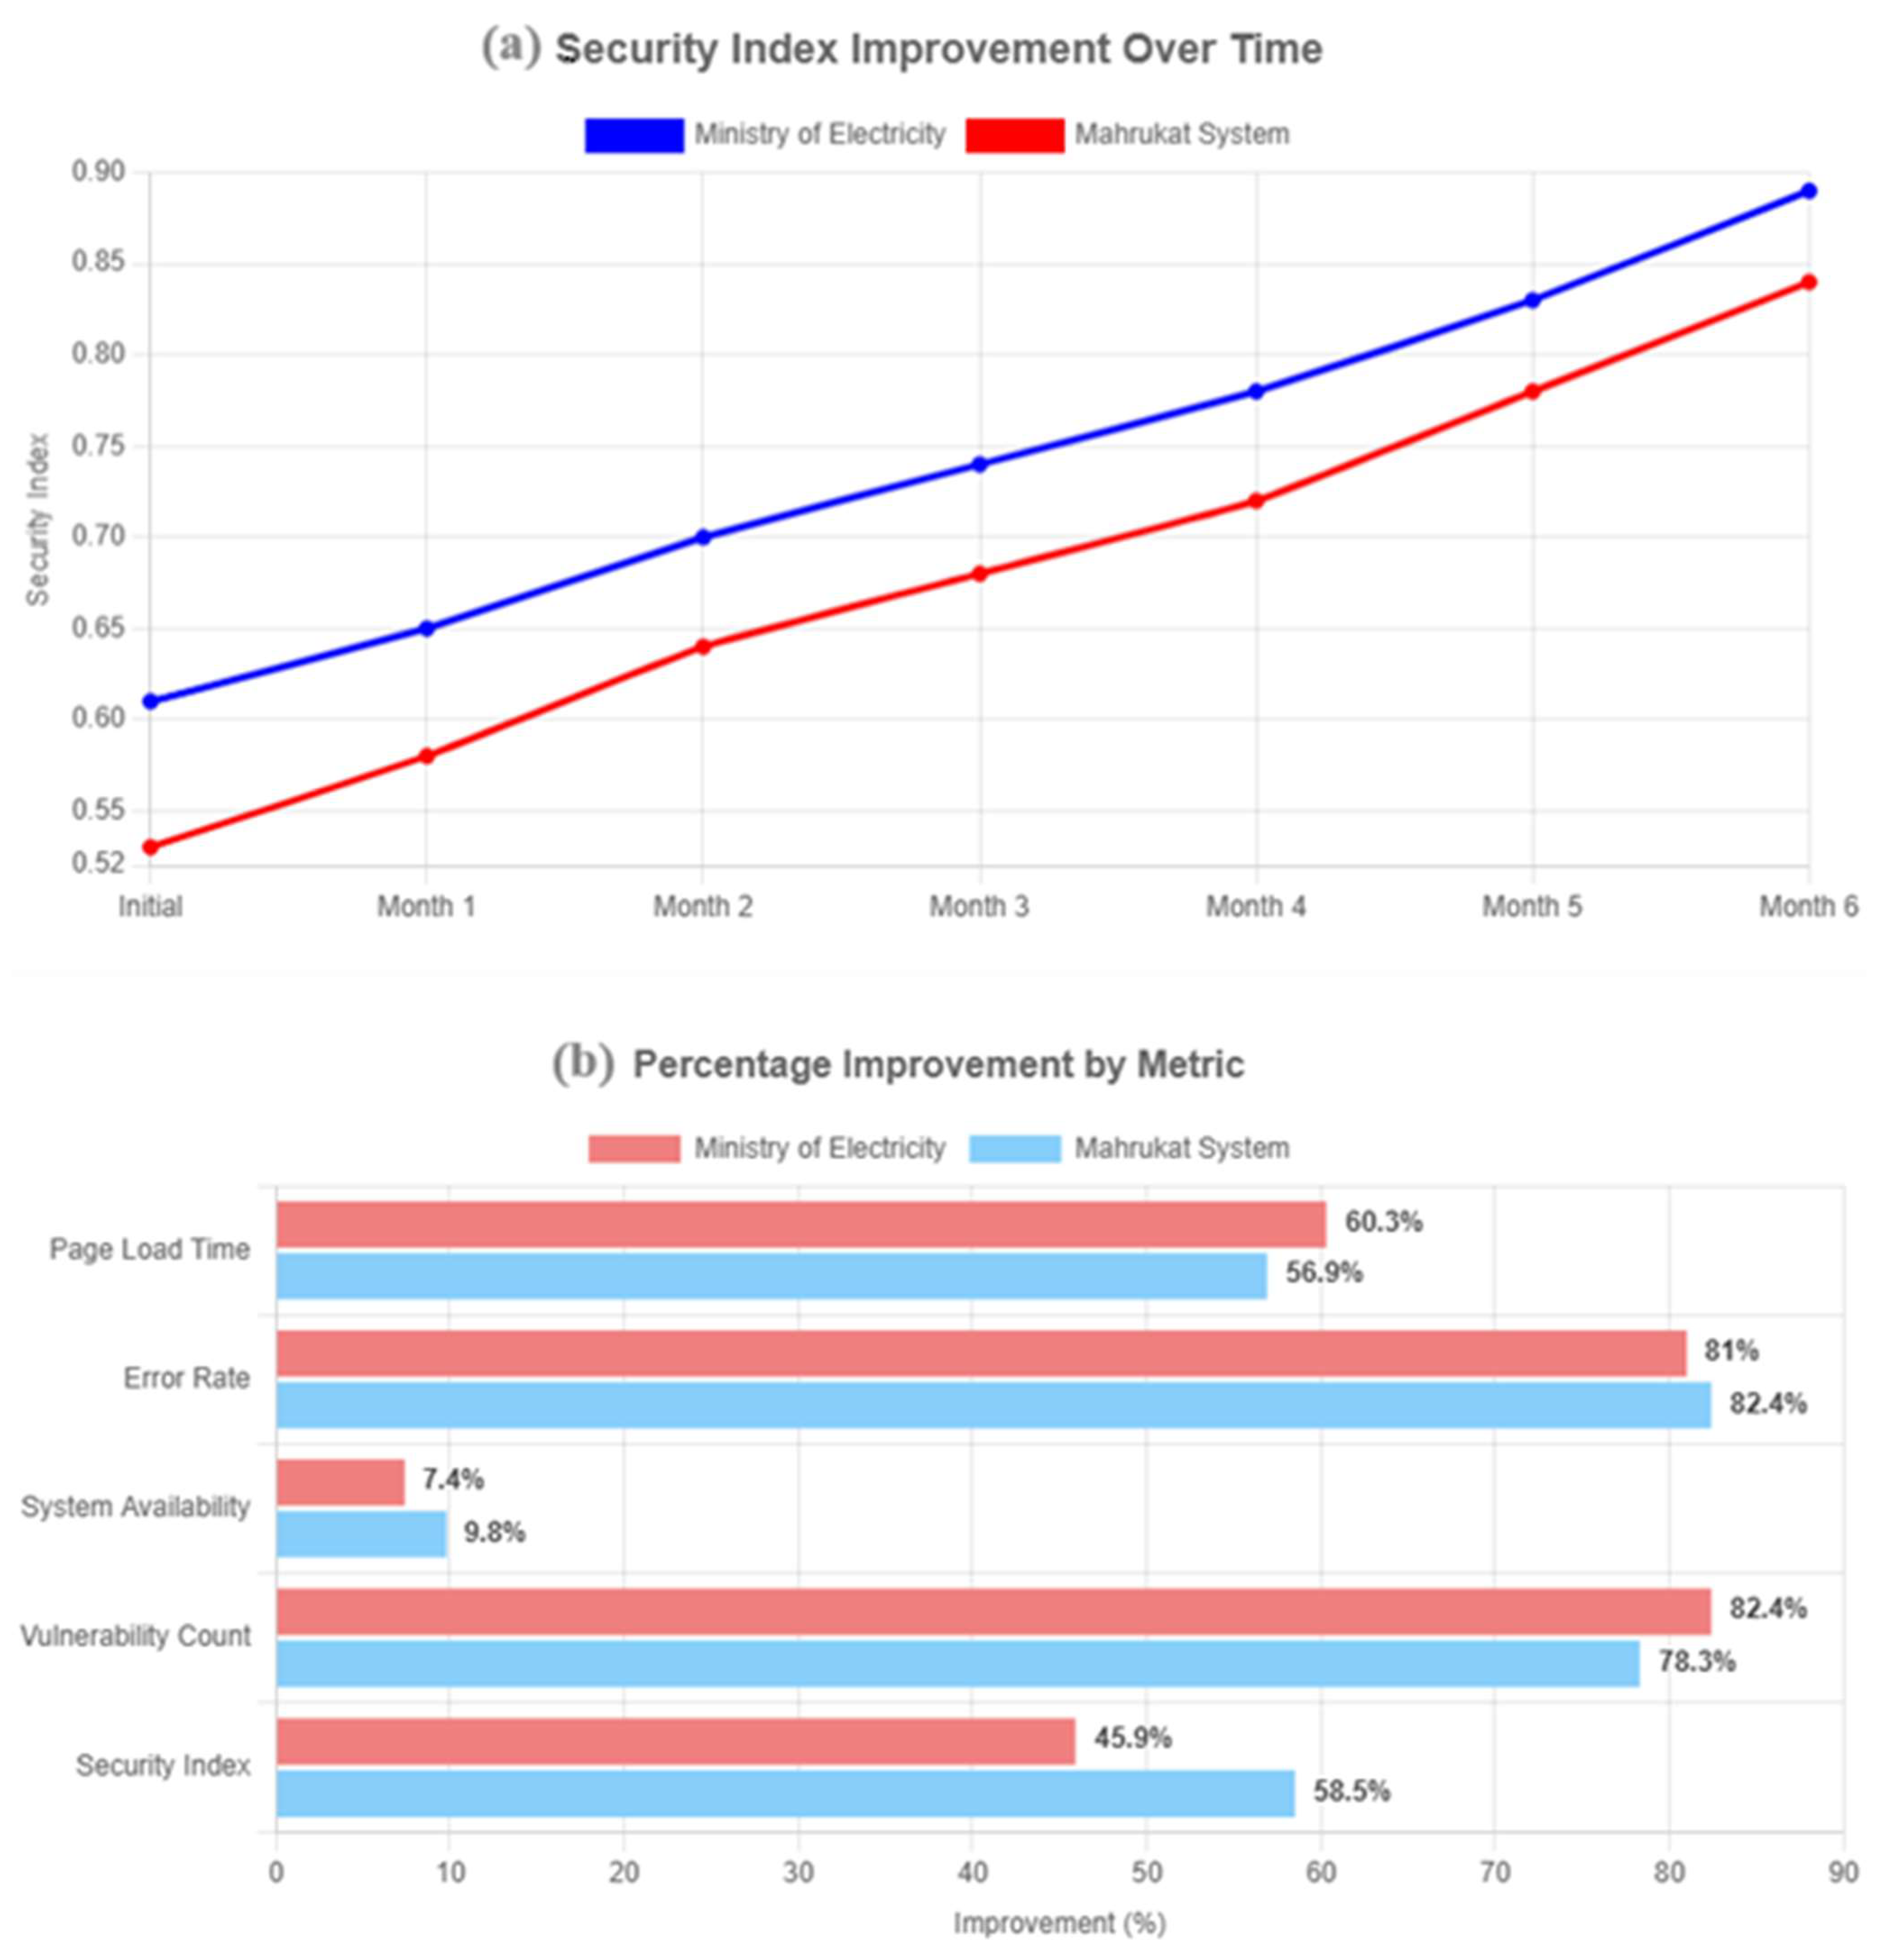
- Quantitative Precision: Measured as the granularity and numerical accuracy of security assessments (e.g., resolution of the security index). In simulations, we compared output precision (e.g., decimal places and error margins) against ground-truth benchmarks from controlled vulnerability injections. Case study data (e.g., security index improvements from 0.61 to 0.89) was aggregated. Expert scoring evaluated subjectivity reduction. Guided by Savola [7] for metric taxonomy.
- Real-Time Monitoring: Assessed as average latency (in ms) for detecting and reporting changes in system state. Simulations timed MAS agents vs. periodic tools (e.g., Nessus scans). Raw data averaged across 50 trials per node scale. Case studies measured hourly/daily metric collection intervals. Lower latency scored higher. Informed by NIST SP 800-115 [25] for monitoring protocols.
- Predictive Capabilities: Evaluated as accuracy of risk forecasts (e.g., fuzzy Markov chain prediction error rate). Simulations injected threats and measured hit rate for future state predictions. Experts rated predictive depth compared to baselines like NIST frameworks. Case study forecasts (e.g., pre-mitigation risk identification) contributed. Based on Pendleton et al. [27] for quantitative modeling.
- Automation Level: Calculated as percentage of assessment/mitigation steps automated (%). Simulations counted manual interventions needed (e.g., MAS auto-mitigates 87% on average). Raw data from trials (e.g., 86–88% for our method). Experts adjusted for real-world applicability. Drew from [26] ISO/IEC 27004 for automation metrics.
- Integration of Metrics: Measured by the number and seamless combination of performance/reliability/security metrics (count and correlation strength). Simulations used fuzzy logic integration scores (e.g., Pearson correlation > 0.85 for our method). Case study metrics from Table 1, Table 2 and Table 3 were aggregated. Guided by Savola [7] taxonomy.
- Scalability: Assessed as performance degradation (%) across increasing nodes (100–1000). Simulations measured efficiency drop in processing time and resource use. Lower degradation scored higher. Experts rated framework extensibility. Informed by [24] NIST SP 800-55 for scalability testing.
- Adaptability: Evaluated as latency (in seconds) to incorporate new threats/metrics. Simulations tested dynamic updates (e.g., fuzzy membership function adjustments). Case studies included post-implementation adaptations. Guided by Pendleton et al. [25] for adaptive models.
- Implementation Cost (Lower is Better): Modeled as total resource expenditure (e.g., deployment time in hours + computational cost in CPU-hours). Simulations estimated based on tool setups; case studies used actual deployment logs. Experts provided cost multipliers for expertise/hardware. Inverted for scoring. Based on [24] ISO/IEC 27004 cost frameworks.
- Human Expertise Required (Lower is Better): Assessed via required skill level (e.g., on a 1–10 scale of certifications needed). Expert panel rated based on setup/maintenance complexity. Simulations and case studies logged training time. Inverted for scoring. Informed by [25] NIST SP 800-115 for expertise guidelines.
- Threat Detection Rate (%): Direct percentage of simulated threats detected successfully. 50 trials per scenario with injected vulnerabilities (e.g., OWASP top 10). Raw data averaged (e.g., 86–90% for our method). Case studies used vulnerability count reductions (78.3–82.4%).
- False Positive Rate (%) (Lower is Better): Percentage of false alarms in simulations. Measured during threat injections; fuzzy logic reduced noise. Raw data from trials (e.g., 43–47% for scanners). Inverted post-normalization.
- Response Time (Lower is Better): Average delay (in ms) from detection to mitigation. Simulations timed full cycles (e.g., MAS ~370 ms). Case studies included real-time logs. Inverted for scoring. Guided by NIST SP 800-55 for response metrics.
- Compliance Mapping: Scored as alignment percentage to standards (e.g., mapping completeness to [3] ISO/IEC 27001 controls). Expert elicitation reviewed framework overlaps; simulations tested audit trails. Higher coverage scored better.
Appendix B. Sample Raw Data Extract
| Trial | Detection Rate | Scanner Detection | MAS Response Time (ms) | Scanner FP (%) | Nodes | Automation (%) |
| 1 | 0.88 | 0.72 | 380 | 44 | 100 | 86 |
| 2 | 0.90 | 0.75 | 365 | 47 | 250 | 88 |
| 3 | 0.86 | 0.71 | 400 | 43 | 500 | 87 |
| 4 | 0.89 | 0.70 | 370 | 46 | 1000 | 87 |
| … | … | … | … | … | … | … |
Appendix C. Revised Table 4 with 95% Confidence Intervals
| Criterion | Our Methodology | Traditional Audits | Performance Tools | Security Scanners | NIST Framework | ISO 27001 [3] |
| Quantitative Precision | 9.5 ± 0.3 | 4.2 ± 0.7 | 7.0 ± 0.4 | 6.5 ± 0.5 | 5.5 ± 0.6 | 4.8 ± 0.5 |
| Real-Time Monitoring | 9.8 ± 0.1 | 3.5 ± 0.8 | 6.5 ± 0.4 | 5.0 ± 0.5 | 4.0 ± 0.5 | 3.8 ± 0.6 |
| Predictive Capabilities | 9.2 ± 0.4 | 2.0 ± 0.5 | 4.5 ± 0.4 | 3.0 ± 0.5 | 3.5 ± 0.6 | 2.5 ± 0.5 |
| Automation Level | 8.7 ± 0.3 | 2.5 ± 0.4 | 7.0 ± 0.4 | 6.5 ± 0.5 | 4.0 ± 0.5 | 3.5 ± 0.4 |
| Integration of Metrics | 9.4 ± 0.2 | 5.0 ± 0.5 | 5.5 ± 0.4 | 4.0 ± 0.4 | 6.5 ± 0.5 | 6.0 ± 0.4 |
| Scalability | 8.5 ± 0.3 | 6.5 ± 0.6 | 7.0 ± 0.4 | 5.5 ± 0.5 | 7.5 ± 0.4 | 7.0 ± 0.4 |
| Adaptability | 8.3 ± 0.4 | 4.0 ± 0.6 | 6.0 ± 0.5 | 5.0 ± 0.5 | 6.0 ± 0.6 | 5.5 ± 0.5 |
| Implementation Cost * | 6.2 ± 0.4 | 8.5 ± 0.6 | 7.5 ± 0.4 | 7.0 ± 0.5 | 7.0 ± 0.5 | 8.5 ± 0.6 |
| Human Expertise * | 7.0 ± 0.3 | 9.0 ± 0.6 | 6.0 ± 0.5 | 7.5 ± 0.5 | 8.0 ± 0.5 | 8.5 ± 0.5 |
| Threat Detection Rate (%) | 88 ± 4 | 55 ± 8 | 40 ± 7 | 75 ± 6 | 65 ± 5 | 60 ± 6 |
| False Positive Rate (%) * | 15 ± 3 | 40 ± 6 | 30 ± 5 | 45 ± 5 | 35 ± 6 | 40 ± 7 |
| Response Time * | 9.0 ± 0.2 | 2.0 ± 0.6 | 7.5 ± 0.3 | 5.0 ± 0.4 | 4.0 ± 0.5 | 3.5 ± 0.4 |
| Compliance Mapping | 7.5 ± 0.3 | 8.5 ± 0.4 | 4.5 ± 0.4 | 6.5 ± 0.4 | 9.5 ± 0.3 | 9.8 ± 0.3 |
| (* Lower is better; values inverted after normalization). | ||||||
References
- National Institute of Standards and Technology. Risk Management Framework for Information Systems and Organizations. NIST Spec. Publ. 2018, 800, 37. [Google Scholar]
- Rajathi, C.; Rukmani, P. Investigation of Assessment Methodologies in Information Security Risk Management. In Proceedings of the International Conference on Information, Communication and Computing Technology, Namakkal, India, 22–23 May 2023. [Google Scholar] [CrossRef] [Scilit]
- ISO/IEC 27001:2013; Information Technology—Security Techniques—Information Security Management Systems—Requirements. International Organization for Standardization: Geneva, Switzerland, 2013.
- Shameli-Sendi, A.; Aghababaei-Barzegar, R.; Cheriet, M. Taxonomy of information security risk assessment (ISRA). Comput. Secur. 2016, 57, 14–30. [Google Scholar] [CrossRef] [Scilit]
- Ahmed, M.S.; Al-Shaer, E.; Khan, L. A novel quantitative approach for measuring network security. In Proceedings of the 27th Conference on Computer Communications (INFOCOM), Phoenix, AZ, USA, 15–17 April 2008; pp. 1957–1965. [Google Scholar]
- Wang, C.; Wulf, W.A. Towards a framework for security measurement. In Proceedings of the 20th National Information Systems Security Conference, Baltimore, MD, USA, 7–10 October 1997; pp. 522–533. [Google Scholar]
- Savola, R.M. Towards a taxonomy for information security metrics. In Proceedings of the 2007 ACM Workshop on Quality of Protection (QoP ‘07), Alexandria, VA, USA, 2 November–31 October 2007; Association for Computing Machinery: New York, NY, USA, 2007; pp. 28–30. [Google Scholar] [CrossRef] [Scilit]
- Owens, S.F.; Levary, R.R. An adaptive expert system approach for intrusion detection. Int. J. Secur. Netw. 2006, 1, 206–217. [Google Scholar] [CrossRef] [Scilit]
- Chen, T.; Zhou, J.; Xu, N. Information security risk assessment based on fuzzy set theory. In Proceedings of the 4th International Conference on Wireless Communications, Networking and Mobile Computing, Dalian, China, 12–17 October 2008; pp. 1–4. [Google Scholar]
- Krzysztoń, E.; Mikołajewski, D.; Prokopowicz, P. Review of Fuzzy Methods Application in IIoT Security—Challenges and Perspectives. Electronics 2025, 14, 3475. [Google Scholar] [CrossRef] [Scilit]
- Deng, Y.; Jiang, W.; Sadiq, R. Modeling contaminant intrusion in water distribution networks: A new similarity-based DST method. Expert Syst. Appl. 2011, 38, 571–578. [Google Scholar] [CrossRef] [Scilit]
- Shamshirband, S.; Patel, A.; Anuar, N.B.; Mat Kiah, M.L.; Abraham, A. A cooperative game theoretic approach using fuzzy Q-learning for detecting and preventing intrusions in wireless sensor networks. Eng. Appl. Artif. Intell. 2014, 32, 228–241. [Google Scholar] [CrossRef] [Scilit]
- Herrero, Á.; Corchado, E.; Pellicer, M.A.; Abraham, A. MOVIH-IDS: A mobile-visualization hybrid intrusion detection system. Neurocomputing 2009, 72, 2775–2784. [Google Scholar] [CrossRef] [Scilit]
- Boudaoud, K.; Labiod, H.; Boutaba, R.; Guessoum, Z. Network security management with intelligent agents. In Proceedings of the 2000 IEEE/IFIP Network Operations and Management Symposium (NOMS 2000), Honolulu, HI, USA, 10–14 April 2000; pp. 579–592. [Google Scholar]
- Carcano, A.; Coletta, A.; Guglielmi, M.; Masera, M.; Fovino, I.N.; Trombetta, A. A multidimensional critical state analysis for detecting intrusions in SCADA systems. IEEE Trans. Ind. Inf. 2011, 7, 179–186. [Google Scholar] [CrossRef] [Scilit]
- Ramos, A.; Lazar, M.; Filho, R.H.; Rodrigues, J.J.P.C. A security metric for the evaluation of collaborative intrusion detection systems in wireless sensor networks. In Proceedings of the 2017 IEEE International Conference on Communications (ICC), Paris, France, 21–25 May 2017; pp. 1–6. [Google Scholar]
- W3C Web Performance Working Group. Web Performance Metrics and Guidelines. 2023. Available online: https://www.w3.org/2023/11/webperf-charter-2023.html (accessed on 10 December 2025).
- Google. Lighthouse Performance Scoring Documentation. 2024. Available online: https://developer.chrome.com/docs/lighthouse/overview/ (accessed on 10 December 2025).
- ISO/IEC 25010:2020; Systems and Software Quality Requirements and Evaluation (SQuaRE)—System and Software Quality Models. International Organization for Standardization: Geneva, Switzerland, 2020.
- National Institute of Standards and Technology. Guide for Conducting Risk Assessments; NIST Special Publication 800-30 Revision 2; National Institute of Standards and Technology: Gaithersburg, MD, USA, 2022. [Google Scholar]
- Rempel, G. Defining Standards for Web Page Performance in Business Applications. In Proceedings of the International Conference on Performance Engineering, Austin, TX, USA, 31 January–4 February 2015. [Google Scholar] [CrossRef] [Scilit]
- Bansal, D. How SEO Makes Website Loads Faster and Helps in User Engagement. Int. J. Multidiscip. Res. 2024, 6. [Google Scholar] [CrossRef]
- Zadeh, L.A. The concept of a linguistic variable and its application to approximate reasoning—I. Inf. Sci. 1975, 8, 199–249. [Google Scholar] [CrossRef] [Scilit]
- National Institute of Standards and Technology. Performance Measurement Guide for Information Security (NIST SP 800-55 Rev.1); National Institute of Standards and Technology: Gaithersburg, MD, USA, 2008. [Google Scholar]
- National Institute of Standards and Technology. Technical Guide to Information Security Testing and Assessment (NIST SP 800-115); National Institute of Standards and Technology: Gaithersburg, MD, USA, 2008. [Google Scholar]
- ISO/IEC 27004:2016; Information Security Management—Monitoring, Measurement, Analysis and Evaluation. International Organization for Standardization: Geneva, Switzerland, 2016.
- Pendleton, M.; Garcia-Lebron, R.; Cho, J.-H.; Xu, S. A Survey on Systems Security Metrics. ACM Comput. Surv. 2016, 49, 1–35. [Google Scholar] [CrossRef] [Scilit]






| Category | Metric | Measurement Tool |
|---|---|---|
| Performance | Page Load Time (PLT) | GTmetrix, Pingdom |
| Performance | Time to First Byte (TTFB) | Chrome DevTools |
| Performance | DOM Processing Time (DPT) | Lighthouse |
| Reliability | Error Rate (ER) | Custom logging |
| Reliability | System Availability (SA) | Uptime monitoring |
| Reliability | Response Consistency (RC) | Statistical analysis |
| Security | Vulnerability Count (VC) | OWASP ZAP, Nessus |
| Security | Patch Latency (PL) | Version tracking |
| Security | Authentication Strength (AS) | Security assessment |
| Metric | Before Implementation | After Implementation | Improvement |
|---|---|---|---|
| Page Load Time (s) | 5.8 | 2.3 | 60.3% |
| Error Rate (%) | 4.2 | 0.8 | 81.0% |
| System Availability (%) | 92.5 | 99.3 | 7.4% |
| Vulnerability Count | 17 | 3 | 82.4% |
| Security Index | 0.61 | 0.89 | 45.9% |
| Metric | Before Implementation | After Implementation | Improvement |
|---|---|---|---|
| Page Load Time (s) | 7.2 | 3.1 | 56.9% |
| Error Rate (%) | 6.8 | 1.2 | 82.4% |
| System Availability (%) | 89.7 | 98.5 | 9.8% |
| Vulnerability Count | 23 | 5 | 78.3% |
| Security Index | 0.53 | 0.84 | 58.5% |
| Criteria | Our Methodology | Traditional Audits | Performance Tools | Security Scanners | NIST Framework | ISO 27001 [3] |
|---|---|---|---|---|---|---|
| Quantitative Precision | 9.5 | 4.2 | 7.0 | 6.5 | 5.5 | 4.8 |
| Real-Time Monitoring | 9.8 | 3.5 | 6.5 | 5.0 | 4.0 | 3.8 |
| Predictive Capabilities | 9.2 | 2.0 | 4.5 | 3.0 | 3.5 | 2.5 |
| Automation Level | 8.7 | 2.5 | 7.0 | 6.5 | 4.0 | 3.5 |
| Integration of Metrics | 9.4 | 5.0 | 5.5 | 4.0 | 6.5 | 6.0 |
| Scalability | 8.5 | 6.5 | 7.0 | 5.5 | 7.5 | 7.0 |
| Adaptability | 8.3 | 4.0 | 6.0 | 5.0 | 6.0 | 5.5 |
| Implementation Cost (Lower is Better) | 6.2 * | 8.5 * | 7.5 * | 7.0 * | 7.0 * | 8.5 * |
| Human Expertise Required (Lower is Better) | 7.0 * | 9.0 * | 6.0 * | 7.5 * | 8.0 * | 8.5 * |
| Threat Detection Rate (%) | 88% | 55% | 40% | 75% | 65% | 60% |
| False Positive Rate (%) (Lower is Better) | 15% * | 40% * | 30% * | 45% * | 35% * | 40% * |
| Response Time (Lower is Better) | 9.0 * | 2.0 * | 7.5 * | 5.0 * | 4.0 * | 3.5 * |
| Compliance Mapping | 7.5 | 8.5 | 4.5 | 6.5 | 9.5 | 9.8 |
Disclaimer/Publisher’s Note: The statements, opinions and data contained in all publications are solely those of the individual author(s) and contributor(s) and not of MDPI and/or the editor(s). MDPI and/or the editor(s) disclaim responsibility for any injury to people or property resulting from any ideas, methods, instructions or products referred to in the content. |
© 2026 by the authors. Licensee MDPI, Basel, Switzerland. This article is an open access article distributed under the terms and conditions of the Creative Commons Attribution (CC BY) license.
Share and Cite
Khaddour, S.; Abu-Abed, F.; Bogatikov, V. A Novel Security Index for Assessing Information Systems in Industrial Organizations Using Web Technologies and Fuzzy Logic. Eng. Proc. 2025, 117, 38. https://doi.org/10.3390/engproc2025117038
Khaddour S, Abu-Abed F, Bogatikov V. A Novel Security Index for Assessing Information Systems in Industrial Organizations Using Web Technologies and Fuzzy Logic. Engineering Proceedings. 2025; 117(1):38. https://doi.org/10.3390/engproc2025117038
Chicago/Turabian StyleKhaddour, Sulieman, Fares Abu-Abed, and Valery Bogatikov. 2025. "A Novel Security Index for Assessing Information Systems in Industrial Organizations Using Web Technologies and Fuzzy Logic" Engineering Proceedings 117, no. 1: 38. https://doi.org/10.3390/engproc2025117038
APA StyleKhaddour, S., Abu-Abed, F., & Bogatikov, V. (2025). A Novel Security Index for Assessing Information Systems in Industrial Organizations Using Web Technologies and Fuzzy Logic. Engineering Proceedings, 117(1), 38. https://doi.org/10.3390/engproc2025117038