Next Issue
Volume 11, April
Previous Issue
Volume 11, February


Hydrology, Volume 11, Issue 3 (March 2024) – 12 articles

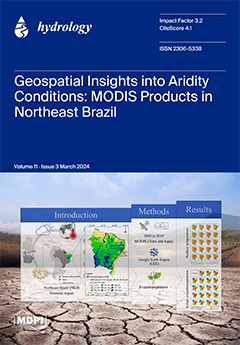
Cover Story (view full-size image): Northeast Brazil is the most populous semiarid region on the planet and is also one of the regions on the planet that suffers the most from climate change events and pressure from anthropogenic activities. In this study, Brazilian researchers present a methodology based on climatic/environmental parameters, with geospatial insights into the conditions of land-cover changes using MODIS sensor data/products and GIS modeling. The results emphasize extremely vulnerable areas in the Caatinga biome (Brazilian ecosystem), with spatiotemporal patterns of significant losses in vegetative and water resilience, demonstrating a condition of aridity over time. The authors warn of the accelerated increase in areas susceptible to desertification processes and emphasize the need for continuous monitoring to understand the changes occurring in semiarid regions. View this paper
  • Issues are regarded as officially published after their release is announced to the table of contents alert mailing list.
  • You may sign up for e-mail alerts to receive table of contents of newly released issues.
  • PDF is the official format for papers published in both, html and pdf forms. To view the papers in pdf format, click on the "PDF Full-text" link, and use the free Adobe Reader to open them.
Order results
Result details
Section
Select all
Export citation of selected articles as:
19 pages, 4880 KiB  
Article
A Temporal Fusion Transformer Model to Forecast Overflow from Sewer Manholes during Pluvial Flash Flood Events
by Benjamin Burrichter, Juliana Koltermann da Silva, Andre Niemann and Markus Quirmbach
Hydrology 2024, 11(3), 41; https://doi.org/10.3390/hydrology11030041 - 21 Mar 2024
Viewed by 1070
Abstract
This study employs a temporal fusion transformer (TFT) for predicting overflow from sewer manholes during heavy rainfall events. The TFT utilised is capable of forecasting overflow hydrographs at the manhole level and was tested on a sewer network with 975 manholes. As part [...] Read more.
This study employs a temporal fusion transformer (TFT) for predicting overflow from sewer manholes during heavy rainfall events. The TFT utilised is capable of forecasting overflow hydrographs at the manhole level and was tested on a sewer network with 975 manholes. As part of the investigations, the TFT was compared to other deep learning architectures to evaluate its predictive performance. In addition to precipitation measurements and forecasts, the issue of how the additional consideration of measurements in the sewer network as model inputs impacts forecast accuracy was investigated. A varying number of sensors and different measurement signals were compared. The results indicate high performance for the TFT compared to other model architectures like a long short-term memory (LSTM) network or a dual-stage attention-based recurrent neural network (DA-RNN). Additionally, results suggest that considering a single measuring point at the outlet of the sewer network instead of an entire measuring network yields better forecasts. One possible explanation is the high correlation between measurements, which increases model and training complexity without adding much value. Full article
Show Figures

Figure 1

21 pages, 7741 KiB  
Article
A Thermal Regime and a Water Circulation in a Very Deep Lake: Lake Tazawa, Japan
by Kazuhisa A. Chikita, Hideo Oyagi and Kazuhiro Amita
Hydrology 2024, 11(3), 40; https://doi.org/10.3390/hydrology11030040 - 16 Mar 2024
Viewed by 973
Abstract
A thermal system in the very deep Lake Tazawa (maximum depth, 423 m) was investigated by estimating the heat budget. In the heat budget estimate, the net heat input at the lake’s surface and the heat input by river inflow and groundwater inflow [...] Read more.
A thermal system in the very deep Lake Tazawa (maximum depth, 423 m) was investigated by estimating the heat budget. In the heat budget estimate, the net heat input at the lake’s surface and the heat input by river inflow and groundwater inflow were considered. Then, the heat loss by snowfall onto the lake’s surface was taken into account. Meanwhile, the lake water temperature was monitored at 0.2 m to the bottom by mooring temperature loggers for more than two years. The heat storage change of the lake from the loggers was calibrated by frequent vertical measurements of water temperature at every 0.1 m pitch by a profiler with high accuracy (±0.01 °C). The heat storage change (W/m2) obtained by the temperature loggers reasonably accorded to that from the heat budget estimate. In the heat budget, the net heat input at lake surface dominated the heat storage change, but significant heat loss by river inflow sporadically occurred, caused by the relatively large discharge from a reservoir in the upper region. How deeply the vertical water circulation in the lake occurs in winter was judged according to the differences between water temperatures at 0.2 m depth and at the bottom and between vertical profiles of dissolved oxygen over winter. It is strongly suggested that the whole water circulation process does not occur every winter, and if it does, it is very weak. A consistent increase in the water temperature at the bottom is probably due to the conservation of geothermal heat by high frequency of incomplete vertical water circulation. Full article
Show Figures

Figure 1

27 pages, 5087 KiB  
Article
Evapotranspiration Assessment by Remote Sensing in Brazil with Focus on Amazon Biome: Scientometric Analysis and Perspectives for Applications in Agro-Environmental Studies
by Daniela Castagna, Luzinete Scaunichi Barbosa, Charles Campoe Martim, Rhavel Salviano Dias Paulista, Nadja Gomes Machado, Marcelo Sacardi Biudes and Adilson Pacheco de Souza
Hydrology 2024, 11(3), 39; https://doi.org/10.3390/hydrology11030039 - 08 Mar 2024
Viewed by 1326
Abstract
The Amazon biome plays a crucial role in the hydrological cycle, supplying water vapor for the atmosphere and contributing to evapotranspiration (ET) that influences regional humidity across Brazil and South America. Remote sensing (RS) has emerged as a valuable tool for measuring and [...] Read more.
The Amazon biome plays a crucial role in the hydrological cycle, supplying water vapor for the atmosphere and contributing to evapotranspiration (ET) that influences regional humidity across Brazil and South America. Remote sensing (RS) has emerged as a valuable tool for measuring and estimating ET, particularly in the data-scarce Amazon region. A scientometric analysis was conducted to identify the most used RS-based ET product or model in Brazil and its potential application in the Amazon. Scientometrics allows for the quantitative analysis of scientific output; this study identified the most widely used RS product in the Amazon biome. Articles published in Web of Science, Scielo, and Scopus databases up to 2022 were searched using the keywords “Evapotranspiration”, “Remote Sensing”, and “Brazil”. After initial screening, 140 relevant articles were subjected to scientometric analysis using the Bibliometrix library in RStudio 2023.06.1+524. These articles, published between 2001 and 2022, reveal a collaborative research landscape involving 600 authors and co-authors from 245 institutions, with most studies originating from Brazil’s Southeast and North (Amazon) regions. Notably, within the 12 studies focusing on ET by RS in the Amazon biome, applications were diverse, encompassing river basins, climate change, El Niño, and deforestation, with the MOD16 product being the most frequently employed. Full article
(This article belongs to the Special Issue GIS Modelling of Evapotranspiration with Remote Sensing)
Show Figures

Figure 1

20 pages, 5229 KiB  
Article
An Integrated Remote Sensing and GIS-Based Technique for Mapping Groundwater Recharge Zones: A Case Study of SW Riyadh, Central Saudi Arabia
by Eman Mohamed M. EL-Bana, Haya M. Alogayell, Mariam Hassan Sheta and Mohamed Abdelfattah
Hydrology 2024, 11(3), 38; https://doi.org/10.3390/hydrology11030038 - 03 Mar 2024
Viewed by 1533
Abstract
It might be difficult to find possible groundwater reservoir zones, especially in arid or hilly regions. In the twenty-first century, remotely sensed satellite imagery may present a new opportunity to locate surface and subsurface water resources more quickly and affordably. In order to [...] Read more.
It might be difficult to find possible groundwater reservoir zones, especially in arid or hilly regions. In the twenty-first century, remotely sensed satellite imagery may present a new opportunity to locate surface and subsurface water resources more quickly and affordably. In order to identify groundwater potential zones, the current study was conducted in Central Saudi Arabia, southwest of Riyadh. The present analysis employed a multi-criteria approach that relies on remote sensing and geographic information systems. The variables employed in this technique include geology, rainfall, elevation, slope, aspect, hillshade, drainage density, lineaments density, and Land Use/Land Cover (LULC). The Analytical Hierarchical Process (AHP) was used for assigning weights to the parameters, and the corresponding significance of each parameter’s several classes for groundwater potentiality. Different groundwater potential zones were identified by the study: very high (16.8%), high (30%), medium (26.7%), low (18.6%), and very low (7.9%). Only two of the observation wells were located in the “medium” potential zone, but the other ten wells were observed in the “very high and high” potential zones, according to the validation survey. Consequently, the results may demonstrate that the current approach, which combines improved conceptualization with AHP to define and map groundwater potential zones, has a greater chance of producing accurate results and can be used to reduce the threat of drought in broader arid regions. Full article
(This article belongs to the Special Issue Groundwater Pollution: Sources, Mechanisms, and Prevention)
Show Figures

Figure 1

17 pages, 12473 KiB  
Article
Insight into Sources of Benzene, TCE, and PFOA/PFOS in Groundwater at Naval Air Station Whiting Field, Florida, through Numerical Particle-Tracking Simulations
by Eric D. Swain, James E. Landmeyer, Michael A. Singletary and Shannon E. Provenzano
Hydrology 2024, 11(3), 37; https://doi.org/10.3390/hydrology11030037 - 02 Mar 2024
Viewed by 1288
Abstract
Past waste-disposal activities at Naval Air Station Whiting Field (NASWF) have led to elevated concentrations of contaminants in the underlying sand and gravel aquifer. Contaminants include two of the most commonly detected chemicals in groundwater in many countries (benzene and trichloroethylene (TCE)) and [...] Read more.
Past waste-disposal activities at Naval Air Station Whiting Field (NASWF) have led to elevated concentrations of contaminants in the underlying sand and gravel aquifer. Contaminants include two of the most commonly detected chemicals in groundwater in many countries (benzene and trichloroethylene (TCE)) and the “forever chemicals” per- and poly-fluoroalkyl substances (PFAS) such as perfluorooctanoic acid (PFOA) and perfluorooctane sulfonic acid (PFOS). A MODFLOW model (the Whiting Field Groundwater Model (WFGM)) was previously developed for NASWF and the surrounding area to simulate groundwater flow. To obtain insight into groundwater flow pathways for the identification of potential source areas, the MODPATH particle-tracking application was applied to the WFGM for three public supply wells and three monitoring wells at NASWF. The travel time to recharge areas was estimated using concentrations of the groundwater age-dating solutes tritium (as helium ingrowth) and chlorofluorocarbons detected in the monitoring wells. Simulated travel times agree with the groundwater ages and indicate that the calibrated WFGM reasonably represents groundwater flow velocities and pathways. The MODPATH simulations confirm suspected on-base source areas to explain chemical detection in the monitoring wells. In contrast, the particle-tracking simulations indicate that potential source areas to the public supply wells include both on- and off-base sources. This is important because PFAS chemicals can have multiple sources, including land application of sludge-based fertilizers. This approach that combines groundwater age dating with particle-tracking simulations can be applied at similar sites characterized by benzene-, TCE-, and PFAS-contaminated groundwater. Full article
Show Figures

Figure 1

14 pages, 2262 KiB  
Article
Assessment of Water Quality as a Key Component in the Water–Energy–Food Nexus
by Kristina Gartsiyanova, Stefan Genchev and Atanas Kitev
Hydrology 2024, 11(3), 36; https://doi.org/10.3390/hydrology11030036 - 29 Feb 2024
Viewed by 1279
Abstract
The intensive economic activity along the Bulgarian Black Sea coast is causing serious changes in the quality of the river water. In view of the topicality of the problem, the main goal of this article is to emphasize the water quality as a [...] Read more.
The intensive economic activity along the Bulgarian Black Sea coast is causing serious changes in the quality of the river water. In view of the topicality of the problem, the main goal of this article is to emphasize the water quality as a necessary key component in the water–energy–food nexus by determining the status of the surface waters of selected Bulgarian Black Sea tributaries from the point of view of their physicochemical characteristics. The research is based on the Water Framework Directive (WFD)—2000/60/EU and the relevant national legislation. In the present study, the Canadian Complex Water Quality Index (CCME, WQI) was applied to determine the quality of river waters. The novelty in the present study is a definite and necessary emphasis on the opinion that the analysis and assessment of water quality should become an integral part of all studies of the water–energy–food nexus. Full article
Show Figures

Figure 1

13 pages, 4789 KiB  
Article
Enhancing Low-Flow Forecasts: A Multi-Model Approach for Rainfall–Runoff Models
by Cynthia Andraos
Hydrology 2024, 11(3), 35; https://doi.org/10.3390/hydrology11030035 - 29 Feb 2024
Viewed by 1471
Abstract
The expected change in rainfall patterns and the increase in evapotranspiration due to climate change leads to earlier droughts, which aggravate water shortages. To ensure the sustainable management of water resources in these conditions, it is necessary to forecast their evolution. The use [...] Read more.
The expected change in rainfall patterns and the increase in evapotranspiration due to climate change leads to earlier droughts, which aggravate water shortages. To ensure the sustainable management of water resources in these conditions, it is necessary to forecast their evolution. The use of hydrological models is essential for monitoring the water crisis. The conceptual hydrological models used in this study are MEDOR, GR4J, and HBV. They are applied in the Nahr Ibrahim watershed, which is a typical Lebanese Mediterranean basin. While these models simplify complex natural systems, concerns persist about their reliability in addressing drought challenges. In order to reduce the uncertainties, this study develops new robust methods that can improve model simulations. First, a particular series concerning low flows is constructed with the use of hydrological low-flow indices. The multi-model approach is utilized to reach a more accurate unique series while combining the low-flow series generated from the models. This combination is accomplished by using the simple average method, weighted average, artificial neural networks, and genetic algorithms. Better results are generated with the use of these methods. Accordingly, this study led to an improvement in model performances while increasing the reliability of low-flow forecasts. Full article
Show Figures

Figure 1

19 pages, 9939 KiB  
Article
Daily Simulation of the Rainfall–Runoff Relationship in the Sirba River Basin in West Africa: Insights from the HEC-HMS Model
by Idi Souley Tangam, Roland Yonaba, Dial Niang, Mahaman Moustapha Adamou, Amadou Keïta and Harouna Karambiri
Hydrology 2024, 11(3), 34; https://doi.org/10.3390/hydrology11030034 - 28 Feb 2024
Viewed by 1474
Abstract
This study focuses on the Sirba River Basin (SRB), a transboundary West African catchment of 38,950 km2 shared by Burkina Faso and Niger, which contributes to flooding downstream in Niamey (Niger). The study uses the HEC-HMS hydrological model to explore the dynamics [...] Read more.
This study focuses on the Sirba River Basin (SRB), a transboundary West African catchment of 38,950 km2 shared by Burkina Faso and Niger, which contributes to flooding downstream in Niamey (Niger). The study uses the HEC-HMS hydrological model to explore the dynamics of the daily rainfall–runoff relationship over the period 2006–2020. The model is calibrated using observed rainfall at 13 meteorological stations within the river basin and observed discharges at the Garbey Kourou hydrometric station outlet. Two types of simulation are compared: (i) a continuous simulation (CS) over the period 2006–2020 and (ii) an event-based simulation (ES) using selected major flood events in 2010, 2012, 2013, 2015 and 2020. The results showed satisfactory model performance under both modeling schemes (R2 = 0.84–0.87 for CS and R2 = 0.94–0.98 for ES), with a superior performance of ES over CS. Also, significant differences in the distribution of calibrated model parameters for the percent impervious and the attenuation flood wave factor were observed. A sensitivity analysis revealed that the curve number, initial abstraction, lag time and routing time factors were influential on the model outputs. The study therefore underscores the model’s robustness and contributes crucial insights for flood control management and infrastructure planning in the SRB. Full article
Show Figures

Figure 1

15 pages, 1937 KiB  
Article
Catchment-Scale Challenges for Water Resources Management: Assessing ‘Reasonable’ Peak Needs for Irrigated Agriculture in a Humid Climate
by Jerry W. Knox and Keith Weatherhead
Hydrology 2024, 11(3), 33; https://doi.org/10.3390/hydrology11030033 - 27 Feb 2024
Viewed by 1200
Abstract
Rising demands and competition for water resources within all sectors are placing increasing pressure on the environment. Almost all direct abstractions in England require a licence (permit) from the regulatory authority, the Environment Agency. Assessing and setting ‘reasonable’ peak quantities of water that [...] Read more.
Rising demands and competition for water resources within all sectors are placing increasing pressure on the environment. Almost all direct abstractions in England require a licence (permit) from the regulatory authority, the Environment Agency. Assessing and setting ‘reasonable’ peak quantities of water that can be legally abstracted in an environmentally sustainable manner is central to the whole licence determination process. To protect environmental flows and other abstractors within each catchment, the regulatory authority needs to be able to set sensible limits in the licence conditions, including total seasonal volumes and peak rates of water use, particularly for abstractions from hydrologically sensitive surface water sources. This paper describes the development of a methodology to assess the ‘reasonable’ peak rates of water use for agricultural irrigation in support of catchment water resources management and planning. A daily time step water balance model was used to simulate peak monthly and daily water requirements for irrigation using long-term historical weather records for agroclimatically contrasting sites. The model-simulated outputs were then compared against observed data from selected case study farms, and against data reported in a national water abstraction database. Guidelines were then developed for setting peak monthly, daily, hourly, and absolute abstraction rates for irrigation, taking into account the environmental sensitivity of different types of water source. The application of the procedure and its relevance in other countries where catchment water resources are under intense pressure from agriculture are described. Full article
(This article belongs to the Topic Hydrology and Water Resources Management)
Show Figures

Figure 1

23 pages, 15596 KiB  
Article
Geospatial Insights into Aridity Conditions: MODIS Products and GIS Modeling in Northeast Brazil
by Jhon Lennon Bezerra da Silva, Marcos Vinícius da Silva, Alexandre Maniçoba da Rosa Ferraz Jardim, Pabrício Marcos Oliveira Lopes, Henrique Fonseca Elias de Oliveira, Josef Augusto Oberdan Souza Silva, Márcio Mesquita, Ailton Alves de Carvalho, Alan Cézar Bezerra, José Francisco de Oliveira-Júnior, Maria Beatriz Ferreira, Iara Tamires Rodrigues Cavalcante, Elania Freire da Silva and Geber Barbosa de Albuquerque Moura
Hydrology 2024, 11(3), 32; https://doi.org/10.3390/hydrology11030032 - 26 Feb 2024
Viewed by 1403
Abstract
Northeast Brazil (NEB), particularly its semiarid region, represents an area highly susceptible to the impacts of climate change, including severe droughts, and intense anthropogenic activities. These stresses may be accelerating environmental degradation and desertification of soil in NEB. The main aim of this [...] Read more.
Northeast Brazil (NEB), particularly its semiarid region, represents an area highly susceptible to the impacts of climate change, including severe droughts, and intense anthropogenic activities. These stresses may be accelerating environmental degradation and desertification of soil in NEB. The main aim of this study was to gain geospatial insights into the biophysical parameters of surface energy balance and actual evapotranspiration on a multi-temporal scale, aiming to detect and analyze the spectral behavioral patterns of areas vulnerable to degradation processes, based on thematic maps at the surface, for NEB and mainly the semiarid region of NEB from 2000 to 2019. Geospatial data from 8-day MODIS sensor products were used, such as surface reflectance (Terra/MOD09A1 and Aqua/MYD09A1), surface temperature (Terra/MOD11A2 and Aqua/MYD11A2), and actual evapotranspiration (Terra/MOD16A2 and Aqua/MYD16A2), version 6. Therefore, in this study, pixel-to-pixel values were processed by calculating the average pixel statistics for each year. From the reflectance product, digital processing of the surface albedo and spectral vegetation indices was also carried out, using computational programming scripts and machine learning algorithms developed via the Google Earth Engine (GEE) platform. The study also presents a seasonal analysis of these components and their relationships over 20 years. Through vegetation indices and statistical correlations, a new predictive model of actual evapotranspiration was developed. The quantitative and spatiotemporal spectral patterns of the parameters were assessed through descriptive statistics, measures of central tendency and dispersion, and statistical error analyses and correlation indices. Thematic maps highlighted the pixel-to-pixel results, with patterns of high temperature distribution mainly in the central and northeastern part of NEB and the semiarid region of NEB, highlighting the formation of persistent heat islands over time. Meanwhile, in these areas, the maps of actual evapotranspiration showed a drastic reduction due to the lesser availability of energy. Over time, the semiarid region of NEB presented areas with little and/or no vegetation cover, which were highly well-defined between the years 2012 and 2019, confirming that these areas are extremely vulnerable to degradation and desertification processes due to significant loss of vegetative and water resilience. The components of energy balance were highly interconnected to climatological and environmental conditions, showing the severe results of drought and accentuation of the water deficit in NEB, presenting a greater condition of aridity in the semiarid region of NEB over time. Full article
(This article belongs to the Special Issue GIS Modelling of Evapotranspiration with Remote Sensing)
Show Figures

Figure 1

33 pages, 10840 KiB  
Article
Hydrometeorological Trends in a Low-Gradient Forested Watershed on the Southeastern Atlantic Coastal Plain in the USA
by Devendra M. Amatya, Timothy J. Callahan, Sourav Mukherjee, Charles A. Harrison, Carl C. Trettin, Andrzej Wałęga, Dariusz Młyński and Kristen D. Emmett
Hydrology 2024, 11(3), 31; https://doi.org/10.3390/hydrology11030031 - 26 Feb 2024
Viewed by 1334
Abstract
Hydrology and meteorological data from relatively undisturbed watersheds aid in identifying effects on ecosystem services, tracking hydroclimatic trends, and reducing model uncertainties. Sustainable forest, water, and infrastructure management depends on assessing the impacts of extreme events and land use change on flooding, droughts, [...] Read more.
Hydrology and meteorological data from relatively undisturbed watersheds aid in identifying effects on ecosystem services, tracking hydroclimatic trends, and reducing model uncertainties. Sustainable forest, water, and infrastructure management depends on assessing the impacts of extreme events and land use change on flooding, droughts, and biogeochemical processes. For example, global climate models predict more frequent high-intensity storms and longer dry periods for the southeastern USA. We summarized 17 years (2005–2021) of hydrometeorological data recorded in the 52 km2, third-order Turkey Creek watershed at the Santee Experimental Forest (SEF), Southeastern Coastal Plain, USA. This is a non-tidal headwater system of the Charleston Harbor estuary. The study period included a wide range of weather conditions; annual precipitation (P) and potential evapotranspiration (PET) ranged from 994 mm and 1212 mm in 2007 to 2243 mm and 1063 in 2015, respectively. The annual runoff coefficient (ROC) varied from 0.09 in 2007 (with water table (WT) as deep as 2.4 m below surface) to 0.52 in 2015 (with frequently ponded WT conditions), with an average of 0.22. Although the average P (1470 mm) was 11% higher than the historic 1964–1976 average (1320 mm), no significant (α= 0.05) trend was found in the annual P (p = 0.11), ROC (p = 0.17) or runoff (p = 0.27). Runoff occurred on 76.4% of all days in the study period, exceeding 20 mm/day for 1.25% of all days, mostly due to intense storms in the summer and lower ET demand in the winter. No-flow conditions were common during most of the summer growing season. WT recharge occurred during water-surplus conditions, and storm-event base flow contributed 23–47% of the total runoff as estimated using a hydrograph separation method. Storm-event peak discharge in the Turkey Creek was dominated by shallow subsurface runoff and was correlated with 48 h precipitation totals. Estimated precipitation intensity–duration–frequency and flood frequency relationships were found to be larger than those found by NOAA for the 1893–2002 period (for durations ≥ 3 h), and by USGS regional frequencies (for ≥10-year return intervals), respectively, for the same location. We recommend an integrated analysis of these data together with available water quality data to (1) assess the impacts of rising tides on the hydroperiod and biogeochemical processes in riparian forests of the estuary headwaters, (2) validate rainfall–runoff models including watershed scale models to assess land use and climate change on hydrology and water quality, and (3) inform watershed restoration goals, strategies, and infrastructure design in coastal watersheds. Full article
(This article belongs to the Special Issue Forest Hydrometeorology)
Show Figures

Figure 1

25 pages, 6650 KiB  
Article
Climate and Land Use/Land Cover Changes within the Sota Catchment (Benin, West Africa)
by Kevin S. Sambieni, Fabien C. C. Hountondji, Luc O. Sintondji, Nicola Fohrer, Séverin Biaou and Coffi Leonce Geoffroy Sossa
Hydrology 2024, 11(3), 30; https://doi.org/10.3390/hydrology11030030 - 23 Feb 2024
Cited by 1 | Viewed by 1462
Abstract
Climate and land cover changes are key factors in river basins’ management. This study investigates on the one hand 60-year (1960 to 2019) rainfall and temperature variability using station data combined with gridded data, and on the other hand land cover changes for [...] Read more.
Climate and land cover changes are key factors in river basins’ management. This study investigates on the one hand 60-year (1960 to 2019) rainfall and temperature variability using station data combined with gridded data, and on the other hand land cover changes for the years 1990, 2005, and 2020 in the Sota catchment (13,410 km2, North Benin, West Africa). The climate period is different from the chosen land use change period due to the unavailability of satellite images. Standardized anomaly index, break points, trend analysis, and Thiessen’s polygon were applied. Satellite images were processed and ground truthing was carried out to assess land cover changes. The analyses revealed a wet period from 1960 to 1972, a dry period from 1973 to 1987, and another wet period from 1988 to 2019. The annual rainfall decreases from the south to the north of the catchment. In addition, rainfall showed a non-significant trend over the study period, and no significant changes were identified between the two normals (1960–1989 and 1990–2019) at catchment scale, although some individual stations exhibited significant trends. Temperatures, in contrast, showed a significant increasing trend over the study period at catchment scale, with significant break points in 1978, 1990, and 2004 for Tmax, and 1989 for Tmin. An increase of 0.4 °C and 1.2 °C is noted, respectively, for Tmax and Tmin between the two normals. The study also revealed increases in agricultural areas (212.1%), settlements (76.6%), waterbodies (2.9%), and baresoil (52%) against decreases in woodland (49.6%), dense forest (42.2%), gallery forest (21.2%), and savanna (31.9%) from 1990 to 2020. These changes in climate and land cover will have implications for the region. Appropriate adaptation measures, including Integrated Water Resources Management and afforestation, are required. Full article
(This article belongs to the Special Issue Trends and Variations in Hydroclimatic Variables)
Show Figures

Figure 1

Previous Issue
Next Issue
Back to TopTop