Next Issue
Volume 11, April
Previous Issue
Volume 11, February


Climate, Volume 11, Issue 3 (March 2023) – 27 articles

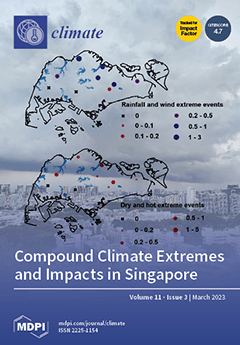
Cover Story (view full-size image): Compound weather and climate extremes have amplified impacts on natural and socioeconomic systems across the world, including Singapore. Based on the analysis of long-term observations over the period 1985–2020, it was found that the north and northeastern parts of Singapore were focal points for both compound rainfall and wind speed extremes, as well as dry and hot extremes, occurring with a higher frequency compared to the southwest of the island.  An upward trend was also detected for mild and moderate levels of both compound climate extremes. Singapore has benefited from investments in enhanced water infrastructure; water resource availability is now less affected; and flash floods are not proportionally related to the severity of climate extremes. The forests that form part of the urban landscape also exhibit resilience to drought. View this paper
  • Issues are regarded as officially published after their release is announced to the table of contents alert mailing list.
  • You may sign up for e-mail alerts to receive table of contents of newly released issues.
  • PDF is the official format for papers published in both, html and pdf forms. To view the papers in pdf format, click on the "PDF Full-text" link, and use the free Adobe Reader to open them.
Order results
Result details
Section
Select all
Export citation of selected articles as:
25 pages, 1389 KiB  
Article
Climate-Induced Non-Economic Loss and Damage: Understanding Policy Responses, Challenges, and Future Directions in Pacific Small Island Developing States
by Alvin Chandra, Karen E. McNamara, Rachel Clissold, Tammy Tabe and Ross Westoby
Climate 2023, 11(3), 74; https://doi.org/10.3390/cli11030074 - 20 Mar 2023
Cited by 4 | Viewed by 4782
Abstract
Despite mitigation and adaptation efforts, the residual risks of climate change will continue to impact the most vulnerable communities globally. Highly exposed regions, such as the Pacific Islands, will continue to experience profound negative loss and damage as a result of climate change, [...] Read more.
Despite mitigation and adaptation efforts, the residual risks of climate change will continue to impact the most vulnerable communities globally. Highly exposed regions, such as the Pacific Islands, will continue to experience profound negative loss and damage as a result of climate change, which will challenge current ways of life. Knowledge on the extent to which regional and national climate change polices can identify and respond to non-economic loss and damage (NELD) is limited. From the perspectives of stakeholders in the Pacific Islands region, this research aims to gain insights into how regional and national policies are responding to NELD, as the well as the barriers, shortcomings, and requirements for future responses. Utilising a mixed qualitative–quantitative approach, this research explores the perspectives of expert informants, including those from the government, donors and development partners, civil society, intergovernmental organisations, and other relevant bodies, such as universities. The key findings of this study indicate that current policy responses include a regional policy that integrates disaster and climate change losses, national efforts to preserve traditional and local knowledge, national adaptation and resilience planning, community-based projects, and relocation and resettlement. Additionally, NELD is a relatively new concept for policymakers, practitioners, and researchers, and it is difficult to conceptualise the diversity of issues related to NELD in the region. Owing to this poor understanding, a key gap relates to the dominance of the economic lens when characterising climate-induced impacts in the region. As such, there is a limited holistic consideration of climate change impacts, and thus a limited appreciation of the interrelated factors of NELD within policy responses that then cascade towards communities. Finally, the paper outlines key policy insights as follows: policies on integration, adaptation, resilience planning, relocation and resettlement have advanced; the economic lens dominates when characterising climate-induced impacts on the region; there is a limited appreciation of the interrelated factors of NELD; and there exists a need to account for residual and intangible losses to land, culture, traditional knowledge, biodiversity, ecosystem services, and human agency. The insights gained from this research can provide a practical basis for guiding local to regional action and help support and design comprehensive risk management solutions in order to address NELD associated with climate change. Full article
(This article belongs to the Collection Adaptation and Mitigation Practices and Frameworks)
Show Figures

Figure 1

15 pages, 6904 KiB  
Article
Analysis of Extreme Precipitation Events in the Mountainous Region of Rio de Janeiro, Brazil
by Maria del Carmen Sanz Lopez, Jorge Luiz Diaz Pinaya, Augusto José Pereira Filho, Fe-lipe Vemado and Fábio Augusto Gomes Vieira Reis
Climate 2023, 11(3), 73; https://doi.org/10.3390/cli11030073 - 20 Mar 2023
Cited by 7 | Viewed by 2253
Abstract
Extreme rainfall events cause diverse loss of life and economic losses. These disasters include flooding, landslides, and erosion. For these intense rainfall events, one can statistically estimate the time when a given rainfall volume will occur. Initially, this work estimated rainfall volumes for [...] Read more.
Extreme rainfall events cause diverse loss of life and economic losses. These disasters include flooding, landslides, and erosion. For these intense rainfall events, one can statistically estimate the time when a given rainfall volume will occur. Initially, this work estimated rainfall volumes for the mountainous region of Rio de Janeiro, and the frequency with which rainfall events occur. For this, we analyzed daily precipitation data using the ANOBES method and the Gumbel statistical distribution to estimate return times. Extreme prec’ipitation volumes of up to 240 mm per day were identified in some locations, with 100 years or more return periods. On 11 January 2011 precipitation volumes were high, but on 12 January they were extreme, similar to the 100-year return time data. The analysis method presented enables the determination of the return time of heavy rainfall, assisting in the prevention of its effects. Knowledge of the atmospheric configuration enables decision support. The atmospheric systems that combined to cause the event were local circulations (orographic and sea breeze) and large-scale systems (SACZ and frontal systems). Full article
(This article belongs to the Special Issue Severe Weather Disasters)
Show Figures

Figure 1

17 pages, 2739 KiB  
Article
Analysis of Snow Cover in the Sibillini Mountains in Central Italy
by Matteo Gentilucci, Andrea Catorci, Tiziana Panichella, Sara Moscatelli, Younes Hamed, Rim Missaoui and Gilberto Pambianchi
Climate 2023, 11(3), 72; https://doi.org/10.3390/cli11030072 - 19 Mar 2023
Cited by 5 | Viewed by 1863
Abstract
Research on solid precipitation and snow cover, especially in mountainous areas, suffers from problems related to the lack of on-site observations and the low reliability of measurements, which is often due to instruments that are not suitable for the environmental conditions. In this [...] Read more.
Research on solid precipitation and snow cover, especially in mountainous areas, suffers from problems related to the lack of on-site observations and the low reliability of measurements, which is often due to instruments that are not suitable for the environmental conditions. In this context, the study area is the Monti Sibillini National Park, and it is no exception, as it is a mountainous area located in central Italy, where the measurements are scarce and fragmented. The purpose of this research is to provide a characterization of the snow cover with regard to maximum annual snow depth, average snow depth during the snowy period, and days with snow cover on the ground in the Monti Sibillini National Park area, by means of ground weather stations, and also analyzing any trends over the last 30 years. For this research, in order to obtain reliable snow cover data, only data from weather stations equipped with a sonar system and manual weather stations, where the surveyor goes to the site each morning and checks the thickness of the snowpack and records, it were collected. The data were collected from 1 November to 30 April each year for 30 years, from 1991 to 2020; six weather stations were taken into account, while four more were added as of 1 January 2010. The longer period was used to assess possible ongoing trends, which proved to be very heterogeneous in the results, predominantly negative in the case of days with snow cover on the ground, while trends were predominantly positive for maximum annual snow depth and distributed between positive and negative for the average annual snow depth. The shorter period, 2010–2022, on the other hand, ensured the presence of a larger number of weather stations and was used to assess the correlation and presence of clusters between the various weather stations and, consequently, in the study area. Furthermore, in this way, an up-to-date nivometric classification of the study area was obtained (in terms of days with snow on the ground, maximum height of snowpack, and average height of snowpack), filling a gap where there had been no nivometric study in the aforementioned area. The interpolations were processed using geostatistical techniques such as co-kriging with altitude as an independent variable, allowing fairly precise spatialization, analyzing the results of cross-validation. This analysis could be a useful tool for hydrological modeling of the area, as well as having a clear use related to tourism and vegetation, which is extremely influenced by the nivometric variables in its phenology. In addition, this analysis could also be considered a starting point for the calibration of more recent satellite products dedicated to snow cover detection, in order to further improve the compiled climate characterization. Full article
(This article belongs to the Special Issue Regional Special Issue: Climate Change in Italy)
Show Figures

Figure 1

8 pages, 225 KiB  
Communication
The Little Ice Age and the Fall of the Ming Dynasty: A Review
by Ka-wai Fan
Climate 2023, 11(3), 71; https://doi.org/10.3390/cli11030071 - 17 Mar 2023
Cited by 4 | Viewed by 14142
Abstract
Based on the climate proxy data, several recent studies have concluded that the Ming dynasty’s reign in China coincided with the Little Ice Age, a global crisis. In response, scholars have published several reports in recent years addressing this topic. This paper presents [...] Read more.
Based on the climate proxy data, several recent studies have concluded that the Ming dynasty’s reign in China coincided with the Little Ice Age, a global crisis. In response, scholars have published several reports in recent years addressing this topic. This paper presents a comprehensive overview of the current research findings in English regarding this subject and identifies existing research gaps. The author proposes that the impact of climate on different regions during the late Ming period remains largely underexplored. Furthermore, scholars must exercise caution when assuming that adverse climatic conditions uniformly impacted the Ming empire during the Little Ice Age. This paper also highlights the use of simplistic models by scholars linking cold and dry climates to crop failure, floods, droughts, population decline, and other factors. However, any straightforward models that presume causal determination risk ignoring historical facts. Full article
21 pages, 7254 KiB  
Article
Sea Level Variability in the Equatorial Malacca Strait: The Influence of Climatic–Oceanographic Factors and Its Implications for Tidal Properties in the Estuarine Zone
by Ulung Jantama Wisha, Yusuf Jati Wijaya and Yukiharu Hisaki
Climate 2023, 11(3), 70; https://doi.org/10.3390/cli11030070 - 16 Mar 2023
Cited by 4 | Viewed by 3617
Abstract
The sea level trend in the equatorial Malacca Strait is a significant issue that needs to be reviewed since it is an area of interest. Assessing its future impact on estuarine tidal characteristics is worth studying because it relates to the potency of [...] Read more.
The sea level trend in the equatorial Malacca Strait is a significant issue that needs to be reviewed since it is an area of interest. Assessing its future impact on estuarine tidal characteristics is worth studying because it relates to the potency of coastal damages. This study aimed to discuss the relationship between sea level variations and anomalies and their possible triggering factors and to estimate the future impacts on the tidal properties in the estuarine zone. Tide gauge and altimetry data in the Tanjong Pagar site were used to assess the sea level trends over 27 years of observation (from 1992 to 2019). Both altimetry and tide gauge data showed an upward trend, with 0.24 cm/year and 0.39 cm/year, respectively. Due to the near-equatorial area of interest, sea level variability is more synchronized with ENSO rather than IOD. At some points, ENSO shapes the sea level fluctuation, with an R2 of less than 10%. For specific periods, the coupling effects between MJO and La Niña may trigger higher evaporation in the maritime continent, triggering increasing sea levels. Of particular concern, among the other assessed factors, the zonal currents and winds (wind-driven currents) are strongly correlated with sea level variations, primarily during the NE monsoon and the second transitional periods, with a determination coefficient of about 18–36%. As a result of sea level rises, it is estimated that tidal constituent amplitudes will increase by about 8.9% and 18.3% in 2050 and 2100, respectively. The increase in tidal range will possibly relate to the tidal bore passage in the Kampar estuary. Therefore, more advanced hydrodynamic modeling is necessary to determine the impact of sea level rises on tidal bore generation. Full article
Show Figures

Figure 1

21 pages, 12170 KiB  
Article
Wind Characteristics and Temporal Trends in Eastern Paraná State, Brazil
by Paulo Miguel de Bodas Terassi, Washington Luiz Félix Correia Filho, Emerson Galvani, Antonio Carlos da Silva Oscar-Júnior, Bruno Serafini Sobral, Givanildo de Gois, Vitor Hugo Rosa Biffi and José Francisco de Oliveira Júnior
Climate 2023, 11(3), 69; https://doi.org/10.3390/cli11030069 - 15 Mar 2023
Cited by 1 | Viewed by 2661
Abstract
The wind is one of the most important and studied variables globally, essential to several sectors, for example, energy. Therefore, this study assesses the wind regime and analysis trends in three locations within the Paraná state, Brazil. The historical series were recorded between [...] Read more.
The wind is one of the most important and studied variables globally, essential to several sectors, for example, energy. Therefore, this study assesses the wind regime and analysis trends in three locations within the Paraná state, Brazil. The historical series were recorded between 1976 and 2010 at conventional meteorological stations belonging to the Brazilian National Institute of Meteorology. WRPLOT version 8.0.0 software was used for elaborating wind roses and histograms in the annual and seasonal scales. Detection of trends and temporal rupture points was performed using different statistical methods (Run, Mann–Kendall, Pettitt and Shapiro–Wilk tests) for all meteorological stations. All statistical tests were conducted using the R software version 3.3.2. On a seasonal scale, summer and spring present the highest wind speeds in the Curitiba and Paranaguá stations due to meteorological systems on different scales, such as the South Atlantic subtropical anticyclone and frontal systems. The Mann–Kendall test revealed that Castro presented statistical significance in reducing wind speed, with a decrease of 0.23 m/s per decade for the annual scale and 0.23 m/s per decade during the autumn season. These ruptures indicated a decrease in wind speed in Curitiba and Paranaguá for the spring season. The Pettitt test revealed a break point detection in the data series in Curitiba station, likely due to urban expansion that started in the 1980s, reducing wind speed, especially in winter and spring. These trends and ruptures revealed a significant reduction in wind speed, possibly due to the interaction between natural climate changes and the increase in surface roughness resulting from land use and urbanization changes. Full article
Show Figures

Figure 1

15 pages, 5860 KiB  
Article
Mediterranean Influence on the Climatic Regime over the Balkan Peninsula from 1901–2021
by Elisaveta Peneva, Mirna Matov and Milen Tsekov
Climate 2023, 11(3), 68; https://doi.org/10.3390/cli11030068 - 15 Mar 2023
Cited by 5 | Viewed by 2829
Abstract
The Balkan Peninsula is a geographical region under various large-scale climatic influences, one of the most significant being the Mediterranean Sea in the southwest and the continent in the northeast. The novelty of this study is that the border between the zones with [...] Read more.
The Balkan Peninsula is a geographical region under various large-scale climatic influences, one of the most significant being the Mediterranean Sea in the southwest and the continent in the northeast. The novelty of this study is that the border between the zones with prevailing maritime or continental climate conditions is clearly identified by the month with the highest precipitation during the year. We use the gridded data product TS_4.06 of the Climatic Research Unit for monthly precipitation to identify the timing of the maximum rainfall at different locations. The grid boxes with highest precipitation in the cold part of the year (October to March) are considered to be under prevailing Mediterranean influences and, on the contrary, the ones with the highest precipitation are in the warm part of the year (April to September); these are climates with prevailing continental characteristics. In general, this border separates the zones with Cs and Dw types of climates. Its spatial variability at a decadal time-scale is discussed for the period from 1901–2021 and a general weakening of the Mediterranean influence over the Balkan Peninsula is found. However, for the last three decades, from 1991–2021, the tendency is the opposite. A periodicity of ~20 years is identified, suggesting that during the decade of 2020–2030, the Mediterranean influence in this region will dominate. Full article
(This article belongs to the Special Issue Climate Variability in the Mediterranean Region)
Show Figures

Figure 1

20 pages, 4572 KiB  
Article
Trend Analysis and Fluctuations of Winter Temperature over Saudi Arabia
by Motirh Al-Mutairi, Abdulhaleem Labban, Abdallah Abdeldym and Heshmat Abdel Basset
Climate 2023, 11(3), 67; https://doi.org/10.3390/cli11030067 - 13 Mar 2023
Cited by 8 | Viewed by 2470
Abstract
The aim of this work is to study the variability of winter (monthly mean of DJF) air temperatures in Saudi Arabia. The study of the coefficient of variation (CV) of winter air temperature time series shows that the CV is a function of [...] Read more.
The aim of this work is to study the variability of winter (monthly mean of DJF) air temperatures in Saudi Arabia. The study of the coefficient of variation (CV) of winter air temperature time series shows that the CV is a function of latitude, decreasing generally gradually from north to south. The highest values of CV during the winter season are mainly because of the migrating extratropical cyclones (Mediterranean cyclones) from west to east, and active subtropical jet, as well as the polar jet. The trend analysis illustrates that all stations have positive trends for the wintertime series. The study of decadal fluctuations in the behavior of winter temperature shows that the period from 1982 to 2010 is characterized in general by negative trend values in most northern stations of Saudi Arabia. In the middle of Saudi Arabia, negative trend values also appear but for the period 1983 to 2003. The southern and middle stations are distinguished by a positive trend during the period from 2003 to 2018. Full article
(This article belongs to the Section Climate and Environment)
Show Figures

Figure 1

15 pages, 3924 KiB  
Article
Salinity Intrusion Trends under the Impacts of Upstream Discharge and Sea Level Rise along the Co Chien River and Hau River in the Vietnamese Mekong Delta
by Tuu Nguyen Thanh, Hiep Huynh Van, Hoang Vo Minh and Van Pham Dang Tri
Climate 2023, 11(3), 66; https://doi.org/10.3390/cli11030066 - 13 Mar 2023
Cited by 5 | Viewed by 3508
Abstract
A one-dimensional hydraulic HEC-RAS model was developed to forecast the change in salinity in the tributaries of the Co Chien and Hau Rivers in Tra Vinh province, Vietnam. The boundary data includes river discharge at Can Tho and My Thuan, water levels, and [...] Read more.
A one-dimensional hydraulic HEC-RAS model was developed to forecast the change in salinity in the tributaries of the Co Chien and Hau Rivers in Tra Vinh province, Vietnam. The boundary data includes river discharge at Can Tho and My Thuan, water levels, and salinity at coastal monitoring stations. Six monitoring stations along the Co Chien River and Hau River were selected to study salinity changes. Four scenarios for the period 2020–2050 were selected, including SLR17, SLR22, SLR26L, and SLR26H, corresponding to sea level rise (17, 22, and 26 cm) and upstream river discharge decrease (in the ranges of 100–128% and 80–117% at Can Tho and My Thuan, respectively) in the dry season based on new climate change scenarios in Vietnam and previous studies. The results highlight that when the average discharge at Can Tho and My Thuan reduces, the salinity increases more significantly than the impact of sea level rise. Salinity at the monitoring stations in Tra Vinh province is projected to increase within the ranges of 4–21% and 3–29% along the Co Chien River and Hau River, respectively. In addition, sea level rise is seen to affect the discharge distribution into the Co Chien River. It suggests an urgent need to raise farmers’ awareness of climate change adaptation, investment in production equipment, and appropriate regulation of riverbed mining and activities upstream in the Mekong River. Full article
Show Figures

Figure 1

13 pages, 1228 KiB  
Article
Application of Sustainable Livelihood Approach (SLA) to Address Climate-Induced Risks through the Lens of Africa Borderland
by Aki Kogachi and Rajib Shaw
Climate 2023, 11(3), 65; https://doi.org/10.3390/cli11030065 - 12 Mar 2023
Cited by 2 | Viewed by 2665
Abstract
The objective of this study is to gain a holistic and enhanced understanding of the characteristics of the livelihood of communities in the Liptako-Gourma region. This region, known for the tri-border area, has become the epicenter of the conflict since 2015. The study [...] Read more.
The objective of this study is to gain a holistic and enhanced understanding of the characteristics of the livelihood of communities in the Liptako-Gourma region. This region, known for the tri-border area, has become the epicenter of the conflict since 2015. The study employs the Sustainable Livelihood Approach to guide survey results, as well as a focus group discussion. The results of the survey are analyzed to assess the linkage between climate-induced risks and development challenges in the region. Furthermore, the paper explores the interactions between climatic stresses and conflict risk. By taking the Liptako-Gourma region (Mali, Niger, and Burkina Faso) as a focal study and analyzing the factors impacting the livelihoods of people in the region, a survey was conducted. It included questions related to agriculture, animal husbandry, and natural resource management, among other things. The survey had seven sections and was conducted with 287 people aged between 25 to 77 years from Bagawa and Tin-Akoff. Climate perceptions were evaluated through individual and group interviews. The result from the cohort study showed a close association between security and developmental challenges in the Liptako-Gourma region. This is due to the region’s reliance on agriculture and animal husbandry, which involves frequent migration and population movement across the borders. Furthermore, the study revealed that (1) climate-induced shocks are increasingly manifested, (2) the adaptive capacity to weather climate shock remains low, (3) mobility and migration is a common strategy, and (4) the conflict over the usage of natural resources exists; however, it is not the primary cause of conflicts. Full article
Show Figures

Figure 1

12 pages, 3216 KiB  
Article
D-SPARC: Rapid Field Albedo Measurement
by Sushobhan Sen and Jeffery Roesler
Climate 2023, 11(3), 64; https://doi.org/10.3390/cli11030064 - 11 Mar 2023
Viewed by 1662
Abstract
The albedo of surfaces in urban areas plays an important role in regulating the urban microclimate and needs to be measured. Artificial urban surfaces, e.g., pavements with lower albedo than natural surfaces such as grass or soil, are a key contributor to the [...] Read more.
The albedo of surfaces in urban areas plays an important role in regulating the urban microclimate and needs to be measured. Artificial urban surfaces, e.g., pavements with lower albedo than natural surfaces such as grass or soil, are a key contributor to the Urban Heat Island (UHI) effect. However, widespread measurement of pavement albedo in the field remains challenging due to limited available daylight hours to record the measurements, the need for clear sky conditions, and slow data collection speed. A new portable system called Discrete SPectrAl RefleCtometer (D-SPARC) was developed to overcome these difficulties. D-SPARC was calibrated in the lab using 25 concrete specimens of known albedo and found to be accurate to within ±0.05, which is similar or better than recently developed aerial or satellite methods. The calibrated D-SPARC device was then used to acquire measurements on ten pavement sections during both the day and night and compared to the results from an albedometer. The RMSE during the day was 0.06 and during the night was 0.02. Each measurement with D-SPARC took about 4 min per test location as compared to 15 min with the albedometer. D-SPARC can be used to conveniently and rapidly measure pavement albedo over a road network with reasonable accuracy and minimal traffic disruption. Full article
Show Figures

Figure 1

12 pages, 4562 KiB  
Communication
Observation of an Extremely Dry Atmospheric Air Column above Bern
by Klemens Hocke and Wenyue Wang
Climate 2023, 11(3), 63; https://doi.org/10.3390/cli11030063 - 10 Mar 2023
Viewed by 1496
Abstract
The water vapour column density or vertically integrated water vapour (IWV) ranges from about 8 mm in winter to about 25 mm in summer in Bern, Switzerland. However, there can be day episodes when IWV drops to 2 mm or even less so [...] Read more.
The water vapour column density or vertically integrated water vapour (IWV) ranges from about 8 mm in winter to about 25 mm in summer in Bern, Switzerland. However, there can be day episodes when IWV drops to 2 mm or even less so that the atmosphere is extremely dry. We selected an event in February 2021 when the tropospheric water radiometer TROWARA measured a mean IWV value of about 1.5 ± 0.2 mm for a time interval of about one day in Bern. The ECMWF reanalysis ERA5 indicated a slightly higher IWV value of about 2.2 ± 0.4 mm where the uncertainty is the standard deviation of IWV during the time of IWV depression. The ERA5 profiles of relative humidity and specific humidity during this episode are reduced by 50% and more compared to the monthly mean profiles. On a global map, it can be seen that Bern is within a mesoscale dry region on that day with descending wind. Back trajectory analysis gives the result that the dry air masses in Bern came from the North and the trajectories are descending in altitude so that dry air from the mid troposphere came into the lower troposphere. These descending air masses from the North explain the minimum of IWV observed in Bern on 13–14 February 2021. The surface climate in Switzerland was dominated by a cold wave at that time. At the same time, severe cold waves occurred in Greece and Northern America. Full article
(This article belongs to the Special Issue Climate: 10th Anniversary)
Show Figures

Figure 1

28 pages, 1756 KiB  
Communication
Can a Symbolic Mega-Unit of Radiative Forcing (RF) Improve Understanding and Assessment of Global Warming and of Mitigation Methods Using Albedo Enhancement from Algae, Cloud, and Land (AEfACL)?
by Kenneth D. Lightburn
Climate 2023, 11(3), 62; https://doi.org/10.3390/cli11030062 - 7 Mar 2023
Cited by 1 | Viewed by 5587 | Correction
Abstract
By expressing radiative forcing (RF) in a symbolic mega-unit we better communicate, to governing organizations and the public, the extent of global warming (GW) and the potency of mitigation methods while also ‘translating’ different GW measures to better explain their interrelationship. An easily [...] Read more.
By expressing radiative forcing (RF) in a symbolic mega-unit we better communicate, to governing organizations and the public, the extent of global warming (GW) and the potency of mitigation methods while also ‘translating’ different GW measures to better explain their interrelationship. An easily visualized symbol that has been suggested is the net shading, or mega-unit, of RF of a “standard 1 km2 cumulus cloud over one day of −25 W/m2” (ScCd). As defined, ScCd is equal to 600,000 kWh and equivalent to Temporary heat radiation Equivalent Carbon (ThrEC) of 18,400 tons of carbon heat effect, or 67,300 tons of CO2 and an approximately 0.136 albedo increase, over 1 km2. Shading over the whole earth caused by clouds is estimated by NASA as −13 W/m2. The excess of solar radiation or Earth Energy Imbalance (EEI) striking the earth was + 1.12 W/m2 in mid-2019 and has been continually increasing. Offsetting this requires the creation of additional reflective surfaces equivalent to 22.848 million square kilometers of ScCd. Such an increase could be provided by albedo enhancement from algae on the ocean surface, marine cloud brightening (MCB) or new marine cloud creation, or land area use that rejuvenates salt flats and similar locations (AEfACL). These are potentially politically acceptable and eventually could be achieved at large enough scale to be effective globally. Full article
(This article belongs to the Section Climate and Environment)
Show Figures

Figure 1

15 pages, 1925 KiB  
Article
Dynamic Modeling of the Trophic Status of an Urban Tropical Wetland under ENSO Conditions
by Leidy Gisselle García-León, Julio Eduardo Beltrán-Vargas and Carlos Alfonso Zafra-Mejía
Climate 2023, 11(3), 61; https://doi.org/10.3390/cli11030061 - 7 Mar 2023
Cited by 2 | Viewed by 2064
Abstract
The climate variability associated with the ENSO phenomenon has a significant impact on wetlands, affecting the total precipitation input and hydrological flows of these ecosystems. The objective of this paper is to study the trophic status variation of an urban tropical wetland under [...] Read more.
The climate variability associated with the ENSO phenomenon has a significant impact on wetlands, affecting the total precipitation input and hydrological flows of these ecosystems. The objective of this paper is to study the trophic status variation of an urban tropical wetland under ENSO conditions, through dynamic modeling. The results suggest an increase in precipitation, by 3.32 times, during the La Niña phase compared to the El Niño phase. Wetland input total phosphorus (TP) concentrations are 1.85 times lower during La Niña. This is probably due to a dilution effect exerted by the increase in surface runoff volumes from the basin. The findings suggest a reduction in wetland hydraulic retention time (HRT) during La Niña (1.33 times) compared to El Niño. This trend causes the TP concentration inside the wetland to decrease, possibly due to an increase in the water volume stored (dilution), and by the exit of this nutrient due to a shorter hydraulic renewal (HRT/La Niña < HRT/El Niño). The occurrence of a high input of TP concentration to the wetland does not necessarily indicate a high trophic status index (TSI). This is because the trophic status of the wetland is possibly more associated with HRT rather than input TP concentration. The trophic status of the wetland during the La Niña tends to be eutrophic. Lastly, under ENSO scenarios, the use of Aizaki’s method is suggested, because it considers HRT as a decisive factor for the calculation of wetland trophic status. Full article
Show Figures

Figure 1

18 pages, 5426 KiB  
Article
Reviewing the Status of Droughts, Early Warning Systems and Climate Services in South India: Experiences Learned
by Punnoli Dhanya and Vellingiri Geethalakshmi
Climate 2023, 11(3), 60; https://doi.org/10.3390/cli11030060 - 6 Mar 2023
Cited by 4 | Viewed by 3076
Abstract
Drought is one of the most challenging disasters that impact the natural and cultural ecosystems across the world, especially in the climate dependent sectors of arid and semi-arid areas. The aim of this article is to share the experiences gained and enhance the [...] Read more.
Drought is one of the most challenging disasters that impact the natural and cultural ecosystems across the world, especially in the climate dependent sectors of arid and semi-arid areas. The aim of this article is to share the experiences gained and enhance the readers’ awareness on the status of drought and process of the early warning systems (EWS) in south India. Drought status of three agroecologically different states is included in this article, such as Kerala, Tamil Nadu and Telangana. As far as Tamil Nadu is concerned, Karur, Thuthukudi, Krishnagiri, Namakkal, Trichy and Thirunelveli districts are water scarce compared to other districts in the state. The districts such as Wayanad, Thiruvananthapuram, Idukki and Palakkad in Kerala have received lesser rainfall compared to the other parts of the state during the period 1981 to 2019. In Telangana, the mandals such as Nagarkurnool, Jogulamba-Gadwal, Wanaparthy, Mahabubnagar Nalgonda and Yedadri are frequently hit by dry spells and droughts. As a case study, weather early warning dissemination, carried out at Parambikulam Aliyar basin, Coimbatore, Tamil Nadu, during Khariff and Rabi seasons, using IMDs medium and extended range forecast is also elaborated in particular in the article. As far as the accuracy of forecast is concerned, probability of false detection (false alarm rate) was found to be 0.81 for Khariff and 0.30 for Rabi season, indicating the need for better performance in the accuracy of dry spell early warning, disaster preparedness and response. In-spite of this, access to early warning has supported the farmers during harvest and land preparation with a utility score of 72% and 59%, respectively. In Parambikulam Aliyar basin, remote sensing products such as MODIS-NDVI, NDWI and TWI was also used to identify the real-time progression of monthly vegetative condition for Kharif and Rabi seasons. NDVI values were used to monitor the district level vegetation condition and compared it with the drought year 2016, the difference in area under barren land was 76% less during Khariff, 2021 and 44% during Rabi, 2021.This study is a compilation of lessons learned from different states and the existing knowledge and practice in early warnings, and recommends the need for a holistic approach in drought and dry spell monitoring along with better accuracy and dissemination to minimize climate-related shocks in agriculture. Full article
(This article belongs to the Special Issue Drought Early Warning)
Show Figures

Figure 1

15 pages, 5064 KiB  
Review
Cut-Off Lows over South Africa: A Review
by Nkosinathi G. Xulu, Hector Chikoore, Mary-Jane M. Bopape, Thando Ndarana, Tshimbiluni P. Muofhe, Innocent L. Mbokodo, Rendani B. Munyai, Mukovhe V. Singo, Tumelo Mohomi, Sifiso M. S. Mbatha and Marshall L. Mdoka
Climate 2023, 11(3), 59; https://doi.org/10.3390/cli11030059 - 5 Mar 2023
Cited by 5 | Viewed by 9799
Abstract
Every year, cut-off low (COL) pressure systems produce severe weather conditions and heavy rainfall, often leading to flooding, devastation and disruption of socio-economic activities in South Africa. COLs are defined as cold-cored synoptic-scale mid-tropospheric low-pressure systems which occur in the mid-latitudes and cause [...] Read more.
Every year, cut-off low (COL) pressure systems produce severe weather conditions and heavy rainfall, often leading to flooding, devastation and disruption of socio-economic activities in South Africa. COLs are defined as cold-cored synoptic-scale mid-tropospheric low-pressure systems which occur in the mid-latitudes and cause persistent heavy rainfall. As they occur throughout the year, these weather systems are important rainfall producing systems that are also associated with extreme cold conditions and snowfalls. An in-depth review of COLs is critical due to their high impacts which affect some parts of the country regularly, affecting lives and livelihoods. Here, we provide a comprehensive review of the literature on COLs over the South African domain, whilst also comparing them with their Southern Hemisphere counterparts occurring in South America and Australia. We focus on the occurrence, development, propagation, dynamical processes and impacts of COLs on society and the environment. We also seek to understand stratospheric–tropospheric exchanges resulting from tropopause folding during the occurrence of COLs. Sometimes, COLs may extend to the surface, creating conditions conducive to extreme rainfall and high floods over South Africa, especially when impinged on the coastal escarpment. The slow propagation of COLs appears to be largely modulated by a quasi-stationary high-pressure system downstream acting as a blocking system. We also reviewed two severe COL events that occurred over the south and east coasts and found that in both cases, interactions of the low-level flow with the escarpment enhanced lifting and deep convection. It was also determined from the literature that several numerical weather prediction models struggle with placement and amounts of rainfall associated with COLs, both near the coast and on the interior plateau. Our study provides the single most comprehensive treatise that deals with COL characteristics affecting the South African domain. Full article
Show Figures

Figure 1

15 pages, 4399 KiB  
Article
Characteristics of Compound Climate Extremes and Impacts in Singapore, 1985–2020
by Jianjun Yu, Anupam Kumar, Kanhu Charan Pattnayak, Jeff Obbard and Aurel Florian Moise
Climate 2023, 11(3), 58; https://doi.org/10.3390/cli11030058 - 5 Mar 2023
Cited by 1 | Viewed by 2538
Abstract
Compound weather and climate extremes have amplified impacts on natural and socioeconomic systems across the world, including Singapore. To better understand the spatial and temporal characteristics of compound climate extremes, including concurrent rainfall and wind speed, as well as dry and hot conditions, [...] Read more.
Compound weather and climate extremes have amplified impacts on natural and socioeconomic systems across the world, including Singapore. To better understand the spatial and temporal characteristics of compound climate extremes, including concurrent rainfall and wind speed, as well as dry and hot conditions, we analyzed long-term observations from 11 selected meteorological stations over the period 1985–2020. The results revealed that the north and northeastern parts of Singapore were focal points for both types of compound extremes, with a higher frequency of occurrence than the southwest of the island. Concurrent rainfall and wind speed extremes were the most prominent in December and January thanks to the northeast monsoon, while dry and hot extremes were distributed mainly in the inter-monsoon season, with peaks in March and April. A notable upward trend was also detected for mild and moderate levels of both compound climate extremes over time. According to our review of the impacts, Singapore has benefited from investments in enhanced water infrastructure; water resource availability was less affected; and flash floods were not proportionally related to the severity of climate extremes. The forests in the urban landscape of Singapore also exhibit resilience to drought. Full article
(This article belongs to the Special Issue Subseasonal to Seasonal Climate Forecasting)
Show Figures

Figure 1

24 pages, 3748 KiB  
Article
Monitoring the Meteorological and Hydrological Droughts in the Largest River Basin (Mahaweli River) in Sri Lanka
by Udara Senatilleke, Jeewanthi Sirisena, Miyuru B. Gunathilake, Nitin Muttil and Upaka Rathnayake
Climate 2023, 11(3), 57; https://doi.org/10.3390/cli11030057 - 2 Mar 2023
Cited by 7 | Viewed by 2762
Abstract
This study assessed the meteorological and hydrological droughts and their relationship over 30 years from 1985 to 2015 in the largest river basin (Mahaweli River Basin (MRB)) in Sri Lanka. Data from 14 rainfall, 5 temperature, and 5 streamflow stations in and near [...] Read more.
This study assessed the meteorological and hydrological droughts and their relationship over 30 years from 1985 to 2015 in the largest river basin (Mahaweli River Basin (MRB)) in Sri Lanka. Data from 14 rainfall, 5 temperature, and 5 streamflow stations in and near the MRB were used in the present study. Universal drought indices including Standardized Precipitation Index (SPI) and Standardized Precipitation–Evapotranspiration Index (SPEI) were used to assess meteorological droughts. The Standardized Streamflow Index (SSI) was used in investigating hydrological droughts. Correlations between meteorological and hydrological droughts were obtained, annual variations were observed (in terms of SPI, SPEI, and SSI), and the spatial distributions of selected drought events were analyzed. Our results revealed that the highest correlation was found in long-term dry conditions in the wet zone. In addition, some negative correlations found showed the opposite behavior of correlations. Furthermore, in annual variations of droughts, extreme droughts were recorded in the dry zone as maximum values, while results were more prominent in the wet zone. In addition, the spatial distribution performed using SPI, SPEI, and SSI showed an extremely dry condition in 2004. Our findings are beneficial for policymaking and for the decision-makers in assessing meteorological and hydrological drought risks in the future. Full article
Show Figures

Figure 1

24 pages, 4412 KiB  
Article
Climate Scenarios for Coastal Flood Vulnerability Assessments: A Case Study for the Ligurian Coastal Region
by Alice Re, Lorenzo Minola and Alessandro Pezzoli
Climate 2023, 11(3), 56; https://doi.org/10.3390/cli11030056 - 1 Mar 2023
Cited by 3 | Viewed by 2989
Abstract
Extreme sea levels and coastal flooding are projected to be among the most uncertain and severe consequences of climate change. In response, a wide development of coastal vulnerability assessment methodologies has been observed in research to support societal resilience to future coastal flood [...] Read more.
Extreme sea levels and coastal flooding are projected to be among the most uncertain and severe consequences of climate change. In response, a wide development of coastal vulnerability assessment methodologies has been observed in research to support societal resilience to future coastal flood risks. This work aims to explore the scope of application of index-based methodologies for coastal vulnerability assessment, in terms of their suitability to convey information on variations in climate variables potentially leading to sea-level changes and inundation. For this purpose, the InVEST Coastal Vulnerability model was coupled for the first time with the ERA5 reanalysis and used to develop a case study assessment of the biophysical exposure component of vulnerability to coastal flooding for Liguria, an Italian coastal region facing the Mediterranean Sea. Different scenarios of wind speed and wave power were created in order to test the sensitivity of this approach to climate data inputs. The results support the applicability of this approach to provide a preliminary grasp of local vulnerability to coastal inundation. Yet, this work also highlights how the method’s data aggregation and indicator computation processes result in its insensitivity to wind and wave variations, and therefore in its unsuitability to reproduce climate scenarios. The implications of these findings for research methodology and regarding the operationalisation of vulnerability assessment results are discussed. Full article
(This article belongs to the Special Issue Climate Change and Responses for Water and Environmental Security)
Show Figures

Figure 1

18 pages, 16705 KiB  
Article
Application of Hydrological Modeling Related to the 2011 Disaster in the Mountainous Region of Rio De Janeiro, Brazil
by Marcia Chen, Marcio Cataldi and Cristiane Nunes Francisco
Climate 2023, 11(3), 55; https://doi.org/10.3390/cli11030055 - 26 Feb 2023
Cited by 4 | Viewed by 2213
Abstract
Natural disasters have been responsible for thousands of deaths in recent decades that, added to the environmental, social and economic impacts, require the implementation of prevention strategies. The largest share of disasters is of hydrological origin. In this context, hydrological models are potential [...] Read more.
Natural disasters have been responsible for thousands of deaths in recent decades that, added to the environmental, social and economic impacts, require the implementation of prevention strategies. The largest share of disasters is of hydrological origin. In this context, hydrological models are potential alternatives for monitoring and preventing events of this nature. The objective of this study was to analyze the applicability of the semi-distributed model SWAT (Soil and Water Assessment Tool) and the concentrated model SMAP (soil moisture accounting procedure) in predicting the extreme flood event that occurred in Brazil in the mountainous region of Rio de Janeiro in 2011. The results showed that the mean relative error in calibration and validation was 12% and 53% for SMAP, and 18.46% and 88.73% for SWAT, respectively. The better performance of SMAP in validation integrated with its ease of data collection, simplicity of execution and semi-automatic calibration included in its routine, allows for the conclusion that this model proved to be more suitable for hydrological monitoring. In this study, for the first time, a model of SWAT’s complexity was applied to a watershed located in the mountainous region of the state of Rio de Janeiro, a region that, unfortunately, has accounted for thousands of deaths over the past decades associated with mass movements and floods. The SWAT model, besides being able to predict the level and flow of the main course of the river and its tributaries, also enables the calculation of sediment transport in extreme events. Looking from an operational point of view, the work clearly shows how poor hydro-meteorological monitoring, as is the case in this region, makes a good quality prediction for extreme events impossible. It was demonstrated that under these conditions, a simpler and concentrated modeling approach, such as the SMAP model, is able to obtain better results than SWAT. Full article
(This article belongs to the Special Issue Severe Weather Disasters)
Show Figures

Figure 1

20 pages, 2195 KiB  
Article
Adaptive Thinking in Cities: Urban Continuity within Built Environments
by Hana Morel and Brenda Denise Dorpalen
Climate 2023, 11(3), 54; https://doi.org/10.3390/cli11030054 - 26 Feb 2023
Cited by 4 | Viewed by 3155
Abstract
Adaptive reuse of built heritage is increasingly critical for reasons of sustainability, particularly in urban spaces. With increasing pressures for building and housing, the building and construction industry will likely continue to contribute 39% of all carbon emissions in the world, with operational [...] Read more.
Adaptive reuse of built heritage is increasingly critical for reasons of sustainability, particularly in urban spaces. With increasing pressures for building and housing, the building and construction industry will likely continue to contribute 39% of all carbon emissions in the world, with operational emissions accounting for 28%. Further demolition, urban renewal and rebuilding not only obstruct pathways to decarbonisation but create shocks that disrupt and displace communities. We argue that it is essential to support built heritage beyond conventional urban renewal approaches and to position it as a critical community-based asset that can leverage local knowledge and promote a sustainable and more circular economy. However, such an agenda must acknowledge the challenges of adopting new innovative practices that can reduce strain on current material and social resources. This paper situates adaptive reuse as critical in strategies to reuse existing building stock and other broader sustainability movements, framing it from an economic angle. A case study approach explores adaptive reuse interventions and how these might be extended to other areas. Full article
Show Figures

Figure 1

17 pages, 350 KiB  
Article
Political and Social Drivers of COVID-19 Prevention and Climate Change Behaviors and Attitudes
by Carl A. Latkin, Zoé Mistrale Hendrickson, Lauren Dayton and Haley Bonneau
Climate 2023, 11(3), 53; https://doi.org/10.3390/cli11030053 - 26 Feb 2023
Cited by 3 | Viewed by 3552
Abstract
Attitudes and behaviors related to the COVID-19 pandemic and the climate change crisis might be driven by similar political beliefs and attitudes. The current study used a neo-Gramsci perspective to examine how political attitudes may be linked to COVID-19 prevention and climate change [...] Read more.
Attitudes and behaviors related to the COVID-19 pandemic and the climate change crisis might be driven by similar political beliefs and attitudes. The current study used a neo-Gramsci perspective to examine how political attitudes may be linked to COVID-19 prevention and climate change attitudes and behaviors. A longitudinal online survey in the US assessed climate change and COVID-19 attitudes and behaviors, and wave 7 (2021) data were used to predict outcomes at wave 8 (2022) among 572 respondents. There were significant correlations among the variables of political ideology, climate change concerns, COVID-19 vaccine hesitancy, COVID-19 skepticism, COVID-19 vaccine as a personal choice, COVID-19 conspiracy, political correctness, percent of Republican friends, and dislike of the Democratic Party. In the multivariate models, COVID-19 vaccination as a personal choice was significantly associated with the four outcomes: vaccination status, climate change actions, vaccine hesitancy, and climate change concerns. COVID-19 skepticism was significantly associated with vaccination status, vaccine hesitancy, and climate change concerns. These findings suggest that there are similar drivers of COVID-19 prevention and climate change attitudes and behaviors, and interventions need to be tailored to target individual-level and societal-level factors. Full article
12 pages, 2219 KiB  
Article
New Normal in ITCZ and Its Role in Altering Agroclimatic Suitability for Rice Production
by Somnath Jha, Mourani Sinha and Anupam Kumar
Climate 2023, 11(3), 52; https://doi.org/10.3390/cli11030052 - 25 Feb 2023
Viewed by 1803
Abstract
Intertropical Convergence Zone (ITCZ) primarily governs the convective rainfall potential of the summer monsoon in Asia. In the present study, non-parametric trend test with outgoing longwave radiation (OLR) for the summer monsoon period for the last 42 years (1980–2021) have been analyzed for [...] Read more.
Intertropical Convergence Zone (ITCZ) primarily governs the convective rainfall potential of the summer monsoon in Asia. In the present study, non-parametric trend test with outgoing longwave radiation (OLR) for the summer monsoon period for the last 42 years (1980–2021) have been analyzed for ITCZ zone, representative zones of Hadley circulation and Walker circulation for exploring trend of the deep convection activity. Besides, various climatic variables like temperature (maximum, minimum, mean), precipitation, and cloud cover dataset are used for exploring trend in major rice growing regions of the world. The results indicate that there is a significantly decreasing trend of OLR in ITCZ zone during summer monsoon season. Contrarily, major rice growing regions of the world have witnessed a significantly increasing trend for the temperature parameter among all the zones. Rainfall and cloud cover have shown a typical trend i.e., increasing rainfall but decreasing cloud cover in the Southeast Asian and Maritime Continent rice growing regions. In rice suitable climate assessment, it has been found that the Maritime Continent rice growing region, the Indo-Gangetic Plain and the Southeast Asian rice growing regions have witnessed better rice suitable climates than other rice growing regions during the last 42 years (1980–2021). Full article
(This article belongs to the Special Issue Subseasonal to Seasonal Climate Forecasting)
Show Figures

Figure 1

24 pages, 9590 KiB  
Article
Potential Impacts of Climate Change on Surface Water Resources in Arid Regions Using Downscaled Regional Circulation Model and Soil Water Assessment Tool, a Case Study of Amman-Zerqa Basin, Jordan
by Ibrahim Al-Hasani, Mohammed Al-Qinna and Nezar Atalla Hammouri
Climate 2023, 11(3), 51; https://doi.org/10.3390/cli11030051 - 22 Feb 2023
Cited by 4 | Viewed by 2495
Abstract
Water scarcity, aggravated by climate change impacts, threatens all sectors in arid regions and hampers sustainable development plans. This work aims to assess the potential impacts of climate change on surface water resources of Amman-Zerqa Basin, Jordan, using the Soil Water Assessment Tool [...] Read more.
Water scarcity, aggravated by climate change impacts, threatens all sectors in arid regions and hampers sustainable development plans. This work aims to assess the potential impacts of climate change on surface water resources of Amman-Zerqa Basin, Jordan, using the Soil Water Assessment Tool model (SWAT) and outputs from the Downscaled Regional Circulation Model. Future scenarios were developed based on combining two Representative Concentration Pathways (RCPs 4.5 and 8.5). A reference scenario from 1973 to 2015 was used to compare the current climate with future climates and their impacts on hydrological processes. Hydrologic modeling outputs showed very good performance ratings for calibration and validation periods. Statistical bias correction of the Downscale Regional Circulation Model (GCM) indicated that linear scaling for precipitation data was the best-performing bias correction method, along with variance scaling and distribution mapping methods for minimum and maximum temperature, respectively. The coupled future model simulations indicated a reduction in crucial water balance components under all modeled scenarios. The simulated reductions range between 3.7% and 20.7% for precipitation, 22.3–41.6% for stream flow, 25.0–47.0% for surface runoff, 0.5–13.4% for evapotranspiration, and 21.5–41.4% for water yield, from conservative to the severe scenario, respectively. In conclusion, spatial analyses indicated the presence of three zones of impact. Thus, future climate and hydrological adaptation measures should focus on the provided zoning. Full article
Show Figures

Figure 1

13 pages, 3975 KiB  
Article
Climate Change Impact on the Cultural Heritage Sites in the European Part of Russia over the Past 60 Years
by Elena Vyshkvarkova and Olga Sukhonos
Climate 2023, 11(3), 50; https://doi.org/10.3390/cli11030050 - 22 Feb 2023
Cited by 14 | Viewed by 8297
Abstract
Climate change is causing damage to infrastructure, ecosystems, and social systems, including cultural heritage sites. In the European part of Russia, there are 20 UNESCO-listed cultural heritage sites situated in different climatic conditions. This study assesses the impact of climate change on these [...] Read more.
Climate change is causing damage to infrastructure, ecosystems, and social systems, including cultural heritage sites. In the European part of Russia, there are 20 UNESCO-listed cultural heritage sites situated in different climatic conditions. This study assesses the impact of climate change on these sites by using ERA5 re-analysis data to calculate two frost damage indices and two salt weathering indices for the period 1960–2020. The findings indicate a rise in frost damage and salt weathering at cultural heritage sites in northern Europe, primarily due to changes in air temperature and water in the atmosphere, which are the main parameters responsible for the destruction of stone and brick structures. Given the observed and predicted trends in the main meteorological parameters, the detrimental destructive impact of climate change on cultural heritage sites will only increase. In view of the significant length of Russia from north to south and the difference in climatic conditions, measures for the adaptation and protection of cultural heritage sites must be adapted to local conditions and consider the material from which the object is made. Full article
Show Figures

Figure 1

21 pages, 5440 KiB  
Article
Projected Changes in Extreme Wet and Dry Conditions in Greece
by Effie Kostopoulou and Christos Giannakopoulos
Climate 2023, 11(3), 49; https://doi.org/10.3390/cli11030049 - 21 Feb 2023
Cited by 4 | Viewed by 3592
Abstract
Earth’s changing climate may have different effects around the planet. Regional changes in temperature and precipitation extremes are associated with damaging natural hazards. Decreases in precipitation are expected to occur in some places at mid-latitudes, for instance the Mediterranean, which has been classified [...] Read more.
Earth’s changing climate may have different effects around the planet. Regional changes in temperature and precipitation extremes are associated with damaging natural hazards. Decreases in precipitation are expected to occur in some places at mid-latitudes, for instance the Mediterranean, which has been classified as a climate change hotspot. Droughts are among the most damaging natural hazards with severe consequences in the socio-economic sectors, the environment, and living beings. In contrast, extreme heavy precipitation events may become more frequent. This study aims to project changes in precipitation extremes and assess drought variability and change across Greece. A better knowledge of the potential changes in drought variability under climate change is vital for managing potential risks and impacts associated with dry conditions. The spatiotemporal characteristics of heavy precipitation and drought events in Greece are investigated using extreme precipitation indices such as consecutive wet/dry days, total wet-day precipitation, fraction of total wet-day rainfall, maximum daily precipitation, and heavy precipitation days. The standardized precipitation index and the standardized precipitation and evapotranspiration index are also calculated to assess seasonal dryness variability. The analysis is performed using a sub-set of high-resolution simulations from EURO-CORDEX, under two different representative concentration pathway scenarios. The results show that the region is subject to future dry conditions. Total annual precipitation is found to decrease in most of the country, with western and southern parts tending to be the most vulnerable areas. The annual precipitation is estimated to decrease by 5–20% and 5–25% (RCP4.5 and RCP8.5 respectively) toward the period 2041–2070 and by 10–25% and 15–40% (RCP4.5 and RCP8.5) toward 2071–2100. Drought-related indices reveal positive trends, particularly under the high greenhouse-gas emission scenario, with the number of consecutive dry days increasing by 20–50% and 40–80% (during 2041–2070 and 2071–2100, respectively). On the contrary, extreme precipitation events tend to decrease in the future. Full article
(This article belongs to the Special Issue Climate Change Impacts at Various Geographical Scales)
Show Figures

Figure 1

24 pages, 7361 KiB  
Article
Performances of Holiday Climate Index (HCI) for Urban and Beach Destinations in Sri Lanka under Changing Climate
by Jayanga T. Samarasinghe, Charuni P. Wickramarachchi, Randika K. Makumbura, Pasindu Meddage, Miyuru B. Gunathilake, Nitin Muttil and Upaka Rathnayake
Climate 2023, 11(3), 48; https://doi.org/10.3390/cli11030048 - 21 Feb 2023
Cited by 4 | Viewed by 2832
Abstract
Climate change has had a significant impact on the tourism industry in many countries, leading to changes in policies and adaptations to attract more visitors. However, there are few studies on the effects of climate change on Sri Lanka’s tourism industry and income, [...] Read more.
Climate change has had a significant impact on the tourism industry in many countries, leading to changes in policies and adaptations to attract more visitors. However, there are few studies on the effects of climate change on Sri Lanka’s tourism industry and income, despite its importance as a destination for tourists. A study was conducted to analyze the holiday climate index (HCI) for Sri Lanka’s urban and beach destinations to address this gap. The analysis covered historical years (2010–2018) and forecasted climatic scenarios (2021–2050 and 2071–2100), and the results were presented as colored maps to highlight the importance of HCI scores. Visual analysis showed some correlation between HCI scores and tourist arrivals, but the result of the overall correlation analysis was not significant. However, a country-specific correlation analysis revealed interesting findings, indicating that the changing climate can be considered among other factors that impact tourist arrivals. The research proposes that authorities assess the outcomes of the study and conduct further research to develop adaptive plans for Sri Lanka’s future tourism industry. The study also investigated potential scenarios for beach and urban destinations under two climate scenarios (RCP 4.5 and RCP 8.5) for the near and far future, presenting the findings to tourism industry stakeholders for any necessary policy changes. As Sri Lanka expects more Chinese visitors in the future due to ongoing development projects, this study could be valuable for policymakers and industry stakeholders when adapting to changing climate and future tourist behavior. While more research is needed to fully understand the effects of climate change on Sri Lanka’s tourism industry, this study serves as a starting point for future investigations. Full article
Show Figures

Figure 1

Previous Issue
Next Issue
Back to TopTop