


Climate 2026, 14(6), 112; https://doi.org/10.3390/cli14060112 (registering DOI) - 23 May 2026
Abstract
Amid the ongoing acceleration of climate change over recent decades, extreme precipitation events have become more frequent and intense on a global scale, triggering severe natural hazards and considerable socioeconomic damage. Nevertheless, how extreme precipitation has evolved at the national level over long
[...] Read more.
Amid the ongoing acceleration of climate change over recent decades, extreme precipitation events have become more frequent and intense on a global scale, triggering severe natural hazards and considerable socioeconomic damage. Nevertheless, how extreme precipitation has evolved at the national level over long time spans, and what role atmosphere–ocean teleconnections play in driving regional differences, remains insufficiently explored. This study addresses that knowledge gap by conducting a comprehensive assessment of eight ETCCDI-based extreme precipitation indices (PRCPTOT, CWD, R20, R95p, R99p, RX1day, RX5day, and SDII) across six climatic sub-regions of China (Northeast, North, East, Central South, Northwest, and Southwest) over 1960–2020, drawing on daily records from 695 quality-controlled meteorological stations. Key atmospheric and oceanic circulation drivers were further diagnosed and their joint influence was quantified via multiple wavelet coherence (MWC). The analysis shows that five of the eight indices (CWD, R95p, R99p, RX1day, and RX5day) underwent statistically significant fluctuating changes (p < 0.05) throughout the 61-year record. Seven indices, all except CWD, demonstrated upward tendencies, with mutation points clustering after 2010, most notably between 2011 and 2016. Wavelet power spectra indicates elevated energy concentrations at multiple time scales, although only CWD exhibited a statistically significant periodicity of approximately 8–10 a (p < 0.05 against red noise). In terms of spatial patterns, index magnitudes generally increased along a northwest-to-southeast gradient. Stations registering significant upward shifts were concentrated in East and Central South China, whereas significant downward shifts appeared mainly in North China and the northern portion of East China. An altitude-dependent pattern was also detected: CWD rose with elevation, while the remaining indices declined sharply below 1288 m, fluctuated in the 1288–2090 m band, and dropped again above 2090 m. Wavelet coherence analysis uncovered significant resonance between extreme precipitation and four circulation indices—SCSMMI, WPSHI, PNA, and NAO. MWC further identified three driver combinations—ENSO-PNA, SCSMMI-WPSHI, and ENSO-NAO-EASMI—as the most influential, acting both individually and synergistically. These results furnish an empirical basis for forecasting, preventing, and managing precipitation-related disasters across China under future climate scenarios.
Full article
(This article belongs to the Section Weather, Events and Impacts)
►
Show Figures
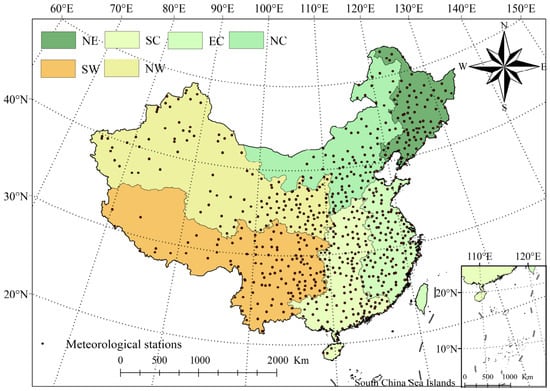
Figure 1


