

ISPRS Int. J. Geo-Inf., Volume 14, Issue 8 (August 2025) – 39 articles
Cover Story (view full-size image):
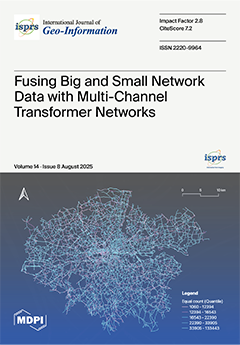
In this study, we propose the Multi-Channel Spatio-Temporal Data Fusion (MCST-DF) framework, designed to integrate heterogeneous “big” and “small” data sources across complex road networks. Leveraging a novel Residual Spatio-Temporal Transformer Network (RSTTNet), our method captures both fine-grained local dynamics and global spatio-temporal patterns. By introducing multi-scale temporal channels and hierarchical spatial modelling, the framework effectively addresses challenges of data mismatch, sparsity, and heterogeneity. Evaluated on London traffic flow data, our approach achieves over 89% prediction accuracy and outperforms several strong baselines. This work contributes a generalisable solution to spatio-temporal data fusion, with wide implications for urban mobility, infrastructure monitoring, and geospatial AI systems. View this paper
- Issues are regarded as officially published after their release is announced to the table of contents alert mailing list.
- You may sign up for e-mail alerts to receive table of contents of newly released issues.
- PDF is the official format for papers published in both, html and pdf forms. To view the papers in pdf format, click on the "PDF Full-text" link, and use the free Adobe Reader to open them.
Previous Issue
Next Issue