Article

An Aspect-Based Emotion Analysis Approach on Wildfire-Related Geo-Social Media Data—A Case Study of the 2020 California Wildfires

1
Department of Geoinformatics—Z_GIS, University of Salzburg, 5020 Salzburg, Austria
2
Geosocial Artificial Intelligence, Interdisciplinary Transformation University Austria, 4040 Linz, Austria
3
Center for Geographic Analysis, Harvard University, Cambridge, MA 02138, USA
*
Author to whom correspondence should be addressed.
ISPRS Int. J. Geo-Inf. 2025, 14(8), 301; https://doi.org/10.3390/ijgi14080301
Submission received: 4 April 2025 / Revised: 15 July 2025 / Accepted: 27 July 2025 / Published: 1 August 2025

Abstract

Natural disasters like wildfires pose significant threats to communities, which necessitates timely and effective disaster response strategies. While Aspect-based Sentiment Analysis (ABSA) has been widely used to extract sentiment-related information at the sub-sentence level, the corresponding field of Aspect-based Emotion Analysis (ABEA) remains underexplored due to dataset limitations and the increased complexity of emotion classification. In this study, we used EmoGRACE, a fine-tuned BERT-based model for ABEA, which we applied to georeferenced tweets of the 2020 California wildfires. The results for this case study reveal distinct spatio-temporal emotion patterns for wildfire-related aspect terms, with fear and sadness increasing near wildfire perimeters. This study demonstrates the feasibility of tracking emotion dynamics across disaster-affected regions and highlights the potential of ABEA in real-time disaster monitoring. The results suggest that ABEA can provide a nuanced understanding of public sentiment during crises for policymakers.

1. Introduction

Natural disasters such as wildfires, hurricanes, earthquakes, and floods have significant social, economic, and environmental consequences. These disasters not only cause widespread destruction, but also evoke strong emotional responses from affected populations. In the modern digital age, social media platforms have emerged as crucial sources for capturing real-time public reactions, providing insights into the emotional state of communities during crisis events [1]. The increasing engagement on social networks for disaster communication underscores the need for robust analytical methods that can extract meaningful information from vast amounts of user-generated content [2]. Among natural disasters, wildfires present unique challenges due to their rapid spread and unpredictability [3]. The extensive damage caused by wildfires often prompts widespread public discussions on platforms such as Twitter, where users share real-time updates, evacuation concerns, emotional reactions, and opinions about governmental responses.
Understanding public sentiment during disasters has been the focus of numerous studies in crisis informatics. Sentiment analysis techniques have been widely used to classify disaster-related posts as having positive, negative, or neutral content [4]. However, traditional text- or sentence-level sentiment analysis methods often fail to capture the complexity of human emotions, which are more nuanced than binary sentiment categories and may vary within text subsections. This challenge led to the development of Aspect-based Sentiment Analysis (ABSA), which is the study of sentiments at the sub-sentence level [5]. Although ABSA has been extensively studied in areas such as product reviews and customer feedback [6], its application in disaster management remains limited. More importantly, Aspect-based Emotion Analysis (ABEA), which extends ABSA by detecting specific emotions such as ‘Fear’, ‘Anger’, ‘Sadness’, and ‘Happiness’ associated with particular targets of emotions, and thus providing deeper insight into how people respond in a disaster situation, remains an underexplored method in disaster research [7].
Incorporating a spatio-temporal dimension into emotion analysis allows us to analyze how emotions evolve across different regions and time periods during a disaster. Several studies have explored the integration of location-based sentiment analysis in disaster response, using geotagged social media posts to assess the impact of crises on public sentiment in affected areas [8]. However, the application of ABEA allows a much more fine-grained semantic analysis, as the assignment of emotions to concrete text elements can be carried out, revealing the specific triggers of emotional reactions (e.g., anger in relation to measures in disaster management). Despite its potential to advance the evaluation of a disaster event, the combination of ABEA and spatio-temporal analysis has not been investigated in the field of disaster management.
Consequently, this paper aims to demonstrate a proof of concept by conducting an ABEA on geo-social media data, revealing spatio-temporal variances among predominant emotions and their associated subjects. For ABSA, several studies have explored such integrations, where location is used either as a pre-processing step to filter relevant data [9,10], as a post-processing step for geo-visualization of analysis results [11,12], or location is merely implicitly inferred from event-related keywords [13]. However, no such study exists that focuses on the spatio-temporal aspect for ABEA.
Our case study addresses this research gap by applying the fine-tuned Bidirectional Encoder Representations from Transformers (BERT)-based model EmoGRACE by Zorenböhmer et al. [14] on georeferenced tweets about the 2020 California wildfires to demonstrate the added value of a spatio-temporal ABEA methodology. As the EmoGRACE model can only be applied to English-language texts, we deliberately selected a use case in the USA. The 2020 California wildfires were chosen because they were an exceptionally large event with many fires close to human settlements. Consequently, we assumed sufficient availability of user-generated social media data. At the same time, the proliferation of geospatial data and the growing demand for (near) real-time insights into disaster-affected areas has fueled the need for timely and accurate geospatial and semantic analyses of user-generated data [15,16,17]. This study aims to contribute to this research domain by addressing the following research question:
  • RQ: Can the application of Aspect-based Emotion Analysis to geo-social media data offer actionable insights for disaster response by revealing distinct spatio-temporal patterns for specific emotions and emotion-targets?

2. Related Works

The use of social media data for wildfire monitoring, prediction, and analysis has grown in importance, as it offers a direct connection to real-time, opinionated responses from those affected. Low barriers to entry on social media platforms allow a wide range of users to voice their concerns and opinions [18], while technological improvements have enabled more advanced information extraction from web data [19]. Many studies using geo-social media data deal with the identification of wildfires and their spatio-temporal distribution [20,21,22,23]. Both sentiment and emotion analysis of such data can help by providing crucial and timely information on public needs and opinions during disaster events [24,25]. This has been demonstrated in a recent study that performed information extraction and aggregation for post-event insights, near real-time monitoring and even predictions by considering emotional fluctuations [26].
Early social media analysis in crisis contexts, particularly wildfires, dates back more than a decade. Spinsanti and Ostermann [27] introduced GeoCONAVI, a prototype system that used Twitter and Flickr posts during forest fires, enriched them with geographic context, and used spatio-temporal clustering to isolate relevant, credible information for emergency response. Building on this, Kent and Capello [28] analyzed geolocated user-generated content across platforms like Twitter, Flickr, and Instagram during the 2012 Horsethief Canyon Fire. Using nearest-neighbor and hotspot analysis, followed by overlaying demographic data, they revealed clusters of effective crisis communication and highlighted demographic biases in contribution patterns. Other examples of social media analysis for wildfire responses include Loureiro et al. [29], who performed sentiment analysis (SA) on geotagged Twitter data from wildfires in Spain and Portugal, finding that sentiments were inversely linked to proximity to the fires, becoming increasingly negative and fearful closer to the fires. García et al. [30] conducted sentiment and emotional well-being analysis for the 2017 Tubbs Fire in California, finding that Twitter content was increasingly emotionally charged, especially at the onset of fire incidents. Interestingly, they found an increase in both negative and positive sentiments related to fire events. Wang et al. [23] found that social media data improve situational awareness in their analysis of tweets about “fire” and “wildfire” in California during 2014, considering spatio-temporal patterns. They used topic mining and spatial density mapping to demonstrate how social media data can help disaster responders assess the severity and spread of fire events. Grace [31] presented a manually annotated dataset of storm-related social media posts, which includes categories like ‘Experience’, subdivided into types like ‘Admiration’, ‘Appreciation’, ‘Complaint’, ‘Fear’, and ‘Humor’, which share conceptual similarities with emotion analysis. In these studies, the methods used for SA often relied on lexicon-based tools like VADER [32]. For near real-time analysis, Li et al. [33] used word patterns to classify evacuation-related tweets into two categories: before and during evacuations. Moving towards predictive analyses, Lever and Arcucci [34] employed Twitter data combined with geophysical data to conduct SA aimed at forecasting fire characteristics. Win Myint et al. [35] showed that a BERTweet-based multi-task model with attention mechanisms can simultaneously detect sentiment, emotion, and intent in crisis from tweets.
While these studies demonstrate the resourcefulness of SA for wildfire-related analyses, the application of ABSA to unstructured social media data presents additional challenges. Social media posts, particularly tweets, are short, informal, and contain high levels of noise, including misspellings, slang, emojis, and contextual ambiguities [36]. Mitchell et al. [37] introduced one of the first Twitter-based datasets, showing the feasibility of ABSA in social media contexts. Spinsanti and Ostermann [27] and Kent and Capello [28] demonstrate the early integration of geolocation filtering, spatial clustering, and bias awareness in wildfire-related crisis informatics. Extending this work, our study advances the field by incorporating ABEA, thereby enriching geospatially filtered crisis data with nuanced, targeted emotional context.

3. Methodology

The methodology consisted of two main steps, namely the application of the EmoGRACE model [14] on a dataset of 3.6 million georeferenced tweets in the context of the 2020 California wildfires, and the subsequent spatio-temporal analysis of the ABEA results.

3.1. Use Case

The 2020 California wildfires were selected as a case study due to the unprecedented scale of wildfire activity that year, including five of the largest fires in the state’s recorded history, and due to historically high Twitter data availability in the US. Caused by a combination of drought, extreme temperatures, strong winds, and human ignition, the 2020 wildfire season saw over 9900 fires burn approximately 4.3 million acres, destroying over 11,000 structures and causing 33 deaths [38], making it the largest in California’s history until then [39]. In the aftermath of the fires, there has been a growing recognition of the need to take action to address the growing fire risk in California [40].

3.2. Data

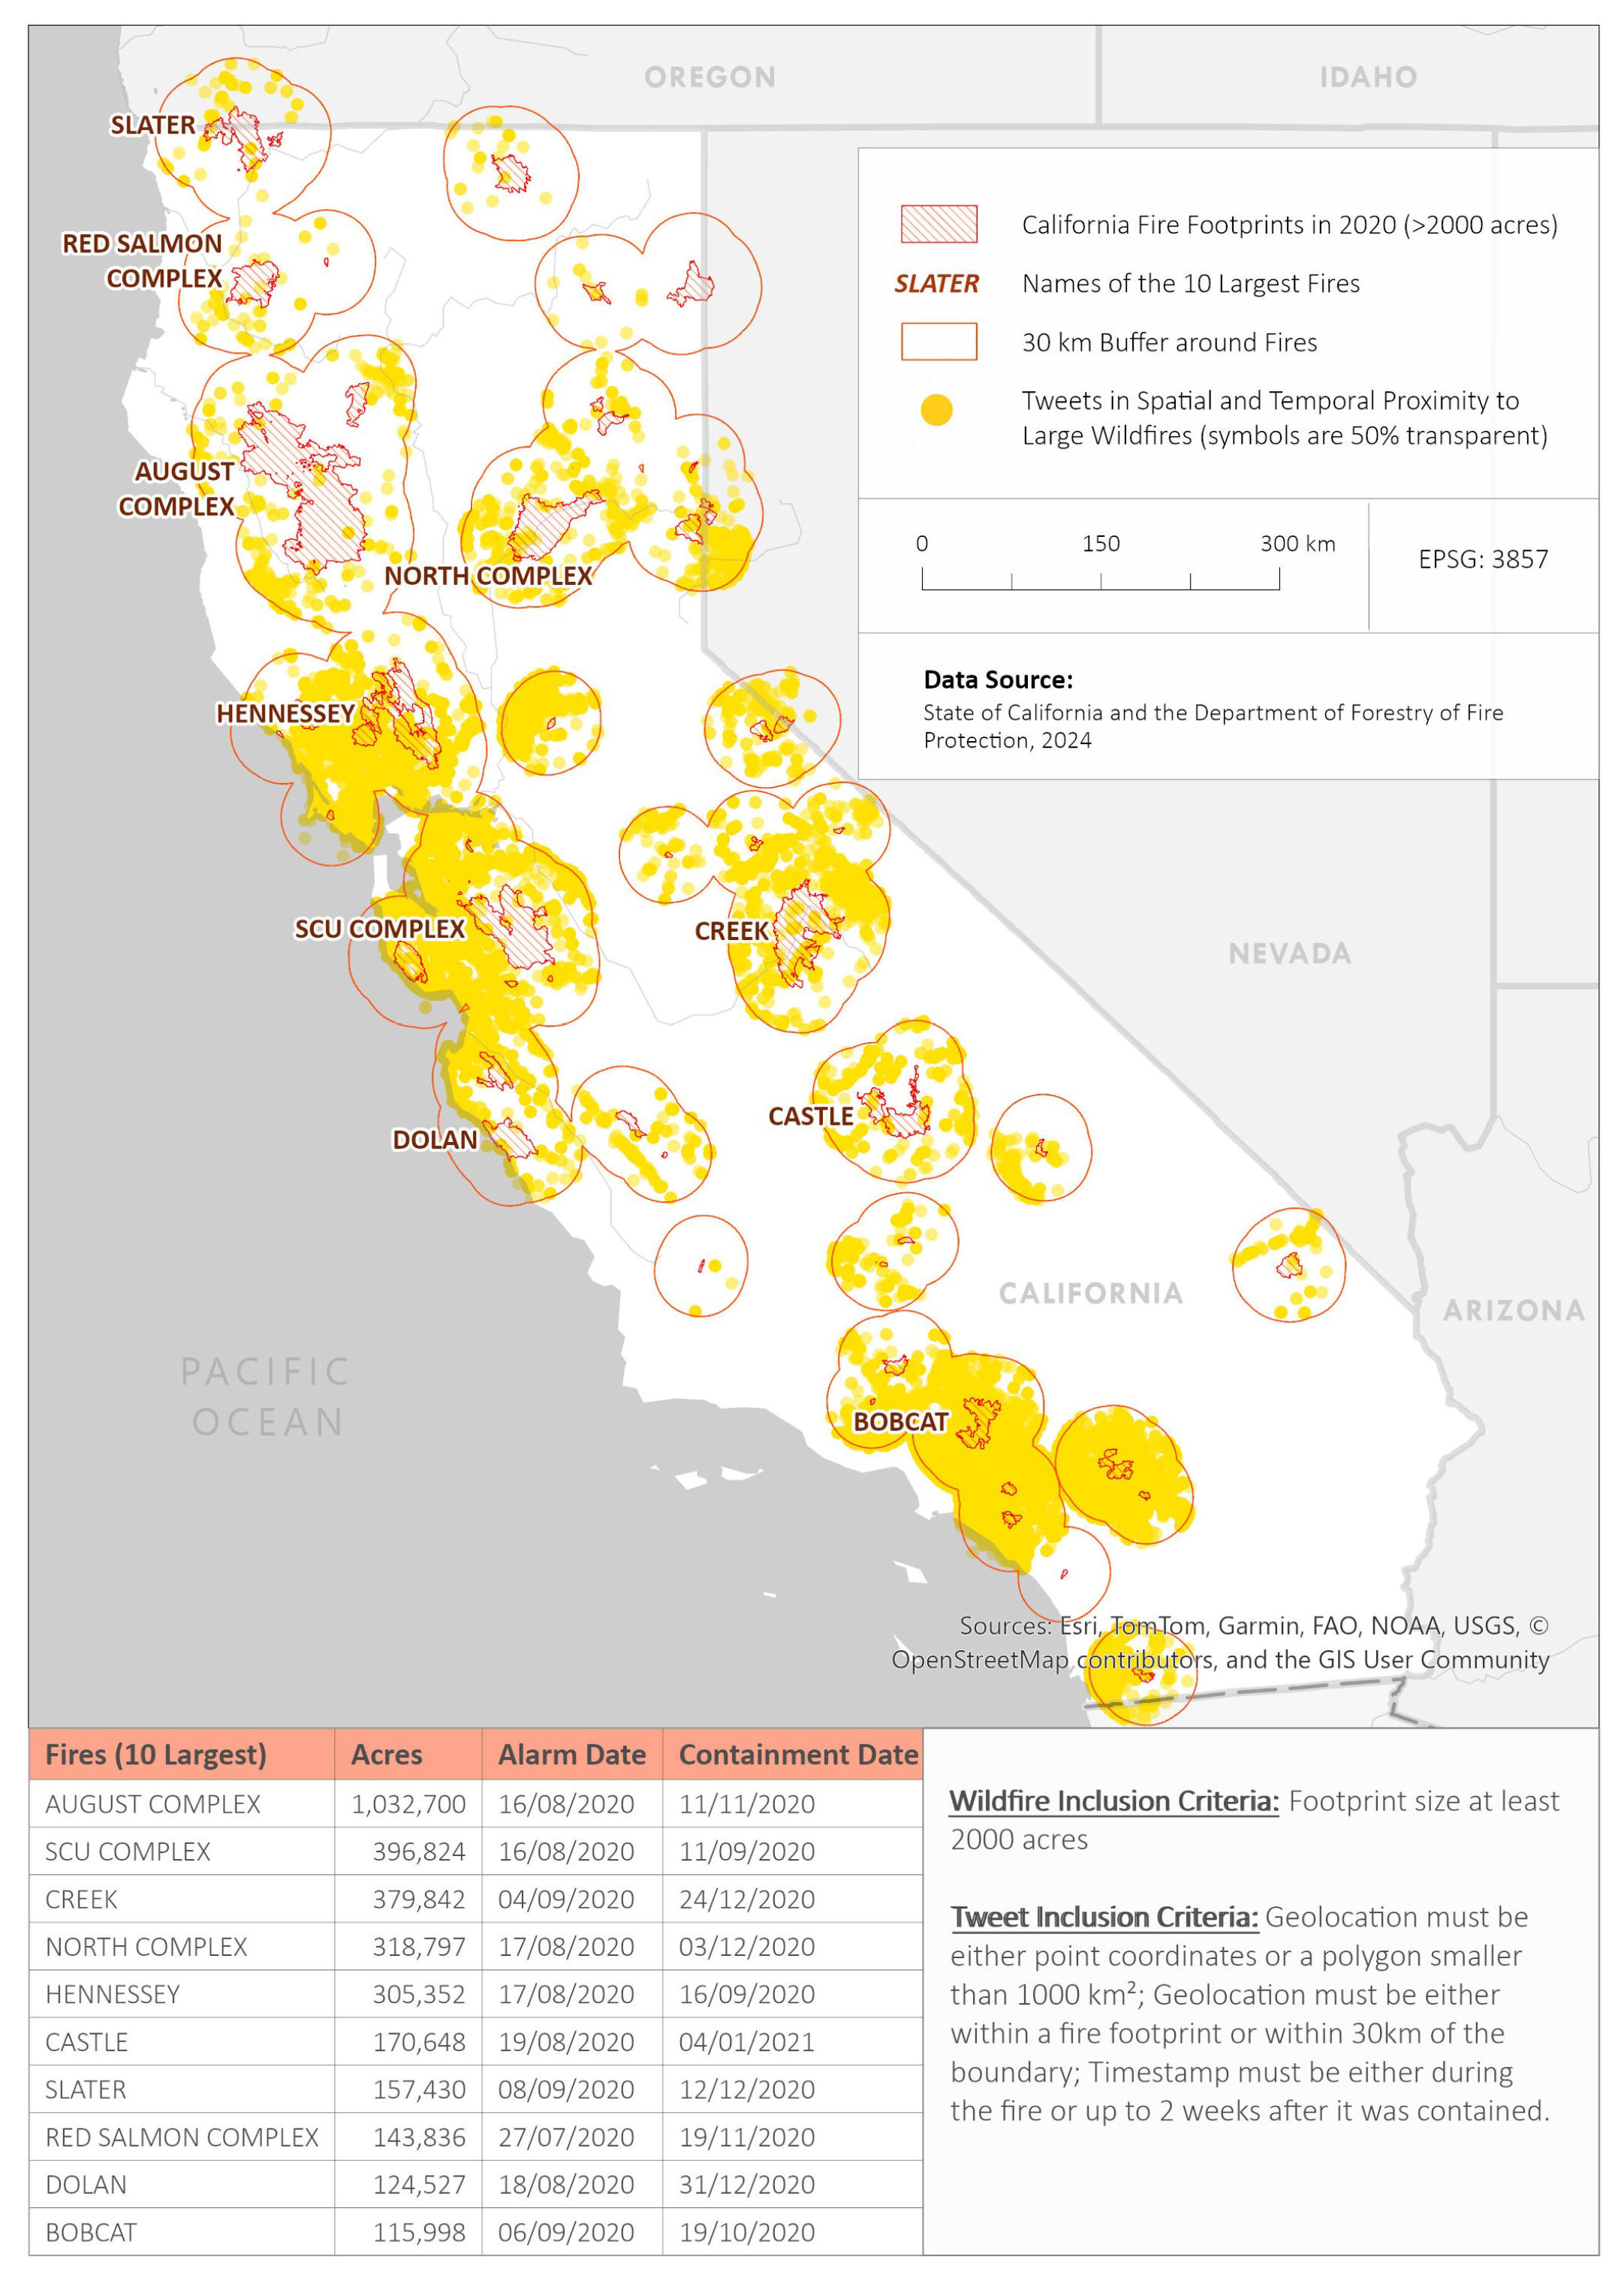
Social media data from the microblogging platform Twitter (now: X) was used for the generation of the case study dataset. Georeferenced tweets, including the respective tweet text, message ID, language, timestamp, and geolocation, were collected through the v1.1 recent search and streaming Application Programming Interfaces (APIs), following Havas and Resch [15] and Schmidt et al. [41]. A tweet’s geolocation can either be stored as a point representing the exact coordinates from the user’s GPS device or set manually as a “place”. Large geotags, like ‘Los Angeles’, are represented as rectangular polygons [42]. The Twitter dataset acquired for this case study contained nearly 35 million tweets, collected between 1 April 2020 and 1 January 2021, spanning the geographic bounding box shown in Figure 1. From this dataset, all tweets with a polygon geolocation larger than 1000 square miles were removed, to ensure greater reliability when performing spatial analyses on the polygon centroids in subsequent steps. For reference, California’s largest city, Los Angeles, spans approximately 500 square miles. By excluding large polygon geometries, the dataset was reduced to 27.1 million tweets.
Since this case study was concerned with the opinions of the communities affected by the fires, the tweets were further filtered for spatial and temporal proximity to the wildfires. For this purpose, a total of 505 wildfire footprints were obtained from California’s Department of Forestry and Fire Protection for the year 2020 [38]. To focus on fires of substantial size, the dataset was filtered for a minimum size of 2000 acres, narrowing down the total to 57. For each fire, a ‘during and near’ subset was created by spatially filtering for tweets either directly within the fire perimeter or up to 30 km away. This buffer was chosen to reflect the area where communities are likely to feel impacts such as air quality changes, evacuations, or other disruptions such as road closures and emergency response efforts. The buffer represents twice the radius of common wildfire evacuation zones [43] to account for indirect, non-evacuation impacts and social media behavior beyond the immediate threat zone. Simultaneously, the tweets were temporally filtered, so that only content posted during the fire or up to two weeks after the fire’s containment was considered. The aftermath of the event was included since immediate response efforts may extend into this time period, and the community impact may lag behind the active burning phase. Two weeks have been shown as an effective timeframe in other disaster-related geo-social media studies, since discussions on the platforms then generally return to a pre-disaster baseline [44]. These steps further narrowed the dataset down to 3.6 million tweets. An overview of the buffers and the spatial spread of the tweets in the final subset are shown in Figure 2.
The ten geographically largest wildfires were further considered for analysis. For each of these wildfires, two comparison subsets of equal tweet quantity were created (see Table 1). By removing either the temporal or geographical coincidence with the wildfire in the two comparison subsets, it becomes possible to validate whether online communication during and near wildfires was noticeably increased. Following the subset creation, six of the ten wildfire subsets were ruled out for analysis due to sample sizes below 15,000 tweets for the ‘during and near’ subset (see Table 2). The remaining four wildfire subsets—Bobcat, SCU Complex, Hennessey, and Dolan—were considered for ABEA and spatio-temporal analysis.

3.3. ABEA Inferences

The EmoGRACE model by Zorenböhmer et al. [14] is an adaptation of Luo et al. [45]’s GRACE model for ABEA. It is built upon the BERT-base-uncased model, with the structure adapted and trained for Aspect Term Extraction (ATE) and Aspect Emotion Classification (AEC). Zorenböhmer et al. [14] note that the ATE part (F1 score of 70.1%) of the workflow outperformed the joint, more complex task of AEC and ATE (46.9%). Due to the greater complexity involved in classifying emotions and the increased diversity of aspect terms in its training data, EmoGRACE exhibited somewhat lower performance than GRACE on the more high-level ABSA task. However, it compensates for this by offering more fine-grained semantic insights.
The tweet texts contained in the subsets were pre-processed for ABEA inferences by removing tweets with empty text values, non-English tweets, and any non-Latin characters, as well as URLs and usernames, and splitting the texts at the token level. The EmoGRACE model was then applied to all subsets. It outputs token level labels for ATE and AEC (‘Happiness’, ‘Anger’, ‘Sadness’, ‘Fear’, ‘None’, ‘O’), where each token in the input sequence is assigned one ATE and one AEC label.

3.4. Spatio-Temporal Analysis

For the spatio-temporal analysis, geographical analysis units were created as 5 × 5 km hex grid cells. The hex grid format was chosen over a square grid due to its closer alignment with the nearest neighbor logic for data aggregation [46]. For the grid size, we chose the middle ground between the analysis units presented in previous research on social media data and natural disasters by Schmidt et al. [20] (∼9.85 km edge length) and Wieland et al. [47] (∼0.5–3.7 km edge length). Using the three subsets per wildfire and the hex grid as geographical units, three different analysis outputs were obtained to demonstrate ABEA insights at varying scales and with differing predominant focus on aspect terms or emotions: regional emotion ratio changes, regional aspect term timeseries, and a local level breakdown of emotions and aspect terms. All three outputs were generated as proofs of concept, demonstrating the feasibility of ABEA integration with spatio-temporal information.
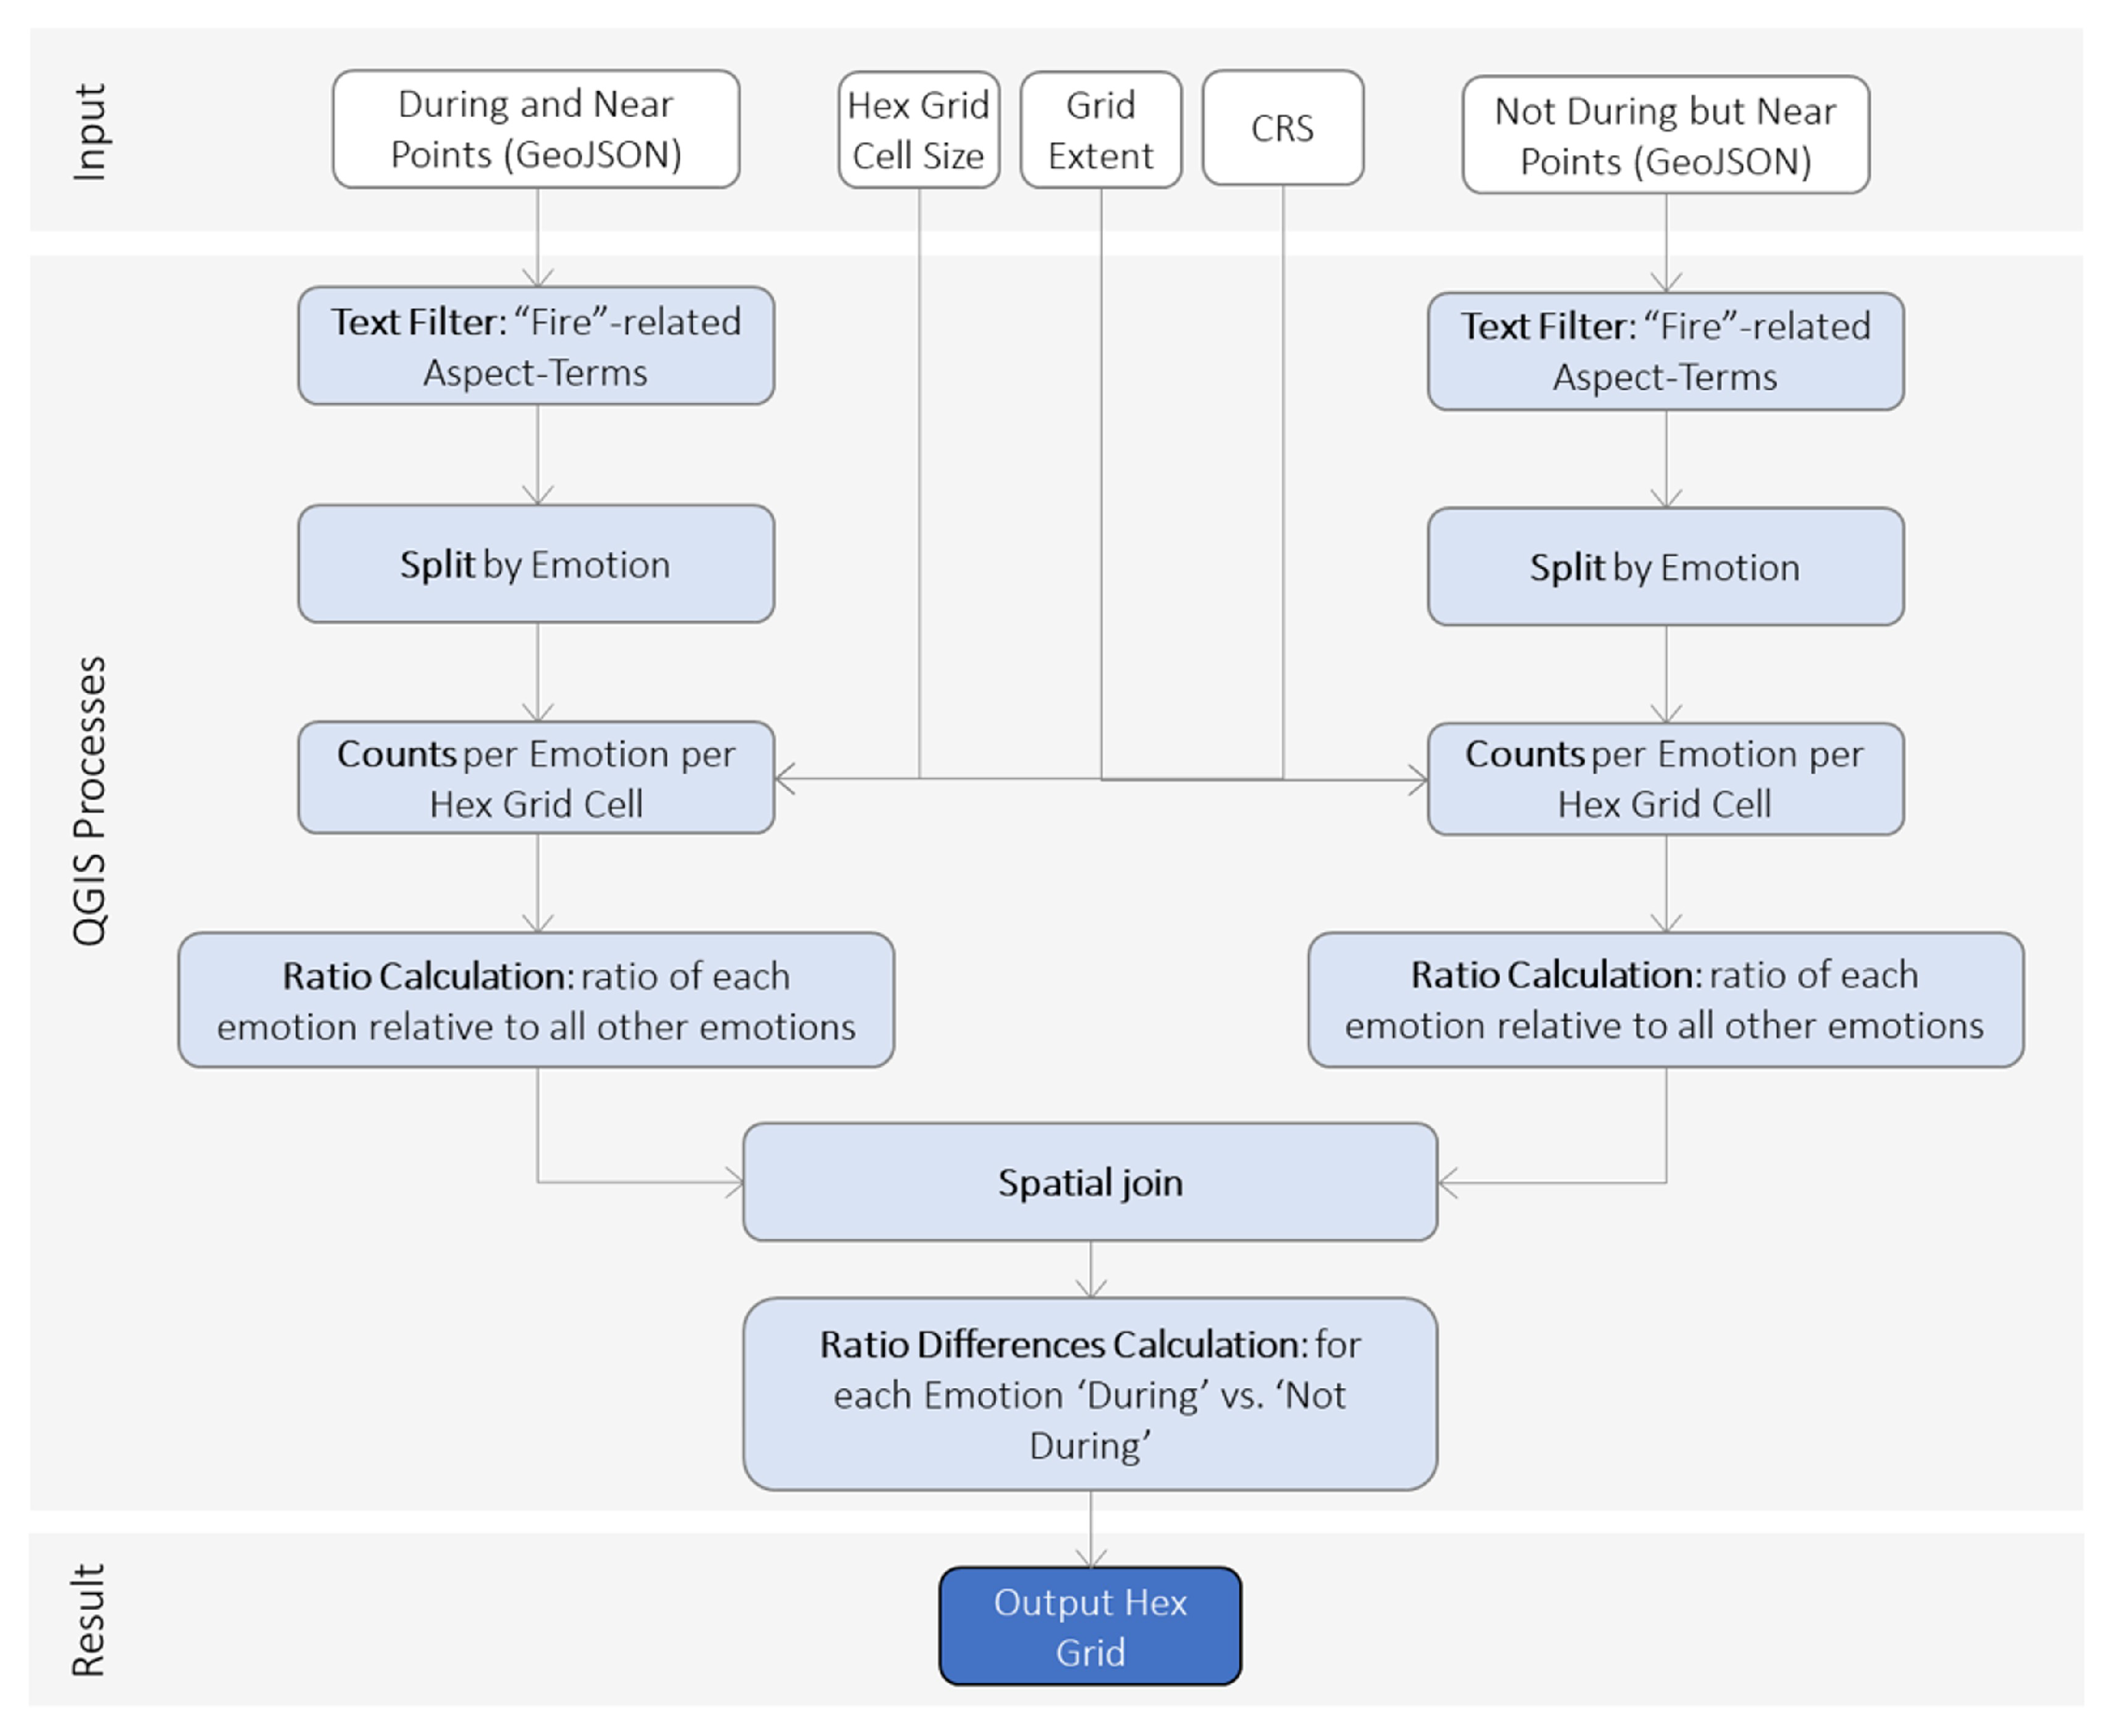
The first output, regional emotion ratio changes, provides insights into the distribution and variation in emotions associated with “fire”-related aspect terms at a regional scale. This was achieved by filtering all ATE results for aspect terms related to “fire”. These aspect terms were identified based on the presence of specific substrings, including ‘fire’, ‘smoke’, ‘forest’, ‘inferno’, ‘blaze’, ‘disaster’, ‘destruction’, ‘wind’, ‘lightning’, ‘storm’, ‘emergenc’, ‘evacuat’, ‘hazard’, ‘burn’, ‘drought’, ‘ash’, and ‘flame’. Emotion ratios, i.e., the amount of tweets per emotion normalized by the amount of all tweets, were then computed for each geographical analysis unit within both the ‘During and Near’ and ‘Not During but Near’ subsets. The latter serves as a comparative baseline, representing typical emotion distributions in non-wildfire periods. By assessing relative changes in emotional expressions, this analysis identified where and to what extent emotions increased or decreased during wildfire events in comparison to the baseline. The workflow was implemented using QGIS Model Builder and the results were visualized in ArcGIS Pro. A schematic representation is provided in Figure 3.
The second output, regional aspect term time series, primarily examines the temporal evolution of discussions related to wildfire events. This was achieved by constructing a daily timeline of mentions for fire-related and disaster response-related aspect terms. The aspect terms corresponding to disaster response included substrings such as ‘respond’, ‘response’, ‘firefight’, ‘heli’, ‘rescue’, ‘help’, ‘evacuat’, ‘relief’, ‘crisis’, ‘displace’, ‘coordinat’, ‘recover’, and ‘shelter’. This temporal analysis compared the ‘During and Near’ subset with the ‘During but Not Near’ subset, which served as a control, representing typical online exchanges on wildfire and disaster response topics at the same time as the wildfire but in geographically distant regions. Tweets from both subsets were filtered by aspect terms, and daily counts were computed and visualized. The resulting plots highlight variations in the volume and timing of communication on wildfire events and disaster response efforts. Furthermore, these time series can be further decomposed into emotion classes to provide additional insights into how emotions fluctuate over time.
The third output focuses on a localized analysis of individual areas of interest near wildfire perimeters, particularly towns that experienced high volumes of social media activity. This local-scale breakdown examined emotions and their corresponding aspect terms to provide insights into region-specific concerns at particular time points. The methodology applied spatial filtering techniques in combination with data processing and visualization tools to systematically extract and analyze emotional trends and thematic aspects within specific geographic locations. This granular approach enabled a more detailed understanding of how different communities react emotionally to wildfire events and disaster response efforts.

4. Results

4.1. Regional Emotion Ratio Changes

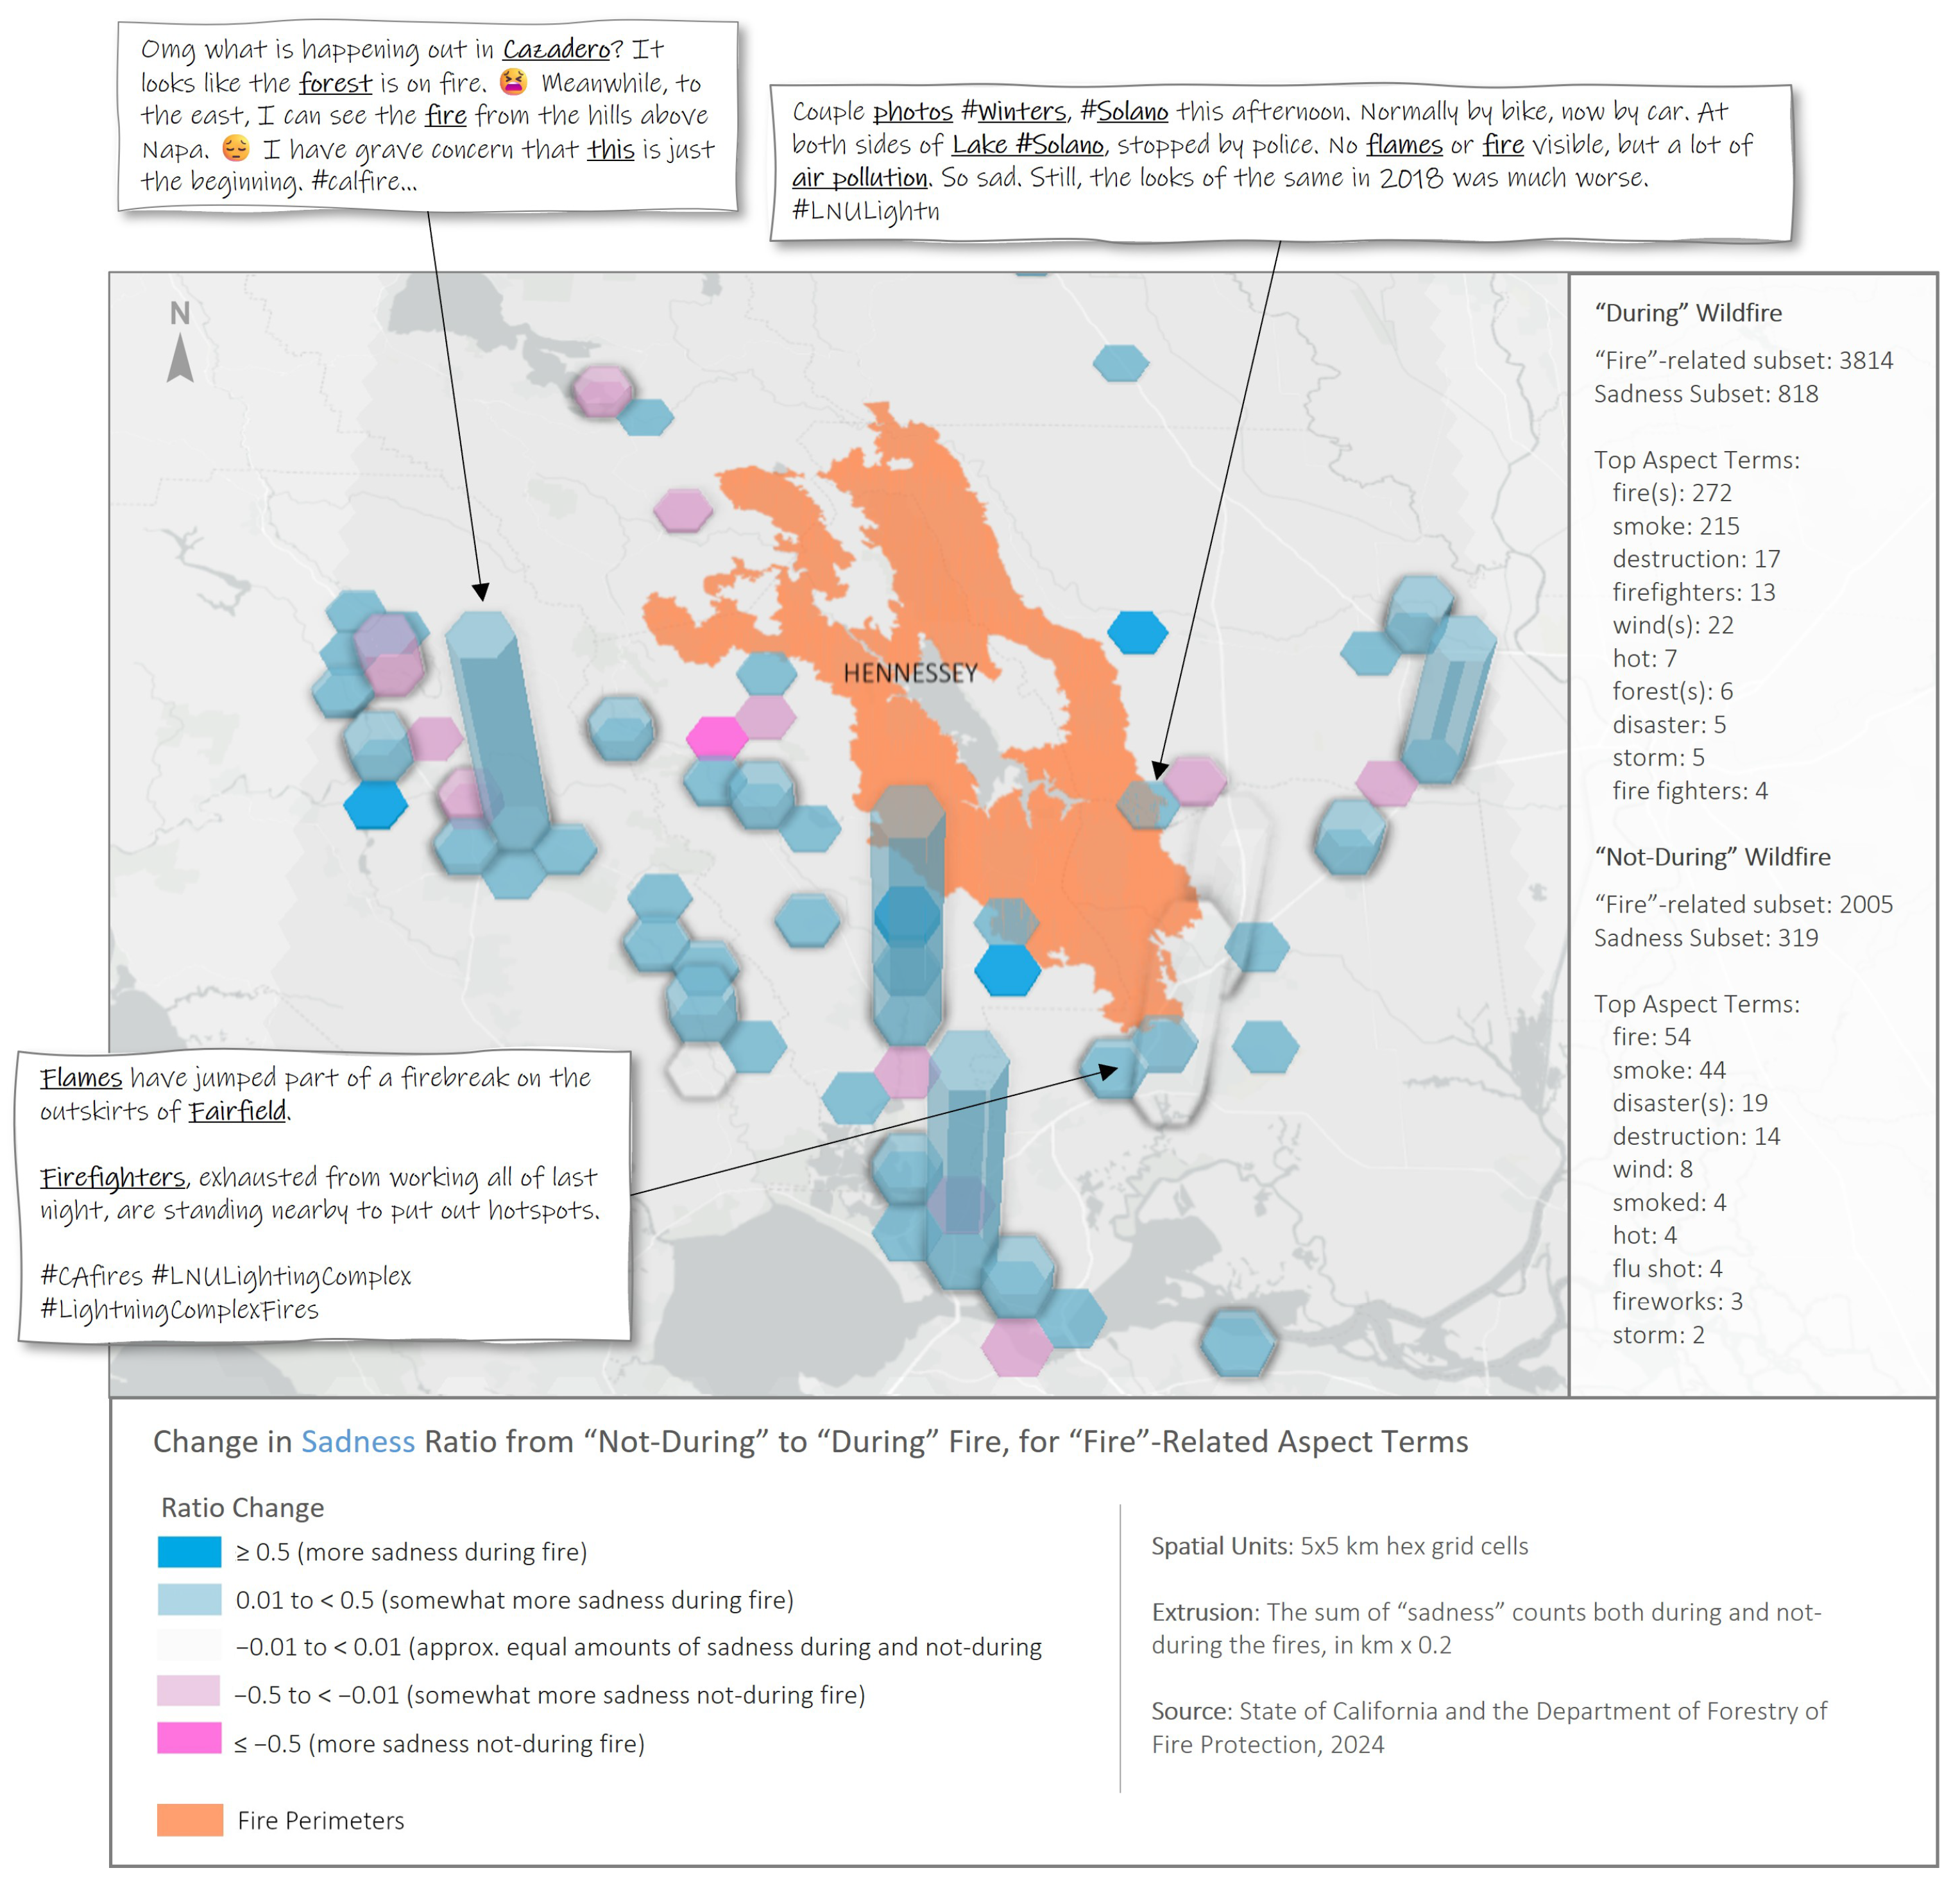
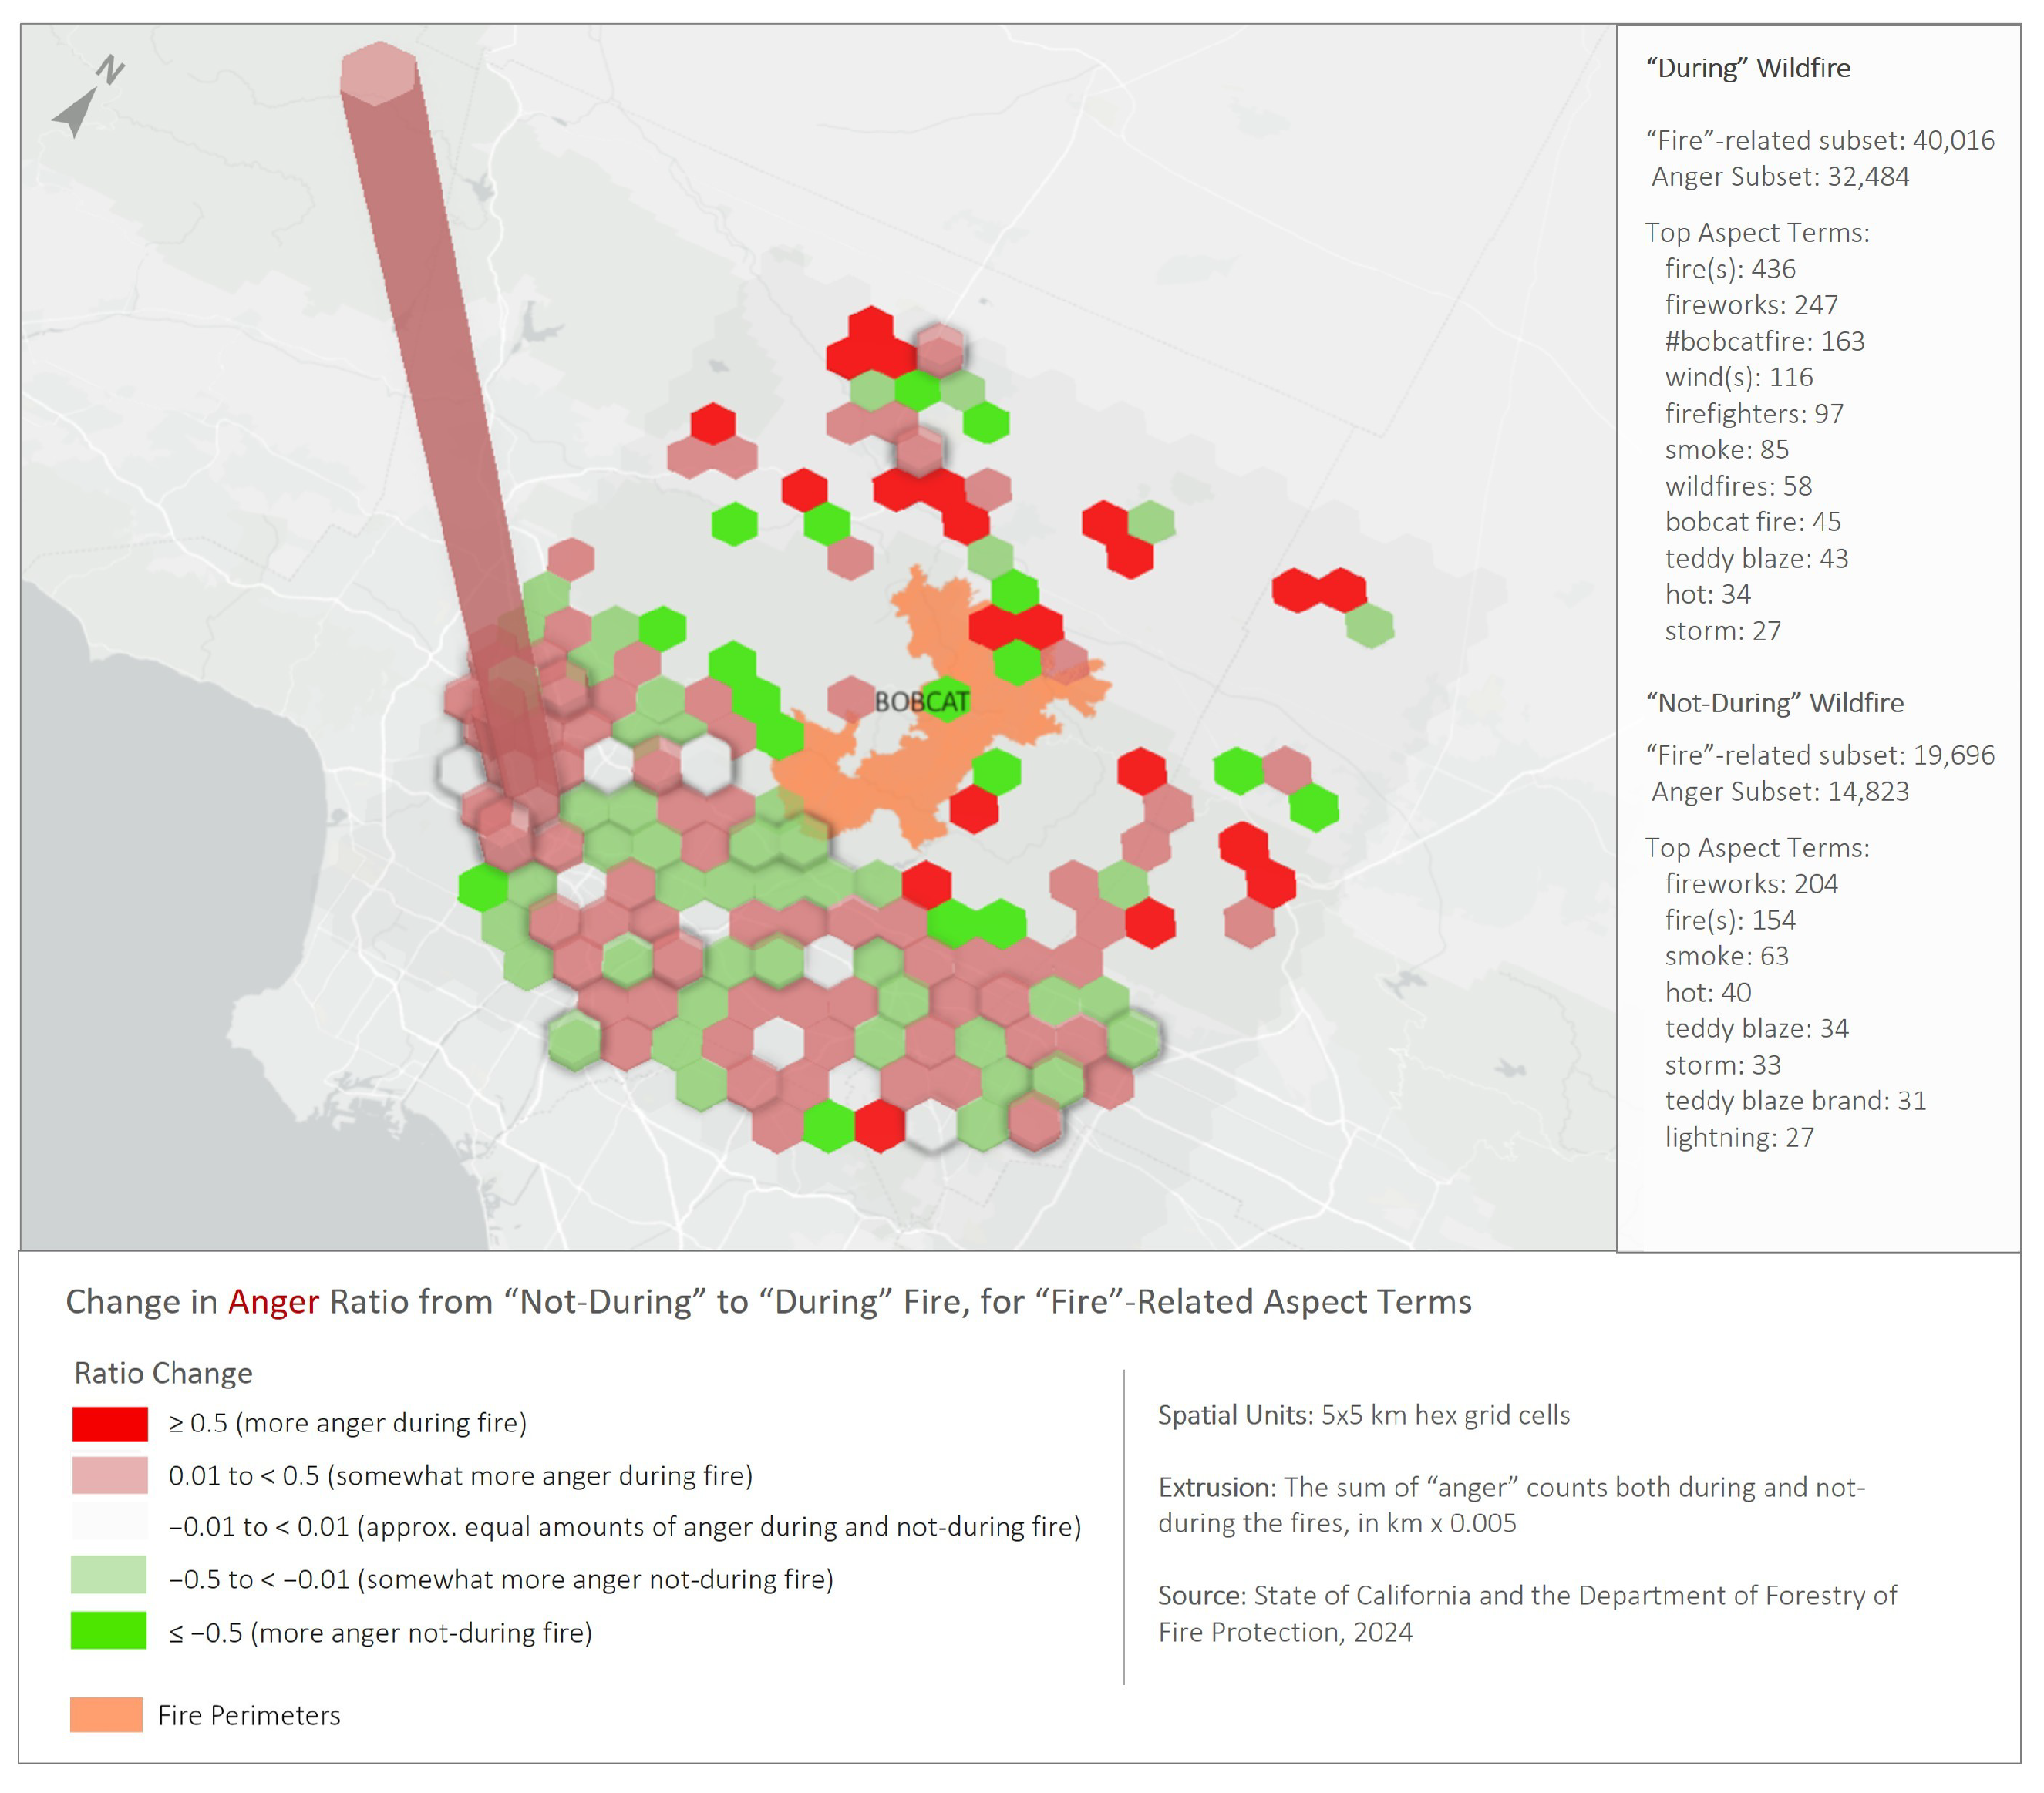
For each emotion (sadness, fear, happiness, anger), the changes between the ‘Not During but Near’ and ‘During and Near’ subsets are shown in Figure 4 and Figure 5 using a binary color scale on a 5 × 5 km hex grid that covers the fire footprint and surrounding areas. The results depict the spatial distribution of changes in emotion ratios for “fire”-related aspect terms for the SCU Complex Fire and the Hennessey Fire. The two other subsets, i.e., the Dolan and Bobcat Fires, are not shown here as the Dolan subsets resulted in too few results per emotion and the Bobcat subsets contained high volumes of non-fire related tweets from the central Los Angeles area.
Since the mapped values are ratios, the absolute number of tweets about “fire”-related topics is not directly accounted for in the color scales. Therefore, 3-dimensional extrusion was added, representing the total amount of Twitter posts per grid cell. After testing several extrusion settings, a multiplication of tweet counts by 0.2 km was chosen for the visualization since it offered a balance between too extreme extrusions to interpret and too small extrusions to clearly see differences. The combination of color scales and extrusion gives a spatial view of both the changes in emotions during a wildfire relative to a non-fire baseline and the cumulative information on how many tweets are posted for the given emotion and aspect terms.
A general increase in relative sadness during the wildfires is seen for both the SCU Complex Fire (Figure 4) and the Hennessey Fire (Figure 5). In particular, regions with higher tweet counts, as shown through the extrusion, consistently showed an increase in sadness ratio for “fire”-related topics. In the emotion class ‘Happiness’, which encompasses sub-emotions like joy, relief, hope, support, and affection, an increase was seen throughout the Hennessey Fire footprint itself with some regions of decreased happiness outside of the fire footprint, particularly to the northwest of the fire. The SCU Complex Fire lacked sufficient Twitter activity within the fire footprint itself, but generally showed similar increases in happiness ratios in regions close to the fire footprint. There was a noticeable increase in “Fear” ratios during the Hennessey Fire, especially in areas closer to the fire perimeters. Fear increases were also seen in urban spaces such as Vallejo (northwest of Concord) and San Jose during the SCU Complex Fire. The fear-associated aspect term “fire” increased 10-fold during the wildfires.
For the Hennessey Fire, the ratio of ‘Anger’ increased particularly in regions towards the northwest of the fire footprint, while the South-Eastern region showed a decrease in anger related to “fire” topics. For the SCU Complex Fire, there were fewer recognizable spatial patterns with both increases and decreases spread throughout the regions around the fire footprints. The top “fire”-related aspect terms in both cases showed a disproportionately large increase in tweets angry about “fire”-related terms, even when differences in subset sizes were accounted for.

4.2. Regional Aspect Term Time Series

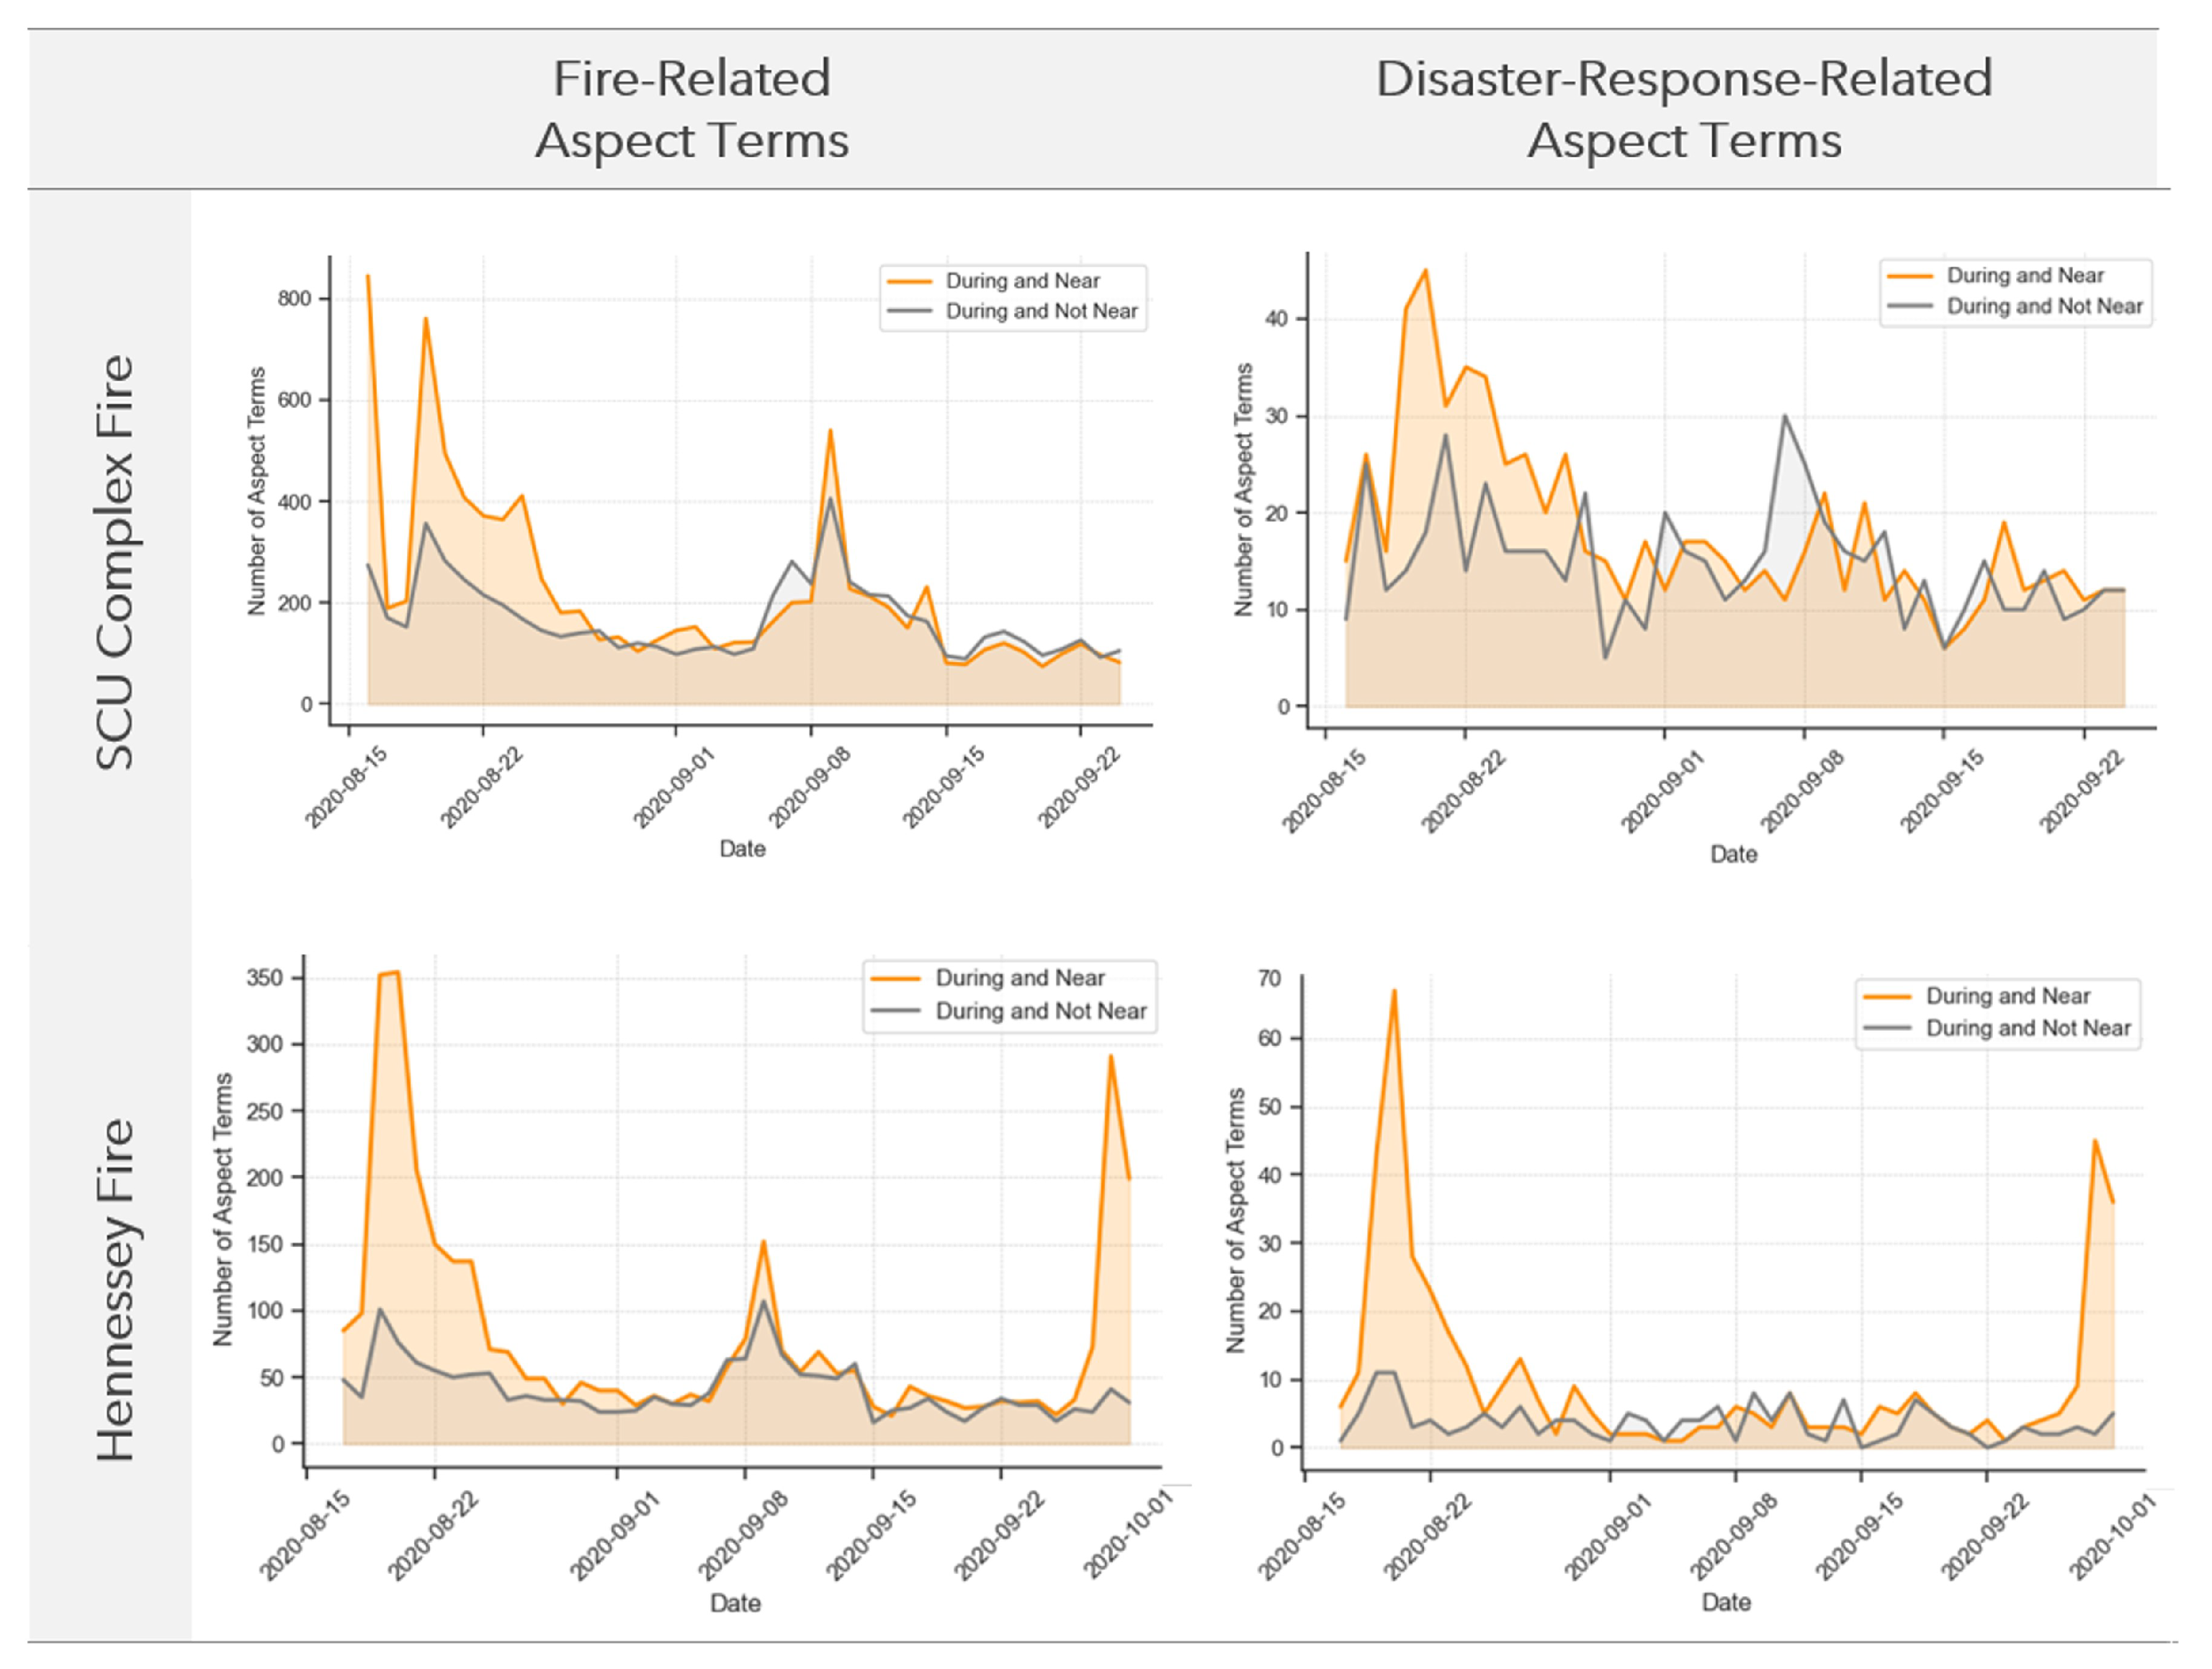
The time series comparisons of “fire”-related and “disaster-response”-related aspect term frequencies revealed clear differences between the regions ‘Near and During’ and ‘Not Near but During’ wildfires. These results are visualized for both the SCU Complex Fire and Hennessey Fire in Figure 6, with each fire represented by two graphs: one for “fire”-related aspect terms and the other for “disaster response”-related aspect terms.
The timelines for regions near the wildfires (orange) show distinct temporal spikes compared to regions not near the wildfires (gray). This pattern was particularly prominent during the initial and peak phases of each fire event. For instance, during the SCU Complex Fire, there was an evident surge in fire-related aspect terms in mid-August 2020, with another notable increase in early September. Similarly, for the Hennessey Fire, peaks appeared at the onset in mid-August and once again in mid-September. In both “fire”-related and “disaster response”-related terms, the ‘During and Near’ subset consistently showed higher frequencies than the ‘Not Near but During’ comparison subset. This indicates that people in closer proximity to the wildfire zones tended to engage more actively with these topics.
The individual emotions associated with “fire”-related aspect terms can be further broken down, as shown in Figure 7 for both the SCU Complex Fire and the Hennessey Fire. In both cases, ‘Anger’ emerged as the dominant emotion throughout the timeseries and showed the most distinct peaks, particularly during the early stages of the fires in mid-August, and again in early September. To a lesser degree, though with the same general pattern, ‘Sadness’ and ‘Happiness’ also had peaks at the onset and towards the end of the fires. For the Hennessey Fire, the daily quantity of “fire”-related aspect terms associated with ‘Happiness’ peaked at the end of September, possibly suggesting moments of relief or hope. In both fire events, ‘Fear’ and ‘None’ had a much smaller representation compared to ‘Anger’, ‘Sadness’, and ‘Happiness’, both of which remained steady with only minor fluctuations.

4.3. Emotions and Aspect Terms at the Local Level

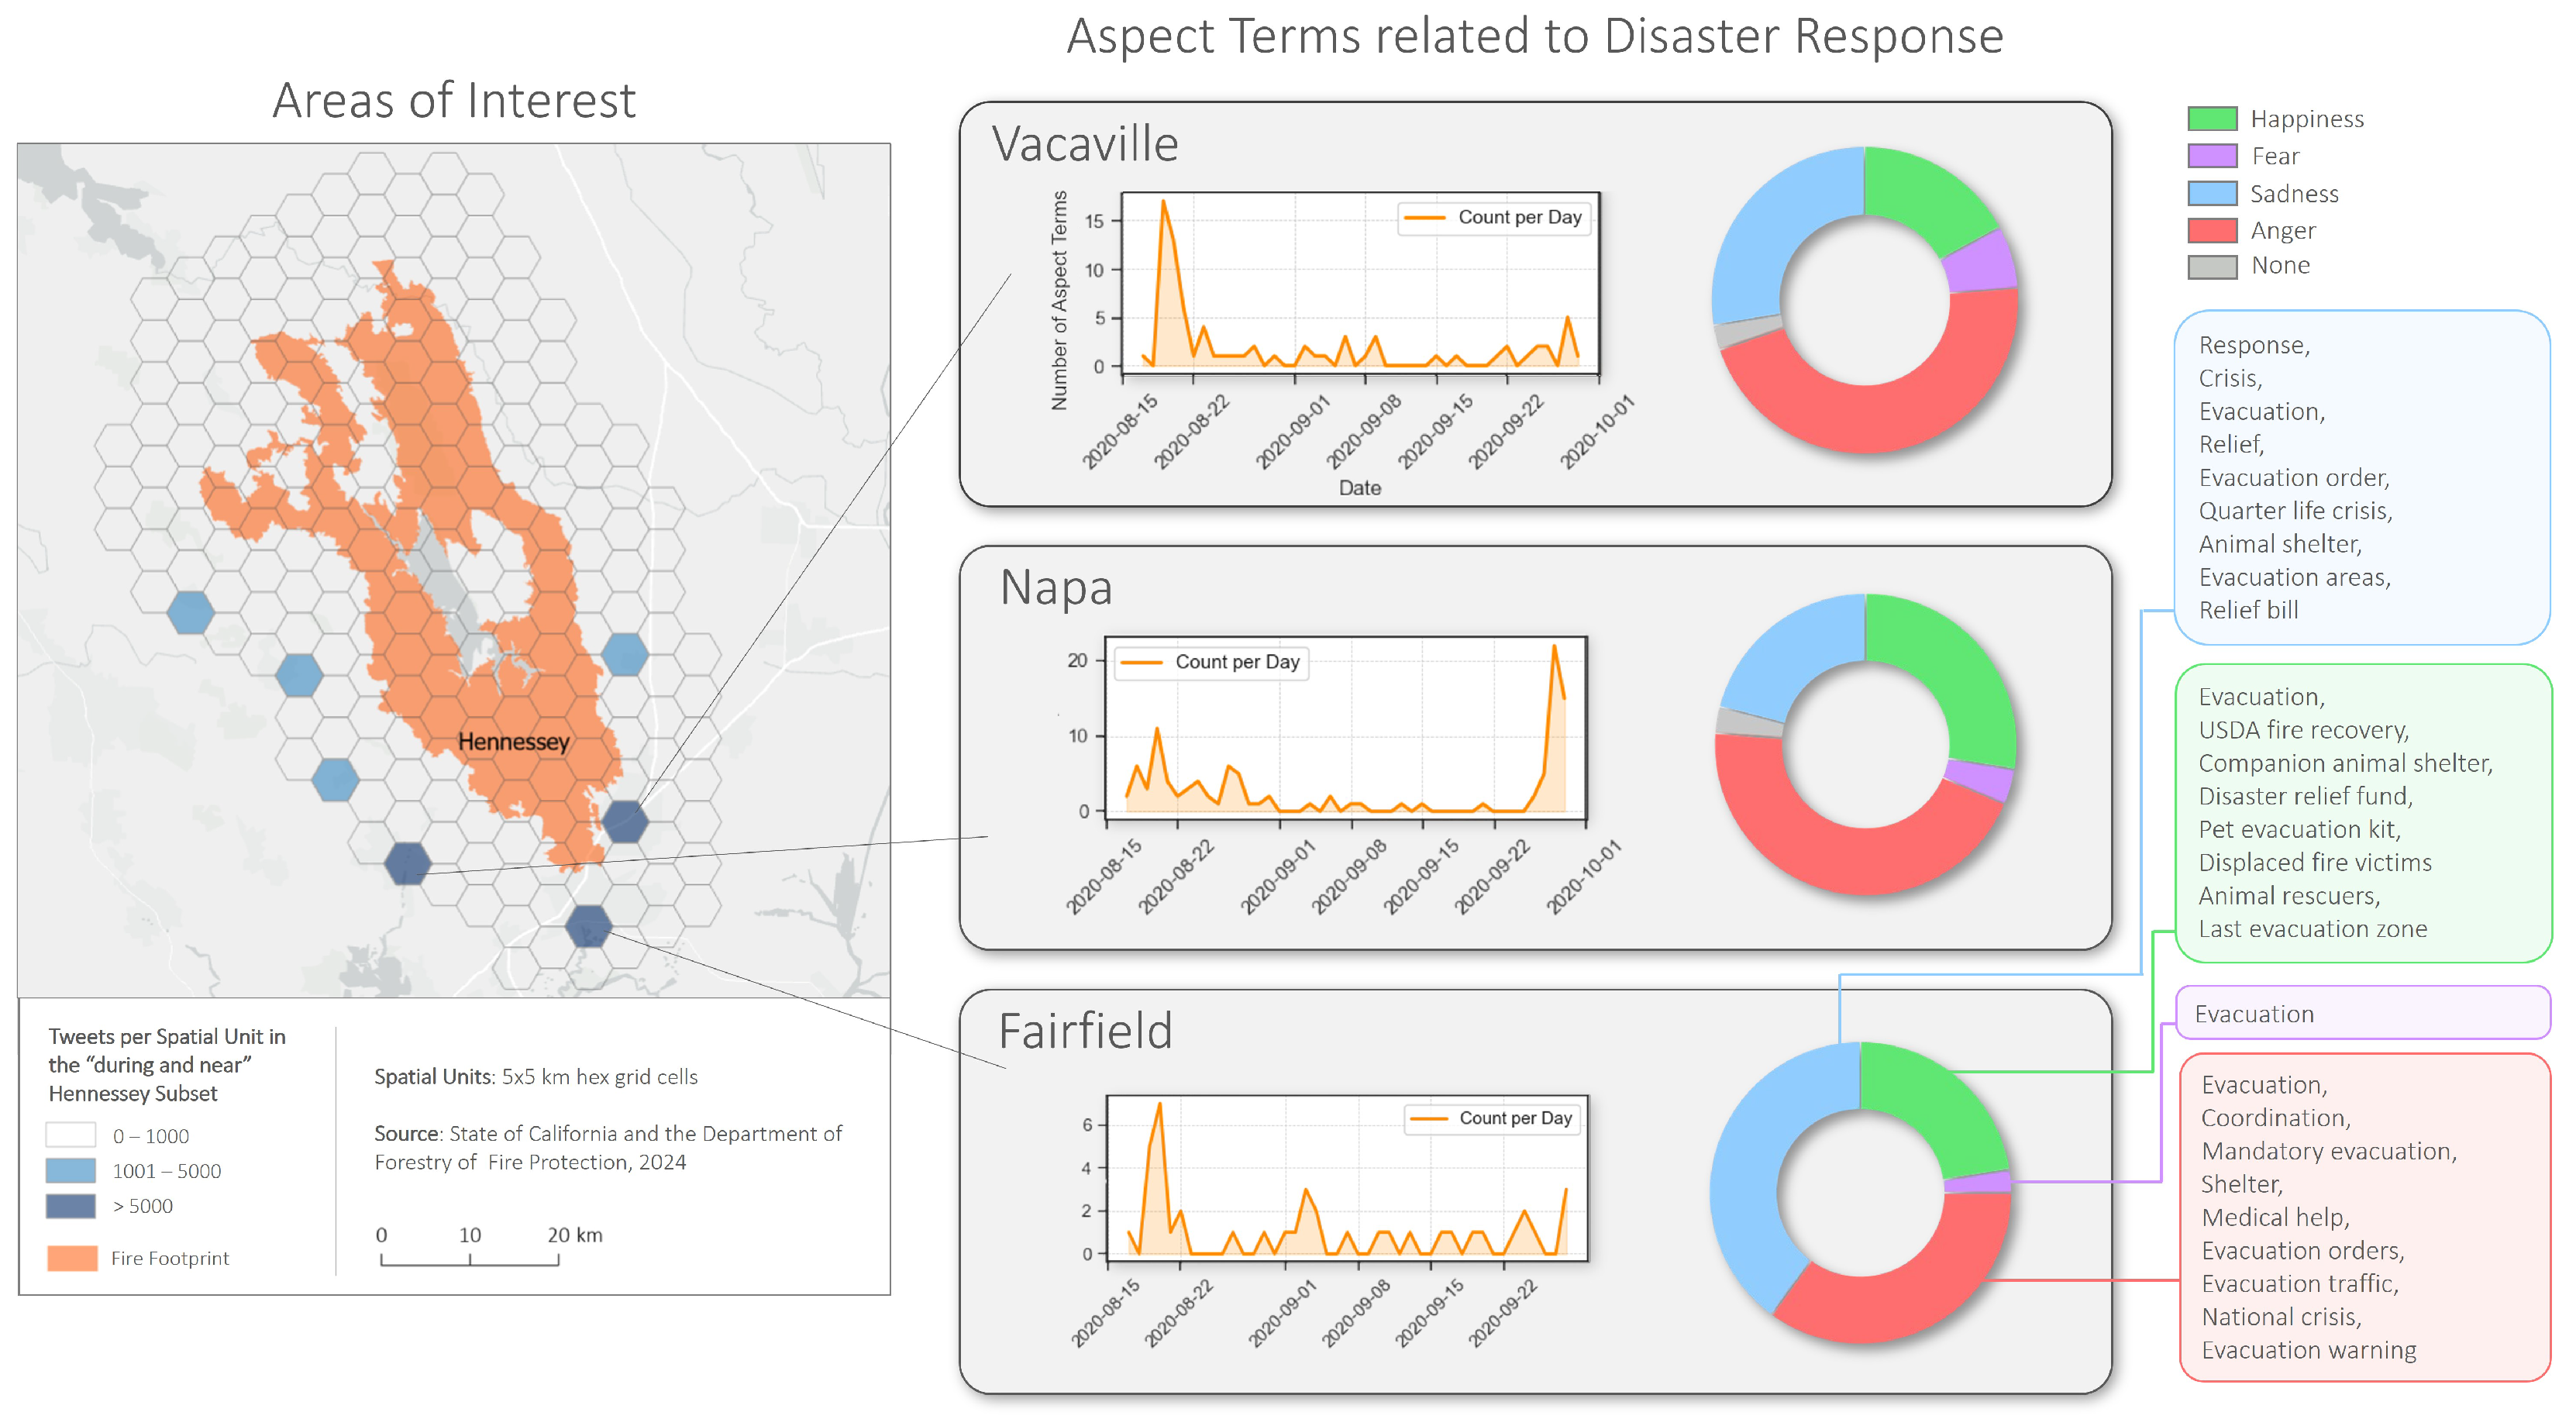
At the local scale, specific areas of interest such as towns in close proximity to fire perimeters can be analyzed by plotting their temporal and emotional ABEA results for “disaster”-related aspect terms. Here, the three cities Vacaville, Napa, and Fairfield, were selected as examples due to their immediate proximity of less than 15 km to the Hennessey wildfire perimeter, and their comparatively high social media activity of over 5000 geolocated tweets originating from their respective 5 × 5 hex grid cell. The temporal and emotional breakdown is shown in Figure 8.
In each of these locations, the frequency and intensity of “disaster response”-related aspect terms revealed slightly different patterns. For example, Vacaville, one of the areas closest to the Hennessey Fire, exhibited a sharp spike in “disaster response” terms during mid-August, reflecting heightened emotional engagement as the fire began to spread and response efforts began. A similar temporal trend was observed for Fairfield, whereas the results for Napa showed a spike in “disaster response”-related aspect terms towards the end of September.
The specific aspect terms for the emotion classes, listed in Figure 8 for Fairfield, revealed that especially evacuation-related topics often corresponded with ‘Anger’. For ‘Happiness’, the aspect terms included animal rescue activities, relief funds, and displaced victims. ‘Sadness’-related aspect terms covered a topically broad spectrum, including the terms ‘crisis’, ‘evacuation’, ‘animal shelter’, or ‘quarter life crisis’. ‘Fear’ and ‘None’ were both far less frequent, with aspect terms for these categories including ‘evacuation’ and ‘roadblock’. For all three cities, the specific aspect terms per emotion showed strong similarities, which are generally represented by the Fairfield example.
These findings can serve as a proof of concept, to show that temporal spikes in disaster-related discussions were aligned with wildfire events in each location. The patterns observed in all three result categories gave a coherent picture of increased emotional engagement with “fire” and “disaster response”-related conversations in social media both near and during large 2020 California wildfires.

5. Discussion

5.1. Limitations of Methodology

It is important to approach the case study results as a proof of concept rather than conclusive findings, due to the limitations of the EmoGRACE model itself, which had signs of overfitting and was based on a rather small training dataset [14]. Since the model’s performance on joint AEC and ATE was notably weaker than for ATE, greater confidence can be placed on the aspect term results than on the emotion classifications.
Our case study was based on historical Twitter data from 2020. We acknowledge that data accessibility from X has changed significantly since then, impeding the replicability of our study. Nevertheless, our methodology, particularly the use of ABEA with short, informal text, remains applicable across other social media platforms such as TikTok, Bluesky, Mastodon, or even localized emergency apps, provided that relevant textual data can be obtained. EmoGRACE, the model used in this study, was optimized for English language input. Applying it to other languages would require prior translation or language-specific model retraining. Nevertheless, while this study focused on U.S.-based wildfires, the general approach is transferable to other regions, although the inferable value for disaster management is influenced by varying platform market shares, cultural communication norms, and language diversity. We also acknowledge that interpretations of social media communications during crises can be enriched by incorporating deeper local context. Future work can seek to involve collaborators with region-specific expertise, ensuring that local nuances, such as community structure, idiomatic expressions, and temporally sensitive behaviors, are comprehensively considered.
Despite these limitations, the case study demonstrates that the combination of ABEA with the spatio-temporal information from geotagged, timestamped tweets, reveals distinct spatial and temporal patterns for subsets during and near wildfires as opposed to those either not during or not near wildfires. Specifically, tweets during and near wildfires showed a clear increase in the frequency of “fire”- and “disaster response”-related aspect terms. For instance, in the first set of results, the ratio comparisons, the subset sizes for “fire”-related aspect term occurrences showed that communication was far more pronounced during and near wildfires. Specific applications of this type of emotion mapping in real-time emergency management could include detecting spikes in fear or confusion near fire zones to adjust evacuation messaging strategies, identifying public frustration with delayed emergency response to reallocate communication efforts, or tracking relief and gratitude expressions as indicators of successful interventions such as shelter access or rescue operations. These results act in favor of continued, future work on spatio-temporal ABEA as a means for disaster response support. To assess the derivation of actionable insights, a more detailed discussion of the case studies is merited, including the implications of the individual dataset locations and sizes, the means available for result validation, and the impact of the Modifiable Areal Unit Problem (MAUP) on spatial analysis.

5.2. Wildfire Subsets

The methodology for creating target subsets, i.e., tweets posted during and near each wildfire, and comparison subsets, i.e., tweets posted outside each wildfire’s temporal and spatial scope, proved effective for some, but not all of the four largest wildfires initially considered. For instance, the Bobcat Fire subset was excluded from further analysis due to its proximity to Los Angeles, where many tweets were geotagged at the city’s centroid (Figure 9). This aggregation distorted the geospatial analysis and reduced fire-related communication, as much of the subset consisted of unrelated content.
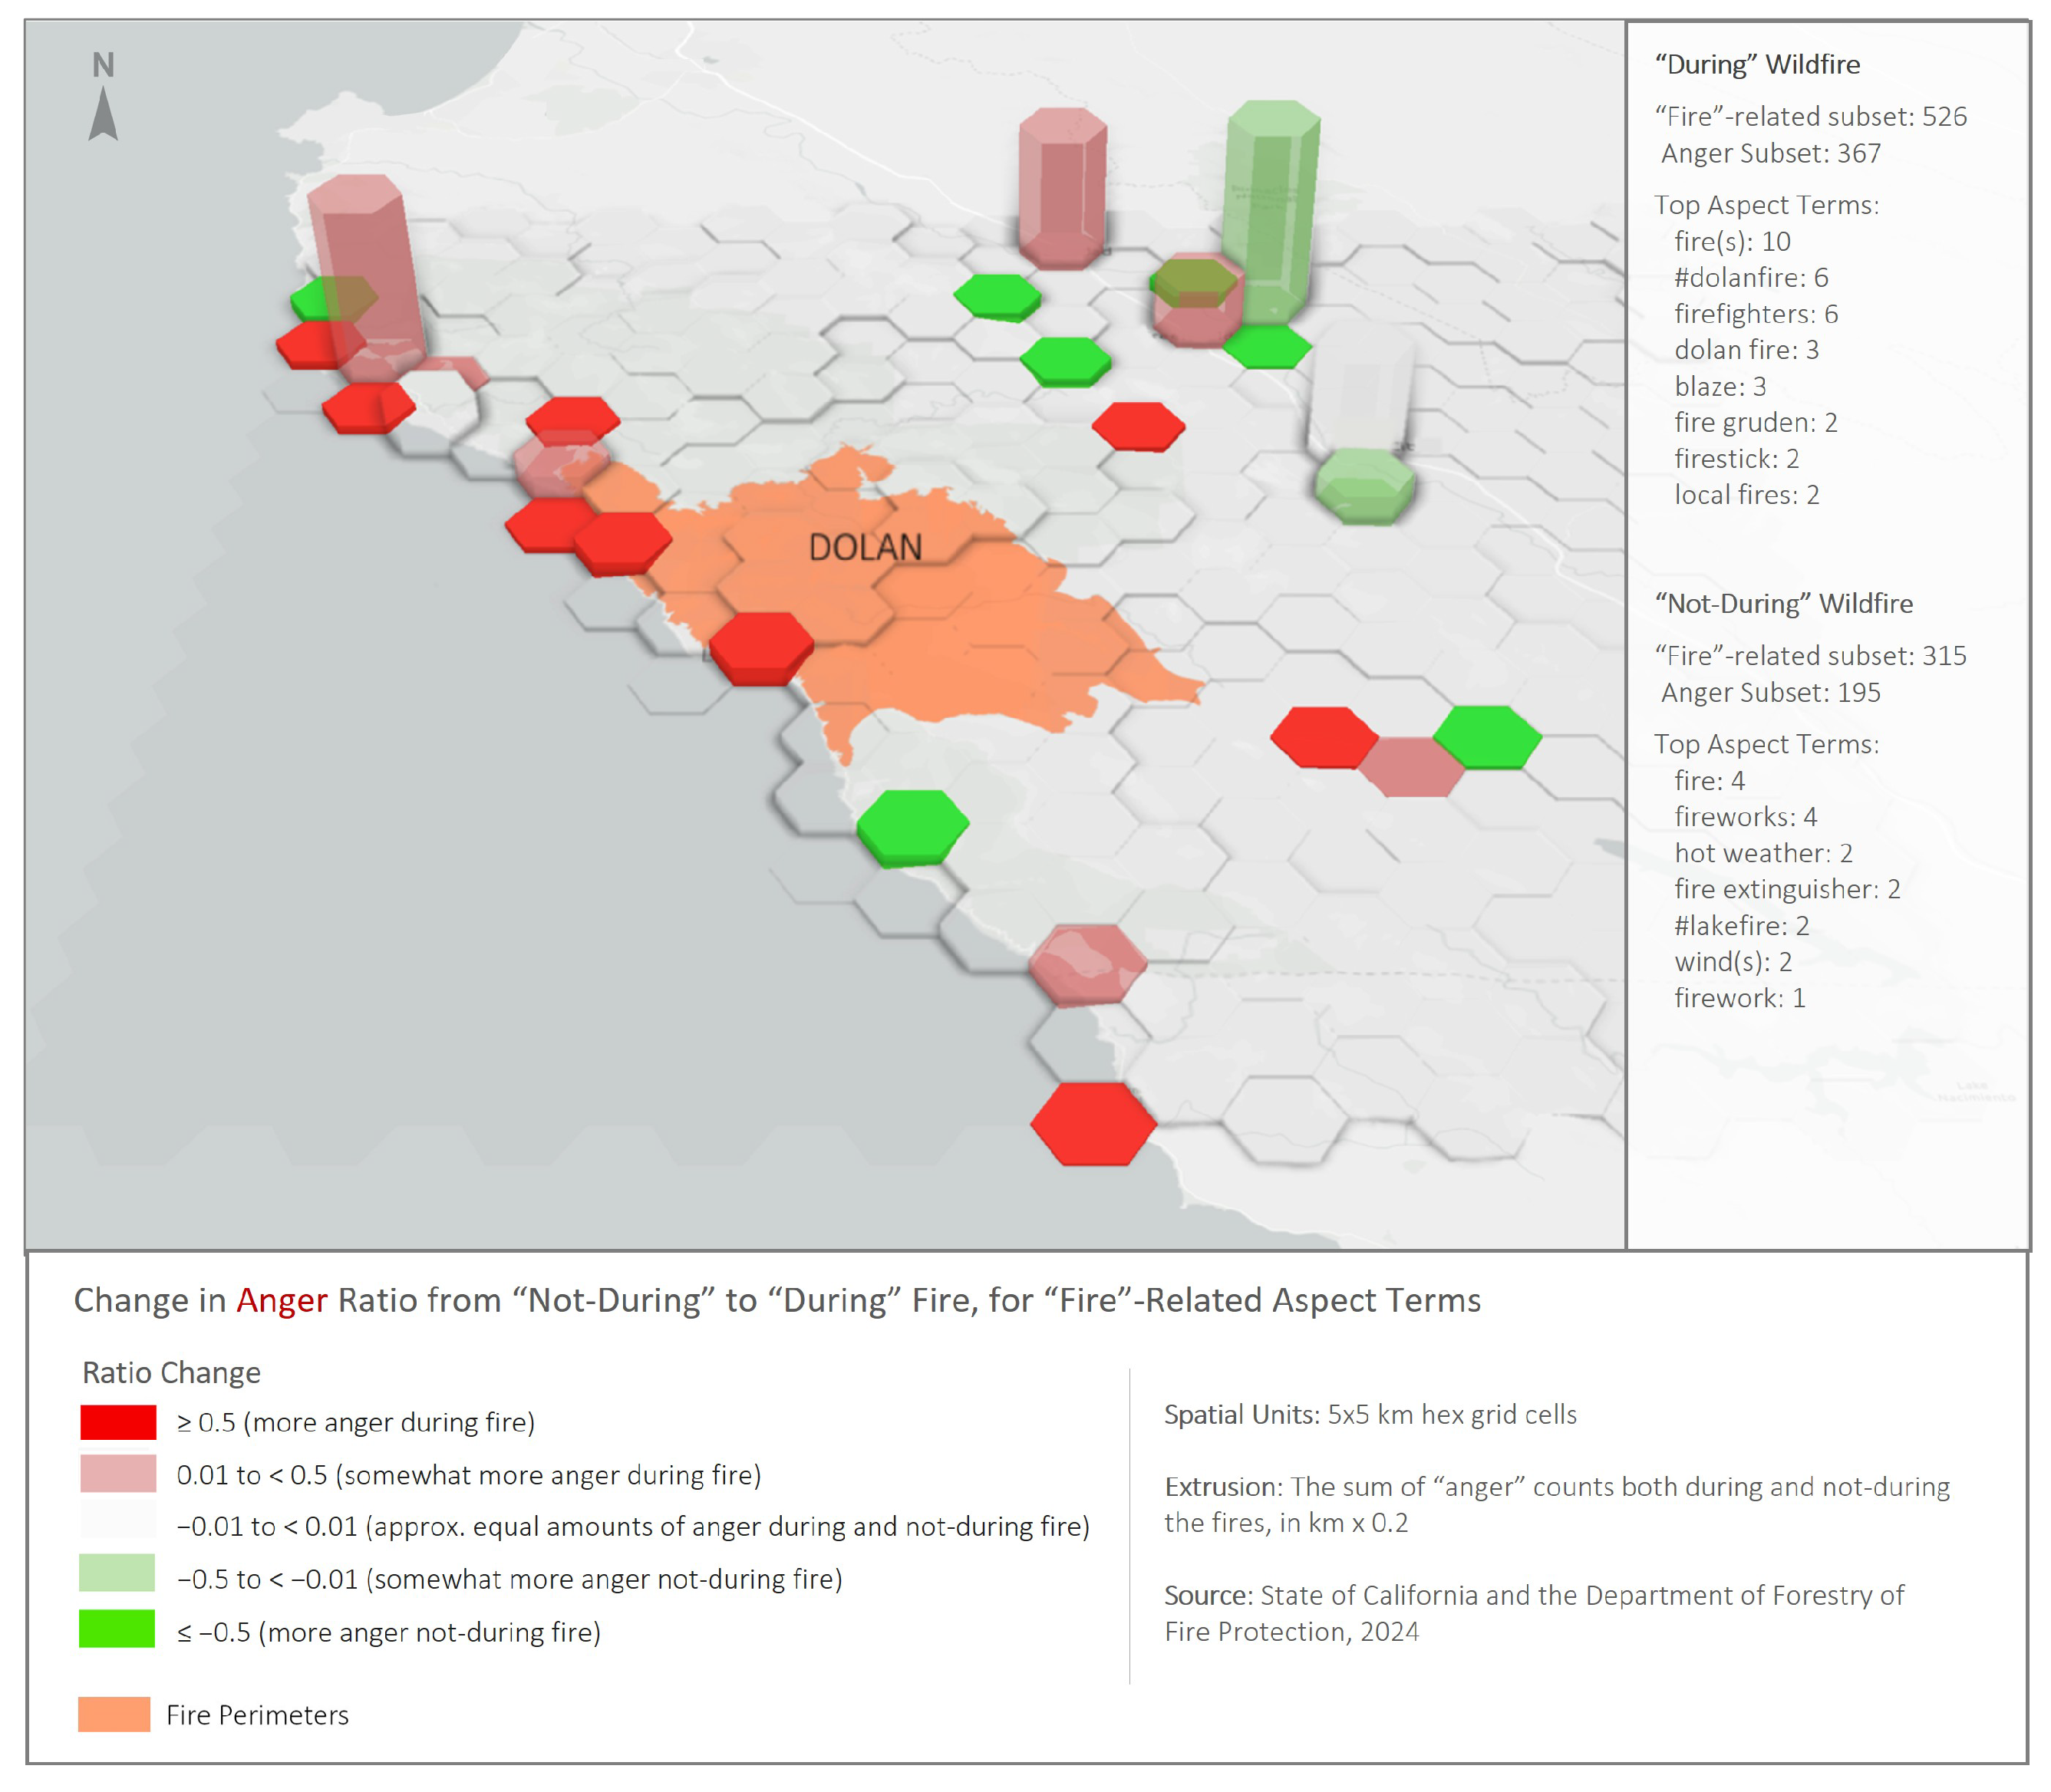
In contrast, the Dolan Fire subset returned too few tweets in the ‘During and Near’ subset. For example, only 526 tweets were identified in the ‘Anger’ subset with “fire”-related aspect terms. When further divided into the hex grid cells, this small sample size became insufficient for meaningful spatial analysis (Figure 10).
However, the SCU Complex Fire and Hennessey Fire were sufficiently distant from major city centers to avoid the distortion of geotags for the city centroid, and not too rural to shrink to inadequate data sizes. In addition, their geographic proximity of roughly 90 km, and temporal alignment, with both fires occurring from mid-August to mid-September, meant that these fire subsets may even have reinforced one another, as local populations were in proximity of two large wildfires, thereby potentially increasing fire-related online conversations.
Future research on spatio-temporal ABEA case studies must include careful consideration of spatial extents selected for the generation of both case and comparison subsets. In this study, a radius of 30 km around the wildfire perimeters was applied to all wildfires equally. To accommodate more and less populated areas, large urban hubs, and varying wildfire footprints dynamic, conditional extent setting may improve subset creation.

5.3. Validation Through Wildfire Data

Bringing together the timeline-based results and the local-scale analysis, the evident spikes in online engagement in the topics of “fire”- and “disaster response”-related discussion can be validated through available spatio-temporal data of the wildfires. In the case of the Hennessey Fire, data for August 2020 is available with daily intervals showing significant fire expansion on August 18 and 19, particularly in areas close to Vacaville and Fairfield [38]. This rapid spread coincides with the first major spike in both “fire” and “disaster response”-related aspect terms, as observed in the local-scale analysis (Figure 8) and the broader temporal trends for the Hennessey Fire (Figure 6 and Figure 7). The geographic proximity to rapidly burning areas likely intensified public discussions, particularly around evacuation and disaster response efforts. The identified relation between increased online engagement and wildfire onsets is also supported by García et al. [30]’s study of the 2017 Tubb’s Fire, which also found that Twitter activity increased particularly at the onset of the event.
Furthermore, the late peak in “disaster response”-related aspect terms for Napa towards the end of September Figure 7 aligned with the start of the Glass Fire, another large wildfire near Napa. This additional event likely caused the renewed spikes in “disaster response”-related discussions, even as the Hennessey Fire neared containment. The temporal and spatial alignment of these spikes with the start of new wildfires underscores the potential usefulness of real-time insights that may be obtained from spatio-temporal ABEA. This could, for instance, provide first aid organizations with more precise information about the public perception of measures already implemented (e.g., anger about lack of measures, joy about support) and thus inform their disaster management strategy.

5.4. Modifiable Area Unit Problem

As a premise to any actionable insights from spatial patterns detected in the emotion ratio changes, it is essential to consider the MAUP. It refers to the inconsistency of results obtained from spatial analyses where geographical units are artificially demarcated, regardless of whether they are regular, such as hex grids, or irregular, such as administrative boundaries [48]. Depending on the scale and zoning methods to create spatial units, the analysis results can change considerably [49].
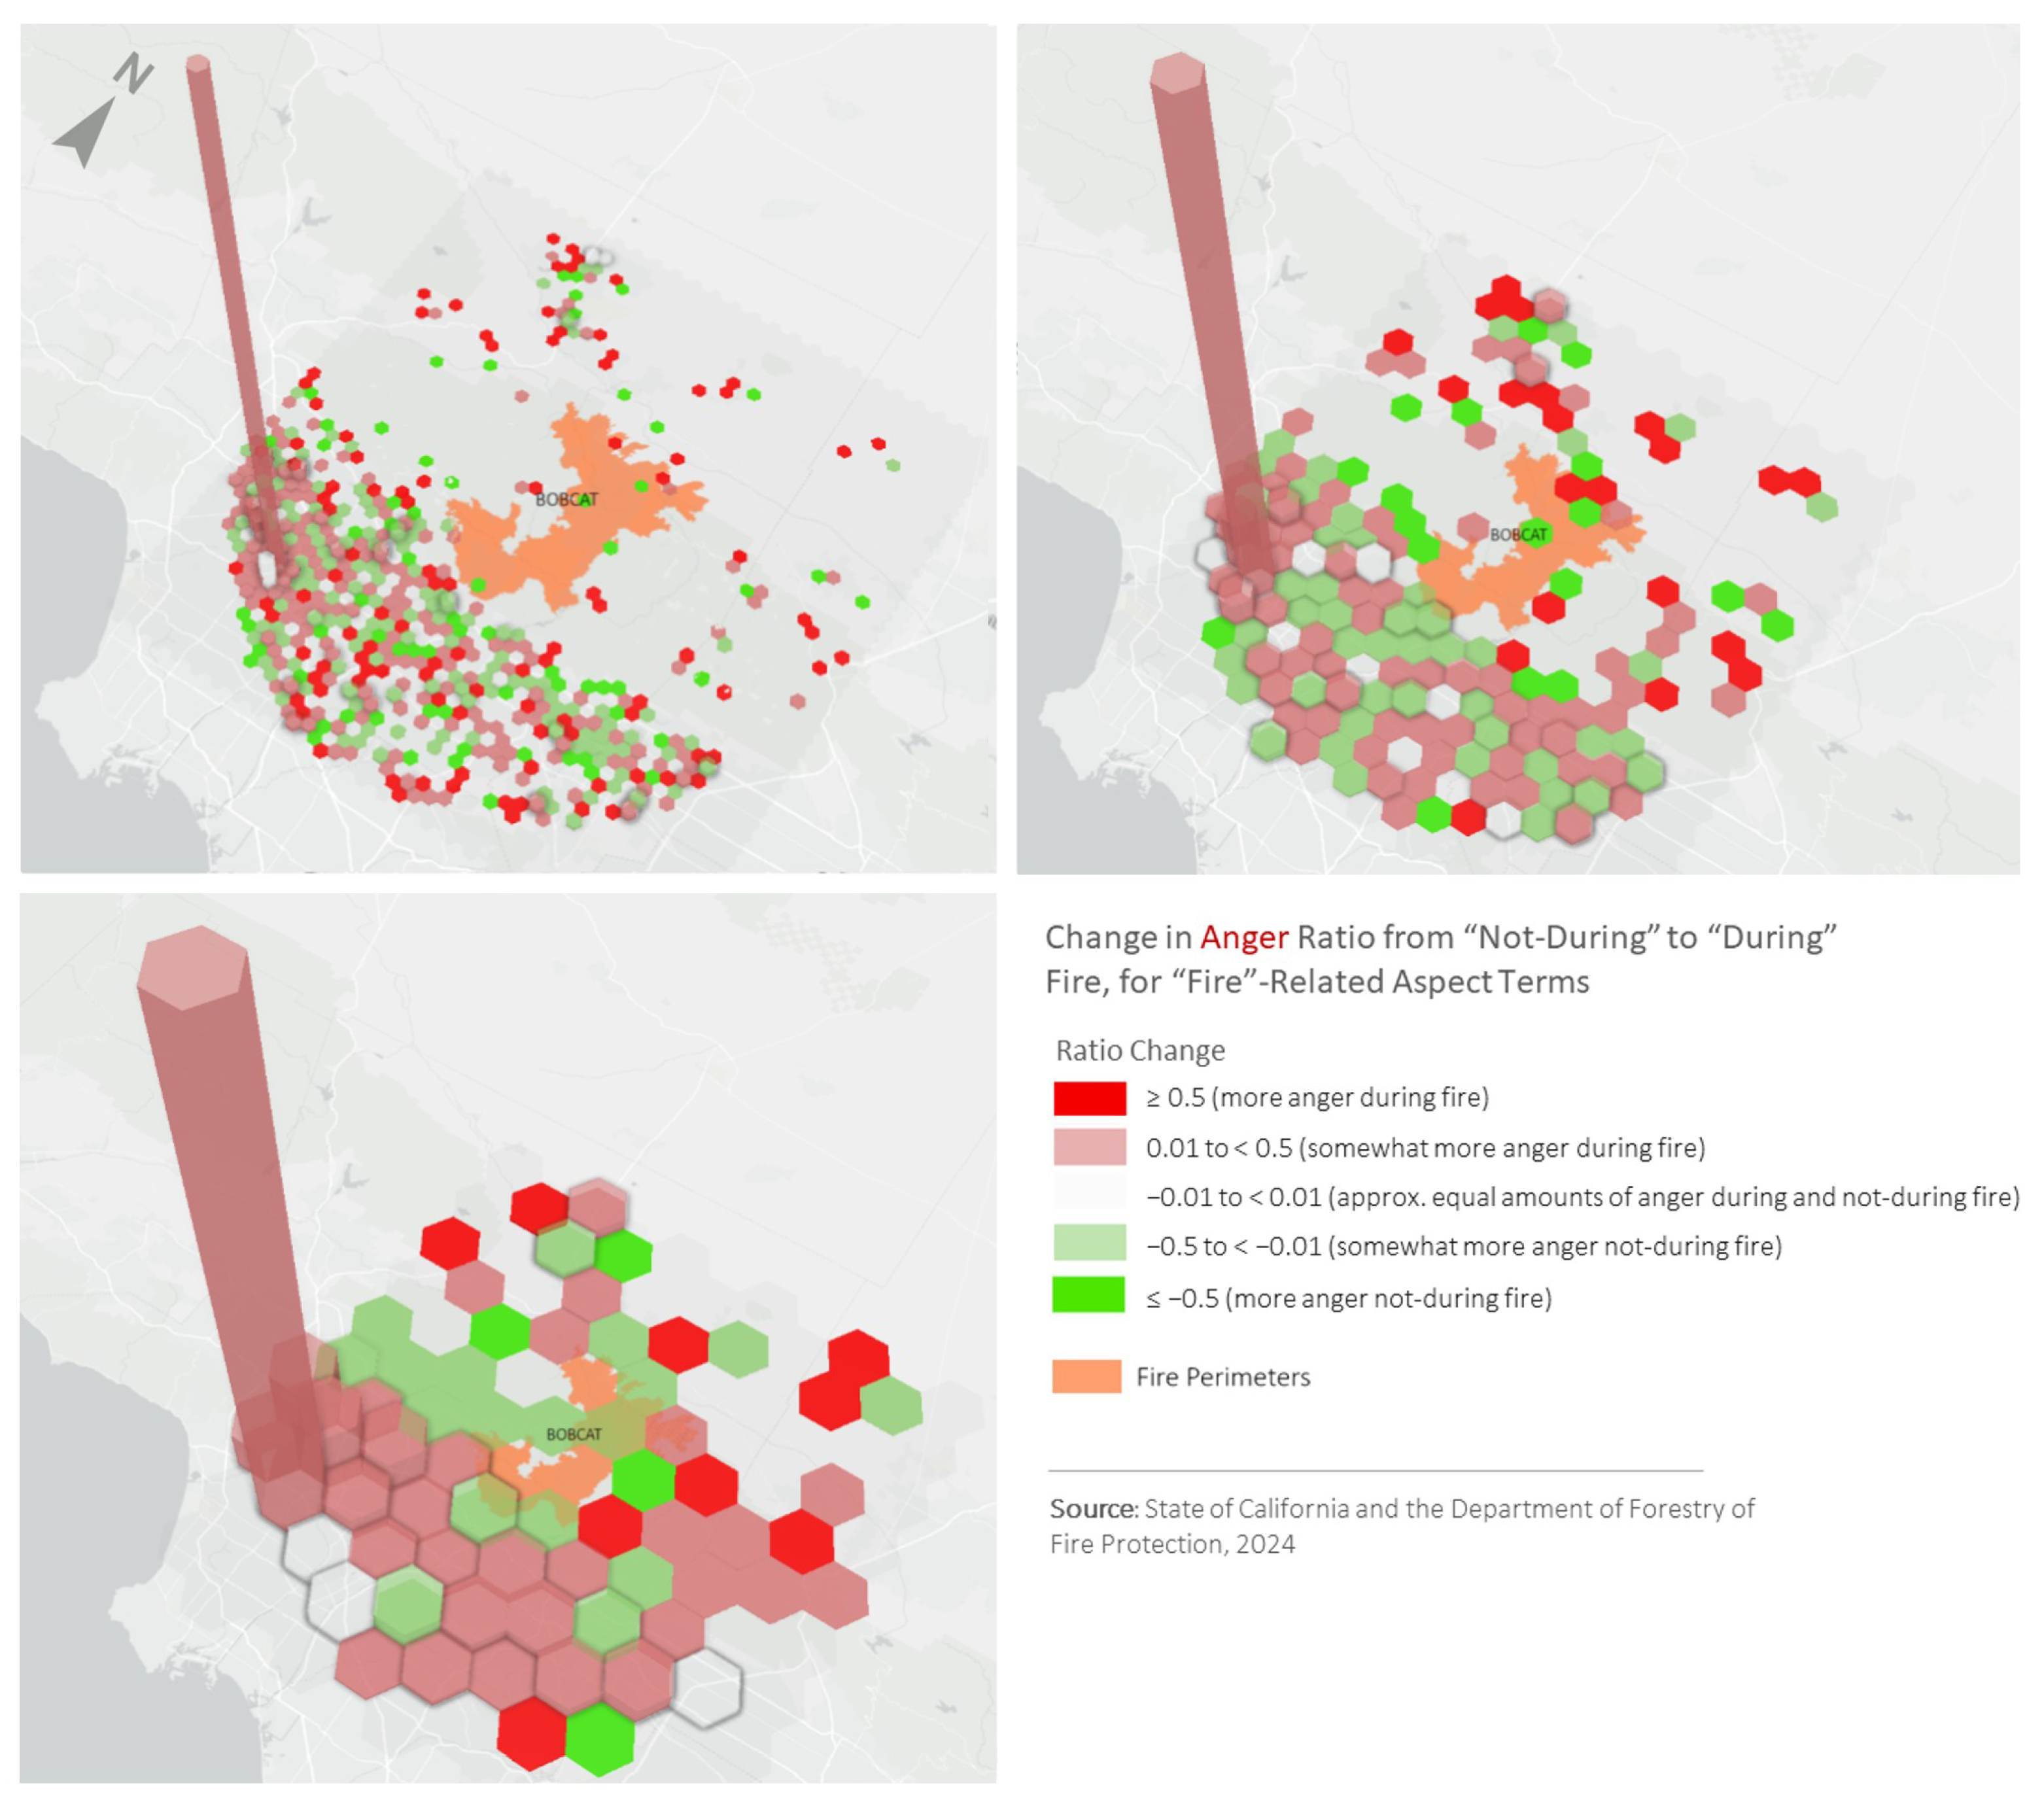
The spatial heterogeneity of the Twitter data, i.e., its strong variation in data density, especially in cities and at the centroid of cities’ bounding boxes, significantly enhances MAUP during analysis. While this issue is not avoidable when performing spatial analyses by dividing data into geographical units, it can be made explicit and transparent by providing results for several different unit sizes. During initial tests on the Bobcat subset, three cell sizes were considered as spatial units: 2 × 2 km, 5 × 5 km, and 10 × 10 km (see Figure 11). Results showed that 10 × 10 km grid cells overly generalized the results, extrapolating localized results beyond their applicable extent. The 2 × 2 km grid, on the other hand, did not generalize enough to show general trends. Therefore, in an effort to minimize erroneous distortions while highlighting meaningful spatial differences, the 5 × 5 km grid was chosen as spatial unit. In practical applications of spatio-temporal ABEA, prior agreement with first responders on the appropriate spatial scale is likely an essential prerequisite to obtain actionable insights.
Despite the conceptual evidence for practical utility offered from these results, this case study must be regarded as a mere proof of concept due to the propagated shortcomings of previous steps. To ultimately achieve real-world applicability further improvements to model training will be necessary. A more robust ABEA model could offer valuable insights into the emotional narratives among local communities affected by disasters. This in turn would allow emergency responders and policymakers to adjust their response and communication strategies towards the needs and concerns of those communities during crises.

6. Conclusions

This research addressed existing research gaps in the field of ABEA, specifically to its application to a disaster-related case study. As a proof of concept, and with careful consideration of the dataset limitations and potential biases introduced during model fine-tuning [14], spatio-temporal analyses were conducted for ABEA inferences of georeferenced tweets on the 2020 California wildfires.
Our analysis revealed distinct spatio-temporal patterns in emotional responses to wildfires, with regions near the fire perimeters showing considerable increases in sadness, fear, and anger. Temporal trends indicated that wildfire-related discussions peaked during key fire events, with emotions such as anger and sadness being dominant, while happiness often appeared in the context of relief efforts. A closer inspection of specific towns near the Hennessey Fire further demonstrated that disaster-related communication aligned with fire progression and response activities. As these findings show the potential of using ABEA to derive more fine-grained information on public emotions from geo-social media data during crises, this first study can be considered motivation for continued research into spatio-temporal ABEA.
This paper presented a use case relating to a major natural disaster to demonstrate the feasibility of combining ABEA with geospatial analyses. However, an application of the presented methodology to many other topics, e.g., related to political issues, is also possible. This also includes the application to texts from other data sources, e.g., social media platforms such as Bluesky or TikTok. Future research could enhance the multilingual and cross-regional applicability of the model by adapting EmoGRACE to additional languages and incorporating deeper local context. These extensions would further establish ABEA as a versatile tool for real-time, emotion-aware social media analysis across domains and regions.

Author Contributions

Conceptualization, Christina Zorenböhmer, Shaily Gandhi, Sebastian Schmidt and Bernd Resch; Methodology, Christina Zorenböhmer; Software, Christina Zorenböhmer; Validation, Christina Zorenböhmer and Shaily Gandhi; Formal analysis, Christina Zorenböhmer; Investigation, Christina Zorenböhmer, Shaily Gandhi and Sebastian Schmidt; Resources, Bernd Resch; Data curation, Christina Zorenböhmer and Sebastian Schmidt; Writing—original draft, Christina Zorenböhmer, Shaily Gandhi and Sebastian Schmidt; Writing—review & editing, Shaily Gandhi and Sebastian Schmidt; Visualization, Christina Zorenböhmer; Supervision, Bernd Resch; Project administration, Bernd Resch; Funding acquisition, Bernd Resch. All authors have read and agreed to the published version of the manuscript.

Funding

This project has received funding from the European Commission—European Union under HORIZON EUROPE (HORIZON Research and Innovation Actions) under grant agreement 101093003 (HORIZON-CL4-2022-DATA-01-01). Views and opinions expressed are however those of the authors only and do not necessarily reflect those of the European Union—European Commission. Neither the European Commission nor the European Union can be held responsible for them.

Data Availability Statement

The data presented in this study are available on request from the corresponding author.

Conflicts of Interest

The authors declare no conflicts of interest.

Abbreviations

The following abbreviations are used in this manuscript:
ABEAAspect-based Emotion Analysis.
ABSAAspect-based Sentiment Analysis.
AECAspect Emotion Classification.
APIApplication Programming Interface.
ATEAspect Term Extraction.
BERTBidirectional Encoder Representations from Transformers.
MAUPModifiable Areal Unit Problem.
SASentiment Analysis.

References

  1. Imran, M.; Castillo, C.; Diaz, F.; Vieweg, S. Processing Social Media Messages in Mass Emergency: A Survey. ACM Comput. Surv. 2015, 47, 67. [Google Scholar] [CrossRef]
  2. Acikara, T.; Xia, B.; Yigitcanlar, T.; Hon, C. Contribution of Social Media Analytics to Disaster Response Effectiveness: A Systematic Review of the Literature. Sustainability 2023, 15, 8860. [Google Scholar] [CrossRef]
  3. Sun, J.; Qi, W.; Huang, Y.; Xu, C.; Yang, W. Facing the Wildfire Spread Risk Challenge: Where Are We Now and Where Are We Going? Fire 2023, 6, 228. [Google Scholar] [CrossRef]
  4. Neppalli, V.; Caragea, C.; Squicciarini, A.; Tapia, A.; Stehle, S. Sentiment analysis during Hurricane Sandy in emergency response. Int. J. Disaster Risk Reduct. 2017, 21, 213–222. [Google Scholar] [CrossRef]
  5. Liu, H.; Chatterjee, I.; Zhou, M.; Lu, X.S.; Abusorrah, A. Aspect-Based Sentiment Analysis: A Survey of Deep Learning Methods. IEEE Trans. Comput. Soc. Syst. 2020, 7, 1358–1375. [Google Scholar] [CrossRef]
  6. Pontiki, M.; Galanis, D.; Papageorgiou, H.; Androutsopoulos, I.; Manandhar, S.; Al-Smadi, M.; Al-Ayyoub, M.; Zhao, Y.; Qin, B.; De Clercq, O.; et al. SemEval-2016 Task 5: Aspect Based Sentiment Analysis. In Proceedings of the 10th International Workshop on Semantic Evaluation (SemEval-2016), San Diego, CA, USA, 16–17 June 2016; pp. 19–30. [Google Scholar] [CrossRef]
  7. Balahur, A.; Mihalcea, R.; Montoyo, A. Computational approaches to subjectivity and sentiment analysis: Present and envisaged methods and applications. Comput. Speech Lang. 2014, 28, 1–6. [Google Scholar] [CrossRef]
  8. Kryvasheyeu, Y.; Chen, H.; Obradovich, N.; Moro, E.; Hentenryck, P.V.; Fowler, J.; Cebrian, M. Rapid assessment of disaster damage using social media activity. Sci. Adv. 2016, 2, e1500779. [Google Scholar] [CrossRef]
  9. Jabalameli, S.; Xu, Y.; Shetty, S. Spatial and sentiment analysis of public opinion toward COVID-19 pandemic using twitter data: At the early stage of vaccination. Int. J. Disaster Risk Reduct. 2022, 80, 103204. [Google Scholar] [CrossRef] [PubMed]
  10. Sirisha, U.; Chandana, B.S. Aspect Based Sentiment & Emotion Analysis with ROBERTa, LSTM. Int. J. Adv. Comput. Sci. Appl. 2022, 13, 766–774. [Google Scholar] [CrossRef]
  11. Paolanti, M.; Mancini, A.; Frontoni, E.; Felicetti, A.; Marinelli, L.; Marcheggiani, E.; Pierdicca, R. Tourism destination management using sentiment analysis and geo-location information: A deep learning approach. Inf. Technol. Tour. 2021, 23, 241–264. [Google Scholar] [CrossRef]
  12. Tas, D.; Sanatani, R.P. Geo-located Aspect Based Sentiment Analysis (ABSA) for Crowdsourced Evaluation of Urban Environments. arXiv 2023, arXiv:2312.12253. [Google Scholar] [CrossRef]
  13. Ruz, G.A.; Henríquez, P.A.; Mascareño, A. Sentiment analysis of Twitter data during critical events through Bayesian networks classifiers. Future Gener. Comput. Syst. 2020, 106, 92–104. [Google Scholar] [CrossRef]
  14. Zorenböhmer, C.; Schmidt, S.; Resch, B. EmoGRACE: Aspect-based emotion analysis for social media data. arXiv 2025, arXiv:2503.15133. [Google Scholar]
  15. Havas, C.; Resch, B. Portability of Semantic and Spatial-Temporal Machine Learning Methods to Analyse Social Media for near-Real-Time Disaster Monitoring. Nat. Hazards 2021, 108, 2939–2969. [Google Scholar] [CrossRef]
  16. Xu, Z.; Zhang, H.; Sugumaran, V.; Choo, K.R.; Mei, L.; Zhu, Y. Participatory sensing-based semantic and spatial analysis of urban emergency events using mobile social media. J. Wirel. Commun. Netw. 2016, 2016, 44. [Google Scholar] [CrossRef]
  17. Xu, L.; Li, H.; Lu, W.; Bing, L. Position-Aware Tagging for Aspect Sentiment Triplet Extraction. arXiv 2020, arXiv:2010.02609. [Google Scholar]
  18. Yue, L.; Chen, W.; Li, X.; Zuo, W.; Yin, M. A Survey of Sentiment Analysis in Social Media. Knowl. Inf. Syst. 2019, 60, 617–663. [Google Scholar] [CrossRef]
  19. Drus, Z.; Khalid, H. Sentiment Analysis in Social Media and Its Application: Systematic Literature Review. Procedia Comput. Sci. 2019, 161, 707–714. [Google Scholar] [CrossRef]
  20. Schmidt, S.; Friedemann, M.; Hanny, D.; Resch, B.; Riedlinger, T.; Mühlbauer, M. Enhancing Satellite-Based Emergency Mapping: Identifying Wildfires through Geo-Social Media Analysis. Big Earth Data 2025, 1–23. [Google Scholar] [CrossRef]
  21. Pinto, J.C.; Gonçalo Oliveira, H.; Cardoso, A.; Silva, C. Generating Wildfire Heat Maps with Twitter and BERT. In Intelligent Data Engineering and Automated Learning—IDEAL 2023; Quaresma, P., Camacho, D., Yin, H., Gonçalves, T., Julian, V., Tallón-Ballesteros, A.J., Eds.; Springer Nature: Cham, Switzerland, 2023; Volume 14404, pp. 82–94. [Google Scholar] [CrossRef]
  22. Zohar, M.; Genossar, B.; Avny, R.; Tessler, N.; Gal, A. Spatiotemporal Analysis in High Resolution of Tweets Associated with the November 2016 Wildfire in Haifa (Israel). Int. J. Disaster Risk Reduct. 2023, 92, 103720. [Google Scholar] [CrossRef]
  23. Wang, Z.; Ye, X.; Tsou, M.H. Spatial, Temporal, and Content Analysis of Twitter for Wildfire Hazards. Nat. Hazards 2016, 83, 523–540. [Google Scholar] [CrossRef]
  24. Dong, Z.S.; Meng, L.; Christenson, L.; Fulton, L. Social Media Information Sharing for Natural Disaster Response. Nat. Hazards 2021, 107, 2077–2104. [Google Scholar] [CrossRef]
  25. Ma, Y.P.; Shu, X.M.; Shen, S.F.; Song, J.; Li, G.; Liu, Q.Y. Study on Network Public Opinion Dissemination and Coping Strategies in Large Fire Disasters. Procedia Eng. 2014, 71, 616–621. [Google Scholar] [CrossRef]
  26. Fan, Q.; Xu, G. Real-Time Prediction Model of Public Safety Events Driven by Multi-Source Heterogeneous Data. Front. Phys. 2025, 13, 1553640. [Google Scholar] [CrossRef]
  27. Spinsanti, L.; Ostermann, F. Automated geographic context analysis for volunteered information. Appl. Geogr. 2013, 43, 36–44. [Google Scholar] [CrossRef]
  28. Kent, J.D.; Capello, H.T., Jr. Spatial patterns and demographic indicators of effective social media content during the Horsethief Canyon fire of 2012. Cartogr. Geogr. Inf. Sci. 2013, 40, 78–89. [Google Scholar] [CrossRef]
  29. Loureiro, M.L.; Alló, M.; Coello, P. Hot in Twitter: Assessing the Emotional Impacts of Wildfires with Sentiment Analysis. Ecol. Econ. 2022, 200, 107502. [Google Scholar] [CrossRef]
  30. García, Y.E.; Villa-Pérez, M.E.; Li, K.; Tai, X.H.; Trejo, L.A.; Daza-Torres, M.L.; Montesinos-López, J.C.; Nuño, M. Wildfires and Social Media Discourse: Exploring Mental Health and Emotional Wellbeing Through Twitter. Front. Public Health 2024, 12, 1349609. [Google Scholar] [CrossRef] [PubMed]
  31. Grace, R. Crisis social media data labeled for storm-related information and toponym usage. Data Brief 2020, 30, 105595. [Google Scholar] [CrossRef]
  32. Hutto, C.; Gilbert, E. VADER: A Parsimonious Rule-Based Model for Sentiment Analysis of Social Media Text. Proc. Int. AAAI Conf. Web Soc. Media 2014, 8, 216–225. [Google Scholar] [CrossRef]
  33. Li, L.; Ma, Z.; Cao, T. Data-Driven Investigations of Using Social Media to Aid Evacuations Amid Western United States Wildfire Season. Fire Saf. J. 2021, 126, 103480. [Google Scholar] [CrossRef]
  34. Lever, J.; Arcucci, R. Sentimental Wildfire: A Social-Physics Machine Learning Model for Wildfire Nowcasting. J. Comput. Soc. Sci. 2022, 5, 1427–1465. [Google Scholar] [CrossRef]
  35. Win Myint, P.Y.; Lo, S.L.; Zhang, Y. Unveiling the dynamics of crisis events: Sentiment and emotion analysis via multi-task learning with attention mechanism and subject-based intent prediction. Inf. Process. Manag. 2024, 61, 103695. [Google Scholar] [CrossRef]
  36. Aguilar, G. Neural Sequence Labeling on Social Media Text. 2020. Available online: https://uh-ir.tdl.org/bitstreams/bae93d6e-13d1-40d0-96e5-cdbeb8d19a10/download (accessed on 11 July 2025).
  37. Mitchell, M.; Aguilar, J.; Wilson, T.; Van Durme, B. Open Domain Targeted Sentiment. In Proceedings of the 2013 Conference on Empirical Methods in Natural Language Processing, Seattle, WA, USA, 18–21 October 2013; Yarowsky, D., Baldwin, T., Korhonen, A., Livescu, K., Bethard, S., Eds.; pp. 1643–1654. [Google Scholar]
  38. CalFire. 2020 Incident Archive. 2024. Available online: https://www.fire.ca.gov/incidents/2020 (accessed on 25 October 2024).
  39. Keeley, J.E.; Syphard, A.D. Large California Wildfires: 2020 Fires in Historical Context. Fire Ecol. 2021, 17, 25. [Google Scholar] [CrossRef]
  40. Li, S.; Baijnath-Rodino, J.A.; York, R.A.; Quinn-Davidson, L.N.; Banerjee, T. Temporal and spatial pattern analysis of escaped prescribed fires in California from 1991 to 2020. Fire Ecol. 2025, 21, 3. [Google Scholar] [CrossRef]
  41. Schmidt, S.; Zorenböhmer, C.; Arifi, D.; Resch, B. Polarity-Based Sentiment Analysis of Georeferenced Tweets Related to the 2022 Twitter Acquisition. Information 2023, 14, 71. [Google Scholar] [CrossRef]
  42. Honzák, K.; Schmidt, S.; Resch, B.; Ruthensteiner, P. Contextual Enrichment of Crowds from Mobile Phone Data through Multimodal Geo-Social Media Analysis. ISPRS Int. J. Geo-Inf. 2024, 13, 350. [Google Scholar] [CrossRef]
  43. Beverly, J.L.; Forbes, A.M. Assessing Directional Vulnerability to Wildfire. Nat. Hazards 2023, 117, 831–849. [Google Scholar] [CrossRef]
  44. Bathina, K.C.; ten Thij, M.; Bollen, J. Quantifying Societal Emotional Resilience to Natural Disasters from Geo-Located Social Media Content. PLoS ONE 2022, 17, e0269315. [Google Scholar] [CrossRef]
  45. Luo, H.; Ji, L.; Li, T.; Jiang, D.; Duan, N. GRACE: Gradient Harmonized and Cascaded Labeling for Aspect-Based Sentiment Analysis. In Proceedings of the Findings of the Association for Computational Linguistics: EMNLP 2020, Online, 16–20 November 2020; pp. 54–64. [Google Scholar] [CrossRef]
  46. Birch, C.P.D.; Oom, S.P.; Beecham, J.A. Rectangular and Hexagonal Grids Used for Observation, Experiment, and Simulation in Ecology. Ecol. Model. 2007, 206, 347–359. [Google Scholar] [CrossRef]
  47. Wieland, M.; Schmidt, S.; Resch, B.; Abecker, A.; Martinis, S. Fusion of Geospatial Information from Remote Sensing and Social Media to Prioritise Rapid Response Actions in Case of Floods. Nat. Hazards 2025, 121, 8061–8088. [Google Scholar] [CrossRef]
  48. Wong, D.W. The Modifiable Areal Unit Problem (MAUP). In WorldMinds: Geographical Perspectives on 100 Problems; Brunn, S.D., Cutter, S.L., Harrington, J.W., Eds.; Springer: Dordrecht, The Netherlands, 2004; pp. 571–575. [Google Scholar]
  49. Loidl, M.; Wallentin, G.; Wendel, R.; Zagel, B. Mapping Bicycle Crash Risk Patterns on the Local Scale. Safety 2016, 2, 17. [Google Scholar] [CrossRef]
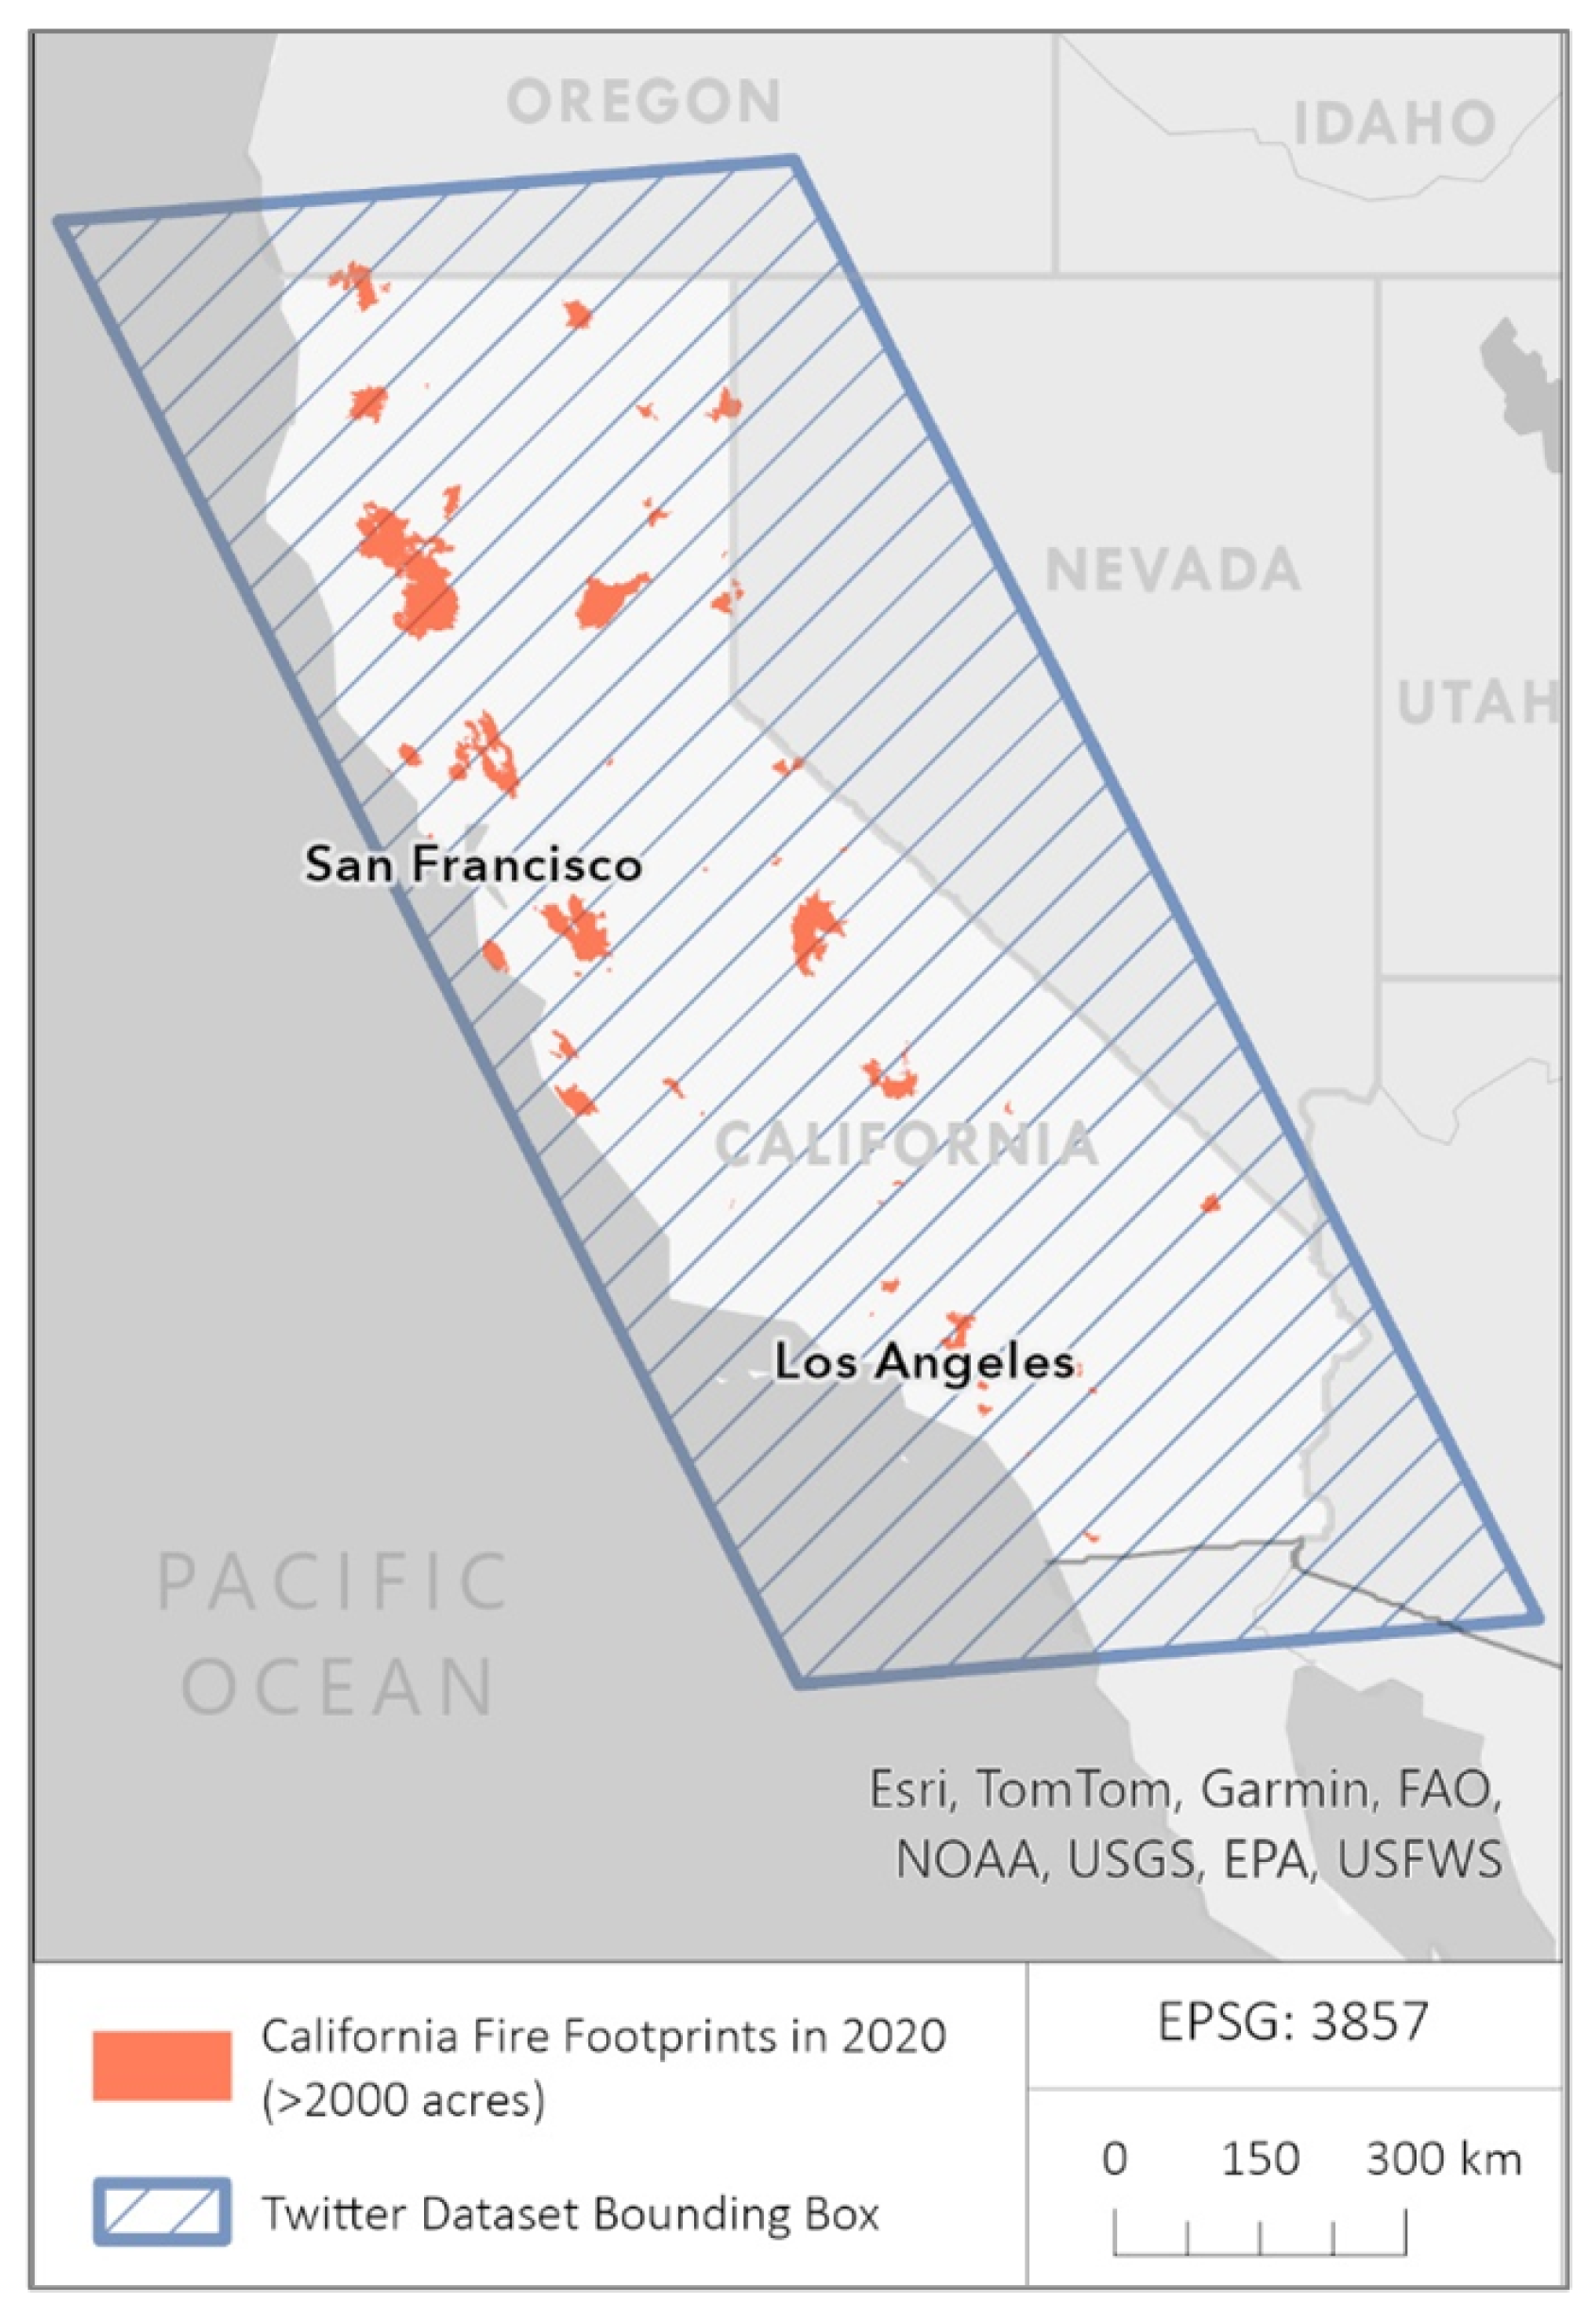
Figure 1. Overview of 2020 California case study bounding box and fire footprints (>2000 acres).
Ijgi 14 00301 g001
Figure 2. California wildfire season 2020: Wildfire and Twitter datasets overview.
Ijgi 14 00301 g002
Figure 3. Schematic view of the emotion ratio change calculation for the ‘during’ and ‘not during’ subsets.
Ijgi 14 00301 g003
Figure 4. Change in Sadness ratio for the SCU Complex Fire, comparing “during” with “not-during” Subsets.
Ijgi 14 00301 g004
Figure 5. Change in the sadness ratio for the Hennessey Fire, comparing “during” with “not-during” subsets, with example tweets. The ‘#’ symbol is used to create hashtags on Twitter, which categorize content and make it easily searchable.
Ijgi 14 00301 g005
Figure 6. Timelines for “fire”-related and “disaster-response”-related aspect terms per day, comparing regions near wildfires with regions not near.
Ijgi 14 00301 g006
Figure 7. Emotion frequencies for “fire” aspect terms over time for the SCU Complex Fire (top) and the Hennessey Fire (bottom).
Ijgi 14 00301 g007
Figure 8. Closer inspection of the aspect terms and emotions related to disaster responses for three areas of interest near the Hennessey Wildfire: Vacaville, Napa, and Fairfield.
Ijgi 14 00301 g008
Figure 9. Exemplary spatial analysis of the anger subset for “fire”-related aspect terms near the Bobcat Fire, showing the vast amounts of tweets at the Los Angeles centroid.
Ijgi 14 00301 g009
Figure 10. Exemplary spatial analysis of the anger subset for “fire”-related aspect terms near the Dolan Fire, showing the low amount of available tweets.
Ijgi 14 00301 g010
Figure 11. The MAUP exemplified with the Bobcat Wildfire. left: 2 × 2 km, middle: 5 × 5 km, right: 10 × 10 km.
Ijgi 14 00301 g011
Table 1. Tweet subsets based on geolocation and timestamp.
Subset NameGeolocationTimestamp
During And NearWithin 30 km radius of fire perimeterDuring the fire or up to 2 weeks after containment
Not During But NearWithin 30 km radius of fire perimeterOutside of ‘during’ timeframe (not during the fire or up to 2 weeks after)
During But Not NearOutside 30 km radius of fire perimeterDuring the fire or up to 2 weeks after containment
Table 2. Number of tweets per wildfire.
WildfireSample Size
Bobcat735,886
SCU Complex379,702
Hennessey Complex106,685
Dolan18,299
Castle13,246
North Complex8025
Creek7596
August Complex1733
Red Salmon Complex417
Salter128
Disclaimer/Publisher’s Note: The statements, opinions and data contained in all publications are solely those of the individual author(s) and contributor(s) and not of MDPI and/or the editor(s). MDPI and/or the editor(s) disclaim responsibility for any injury to people or property resulting from any ideas, methods, instructions or products referred to in the content.