Article

XT-SECA: An Efficient and Accurate XGBoost–Transformer Model for Urban Functional Zone Classification

1
Hubei Subsurface Multi-Scale Imaging Key Laboratory, School of Geophysics and Geomatics, China University of Geosciences, Wuhan 430074, China
2
Key Laboratory of Geological Survey and Evaluation of Ministry of Education, China University of Geosciences, Wuhan 430074, China
3
Institute of Advanced Studies, China University of Geosciences, Wuhan 430078, China
4
The Second Surveying and Mapping Institute of Hunan Province, Changsha 410029, China
5
Laboratory of Natural Disaster Risk Prevention and Emergency Management, School of Economics and Management, China University of Geosciences, Wuhan 430074, China
6
Hebei Key Laboratory of Geological Resources and Environment Monitoring and Protection, Hebei Survey Institute of Environmental Geology, Shijiazhuang 050000, China
*
Author to whom correspondence should be addressed.
ISPRS Int. J. Geo-Inf. 2025, 14(8), 290; https://doi.org/10.3390/ijgi14080290
Submission received: 27 April 2025 / Revised: 13 July 2025 / Accepted: 22 July 2025 / Published: 25 July 2025
(This article belongs to the Topic Artificial Intelligence Models, Tools and Applications)

Abstract

The remote sensing classification of urban functional zones provides scientific support for urban planning, land resource optimization, and ecological environment protection. However, urban functional zone classification encounters significant challenges in accuracy and efficiency due to complicated image structures, ambiguous critical features, and high computational complexity. To tackle these challenges, this work proposes a novel XT-SECA algorithm employing a strengthened efficient channel attention mechanism (SECA) to integrate the feature-extraction XGBoost branch and the feature-enhancement Transformer feedforward branch. The SECA optimizes the feature-fusion process through dynamic pooling and adaptive convolution kernel strategies, reducing feature confusion between various functional zones. XT-SECA is characterized by sufficient learning of complex image structures, effective representation of significant features, and efficient computational performance. The Futian, Luohu, and Nanshan districts in Shenzhen City are selected to conduct urban functional zone classification by XT-SECA, and they feature administrative management, technological innovation, and commercial finance functions, respectively. XT-SECA can effectively distinguish diverse functional zones such as residential zones and public management and service zones, which are easily confused by current mainstream algorithms. Compared with the commonly adopted algorithms for urban functional zone classification, including Random Forest (RF), Long Short-Term Memory (LSTM) network, and Multi-Layer Perceptron (MLP), XT-SECA demonstrates significant advantages in terms of overall accuracy, precision, recall, F1-score, and Kappa coefficient, with an accuracy enhancement of 3.78%, 42.86%, and 44.17%, respectively. The Kappa coefficient is increased by 4.53%, 51.28%, and 52.73%, respectively.

1. Introduction

Urban functional zones (UFZs) are spatial units that support distinct socio-economic activities and play a crucial role in urban planning, land-use optimization, and spatial governance [1,2]. With rapid urbanization and evolving governance paradigms, UFZ classification has become a key tool linking physical space with human behavior, facilitating the transition from rigid land-use zoning to function-oriented spatial management [2]. However, the growing heterogeneity of urban environments, characterized by overlapping land functions and irregular spatial patterns, poses significant challenges to existing UFZ classification methods [3,4]. These challenges are particularly evident in high-density and functionally mixed areas, where diverse socio-economic activities interweave in limited spaces, resulting in blurred functional boundaries and frequent functional transformations.
In recent years, significant progress has been achieved in the identification of functional zones within complex urban environments. Advanced remote sensing technologies, multi-source data integration, and refined classification frameworks are becoming important means to address the increasing spatial and functional heterogeneity of cities [5,6,7]. For instance, fusing high-resolution remote sensing images with mobile phone signaling or POI data has proven effective in capturing fine-grained urban functional patterns [8,9]. Moreover, machine learning and deep learning approaches that exploit contextual and semantic information can delineate mixed-use and morphologically irregular urban spaces [7,10]. Despite these advancements, accurately identifying functional zones in densely built-up and dynamically evolving areas remains challenging, underscoring the need for more efficient and scalable classification algorithms that can be applied to large-scale urban datasets [7,9,11,12]. These challenges reveal the limitations of conventional methods and motivate the exploration of advanced and multi-modal solutions.
Although many mature techniques have been developed in the research of land-use classification, UFZ classification remains in a relatively preliminary stage. Transferring and applying existing land-use classification techniques to UFZ classification represents an emerging exploratory path. According to the Urban Land-Use Classification and Planning and Construction Land-Use Standards (GB50137-2011) [13], urban spatial functions are typically classified into six major categories based on the consistency and universality principles of points of interest (POI): residential areas, commercial services, logistics and storage, transportation, green areas and squares, and public administration and public services [2]. Functional zone classification constructs a key spatial framework for urban planning, environmental management, and economic sustainability, supporting land-use optimization, rational infrastructure allocation, and urban expansion control, thus enhancing urban livability and balanced development [14,15,16]. However, due to the complexity of urban geographic environments and the interwoven layout of various functional zones, the current classification of functional zones faces both accuracy and efficiency challenges. Therefore, developing an algorithm capable of rapidly and accurately identifying UFZs over large urban regions holds significant theoretical and practical value for urban development.
Traditional UFZ classification methods include both supervised and unsupervised learning algorithms. Supervised learning algorithms typically rely on sample data to train classification models, with representative algorithms including Maximum Likelihood Classification (MLC) [17] and Support Vector Machine (SVM) [3]. These methods identify functional zones by extracting image features such as spectral, texture, and shape. However, when dealing with complex urban environments, especially where spectral similarities between different functional zones are high, traditional supervised learning methods often struggle to effectively differentiate subtle differences among different functional zones, leading to a decline in classification accuracy. On the other hand, unsupervised learning algorithms, such as K-means clustering [18] and ISODATA algorithms [19], classify UFZs by automatically grouping pixel clusters. These methods are simple to operate and do not rely on manually labeled sample data, but they struggle to accommodate the spatial complexity of UFZs, resulting in low classification efficiency and inaccurate results [20]. With the rapid development of remote sensing technology, the resolution and scale of image data have significantly improved, and the spatial distribution of UFZs (e.g., residential areas and commercial service areas) has become increasingly complex [21]. Traditional methods, due to simplistic assumptions about data features and simplified mathematical models, are unable to accurately capture these complex spatial features [21], thus failing to meet the demands of modern UFZ classification [11,22].
Current UFZ classification algorithms broadly fall into two distinct categories. The first category involves shallow machine learning algorithms, such as XGBoost [23,24,25,26], RF [27,28,29,30], K-Nearest Neighbors (KNN) [31,32,33], and SVM [3,26,27]. These algorithms integrate remote sensing imagery, POI data, and geospatial information to improve the model’s classification capability. For instance, XGBoost employs a gradient-boosting framework to achieve high training efficiency in large-scale data scenarios [24,25,26]. RF enhances classification robustness by aggregating multiple decision trees [28,29,30]. KNN, relying on a straightforward distance-based inference mechanism, performs well in small-sample datasets [31,32,33]. Additionally, combining Linear Discriminant Analysis (LDA) and SVM can improve model stability through dimensionality reduction and optimized classification strategies [3,34]. However, these methods generally depend heavily on hand-crafted features, which limits their ability to model complex spatial dependencies and semantic boundaries. As a result, they face significant challenges in achieving high accuracy for fine-grained UFZ delineation.
The second category relies on deep learning models, which significantly enhance classification performance through automatic feature learning. Transformer-based architectures have gained considerable attention in recent years due to their ability to effectively capture long-range dependencies and spatial contextual relationships in urban remote sensing data through self-attention mechanisms. For example, models such as TranUNet [35] and STNet [36] incorporate multi-head self-attention and positional encoding to enhance the recognition of fine-grained boundaries and spatial adjacency between UFZs. Convolutional Neural Networks (CNNs) [37], which extract localized spatial features via convolutional operations, have also been widely adopted in UFZ classification tasks [11,38,39], particularly in medium-scale applications due to their strong feature-abstraction capability. However, these deep models also face certain limitations. CNNs struggle to capture global spatial interactions. Although Transformer-based models offer superior classification accuracy and robustness, their complex architectures require significant computational resources for both training and inference. This results in relatively long training durations and high computational costs, thereby constraining their practical deployment in large-scale urban planning and management scenarios [40,41].
Transformer-based architectures have recently gained widespread attention in urban remote sensing due to their superior capability in modeling global dependencies and capturing spatial contextual relationships through multi-head self-attention. Compared with traditional CNN or RNN-based networks, Transformer models present distinct advantages that make them particularly suitable for UFZ classification scenarios.
1.
Global spatial interaction modeling: Transformers inherently possess a global receptive field, enabling the model to learn long-distance spatial dependencies and semantic relationships across fragmented or spatially disjoint urban areas. This is especially valuable in functional zone classification, where similar functions may exist in non-contiguous regions [15].
2.
High compatibility with heterogeneous data: The self-attention mechanism can simultaneously model relationships across multiple modalities, such as spectral features from remote sensing images and POI-based density distributions, offering a unified representation of both physical structure and human activity patterns [42,43].
3.
Superior performance in complex urban zoning tasks: Recent studies have shown that Transformer-based networks significantly outperform CNNs and other deep architectures in large-scale, fine-grained urban classification tasks. For example, Lu et al. [15] demonstrated that a Transformer-based framework improved boundary recognition and classification accuracy across mixed-use zones. Fan et al. [36] also confirmed the robustness of Transformer backbones in mapping informal settlements under diverse environmental conditions.
However, despite its accuracy, Transformer networks typically demand high computational resources. To address this, we integrate the Transformer with XGBoost, which serves as an efficient feature extractor that explicitly models nonlinear interactions with minimal computational overhead. This hybrid design ensures that the XT-SECA model not only achieves high classification performance but also maintains practical scalability in large urban regions.
In general, UFZ classification is of significant importance in urban planning, environmental management, and sustainable development. However, it still faces challenges in practical applications, primarily in two aspects: (1) feature similarity and class confusion, and (2) complex image structures and high computational cost. First, different UFZs, e.g., residential areas, public administration and public service areas, and commercial service areas, may present similar spectral and textural features due to highly intertwined human activities [2]. That leads to a high degree of class confusion and limits UFZ classification accuracy. Second, complex spatial and spectral structures in high-resolution imagery result in a surge in computational workload. While deep learning algorithms feature high classification accuracy, they still face large computational demands when applying across extensive city regions.
To address these issues, this work proposes an XT-SECA algorithm for UFZ classification, which integrates the Transformer module, XGBoost module, and SECA mechanism. Each module optimizes the classification function through its unique advantages, improving both efficiency and accuracy.
As for the classification accuracy of UFZs, the Transformer module effectively captures abundant local and global features by performing high-dimensional mapping and feature transformation on the input features. This enhances the model’s adaptability to complex urban spatial structures. Based on this, the SECA mechanism optimizes the feature-fusion process through dynamic pooling, reducing class confusion caused by similar spectral and textural features and significantly improving classification accuracy. Regarding the classification efficiency of UFZs, XGBoost, through column-block parallel computation and cache access optimization, significantly enhances the efficiency of feature extraction.
This work has three main contributions. (1) A SECA attention mechanism is proposed. SECA optimizes feature recognition by dynamically adjusting the convolution kernel and pooling strategy, reducing class confusion caused by similar spectral and textural features, and significantly improving classification accuracy. (2) The XT-SECA architecture is suggested. The architecture combines the efficient feature-extraction ability of XGBoost with the feature-optimization capacity of the Transformer module, obviously alleviating the computational burden while achieving high accuracy. (3) Three districts featuring different functions are selected to conduct UFZ classification to highlight the performance of the XT-SECA algorithm.

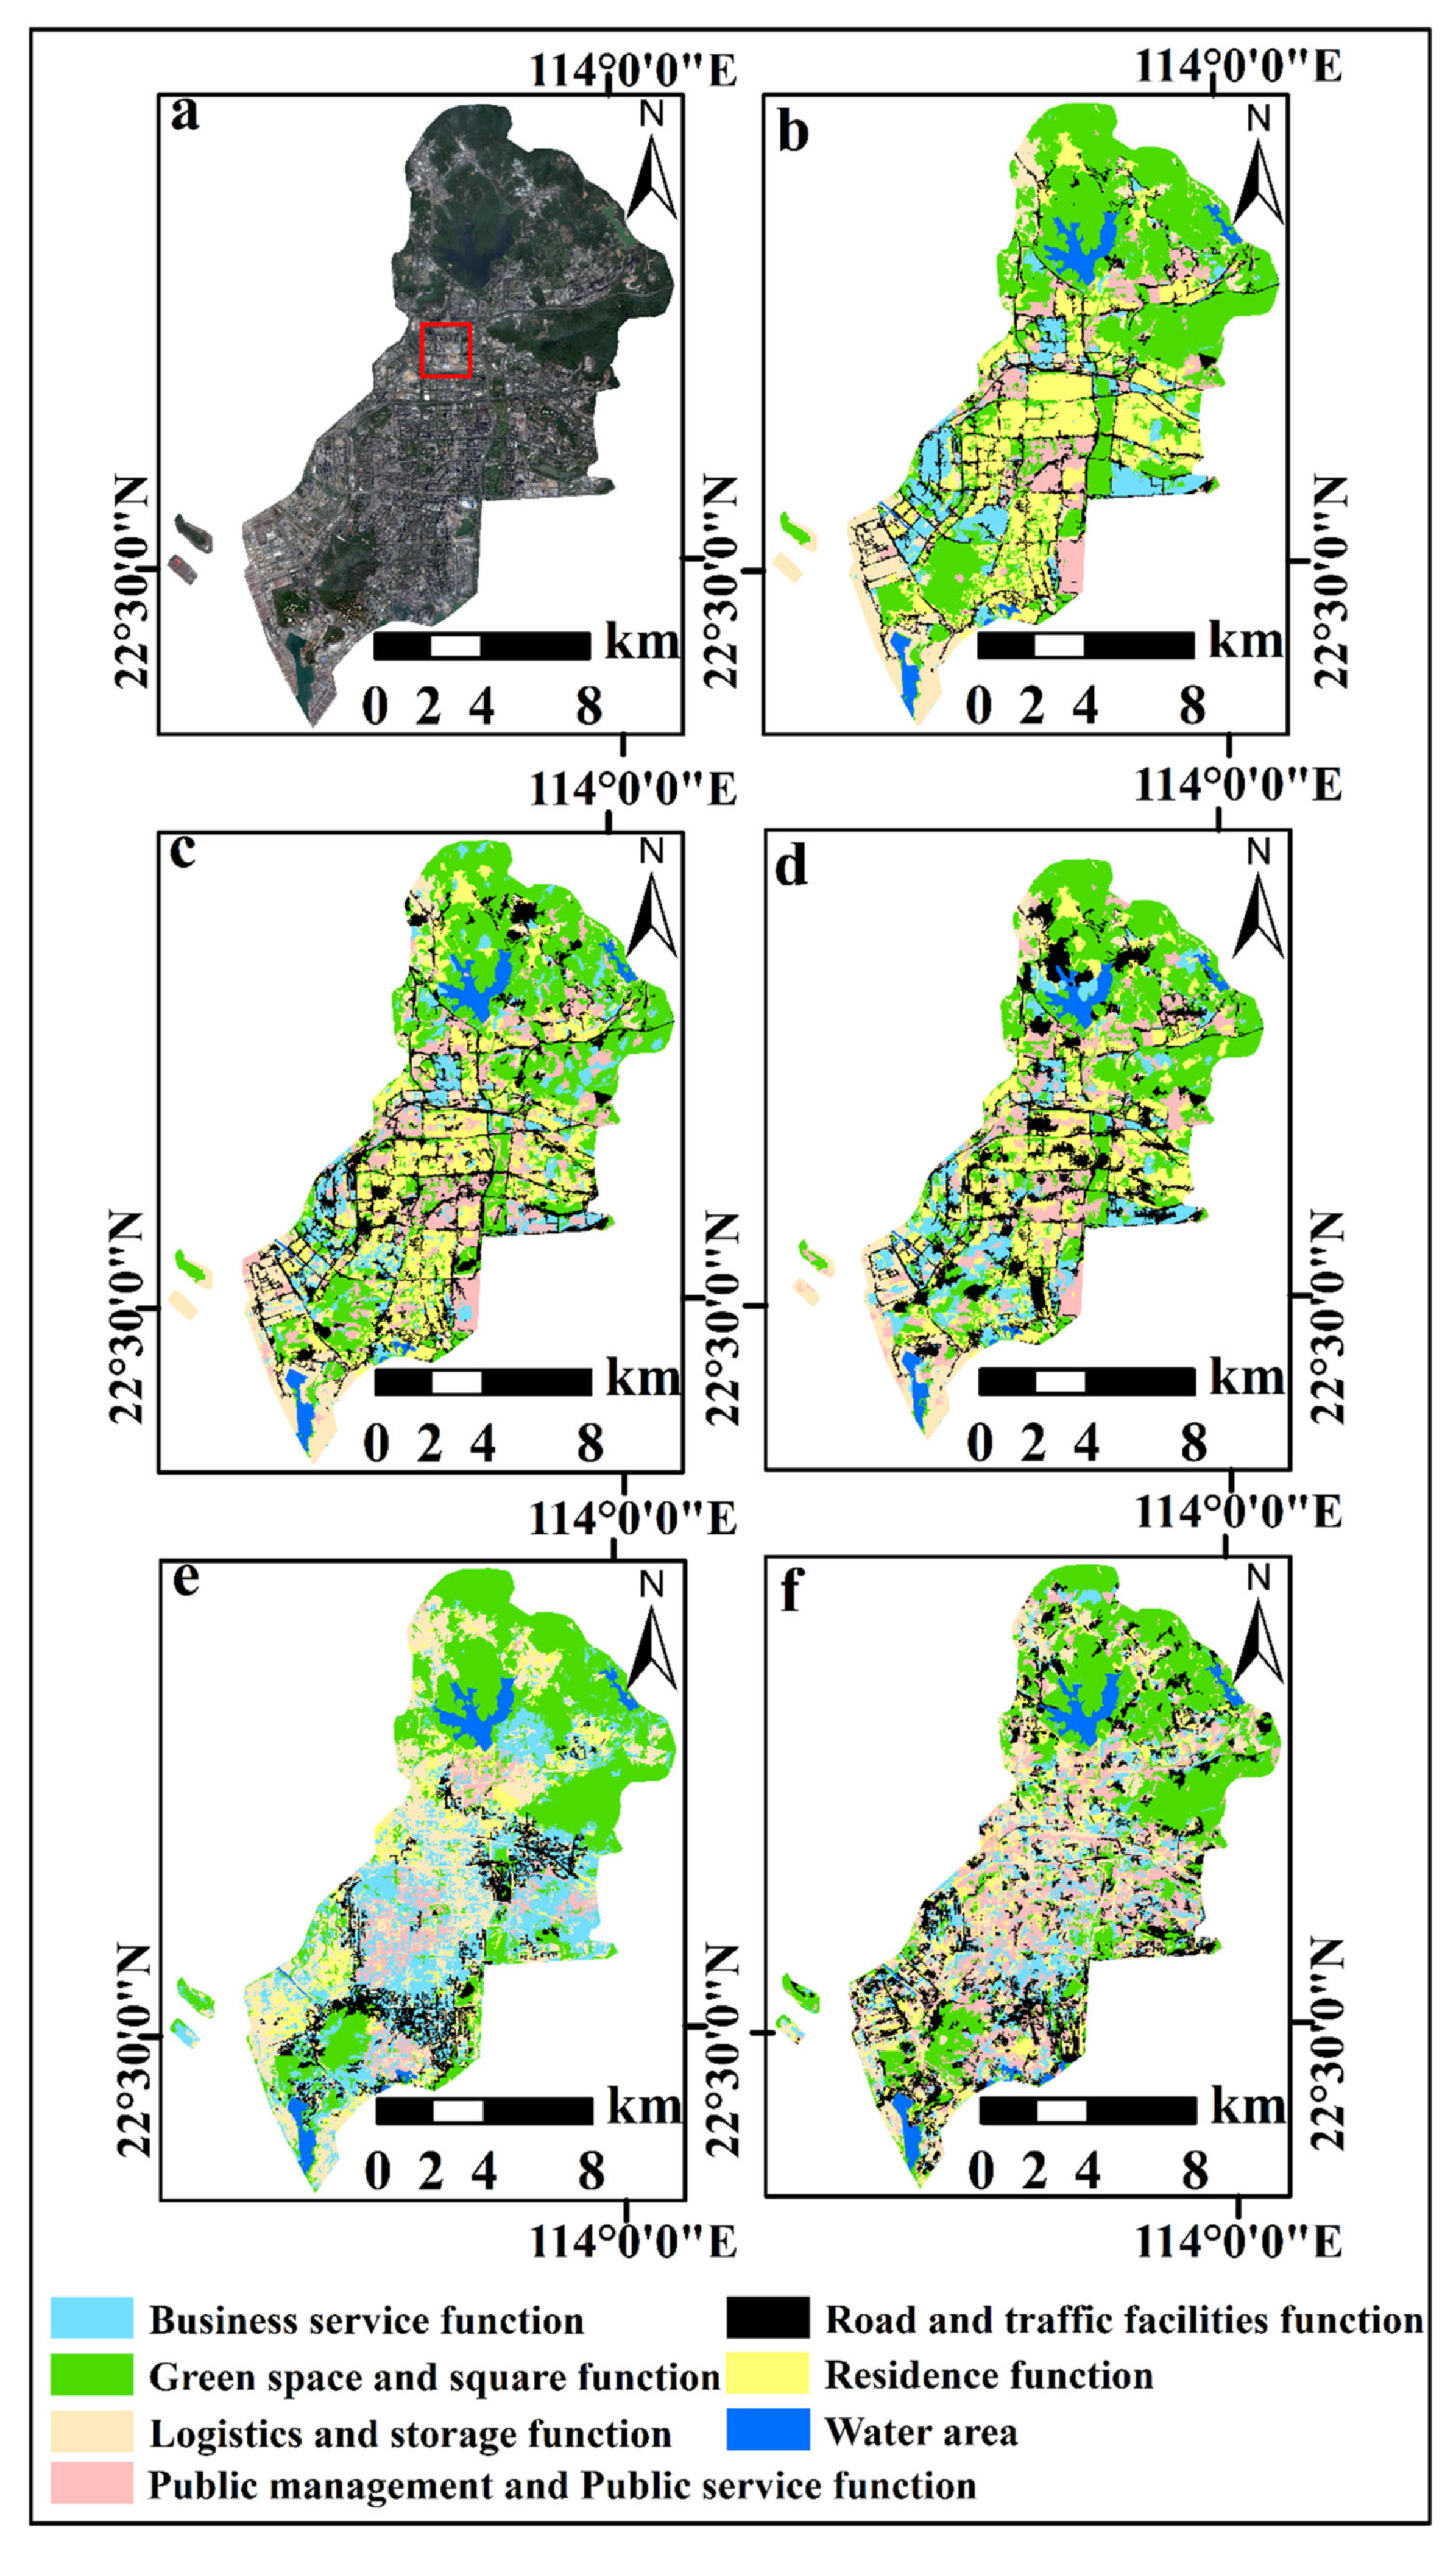
2. Study Areas and Data
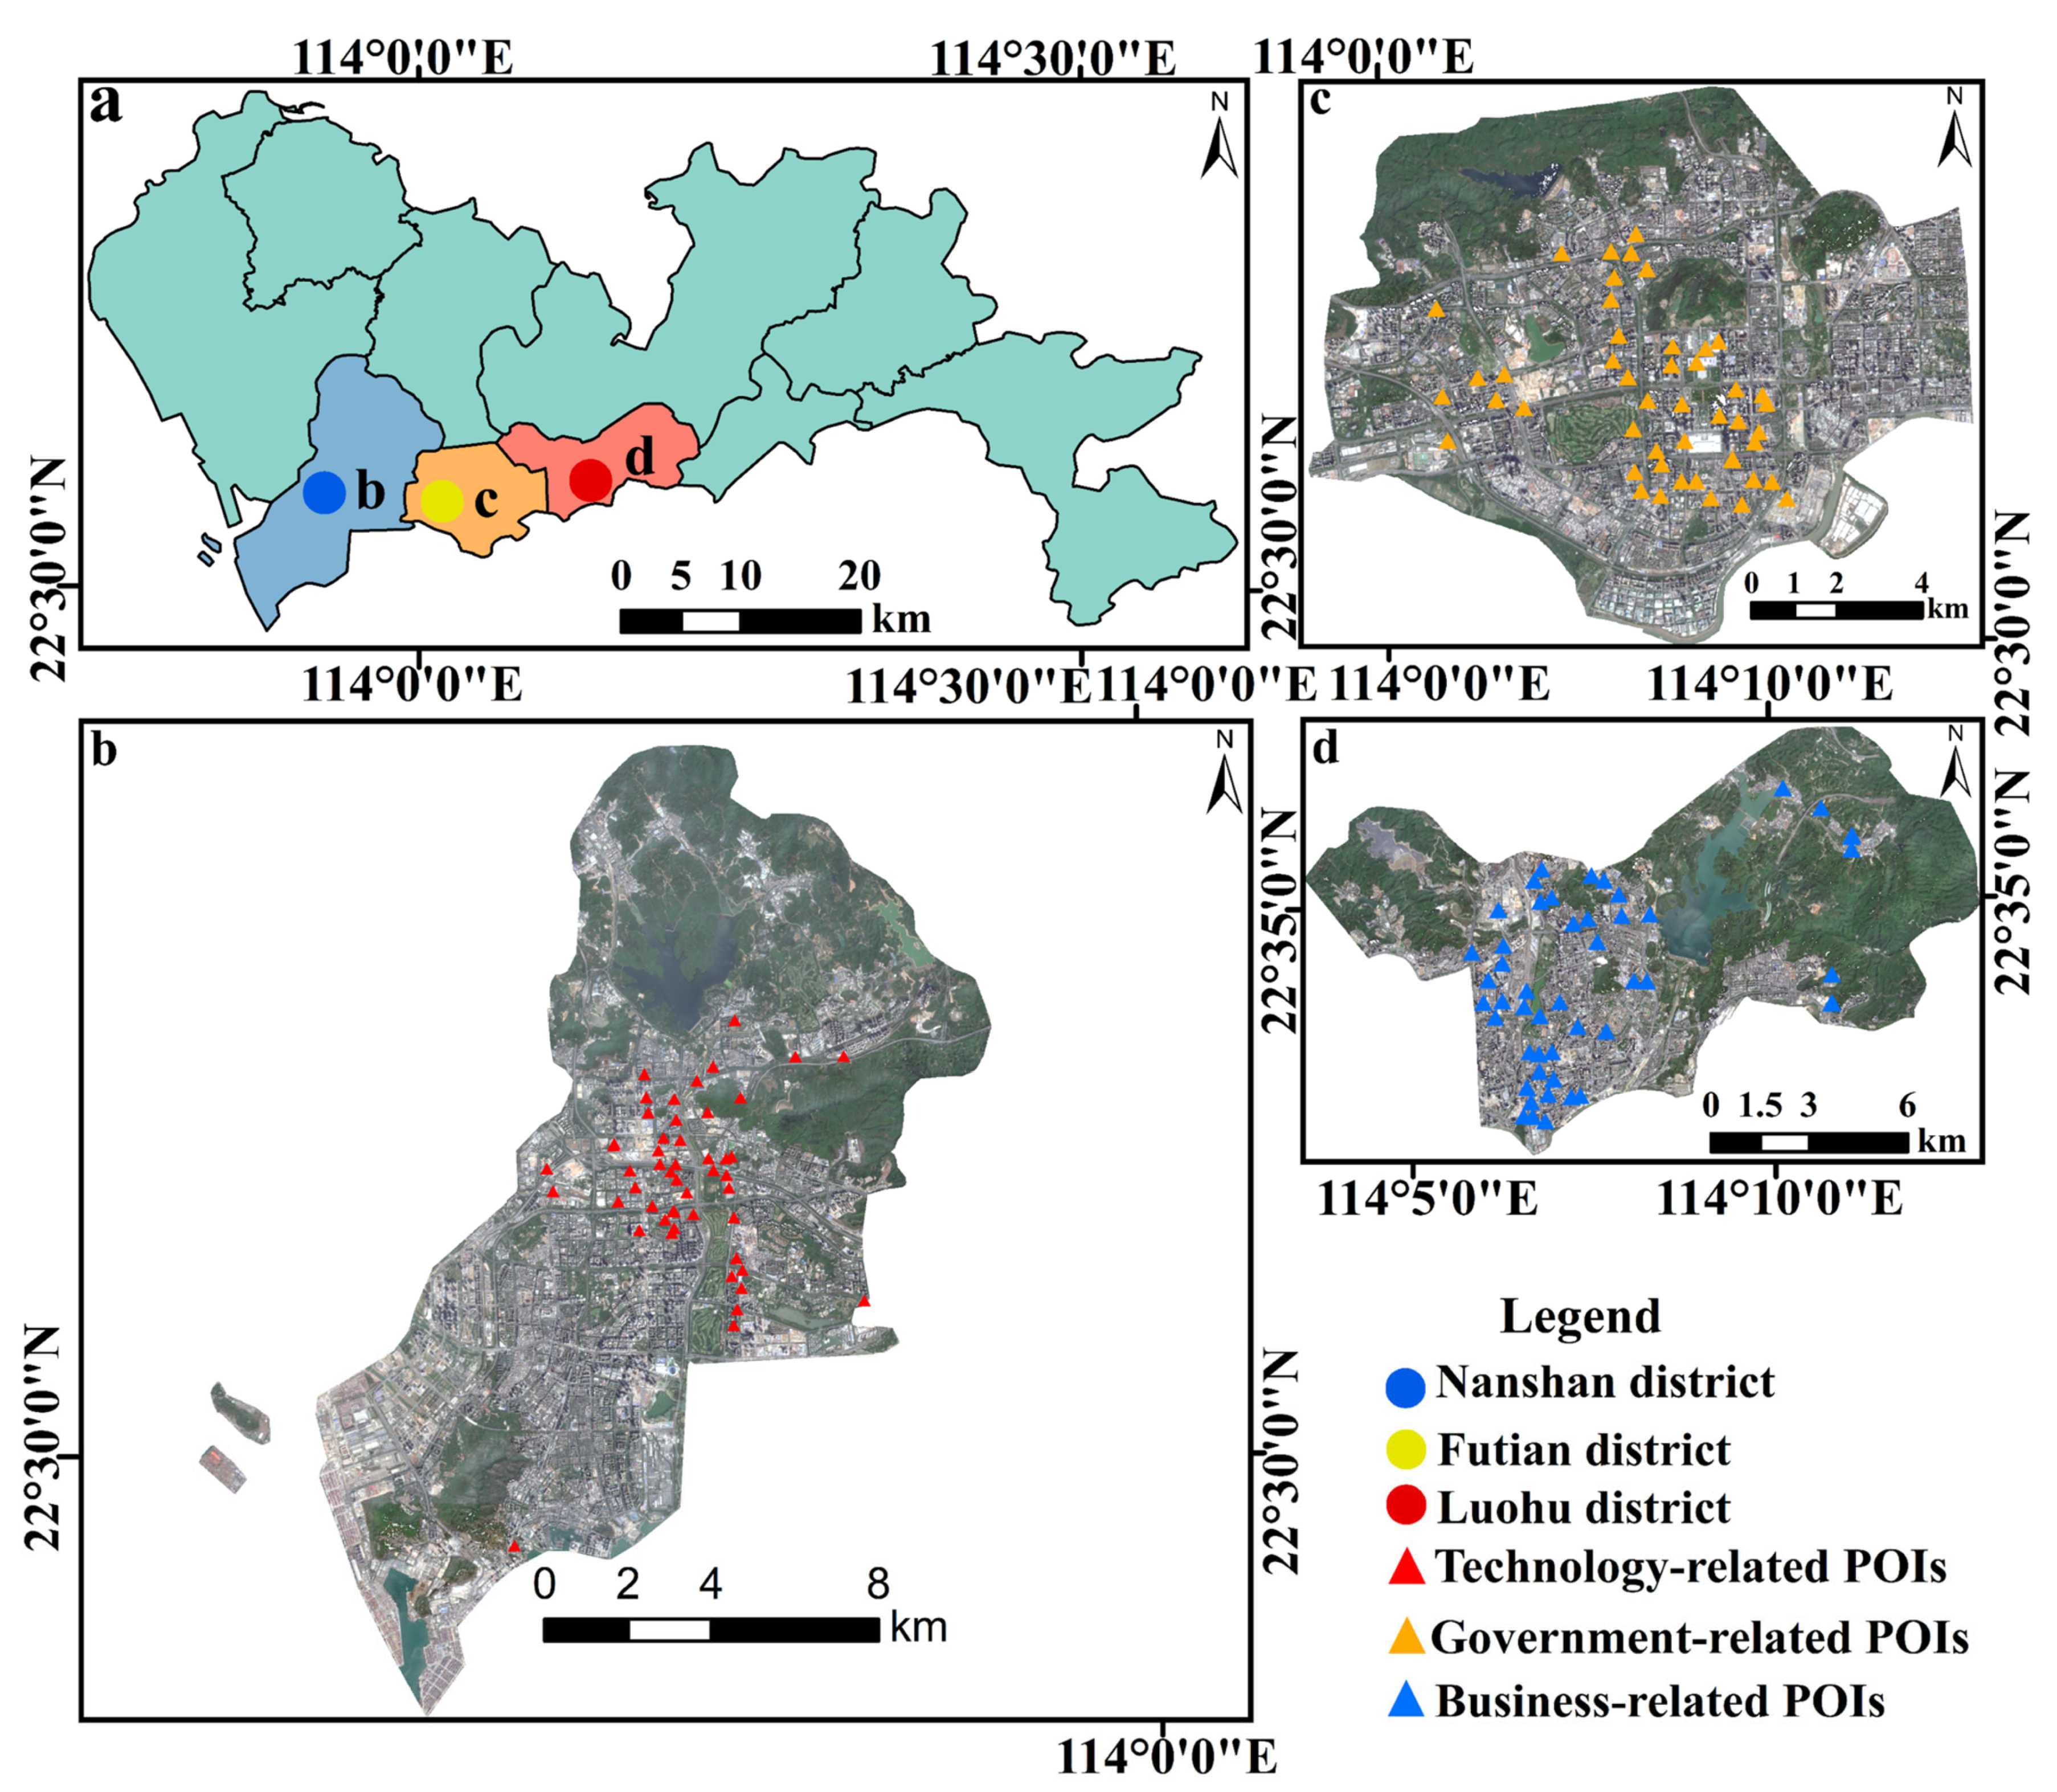
2.1. Study Areas

Shenzhen, as a key global center for economy and technology, has undergone rapid development over the past four decades, transforming from a small town with a population of 300,000 to an international metropolis with over 17 million residents. The urbanization rate soared from 23.91% in 1980 to full urbanization by 2004, and by 2020, the city achieved a GDP of CNY 27.67 trillion, ranking third among Chinese cities and twelfth globally [44]. However, this growth has led Shenzhen into the era of stock planning. High-density human activities and continuous urban expansion have continuously altered land-use patterns [45], resulting in increasingly strained land supply and a pressing need to improve land-use efficiency and optimize urban planning. Therefore, conducting research on urban functional zones becomes crucial to ensure the rational allocation of resources and the sustainable development of the city.
This work selects Futian District, Luohu District, and Nanshan District as the research areas (Figure 1). These districts form the core regions of the original Shenzhen Special Economic Zone, representing typical areas for administrative management, technological innovation, and commercial finance, respectively.
Nanshan District, as the technological innovation hub of Shenzhen, has not only driven China’s advancements in science and technology but also exerted a significant influence on global technological innovation. The district is home to many of Shenzhen’s leading technology enterprises and serves as a major driving force behind the city’s economic growth and its competitiveness in the global technology arena. Luohu District, as the commercial and financial center of Shenzhen, plays a vital role in facilitating economic interactions between Shenzhen and both domestic and international markets. Futian District, serving as the administrative and political center of Shenzhen, plays a central role in decision-making, governmental administration, and policy formulation. These three districts highlight the complexity and uniqueness of Shenzhen’s urban function zoning and optimization process as a megacity.

2.2. Data

This work employs remote sensing imagery and POI data for UFZ classification (Table 1). By utilizing the spectral, textural, and spatial information from Sentinel-2 imagery, significant features of the UFZs are captured. For example, the spectral information of large green areas typically indicates an ecological zone, while the regular and uniform texture information generally suggests a residential area. In contrast, high-density and structured spatial layouts may represent commercial areas. Additionally, by introducing POI data from the Gaode Map, human activity information related to commercial, residential, and industrial zones is incorporated into the functional zone classification, helping to reveal the functional attributes of specific areas.
The integration of these above two data sources can combine the physical characteristics (i.e., spectral, textural, and geometric features) with human activity patterns, contributing to accuracy improvement.

2.2.1. Data Processing

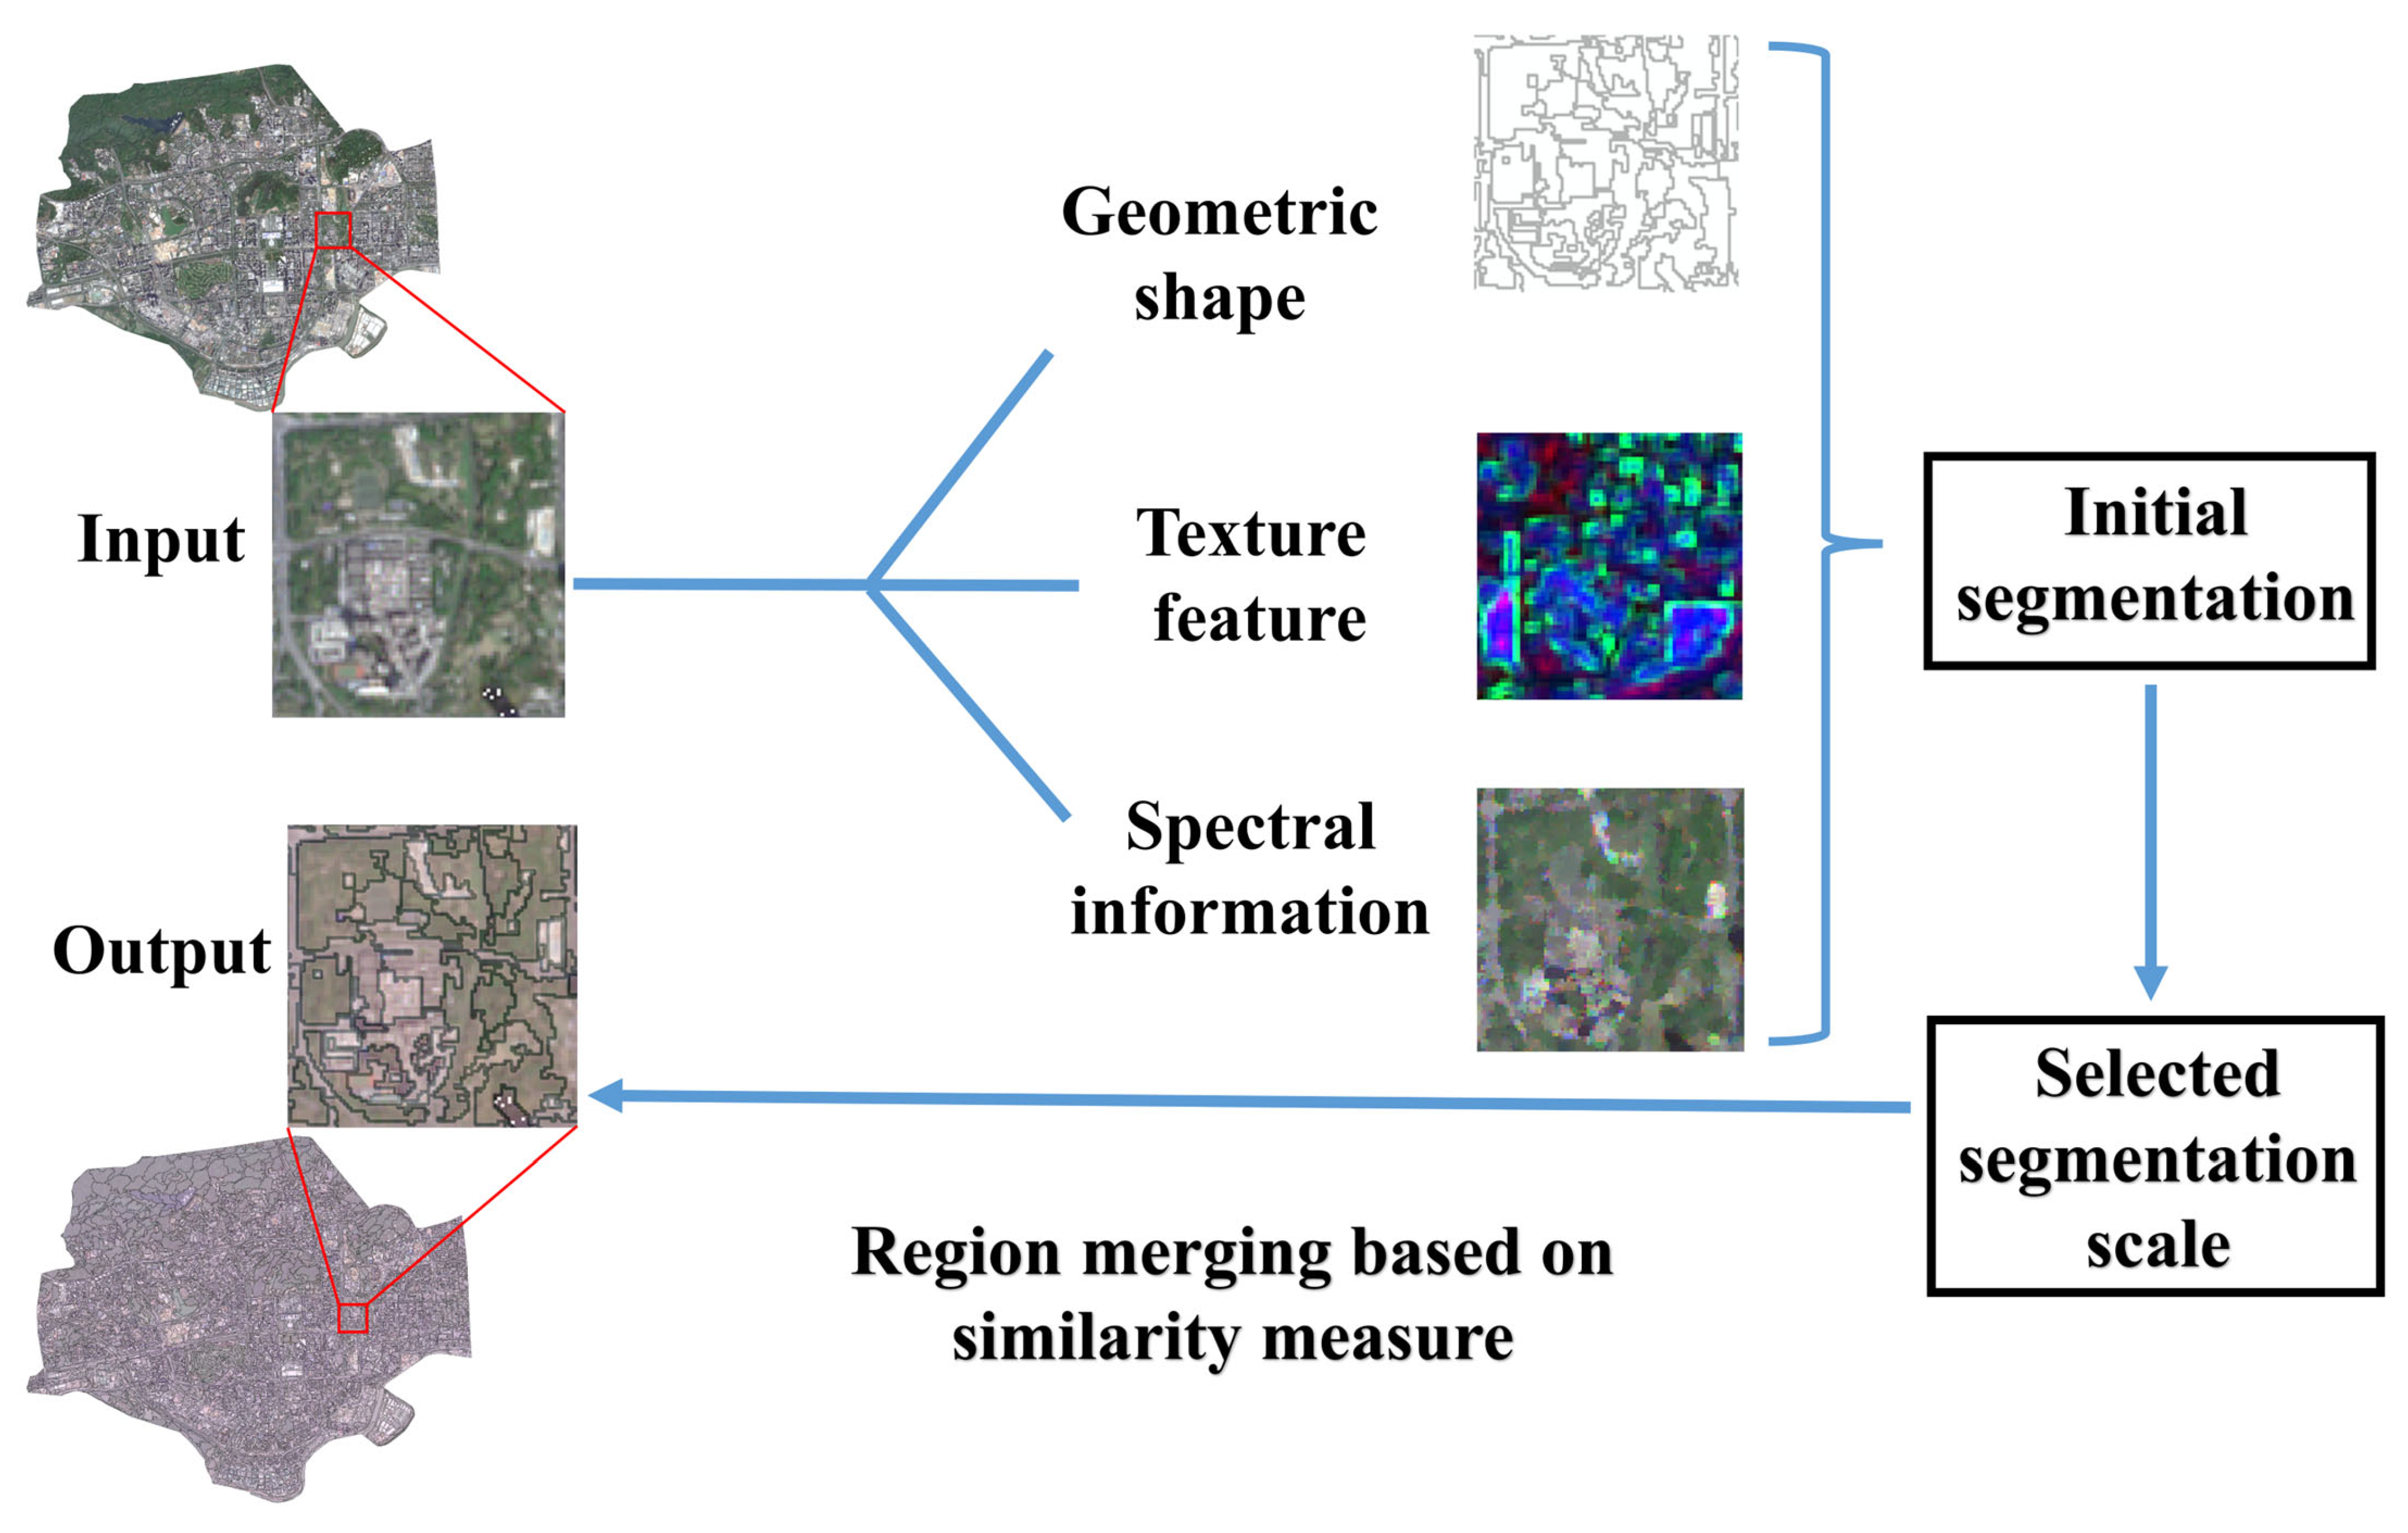
Multiscale Segmentation of Remote Sensing Images
Multiscale segmentation is conducted to group remote sensing image pixels, and each group shares similar spectral, spatial, and textural characteristics. The segmentation process begins by an initial segmentation based on the spectral, spatial, and textural features of pixels. It then progressively merges regions with similar characteristics to form target areas, using a similarity measure (Equation (1)). By adjusting the scale factor and segmentation parameters appropriately, this process ensures that the segmentation retains image details, reduces noise, and enhances feature stability [46]. In this work, 20 pixels are identified as the optimal segmentation scale, yielding 113,873 classification units.
E = i = 1 N 1 σ i ( Δ x i + Δ y i + Δ z i )
where E represents the similarity measure, indicating the segmentation quality. N is the number of segmented units, and σ i denotes the standard deviation in unit i , reflecting the feature heterogeneity within the unit. Δ x i ,   Δ y i ,   a n d   Δ z i represent the differences in spatial, textural, and spectral characteristics of unit i , which are obtained by calculating the geometric shape, textural features, and spectral information of the unit, respectively.
In order to address the spatial heterogeneity of urban landscapes, a multiscale segmentation approach based on object-oriented image analysis is employed, following the multiresolution segmentation algorithm. This algorithm integrates multiple features, including spectral, shape, and texture, to facilitate the bottom-up merging of adjacent pixels or pixel groups into coherent objects. The core principle is to minimize intra-segment heterogeneity while maximizing inter-segment differences. This is controlled by a user-defined segmentation scale which influencing the merging process. As illustrated in Figure 2, the segmentation process is represented by a schematic diagram showing the iterative object-merging mechanism. It is clear that as the scale parameter increases, the resulting image objects become larger and smoother, but at the cost of losing the finer details of smaller-scale features.
POI Kernel Density Analysis
According to the Urban Land-Use Classification and Planning and Construction Land-Use Standards [13], urban spatial functions are classified into six categories: residential areas, commercial services, logistics and storage, transportation, green areas and squares, and public administration and public services. Based on the attributes of POI points, the POIs are classified and mapped to the corresponding urban spatial function categories (Table 2) [2]. Subsequently, kernel density analysis (Equations (2) and (3)) is used to calculate the density distribution of each POI type corresponding to each urban functional zone, which reflects the impact of each functional zone type in each segmented unit, i.e., embodies the human activity pattern in each segmented unit. A 10 m linear unit and a 1200 m decay threshold are selected as the ideal parameters [2]. These parameters ensure that the influence of POI points within a functional zone on surrounding areas is reasonably accounted for while avoiding the loss of spatial information caused by excessive smoothing.
f x = i = 1 n 1 h 2 K x x i h
K ( x x i h ) = 3 4 ( 1 ( x x i h ) 2 )
where K is the Gaussian kernel function, used to measure the contribution of each POI within the search radius to the central point x ; h is the bandwidth, used to define the spatial ranges and boundaries of different functional regions; and n is the number of POIs contained within the bandwidth.

3. Method

A novel XT-SECA deep learning algorithm is suggested in this work for UFZ classification (Figure 3). The XT-SECA algorithm consists of 4 main steps. (1) Feature extraction. Multi-scale segmentation units are employed as classification units. POI kernel density data and remote sensing imagery are input into the feature-extraction XGBoost branch to extract initial features. (2) Feature enhancement. A Transformer block is constructed, and the features extracted by XGBoost are input into the Transformer block to enhance nonlinear feature representation and improve the model’s ability to handle complex data structures. (3) Fusion and optimization. The features from the two branches, the Transformer branch and the XGBoost + Softmax branch, are adaptively aggregated by the SECA attention mechanism to enhance the model’s ability in distinguishing different categories of features. (4) Output. The fused and optimized features are passed to the output layer, where the loss function is computed. Once the loss function converges, the UFZ classification map is obtained.

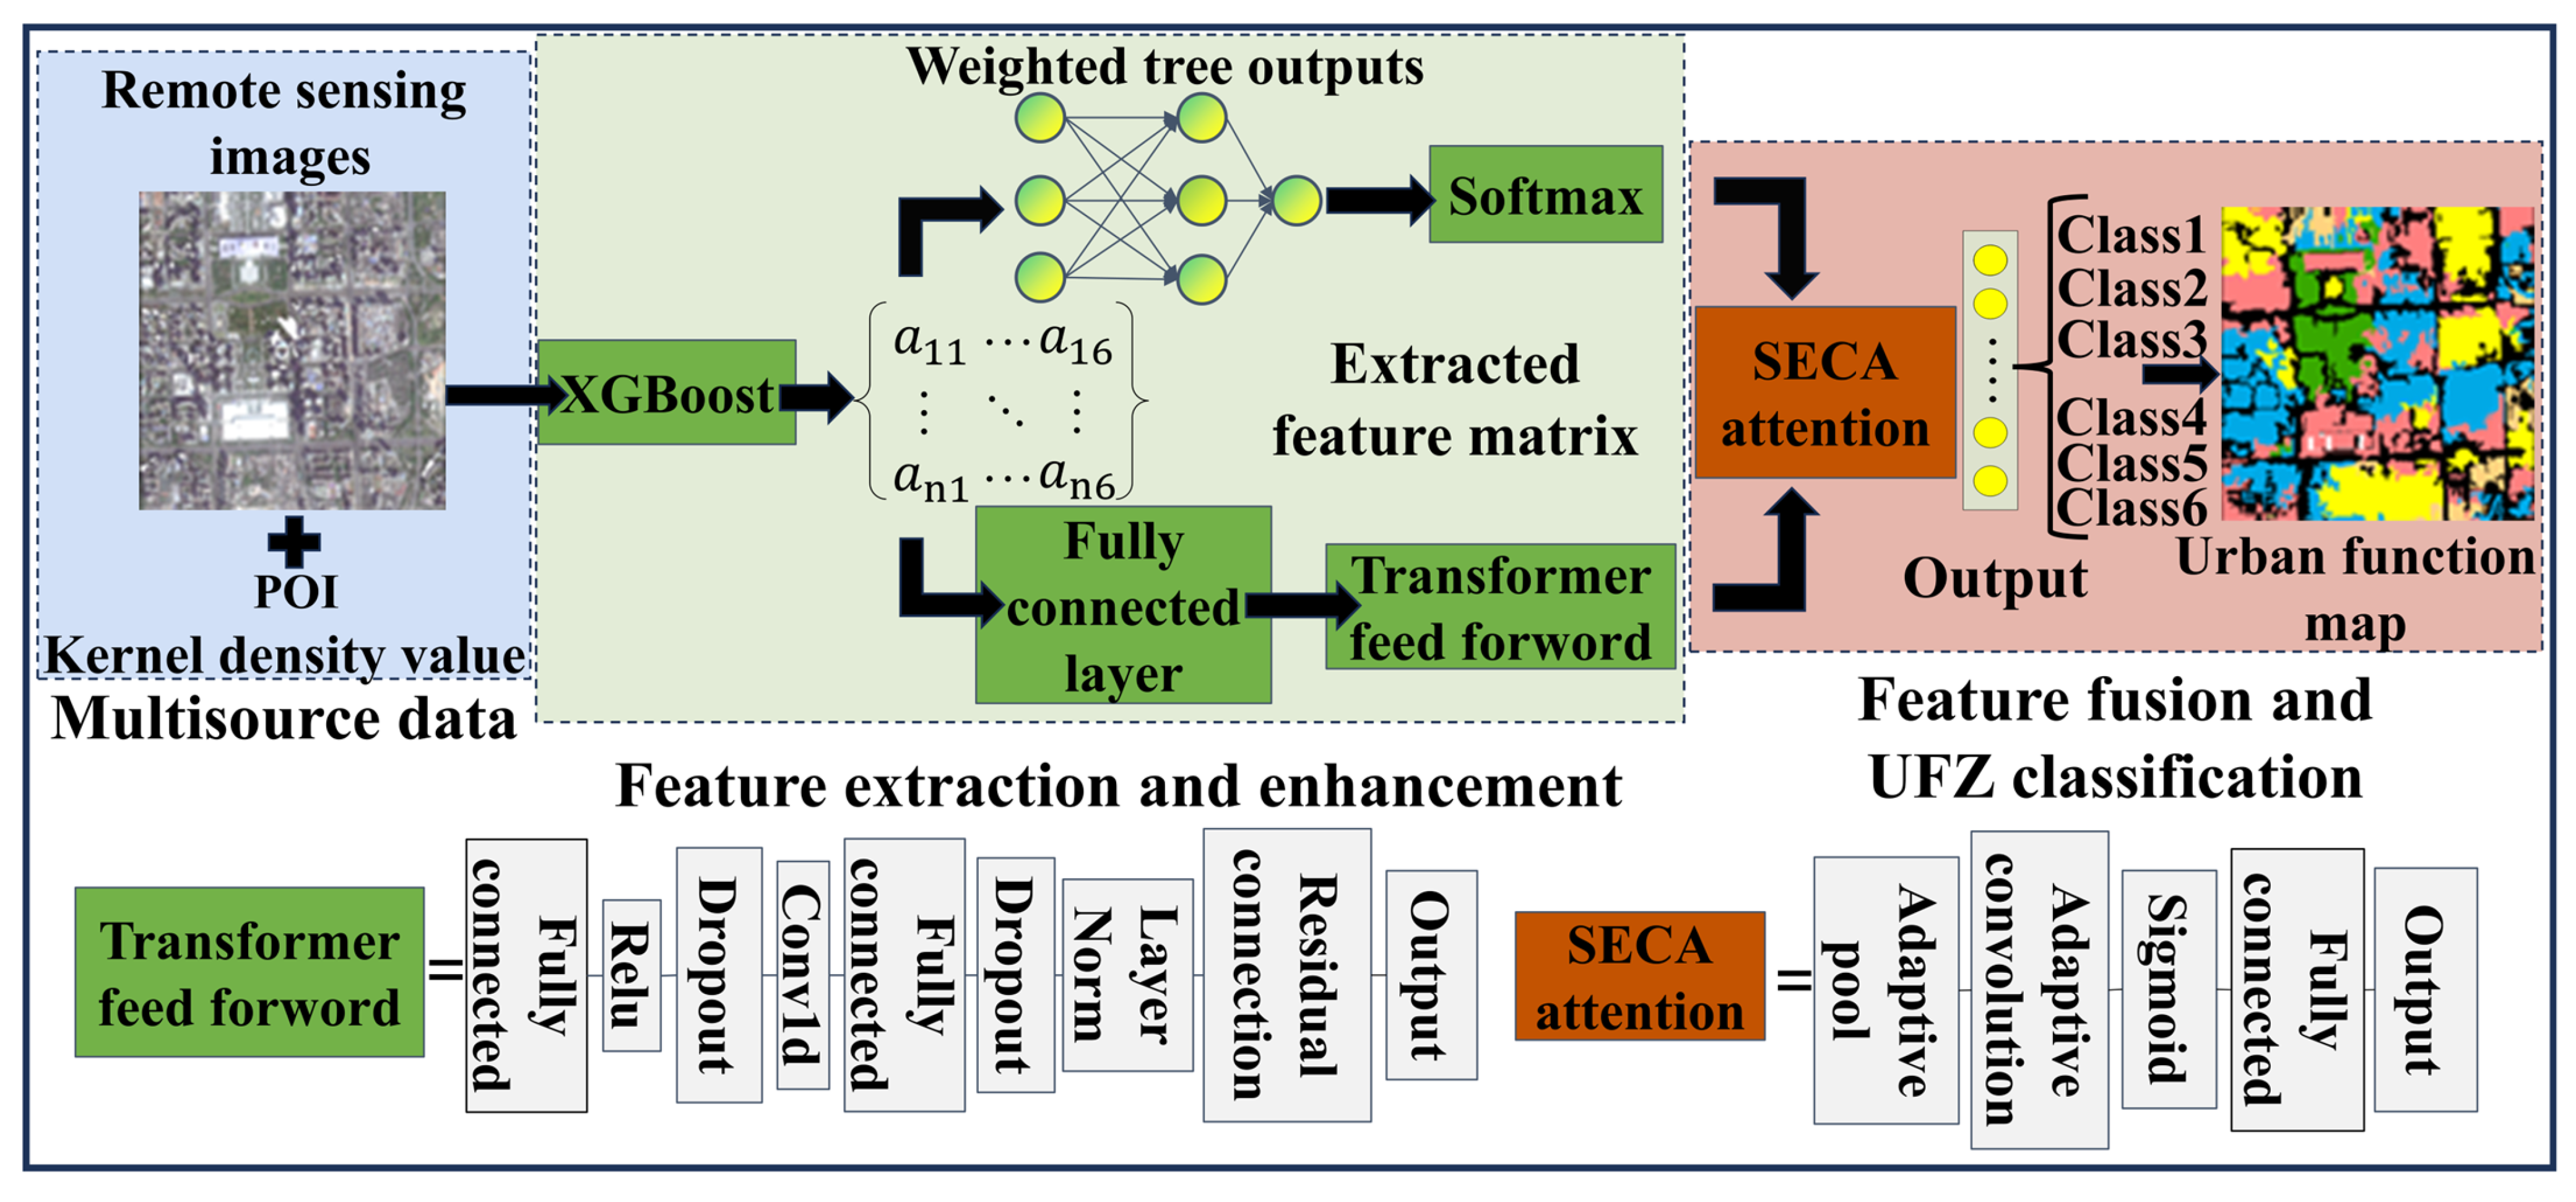
3.1. Feature Reconstruction Modules

3.1.1. Feature-Extraction Branch

Feature-extraction branch derives intrinsic and significant features from remote sensing imagery and POI density data. To efficiently reduce computational burden, the XGBoost model [23] is employed as a preliminary classifier. XGBoost encodes image spectral features and POI density features into tree structures. During each tree construction, XGBoost selects the optimal splitting feature by maximizing the “Gain” (Equation (4)) [47], thereby eliminating redundant or irrelevant features, and automatically selects crucial features for UFZ classification. This branch possesses two outputs. One output is fed through a fully connected layer into the subsequent Transformer module, aiming to explore the high-level interaction among human activity features, spectral features, and urban functions. The other output represents the explicit modeling of the nonlinear relationships through tree iterations (Equation (5)) and weighted classification (Equation (6)) [31].
Gain = 1 2 ( ( i = 1 n L y i ) 2 n L + λ + ( i = 1 n R y i ) 2 n R + λ ( i = 1 n y i ) 2 n + λ )
where n L and n R represent the number of samples in the left and right child nodes, respectively. y i denotes the label of each functional zone, and λ is a regularization parameter used to control the model complexity and avoid overfitting.
y ^ i ( m + 1 ) = y ^ i ( m ) + η h m ( x i )
where y ^ i ( m ) is the predicted value after the m -th iteration, representing the current UFZ classification result. η indicates learning rate, controlling the contribution of each tree to the final classification result. h m ( x i ) is the predicted value of the newly added tree in the m -th iteration, representing the contribution of the new features to UFZ classification.
w j ( m ) = i I j [ g i + λ w j ( m 1 ) ] i I j [ h i + λ ]
in which I j represents the set of sample indices contained in the j -th leaf node, corresponding to the samples of a specific functional zone category. g i and h i are the first and second derivatives of the loss function for sample i , reflecting the prediction error of the current model. λ denotes the regularization parameter used to control the complexity of the leaf node weights.

3.1.2. Feature-Enhancement Branch

The feature-enhancement branch refines the features derived from XGBoost to learn multi-scale high-level semantic features. A Transformer feedforward network layer [42] is introduced in this work, which performs nonlinear mapping of the features through two fully connected layers (Equation (7)). First, the Transformer receives the high-dimensional features output by XGBoost and conducts a linear mapping through W 1 and b 1 , followed by the application of the ReLU activation function to extract complex feature patterns. The second fully connected layer further maps the features through W 2 and b 2 , capturing fine-grained spatial patterns and the synergistic interactions between features, thus improving the accuracy of UFZ classification. By performing nonlinear feature modeling in the implicit space through matrix operations and high-dimensional mapping, the Transformer feedforward network is capable of uncovering finer-grained, higher-order interactions hidden between features, which are typically difficult to capture through the explicit threshold-based modeling of features in XGBoost [42].
y = ReLU ( x W 1 + b 1 ) W 2 + b 2
where x represents the input feature vector, including image spectral features and POI density features. W 1 and b 1 denote the weight matrix and the bias vector of the first fully connected layer, respectively. W 2 and b 2 indicate the weight matrix and the bias vector of the second fully connected layer, respectively.
In the context of large-scale UFZ classification, XGBoost is specifically selected over other ensemble classifiers such as CatBoost, LightGBM, AdaBoost, or Random Forest due to the following reasons:
1.
Second-order optimization enhances feature stability and interpretability: Unlike other boosting methods that rely solely on first-order gradients or heuristic splits, XGBoost utilizes both the first- and second-order derivatives of the loss function. This leads to more stable and theoretically grounded decisions during feature splits. In this study, where fused features from spectral data and POI density are highly nonlinear and potentially redundant, this second-order gain-based mechanism effectively filters irrelevant attributes, enhancing both classification accuracy and interpretability.
2.
Integrated regularization ensures model generalization in multimodal settings: XGBoost incorporates explicit L2 regularization to penalize model complexity, which is crucial for the UFZ classification scenario involving multi-source and high-dimensional inputs. This strategy helps control overfitting while maintaining model performance. In comparison, LightGBM tends to generate deeper trees due to its leaf-wise splitting, increasing overfitting risk, and CatBoost focuses more on categorical bias reduction, which is less applicable to the continuous input features in this work.
3.
Gain-driven feature selection boosts efficiency and discriminative power: The core mechanism of XGBoost involves maximizing the expected reduction in loss (“Gain”) at each tree split, thereby prioritizing the most relevant features. This is especially valuable in remote sensing imagery where many features may be weakly correlated with the target classes. In contrast, Random Forest employs random feature sampling without loss optimization, and LightGBM’s histogram approximation may cause precision loss in split decisions.
4.
Structural compatibility with the dual-branch design: XGBoost naturally complements the dual-branch model structure. Beyond acting as a classifier, its outputs provide interpretable and structured feature representations that can be directly fed into the Transformer module. This facilitates a seamless integration between explicit tree-based modeling and implicit contextual learning. Conversely, models like CatBoost and LightGBM encapsulate internal representations more tightly, making it difficult to extract structured intermediate features, while Random Forest lacks the granularity needed for downstream Transformer-based refinement.
These methodological and structural advantages justify the choice of XGBoost as a suitable preliminary classifier in our framework, balancing computational efficiency, interpretability, and integration capability within the XT-SECA model.

3.1.3. Strengthened Efficient Channel Attention Mechanism

The SECA mechanism is developed based on the ECA-Net module [48], aiming to fuse the features derived from the feature-extraction branch and feature-enhancement branch. SECA introduces dynamic pooling and dynamic convolution kernels to avoid the use of complex MLP structures for dimensionality reduction and expansion, thereby reducing model parameters and computational costs. Moreover, SECA can effectively capture multi-scale dependencies between features, ensuring a refined feature representation.
Dynamic pooling adapts the pooling window size to ensure that the aggregation of each feature dimension is performed at the optimal scale, effectively suppressing redundant information. When processing the interaction between human activity features and image spectral features, dynamic pooling (Equations (8) and (9)) can flexibly select the pooling window applicable to different functional types (such as urban buildings, green spaces, commercial areas, etc.) precisely capturing the spatial patterns of local features [48]. This avoids the problem of information loss or redundancy often encountered in traditional pooling methods.
G A P ( X ) = 1 H x W j = 1 K j = 1 K X c i j , c 1 , , C .
D y n a m i c P o o l ( X ) = 1 K j = 1 K j = 1 K X c i j , c { 1 , , C } ,
where
X c i j denotes the element at position (i,j) in the feature map X , which specifically reflects spectral and POI density features at that position. H and W indicate the height and width of the feature map, respectively. C represents the number of channels. K is size of the dynamically computed pooling window.
Dynamic convolution (Equation (10)) further refines the feature-extraction process, and it adapts the kernel size based on the feature distribution, precisely capturing complex spatial patterns and subtle feature interactions for various functional zones [40]. The synergy between dynamic pooling and dynamic convolution allows the model to intelligently select and enhance features based on their distribution and importance. Dynamic pooling ensures accurate capture of features at different scales, while dynamic convolution delves deep into complex nonlinear relationships, preventing the impact of redundant and irrelevant features [40].
k = | log 2 C + b γ | o d d
where
k is the convolution kernel size that controls the local dependencies between channels, and   γ regulates the spatial range that a convolution kernel can capture, determining the kernel’s adaptability. Smaller values of γ allow the convolution kernel to encompass a broader range of feature dependencies, suitable for capturing urban structural patterns over larger areas, i.e., suitable for large commercial or industrial zones. Larger values of γ , on the other hand, cause the convolution kernel to focus on smaller regions, making it effective for identifying localized features, i.e., effective for building distributions. b is a hyperparameter, allowing for dynamic fine-tuning of the convolution kernel’s adaptability.
The synergy between dynamic pooling and dynamic convolution enables SECA to intelligently select and enhance informative features while avoiding the computational burden of MLPs. This design offers the following benefits:
1.
MLP-free attention computation: Instead of a two-layer fully connected network for channel recalibration, SECA employs a parameter-efficient 1D convolution (as in Equation (10)) to directly model local cross-channel interactions. This avoids the quadratic parameter growth of MLPs and enables fast inference [49].
2.
Dynamic kernel adaptivity: The convolution kernel adapts to the feature channel dimension via a logarithmic function, enabling SECA to flexibly adjust its attention scope while maintaining low parameter counts [49].
3.
No bottleneck distortion: SECA avoids the reduction–expansion process common in SE blocks, preventing the distortion of intermediate feature representations and reducing memory overhead [49].
4.
Multiscale spatial perception: Dynamic pooling (Equations (8) and (9)) allows the attention mechanism to adapt to different urban spatial types, capturing fine-grained features in small areas and broader contexts in larger functional zones, improving interpretability and robustness.
In summary, the SECA module retains representational strength while being significantly more lightweight than traditional attention structures. These properties make it well-suited to large-scale remote sensing applications like UFZ classification, where computational efficiency and accuracy must be simultaneously achieved.
In brief, the Transformer feedforward network layer extracts multi-level nonlinear spatial features. These features capture fine-grained spatial patterns and reveal the complex relationships between spectral features and POI data. XGBoost extracts features by maximizing gain, eliminating redundant features, and explicitly modeling nonlinear relationships between features through an ensemble of decision trees in the first branch of the model. The dynamic pooling in the SECA mechanism adaptively selects pooling windows at different scales, effectively capturing multi-scale dependencies in the data. Dynamic convolution further explores complex nonlinear relationships by adjusting the kernel size based on the feature distribution. In the two branches of the model, the first branch leverages the XGBoost decision tree ensemble to capture explicit nonlinear relationships. XGBoost explicitly models feature interactions through feature thresholding and tree structures, generating global nonlinear classification results. The second branch utilizes the Transformer architecture, which combines features in high-dimensional space through matrix operations and fully connected layers, implicitly capturing higher-order nonlinear interactions. Finally, the SECA mechanism performs a weighted fusion of the features extracted from both branches, enabling the model to simultaneously utilize the globally explicit nonlinear features modeled by XGBoost and the higher-order nonlinear interactions implicitly captured by the Transformer.

3.2. Accuracy Evaluation Metrics

Five evaluation metrics are employed to assess the algorithm performance, including overall accuracy (OA), precision, recall, F1-score, and Kappa coefficient. These metrics provide a comprehensive evaluation of the model’s performance from different perspectives, such as classification accuracy, consistency, class balance, and computational efficiency. OA reflects the classification accuracy across the entire dataset, but as a single metric, it cannot fully assess the performance on imbalanced datasets, which is why the Kappa coefficient is also introduced. The Kappa coefficient takes into account classification correctness and adjusts for the influence of random agreement, providing a more precise evaluation, particularly for imbalanced datasets. Additionally, precision measures the accuracy of the classification, while recall assesses the completeness. Together, these metrics offer a comprehensive understanding of the model’s performance in specific categories, and the F1-score, which combines precision and recall, provides a balanced evaluation. Finally, training time measures the time required for model training, directly reflecting the model’s scalability and efficiency in large-scale urban applications. The formulas for calculating these accuracy metrics are shown in Equations (11)–(15).
O A = T P + T N T P + F P + F N + T N
K a p p a = P o P e 1 P e
P r e c i s i o n = T P T P + F P
R e c a l l = T P T P + F N
F 1 = 2 × P r e c i s i o n × R e c a l l P r e c i s i o n + R e c a l l
In which
T P represents the number of true positive samples correctly classified. F P denotes the number of false-positive samples incorrectly classified. F N indicates the number of false-negative samples. T N refers to the number of true negative samples correctly classified. P o is the proportion of correctly classified samples in the total sample, while P e is the expected proportion of correct classifications by the model through random chance.

4. Results and Discussion

4.1. Experimental Setup

All experiments were conducted on a workstation equipped with a 16 vCPU Intel(R) Xeon(R) Platinum 8352V CPU @ 2.10GHz and a single NVIDIA RTX 4090 GPU (24GB). The system environment was Ubuntu 20.04, and the CUDA version used was 11.8. The proposed XT-SECA algorithm was implemented in Python 3.8 using the PyTorch 2.0.0 framework.
To ensure adequate representation of each functional zone data and to achieve balanced sample sizes across different categories, about 1% of the segmentation unit data was randomly selected from each functional zone. They were randomly divided into training and test sets with a 7:3 ratio for model development and assessment. Subsequently, the image and POI density data across the entire study area were input into the trained and assessed model to perform large-scale UFZ classification. Considering the limitations in sample labeling and potential biases during the training process, the experiment incorporating random training–testing partitions was conducted 10 times, with the final accuracy computed as the arithmetic mean of all trials.
To evaluate the effectiveness of the XT-SECA algorithm, three widely used algorithms for UFZ classification were selected for comparison, including RF [49], Multi-Layer Perceptron (MLP) [29], and Long Short-Term Memory (LSTM) network [50]. These algorithms are known for their strong adaptability in handling complex spatial data structures, as well as their stability and efficiency in UFZ classification tasks.

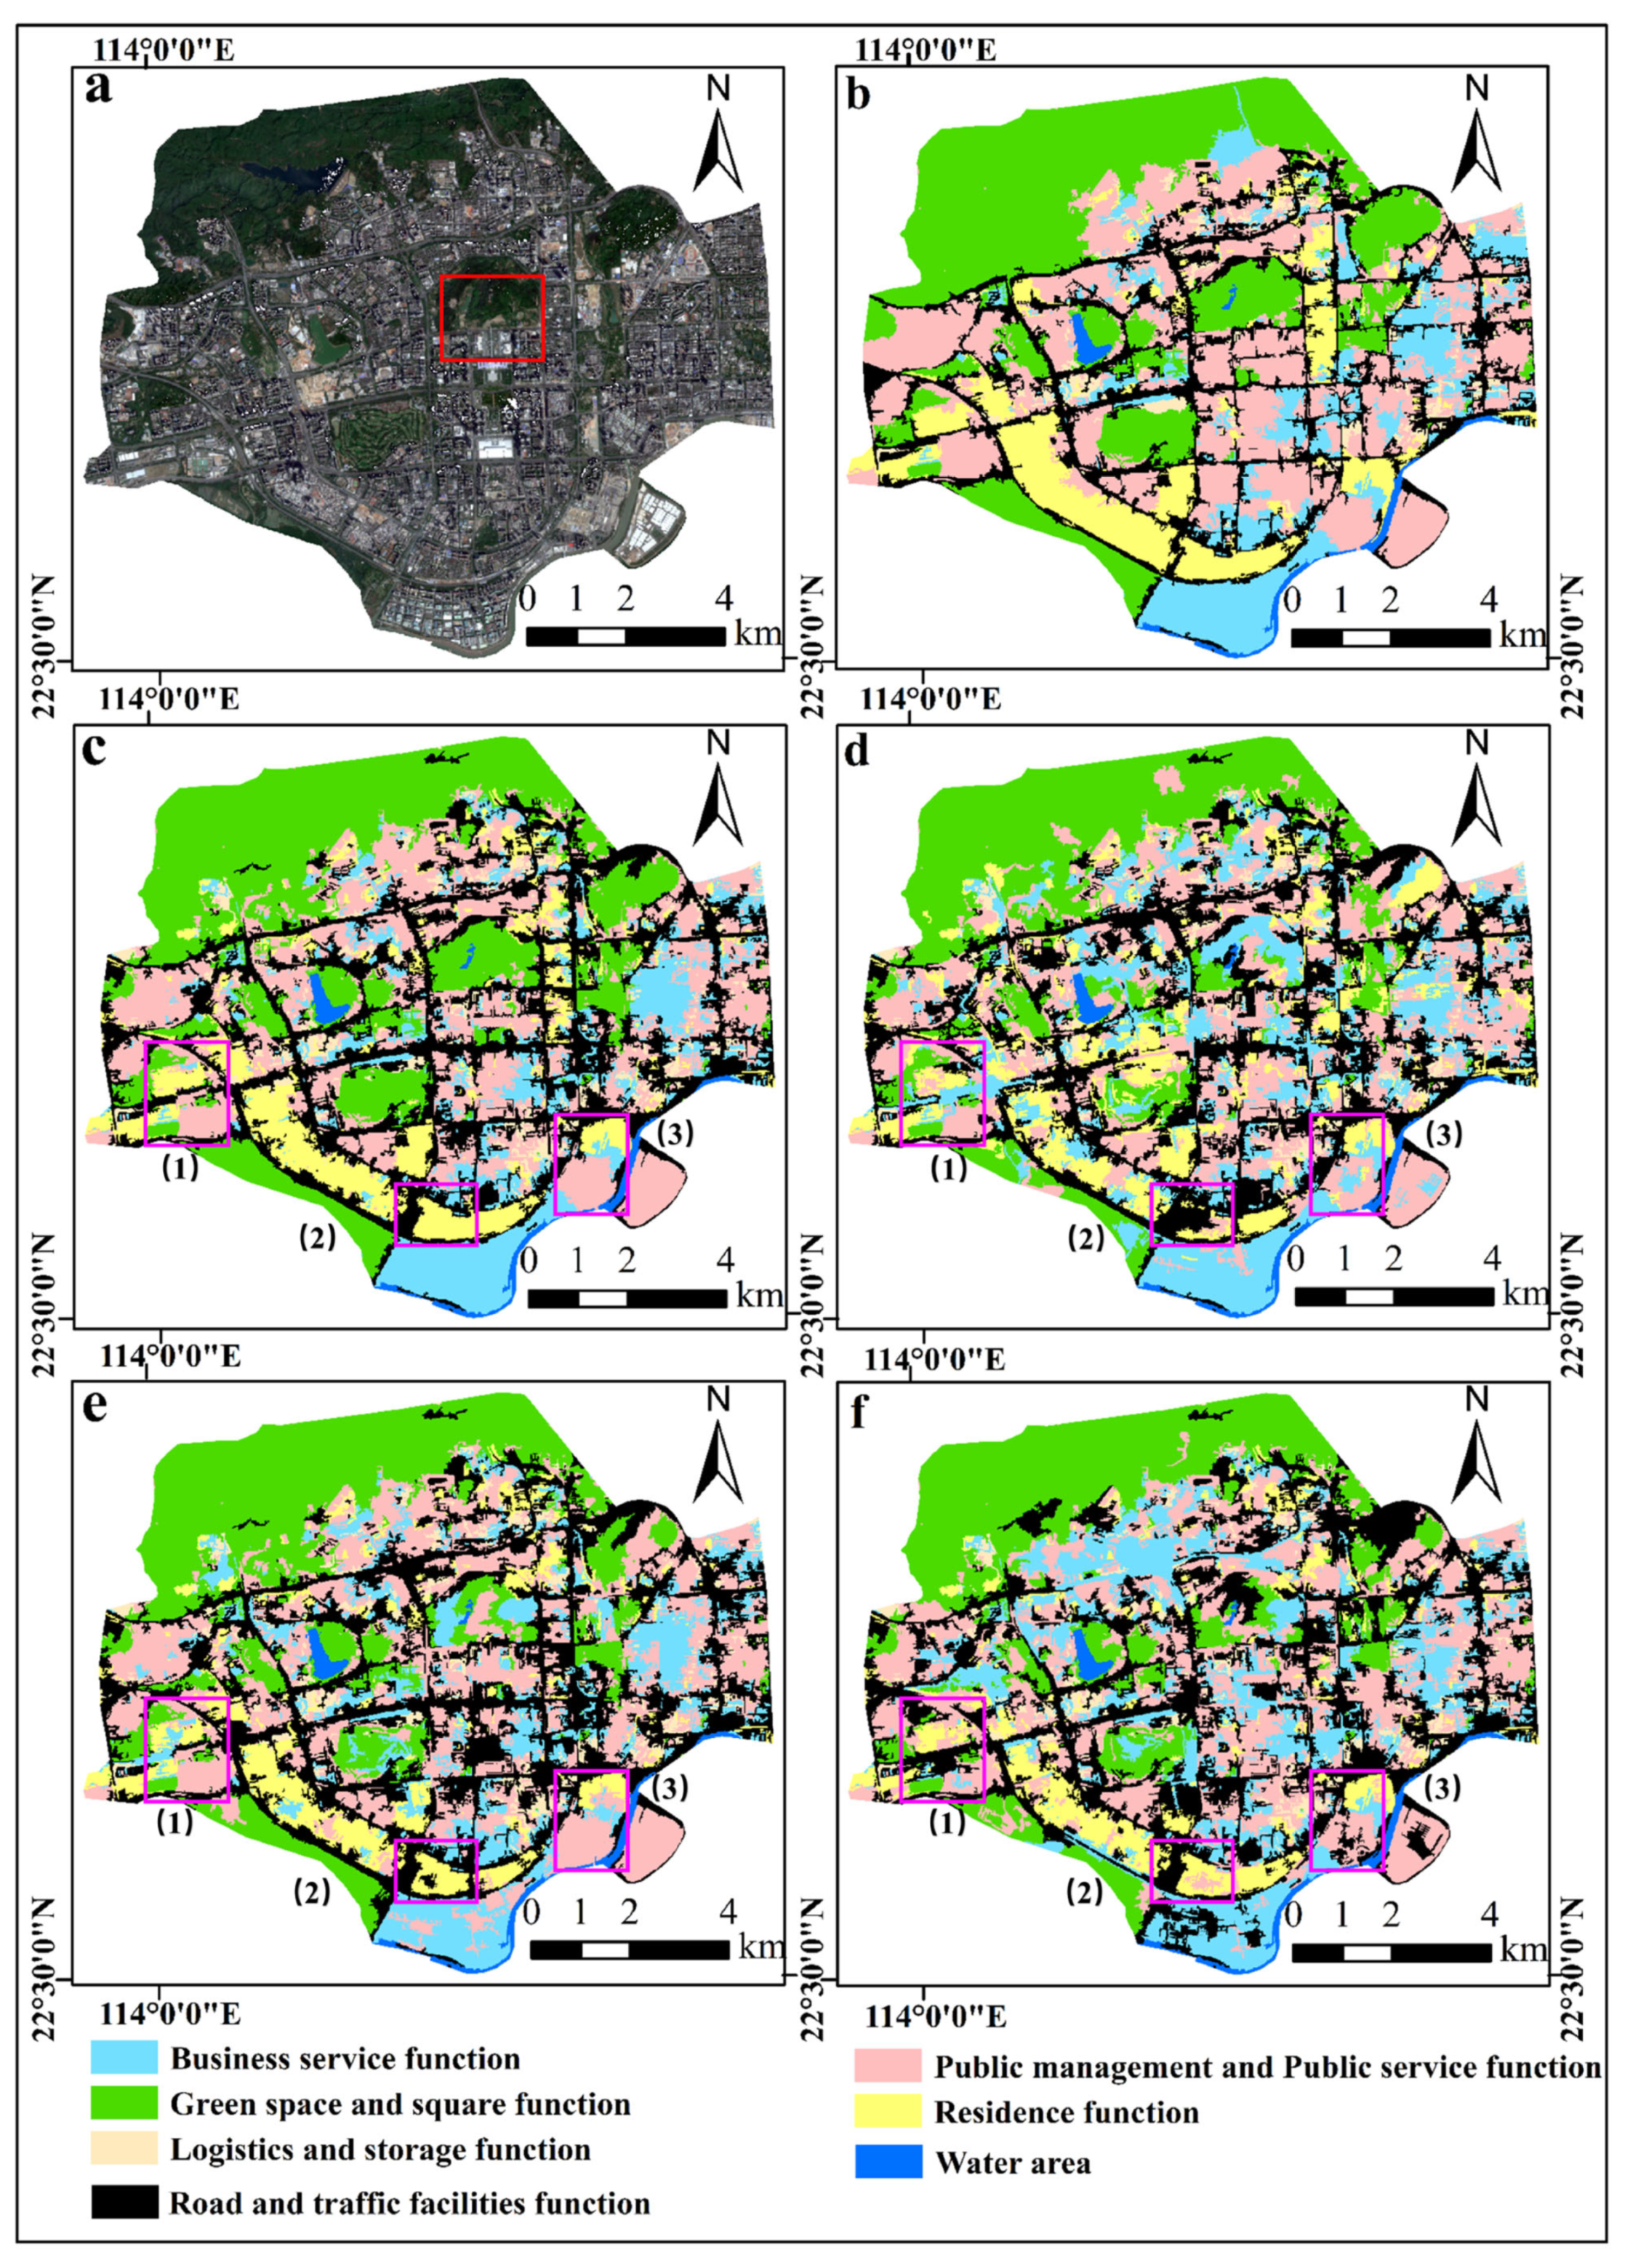
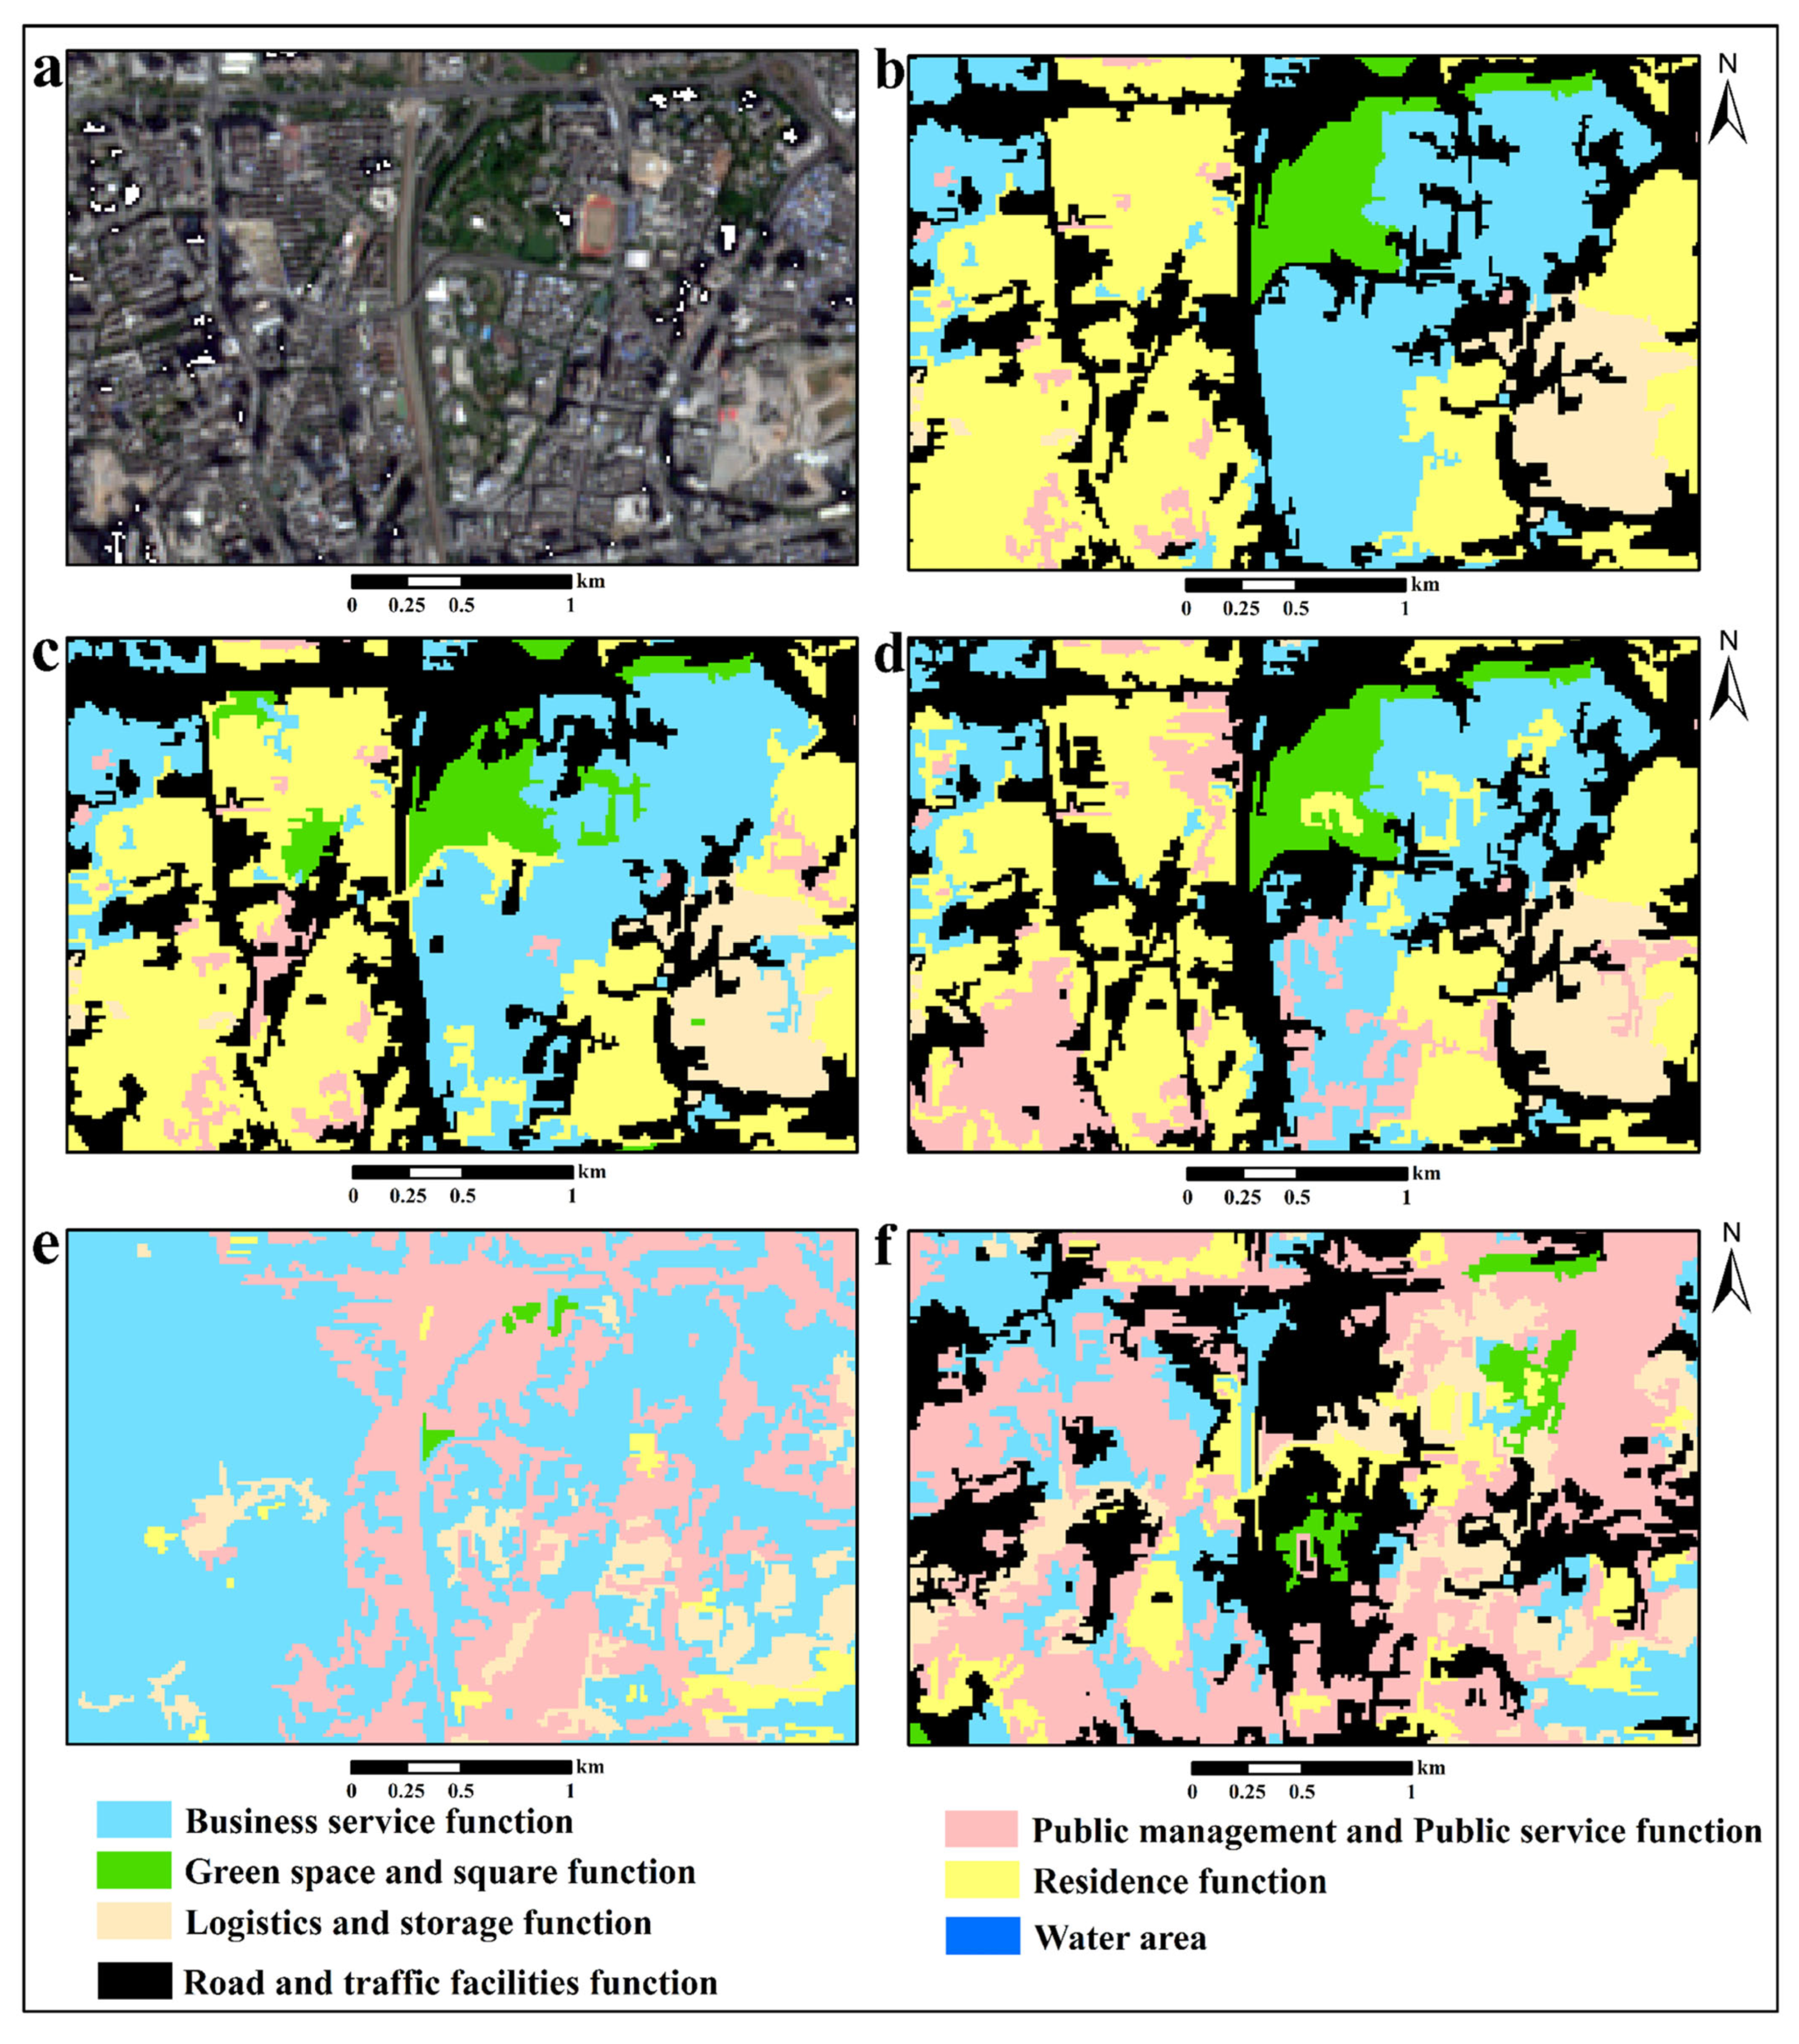
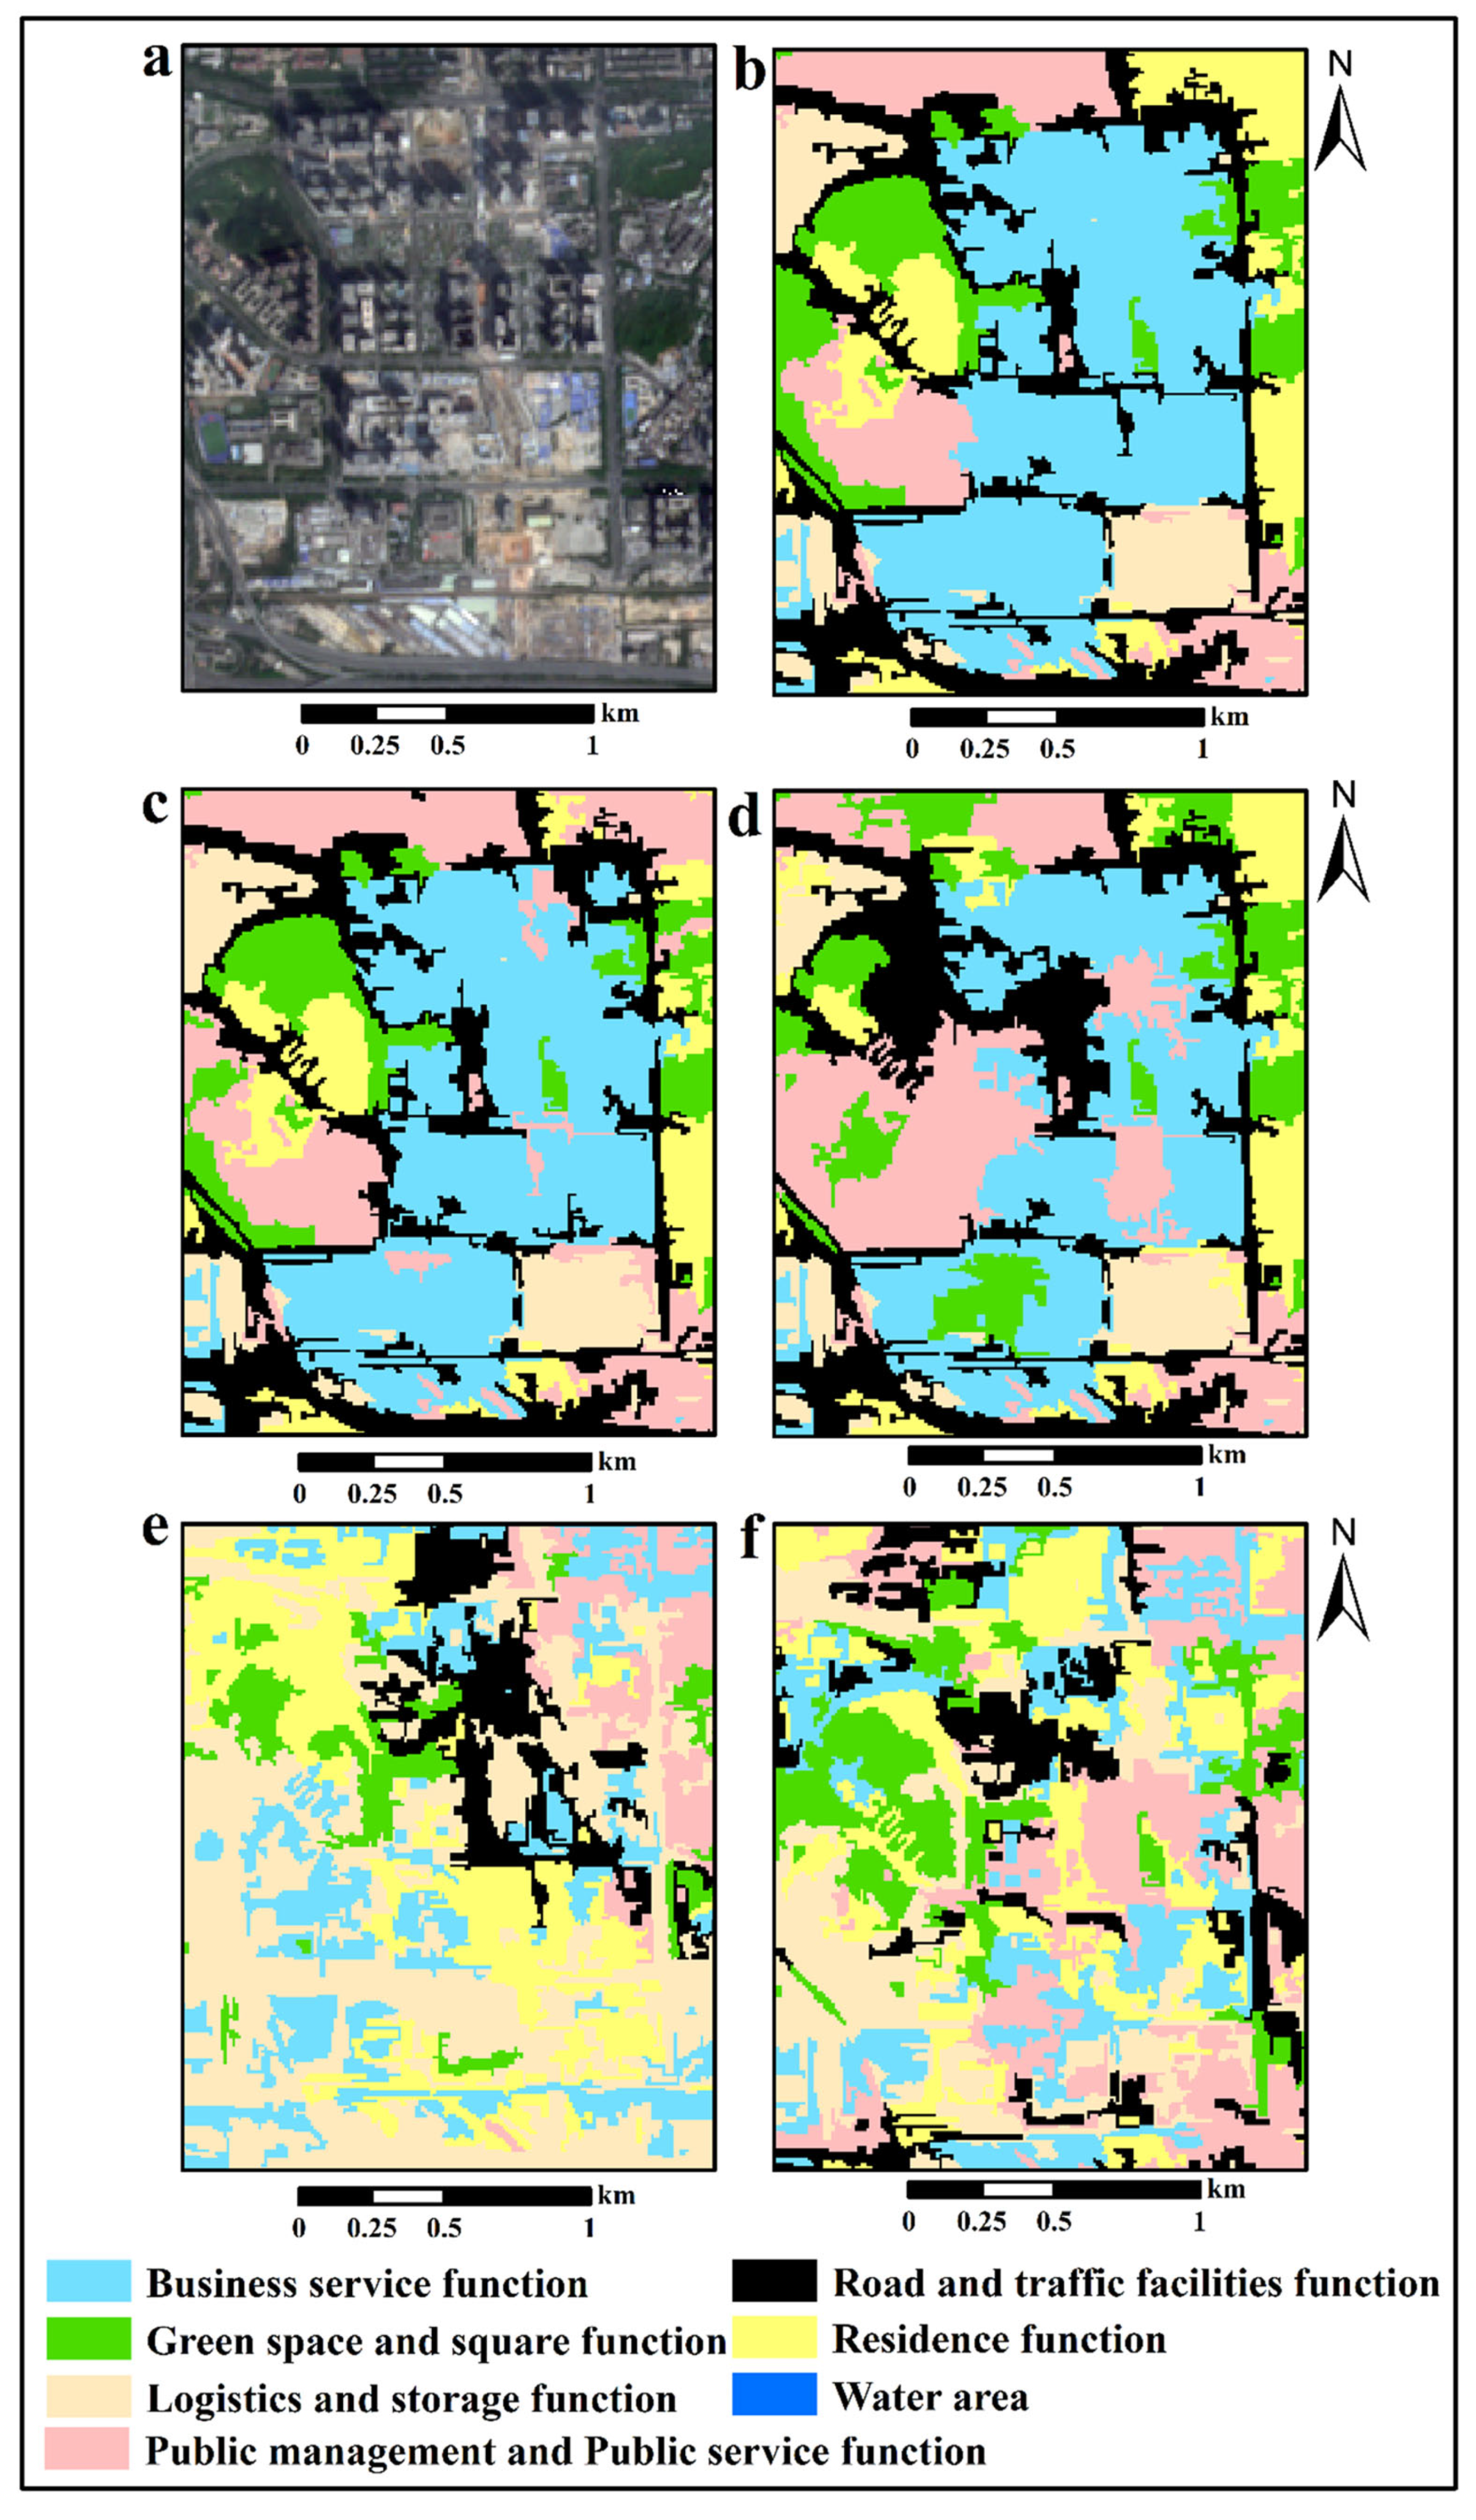
4.2. Urban Functional Zone Classification Results

4.2.1. Algorithm Comparison

The UFZ classification results in the three administrative districts in Shenzhen are shown in Figure 4, Figure 5, Figure 6, Figure 7, Figure 8 and Figure 9. These three districts are characterized by high population density and frequent human activities.
Regarding the overall classification results, the baseline models exhibit significant deficiencies in boundary delineation. The classification results of LSTM and MLP display a “foggy” distribution, with particularly vague boundaries in the areas with dense human activity, such as the commercial core. The models fail to accurately distinguish the transitional zones between functional areas, leading to boundary blurring. Although RF is able to roughly outline the boundaries, it still suffers from boundary fragmentation and salt-and-pepper noise, manifesting as discontinuities along the road network and functional area edges, as well as scattered anomalous patches that disrupt spatial continuity. In contrast, XT-SECA effectively removes redundant features through XGBoost feature selection, resulting in clear and complete boundary delineation.
For instance, in the regions marked by the purple boxes in Figure 4, the boxes (1) and (3) illustrate that XT-SECA successfully identifies complex and interwoven urban structures, whereas the classification results of the other algorithms suffer from noticeable misclassification, manifested as scattered “patches” of incorrect land-use types intruding into otherwise homogeneous zones.
As shown in Figure 5e, the LSTM-based classification fails to delineate the boundaries between functional zones in urban areas, with outputs dominated by single-class predictions. For instance, the highlighted region misclassifies green space and public squares as business service areas. This failure stems from inherent limitations in the LSTM architecture and its incompatibility with the spatially structured data used in this study.
Firstly, LSTM has certain limitations in capturing two-dimensional spatial dependencies in remote sensing imagery. When applied to urban datasets such as multispectral imagery and POI kernel density maps, the LSTM flattens spatial features, thereby ignoring local context and topological continuity. As a result, it struggles to capture subtle class transitions and fine-grained spatial variations.
Secondly, the model structure of LSTM hinders the effective fusion of multimodal inputs, such as spectral and human activity features. Without an attention mechanism to model spatial hierarchies, LSTM tends to overgeneralize, favoring dominant classes and producing overly smoothed outputs. These findings highlight that LSTM cannot effectively support particular spatial classification tasks like urban functional zoning, where cross-scale spatial interactions are essential.
In terms of classification granularity, LSTM and MLP still experience significant category confusion, particularly between commercial areas and public administration service areas. This is mainly because LSTM and MLP fail to effectively model the nonlinear synergy between human activity and remote sensing imagery, leading to inaccurate area delineations. Although RF reduces the confusion to some extent, it still suffers from spatial over-fragmentation and color noise issues. For instance, continuous commercial streets in Luohu are split into multiple fragments, and individual blocks contain mixed categories. XT-SECA, through SECA, suppresses cross-category interference and, by combining XGBoost and Transformer modeling, ensures both fine-grained classification accuracy and the preservation of area integrity, avoiding unreasonable fragmentation.
Figure 10 presents accuracy comparison among four algorithms, where XT-SECA significantly outperforms the other three mainstream algorithms.
In the Futian District, the F1-score of XT-SECA is improved by 7.2%, 30.0%, and 59.6% compared to RF, LSTM, and MLP, respectively. The accuracy of XT-SECA is increased by 7.18%, 29.7%, and 58.2% compared to RF, LSTM, and MLP, respectively. The precision of XT-SECA is enhanced by 5.8%, 29.1%, and 48.0% compared to RF, LSTM, and MLP, respectively. The recall of XT-SECA is 7.18%, 29.7%, and 58.2% higher than RF, LSTM, and MLP, respectively. The Kappa of XT-SECA is improved by 9.0%, 37.5%, and 67.8% compared to RF, LSTM, and MLP, respectively. The inference time of XT-SECA is slower by 11.78 s, faster by 211.45 s and 87.0 s than RF, LSTM, and MLP, respectively.
In the Luohu District, the F1-score of XT-SECA is improved by 3.9%, 76.0%, and 65.0% compared to RF, LSTM, and MLP, respectively. The accuracy of XT-SECA is increased by 4.2%, 75.1%, and 62.7% compared to RF, LSTM, and MLP, respectively. The precision of XT-SECA is enhanced by 2.8%, 73.5%, and 59.1% compared to RF, LSTM, and MLP, respectively. The recall of XT-SECA is 4.2%, 75.1%, and 62.7% higher than RF, LSTM, and MLP, respectively. The Kappa of XT-SECA is improved by 5.1%, 89.2%, and 74.0% compared to RF, LSTM, and MLP, respectively. The inference time of XT-SECA is slower by 11.85 s, faster by 211.67 s, and faster by 87.0 s compared to RF, LSTM, and MLP, respectively.
In the Nanshan District, the F1-score of XT-SECA is improved by 6.1%, 50.0%, and 64.3% compared to RF, LSTM, and MLP, respectively. The accuracy of XT-SECA is increased by 6.5%, 49.8%, and 62.1% compared to RF, LSTM, and MLP, respectively. The precision of XT-SECA is enhanced by 5.1%, 45.6%, and 62.1% compared to RF, LSTM, and MLP, respectively. The recall of XT-SECA is increased by 6.5%, 49.8%, and 62.1% compared to RF, LSTM, and MLP, respectively. The Kappa of XT-SECA is improved by 7.2%, 58.0%, and 73.1% compared to RF, LSTM, and MLP, respectively. The inference time of XT-SECA is slower by 11.763 s, faster by 213.09 s, and faster by 89.32 s compared to RF, LSTM, and MLP, respectively.

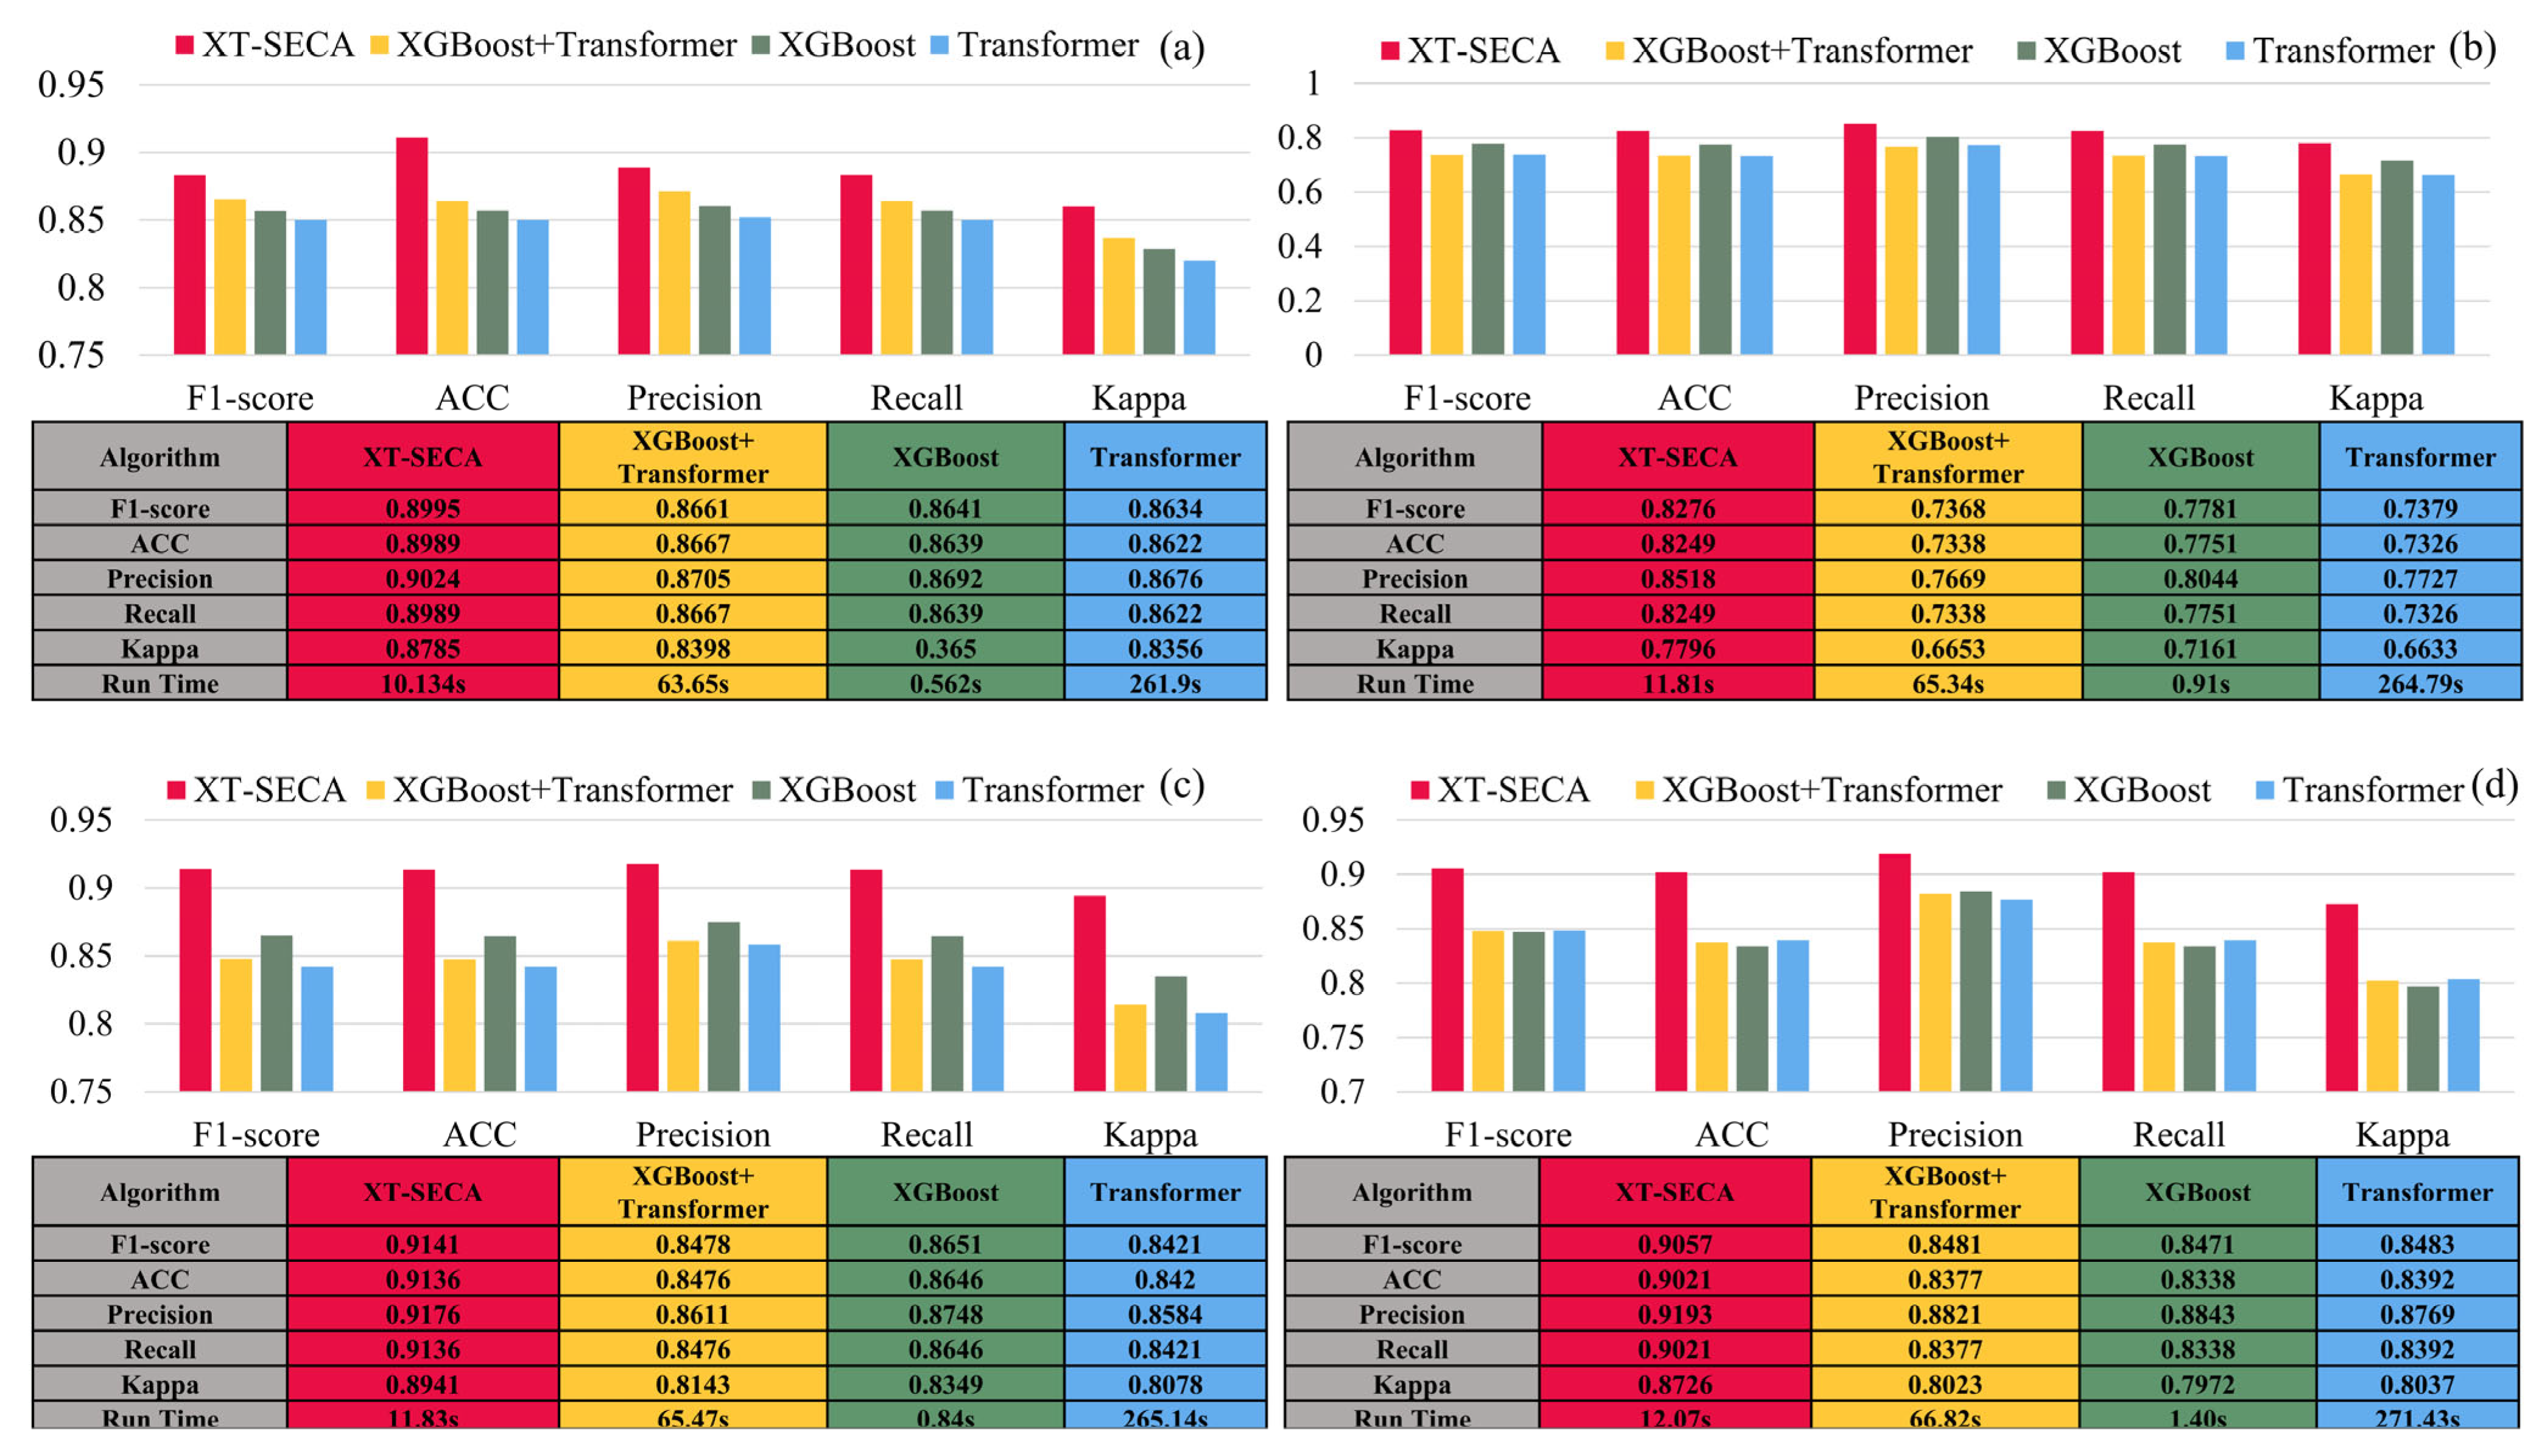
4.2.2. Ablation Experiment

To validate the effectiveness of each module in the XT-SECA architecture, ablation experiments were conducted, and the results are shown in Figure 11. XT-SECA achieves the best UFZ classification performance after integrating all modules, with SECA achieving an optimal integration of accuracy and efficiency.
XGBoost+Transformer refers to using XGBoost to process input spectral features from remote sensing images and POI kernel density features. The output of XGBoost is then mapped to the dimensionality required by the Transformer module through a fully connected layer, after which the Transformer is employed for classification. XGBoost refers to the standalone use of the XGBoost algorithm for classification tasks. Transformer refers to the stacking of multiple self-attention layers and feed-forward neural network layers, followed by classification output through a fully connected layer. In the Futian District, the F1-score of XT-SECA is improved by 9.1%, 5.0%, and 9.0% compared to the ones of XGBoost+Transformer, XGBoost, and Transformer, respectively. The accuracy of XT-SECA is increased by 9.1%, 5.0%, and 9.2% compared to the ones of XGBoost+Transformer, XGBoost, and Transformer, respectively. The precision of XT-SECA is enhanced by 8.5%, 4.7%, and 7.9% compared to the ones of XGBoost+Transformer, XGBoost, and Transformer, respectively. The recall of XT-SECA is increased by 9.1%, 5.0%, and 9.2% compared to the ones of XGBoost+Transformer, XGBoost, and Transformer, respectively. The Kappa of XT-SECA is improved by 11.4%, 6.4%, and 11.6% compared to the ones of XGBoost+Transformer, XGBoost, and Transformer, respectively. The inference time of XT-SECA is reduced by 53.53 s, increased by 10.9 s, and reduced by 252.98 s compared to the one of XGBoost+Transformer, XGBoost, and Transformer, respectively.
In the Luohu District, the F1-score of XT-SECA is improved by 6.6%, 5.0%, and 7.2% compared to XGBoost+Transformer, XGBoost, and Transformer, respectively. The accuracy of XT-SECA is increased by 6.6%, 5.0%, and 7.2% compared to XGBoost+Transformer, XGBoost, and Transformer, respectively. The precision of XT-SECA is enhanced by 5.7%, 4.3%, and 5.9% compared to XGBoost+Transformer, XGBoost, and Transformer, respectively. The recall of XT-SECA is increased by 6.6%, 5.0%, and 7.2% compared to XGBoost+Transformer, XGBoost, and Transformer, respectively. The Kappa of XT-SECA is improved by 8.1%, 5.9%, and 8.6% compared to XGBoost+Transformer, XGBoost, and Transformer, respectively. The inference time of XT-SECA is reduced by 53.64 s, increased by 10.99 s, and reduced by 253.31 s compared to XGBoost+Transformer, XGBoost, and Transformer, respectively.
In Nanshan District, the F1-score of XT-SECA is improved by 5.8%, 5.9%, and 5.7% compared to XGBoost+Transformer, XGBoost, and Transformer, respectively. The accuracy of XT-SECA is increased by 6.4%, 6.9%, and 6.3% compared to XGBoost+Transformer, XGBoost, and Transformer, respectively. The precision of XT-SECA is enhanced by 3.7%, 3.5%, and 4.2% compared to XGBoost+Transformer, XGBoost, and Transformer, respectively. The recall of XT-SECA is increased by 6.4%, 6.9%, and 6.3% compared to XGBoost+Transformer, XGBoost, and Transformer, respectively. The Kappa of XT-SECA is improved by 7.0%, 7.5%, and 6.9% compared to XGBoost+Transformer, XGBoost, and Transformer, respectively. The inference time of XT-SECA is reduced by 54.75 s, increased by 10.67 s, and reduced by 259.36 s compared to XGBoost+Transformer, XGBoost, and Transformer, respectively.
As shown in Figure 11, XT-SECA effectively enhances the overall performance of the model by integrating three modules: XGBoost, Transformer, and SECA. It leverages XGBoost’s explicit nonlinear modeling, Transformer’s implicit higher-order feature interaction learning, and SECA’s multi-scale feature extraction capability based on dynamic pooling and convolution. This integration improves classification accuracy while optimizing inference efficiency.
This paper proposes a dual-branch network method for large-scale UFZ classification, demonstrating satisfactory performance. To further adapt the framework to global-scale UFZ classification scenarios, the proposed network can be improved in the following aspects:
1.
Incorporation of spatial heterogeneity-aware modules. Urban areas across the globe exhibit substantial diversity in morphological and functional patterns, shaped by socio-economic, cultural, and climatic conditions. To enhance the model’s transferability across continents and varying urban structures (e.g., monocentric vs. polycentric cities), domain-adaptive components, such as adaptive normalization layers or attention-based spatial priors, could be integrated into the network. These modules would allow for dynamic adjustment to region-specific urban characteristics, thereby reducing the dependence on extensive fine-tuning when applied to new geographic regions.
2.
Integration of multi-source data and hierarchical supervision mechanisms. In global applications, the availability and reliability of POI and ancillary datasets often vary significantly. To address this, a semi-supervised or multi-task learning framework that incorporates weak labels (e.g., nighttime light intensity, land-use codes, crowd-sourced annotations) could improve model robustness in data-scarce regions. Furthermore, designing a hierarchical classification pipeline, initially distinguishing coarse land-use categories before refining them into specific functional subtypes, would better align with the heterogeneous granularity of global UFZ definitions while maintaining computational efficiency.
With these improvements, the proposed network would be better equipped to support scalable and cross-regional functional zone classification, thereby facilitating a wide range of applications such as global urban monitoring, sustainable development assessment, and international urban planning research.

5. Conclusions

UFZ classification plays a crucial role in modern urban planning, land resource utilization, and urban sustainable development. This work presents a novel XT-SECA model designed to address the dual challenges of accuracy and efficiency in large-scale UFZ classification. The XT-SECA model integrates XGBoost, Transformer feedforward network, and SECA attention mechanism. It can effectively capture the relationships and interaction between human activity features and image spectral features in the context of UFZ classification. This integration ensures that the model retains both the explicit nonlinear features modeled by XGBoost and the higher-order nonlinear interactions implicitly captured by the Transformer. Three key conclusions are drawn.
1.
XT-SECA improves the performance and efficiency of UFZ classification through the effective combination of XGBoost, Transformer, and SECA. It significantly enhances the robustness of classification performance in the presence of complex and overlapping UFZs (such as residential, commercial, and public service areas), effectively addressing the issue of class confusion.
2.
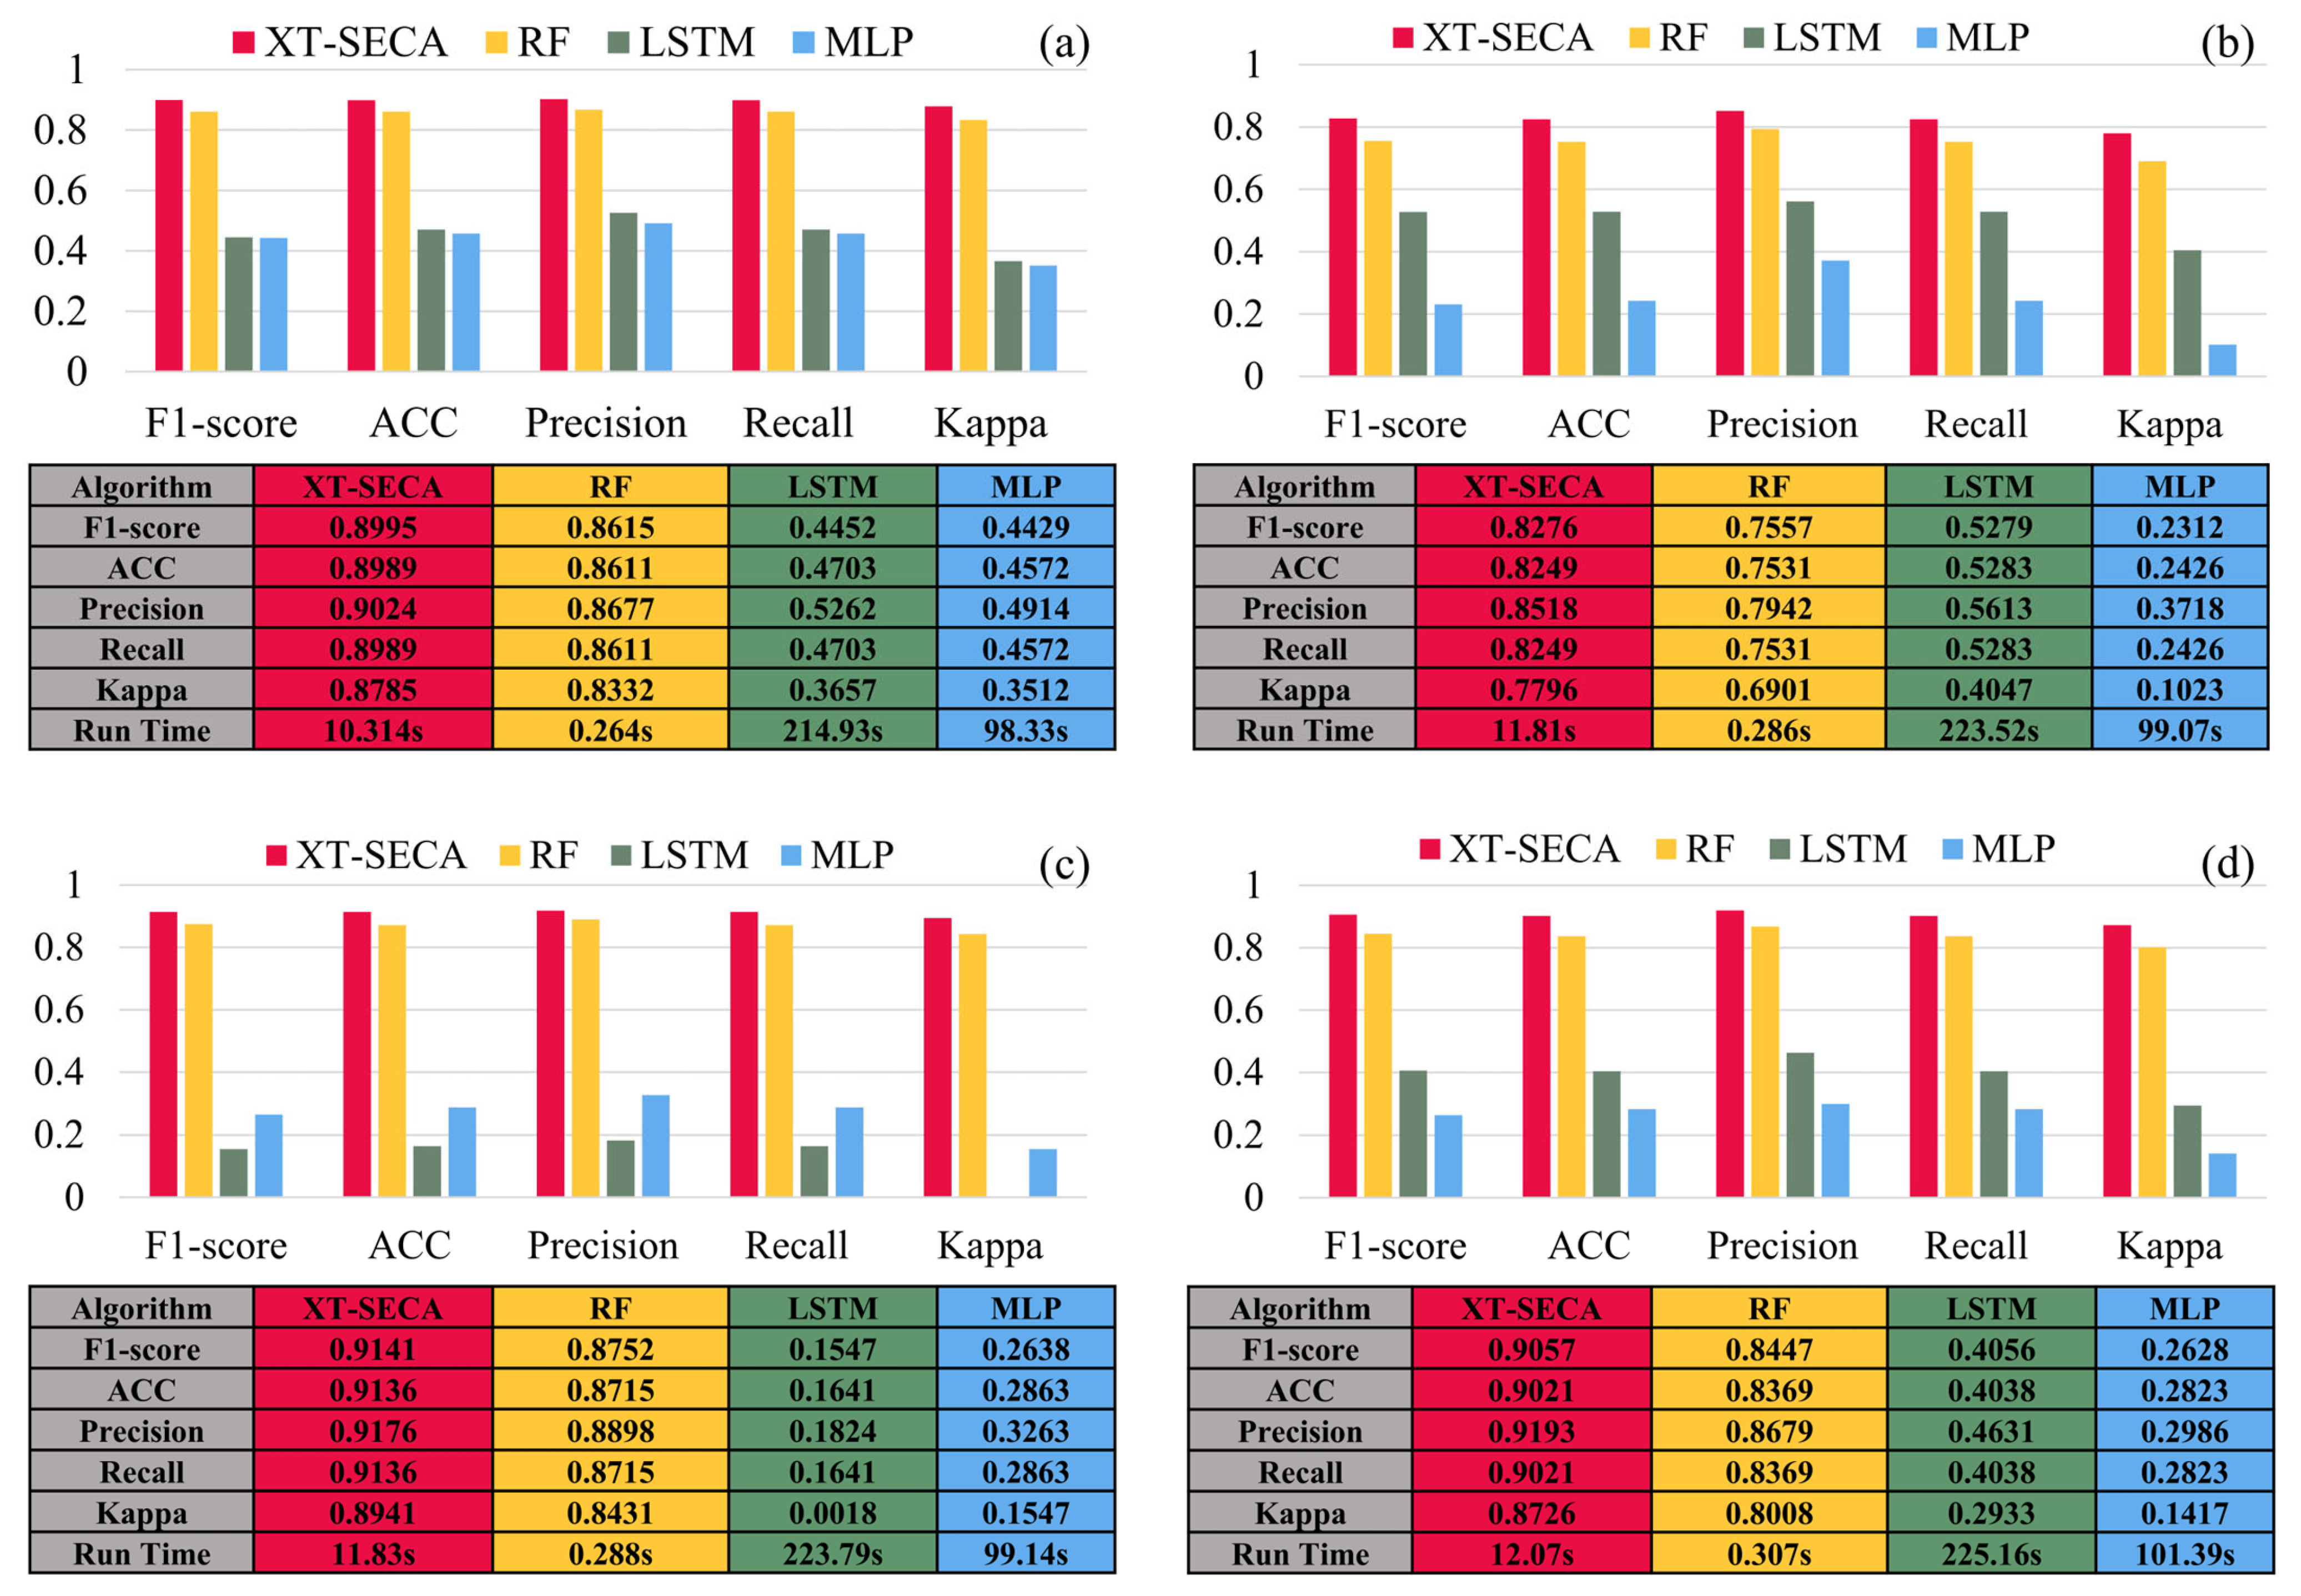
The XT-SECA algorithm was applied to key areas in Shenzhen: the science and technology innovation center (Nanshan District), commercial and financial center (Luohu District), and administrative center (Futian District). XT-SECA outperformed several widely used UFZ classification algorithms. Taking precision as an evaluation metric, the model achieved a precision of 0.8518 in the Futian District, exceeding RF, LSTM, and MLP by 5.8%, 29.1%, and 48.0%, respectively. In the Luohu District, XT-SECA reached a precision of 0.9176, with respective improvements of 2.8%, 73.5%, and 59.1% over the same algorithms. In the Nanshan District, the model achieved the highest precision of 0.9193, surpassing RF, LSTM, and MLP by 5.1%, 45.6%, and 62.1%, respectively.
3.
The ablation experiment validated the effectiveness of each module. The XGBoost component explicitly captures nonlinear feature interactions using decision trees, while the Transformer feedforward network captures nonlinear spatial features and implicitly models complex relationships. The SECA mechanism integrates features through dynamic pooling and convolution, enhancing the model’s ability to leverage both explicit and implicit nonlinear features. Taking the precision metric in the Futian District as an example, XT-SECA outperformed XGBoost + Transformer, XGBoost, and Transformer by 8.5%, 4.7%, and 7.9%, respectively. In the Luohu District, the improvements were 5.7%, 4.3%, and 5.9%; in the Nanshan District, they were 3.7%, 3.5%, and 4.2%, respectively. In terms of time, XT-SECA reduced processing duration from 65.34 s, 65.47 s, and 66.82 s in Futian, Luohu, and Nanshan, respectively, to 11.81 s, 11.83 s, and 12.07 s.
In future work, we plan to enhance the model’s scalability and transferability for global-scale applications by incorporating spatial heterogeneity-aware modules and multi-source weak supervision. These directions will facilitate broader deployment of UFZ classification models in diverse urban contexts across the world.

Author Contributions

Conceptualization, Xin Gao; Software, Xin Gao; Experiment, Xin Gao; Writing—original draft, Xin Gao; Visualization, Xin Gao. Conceptualization, Xianmin Wang; Methodology, Xianmin Wang; Formal analysis, Xianmin Wang; Writing—original draft, Xianmin Wang; Writing—review and editing, Xianmin Wang. Writing—review and editing, Li Cao; Supervision, Li Cao. Writing—review and editing, Haixiang Guo. Experiment, Wenxue Chen; Visualization, Wenxue Chen. Writing—review and editing, Xing Zhai. All authors have read and agreed to the published version of the manuscript.

Funding

This work is funded by the Key Science and Technology Plan of the Emergency Management Department (2024EMST030301), National Natural Science Foundation of China (U21A2013, 71874165, 42311530065), Undergraduate Innovation and Entrepreneurship Program, China University of Geosciences (Wuhan) (S202410491189, S202510491347), Innovative Research Groups of Hubei Province of China (Grant No.2024AFA015), Opening Fund of Key Laboratory of Geological Survey and Evaluation of Ministry of Education (Grant Nos. GLAB2024ZR04, GLAB2020ZR02, GLAB2022ZR02), and the Fundamental Research Funds for the Central Universities, China University of Geosciences (Wuhan) (CUG2642022006).

Data Availability Statement

All data are available within this article.

Conflicts of Interest

The authors declare that they have no known competing financial interests or personal relationships that could have appeared to influence the work reported in this paper.

References

  1. Ma, L.; Huang, Z.; Song, M.; Li, L.; Zhang, L. Mixed-use of industrial land: Foreign experience and practical implications. Urban Plann. Int. 2023, 3, 20–21. [Google Scholar] [CrossRef]
  2. Luo, G.; Ye, J.; Wang, J.; Wei, Y. Urban functional zone classification based on POI data and machine learning. Sustainability 2023, 15, 4631. [Google Scholar] [CrossRef]
  3. Du, S.; Du, S.; Liu, B.; Zhang, X.; Zheng, Z. Large-scale urban functional zone mapping by integrating remote sensing images and open social data. GISci. Remote Sens. 2020, 57, 411–430. [Google Scholar] [CrossRef]
  4. Long, J.; Zhang, J.; Wang, M. Semantic-aware urban functional area recognition from multi-source data: A deep embedding approach. ISPRS J. Photogramm. Remote Sens. 2023, 198, 156–170. [Google Scholar]
  5. Zhao, W.; Peng, S.; Chen, J.; Zhang, H.; Lin, S. Exploring urban functional zones based on multi-source semantic knowledge and cross-modal network. Int. Arch. Photogramm. Remote Sens. Spat. Inf. Sci. 2023, 48, 1337–1342. [Google Scholar] [CrossRef]
  6. Chen, J.; Chen, Y.; Zheng, Z.; Ling, Z.; Meng, X. Urban functional zone classification based on high-resolution remote sensing imagery and nighttime light imagery. Remote Sens. 2025, 17, 1588. [Google Scholar] [CrossRef]
  7. Zhang, K.; Ming, D.; Du, S.; Xu, L.; Ling, X.; Zeng, B.; Lv, X. Distance weight–graph attention model–based high-resolution remote sensing urban functional zone identification. IEEE Trans. Geosci. Remote Sens. 2022, 60, 5608518. [Google Scholar] [CrossRef]
  8. Yu, M.; Xu, H.; Zhou, F.; Xu, S.; Yin, H. A deep-learning-based multimodal data fusion framework for urban region function recognition. ISPRS Int. J. Geo-Inf. 2023, 12, 468. [Google Scholar] [CrossRef]
  9. Xu, W.; Wang, J.; Wu, Y. Multi-Dimension Geospatial Feature Learning for Urban Region Function Recognition. In Proceedings of the IEEE International Geoscience and Remote Sensing Symposium (IGARSS), Kuala Lumpur, Malaysia, 17–22 July 2022; pp. 5832–5835. [Google Scholar] [CrossRef]
  10. Chen, S.; Zhang, H.; Yang, H. Urban Functional Zone Recognition Integrating Multisource Geographic Data. Remote Sens. 2021, 13, 4732. [Google Scholar] [CrossRef]
  11. Zhang, Y.; Xu, Y.; Gao, J.; Zhao, Z.; Sun, J.; Mu, F. Urban functional zone identification based on multimodal data fusion: A case study of Chongqing’s central urban area. Remote Sens. 2025, 17, 990. [Google Scholar] [CrossRef]
  12. Liu, T.; Chen, H.; Ren, J.; Zhang, L.; Chen, H.; Hong, R.; Li, C.; Cui, W.; Guo, W.; Wen, C. Urban Functional Zone Classification via Advanced Multi-Modal Data Fusion. Sustainability 2024, 16, 11145. [Google Scholar] [CrossRef]
  13. GB 50137-2011; China Academy of Urban Planning and Design, Urban Land Use Classification and Planning and Construction Land Use Standards. Ministry of Housing and Urban-Rural Development of the People’s Republic of China: Beijing, China, 2010.
  14. Batty, M. The size; scale, and shape of cities. Science 2008, 319, 769–771. [Google Scholar] [CrossRef]
  15. Lu, W.P.; He, Q.K.; Li, J.L.; Li, S.Y.; Tao, C. Object units and Transformer networks combined with urban functional zone classification method. Natl. Remote Sens. Bull. 2024, 28, 1927–1939. [Google Scholar] [CrossRef]
  16. Wang, K.-J.; Xu, W.-M.; Li, C.-Y.; Shao, E.-H.; Yang, H. A study on the function and structure of mixed land use in urban built-up areas from the perspective of spatial governance. J. Nat. Resour. 2023, 38, 1496–1516. [Google Scholar] [CrossRef]
  17. Das, S.; Sarkar, R. Predicting the land use and land cover change using Markov model: A catchment level analysis of the Bhagirathi-Hugli River. Spat. Inf. Res. 2019, 27, 439–452. [Google Scholar] [CrossRef]
  18. Wang, Y.; Wang, T.; Tsou, M.-H.; Li, H.; Jiang, W.; Guo, F. Mapping dynamic urban land use patterns with crowdsourced geo-tagged social media (Sina-Weibo) and commercial points of interest collections in Beijing, China. Sustainability 2016, 8, 1202. [Google Scholar] [CrossRef]
  19. Memarsadeghi, N.; Mount, D.M.; Netanyahu, N.S.; Le Moigne, J. A fast implementation of the ISODATA clustering algo-rithm. Int. J. Comput. Geom. Appl. 2007, 17, 71–103. [Google Scholar] [CrossRef]
  20. Zhang, H.; Wang, R.; Chen, B.; Hou, Y.; Qu, D. Dynamic identification of urban functional areas and visual analysis of time-varying patterns based on trajectory data and POIs. J. Comput.-Aided Des. Comput. Graph. 2018, 30, 1728–1740. [Google Scholar] [CrossRef]
  21. Li, S.; Song, W.; Fang, L.; Chen, Y.; Ghamisi, P.; Benediktsson, J.A. Deep learning for hyperspectral image classification: An overview. IEEE Trans. Geosci. Remote Sens. 2019, 57, 6690–6709. [Google Scholar] [CrossRef]
  22. Zhou, P.C.; Cheng, G.; Yao, X.W.; Han, J.W. Machine learning paradigms in high-resolution remote sensing image in-terpretation. Natl. Remote Sens. Bull. 2021, 25, 182–197. [Google Scholar] [CrossRef]
  23. Chen, T.; Guestrin, C. XGBoost: A scalable tree boosting system. In Proceedings of the 22nd ACM SIGKDD International Conference on Knowledge Discovery and Data Mining (KDD ‘16), San Francisco, CA, USA, 13–17 August 2016; pp. 785–794. [Google Scholar] [CrossRef]
  24. Li, X.; Deng, Y.; Liu, B.; Yang, J.; Li, M.; Jing, W.; Chen, Z. GDP spatial differentiation in the perspective of urban functional zones. Cities 2024, 151, 105126. [Google Scholar] [CrossRef]
  25. Ågren, A.M.; Lin, Y. A fully automated model for land use classification from historical maps using machine learning. Remote Sens. Appl. Soc. Environ. 2024, 36, 101349. [Google Scholar] [CrossRef]
  26. Shao, Z.; Ahmad, M.N.; Javed, A. Comparison of random forest and XGBoost classifiers using integrated optical and SAR features for mapping urban impervious surface. Remote Sens. 2024, 16, 665. [Google Scholar] [CrossRef]
  27. Breiman, L. Random forests. Mach. Learn. 2001, 45, 5–32. [Google Scholar] [CrossRef]
  28. Oukawa, G.Y.; Krecl, P.; Targino, A.C. Fine-scale modeling of the urban heat island: A comparison of multiple linear regression and random forest approaches. Sci. Total Environ. 2022, 815, 152836. [Google Scholar] [CrossRef] [PubMed]
  29. Liu, Y.; Zhang, W.; Liu, W.; Tan, Z.; Hu, S.; Ao, Z.; Li, J.; Xing, H. Exploring the seasonal effects of urban morphology on land surface temperature in urban functional zones. Sustain. Cities Soc. 2024, 103, 105268. [Google Scholar] [CrossRef]
  30. Du, S.; Zhang, Y.; Sun, W.; Liu, B. Quantifying heterogeneous impacts of 2D/3D built environment on carbon emissions across urban functional zones: A case study in Beijing, China. Energy Build. 2024, 319, 114513. [Google Scholar] [CrossRef]
  31. Cover, T.; Hart, P. Nearest neighbor pattern classification. IEEE Trans. Inf. Theory 1967, 13, 21–27. [Google Scholar] [CrossRef]
  32. Mo, Y.; Guo, Z.; Zhong, R.; Song, W.; Cao, S. Urban functional zone classification using light-detection-and-ranging point clouds, aerial images, and point-of-interest data. Remote Sens. 2024, 16, 386. [Google Scholar] [CrossRef]
  33. Sanlang, S.; Siji, S.; Cao, S.; Du, M.; Mo, Y.; Chen, Q.; He, W. Integrating aerial LiDAR and very-high-resolution images for urban functional zone mapping. Remote Sens. 2021, 13, 2573. [Google Scholar] [CrossRef]
  34. Deng, Y.; He, R. Refined urban functional zone mapping by integrating open-source data. ISPRS Int. J. Geo-Inf. 2022, 11, 421. [Google Scholar] [CrossRef]
  35. Teh, W.Y.; Tan, I.K.T. TransUNet for cross-domain semantic segmentation of urban scenery. In Proceedings of the 2022 International Symposium on Intelligent Signal Processing and Communication Systems (ISPACS), Penang, Malaysia, 22–25 November 2022; pp. 1–4. [Google Scholar] [CrossRef]
  36. Fan, R.; Li, J.; Song, W.; Han, W.; Yan, J.; Wang, L. Urban informal settlements classification via a transformer-based spa-tial-temporal fusion network using multimodal remote sensing and time-series human activity data. Int. J. Appl. Earth Obs. Geoinf. 2022, 111, 102831. [Google Scholar] [CrossRef]
  37. LeCun, Y.; Bottou, L.; Bengio, Y.; Haffner, P. Backpropagation applied to handwritten zip code recognition. Neural Comput. 1989, 1, 541–551. [Google Scholar] [CrossRef]
  38. Guo, Z.; Wen, J.; Xu, R. A shape and size free-CNN for urban functional zone mapping with high-resolution satellite images and POI data. IEEE Trans. Geosci. Remote Sens. 2023, 61, 5622117. [Google Scholar] [CrossRef]
  39. Ouyang, S.; Du, S.; Zhang, X.; Du, S.; Bai, L. MDFF: A method for fine-grained UFZ mapping with multimodal geographic data and deep network. IEEE J. Sel. Topics Appl. Earth Observ. Remote Sens. 2023, 16, 9951–9966. [Google Scholar] [CrossRef]
  40. Ramana, K.; Srivastava, G.; Kumar, M.R.; Gadekallu, T.R.; Lin, J.C.-W.; Alazab, M.; Iwendi, C. A vision transformer approach for traffic congestion prediction in urban areas. IEEE Trans. Intell. Transp. Syst. 2023, 24, 3922–3934. [Google Scholar] [CrossRef]
  41. Afrin, S.; Machida, F. Exploiting transformer models in three-version image classification systems. In Proceedings of the 2024 IEEE 48th Annual Computers, Software, and Applications Conference (COMPSAC), Osaka, Japan, 2–4 July 2024; pp. 662–669. [Google Scholar] [CrossRef]
  42. Vaswani, A.; Shazeer, N.; Parmar, N.; Uszkoreit, J.; Jones, L.; Gomez, A.N.; Kaiser, Ł.; Polosukhin, I. Attention is all you need. Adv. Neural Inf. Process. Syst. 2017, 30. [Google Scholar] [CrossRef]
  43. Dosovitskiy, A.; Beyer, L.; Kolesnikov, A.; Weissenborn, D.; Zhai, X.; Unterthiner, T.; Dehghani, M.; Minderer, M.; Heigold, G.; Gelly, S.; et al. An image is worth 16x16 words: Transformers for image recognition at scale. arXiv 2021, arXiv:2010.11929. [Google Scholar] [CrossRef]
  44. Shenzhen Municipal Bureau of Statistics, Shenzhen Statistic Yearbook 2021; Shenzhen Municipal Bureau of Statistics: Shenzhen, China, 2021.
  45. Chen, J.; Chang, K.; Karacsonyi, D.; Zhang, X. Comparing urban land expansion and its driving factors in Shenzhen and Dongguan, China. Habitat Int. 2014, 43, 61–71. [Google Scholar] [CrossRef]
  46. Baatz, M.; Schape, A. Multiresolution segmentation—An optimization approach for high quality multi-scale image seg-mentation. In Angewandte Geographische Information Sverarbeitung; Strobl, J., Blaschke, T., Griesebner, G., Eds.; Wichmann-Verlag: Heidelberg, Germany, 2000; pp. 12–23. [Google Scholar]
  47. Huang, Z.; Qi, H.; Kang, C.; Su, Y.; Liu, Y. An ensemble learning approach for urban land use mapping based on remote sensing imagery and social sensing data. Remote Sens. 2020, 12, 3254. [Google Scholar] [CrossRef]
  48. Wang, Q.; Wu, B.; Zhu, P.; Li, P.; Zuo, W.; Hu, Q. ECA-Net: Efficient channel attention for deep convolutional neural networks. arXiv 2019, arXiv:1910.03151. [Google Scholar] [CrossRef]
  49. Wang, L.; Yang, M.; Li, Q. Dynamic pooling for remote sensing image classification using attention mechanisms. IEEE J. Sel. Topics Appl. Earth Observ. Remote Sens. 2021, 14, 7851–7863. [Google Scholar]
  50. Nguyen, H.; Pham, T.; Doan, T.; Tran, P. Land use/land cover change prediction using multi-temporal satellite imagery and multi-layer perceptron Markov model. ISPRS Int. Arch. Photogramm. Remote Sens. Spat. Inf. Sci. 2020, 44, 99–105. [Google Scholar] [CrossRef]
Figure 1. Sentinel-2 images and representative POIs in the study areas. (a) A diagram of the administrative district locations in Shenzhen. (b) Remote sensing image and critical government-related POIs in the Nanshan District. (c) Remote sensing image and important business-related POIs in the Futian District. (d) Remote sensing image and typical technology-related POIs in the Luohu District.
Ijgi 14 00290 g001
Figure 2. Schematic diagram of object-oriented multiscale segmentation for remote sensing imagery.
Ijgi 14 00290 g002
Figure 3. The architecture of the proposed XT-SECA for urban function zone classification. UFZ stands for urban function zone.
Ijgi 14 00290 g003
Figure 4. Urban function classification in the Futian District by four algorithms. (a) Sentinel-2 image. (b) Ground truth. (c) XT-SECA. (d) RF. (e) LSTM. (f) MLP. The purple boxes mark the differences at the bottom part and the red rectangle indicates a detailed view of subzone in Figure 5.
Ijgi 14 00290 g004
Figure 5. Detailed presentation of the classification result in a Futian sub-region by different algorithms. (a) Sentinel-2 image. (b) Ground truth. (c) XT-SECA. (d) RF. (e) LSTM. (f) MLP. The purple boxes mark the differences.
Ijgi 14 00290 g005
Figure 6. Urban function classification in the Luohu District, Shenzhen by four algorithms. (a) Sentinel-2 image. (b) Ground truth. (c) XT-SECA. (d) RF. (e) LSTM. (f) MLP. The red box highlights a detailed view of the sub-area in Figure 7.
Ijgi 14 00290 g006
Figure 7. Detailed presentation of the classification result in a Luohu sub-region by different algorithms. (a) Sentinel-2 image. (b) Ground truth. (c) XT-SECA. (d) RF. (e) LSTM. (f) MLP.
Ijgi 14 00290 g007
Figure 8. Urban function classification in the Nanshan district, Shenzhen by four algorithms. (a) Sentinel-2 image. (b) Ground truth. (c) XT-SECA. (d) RF. (e) LSTM. (f) MLP. The red box shows a detailed view of the subzone in Figure 9.
Ijgi 14 00290 g008
Figure 9. Detailed presentation of the classification result in a Nanshan subzone by different algorithms. (a) Sentinel-2 image. (b) Ground truth. (c) XT-SECA. (d) RF. (e) LSTM. (f) MLP.
Ijgi 14 00290 g009
Figure 10. Classification accuracy comparison of different algorithms in the three districts. (a) Model evaluation results; (b) testing accuracy in the Futian District; (c) testing performance in the Luohu district; (d) testing accuracy in the Nanshan district.
Ijgi 14 00290 g010
Figure 11. Classification performance comparison in the ablation experiment of XT-SECA in three districts. (a) Model evaluation results; (b) testing performance in the Futian District; (c) testing performance in the Luohu District; (d) testing performance in the Nanshan District.
Ijgi 14 00290 g011
Table 1. Data adopted in this work. POI denotes point of interest.
Data TypeDataTimeData SourceSpacial Resolution
Remote sensing imageSentinel-2 multispectral image23 February 2023European Space Agency10 m
POI dataPOI types: dining, shopping, services, transportation, living facilities, entertainment, attractions, accommodation, offices, and government and public servicesDecember 2022Gaode
Map
-
Table 2. POIs and their corresponding urban function zone categories.
Function CategoryPOI Type
Business and servicesCafes, fast-food restaurants, convenient hotels, shopping centers, travel agencies, publishers, companies, banks, cinemas, training institutions, car dealers, etc.
ResidenceReal estate, community housing, etc.
Public management and servicesGovernment agencies, administrative units, higher education institutions, elementary schools, secondary schools, exhibition halls, convention centers, museums, stadiums, hospitals, etc.
Green spaces and squaresParks, scenic spots, tourist attractions, etc.
Logistics and storageLogistics companies, logistics courier stations, distribution centers, etc.
Road and traffic facilitiesParking lots, driving schools, railway stations, subway stations, bus stations, port terminals, etc.
Disclaimer/Publisher’s Note: The statements, opinions and data contained in all publications are solely those of the individual author(s) and contributor(s) and not of MDPI and/or the editor(s). MDPI and/or the editor(s) disclaim responsibility for any injury to people or property resulting from any ideas, methods, instructions or products referred to in the content.

