Article

A Pyramid Convolution-Based Scene Coordinate Regression Network for AR-GIS

1
Faculty of Social Sciences, The University of Hong Kong, Hong Kong 999077, China
2
Institute of Smart City, Chongqing Jiaotong University, Chongqing 400074, China
3
Chongqing Geomatics and Remote Sensing Center, Chongqing 401120, China
*
Author to whom correspondence should be addressed.
ISPRS Int. J. Geo-Inf. 2025, 14(8), 311; https://doi.org/10.3390/ijgi14080311
Submission received: 12 July 2025 / Revised: 6 August 2025 / Accepted: 14 August 2025 / Published: 15 August 2025

Abstract

Camera tracking plays a pivotal role in augmented reality geographic information systems (AR-GIS) and location-based services (LBS), serving as a crucial component for accurate spatial awareness and navigation. Current learning-based camera tracking techniques, while achieving superior accuracy in pose estimation, often overlook changes in scale. This oversight results in less stable localization performance and challenges in coping with dynamic environments. To address these tasks, we propose a pyramid convolution-based scene coordinate regression network (PSN). Our approach leverages a pyramidal convolutional structure, integrating kernels of varying sizes and depths, alongside grouped convolutions that alleviate computational demands while capturing multi-scale features from the input imagery. Subsequently, the network incorporates a novel randomization strategy, effectively diminishing correlated gradients and markedly bolstering the training process’s efficiency. The culmination lies in a regression layer that maps the 2D pixel coordinates to their corresponding 3D scene coordinates with precision. The experimental outcomes show that our proposed method achieves centimeter-level accuracy in small-scale scenes and decimeter-level accuracy in large-scale scenes after only a few minutes of training. It offers a favorable balance between localization accuracy and efficiency, and effectively supports augmented reality visualization in dynamic environments.

1. Introduction

With the development of smart cities, the scale and complexity of urban spatial information continue to grow, drawing increasing attention to spatial information visualization and representation [1]. As one of the key visualization approaches in geographic information systems (GIS), augmented reality geographic information systems (AR-GIS) has become increasingly important, with broad application prospects in smart cities [2], disaster management [3], and cultural heritage [4,5]. AR-GIS seamlessly integrates virtual geographic information with real-world scenes, providing users with a more intuitive, immersive, and highly interactive spatial information display, thereby enhancing the overall user experience. Additionally, it offers a transparent and intuitive means to advance applications in urban planning, analysis, city development, and other geoscience-related fields.
In recent years, researchers have conducted extensive studies in the field of AR-GIS. Liu et al. [6] introduced an AR-based architectural diagnostic prototype system that employs marker-less tracking and a third-person perspective (TPP) to display infrared thermal images, facilitating building facade inspection tasks. Min et al. [7] proposed an interactive registration technique for AR and GIS, enabling precise alignment of virtual information with the real world through user interaction, thereby enhancing the practicality and user experience of AR-GIS applications. Ma et al. [8] developed an indoor map visualization method based on AR, integrating multi-sensor data from Bluetooth Low Energy (BLE) and pedestrian dead reckoning (PDR) to achieve dynamic fusion of indoor spatial information with real-world scenes. Despite the progress in AR-GIS applications, a fundamental technical challenge remains: how to accurately and efficiently estimate the camera pose in real-time under dynamic environmental conditions using resource-constrained mobile devices. Accurate camera tracking is essential for maintaining the alignment between virtual content and the real world. However, achieving this goal is difficult in real-world AR-GIS scenarios, where illumination, object motion, and viewpoint changes are frequent.
Camera tracking, a critical component of AR applications, has seen rapid advancements in visual feature-based pose tracking methods in recent years. Feature-matching-based methods [9,10,11,12] leverage scene structure information to achieve camera tracking, yet they require significant time for constructing a 3D scene model, consume substantial storage space for the generated 3D maps, and demand high computational resources for matching 2D images with 3D scenes. Another approach, absolute pose regression (APR) [13,14,15,16], utilizes neural networks to predict camera poses from single images. However, APR requires training a dedicated pose regressor for each scene to ensure accurate predictions, and its estimation accuracy decreases when encountering previously unseen scenes with poor generalization performance. Additionally, scene coordinate regression (SCR) [17,18,19,20] encodes scene information implicitly using neural networks to establish 2D–3D correspondences from pixel images, thereby estimating camera poses. However, existing SCR pipelines demand extensive training time to map scenes effectively and still face limitations in handling complex and dynamic environments. These constraints hinder the adoption and practical application of camera tracking technology in AR-GIS.
In this paper, we aim to solve the following core problem: How can we design a camera tracking method that is both accurate and computationally efficient, and that performs robustly in dynamic environments, to support real-time AR-GIS applications on mobile platforms? To this end, we propose a novel pyramid convolution-based [21] scene coordinate regression network architecture for AR-GIS applications. This architecture employs pyramid convolution to effectively integrate multi-scale features. These features are extracted from convolutional layers operating at different sizes and depths. Inspired by Accelerated Coordinate Encoding (ACE) [22], a fast network for regressing 3D coordinates from 2D coordinates, we enhance network training efficiency by shuffling a buffer mixed with multi-scale image features, pixel positions, intrinsic matrices, and ground-truth poses during training. Then, the regression layer predicts 3D scene coordinates corresponding to the multi-scale feature vectors, thereby establishing 2D–-3D correspondences between pixel coordinates and scene coordinates. Using this architecture, we input these 2D–3D correspondences into a differentiable pose estimator to generate camera poses, which, after coordinate transformation, allow virtual objects to be rendered at their correct positions in the real world. We evaluated the accuracy of our localization method on three different datasets, and the results demonstrate that our approach significantly improves localization accuracy in complex and dynamic environments. Furthermore, this multi-scale and highly efficient method enables faster and more precise camera pose estimation. After applying coordinate transformations, the AR-GIS system can seamlessly integrate spatial information of visible areas into the AR view, enhancing its visualization capabilities.
In summary, the pivotal contributions presented in this paper are delineated below:
(1)
We introduce a novel pyramid convolution-driven scene coordinate regression network (PSN), engineered to bolster the resilience and versatility of camera tracking within the complexities of dynamic environments.
(2)
We present an advanced randomization method designed to disrupt the correlation between pixel blocks during training. This design is crafted to minimize gradient correlation, thereby effectively amplifying the efficiency of the model training process.
(3)
We conducted comprehensive experiments on multiple public and real-world datasets, which demonstrate that PSN achieves centimeter-level accuracy in small-scale scenes and decimeter-level accuracy in large-scale scenes within minutes of training. We also integrated PSN into real-time scenes to support AR-GIS visualization.
This paper is organized as follows. Section 2 discusses the related work on AR visualization and camera tracking. In Section 3, the overall architecture of the whole methodology is introduced in detail, including the pyramid convolution used for multi-scale feature extraction, and the strategy for efficient scene coordinate regression. Additionally, it explains the brief workflow of AR visualization and the transformation of camera position information from the world coordinate system to the AR coordinate system. Experimental results and analyses of the proposed method, along with an on-site AR-GIS visualization, are presented in Section 4. A discussion of related methods, their differences, and the limitation of the proposed method is provided in Section 5. Finally, this paper concludes in Section 6.

2. Related Work

In the context of current augmented reality, most studies focus on techniques for overlaying virtual visual information onto real environments, as well as on methods for getting camera poses during motion.

2.1. AR Visualization

Augmented reality (AR) visualization is a spatial information representation technique that integrates virtual content with real-world environments, focusing not only on the visual presentation of virtual data but also on spatial registration and dynamic interaction [23]. Unlike traditional two-dimensional or three-dimensional geographic visualizations, AR visualization employs an immersive, first-person perspective to superimpose virtual scenes onto real environments, emphasizing real-time and continuous acquisition and interaction with geospatial information by users [24].
Research on AR visualization has primarily focused on visual representation, symbol design, and user perception. Scholars have extensively explored spatial information representation and interaction in AR systems, proposing a variety of visualization methods, including symbols, annotations, and path guidance. Tönnis et al. [25] designed various arrow styles to enhance long-distance AR navigation and dynamically adjusted the arrow behaviors based on user speed, thereby improving navigation experiences in complex environments. Furthermore, to address the expression and adaptability of visual variables, dynamic label and symbol management techniques based on situated visualization have been employed to mitigate symbol occlusion and redundant display issues, thereby enhancing the clarity and contextual relevance of spatial information representation [26,27]. Additionally, methods such as image label layout based on visual saliency algorithms and edge analysis [28] and holographic grid projection [29] have also been proposed to optimize the display of virtual symbols in AR environments. Grübel et al. [30] adopted the digital twin as a theoretical framework to explore how augmented reality technology can integrate virtual building-related information into real-world environments, thereby enabling the visualization of architectural data.
While general AR visualization focuses on overlaying digital content onto the physical world for enhanced user interaction, AR-GIS extends this concept by integrating geographic information systems to enable spatially accurate, context-aware augmentation. This integration addresses specific requirements such as large-scale mapping, geospatial data alignment, and location-based analytics, which are not fully covered in conventional AR research.
Moreover, in AR-GIS research, Fenais et al. [31] developed an AR-GIS integrated underground pipeline mapping system, demonstrating the potential value of AR-GIS integration. Huang et al. [32] proposed AUGL, an efficient, cross-platform mobile AR map rendering framework that addresses inconsistencies in rendering performance and style across AR-GIS systems through unified cross-platform interfaces and high-performance rendering strategies, significantly improving rendering efficiency and consistency. Galvão et al. [33] proposed the GeoAR framework, aligning geographic and virtual coordinate systems via a seven-parameter transformation to integrate geographic, physical, and virtual spaces for accurate AR content placement. In terms of navigation, CampusGo [34] introduces a digital twin-based AR navigation platform that seamlessly integrates indoor and outdoor path planning using GeoJSON, BOT ontology, and MapBox visualization with QR-code-based indoor localization. NavPES [35] develops an AR-based mobile navigation app combining ARway SDK, Vuforia, and Azure Spatial Anchors in Unity to deliver interactive, voice-guided indoor navigation with 3D visual cues and contextual campus information. MagLoc-AR [36] proposes a visual-free AR localization system that utilizes magnetic field mapping and IMU sensor fusion with deep learning-based motion prediction and particle filtering to achieve robust, privacy-preserving indoor navigation. Ma et al. [37] efficiently integrated virtual 3D models with real indoor environments by combining feature tracking and 3D indoor scene-understanding techniques, significantly enhancing the visual quality and user experience of AR-GIS systems. However, most existing AR-GIS systems still focus on short-term and localized information display, lacking comprehensive representation of dynamic information in continuous spatial scenes. Furthermore, limitations in symbol design and interface layout adaptability in complex environments hinder users from obtaining clear and contextually relevant spatial information.

2.2. Camera Tracking

During the AR visualization process, it is essential to continuously and in real-time acquire the pose information of the mobile device. Commonly used approaches previously included Simultaneous Localization and Mapping (SLAM) [38] for real-time pose estimation, or employing various markers, WiFi, and BLE [39] for camera localization. However, with the growing need for marker-less and infrastructure-free localization, recent years have seen the emergence of three major categories of visual feature-based methods for this task: feature matching-based methods, APR, and SCR.
Feature matching-based methods extract key points from images to establish correspondences, which, combined with a known 3D model, enable the estimation of camera pose. They are usually achieved employing a Perspective-n-Point (PnP) solver [40], with the 3D environment often represented through Structure-from-Motion (SfM) [41] reconstructions and local feature descriptors employed for 2D–3D matching [42,43]. These methods have demonstrated promising performance. However, in low-texture regions, repetitive texture scenes, or cases where feature points are sparse, feature extraction and matching may be inaccurate. Additionally, variations in lighting conditions, noise, and other factors can further affect the accuracy of feature extraction and matching, thereby reducing the robustness of pose estimation. Despite improvements from learning-based matchers like SuperGlue [44] and geometry-aware methods such as MeshLoc [45], challenges in computational efficiency and scalability remain, particularly for mobile augmented reality (AR) applications where resources are limited.
In contrast, APR approaches aim to bypass the explicit correspondence search by directly predicting the camera pose from a single input image using deep neural networks. A seminal work in this field, PoseNet [46], introduced an end-to-end regression framework for camera localization. Later extensions incorporated uncertainty estimation [47] and transformer-based architectures [48] to improve adaptability across different scenes. However, APR methods often lack explicit geometric reasoning, which may limit the performance of AR visualization, especially in complex or cluttered environments with visual ambiguities.
Scene coordinate regression offers an alternative learning-based method that enables a model, through training, to predict the 3D scene coordinates of corresponding pixels based on the pixel features of input images. Initial works employed random forest-based regressors [49,50], while more recent advancements leverage convolutional neural networks [51,52] to enhance learning capacity and generalization. By learning a direct 2D-to-3D mapping, these methods avoid explicit descriptor storage and preserve privacy, as no direct feature matching or 3D model sharing is required. Advanced frameworks like DSAC++ [17] and DSAC* [53] implement scene coordinate regression using RGB-only input. Notably, as highlighted by Dong et al. [54], these frameworks do not require additional depth information for network training, thereby simplifying the data requirements and expanding the potential applications in scenes where depth data may not be readily available. Similarly, ZoeDepth [55] demonstrates that zero-shot depth estimation can be achieved without scene-specific supervision, offering another path for depth-aware applications. Furthermore, they integrate pose estimation based on differentiable RANSAC into an end-to-end training pipeline, enhancing localization robustness. However, the performance of scene coordinate regression for camera tracking in large-scale or dynamic environments, as well as the required scene training time, continues to pose significant hurdles for real-time AR deployment.
These camera tracking methods all rely on feature extraction modules. In recent years, pyramid structures have been extensively studied for their effectiveness in feature extraction and related applications. Feature Pyramid Network (FPN) [56] enhances multi-scale features through top-down fusion, providing pyramid features with both high semantic information and high resolution. This significantly improves the accuracy of small object detection with minimal additional computational cost. Liu et al. [57] proposed a hybrid U-Net architecture that integrates pyramidal convolution and Transformer modules. This design significantly improves performance on small-scale medical image segmentation tasks while reducing both parameter count and computational cost. Zhang et al. [58] introduced the DPCMF model, which employs dense pyramidal convolutions to extract multi-scale local and global features in both spatial and spectral branches. These features are then fused, leading to substantial improvements in hyperspectral image classification accuracy under few-shot conditions.

3. Methodology

3.1. Overview

As illustrated in Figure 1, PSN represents a SCR pipeline based on a structural methodology. PSN employs a pyramidal convolution, composed of convolution kernels of different sizes and depths, and utilizes grouped convolutions to reduce computational load, extracting features at various scales from the input image I . Subsequently, the network implements a randomization step, where image features, pixel coordinates, intrinsic matrixes, and ground-truth poses are randomized together, reducing gradient correlation and significantly enhancing training efficiency. Then, a regression layer predicts the 3D scene coordinates corresponding y i to the 2D pixel coordinates x i . Next, PSN uses a PnP solver in a RANSAC [19] loop for camera pose estimation; refer to DSAC*. The given GIS map is partitioned into a regular grid to construct a spatial index, from which the region corresponding to the current pose is extracted based on localization results, and the spatial entities to be visualized are computed. Subsequently, the camera pose coordinates in the world coordinate system are transformed into the AR coordinate system, so that the scene information corresponding to the part of the indoor model aligned with the current view of the AR camera is rendered in real-time.

3.2. Pyramidal Convolution

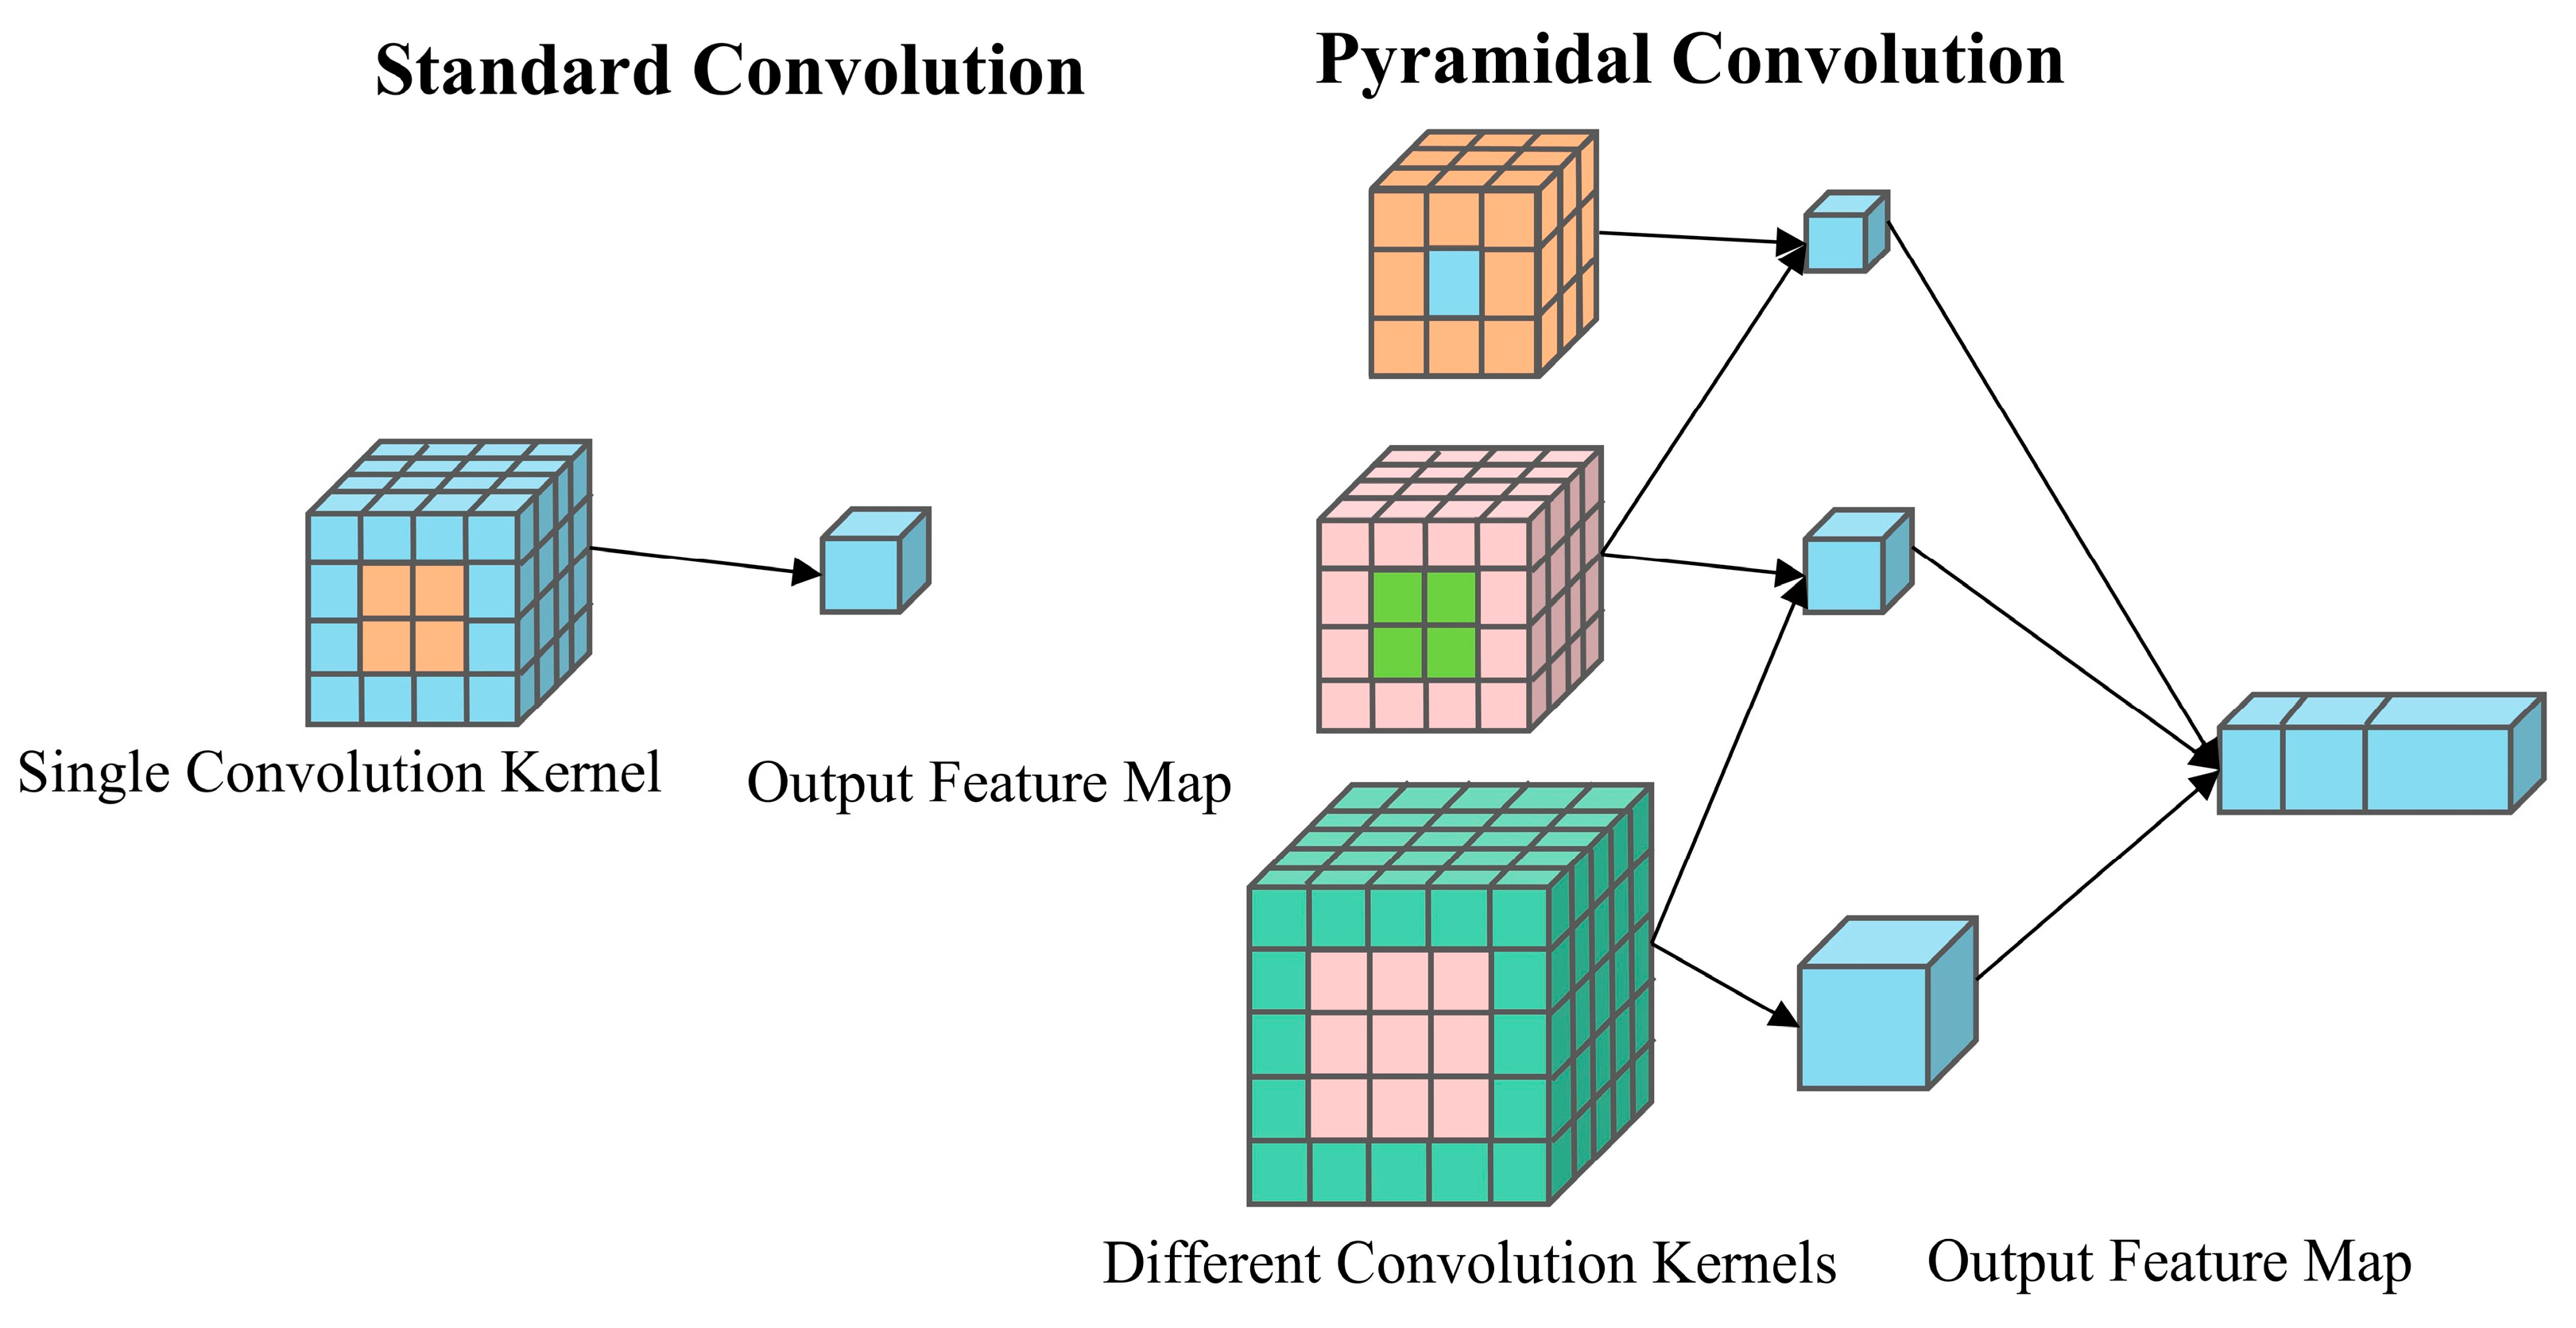
Compared to previous scene coordinate regression pipelines, we introduced the pyramid convolution in the feature extraction stage instead of the standard convolution, aiming for better localization performance in indoor and outdoor scenes at different scales to face dynamic and complicated environments. In standard convolution, the convolution operation uses a single type of kernel with a fixed spatial size and depth, as shown on the left side of Figure 2. Therefore, the parameters and floating-point operations (FLOPS) of the standard convolution are:
p a r a m e t e r s = k 2 f i n f o u t
F L O P S = k 2 f i n f o u t W H
where f i n is the depth equal to the number of input feature maps and f o u t the number of output feature maps with spatial width W and height H . Fixed-size kernels cannot effectively capture multi-scale features in images, especially when dealing with complex scenes.
Pyramid convolution, however, consists of multiple layers of different types of kernels. Different types of kernels enable the capture of details at various levels of the scene, with the different colors at the center of the cubes in Figure 2 representing different convolution kernel sizes. The smaller convolution kernel can capture the details, while the larger convolution kernel can provide contextual information. To avoid increasing computational cost, the input feature map is processed with different scales of kernels. In each layer of the pyramid convolution, the spatial size of the kernels increases while the depth decreases. This forms two opposing pyramids. In one pyramid, the base consists of the convolutional kernel with the smaller spatial size, while the top consists of the kernel with the larger spatial size. In the other pyramid, the base consists of the kernel with greater depth, and the top consists of the kernel with smaller depth.
The kernel with smaller spatial size has greater depth, while the kernel with larger spatial size has smaller depth. This allows the network to capture features at different scales while controlling computational complexity and the number of parameters. To use different depths of kernels at each layer of the pyramid convolution, the input feature map is split into several groups, and the kernels are applied independently to each group. As the number of groups increases, the depth and computational cost of the kernels proportionally decrease. The results of the convolutions in all groups are concatenated to generate the final output feature map. Although pyramid convolutions use multiple convolutional kernels of different scales, the total number of parameters and computational cost are similar to those of standard convolutions. The specific calculations are as follows:
p a r a m e t e r s = j = 1 m k j 2 c j i n c j o u t
F L O P S = j = 1 m k j 2 c j i n c j o u t ( W H )
where j represents the current pyramid level, c j i n = f i n k j 2 / k 1 2 is the number of input feature maps at level j , c j o u t =   f j o u t is the number of output feature maps at level j , and m is the total number of pyramid levels. To increase the kernel size without increasing the FLOPs, the kernel depth must be reduced accordingly. This is achieved by grouping, which decreases the number of input channels per group. k j 2 / k 1 2 corresponds to the number of groups and is determined based on the ratio between the current kernel’s area and the minimum kernel area, thereby balancing computational complexity.
The architecture in question significantly enhances feature extraction capabilities through the utilization of pyramid convolutions while simultaneously maintaining manageable computational costs and parameter counts, particularly when dealing with image information of diverse scales. Pyramid convolutions facilitate the parallel processing of input feature maps through the utilization of convolutional kernels with varying spatial resolutions and depths, thereby enabling the capture of more detailed information. This is especially beneficial in complex and dynamically changing environments.

3.3. Efficient Scene Coordinate Regression and Pose Estimation

In recent scene coordinate regression pipelines, the network was trained to predict scene coordinates by processing a sequence of mapped images. The aforementioned pipelines only optimize a single mapped image per training iteration, which prolonged training times. We utilize the previously described pyramid convolutional network to extract high-dimensional feature vectors f from multiple input images. Then we employ a multilayer perceptron as the regression layer to generate the 3D scene coordinates y i from all input images based on the extracted feature vectors. In this way, each feature vector is associated with a pair of 2D–3D correspondences between pixel coordinates and scene coordinates for localization. We utilize the pretrained pyramidal convolutional model to extract multi-scale features, with the training focused on optimizing the scene coordinate prediction component in this process. Since directly inputting multiple images simultaneously would drastically increase computational demand, a randomization strategy is introduced. Between the convolutional and regression layers, a buffer is constructed using the extracted multi-scale features and input data. This buffer contains patches formed by multi-scale features f at pixel locations x i from training images I , along with their associated ground-truth poses h and intrinsics K . As shown in the left image of Figure 1 under the Buffer Random process, each column represents all patches of an image, and different colors indicate patches from different images. We construct indexes for the patch data stored in the buffer and perform shuffling by randomly permuting these indexes as shown in the right image of Figure 1 under the Buffer Random process. During each iteration, we traverse the shuffled indexes. This strategy disrupts predictive correlations between patches, thereby reducing gradient correlation between adjacent pixel blocks. This allows for the use of a high learning rate to achieve fast convergence.
We employ the reprojection error as the loss introduced in ACE [22]:
l π x i , y i , h = w α τ m a x + τ m i n × tanh e π x i , y i , h w α τ m a x + τ m i n ,   i f   y i V y i y ¯ i 1 ,   o t h e r w i s e
where e π is the reprojection error. The pseudo scene coordinate y ¯ i is computed using the inverse intrinsic matrix, pixel coordinates, and a fixed depth value of 10 m. Throughout training, the threshold τ α is dynamically modulated to adaptively guide the learning process, where α ( 0 , 1 ) is the training progress and w α = 1 α 2 . V represents the set of valid coordinate predictions constrained to lie within 0.1 m and 1000 m in front of the camera, along with the reprojection error below 1000 px.
Based on the scene coordinate regression network, a set of 2D–3D correspondences can be obtained. By applying a PnP solver, the camera pose can be estimated. However, incorrect correspondences often exist in this process, leading to inaccurate pose estimations with significant errors. Therefore, we adopt a differentiable RANSAC [53], which not only removes outliers but also refines the pose estimation. This allows the entire network to operate in an end-to-end manner. The manner reduces manual intervention, enabling the network to autonomously learn feature representations that are most suitable for the localization task.

3.4. Augmented Reality and Map Visualization

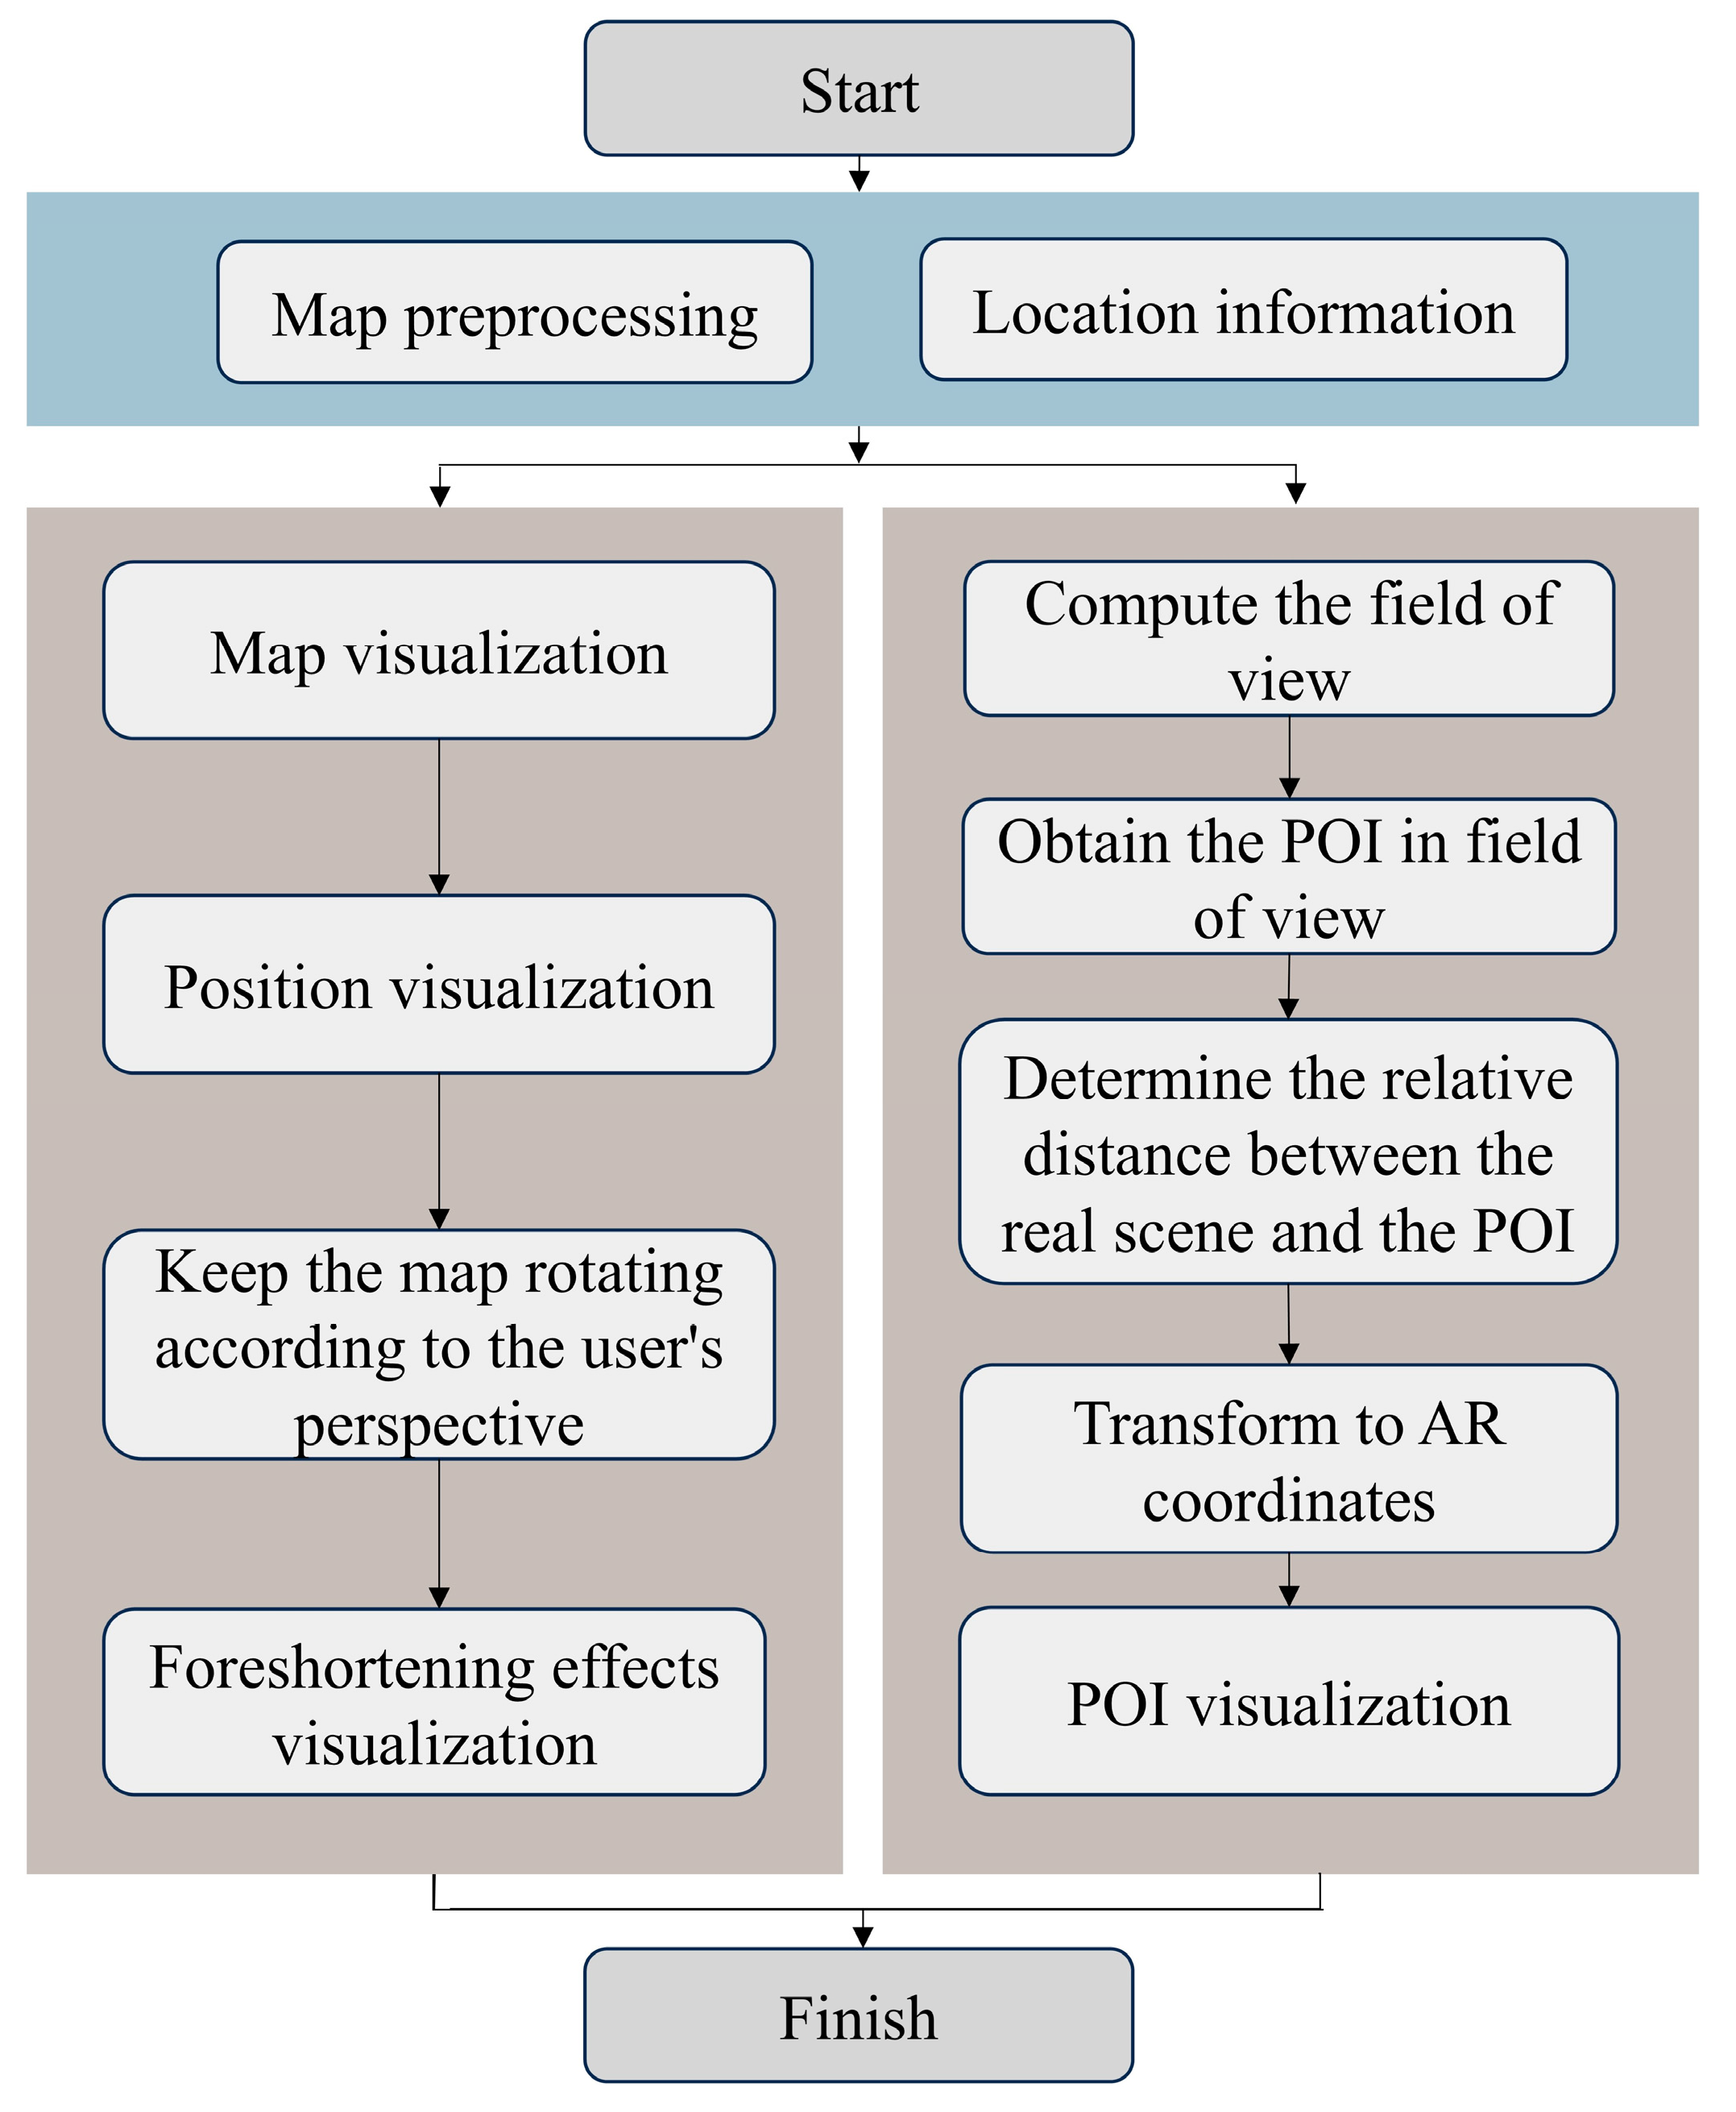
The AR visualization workflow is illustrated in Figure 3. The AR visualization workflow used in this study is consistent with that proposed by Ma et al. [8]. Since the primary focus of this work is on camera tracking in AR visualization, only a brief overview is provided this paper. Please refer to Ma et al. for more detailed information.
For AR visualization, the estimated poses in the world coordinate system need to be transformed into the AR coordinate system. To estimate the rigid transformation between a set of 3D points’ AR visualization, the estimated poses in the world coordinate system need to be transformed into P W = P W i = x W i , y W i , z W i i = 1 N and their corresponding points in the AR coordinate system P C = P C i = x C i , y C i , z C i i = 1 N . We need to obtain the optimal rotation matrix R R 3 × 3 and translation vector t R 3 × 3 that satisfy the following relation for all i = 1 , , N :
P W i = R P C i + t
where R is a rotation matrix and t is a translation vector.
Considering that practical applications often involve measurement noise or redundant correspondences (i.e., N points, where N exceeds the minimum required number of 3), we employ a least-squares estimation approach to obtain the optimal transformation parameters. The resulting rigid transformation matrix T consists of the pair ( R , t ) . The procedure for computing R and t is as follows:
First, the centroids of the point set P W and P C are computed as:
C W = 1 N i = 1 N P W i ,   C C = 1 N i = 1 N P C i
To obtain the central locations of the two sets of points in their respective coordinate systems, subsequently the point sets are centered by subtracting their corresponding centroids, yielding zero-mean point sets:
P ~ W i = P W i C W ,     P ~ C i = P C i C C
After centering, a covariance matrix H is constructed to capture the correlation between the two-point sets:
H = i = 1 N P ~ W i P ~ C i T
To solve for the rotation matrix, Singular Value Decomposition (SVD) is applied to H :
H = U S V T
where U and V are orthogonal matrices and S is a diagonal matrix. An initial estimate of the rotation matrix R is given by:
R = V U T
To ensure that R belongs to the special orthogonal group S O ( 3 ) , i.e., d e t ( R ) = 1 , if d e t ( R ) < 0 , the last column of V is negated, resulting in a modified matrix V :
V = V ,   V : 3 = V : 3
Then, the corrected rotation matrix is recomputed as:
R = V U T
Once the rotation matrix R is determined, the translation vector t is computed based on the difference between the centroids of the two-point sets after rotation:
t = C C R C W
In summary, with the combined action of rotation and translation, any point P C in the AR coordinate system can be transformed into the world coordinate system as:
P W = R P C + t

4. Experimental

To evaluate the efficiency and accuracy of the proposed method, we conducted experiments on three public datasets. In addition, to assess its adaptability in real-world application scenes and its effectiveness in AR-GIS visualization, we carried out on-site experiments at the Science City campus of Chongqing Jiaotong University, covering one medium room and one large room.

4.1. Camera Tracking Experiment

4.1.1. Experiment Settings

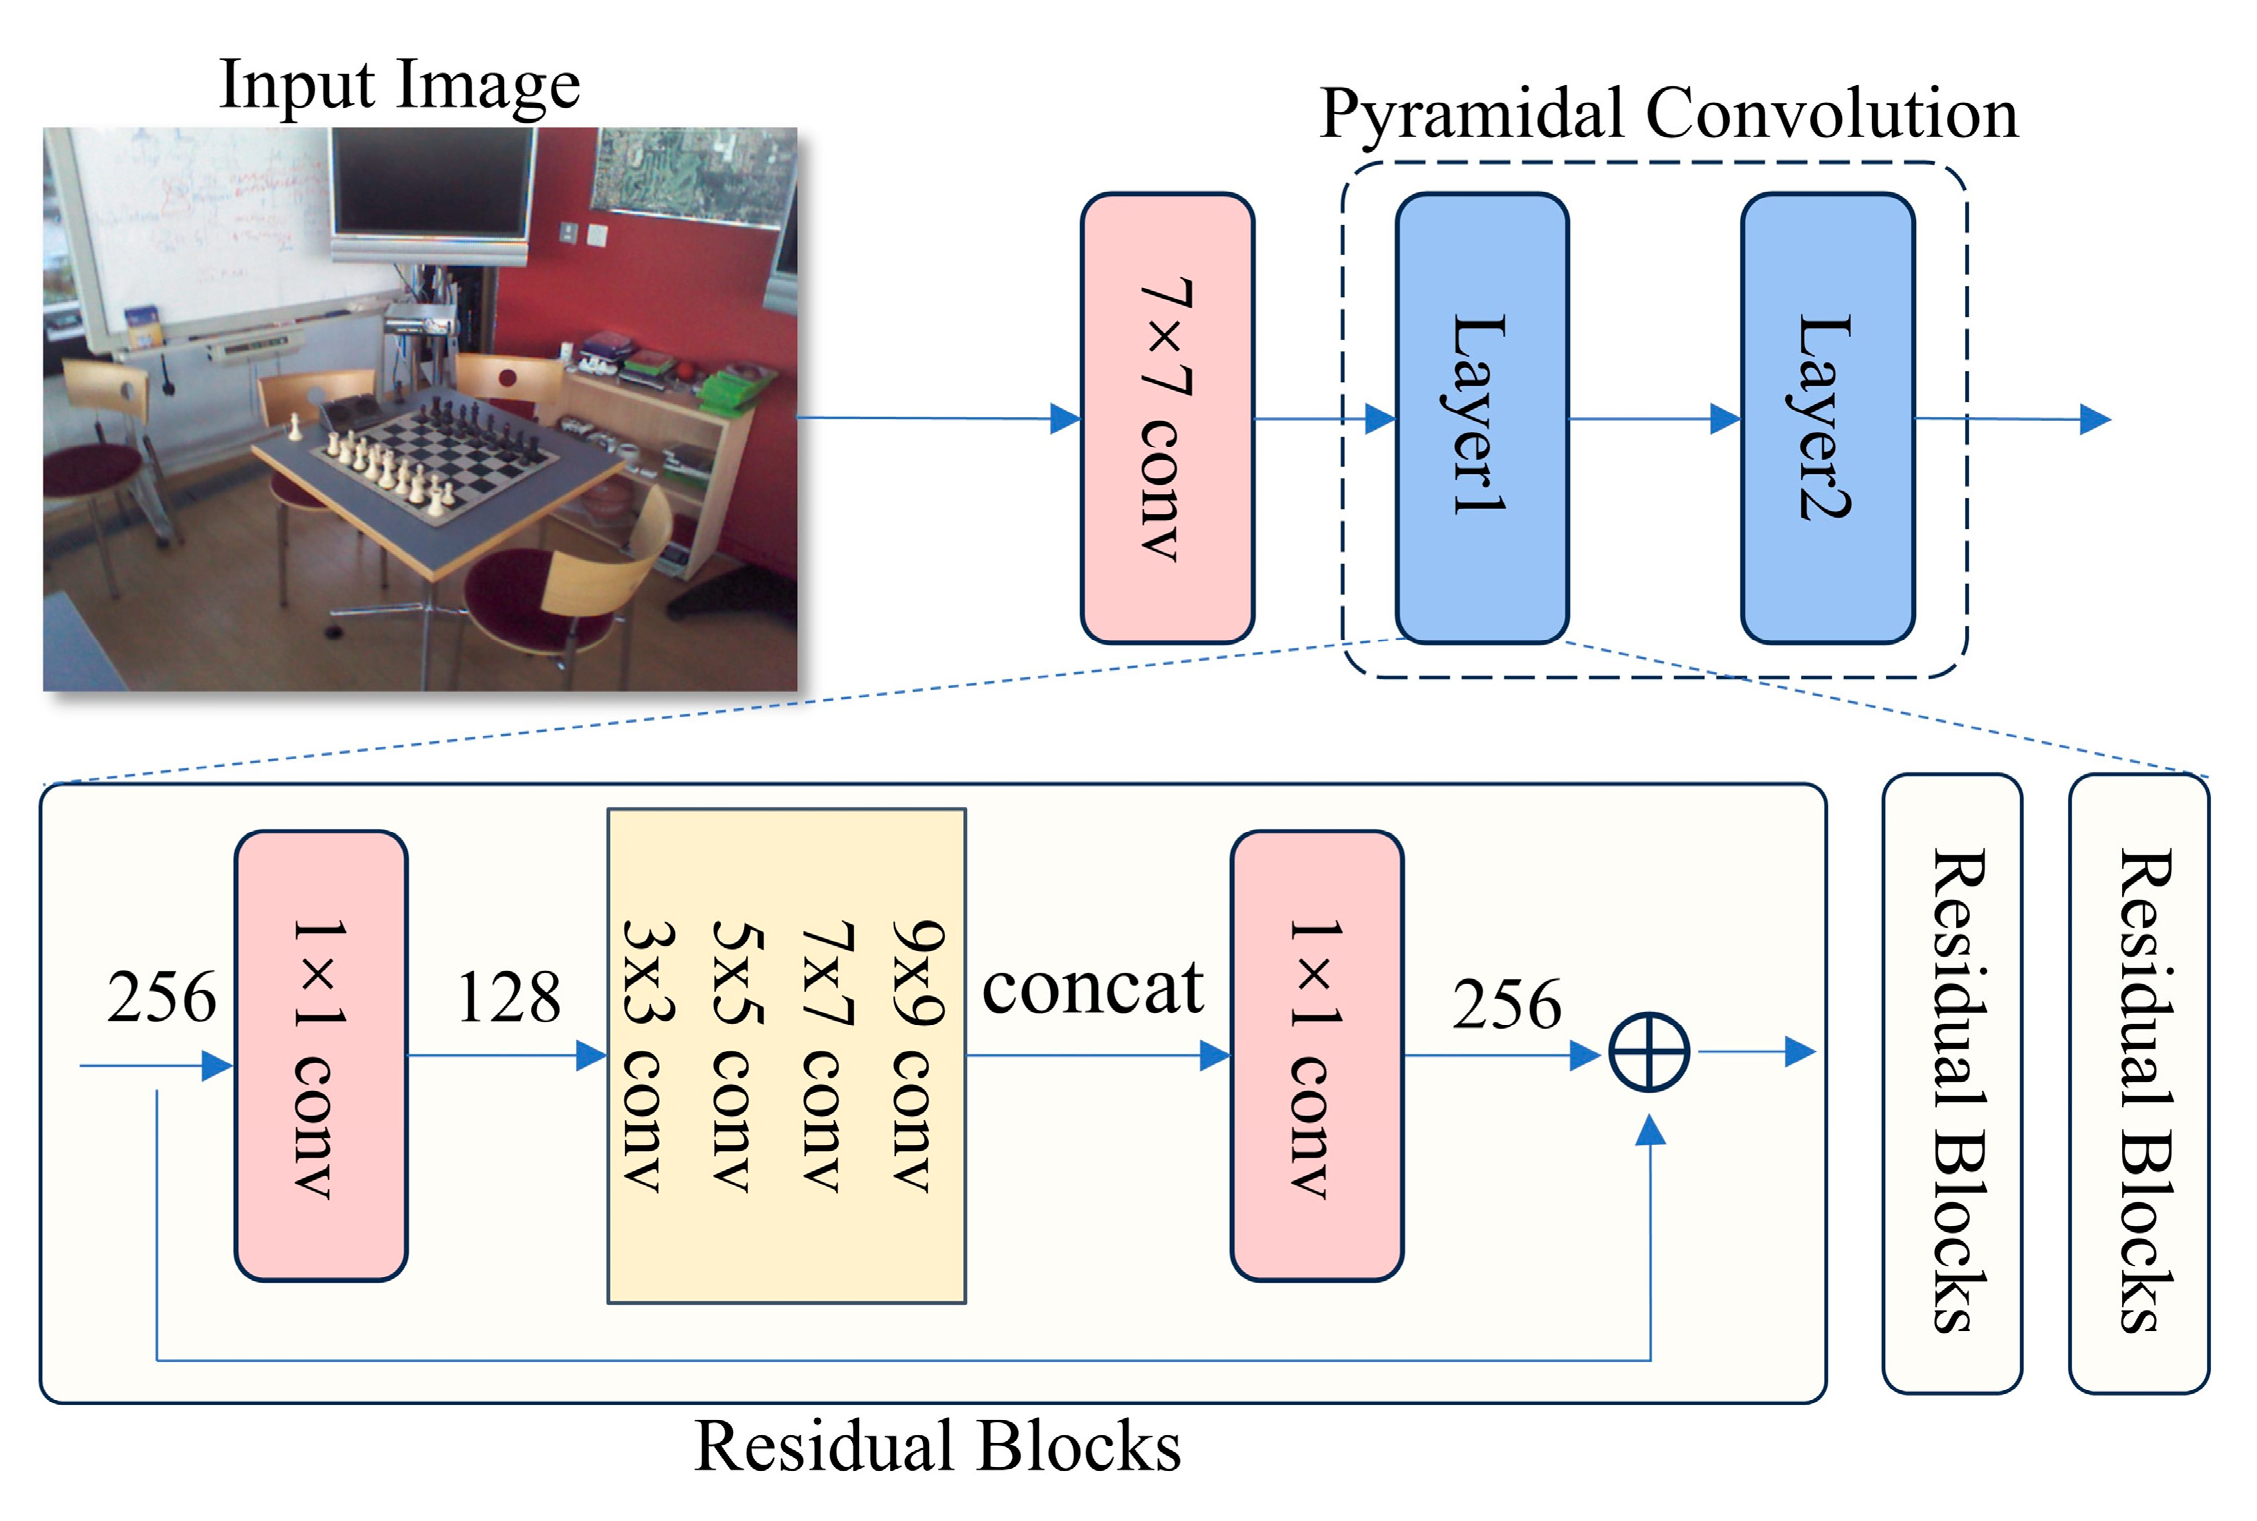
First, we describe the network architecture used in our experiments. The entire scene coordinate regression network is divided into two components: a multi-scale feature extraction network and a regression layer. The multi-scale feature extraction network comprises one 7 × 7 convolution and two layers, with each layer built by employing multiple residual blocks that are the same. The first layer applies one 1 × 1 convolution to reduce the input feature maps to 128, followed by a pyramid convolution consisting of four levels. The pyramid includes four convolutional kernels of varying sizes, progressing from the bottom to the top level. The sizes of the convolution kernels are 3 × 3, 5 × 5, 7 × 7, and 9 × 9. Each level has a depth of 32 groups. The features from the four levels are then concatenated together, and another convolutional layer restores the feature maps to 256. This process constitutes a residual block, as shown in Figure 4. A total of three such residual blocks are contained in the first layer. The second layer is similar to the first, with the pyramid using convolutional kernels of three levels, excluding the 9 × 9 kernel. The depths of kernels are set from 128 groups to 64 as the level increases. It contains a total of four such residual blocks. For the regression layer, it is composed of eight 1 × 1 convolutional layers, augmented with skip connections following the third and sixth layers.
Second, we present the details of our experiments. We trained the entire network using PyTorch 2.0 on a remote server equipped with NVIDIA 4090 GPUs. The pyramidal convolutional network is pretrained on the ImageNet dataset using images as input and a pretraining weight size of 88 M. The pyramidal convolution increases the channel dimension of the image tensor to 512 and then generates a buffer containing eight million patches from all images. Furthermore, the scene coordinates are regressed jointly over multiple images for 16 epochs, with a learning rate ranging from 5 × 10⁻⁴ to 5 × 10⁻³. The maximum threshold τ m a x in the loss function is set to 50px, and the minimum threshold τ m i n is set to 10px.

4.1.2. Results

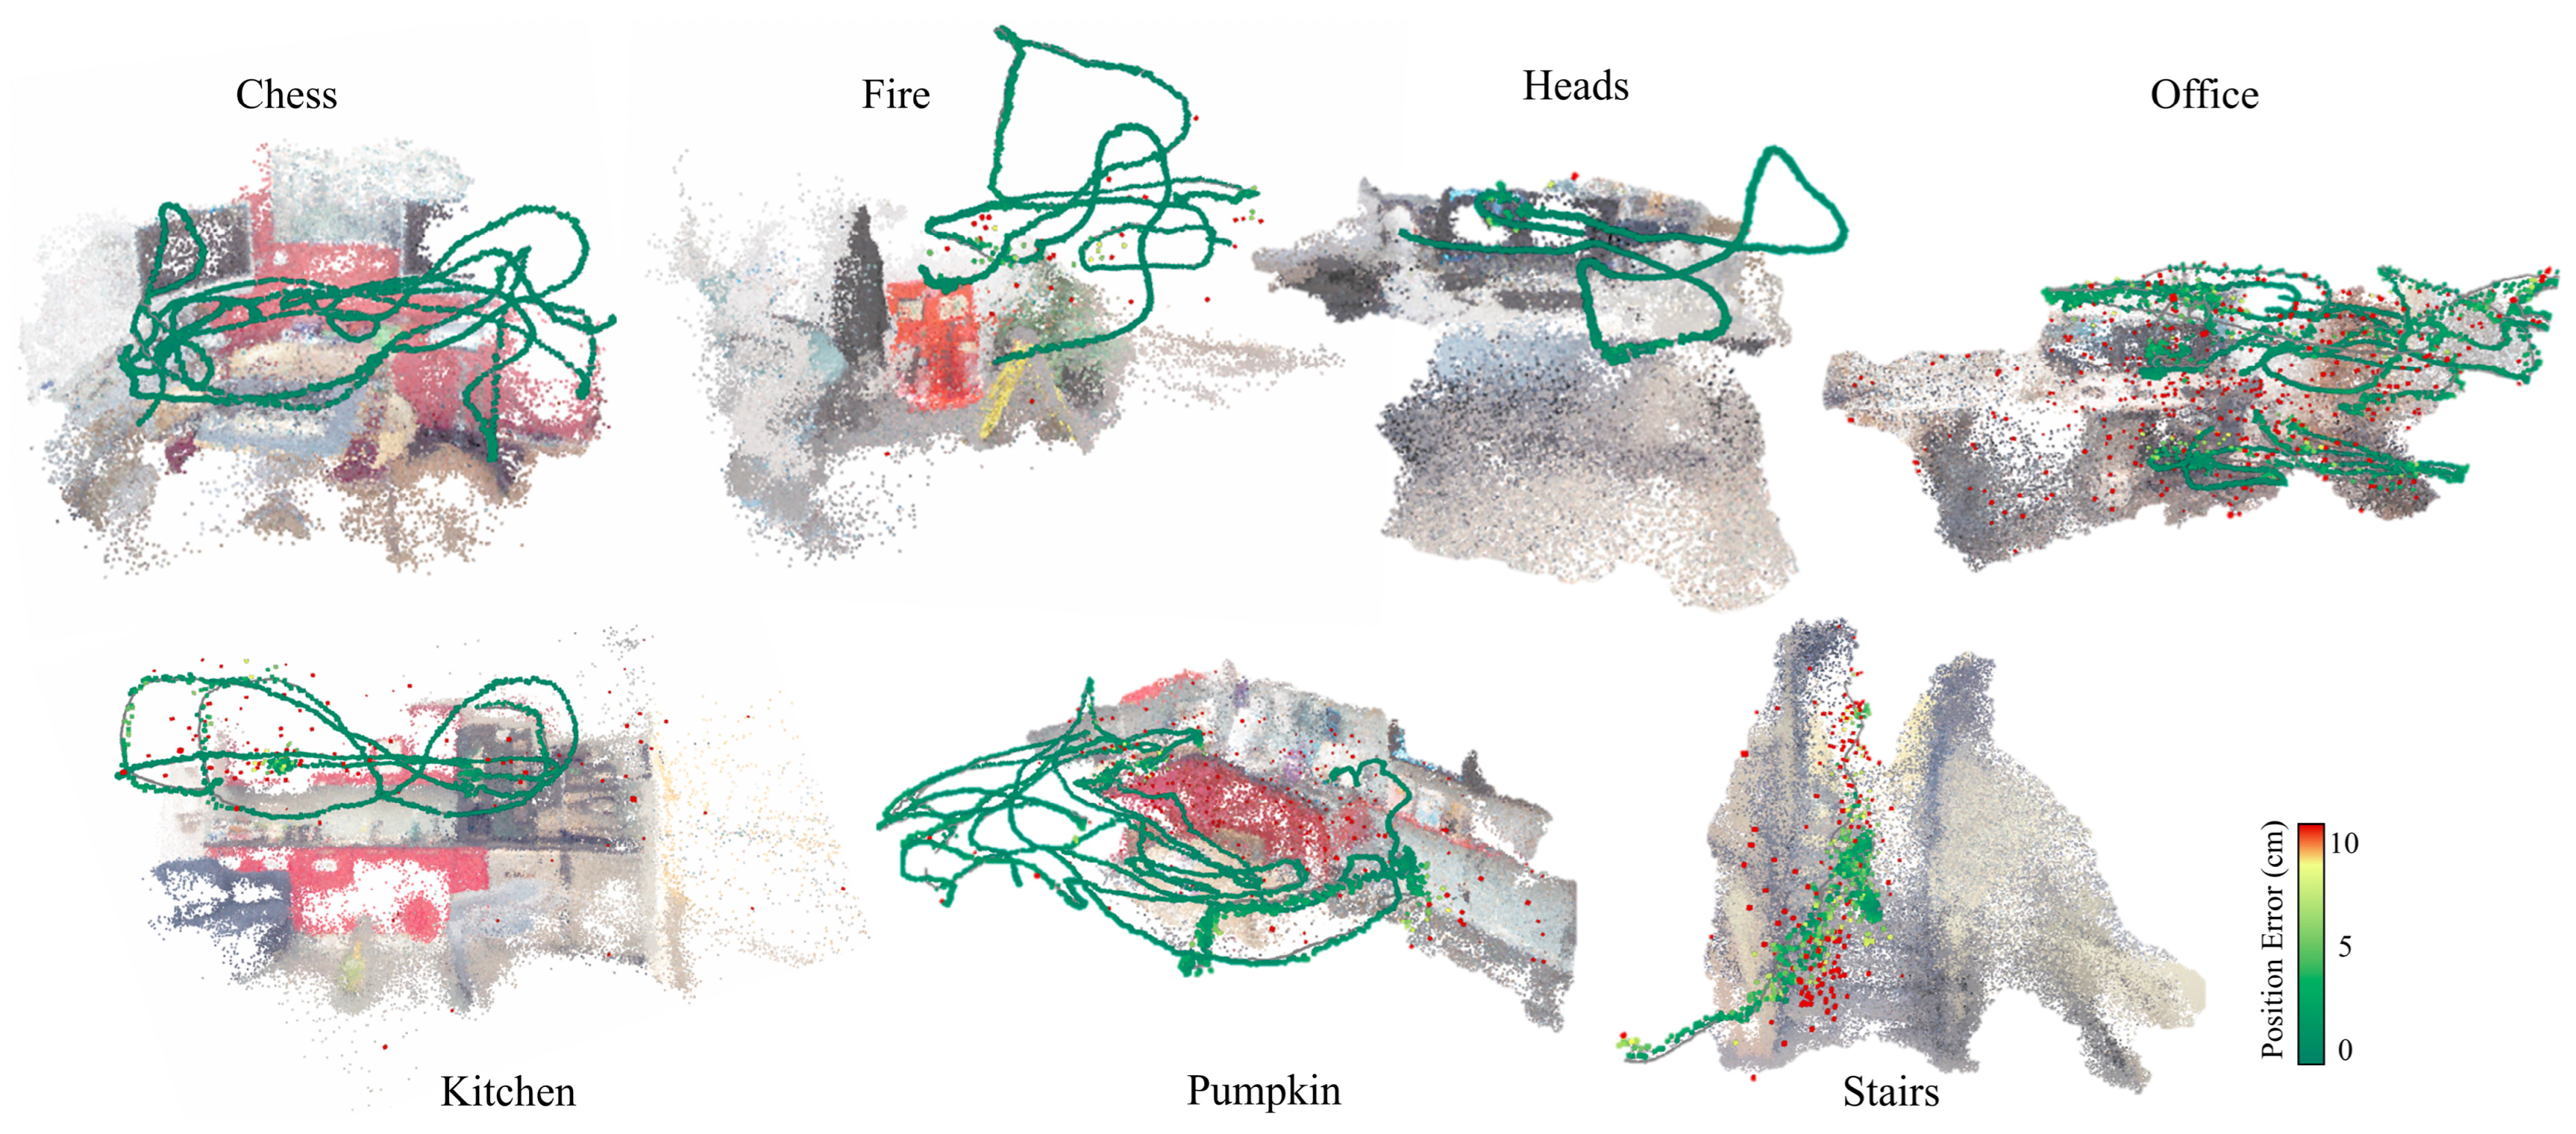
Result on the 7-scene dataset [49]. We compared PSN with typical feature matching-based methods, absolute pose regression methods, and scene coordinate regression methods on the 7-scene dataset. The 7-scene dataset contains seven indoor scenes captured with a Kinect RGB-D camera, featuring challenges like textureless areas, motion blur, and repeating structures. It includes RGB and depth images (640 × 480) with ground-truth camera poses. Each scene has multiple image sequences from different users. As shown in Table 1, PSN is superior to the absolute pose regression method and the feature matching-based method in most scenes. Concurrently, PSN approaches the state-of-the-art scene coordinate regression methods but with shorter mapping times, demonstrating superior localization performance. SANet generates coordinate maps by interpolating the results from top-ranked retrieved images, making it more efficient than other regression-based approaches. However, it has poor positioning performance in most scenes. To more clearly provide the localization performance, we visualized the estimated trajectories of PSN in Figure 5. While we achieved good accuracy in most scenes, we also encountered a challenge in the textureless nature of the Stairs scene. The features produced by the pyramidal convolution are generated through the fusion of multiple scales. In low-texture regions, large-scale features may overshadow useful small-scale details and tend to blur the limited edge and structural information that is already sparse.
Result on the Cambridge Landmarks dataset [46]. In addition to the indoor scenes, outdoor camera tracking experiments were also conducted on the Cambridge Landmarks dataset. The Cambridge Landmarks dataset contains five large-scale urban landmarks that cover hundreds to thousands of square meters. It is collected by capturing these landmarks from multiple viewpoints under varying weather conditions and at different times of day, encompassing diverse lighting scenes. As reported in Table 2, matching-based methods exhibit high accuracy on this dataset due to their similarity to SfM algorithms. However, this approach requires a significant amount of memory. Compared with the other scene coordinate regression methods, PSN achieves lower accuracy on the Great Court scene due to its large scale. In general, PSN demonstrates superior localization accuracy compared to absolute pose regression pipelines and exhibits performance that is close to that of other SCR methods.
Result on the Wayspots dataset [63]. In Table 3, we present a performance comparison between PSN and three APR methods on the Wayspots dataset; we also include a comparison with the current state-of-the-art scene coordinate regression method DSAC*. The best result in the scene is bolded The Wayspots dataset comprises 10 small, complex, and dynamic outdoor scenes, each of which includes two independent scans—one for mapping and one for querying. Pseudo ground-truth poses are generated by aligning smartphone trajectories with SfM-based poses. Meanwhile, it provides only images and corresponding poses without supplying depth data or full 3D point clouds. Obviously, PSN significantly outperforms previous APR methods, which typically require hours of training. PSN requires only a few minutes to train a network, encoding specific scenes into learnable weights, thereby enabling rapid inference from input images. In addition to exhibiting high training efficiency, it also outperforms DSAC* in certain scenes. The results demonstrate the good accuracy and versatility of PSN in localization within dynamic environments.
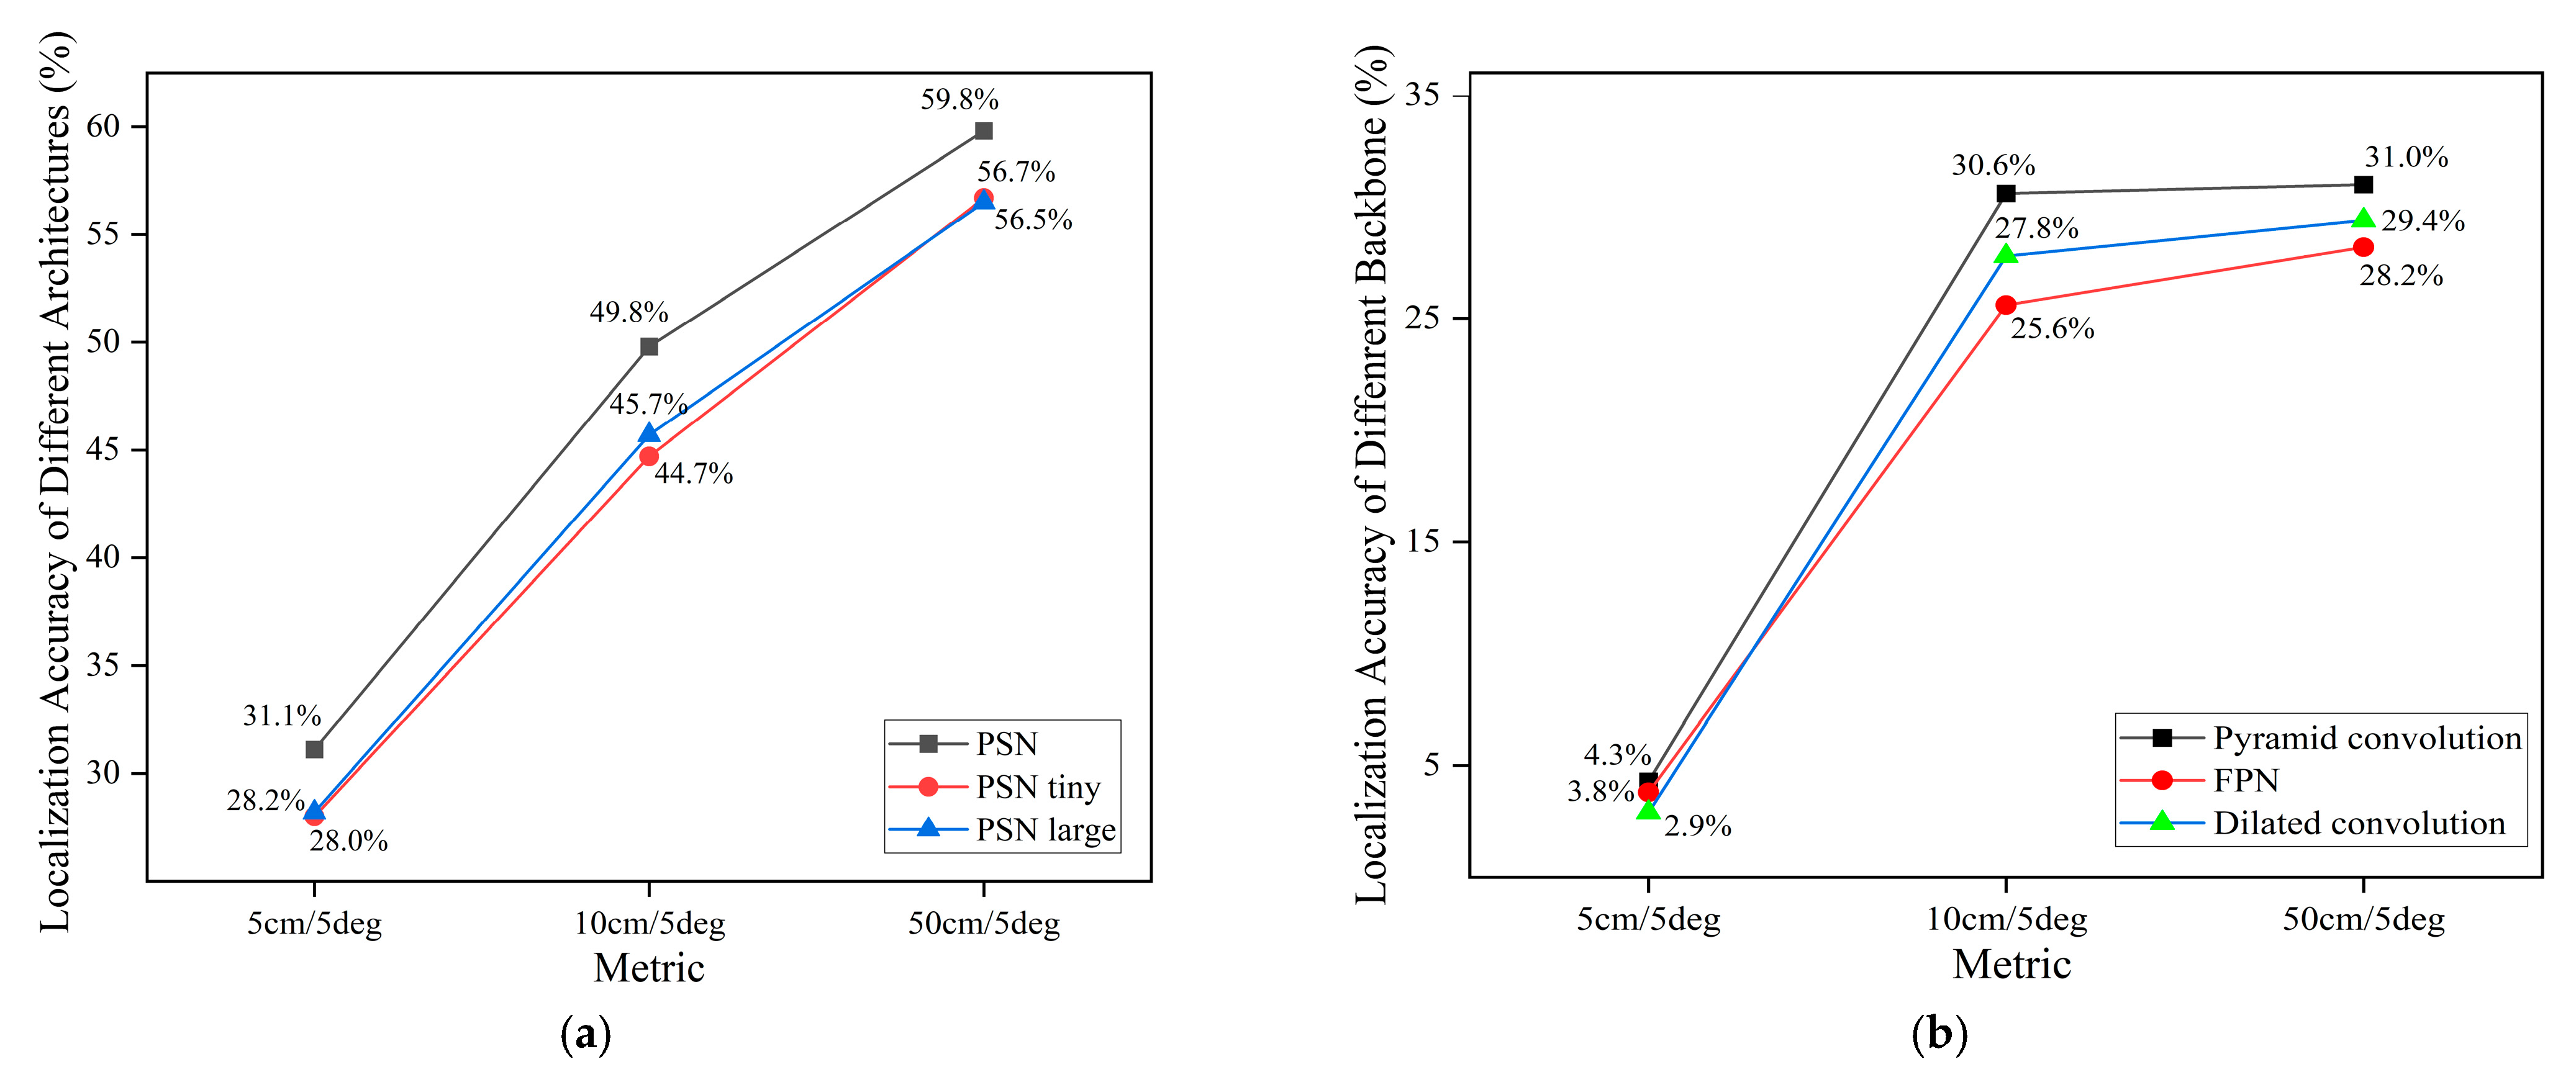
Result of the ablation experiment. In this study, we modified the pyramid convolution architecture to investigate the effects of varying depth, group size, and the number of residual blocks. To evaluate the effectiveness and accuracy of these modifications, we conducted a comparative analysis of the average localization accuracy across all scenes using the Wayspots dataset. Initially, we reduce the kernel depth from 32 to 16 in the first layer and adjust the kernel depth from 64 groups to 32 as the level increases in the second layer, resulting in PSN tiny. Secondly, we augment the number of residual blocks, using eight residual blocks as opposed to four, in the second layer, resulting in PSN large. As shown in Figure 6a, that increase in the number of groups and the depth of the convolution kernels relative to PSN tiny significantly enhanced accuracy, although the FLOPs increased slightly. Additionally, the result indicates that increasing the number of residual blocks like in PSN large does not necessarily enhance localization accuracy.
To compare our method with traditional multi-scale convolution, we replaced the convolutional backbone with dilated convolution [64] and FPN [56], and conducted accuracy evaluation on the Tendrils scene in the Wayspots dataset. This scene, located along a tree-lined road, presents significant localization challenges. As shown in Figure 6b, the proposed pyramid convolution achieves superior localization performance compared to the other two networks. While dilated convolution increases the receptive field by skipping pixels according to the dilation rate, it may introduce gridding artifacts and struggle to capture fine-grained details. In contrast, pyramid convolution employs a structure that applies multiple kernel sizes in parallel to capture both fine and coarse features simultaneously. Although FPN aggregates features across multiple network layers via additional top-down pathways and lateral connections, pyramid convolution extracts rich multi-scale features within a single layer, simplifying the architecture while maintaining high efficiency. The key innovation of pyramid convolution lies in its unified multi-scale representation within a single convolutional block, computational efficiency through grouped convolutions, and comprehensive feature capture. While both dilated convolution and FPN are powerful, pyramid convolution offers a more general and efficient solution for multi-scale feature extraction.
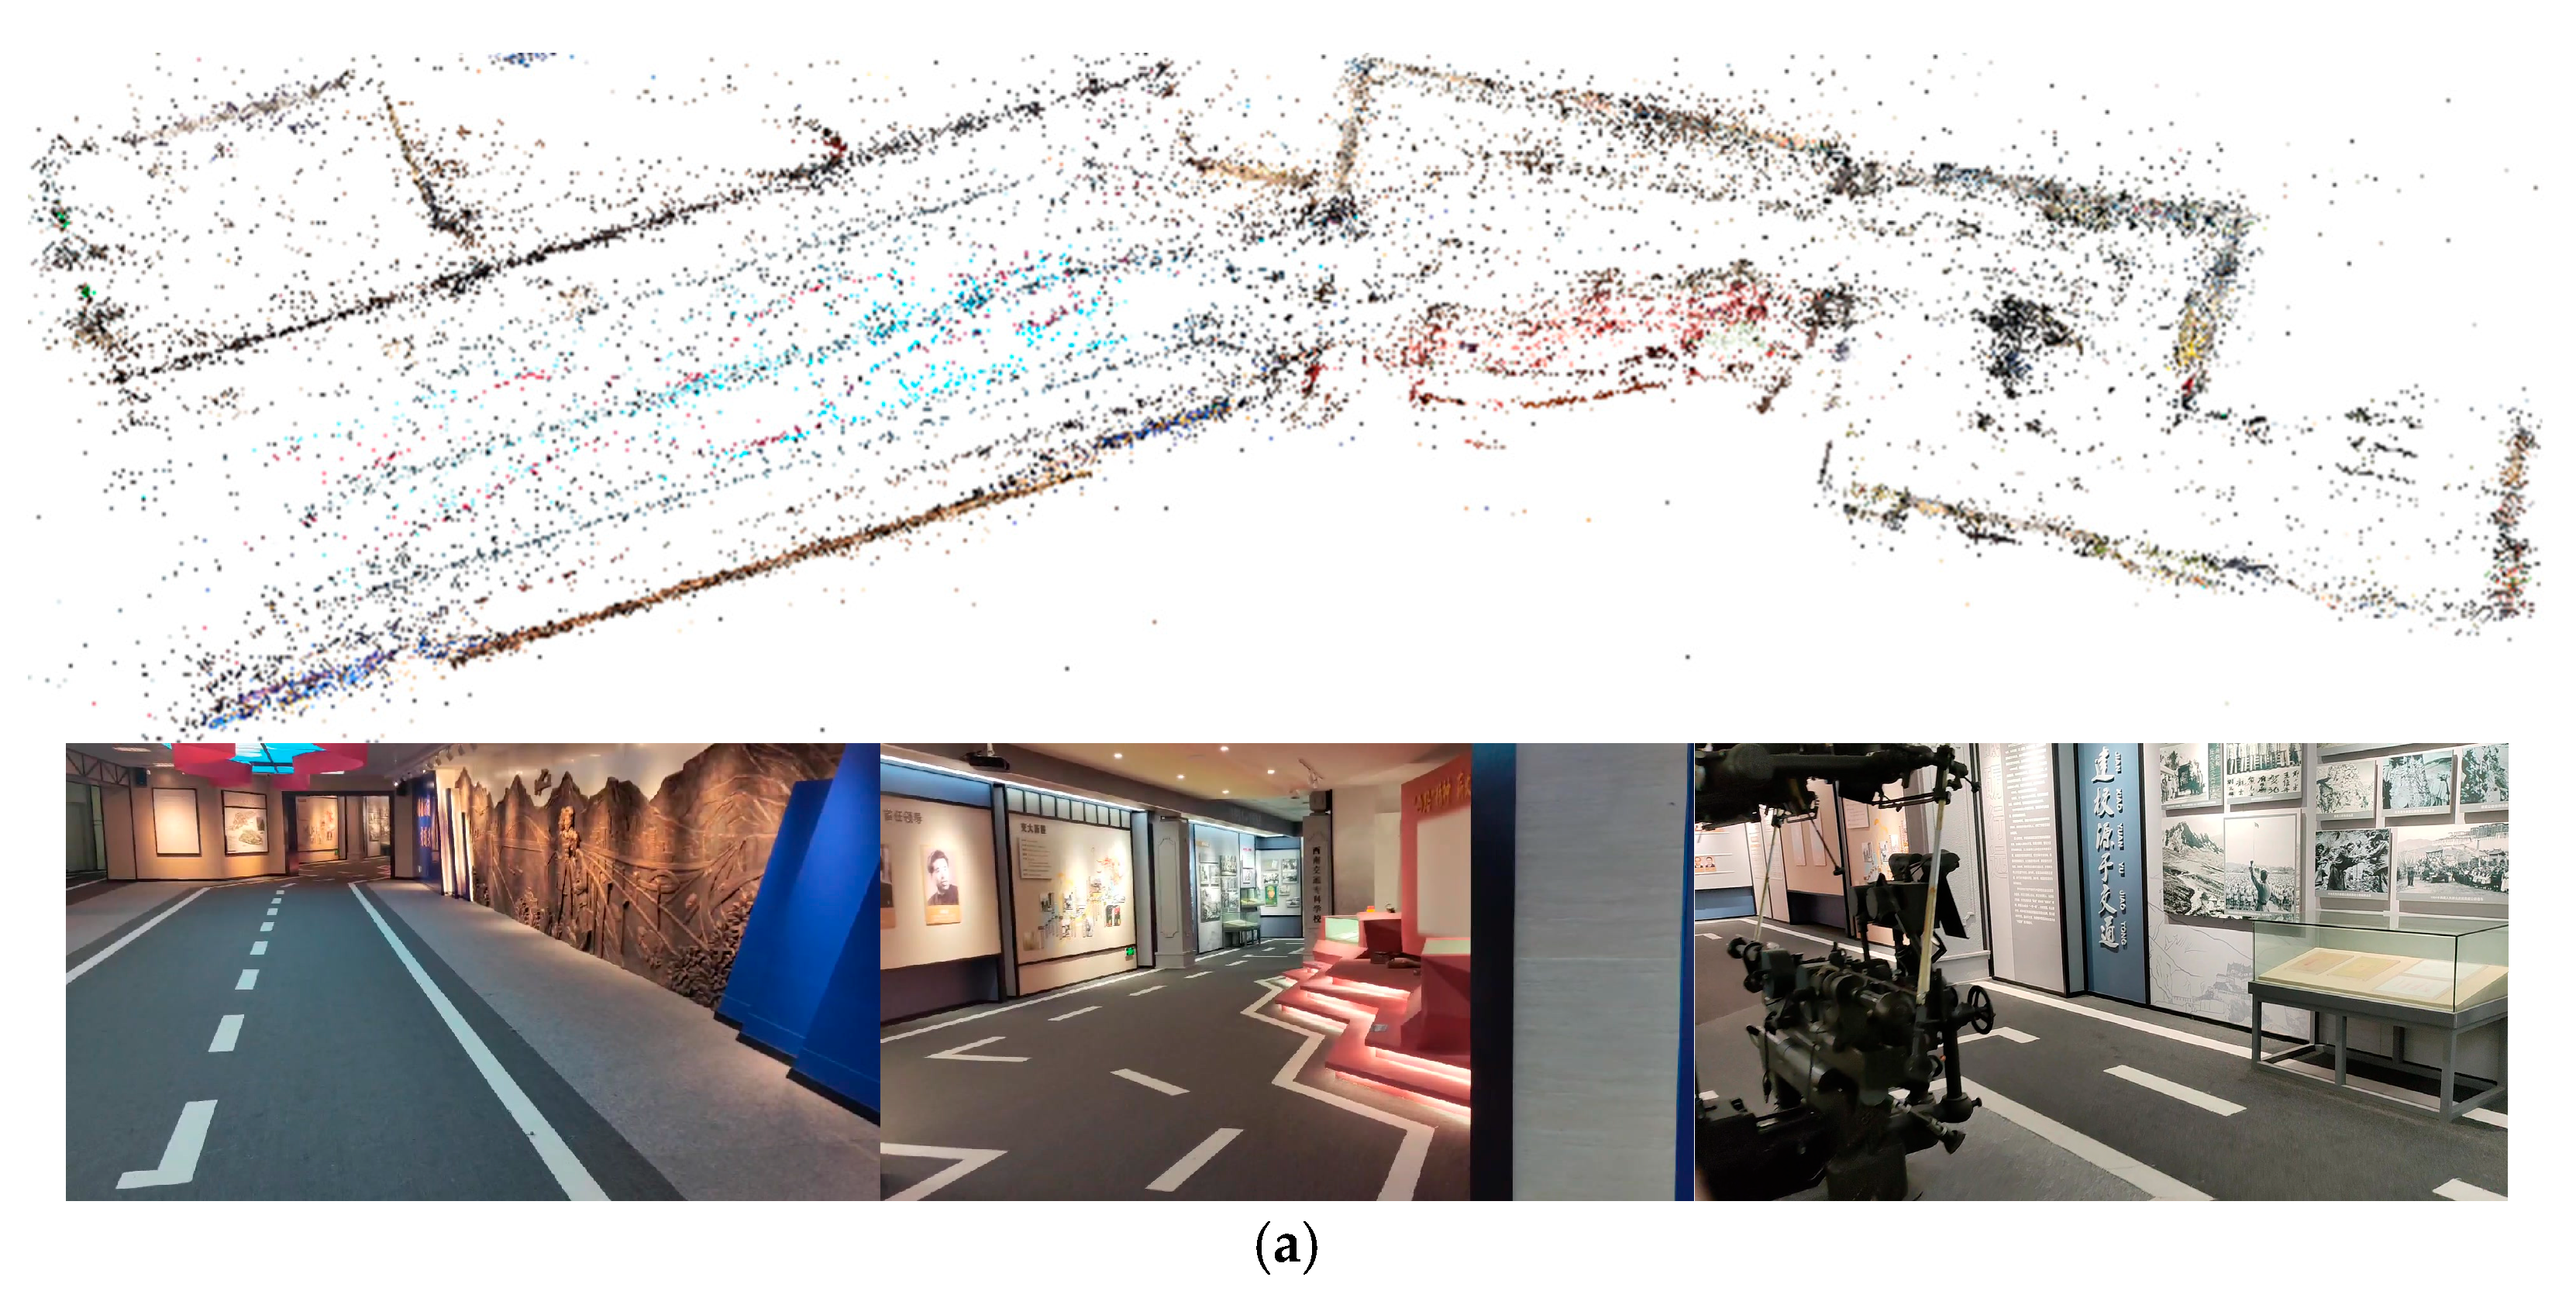
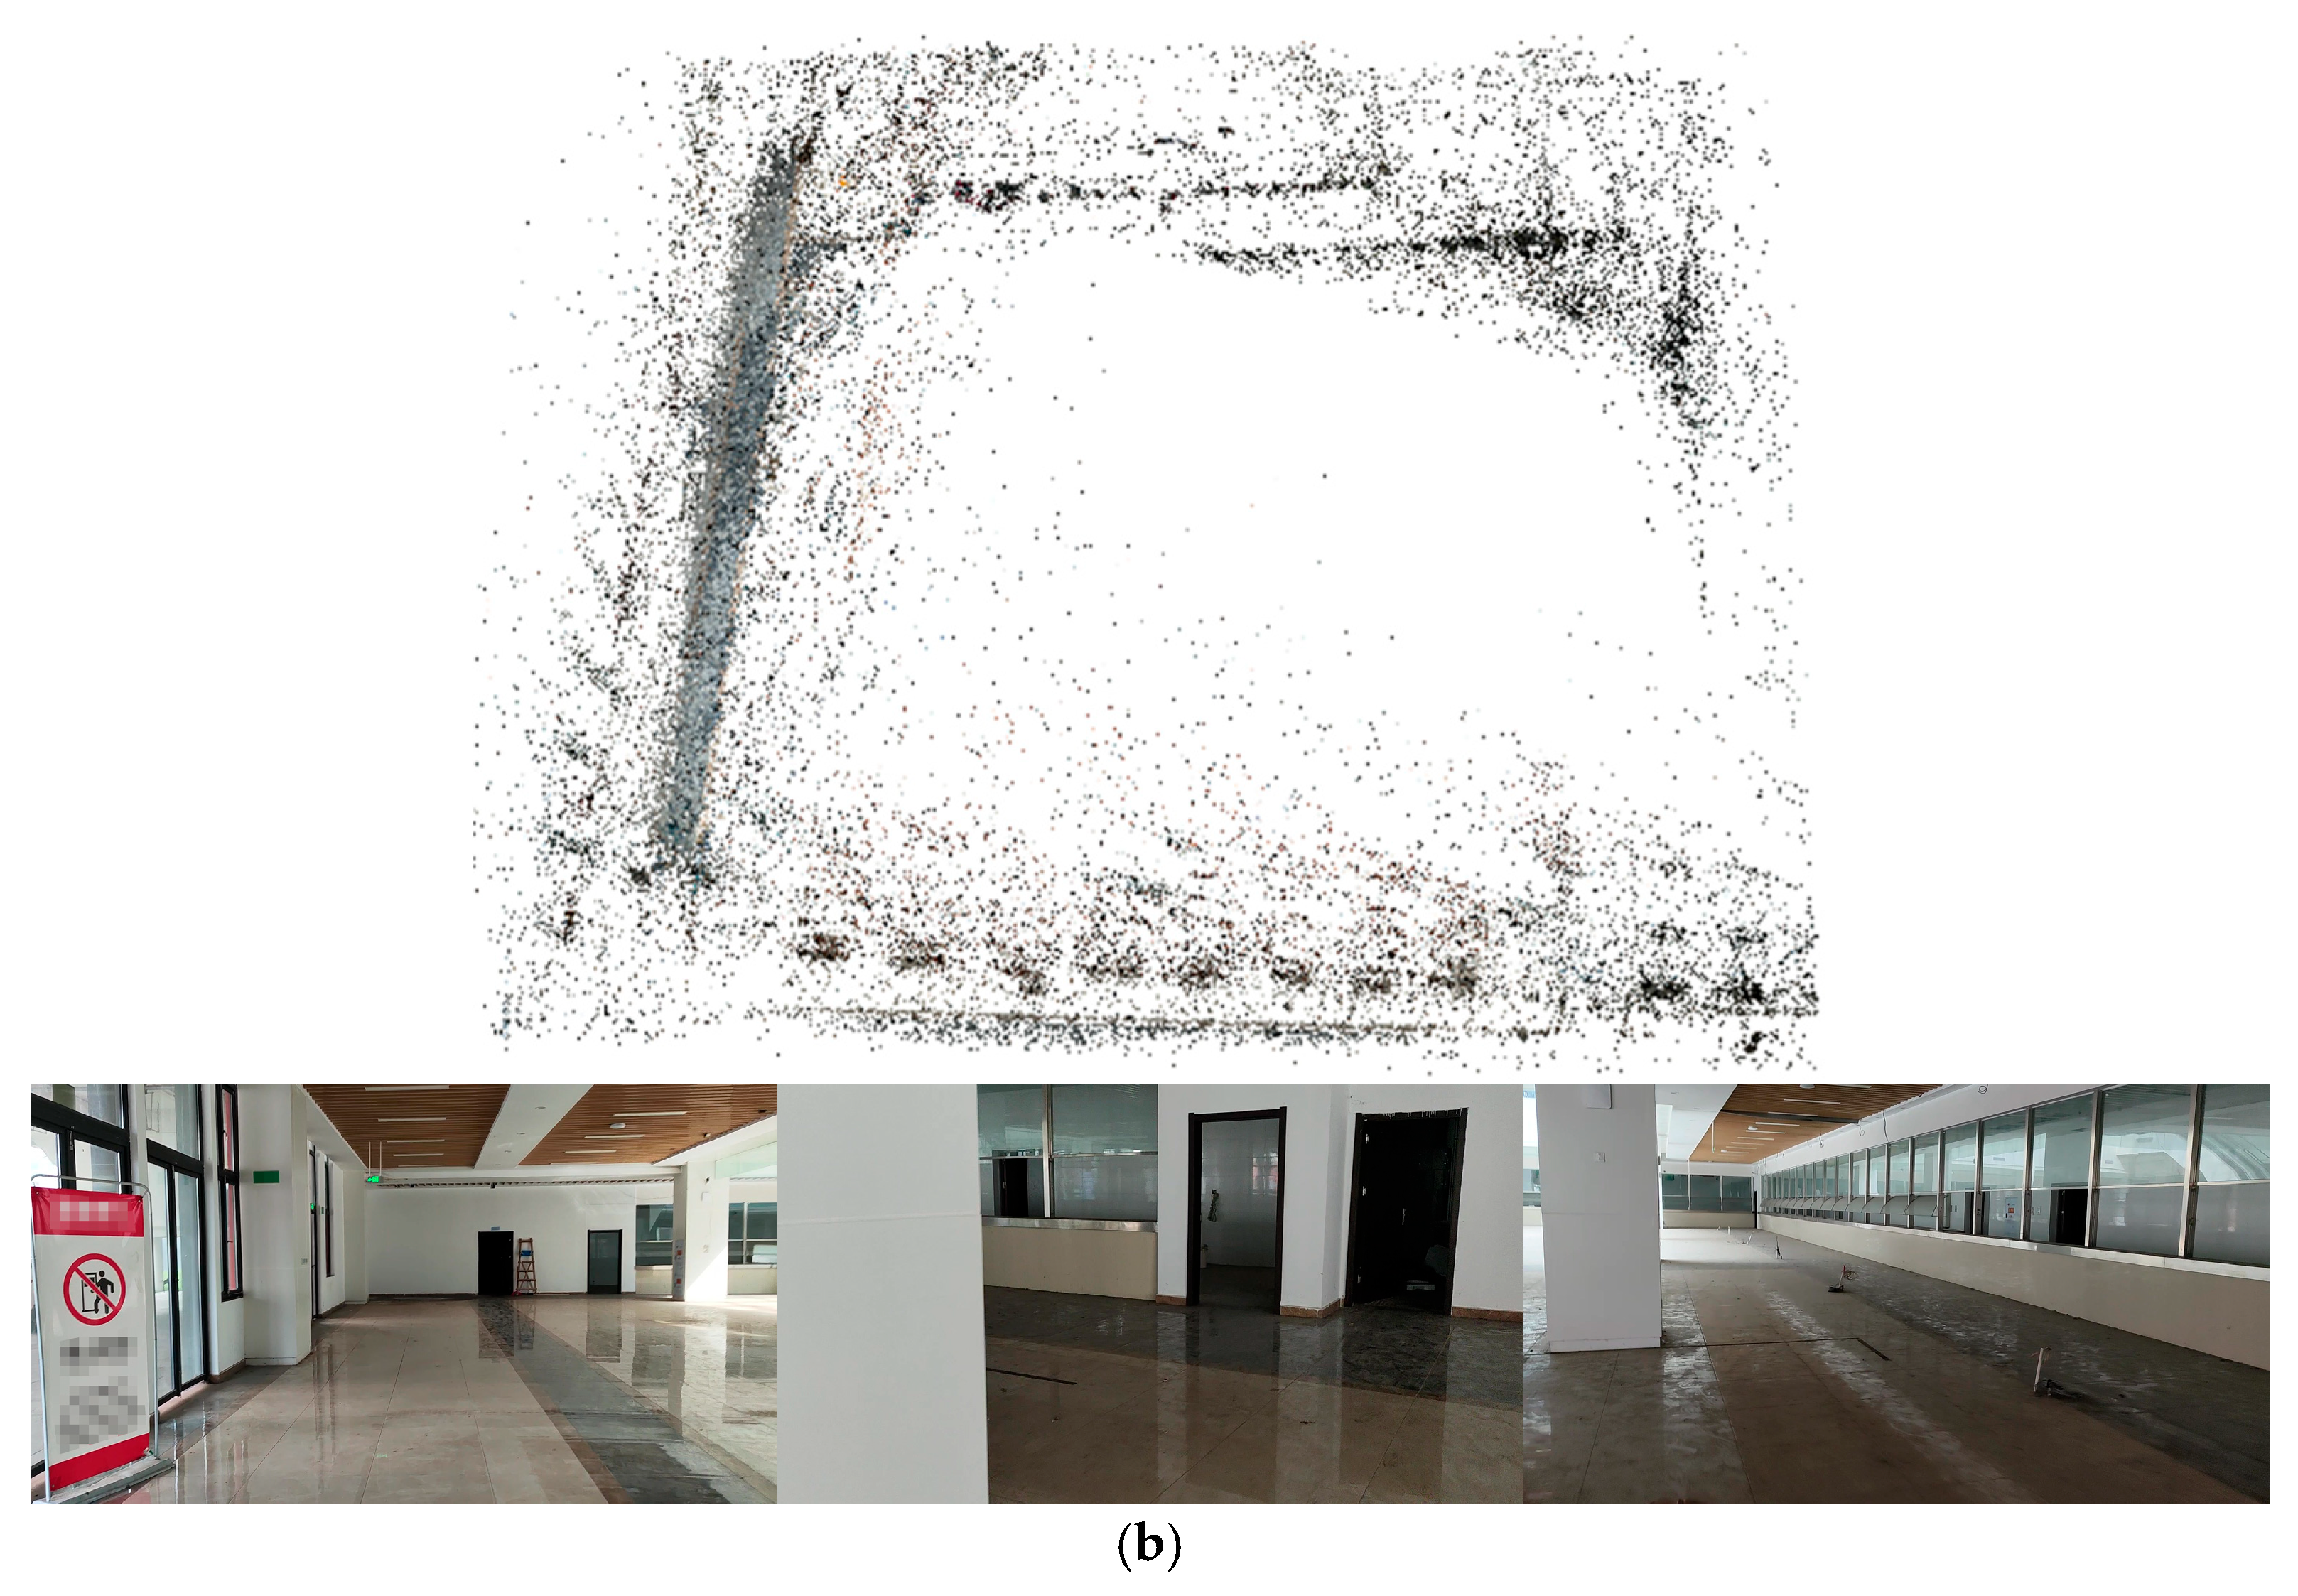
Result of the real-world evaluation of camera tracking. To evaluate the camera tracking accuracy of PSN in real-world application scenes, we conducted experimental analyses in two indoor environments of Chongqing Jiaotong University.
Medium room: A composite indoor space of 500 m2 consisting of several connected rooms, with no natural light and only auxiliary lighting, and rich texture information on surfaces.
Large room: A spacious hall of 5000 m2, illuminated by natural light and lacking auxiliary lighting, with dim lighting in some areas and poor surface texture information.
We selected two environments with an area difference of 10 times for the experiment to evaluate the accuracy and robustness of PSN in basic scenarios, as well as its generalization and scalability from medium and small scenarios to large scenarios. We used a smartphone to capture environmental data via video during walking, and used the poses obtained from SfM as ground truth for supervision and evaluation. Images are extracted from all recorded videos at a frame rate of 6 fps and used as input to COLMAP for model reconstruction. Due to the relatively low ceiling height, we adopted horizontal recording to capture more visual details. The reconstructed model from COLMAP and the collected images are shown in the Figure 7. We treated the data from two separate recording sessions as the training and testing sets, respectively, and aligned their coordinate systems accordingly.
The results are shown in the Table 4, demonstrating that PSN achieves certain accuracy even in large-scale real-world environments, making it suitable for AR-GIS applications.

4.2. AR-GIS Visualization

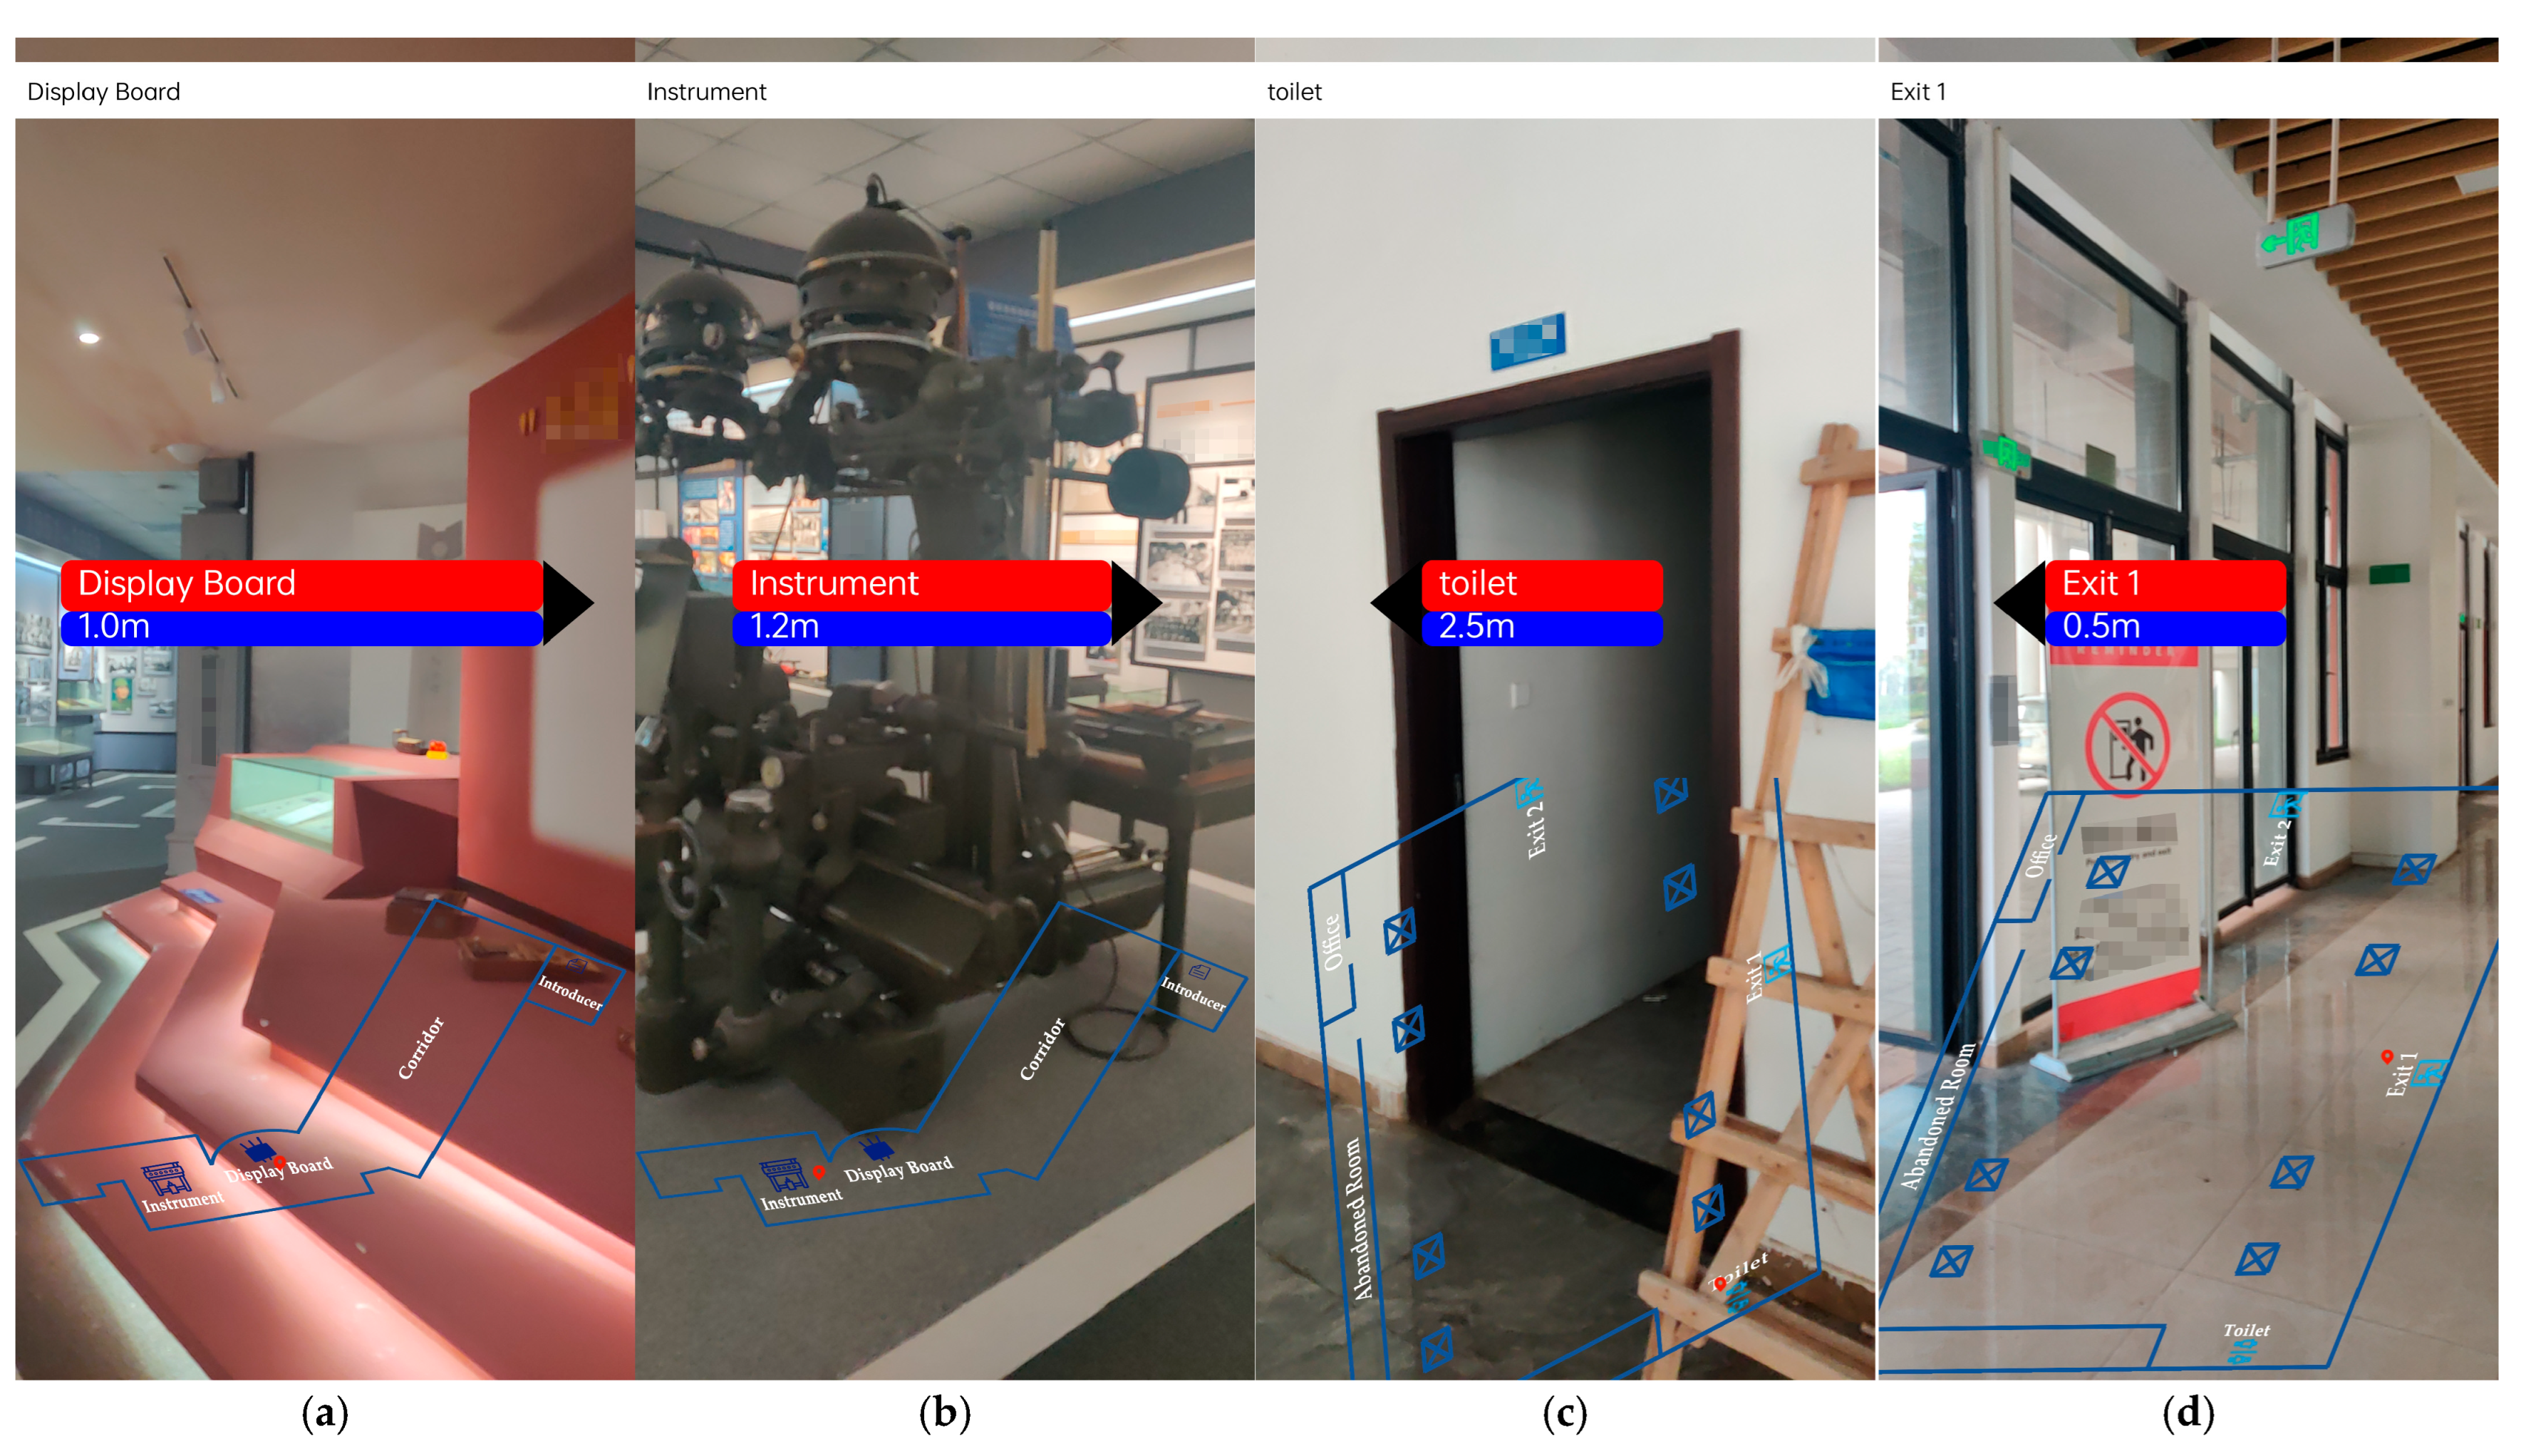
We conducted AR-GIS visualization experiments using a OnePlus 7 Pro Android system mobile phone to record the corresponding spatial information visualization results. The OnePlus 7 Pro is powered by the Qualcomm Snapdragon 855 Mobile Platform and Adreno 640 GPU, coupled with 12 GB of RAM. Devices with similar configurations are sufficient to support the experiments conducted in this study. The AR visualization is implemented by OpenGL ES. The entire application was developed in Android Studio using the Java programming language. The visualization workflow is designed to simulate the walking behavior of pedestrians in real-world scenes, enabling real-time visualization of POIs and GIS maps during movement. Before conducting the experiment, we pretrained the SCR model on the scene for only a few minutes. As the mobile device moves, the pose information obtained from the model updates in real-time, and the pre-rendered floor map and scene information are dynamically displayed in the AR viewport. On average, the localization process takes approximately 30 ms, while the AR visualization requires about 200 ms. The AR visualization outcomes are illustrated in Figure 8.
The first two figures demonstrate the AR visualization results in the medium room, including contextual information, distance indicators, the indoor map, and localization output. As shown in Figure 8a, the Display Board is located to the right of the user’s current position, and thus the corresponding textual and distance information is rendered on the right side of the AR view. In Figure 8b, as the user continues walking forward, information about the Instrument placed in front of the Display Board is displayed in the AR interface. Meanwhile, the distance indicator updates in real-time as the user moves, demonstrating the better localization performance of PSN. The last two figures show the AR visualization results in the large room. Even in this more expansive environment, the semantic information remains clearly visible and is accurately overlaid within the AR view.
We discuss our approach as compared with two state-of-the-art augmented reality (AR) systems. Liu et al. [36] proposed a vision-free localization solution based on magnetic fields, which leverages ambient indoor magnetic disturbances as positioning signals for AR applications. However, in open or semi-open environments, the magnetic field variations may be insufficient to provide adequate localization accuracy. Moreover, storing magnetic field maps requires considerable computational resources. At the same time, their visualization only has the visualization of POIs, without the visualization of global information and geographic information. M. Sundarramurthi et al. introduced NavPES [35], which detects environmental anchors and employs the ARway SDK to determine the user’s position and orientation within indoor mapped areas. However, indoor environments are often subject to change, and completing the full spatial mapping process can be time-consuming in real-world applications. In addition, NavPES displays only point and path information within the AR view, offering users access to merely localized content. Compared with them, PSN is capable of adapting to rapidly changing indoor environments. It enables the training of new learning models for localization within a shorter time frame, while requiring less storage space. Moreover, our AR visualization links rich indoor spatial information with real-world scenes, allowing both global and local information to be presented in the AR view.

5. Discussion

PSN primarily focuses on the algorithm, aiming to balance accuracy and efficiency to enable practical deployment in AR-GIS applications. The method is designed to be lightweight enough to run on standard mobile devices. Existing platforms such as Vuforia, HoloLens, and ARKit typically rely on visual markers [65] or visual-inertial odometry (VIO) [66] for camera tracking. Alternatively, localization can be achieved using BLE [67]. However, marker-based tracking typically has a limited tracking range and restricts user mobility and interaction. BLE, on the other hand, is suitable only for small indoor environments and offers relatively low accuracy. In contrast, the method adopted in this study falls under the category of scene coordinate regression for camera relocalization. This approach first constructs a scene model offline and subsequently estimates the camera pose by establishing correspondences between the current image and the pre-encoded scene information. Unlike VIO, which continuously tracks camera pose and accumulates drift over time, scene coordinate regression is inherently resistant to such cumulative errors and is capable of recovering camera pose even after occlusion. Given the need for a pre-built scene representation, the proposed PSN method is specifically designed to strike a balance between efficiency and accuracy, making it well suited for this application scene.
As for potential limitations, in real-time applications, PSN may exhibit suboptimal localization performance in weakly textured or even textureless scenes, potentially leading to inaccuracies in AR visualization. Moreover, in very large-scale environments, the lack of global context may lead to degraded AR visualization quality.

6. Conclusions

In this paper, we propose a novel positioning network, PSN, designed for precise and efficient camera tracking in AR-GIS applications. This framework not only provides multi-scale image features to enhance localization performance in complex and dynamic environments during AR visualization, but also effectively reduces gradient correlation during training. This accelerates scene information construction, ultimately delivering real-time and accurate positioning information for AR visualization.
In terms of camera tracking, compared with DSAC*, PSN demonstrates advantages in both localization performance and scene mapping time in complex environments. We conducted a comprehensive evaluation of PSN on three different public datasets. The results show that PSN achieves localization accuracy comparable to or even surpassing state-of-the-art baseline methods. It also demonstrates better localization performance in real-world datasets. Moreover, PSN significantly outperforms most approaches in terms of time efficiency, requiring only a few minutes to complete scene mapping and enabling fast and accurate initial localization for AR applications. In terms of AR-GIS visualization, our experiments conducted at Chongqing Jiaotong University demonstrate that AR visualization using PSN achieves accurate localization, dynamically displaying current location, indoor maps, and spatial information with high precision. This AR-GIS visualization is intuitive and effectively enhances and enriches the spatial information of environmental visualization.
Future research will focus on developing a camera tracking framework capable of seamlessly integrating global and local features to significantly enhance the accuracy of AR-GIS applications in large-scale environments. It will also focus on solving the localization performance of weak texture scenes to adapt to more scenes.

Author Contributions

Conceptualization, Haobo Xu, Wei Ma; methodology, Haobo Xu, Chao Zhu; software, Chao Zhu, Yilong Wang; validation, Haobo Xu, Chao Zhu; formal analysis, Chao Zhu, Huachen Zhu; investigation, Haobo Xu, Huachen Zhu; resources, Wei Ma; data curation, Chao Zhu, Yilong Wang, Huachen Zhu; writing—original draft preparation, Haobo Xu, Chao Zhu, Yilong Wang; writing—review and editing, Haobo Xu, Chao Zhu, Huachen Zhu, Wei Ma; visualization, Haobo Xu, Chao Zhu; supervision, Wei Ma, Chao Zhu; project administration, Wei Ma; funding acquisition, Wei Ma. All authors have read and agreed to the published version of the manuscript.

Funding

This research was funded by the State Key Laboratory of Satellite Navigation System and Equipment Technology open fund, grant number CEPNT2023B11.

Conflicts of Interest

The authors declare no conflicts of interest.

References

  1. Dargan, S.; Bansal, S.; Kumar, M.; Mittal, A.; Kumar, K. Augmented reality: A comprehensive review. Arch. Comput. Methods Eng. 2023, 30, 1057–1080. [Google Scholar] [CrossRef]
  2. Lameirão, T.; Melo, M.; Pinto, F. Augmented Reality for Event Promotion. Computers 2024, 13, 342. [Google Scholar] [CrossRef]
  3. Park, S.; Park, S.H.; Park, L.W.; Park, S.; Lee, S.; Lee, T.; Lee, S.H.; Jang, H.; Kim, S.M.; Chang, H.; et al. Design and Implementation of a Smart IoT Based Building and Town Disaster Management System in Smart City Infrastructure. Appl. Sci. 2018, 8, 2239. [Google Scholar] [CrossRef]
  4. Chen, A.; Jesus, R.; Vilarigues, M. Synergy of Art, Science, and Technology: A Case Study of Augmented Reality and Artificial Intelligence in Enhancing Cultural Heritage Engagement. J. Imaging 2025, 11, 89. [Google Scholar] [CrossRef]
  5. Joo-Nagata, J.; Rodríguez-Becerra, J. Mobile Pedestrian Navigation, Mobile Augmented Reality, and Heritage Territorial Representation: Case Study in Santiago de Chile. Appl. Sci. 2025, 15, 2909. [Google Scholar] [CrossRef]
  6. Liu, F.; Jonsson, T.; Seipel, S. Evaluation of Augmented Reality-Based Building Diagnostics Using Third Person Perspective. ISPRS Int. J. Geo-Inf. 2020, 9, 53. [Google Scholar] [CrossRef]
  7. Min, S.; Lei, L.; Wei, H.; Xiang, R. Interactive registration for augmented reality gis. In Proceedings of the International Conference on Computer Vision in Remote Sensing, Xiamen, China, 16–18 December 2012; pp. 246–251. [Google Scholar]
  8. Ma, W.; Zhang, S.; Huang, J. Mobile augmented reality based indoor map for improving geo-visualization. PeerJ Comput. Sci. 2021, 7, e704. [Google Scholar] [CrossRef]
  9. Sattler, T.; Leibe, B.; Kobbelt, L. Efficient & Effective Prioritized Matching for Large-Scale Image-Based Localization. IEEE Trans. Pattern Anal. Mach. Intell. 2017, 39, 1744–1756. [Google Scholar] [CrossRef]
  10. Sarlin, P.-E.; Cadena, C.; Siegwart, R.; Dymczyk, M. From coarse to fine: Robust hierarchical localization at large scale. In Proceedings of the IEEE Conference on Computer Vision and Pattern Recognition, Long Beach, CA, USA, 15–20 June 2019; pp. 12716–12725. [Google Scholar]
  11. Camposeco, F.; Cohen, A.; Pollefeys, M.; Sattler, T. Hybrid Scene Compression for Visual Localization. In Proceedings of the IEEE Conference on Computer Vision and Pattern Recognition, Long Beach, CA, USA, 15–20 June 2019; pp. 7645–7654. [Google Scholar]
  12. Zhou, Q.; Agostinho, S.; Ošep, A.; Leal-Taixé, L. Is Geometry Enough for Matching in Visual Localization? In Proceedings of the European Conference on Computer Vision, Tel Aviv, Israel, 23–27 October 2022; pp. 407–425. [Google Scholar]
  13. Moreau, A.; Piasco, N.; Tsishkou, D.; Stanciulescu, B.; de La Fortelle, A. Coordinet: Uncertainty-aware pose regressor for reliable vehicle localization. In Proceedings of the IEEE Winter Conference on Applications of Computer Vision, Waikoloa, HI, USA, 1–6 January 2022; pp. 2229–2238. [Google Scholar]
  14. Chen, S.; Li, X.; Wang, Z.; Prisacariu, V.A. DFNet: Enhance Absolute Pose Regression with Direct Feature Matching. In Proceedings of the European Conference on Computer Vision, Tel Aviv, Israel, 23–27 October 2022; pp. 1–17. [Google Scholar]
  15. Chen, S.; Wang, Z.; Prisacariu, V. Direct-PoseNet: Absolute Pose Regression with Photometric Consistency. In Proceedings of the International Conference on 3D Vision, International Trave, Online, 1–3 December 2021; pp. 1175–1185. [Google Scholar]
  16. Bach, T.B.; Dinh, T.T.; Lee, J.-H. FeatLoc: Absolute pose regressor for indoor 2D sparse features with simplistic view synthesizing. ISPRS J. Photogramm. Remote Sens. 2022, 189, 50–62. [Google Scholar] [CrossRef]
  17. Brachmann, E.; Rother, C. Learning Less is More—6D Camera Localization via 3D Surface Regression. In Proceedings of the IEEE Conference on Computer Vision and Pattern Recognition, Salt Lake City, UT, USA, 18–23 June 2018; pp. 4654–4662. [Google Scholar]
  18. Cavallari, T.; Bertinetto, L.; Mukhoti, J.; Torr, P.; Golodetz, S. Let’s Take This Online: Adapting Scene Coordinate Regression Network Predictions for Online RGB-D Camera Relocalisation. In Proceedings of the International Conference on 3D Vision, Quebec City, QC, Canada, 16–19 September 2019; pp. 564–573. [Google Scholar]
  19. Cavallari, T.; Golodetz, S.; Lord, N.A.; Valentin, J.; Prisacariu, V.A.; Stefano, L.D.; Torr, P.H.S. Real-Time RGB-D Camera Pose Estimation in Novel Scenes Using a Relocalisation Cascade. IEEE Trans. Pattern Anal. Mach. Intell. 2020, 42, 2465–2477. [Google Scholar] [CrossRef] [PubMed]
  20. Brachmann, E.; Michel, F.; Krull, A.; Yang, M.Y.; Gumhold, S.; Rother, C. Uncertainty-Driven 6D Pose Estimation of Objects and Scenes from a Single RGB Image. In Proceedings of the IEEE Conference on Computer Vision and Pattern Recognition, Las Vegas, NV, USA, 26 June–1 July 2016; pp. 3364–3372. [Google Scholar]
  21. Duta, I.C.; Liu, L.; Zhu, F.; Shao, L. Pyramidal convolution: Rethinking convolutional neural networks for visual recognition. arXiv 2020, arXiv:2006.11538. [Google Scholar] [CrossRef]
  22. Brachmann, E.; Cavallari, T.; Prisacariu, V.A. Accelerated Coordinate Encoding: Learning to Relocalize in Minutes Using RGB and Poses. In Proceedings of the IEEE Conference on Computer Vision and Pattern Recognition, Vancouver, BC, Canada, 17–24 June 2023; pp. 5044–5053. [Google Scholar]
  23. Azuma, R.T. A survey of augmented reality. Presence Teleoperators Virtual Environ. 1997, 6, 355–385. [Google Scholar] [CrossRef]
  24. Herman, L.; Juřík, V.; Stachoň, Z.; Vrbík, D.; Russnák, J.; Řezník, T. Evaluation of user performance in interactive and static 3D maps. ISPRS Int. J. Geo-Inf. 2018, 7, 415. [Google Scholar] [CrossRef]
  25. Tonnis, M.; Klein, L.; Klinker, G. Perception thresholds for augmented reality navigation schemes in large distances. In Proceedings of the IEEE/ACM International Symposium on Mixed and Augmented Reality, Cambridge, UK, 15–18 September 2008; pp. 189–190. [Google Scholar]
  26. Zollmann, S.; Poglitsch, C.; Ventura, J. VISGIS: Dynamic situated visualization for geographic information systems. In Proceedings of the International Conference on Image and VisionComputing New Zealand (IVCNZ), Palmerston North, New Zealand, 21–22 November 2016; pp. 1–6. [Google Scholar]
  27. White, S.; Feiner, S. SiteLens: Situated visualization techniques for urban site visits. In Proceedings of the SIGCHI Conference on Human Factors in Computing Systems, Boston, MA, USA, 4–9 April 2009; pp. 1117–1120. [Google Scholar]
  28. Grasset, R.; Langlotz, T.; Kalkofen, D.; Tatzgern, M.; Schmalstieg, D. Image-driven view management for augmented reality browsers. In Proceedings of the IEEE International Symposium on Mixed and Augmented Reality (ISMAR), Atlanta, GA, USA, 5–8 November 2012; pp. 177–186. [Google Scholar]
  29. Keil, J.; Korte, A.; Ratmer, A.; Edler, D.; Dickmann, F. Augmented reality (AR) and spatial cognition: Effects of holographic grids on distance estimation and location memory in a 3D indoor scenario. PFG–J. Photogramm. Remote Sens. Geoinf. Sci. 2020, 88, 165–172. [Google Scholar] [CrossRef]
  30. Grübel, J.; Thrash, T.; Aguilar, L.; Gath-Morad, M.; Chatain, J.; Sumner, R.W.; Hölscher, C.; Schinazi, V.R. The Hitchhiker’s Guide to Fused Twins: A Review of Access to Digital Twins In Situ in Smart Cities. Remote Sens. 2022, 14, 3095. [Google Scholar] [CrossRef]
  31. Fenais, A.; Ariaratnam, S.T.; Ayer, S.K.; Smilovsky, N. Integrating geographic information systems and augmented reality for mapping underground utilities. Infrastructures 2019, 4, 60. [Google Scholar] [CrossRef]
  32. Huang, K.; Wang, C.; Wang, S.; Liu, R.; Chen, G.; Li, X. An Efficient, Platform-Independent Map Rendering Framework for Mobile Augmented Reality. ISPRS Int. J. Geo-Inf. 2021, 10, 593. [Google Scholar] [CrossRef]
  33. Galvão, M.L.; Paolo, F.; Ioannis, G.; Gerhard, N.; Markus, K.; Alinaghi, N. GeoAR: A calibration method for Geographic-Aware Augmented Reality. Int. J. Geogr. Inf. Sci. 2024, 38, 1800–1826. [Google Scholar] [CrossRef]
  34. Mo Adel, A.; Eleni, S. Augmented Reality Indoor-Outdoor Navigation Through a Campus Digital Twin. In Proceedings of the International Conference on Collaborative Advances in Software and COmputiNg (CASCON), Toronto, ON, Canada, 11–13 November 2024; pp. 1–6. [Google Scholar]
  35. Sundarramurthi, M.; Balasubramanyam, A.; Patil, A.K. NavPES: Augmented Reality Redefining Indoor Navigation in the Digital Era. In Proceedings of the International Conference on Digital Applications, Transformation & Economy (ICDATE), Miri, Malaysia, 14–16 July 2023; pp. 1–5. [Google Scholar]
  36. Liu, H.; Xue, H.; Zhao, L.; Chen, D.; Peng, Z.; Zhang, G. MagLoc-AR: Magnetic-Based Localization for Visual-Free Augmented Reality in Large-Scale Indoor Environments. IEEE Trans. Vis. Comput. Graph. 2023, 29, 4383–4393. [Google Scholar] [CrossRef]
  37. Ma, W.; Xiong, H.; Dai, X.; Zheng, X.; Zhou, Y. An Indoor Scene Recognition-Based 3D Registration Mechanism for Real-Time AR-GIS Visualization in Mobile Applications. ISPRS Int. J. Geo-Inf. 2018, 7, 112. [Google Scholar] [CrossRef]
  38. Pan, X.; Huang, G.; Zhang, Z.; Li, J.; Bao, H.; Zhang, G. Robust Collaborative Visual-Inertial SLAM for Mobile Augmented Reality. IEEE Trans. Vis. Comput. Graph. 2024, 30, 7354–7363. [Google Scholar] [CrossRef]
  39. Jiang, J.-R.; Subakti, H. An indoor location-based augmented reality framework. Sensors 2023, 23, 1370. [Google Scholar] [CrossRef] [PubMed]
  40. Gao, X.-S.; Hou, X.-R.; Tang, J.; Cheng, H.-F. Complete solution classification for the perspective-three-point problem. IEEE Trans. Pattern Anal. Mach. Intell. 2003, 25, 930–943. [Google Scholar]
  41. Schönberger, J.L.; Frahm, J.M. Structure-from-Motion Revisited. In Proceedings of the IEEE Conference on Computer Vision and Pattern Recognition, Las Vegas, NV, USA, 26 June–1 July 2016; pp. 4104–4113. [Google Scholar]
  42. Pietrantoni, M.; Humenberger, M.; Sattler, T.; Csurka, G. SegLoc: Learning Segmentation-Based Representations for Privacy-Preserving Visual Localization. In Proceedings of the IEEE Conference on Computer Vision and Pattern Recognition, Vancouver, BC, Canada, 17–24 June 2023; pp. 15380–15391. [Google Scholar]
  43. Sarlin, P.E.; Unagar, A.; Larsson, M.; Germain, H.; Toft, C.; Larsson, V.; Pollefeys, M.; Lepetit, V.; Hammarstrand, L.; Kahl, F.; et al. Back to the Feature: Learning Robust Camera Localization from Pixels to Pose. In Proceedings of the IEEE Conference on Computer Vision and Pattern Recognition, Nashville, TN, USA, 20–25 June 2021; pp. 3246–3256. [Google Scholar]
  44. Sarlin, P.-E.; DeTone, D.; Malisiewicz, T.; Rabinovich, A. Superglue: Learning feature matching with graph neural networks. In Proceedings of the IEEE Conference on Computer Vision and Pattern Recognition, Seattle, WA, USA, 13–19 June 2020; pp. 4938–4947. [Google Scholar]
  45. Panek, V.; Kukelova, Z.; Sattler, T. MeshLoc: Mesh-Based Visual Localization. In Proceedings of the European Conference on Computer Vision, Tel Aviv, Israel, 23–27 October 2022; pp. 589–609. [Google Scholar]
  46. Kendall, A.; Grimes, M.; Cipolla, R. Posenet: A convolutional network for real-time 6-dof camera relocalization. In Proceedings of the IEEE Conference on Computer Vision and Pattern Recognition, Boston, MA, USA, 7–15 June 2015; pp. 2938–2946. [Google Scholar]
  47. Kendall, A.; Cipolla, R. Modelling uncertainty in deep learning for camera relocalization. In Proceedings of the IEEE International Conference on Robotics and Automation, Stockholm Waterfront Congress Centre, Stockholm, Sweden, 16–21 May 2016; pp. 4762–4769. [Google Scholar]
  48. Shavit, Y.; Ferens, R.; Keller, Y. Learning Multi-Scene Absolute Pose Regression with Transformers. In Proceedings of the IEEE International Conference on Computer Vision, Montreal, BC, Canada, 11–17 October 2021; pp. 2713–2722. [Google Scholar]
  49. Shotton, J.; Glocker, B.; Zach, C.; Izadi, S.; Criminisi, A.; Fitzgibbon, A. Scene Coordinate Regression Forests for Camera Relocalization in RGB-D Images. In Proceedings of the IEEE Conference on Computer Vision and Pattern Recognition, Portland, OR, USA, 23–28 June 2013; pp. 2930–2937. [Google Scholar]
  50. Cavallari, T.; Golodetz, S.; Lord, N.A.; Valentin, J.; Stefano, L.D.; Torr, P.H.S. On-the-Fly Adaptation of Regression Forests for Online Camera Relocalisation. In Proceedings of the IEEE Conference on Computer Vision and Pattern Recognition, Honolulu, HI, USA, 21–26 July 2017; pp. 218–227. [Google Scholar]
  51. Brachmann, E.; Krull, A.; Nowozin, S.; Shotton, J.; Michel, F.; Gumhold, S.; Rother, C. Dsac-differentiable ransac for camera localization. In Proceedings of the IEEE Conference on Computer Vision and Pattern Recognition, Honolulu, HI, USA, 21–26 July 2017; pp. 6684–6692. [Google Scholar]
  52. Li, X.; Wang, S.; Zhao, Y.; Verbeek, J.; Kannala, J. Hierarchical Scene Coordinate Classification and Regression for Visual Localization. In Proceedings of the IEEE Conference on Computer Vision and Pattern Recognition, Seattle, WA, USA, 13–19 June 2020; pp. 11980–11989. [Google Scholar]
  53. Brachmann, E.; Rother, C. Visual camera re-localization from RGB and RGB-D images using DSAC. IEEE Trans. Pattern Anal. Mach. Intell. 2021, 44, 5847–5865. [Google Scholar] [CrossRef] [PubMed]
  54. Dong, Q.; Zhou, Z.; Qiu, X.; Zhang, L. A Survey on Self-Supervised Monocular Depth Estimation Based on Deep Neural Networks. IEEE Trans. Neural Netw. Learn. Syst. 2025, 1–21. [Google Scholar] [CrossRef]
  55. Bhat, S.F.; Birkl, R.; Wofk, D.; Wonka, P.; Müller, M. Zoedepth: Zero-shot transfer by combining relative and metric depth. arXiv 2023, arXiv:2006.11538. [Google Scholar]
  56. Lin, T.-Y.; Dollár, P.; Girshick, R.; He, K.; Hariharan, B.; Belongie, S. Feature pyramid networks for object detection. In Proceedings of the IEEE Conference on Computer Vision and Pattern Recognition, Honolulu, HI, USA, 21–26 July 2017; pp. 2117–2125. [Google Scholar]
  57. Liu, X.; Hu, Y.; Chen, J. Hybrid CNN-Transformer model for medical image segmentation with pyramid convolution and multi-layer perceptron. Biomed. Signal Process. Control 2023, 86, 105331. [Google Scholar] [CrossRef]
  58. Zhang, J.; Zhao, L.; Jiang, H.; Shen, S.; Wang, J.; Zhang, P.; Zhang, W.; Wang, L. Hyperspectral Image Classification Based on Dense Pyramidal Convolution and Multi-Feature Fusion. Remote Sens. 2023, 15, 2990. [Google Scholar] [CrossRef]
  59. Kendall, A.; Cipolla, R. Geometric Loss Functions for Camera Pose Regression with Deep Learning. In Proceedings of the IEEE Conference on Computer Vision and Pattern Recognition, Honolulu, HI, USA, 21–26 July 2017; pp. 6555–6564. [Google Scholar]
  60. Taira, H.; Okutomi, M.; Sattler, T.; Cimpoi, M.; Pollefeys, M.; Sivic, J.; Pajdla, T.; Torii, A. InLoc: Indoor Visual Localization with Dense Matching and View Synthesis. IEEE Trans. Pattern Anal. Mach. Intell. 2021, 43, 1293–1307. [Google Scholar] [CrossRef] [PubMed]
  61. Yang, L.; Bai, Z.; Tang, C.; Li, H.; Furukawa, Y.; Tan, P. SANet: Scene Agnostic Network for Camera Localization. In Proceedings of the International Conference on Computer Vision, Seoul, Republic of Korea, 27 October–2 November 2019; pp. 42–51. [Google Scholar]
  62. Do, T.; Miksik, O.; DeGol, J.; Park, H.S.; Sinha, S.N. Learning to Detect Scene Landmarks for Camera Localization. In Proceedings of the IEEE Conference on Computer Vision and Pattern Recognition, New Orleans, LA, USA, 18–24 June 2022; pp. 11122–11132. [Google Scholar]
  63. Arnold, E.; Wynn, J.; Vicente, S.; Garcia-Hernando, G.; Monszpart, Á.; Prisacariu, V.; Turmukhambetov, D.; Brachmann, E. Map-Free Visual Relocalization: Metric Pose Relative to a Single Image. In Proceedings of the European Conference on Computer Vision, Tel Aviv, Israel, 23–27 October 2022; pp. 690–708. [Google Scholar]
  64. Yu, F.; Koltun, V. Multi-scale context aggregation by dilated convolutions. arXiv 2015, arXiv:1511.07122. [Google Scholar]
  65. Zhang, G.; Liu, X.; Wang, L.; Zhu, J.; Yu, J. Development and feasibility evaluation of an AR-assisted radiotherapy positioning system. Front. Oncol. 2022, 12, 921607. [Google Scholar] [CrossRef] [PubMed]
  66. Huang, Y.; Tan, Z.; Qiao, X.; Zhao, J.; Tian, F. Moving Visual-Inertial Ordometry into Cross-platform Web for Markerless Augmented Reality. In Proceedings of the IEEE Conference on Virtual Reality and 3D User Interfaces Abstracts and Workshops (VRW), Christchurch, New Zealand, 12–16 March 2022; pp. 624–625. [Google Scholar]
  67. Morgan, A.A. On the accuracy of BLE indoor localization systems: An assessment survey. Comput. Electr. Eng. 2024, 118, 109455. [Google Scholar] [CrossRef]
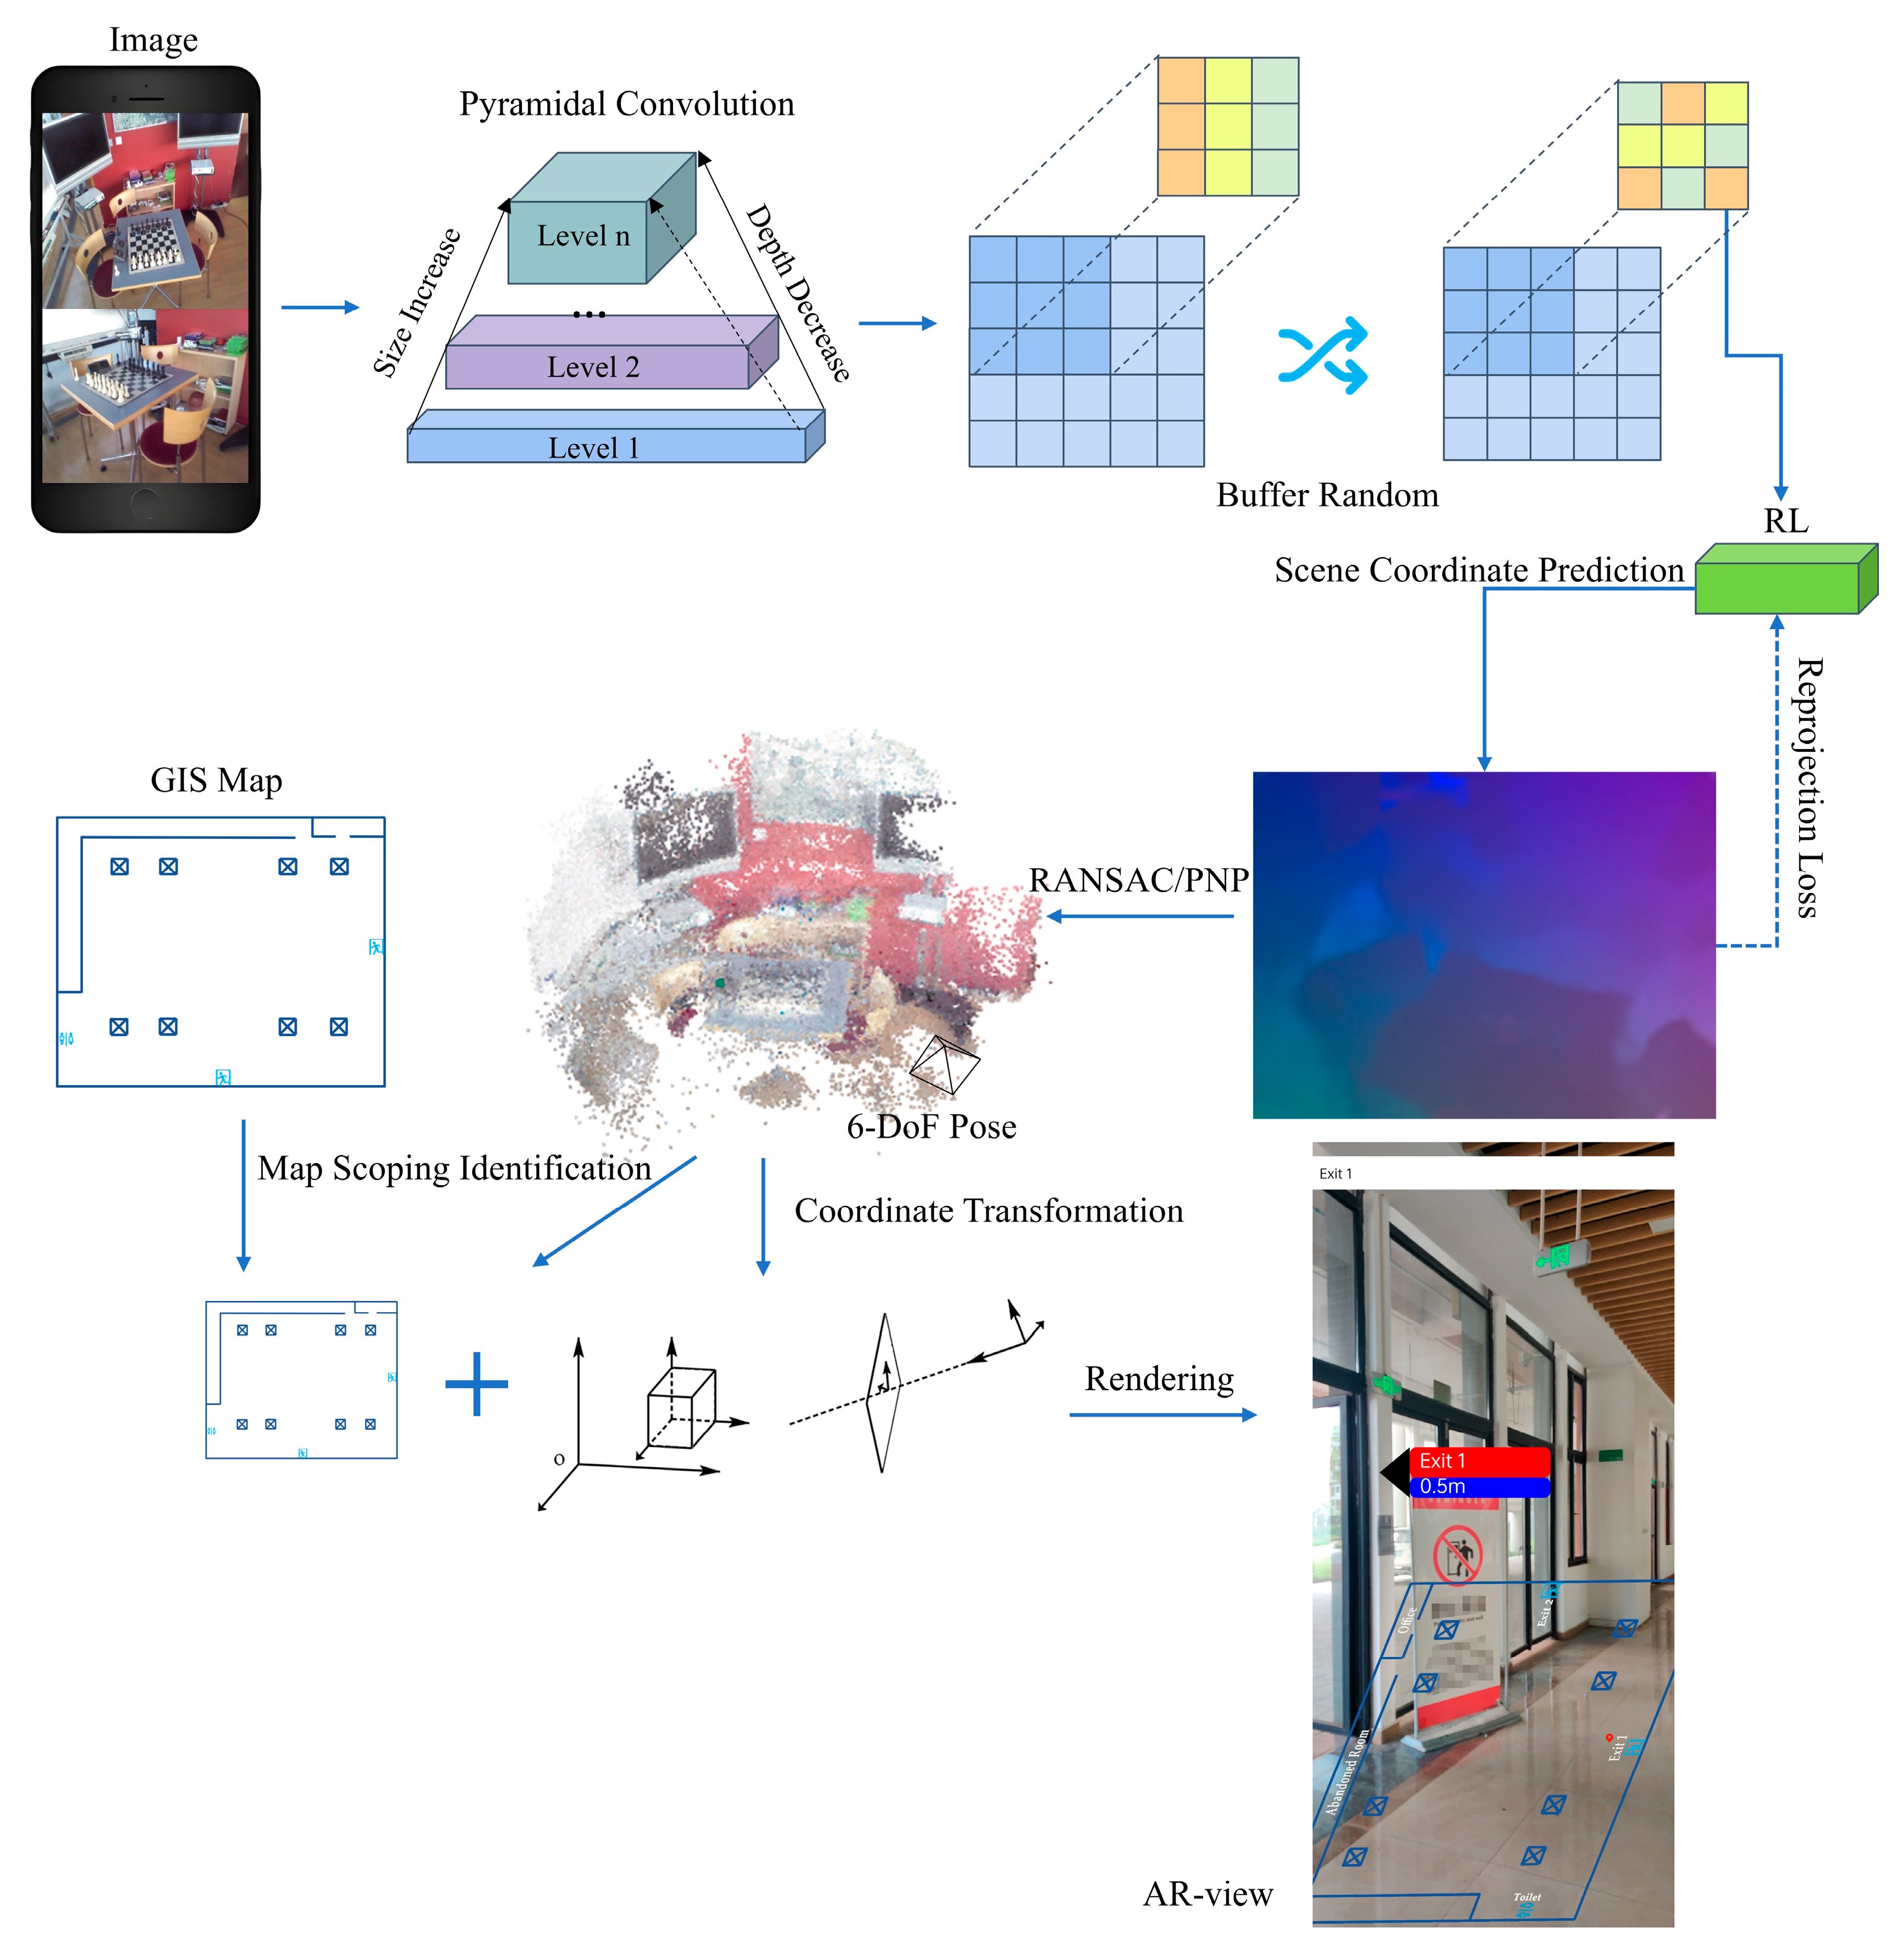
Figure 1. System overview.
Ijgi 14 00311 g001
Figure 2. Comparison with standard convolution.
Ijgi 14 00311 g002
Figure 3. The workflow of AR-GIS visualization.
Ijgi 14 00311 g003
Figure 4. Feature extraction network architectures.
Ijgi 14 00311 g004
Figure 5. The trajectories in the test set on 7-scene datasets and visualization of the 3D scenes.
Ijgi 14 00311 g005
Figure 6. Ablation experiment. (a) Localization accuracy of different architectures; (b) localization accuracy of different backbones.
Ijgi 14 00311 g006
Figure 7. Two indoor datasets. (a) medium room; (b) large room.
Ijgi 14 00311 g007aIjgi 14 00311 g007b
Figure 8. The results of AR-GIS visualization. (a) visualization around the Display Board; (b) visualization around the Instrument; (c) visualization around the Toilet; (d) visualization around Exit 1.
Ijgi 14 00311 g008
Table 1. The median translational error (cm), rotational error (°), and mapping time of different methods on the 7-scene dataset.
MethodChessFireHeadsOfficePumpkinKitchenStairsMapping Time
APRMST [48]11/4.724/9.614/12.217/5.618/4.417/6.026/8.4>60 min
Posenet17 [59]13/4.527/11.317/1319/5.626/4.823/5.435/12.4>60 min
FMAS [9]2.6/0.92.3/1.01.1/0.84.0/1.26.5/1.75.3/1.73.8/1.1>90 min
Inloc [60]3.0/1.053.0/1.12.0/1.163.0/1.055.0/1.554.0/1.39.0/2.5>90 min
Hloc [10]2.4/0.81.8/0.80.9/0.62.6/0.84.4/1.24.0/1.45.1/1.4>90 min
SCRSANet [61]3.0/2.93.0/1.12.0/1.53.0/1.05.0/1.34.0/1.416.0/4.63 min
NBE + SLD [62]2.2/0.81.8/0.70.9/0.73.2/0.95.6/1.65.3/1.55.5/1.4>60 min
DSAC* (RGB) [53]1.9/1.11.9/1.21.1/1.82.6/1.24.2/1.43.0/1.74.1/1.4>100 min
PSN (Ours)2.2/0.82.0/0.81.0/0.75.0/1.45.5/1.67.0/1.98.6/2.05 min
Table 2. The median errors (m) for position and degree (°) for the orientation of the Cambridge Landmarks dataset.
MethodGreat CourtK. CollegeHospitalShopChurchMapping Time
APRMST [48]-0.83/1.51.81/2.40.86/3.11.62/4.0>100 min
Posenet17 [59]6.83/3.50.88/1.03.20/3.30.88/3.81.57/3.3>100 min
DFNet [14]-0.73/2.42.00/3.00.67/2.21.37/4.0>60 min
FMAS [9]0.24/0.10.13/0.20.20/0.40.04/0.20.08/0.335 min
Hloc [10]0.17/0.10.11/0.20.15/0.30.04/0.20.07/0.235 min
PxLoc [43]0.30/0.10.14/0.20.16/0.30.05/0.20.10/0.335 min
SCRDSAC++ (RGB) [17]0.66/0.20.23/0.30.24/0.30.09/0.30.20/0.4>100 min
DSAC* (RGB) [53]0.34/0.20.18/0.30.21/0.40.05/0.30.15/0.6>100 min
PSN (Ours)0.98/0.60.20/0.40.38/0.70.05/0.30.26/0.925 min
Table 3. The percentage of frames below 10 cm/5° and 0.5 m/5° position error of the Wayspots dataset.
SceneAPRSCR
Posenet17 [59]MST [48]DSAC* [53]PSN (Ours)
Bears12.9%/35.7%0.5%/12.8%82.6%/91.6%76.9%/82.4%
Cubes0.0%/0.4%0.0%/9.9%83.8%/98.1%81.7%/96.3%
Inscription1.1%/6.3%1.3%/9.7%54.1%/69.7%53.9%/75.1%
Lawn0.0%/0.2%0.0%/0.0%34.7%/38.0%36.6%/37.7%
Map14.9%/49.1%5.6%/25.7%56.7%/87.1%53.9%/85.9%
Square Bench0.0%/3.0%0.0%/0.0%69.5%/97.9%63.8%/88.0%
Statue0.0%/0.0%0.0%/0.0%0.0%/0.0%0.0%/0.0%
Tendrils0.0%/0.0%0.9%/23.6%25.1%/26.5%30.6%/31.0%
The Rock21.2%/77.5%10.7%/52.6%100.0%/100.0%100.0%/100.0%
Winter Sign0.0%/0.0%0.0%/0.0%0.2%/5.7%0.2%/5.7%
Table 4. The median error and the percentage of frames below 50 cm/5° position error of the medium room and large room.
MetricMedium RoomLarge Room
Median error0.16 m/0.3 deg0.36 m/0.4 deg
Position error79.6%59.8%
Disclaimer/Publisher’s Note: The statements, opinions and data contained in all publications are solely those of the individual author(s) and contributor(s) and not of MDPI and/or the editor(s). MDPI and/or the editor(s) disclaim responsibility for any injury to people or property resulting from any ideas, methods, instructions or products referred to in the content.