Abstract
With the emergence of Survey 4.0, the oil and gas (O & G) industry is now considering spatial digital twins during their field design to enhance visualization, efficiency, and safety. O & G companies have already initiated investments in the research and development of spatial digital twins to build digital mining models. Existing studies commonly adopt surveys and case studies as their evaluation approach to validate the feasibility of spatial digital twins and related technologies. However, this approach requires high costs and resources. To address this gap, this study explores the feasibility of the informed argument method within the design science framework. A land survey data model (LSDM)-based digital twin prototype for O & G field design, along with 3D spatial datasets located in Lot 2 on RP108045 at petroleum lease 229 under the Department of Resources, Queensland Government, Australia, was selected as a case for this study. The ISO/IEC 25010 model was adopted as a methodology for this study to evaluate the prototype and Digital Twin Victoria (DTV). It encompasses eight metrics, such as functional suitability, performance efficiency, compatibility, usability, security, reliability, maintainability, and portability. The results generated from this study indicate that the prototype encompasses a standard level of all parameters in the ISO/IEC 25010 model. The key significance of the study is its methodological contribution to evaluating the spatial digital twin models through cost-effective means, particularly under circumstances with strict regulatory requirements and low information accessibility.
1. Introduction
Digital technologies have been leveraged in oil and gas (O & G) projects for decades [1]. The fully integrated O & G projects consist of three sections: upstream, midstream, and downstream [2]. The upstream section undergoes five different stages, such as exploration, appraisal, development, production, and decommissioning [3]. Field design is considered a pivotal activity of the development stage in any O & G project [4]. In the context of Australia, O & G field design involves conceptual design, followed by detailed design, the approval of the design from various stakeholders, and archiving into a spatial information system [5]. The key assets involved in field design include rigs, access roads, gathering pipeline systems, utility services, and facility structures [6,7].
With the emergence of Industry 4.0, O & G projects are significantly integrating digital technologies such as digital twins, autonomous robots, simulations, system integration, Internet of Things (IoT), cyber security, cloud computing, additive manufacturing, augmented reality (AR), and big data to enhance their operational efficiency, safety, and decision-making process [8]. A key advancement within the digital twin sector is the spatial digital twin, which is defined as a digital twin (3D/4D virtual reality) with a specific spatial context and which provides a holistic, dimensionally accurate, and location-based representation of assets, infrastructure, and systems [9]. For industries that predominantly rely on spatial information, such as O & G [6], the development of spatially enabled digital twins requires the integration of various Survey 4.0 technologies. An article published by [10] defined Survey 4.0 as the evolution of conventional surveying practices through the adoption of advanced, integrated, and intelligent technologies, such as global navigation satellite systems (GNSS), unmanned aerial vehicles (UAVs), light detection and ranging (LiDAR), building information modeling (BIM), 3D geographic information systems (GIS), 3D computer-aided drawing (CAD), smart geospatial systems, and IoT-based monitoring, which are aligned with Industry 4.0 principles. In addition to this, Survey 4.0 enables automation, real-time data processing, and interoperability to support complex geospatial applications.
Currently, the O & G industry is significantly investing in the research and development (R & D) of digital twins and their related technologies. For instance, in 2024, the global digital twin market in the O & G industry was valued at approximately USD 109.6 million in 2023 and is projected to reach around USD 912.1 million by 2032, due to its capability to enhance asset management, safety, and the decision-making process [11]. Figure 1 represents the digital twin market statistics from 2020–2029. The market has grown steadily since 2020 and shows a strong inclination after 2025. The figure shows that by 2029, the market will reach approximately USD 50 billion. Furthermore, a study by [12] also forecasts that 64.9% of compound annual growth will occur between 2025–2029.
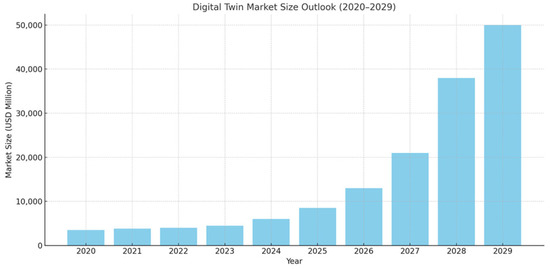
Figure 1.
Statistics of digital twin markets from 2020–2029 [12].
Similarly, Figure 2 illustrates the implication of digital twins on revenue growth status across various industries. The highest revenue growth sectors are oil and gas and the automotive sectors at 27%. Similarly, building and facilities management and mining are at a revenue growth of 24%, whereas infrastructure and general manufacturing show a solid revenue growth rate of 22%. Furthermore, aerospace and defense are at 21%, while city planning and public safety only manage to generate growth rates of 19% and 13%, respectively.
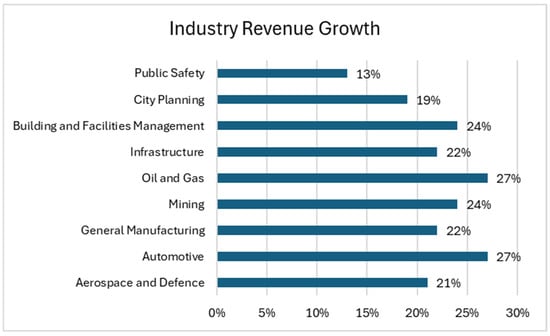
Figure 2.
Industrial revenue generated by DT across various sectors [13].
Despite its significant market value and industry revenue growth, the digital twin development within the O & G industry is still considered emerging, as highlighted in previous [14,15,16] research studies. In the context of R & D, digital twins and their related technologies in any application areas such as smart city, cadastrer and land management, construction, and mining typically involve four key steps: design, development, demonstration, and evaluation [17,18,19]. Within the information science research community, the design science framework is considered a widely accepted approach to design, develop, demonstrate, and evaluate systems, software, and artifacts [20,21,22]. The latest available design science framework was developed by [23]. Research scholars [24,25,26] have adopted design science frameworks in their study to design, develop, demonstrate, and evaluate digital twins and their related technologies. Furthermore, while carrying out the evaluation of a digital twin and its related technologies, various approaches, such as survey, case study, cost–benefit analysis, and experiments, have been utilized, which are detailed in Section 2.3. However, most of these existing methods require high cost, resources, and information [23]. Thus, existing approaches of digital twin and its related technologies have limitations, particularly in regions like Australia, where strict regulatory requirements exist for data accessibility in the mining industry (oil and gas).
Therefore, this research aims to explore the feasibility of an alternative, more cost-effective evaluation approach using the informed argument method of the design science framework. Informed argument is an evaluation approach where researchers assess artifacts through reasoning and argue that it fulfills the defined requirements [23]. The ISO/IEC 25010 model is utilized to achieve the aim of this study due to its worldwide acceptance for assessing any software, prototype, and systems [27]. The key significance of the study is its methodological contribution to evaluating the spatial digital twin models through cost-effective means, particularly under circumstances with strict regulatory requirements and restricted information accessibility.
The remainder of this article is organized as follows. Section 2 outlines the literature review on oil and gas field design from an Australian perspective, overview of spatial digital twins, evaluation approaches of spatial digital twins, and the study rationale. Section 3 describes the materials and methods used in this study. Section 4 presents the results of this study, followed by discussions in Section 5. Finally, Section 6 provides concluding remarks and future work.
2. Literature Review
2.1. Overview of Oil and Gas Field Design: Australian Perspective
International Association of Oil and Gas Producers (IOGP) legislation states that oil and gas (O & G) field design approaches are governed by the laws of the project location country [5]. Consequently, each O & G field design is different from each other. In the context of Australia, conceptual engineering design, detailed engineering design, stakeholders’ approval, and archiving design data into a spatial information system are four elementary steps while designing any O & G field [7,15,28]. O & G field design involves the planning and designing of various infrastructure assets, such as well pads, trunklines, camps, processing facilities, batters, drainage systems, access roads, high-point drains, low-point vents, laydown areas, and fences [5,15]. Conceptual engineering design is considered the foremost step in the O & G field design, and its main purpose is to evaluate different design alternatives [29]. Similarly, the objective of detailed engineering is to ground-truth conceptual engineering design through field surveying and make design adjustments as necessary [30]. Moreover, detailed engineering designs of any infrastructure asset should be approved by all relevant stakeholders, such as construction lead, surveying lead, cultural heritage lead, environmental lead, health and safety lead, and geology lead [28]. Finally, approved design data from all stakeholders are archived into a spatial information system, as mentioned by [6], using the land survey data model (LSDM).
The land survey data model (LSDM), developed by the Geomatics Committee of IOGP, serves both as a geodatabase template and a guiding data dictionary for all the O & G projects worldwide. It supports a wide range of applications, such as O & G field design, geodetic networks establishment, topographic surveys, UAV/LiDAR operations, vegetation surveys, imagery sourcing, Right-of-Way (ROW) assessments, cultural data collection, geological studies, environmental surveys, and infrastructure monitoring [6]. There are five major classes in LSDM that encompass environment samples, infrastructure, shallow intermediate geology, survey measurements, and surface geomorphology [6,15]. IOGP advised that, as part of utilizing LSDM, survey contractors should supply the geodatabase of the infrastructure design based on the LSDM geodatabase template [6]. The key purpose of this model is to minimize data replication and redundancy and to facilitate the consistent archival of infrastructure design datasets into spatial information systems across all O & G projects.
2.2. Overview of Spatial Digital Twin
In the early 2000s, “Michael Grieves” was the first scholar to coin the digital twin term within the research community in the context of product lifecycle management [31]. Over the last two decades, the definition of digital twin has been changed, but the fundamental concept of the digital twin “3D virtual model” has remained constant. A study carried out by [14] suggested that a digital twin should not be limited to 3D visualization. However, it should also include data exchange between a physical asset and its digital model, data analytics, and advanced 4D visualization. Similarly, in 2022, spatial digital twin was first coined by the World Geospatial Industry Council in their report on Spatial Digital Twins: Global Status, Opportunities, and Way Forward [9]. According to the report, at the elementary level, spatial digital twins are geographically based virtual representations of real-world objects. Additionally, this report defined spatial digital twin as the virtual representation of real-world entities and processes by using positioning and dimensions to uplift the value, insight, and integrity of the virtual model, which, in many instances, may be continuously updated at a synchronized frequency and fidelity. Furthermore, spatial digital twin includes numerous technological facets such as IoT sensors, CAD/BIM, virtual reality, and 3D Web GIS platforms [9,32,33]. Similarly, Australian and New Zealand Land Information Council (ANZLIC) defined digital twin with a spatial component as the virtual representation of real-world entities and processes by using positioning and dimensions to uplift the value, insight, and integrity of the virtual model, which, in many instances, may be continuously updated at a synchronized frequency and fidelity [34].
Currently, numerous industries have initiated investing in the research and development of spatial digital twins. A study by [9] found that thirteen sectors have initiated the building of digital twins in the spatial context. The thirteen sectors include A (infrastructure, utilities, and construction), B (public sector and defense), C (real estate/property development/asset or facilities management), D (transport and logistics), E (energy, O & G, mining, and renewables), F (manufacturing/product development and consumer goods), G (telecommunications), H (industrial and heavy manufacturing), I (technology and ICT service providers), J (healthcare), K (agriculture), L (institution, association, or professional body/organization), and M (finance and insurance). Among these, infrastructure, utilities, and construction are very strong contributors to digital twin initiatives, whereas the oil and gas industry is the fifth contributor to digital twin initiatives [9].
2.3. Evaluation Approaches of Spatial Digital Twins
Design science framework is considered a widely accepted tool to design, develop, and evaluate artifacts in the domain of information science [20,21,22]. The latest available design science framework has been developed by [23]. Research scholars have adopted design science frameworks to design, develop, demonstrate, and validate spatial digital twins and their related technologies, such as BIM, IoT, and 3D Web GIS. For instance, ref. [24] developed a conceptual framework for building a demolition waste management system in Hong Kong based on a design science approach that leverages digital twin technology. Similarly, [25] developed the BIM-integrated digital twin framework for advanced construction project management using a design science strategy. Similarly, ref. [26] utilized a design science methodological framework in his PhD dissertation that focused on building a BIM framework for urban land administration.
Design science framework outlines numerous strategies to evaluate the system/prototype/artifact, which mostly depend on the type of artifact or available resources. Similarly, evaluation strategies can be categorized into two types: naturalistic and artificial [35]. Naturalistic evaluation strategies include action research, focus groups, interviews, and case studies, whereas artificial strategies include logical proof, lab experiments, computer simulations, field experiments, and informed arguments. The study in [35] has also suggested the pros and cons of these evaluation strategies. Higher effectiveness and higher external validity are two significant advantages that naturalistic evaluation strategies offer to the examining facet of the study [23]. However, more cost and organizational access are needed to carry out this evaluation strategy. Similarly, an artificial strategy offers merits in terms of financial resources (low cost), few stakeholders, and a faster approach. Perhaps higher effectiveness might not be obtained in comparison to the natural evaluation strategy. However, refs. [23,36] signifies that the evaluation approach is always based on the context, goal, strategies, and available resources. The current evaluation approaches adopted in research communities are illustrated in Table 1.

Table 1.
Prototype evaluation approaches within the research community with their limitations.
Most researchers have adopted the case study as an evaluation approach due to its reliability. A study carried out by [37] utilized a case study demonstration to validate the digital twin platform designed to facilitate bridge damage assessment. In this study, real- world field data measurement was used to validate the functionality of the platform. Similarly, another study carried out by [38] developed an integrated blockchain and digital twin framework for sustainable building energy management. This study also used a case study of a residential apartment to validate the viability of the developed framework. Furthermore, study [39] on the design and validation of a real-time maintenance monitoring system using building information modeling (BIM) and digital twin integration leveraged a data-based anomaly detection technique through a case study for platform functional validation. Furthermore, ref. [15] also used a case study to validate the functional capability of the spatial digital twin platforms specifically developed for O & G field design. Likewise, ref. [40] demonstrated the 3D land information systems through developing a 3D prototype. Similarly, ref. [41] adopted a case study of a prefabricated building project in China. All of these studies employed a case study approach to assess the feasibility of a digital twin platform or its related technological aspects, which required significant costs, resources, and time. Additionally, ref. [24] leveraged a cost–benefit (C-B) approach to assess the BIM-based waste management. The C-B approach is only suitable and effective if accurate financial datasets are accessible.
Moreover, previous studies have also utilized numerical experiments as a validation approach to assess spatial digital twins and their related technologies. For instance, a study carried out by [42] on the development of an urban digital twin for a spatiotemporal intelligent framework conducted experiments and generated results for video image referencing correction, overhead view small target detection (STD), and target tracking based on the twin network. This approach mainly focused on numerical and functional validation, with the validation results being limited to unreal users.
Researchers have also adopted surveys as an evaluation approach to assess the feasibility of spatial digital twins due to their reliability. For instance, ref. [26] interviewed twelve participants to evaluate the BIM model. Likewise, ref. [44], in his master’s dissertation, recruited twenty users to test the usability of a developed 3D cadastral model. Additionally, ref. [45] conducted a comprehensive survey, interviewing 220 professionals to validate an IoT and BIM-based conceptual framework for residential building design. Furthermore, ref. [46] validated the conceptual framework linking BIM and prefabricated building supply chain resilience through conducting an in-depth interview with a key informant from the selected case study organization. Also, ref. [47] carried out an evaluation of a web-based visual and analytical geographical information system (GIS) for O & G data through nine researchers and engineers. Despite researchers adopting the survey approach as an evaluation strategy, it requires higher cost, resources, and time consumption.
2.4. Study Rationale
Table 1 outlines various approaches that have been practiced within the evaluation of spatial digital twins and their related technologies. However, most of the existing evaluation approaches require intensive resources, higher cost, and are time-consuming. In the context of the Australian mining industry, accessing information and datasets is challenging, making information accessibility both difficult and time-consuming. Therefore, a research gap exists in exploring evaluation approaches that are cost-effective, efficient, and capable of addressing strict data regulatory requirements.
Ref. [23] mentioned the concept of an informed argument in their book, defined as an evaluation approach where researchers assess artifacts through reasoning, and argued that it fulfills the defined requirements. The key advantage of the method of informing argument is that it is inexpensive and very useful for formative evaluations. However, there is a high probability of researcher bias in derived results. To strengthen the evaluation, feedback from other researchers could be incorporated. There are existing studies that have also adopted the informed argument approach with single users or very limited users due to a lack of resources for extensive evaluation to evaluate the framework/artifacts/prototypes. For instance, Ref. [48] carried out the heuristic evaluation of SafeTEI of the COVID support application with just two evaluators. Similarly, another study carried out by [49] validated the BIM prototype (a GPT-powered assistant for real-time interactions with BIM) based on a single user through multiple parameters, such as functional queries, error analysis, and response time analysis.
Therefore, a key research question of this study is: How can the informed argument method be leveraged to assess the spatial digital twin of oil and gas field design? Thus, the main objective of this study is to explore the feasibility of using the informed argument method to assess the spatial digital twin and its related technologies of O & G field design in a resource-constrained environment with limited data availability. To achieve the main aim of this study, the ISO/IEC 25010 model was adopted. The key reason for selecting this model is its wide acceptance by industry, academia, and governments for assessing the quality of software, prototypes, and systems [50]. The ISO/IEC 25010 model assesses prototypes, software, and systems from all aspects that include functional suitability, performance efficiency, compatibility, usability, security, reliability, maintainability, and portability [51].
The key significance of this study lies in its contribution to developing a rapid and cost-effective evaluation methodology for spatial digital twin in the context of the oil and gas industry of Australia under conditions of regulatory restriction and limited resource availability. Overall, this study makes a methodological contribution to the growing body of research on spatial digital twins.
3. Materials and Methods
3.1. Materials
The land survey data model (LSDM)-based digital twin for oil and gas field design (prototype), developed by [15], was selected, as shown in Figure 3. The key reason for selecting the prototype was due to accessibility and it being specifically tailored for O & G projects. The prototype is a beta version that includes four key facets, such as layers (red), map interface (blue), navigation bar (yellow), and other miscellaneous components (pink), as shown in Figure 3.
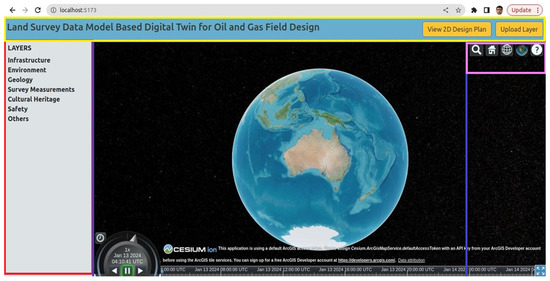
Figure 3.
Land survey data model-based digital twin for oil and gas field design.
Secondly, existing datasets were accessed, as illustrated in Table 2. The datasets were available in .kml, .las, and .tif formats. For instance, 3D models (kml) were developed by integrating as-built data (orthophoto digitization) and 3D point clouds generated through UAV survey, followed by creating a 3D CAD model using AutoCAD Plant software (Version 2024) and embedding LSDM attributes into 3D models through XML scripting. However, DSM was produced after processing UAV-captured images through Agisoft Metashape 1.8.0. While processing the raw images in the select coordinate system tab, GDA94/MGA56 was selected. Thus, the coordinate reference systems (CRS) of all developed digital twin models, as shown in Table 2, are based on GDA94/MGA Zone 56 (EPSG:28356).
Table 2.
Datasets used in this study with their captured methods, positional accuracies, and formats.
3.2. Method
The research approach adopted in this study is presented in Figure 4. Firstly, the land survey data model (LSDM)-based digital twin for oil and gas field design (prototype) was selected, as discussed in Section 3.1. The key reason for selecting the prototype was due to accessibility and it being specifically tailored for O & G. Similarly, the acquired datasets illustrated in Table 2 are located in Lot 2 on RP108045 at petroleum lease 229 under the Department of Resources, Queensland Government, Australia.
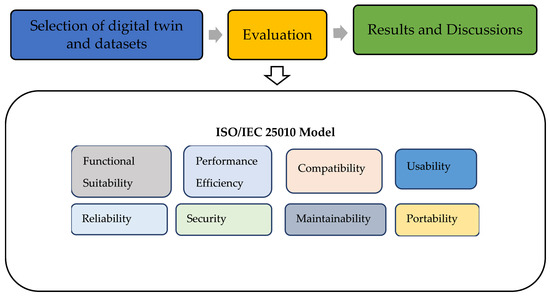
Figure 4.
Research method based on the ISO/IEC 25010 model to evaluate the prototype.
Secondly, the selected spatial digital twin (prototype) was assessed using the ISO/IEC 25010 model through eight metrics: functional suitability, performance efficiency, compatibility, usability, security, reliability, maintainability, and portability. Eight assessments were carried out separately against the respective metrics. The key reasons to select the ISO/IEC 25010 as part of the research methodology were due to the acceptability of this framework within the research community. For instance, a study conducted by [52] proposed an evaluation method to select hardware and AI models for edge applications in the context of UAV through the integration of ISO/IEC 25010 and multi-criteria decision analysis (MCDA). Furthermore, a study by [53] also assessed the geoportals’ usability based on the principles of ISO/IEC 25010.
Finally, results were generated and compiled, followed by discussions, presented in the next two sections.
4. Results
The results obtained from each evaluation criterion are systematically presented through a structured process involving definition, evaluation, and critical reflection. Firstly, each criterion is clearly defined to establish a consistent evaluation framework. Secondly, the spatial digital twin (prototype) is evaluated against these predefined criteria, enabling a comprehensive assessment of its performance and capabilities. Finally, a reflection is presented to interpret the evaluation results, highlighting both strengths and limitations and identifying areas for potential improvement. Detailed discussions supporting each stage of the process are explained, drawing connections to previous studies.
4.1. Functional Suitability
4.1.1. Definition
This parameter is defined by three key criteria: functional completeness, correctness, and appropriateness [54]. Functional completeness evaluates the extent to which a system includes all necessary functions to meet defined objectives comprehensively [55]. Similarly, functional correctness ensures that the system generates accurate outcomes aligned with expected results. Further, functional appropriateness assesses how well these functions support users in achieving specific objectives, considering usability and efficiency in task accomplishment [56]. Together, they ensure a system that not only encompasses the required functions but also delivers accurate results and effectively aids users in reaching their goals.
4.1.2. Evaluation
The datasets shown in Table 2 were available in .kml file format and uploaded through the KML data type using the data-uploading function of the prototype. The outputs are depicted in Figure 5, Figure 6, Figure 7, Figure 8, Figure 9, Figure 10, Figure 11 and Figure 12, respectively.
a. Infrastructure
LSDM infrastructure class includes pipeline, ROW, road, well pad, and facilities layers. A brief description of each class’s results is presented below.
i. Facilities
Figure 5 illustrates existing 3D facilities, which were successfully visualized, and their relevant LSDM attributes were displayed on the prototype. In addition to this, to add relevancy, the 2D well pad layer (gray color) was also turned into a layer interface, as shown in Figure 5.
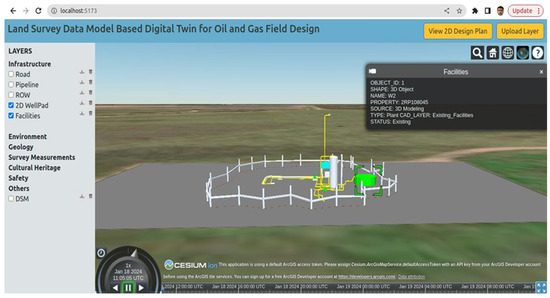
Figure 5.
Demonstration of 3D facilities.
ii. ROW
As illustrated in Figure 6, the 3D ROW color (Cyan) was effectively visualized and its associated LSDM attributes, such as OBJECT ID, SHAPE, LENGTH, PROPERTY, SOURCE, DESCRIPTION, CAD_LAYER, AND STATUS, were successfully displayed in the prototype. In addition to this, using the mouse scroll bar wheel, a 3D view was visualized, as shown in Figure 6 (3D view).
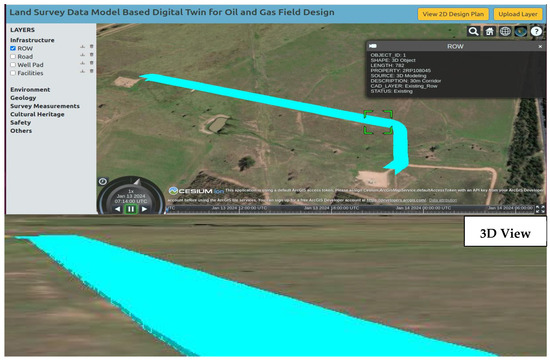
Figure 6.
Demonstration of 3D ROW.
iii. Roads
The 3D roads were effectively visualized into a prototype, and relevant attributes were precisely displayed, as demonstrated in Figure 7. Similarly, using the mouse scroll bar wheel, a 3D view of the proposed (blue) and existing (orange) roads were interactively zoomed in and zoomed out, as shown in Figure 7.
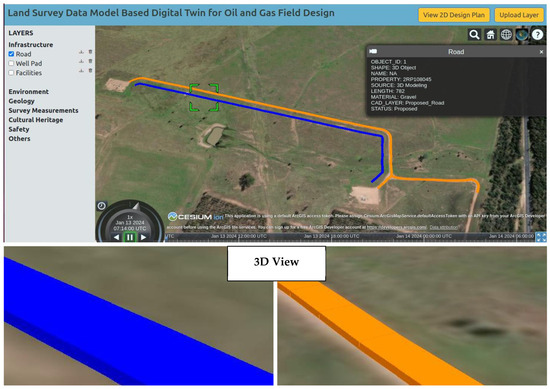
Figure 7.
Demonstration of 3D roads.
iv. Pipelines
The visualization of the pipelines is illustrated in Figure 8. The relevant attributes of existing pipelines (orange), such as OBJECT ID, SHAPE, LENGTH, PROPERTY, SOURCE, LENGTH, MATERIAL, DIAMETER, DEPTH, CAD_LAYER, and STATUS are displayed in Figure 8. Similarly, in Figure 9, pink represents the proposed 3D pipeline.
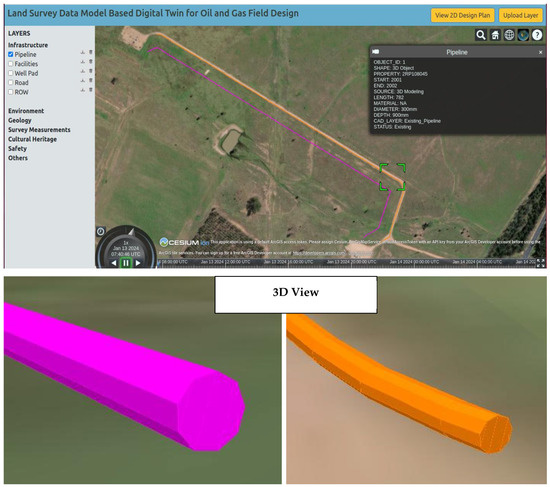
Figure 8.
Demonstration of 3D pipelines.
v. Well Pads
The well pad data, provided in .kml file format, were effectively uploaded into the prototype using the KML data type through the data uploading function. The 3D visualization of the well pads is presented in Figure 10, where the features were accurately rendered. Additionally, the relevant LSDM attributes associated with the well pads were successfully displayed in the prototype.
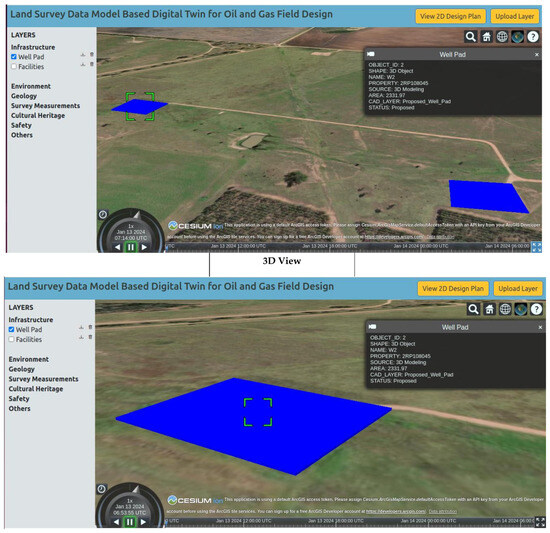
Figure 9.
Demonstration of 3D well pad.
b. Environment (Habitat Area)
Habitat area falls under the environment category in LSDM. The 3D habitat area of the study area was accurately uploaded, and their relevant attributes, such as OBJECT ID, SHAPE, NAME, DENISTY, and SOURCE, were successfully displayed in the prototype, as shown in Figure 10. Also, the habitats’ branches are represented in green, while streams are depicted in brown in Figure 10 to provide natural habitat characteristics.
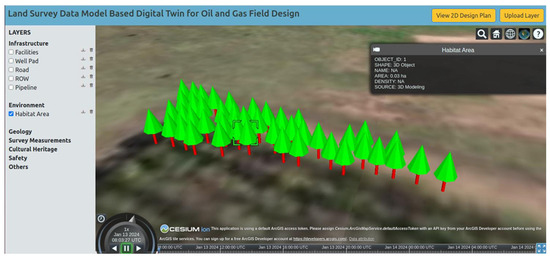
Figure 10.
Demonstration of habitat area.
c. Survey Measurements and Others
The point cloud data, provided in .las file format, was uploaded to the Cesium Ion platform and integrated into the prototype using the corresponding Asset ID (2330619) from the Cesium database. The 3D point clouds were successfully stored and visualized under the survey measurement class, as demonstrated in Figure 11. Similarly, the digital surface model (DSM), generated from the UAV survey and provided in .tif format, was effectively uploaded using the raster data type. It was categorized and displayed under the ‘Other’ layer within the prototype, as illustrated in Figure 12.
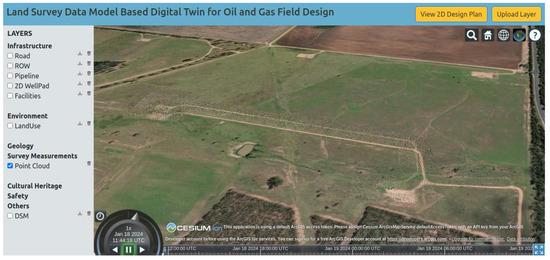
Figure 11.
Demonstration of 3D point clouds.
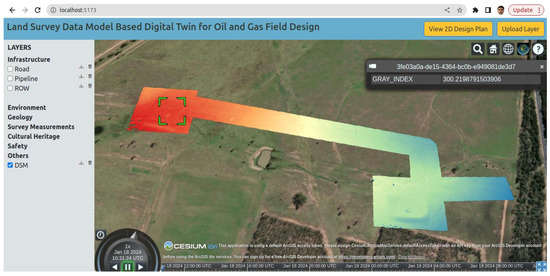
Figure 12.
Demonstration of DSM.
4.1.3. Reflection
The developed prototype is capable of successfully performing the tasks, as demonstrated in Section 4.1.2. Additionally, the LSDM-based attributes, such as OBJECT ID, SHAPE, CAD_LAYER, LENGTH, and SOURCE [6], of the associated 3D spatial data of the infrastructure design are successfully populated while clicking on the 3D object. This demonstrates an effective integration of semantic information within the 3D virtual environment, which ultimately supports further spatial queries and enables collaboration among various field design stakeholders. Moreover, this also ensures the integration between the 3D spatial and design datasets effectively. Therefore, it enhances the spatial digital twin capability, which aids informed decision making and effective management of field design assets.
4.2. Performance Efficiency
4.2.1. Definition
This parameter is defined through three key criteria that include time performance, resource utilization, and capacity [57]. Time performance measures how well a system meets requirements in terms of response time, processing speed, and throughput rates while executing its functions [58]. Similarly, resource utilization evaluates how effectively a system utilizes various resources in quantity and type while carrying out its functions to meet specified requirements [51]. Finally, capacity assesses how well the system meets stipulated requirements concerning its maximum thresholds or limits for specific parameters.
4.2.2. Evaluation
To evaluate performance efficiency, the developed prototype was compared with a similar existing DT platform (Digital Twin Victoria; DTV). The comparison was made based on the three pre-defined criteria (rendering time, resource utilization, and capacity) as outlined in the definition section above.
- Rendering Time
The rendering time performance of Digital Twin Victoria (DTV) and the prototype was assessed using eight 3D datasets, which are shown in Table 3. It showed that both spatial digital twin systems showed similar rendering capabilities across most datasets. The weight was proportionally distributed across each 3D dataset based on the size (KB). The statistical analysis revealed that the mean rendering time was slightly higher for the prototype (9.82 s), compared to DTV (9.2 s), as shown in Table 4. However, when we weighed by dataset size, the weighted mean rendering time for the prototype (26.5) was also higher than that of DTV (22.7), primarily due to larger rendering times in point cloud and digital surface model datasets. The two paired t-tests were conducted for raw rendering times and weighted rendering times. The obtained p-value was 0.469 for rendering time, indicating no statistically significant difference between systems. Furthermore, for weighted rendering times, the obtained p-value was 0.179, suggesting a moderate difference but still not significant under the traditional benchmark p-value (p < 0.05) [59]. Therefore, it can be concluded that the overall rendering performance of the prototype is comparable to that of DTV, with no significant differences observed across the tested 3D datasets. Minor variations are present, particularly in larger datasets, but they are not statistically meaningful.
Table 3.
Rendering time data source [15].
Table 4.
Summary of statistical results (mean, weighted mean, t-test).
- b.
- Resource Utilization and Capacity
Both the prototype and DTV were developed based on open-source libraries such as Geoserver, Cesium Ion, and PostgreSQL. Similarly, in terms of capacity, the prototype can visualize the 3D datasets relevant to field design activities, specifically tailored for specific O & G projects, utilizing LSDM attributes. This domain-specific capability is significantly important. However, the DTV is more focused on broader applications within the built environment and the public sector infrastructure. The prototype can store a maximum of 5 GB of datasets through a Cesium Ion free subscription. However, DTV can manage and display a wide range of data layers, such as cadastre, transportation, railways, and land administration, reflecting its focus on urban-scale spatial planning and governance.
4.2.3. Reflection
The preceding assessment indicates that the developed prototype performs well across all three criteria: rendering time, resource utilization, and capacity. However, it has been identified that 5 GB is quite inadequate for the scalability of the prototype. Thus, further improvements, such as enhancing storage capacity and scalability, are recommended.
4.3. Compatibility
4.3.1. Definition
Compatibility is explained as the extent to which a system is capable of both sharing information with other systems and executing its intended functions within a common hardware or software environment [27]. This attribute consists of the two key underlying criteria that include co-existence and interoperability [51]. Co-existence refers to the level at which a system maintains efficient functionality while sharing resources and an environment with other systems without causing any negative impact on those other systems [60]. Interoperability, on the other hand, signifies the extent to which multiple systems can effectively exchange information and utilize the exchanged information for their respective purposes [54].
4.3.2. Evaluation
To evaluate the compatibility, the developed prototype was compared with the Digital Twin Victoria (DTV), based on two key criteria: co-existence and interoperability.
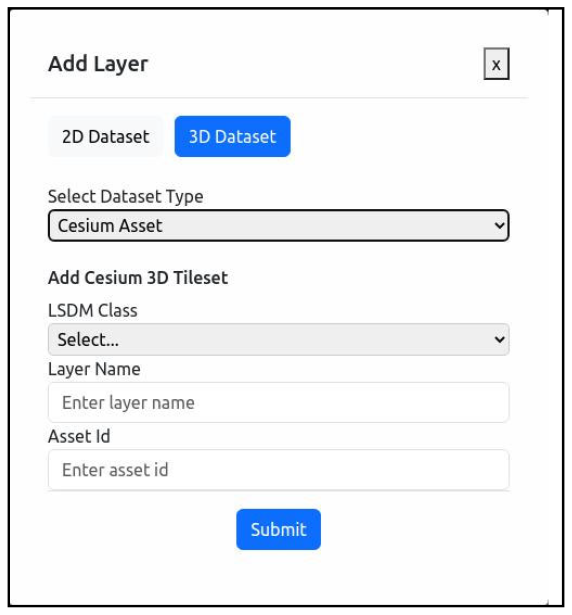
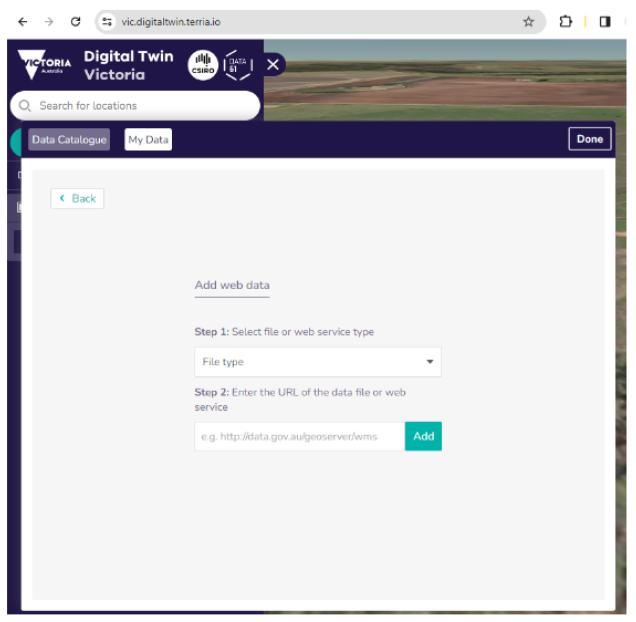
In terms of co-existence, DTV demonstrates the ability to access and visualize the datasets from external sources via direct URL links, whereas the prototype can store the datasets on Cesium Ion through Asset ID, as presented in Table 5. In the context of interoperability, both the prototype and DTV are capable of accessing and rendering various 3D data formats that are supported by Cesium Ion. This ensures the ability to store and visualize diverse 3D objects, regardless of their source formats, facilitating integration within different digital twin ecosystems.
Table 5.
Data uploading interface of the prototype and Digital Twin Victoria (DTV).
4.3.3. Reflection
The above assessment signifies that the prototype is compatible while assessing with DTV, as the prototype shares the same capability as DTV in terms of accessing and rendering various 3D data formats supported by Cesium Ion.
4.4. Usability
4.4.1. Definition
The definition of usability is the extent to which a system, within a specified context of use, enables specified users to achieve predefined goals with effectiveness, efficiency, and satisfaction [60]. This parameter comprises criteria which include appropriateness, learnability, operability, user error protection, user interface aesthetics, and accessibility [57]. The definitions of each criterion are illustrated in Table 6.
Table 6.
Definitions of appropriateness (Ap), learnability (L), operability (O), user error protection (UEP), user interface aesthetics (UIA), and accessibility (Ac).
4.4.2. Evaluation
To evaluate the usability, the prototype was assessed against the six criteria outlined above. Firstly, it could certainly be stated that the prototype is appropriate for the field design process of the O & G project and was developed focusing on a specific industry- standard LSDM. Therefore, the prototype is appropriate (Ap) and has good learnability (L). Secondly, the prototype only contains the datasets that are specifically relevant to the O & G project. For instance, DTV entails a large set of the built environment, cadastre, and urban planning datasets, which might not be useful for the field design process. Therefore, the prototype is simple to operate (O) in the context of the O & G project. Following this, the user interface aesthetics (UIA) of the prototype are decent. It contains 3D zoom-in/zoom-out functionalities, 3D format selection, and an LSDM class section. Further, accessibility (Ac) can be easily enhanced by hosting it on a cloud/web server. In addition to this, prototype user error (UEP) was not directly validated, as it is in a beta version. Perhaps the use of open-source libraries such as CesiumJS, GeoServer, and PostgreSQL inherently supports a degree of error protection. These libraries enforce the datasets’ schema constraints and confirm data requests. Thus, it can be concluded that the prototype supports a basic level of user protection at the beta version stage.
4.4.3. Reflection
The above assessment signifies that the prototype is less polished and requires enhancements in the user interface, web hosting, and real-time support (4D datasets). Further, the prototype also needs to offer error prompts, onboarding features, and user-centric feedback for the O & G stakeholders.
4.5. Reliability
4.5.1. Definition
The extent to which a system fulfills specific functions within predefined conditions and over a specified duration is referred to as its reliability [27]. This parameter can be assessed by maturity, availability, fault tolerance, and recoverability [55]. The level to which a system satisfies reliability requirements during regular operation is defined as maturity. Similarly, availability can be defined as the extent to which a system is available and accessible as needed for its intended use [60]. The degree to which a system continues to function according to its intended design despite the existence of hardware or software faults is termed fault tolerance [56]. Further, the level at which a system, when facing an interruption or failure, can retrieve the affected data and restore the system to its desired state is known as recoverability [27].
4.5.2. Evaluation
To evaluate the reliability of the prototype, it was again compared with the Digital Twin Victoria (DTV) using the criteria that include maturity, availability, fault tolerance, and recoverability. In terms of maturity, the prototype is mature within the scope of the study. However, DTV is better in terms of maturity, as it is developed through a government-funded project and encompasses various functionalities, such as georeferencing capabilities, access control, etc. The prototype can perform the specific required functions (visualization of the 3D object based on LSDM). In terms of availability, the Victoria models might not be very reliable in the future, and it is not open to the public. For instance, there was a similar DT platform (QLD DT) which is no longer accessible to the public. It is uncertain how long these government-funded projects will be accessible to the public. On the other hand, the prototype cannot be accessed against the availability, as it is limited to the local server. In terms of fault tolerance and recoverability, the existing DTV has a data backup system in case of system faults/system crashes. The prototype is also capable of backing up the datasets in localhost.
4.5.3. Reflection
The above assessment implies that the prototype is reliable within the scope of the study because it can perform the core field design functionalities based on LSDM. However, the prototype is still in a beta version/immature, compared with the DTV, which was developed by a government-funded project. The key recommendations are to deploy the prototype into a web/cloud server, implement backups, and restore workflows. In addition to this, it is recommended that prototype maturity should be gradually increased through integrating the version control, access permissions, and session recovery.
4.6. Security
4.6.1. Definition
This parameter signifies the extent to which a system safeguards information and data, ensuring appropriate access levels based on authorization types and levels [27]. The parameter needs to be assessed through confidentiality, integrity, non-repudiation, accountability, and authenticity, as illustrated in Table 7.
Table 7.
Sub-criteria of the security parameters and their definitions.
4.6.2. Evaluation
This parameter is typically evaluated when a system is released to the market for real-world business applications. In this study, the system under consideration is a beta version of the prototype. Nevertheless, the security parameter was assessed based on the capabilities of the underlying libraries, including PostgreSQL, Cesium Ion, and GeoServer. With regard to integrity, PostgreSQL enforces data structure constraints, while GeoServer allows for the restriction of access to specific layers. However, in terms of non-repudiation, the prototype does not currently provide audit trails or logging services. Additionally, the system uses default or shared access credentials, lacking user-specific roles or an integrated authentication mechanism. Furthermore, there is no implementation of token-based verification, as the prototype is currently hosted on a local server.
4.6.3. Reflection
To strengthen the security of the prototype, several improvements are recommended. Firstly, implementing role-based access control and row-level security in PostgreSQL, alongside restricting data access in GeoServer, would enhance data integrity and prevent unauthorized modifications. Enabling pgAudit in PostgreSQL and activating request logging in GeoServer are crucial steps to support non-repudiation, allowing system administrators to trace user actions effectively. To ensure accountability, the system should adopt individual user logins and integrate authentication protocols such as LDAP or OAuth2. Moreover, authenticity can be significantly improved by hosting the system over HTTPS with a CA-signed SSL certificate and introducing JWT tokens for secure user session management. Finally, incorporating user error protection mechanisms, such as confirmation prompts for critical actions, input validation, and undo functionality, will safeguard against accidental user errors and enhance overall system usability.
4.7. Maintainability
4.7.1. Definition
This parameter denotes the level of effectiveness and efficiency in modifying, correcting, or adapting a system to enhance its performance or align it with changes in the environment and evolving requirements [51]. It encompasses several criteria, which are modularity, reusability, analyzability, modifiability, and testability [27]. The criteria are illustrated in Table 8.
Table 8.
Sub-criteria of the maintainability parameters and their definitions.
4.7.2. Evaluation
The developed prototype was assessed with the above-mentioned criteria. In the context of modularity, the developed prototype has discrete components, such as a database management system, map server, and visualization components, which are independently handled through the backend and frontend systems. Similarly, in the context of reusability and modifiability, the prototype developed through this study can be easily replicated and modified by other oil and gas companies, and the prototype can be enhanced as per their requirements in the field design process, as it is specifically designed for this purpose. Similarly, analyzability and testability are the criteria that need to be assessed when the prototype is tested across the stakeholders of the field design process of the O & G project.
4.7.3. Reflection
To enhance the maintainability of the developed prototype, several improvements are recommended. First, although the system demonstrates a modular structure with distinct components, such as the database, map server, and visualization engine, it is essential to provide comprehensive technical documentation and standardized interfaces (e.g., APIs) to support integration, troubleshooting, and future enhancements. Second, while the prototype shows potential for reuse in similar oil and gas projects, its reusability can be improved by generalizing components to accommodate broader field design or geospatial applications within the O & G projects. Furthermore, as analyzability and testability have not yet been evaluated, it is crucial to engage end-users and stakeholders in formal testing phases. This will help to identify usability issues, functional limitations, and maintenance concerns at an early stage. Additionally, the prototype should incorporate error-logging, performance monitoring, and automated testing frameworks to support diagnostic activities and ensure long-term system sustainability.
4.8. Portability
4.8.1. Definition
The degree of effectiveness and efficiency with which a system can be shifted from one hardware, software, or operational environment to another is called explanation [27]. This characteristic encompasses adaptability, ‘installability’, and replaceability [58].
The extent to which a system can be efficiently and effectively adjusted to suit diverse or changing hardware, software, or operational environments is called adaptability [57]. Similarly, ‘installability’ is the level of effectiveness and efficiency in successfully installing and/or uninstalling a system within a specified environment [27]. The degree to which a system can replace another specified software for the same purpose within the same operational environment is called replaceability [55].
4.8.2. Evaluation
In terms of adaptability and replaceability, the developed prototype can be easily deployed to the O & G field design project context to store the 3D spatial data of the infrastructure designs. For instance, independent prototypes such as Digital Twin Victoria (DTV) are primarily focused on urban planning and spatial data management [61]. In contrast, our prototype is specifically tailored to support oil and gas projects, with a particular emphasis on field design processes. The developed prototype is based on LSDM attributes; therefore, it can exactly replace the current 2D spatial information system that is currently used in the field design process of the O & G project. As this is a web-based model, the ‘installability’ is not relevant in this context.
4.8.3. Reflection
While the prototype demonstrates strong adaptability within the oil and gas field design context, its applicability to other domains (construction of O & G fields) remains untested, limiting broader adaptability. Although installability is considered irrelevant due to its web-based nature, providing alternative deployment options, such as containerized or offline versions, would enhance its practicality in varied environments. Addressing these aspects will improve the overall portability and deployment flexibility of the prototype.
4.9. Results Validation Using MCDA AHP Approach
To support the above results, further validation was carried out between the prototype and Digital Twin Victoria (DTV), based upon all eight metrics of ISO/IEC 25010. The further validation process was based upon the MCDA-AHP approach [62].
4.9.1. Determine Criteria Weights
The scoring was calculated based on the judgements carried out between Section 4.1, Section 4.2, Section 4.3, Section 4.4, Section 4.5, Section 4.6, Section 4.7 and Section 4.8 using Saaty’s fundamental scale [63]. The fundamental scales are extremely strong (9), very strong (7), strong (5), moderate (3), equal (1), and reverse (1/3, 1/5, 1/7, 1/9).
4.9.2. Pairwise Comparison and Normalized Matrix
The prepared pairwise comparison matrix and normalized matrix are shown in Table 9a,b.
Table 9.
(a). Pairwise comparisons of all eight metrices using Saaty’s fundamental scale. (b). Normalized matrix of all eight criteria prepared for calculating consistency ratio.
4.9.3. Calculating Consistency
λmax = consistency vector/8 = 8.6515
CI = = 0.0931. As the CR value is ≤0.1, that signifies that the judgements that have been carried out throughout Section 4.1, Section 4.2, Section 4.3, Section 4.4, Section 4.5, Section 4.6, Section 4.7 and Section 4.8 are consistent and valid.
5. Discussion
The comparative evaluation between Digital Twin Victoria (DTV) is shown in Table 10, and the developed prototype demonstrates that the prototype performs well across several key criteria. In terms of functional suitability, the prototype exhibits commendable completeness, achieving a performance comparable to that of DTV. Regarding performance efficiency, although the prototype’s weighted means rendering time (26.5 s) is slightly higher than DTV’s (22.7 s), statistical analysis using a t-test indicates no significant difference, suggesting that both systems offer similar rendering capabilities. Both platforms score highly on compatibility, with the prototype effectively supporting a variety of 3D datasets, although its integration scope is narrower compared to DTV’s broader system compatibility. The usability of the prototype is rated as moderate, reflecting a less polished interface compared to DTV’s sophisticated user experience, which can be attributed to the prototype’s beta development status. In terms of reliability, the prototype currently exhibits stability issues, such as occasional crashes, highlighting its early-stage development, while DTV remains stable and robust. The security aspect reveals a notable gap, with the prototype providing only basic security features, in contrast to the higher security standards implemented in DTV. Regarding maintainability, the prototype is rated moderately; it benefits from agility and adaptability but lacks the structured support and maturity associated with the government-backed DTV. Lastly, the prototype excels in portability, offering easier deployment within oil and gas projects, whereas DTV has a moderate rating reflective of its focus on broader urban applications. In summary, the prototype represents a promising, domain-specific solution with competitive functional and performance attributes. However, it requires further enhancement, particularly in reliability, security, and usability, to attain the maturity and robustness exhibited by established platforms such as DTV.
Table 10.
Summary of the comparison synthesis table between DTV and the prototype.
Similarly, the quality of this study can be evaluated through the strengths, weaknesses, opportunities, and threats (SWOT) model, as demonstrated by [57] in their study in the context of BIM for landscape design, with a focus on climate adaptation planning. Firstly, the key strength of this study lies in its novel methodological contribution and the integration of informed argument and the ISO/IEC 25010 model to evaluate the spatial digital twin in regulated, resource-constrained projects. This methodological innovation addresses the current research gap, where most of the existing research approaches have explored case studies or survey methods to validate the digital twin or its related technologies, which are high cost, time consuming, and require extensive resources. However, the scope of this research is confined to the O and G field design context. While this focus enhances the internal validity of findings, it limits the generalizability across other domains. This limitation also presents a significant opportunity. Future research may apply the same approach to adjacent domains, such as BIM, 3D land administration, and smart infrastructure planning, which could enhance its reliability. A potential threat of this study is that the results generated from this research have not been compared with other established empirical methods, such as stakeholder interviews or large-scale surveys. As suggested by [64] in case study research design, triangulation of data sources enhances construct validity. Incorporating such methods in future studies would improve the overall credibility of the findings. This study contributes to a growing body of knowledge that seeks to embed rigorous evaluation standards, such as those in ISO/IEC 25010, into the assessment of emerging digital twin technologies in a complex domain.
6. Conclusions and Future Work
This study explored the feasibility of the informed argument method to assess the spatial digital twin (prototype) of O & G projects where there are limitations in resources and data accessibility. The developed prototype was assessed across eight key quality dimensions and benchmarked against Digital Twin Victoria (DTV), and results were further validated using Analytic Hierarchy Process (AHP) weights and structured comparisons. The results reveal that the prototype achieves a high level of functional suitability, with comparable performance to DTV. Although the prototype exhibited a slightly higher rendering time, t-test results confirmed no statistically significant difference, indicating similar performance efficiency. Furthermore, the prototype performs well in compatibility and portability, demonstrating strong potential for deployment in domain-specific environments, such as O & G and mining projects. However, the evaluation also highlights key limitations. In its current beta version, the prototype presents lower performances in usability, security, and reliability, primarily due to limited polish, basic authentication mechanisms, and occasional system crashes.
The quality of this study was evaluated using a SWOT framework. The key strength lies in its methodological novelty and the integration of informed argument with the ISO/IEC 25010 model suitable for resource-constrained and regulated environments. This addresses a clear gap in current literature, where digital twin validation often depends on high-cost, resource-intensive methods such as extensive surveys or empirical trials. However, this study is limited to a single case in the O & G sector, which constrains the generalizability of the results.
The results of this study are limited to a case study that was carried out on the specific spatial digital twin beta version prototype and its associated 3D spatial datasets. Furthermore, this research only compared the prototype to Digital Twin Victoria. In addition to this, final validation of digital twins has not been performed using traditional geodetic methods to confirm their accuracy and reliability in the real world. The results generated from this research mostly focused on the ISO/IEC 2510 criterion through the informative argument method. Nonetheless, the results generated from this study are limited to single users. Therefore, to further validate the results obtained from this study, other additional reliable and expensive methods, such as interviewing the subject matter experts (SMEs), could be employed. This evaluation approach adds value to the reliability of the developed approach through this study and ensures a genuine business perspective for further enhancements of the prototype. The main contribution of this study lies in its development and application of a cost-effective methodology for assessing spatial digital twin models under a complex, regulated, industrial context, with limitations in resources and data accessibility.
Author Contributions
Conceptualization, Sijan Bhandari and Dev Raj Paudyal; methodology, Sijan Bhandari and Dev Raj Paudyal; software, Sijan Bhandari; investigation, Sijan Bhandari; data collection, processing, analysis, and visualization, Sijan Bhandari and Dev Raj Paudyal; writing—original draft preparation, Sijan Bhandari; writing—review and editing, Dev Raj Paudyal; supervision, Dev Raj Paudyal; project administration, Dev Raj Paudyal. All authors have read and agreed to the published version of the manuscript.
Funding
This research received no external funding. This research was supported by the Graduate Research School, University of Southern Queensland (UniSQ), and is part of the first author’s HDR project entitled “Spatially enabled digital twin framework for the field design process of oil and gas projects”.
Data Availability Statement
The data supporting the findings of this study are available from the first author upon reasonable request. The data are not publicly available due to privacy restrictions.
Acknowledgments
Authors would like to acknowledge DSQ Land Surveyors for facilitating data accessibility.
Conflicts of Interest
The authors declare no conflicts of interest.
References
- Bist, N.; Panchal, S.; Gupta, R.; Soni, A.; Sircar, A. Digital Transformation and Trends for Tapping Connectivity in the Oil and Gas sector. Hybrid Adv. 2024, 6, 100256. [Google Scholar] [CrossRef]
- Mahmood, Y.; Afrin, T.; Huang, Y.; Yodo, N. Sustainable Development for Oil and Gas Infrastructure from Risk, Reliability, and Resilience Perspectives. Sustainability 2023, 15, 4953. [Google Scholar] [CrossRef]
- Zallaghi, M. An Overview of Upstream Oil and Gas Development and Management; Figshare: London, UK, 2025. [Google Scholar] [CrossRef]
- Zhang, M.; Jia, A.; Lei, Z.; Lei, G. A Comprehensive Asset Evaluation Method for Oil and Gas Projects. Processes 2023, 11, 2398. [Google Scholar] [CrossRef]
- International Association of Oil and Gas Producers. Environmental Management in the Upstream Oil and Gas Industry; IOGP: London, UK, 2022. [Google Scholar]
- International Association of Oil and Gas Producers. Guidelines for Delivery and Use of the Land Survey Data Model; IOGP: London, UK, 2022. [Google Scholar]
- Shell QGC. Constraints Planning and Field Development Protocol Surat Basin Acreage, 2017. Available online: https://www.shell.com.au/about-us/projects-and-locations/qgc/environment/environment-management/management-plans/_jcr_content/root/main/section/list_copy_copy_13212_2054867076/list_item.multi.stream/1715106729713/0f5351df780294e296ceee110becb05955d6725d/sbad-constraints.pdf (accessed on 30 June 2025).
- Meza, E.B.M.; Souza, D.G.B.d.; Copetti, A.; Sobral, A.P.B.; Silva, G.V.; Tammela, I.; Cardoso, R. Tools, Technologies and Frameworks for Digital Twins in the Oil and Gas Industry: An In-Depth Analysis. Sensors 2024, 24, 6457. [Google Scholar] [CrossRef]
- World Geospatial Industry Council. Spatial Digital Twins: Global Status, Opportunities, and the Way Forward; WGIC: Amersfoort, The Netherlands, 2022. [Google Scholar]
- Staiger, R. The Surveyor 4.0. Available online: https://www.gim-international.com/content/article/the-surveyor-4-0 (accessed on 5 March 2025).
- Gerardino, K.A. The Role of Digital Twins in Transforming the Oil & Gas Industry. Available online: https://oilgastechnology.com/market-overview/89257-the-role-of-digital-twins-in-transforming-the-oil-gas-industry?utm_source=chatgpt.com (accessed on 25 March 2025).
- Technavio. Digital Twin Market Analysis North America, Europe, APAC, Middle East and Africa, South America-US, Germany, UK, Japan, Canada-Size and Forecast 2025–2029. Available online: https://www.technavio.com/report/digital-twin-market-size-industry-analysis (accessed on 30 June 2025).
- Hexagon. The Digital Twin Industry Report. Available online: https://www.calameo.com/read/001915796155d0c494c32?authid=L8cWi6laffjB (accessed on 30 June 2025).
- Wanasinghe, T.R.; Wroblewski, L.; Petersen, B.K.; Gosine, R.G.; James, L.A.; Silva, O.D.; Mann, G.K.I.; Warrian, P.J. Digital Twin for the Oil and Gas Industry: Overview, Research Trends, Opportunities, and Challenges. IEEE Access 2020, 8, 104175–104197. [Google Scholar] [CrossRef]
- Bhandari, S.; Paudyal, D.R.; Chadalavada, S. Spatial Digital Twin Architecture for the Field Design Process of Oil and Gas Projects in Australia. Land 2024, 13, 902. [Google Scholar] [CrossRef]
- Al-Hajri, A.; Abdella, G.M.; Al-Yafei, H.; Aseel, S.; Hamouda, A.M. A Systematic Literature Review of the Digital Transformation in the Arabian Gulf’s Oil and Gas Sector. Sustainability 2024, 16, 6601. [Google Scholar] [CrossRef]
- González-Herbón, R.; González-Mateos, G.; Rodríguez-Ossorio, J.R.; Domínguez, M.; Alonso, S.; Fuertes, J.J. An Approach to Develop Digital Twins in Industry. Sensors 2024, 24, 998. [Google Scholar] [CrossRef]
- Dani, A.A.H.; Supangkat, S.H.; Lubis, F.F.; Nugraha, I.G.B.B.; Kinanda, R.; Rizkia, I. Development of a Smart City Platform Based on Digital Twin Technology for Monitoring and Supporting Decision-Making. Sustainability 2023, 15, 14002. [Google Scholar] [CrossRef]
- Iliuţă, M.-E.; Moisescu, M.-A.; Pop, E.; Ionita, A.-D.; Caramihai, S.-I.; Mitulescu, T.-C. Digital Twin—A Review of the Evolution from Concept to Technology and Its Analytical Perspectives on Applications in Various Fields. Appl. Sci. 2024, 14, 5454. [Google Scholar] [CrossRef]
- Saravanos, A.; Curinga, M.X. Simulating the Software Development Lifecycle: The Waterfall Model. Appl. Syst. Innov. 2023, 6, 108. [Google Scholar] [CrossRef]
- Lahti, M.; Nenonen, S. Design Science and Co-Designing of Hybrid Workplaces. Buildings 2021, 11, 129. [Google Scholar] [CrossRef]
- Huseynli, M.; Bub, U.; Ogbuachi, M.C. Development of a Method for the Engineering of Digital Innovation Using Design Science Research. Information 2022, 13, 573. [Google Scholar] [CrossRef]
- Johannesson, P.; Perjons, E. An Introduction to Design Science; Springer: Cham, Switzerland, 2021. [Google Scholar]
- Kang, K.; Besklubova, S.; Dai, Y.; Zhong, R.Y. Building Demolition Waste Management Through Smart BIM: A Case Study in Hong Kong. Waste Manag. 2022, 143, 69–83. [Google Scholar] [CrossRef] [PubMed]
- Pan, Y.; Zhang, L. A BIM-Data Mining Integrated Digital Twin Framework for Advanced Project Management. Autom. Constr. 2021, 124, 103564. [Google Scholar] [CrossRef]
- Atazadeh, B. Building Information Modelling for Urban Land Administration; Academia: San Francisco, CA, USA, 2017. [Google Scholar]
- ISO/IEC 25010; ISO 2500 Software and Data Quality. International Standard Organisation: Geneva, Switzerland, 2023. Available online: https://iso25000.com/index.php/en/iso-25000-standards/iso-25010 (accessed on 3 March 2025).
- VIVA Energy Australia. Pipeline Consultation Plan Proposed Gas Terminal Pipeline; VIVA Energy Australia: Melbourne, Australia, 2021. [Google Scholar]
- Watson, P.; Gibson, D.; Hanney, N.; Rushforth, P.; Smith, S.; Walsh, C.; Workman, G. Surveying and Engineering: Principles and Practice, 1st ed.; Wiley-Blackwell: Hoboken, NJ, USA, 2008. [Google Scholar]
- Kim, M.-H.; Lee, E.-B.; Choi, H.-S. Detail Engineering Completion Rating Index System (DECRIS) for Optimal Initiation of Construction Works to Improve Contractors’ Schedule-Cost Performance for Offshore Oil and Gas EPC Projects. Sustainability 2018, 10, 2469. [Google Scholar] [CrossRef]
- Rajabifard, A.; Sabri, S.; Chen, Y. Digital Twin for the Next Generation of Urban Land Administration and 3D Spatial Planning. In Proceedings of the FIG Congress 2022; Volunteering for the Future-Geospatial Excellence for a Better Living, Warsaw, Poland, 11–15 September 2022. [Google Scholar]
- Piras, G.; Agostinelli, S.; Muzi, F. Digital Twin Framework for Built Environment: A Review of Key Enablers. Energies 2024, 17, 436. [Google Scholar] [CrossRef]
- Wang, Q.; Huang, B.; Gao, Y.; Jiao, C. Current Status and Prospects of Digital Twin Approaches in Structural Health Monitoring. Buildings 2025, 15, 1021. [Google Scholar] [CrossRef]
- ANZLIC. Principles for Spatially Enabled Digital Twins of the Built and Natural Environment in Australia; ANZLIC: Symonston, Australia, 2019. [Google Scholar]
- Venable, J.; Pries-Heje, J.; Baskerville, R. A Comprehensive Framework for Evaluation in Design Science Research. In Proceedings of the Design Science Research in Information Systems. Advances in Theory and Practice, Berlin, Heidelberg, 14–15 May 2012; pp. 423–438. [Google Scholar]
- Tang, Z.; Zhuang, D.; Zhang, J. Evaluation Framework for Domain-Specific Digital Twin Platforms. Sci. Rep. 2025, 15, 10544. [Google Scholar] [CrossRef]
- Fawad, M.; Salamak, M.; Chen, Q.; Uscilowski, M.; Koris, K.; Jasinski, M.; Lazinski, P.; Piotrowski, D. Development of Immersive Bridge Digital Twin Platform to Facilitate Bridge Damage Assessment and Asset Model Updates. Comput. Ind. 2025, 164, 104189. [Google Scholar] [CrossRef]
- Khalifa, F.; Marzouk, M. Integrated Blockchain and Digital Twin Framework for Sustainable Building Energy Management. J. Ind. Inf. Integr. 2025, 43, 100747. [Google Scholar] [CrossRef]
- Yang, S.-W.; Lee, Y.; Kim, S.-A. Design and Validation of a Real-Time Maintenance Monitoring System Using BIM and Digital Twin Integration. Buildings 2025, 15, 1312. [Google Scholar] [CrossRef]
- Broekhuizen, M.; Kalogianni, E.; Oosterom, P.v. BIM/IFC as Input for Registering Apartment Rights in a 3D Land Administration Systems—A Prototype Webservice. Land Use Policy 2025, 148, 107368. [Google Scholar] [CrossRef]
- Cao, P.; Cao, Z.; Huang, D.; Wang, J. Hybrid Model for BIM Application Maturity in Prefabricated Buildings: A Case Study in Xi’an, China. Buildings 2025, 15, 1322. [Google Scholar] [CrossRef]
- Hu, J.; Lv, Z.; Yuan, D.; He, B.; Chen, W.; Ye, X.; Li, D.; Yang, G. A Spatiotemporal Intelligent Framework and Experimental Platform for Urban Digital Twins. Virtual Real. Intell. Hardw. 2023, 5, 213–231. [Google Scholar] [CrossRef]
- Abdullahi, I.; Longo, S.; Samie, M. Towards a Distributed Digital Twin Framework for Predictive Maintenance in Industrial Internet of Things (IIoT). Sensors 2024, 24, 2663. [Google Scholar] [CrossRef]
- Cemellini, B. Web-Based Visualisation of 3D Cadastre; Delft University of Technology: Delft, The Netherlands, 2018. [Google Scholar]
- Abdullahi, U.I.; Zhang, W.; Cao, Y.; Irankunda, G. Integrating IoT Technology for Fire Risk Monitoring and Assessment in Residential Building Design. Buildings 2025, 15, 1346. [Google Scholar] [CrossRef]
- Hua, Y.; Zhang, Y.; Zhang, S.; Hou, F.; Kang, M. Using Building Information Modeling to Enhance Supply Chain Resilience in Prefabricated Buildings: A Conceptual Framework. Appl. Sci. 2023, 13, 12694. [Google Scholar] [CrossRef]
- Li, Y.; Wei, B.; Wang, X. A Web-Based Visual and Analytical Geographical Information System for Oil and Gas Data. ISPRS Int. J. Geo-Inf. 2017, 6, 76. [Google Scholar] [CrossRef]
- Payyanadan, R.P.; Angell, L.S.; Zeidan, A. A COVID Support App Demonstrating the Use of a Rapid Persuasive System Design Approach. Information 2025, 16, 360. [Google Scholar] [CrossRef]
- Fernandes, D.; Garg, S.; Nikkel, M.; Guven, G. A GPT-Powered Assistant for Real-Time Interaction with Building Information Models. Buildings 2024, 14, 2499. [Google Scholar] [CrossRef]
- Miller, R.; Chan, S.H.M.; Whelan, H.; Gregório, J. A Comparison of Data Quality Frameworks: A Review. Big Data Cogn. Comput. 2025, 9, 93. [Google Scholar] [CrossRef]
- Kato, D.; Ishikawa, H. Quality Control Methods Using Quality Characteristics in Development and Operations. Digital 2024, 4, 232–243. [Google Scholar] [CrossRef]
- Canpolat Şahin, M.; Kolukısa Tarhan, A. Evaluation and Selection of Hardware and AI Models for Edge Applications: A Method and A Case Study on UAVs. Appl. Sci. 2025, 15, 1026. [Google Scholar] [CrossRef]
- Król, K. Retrospective Analysis of Municipal Geoportal Usability in the Context of the Evolution of Online Data Presentation Techniques. ISPRS Int. J. Geo-Inf. 2024, 13, 307. [Google Scholar] [CrossRef]
- Abu Bakar, H.; Razali, R.; Jambari, D.I. A Qualitative Study of Legacy Systems Modernisation for Citizen-Centric Digital Government. Sustainability 2022, 14, 10951. [Google Scholar] [CrossRef]
- Ali, M.A.; Yap, N.K.; Ghani, A.A.A.; Zulzalil, H.; Admodisastro, N.I.; Najafabadi, A.A. A Systematic Mapping of Quality Models for AI Systems, Software and Components. Appl. Sci. 2022, 12, 8700. [Google Scholar] [CrossRef]
- Echeverría, A.; Cevallos, C.; Ortiz-Garces, I.; Andrade, R.O. Cybersecurity Model Based on Hardening for Secure Internet of Things Implementation. Appl. Sci. 2021, 11, 3260. [Google Scholar] [CrossRef]
- Keibach, E.; Shayesteh, H. BIM for Landscape Design Improving Climate Adaptation Planning: The Evaluation of Software Tools Based on the ISO 25010 Standard. Appl. Sci. 2022, 12, 739. [Google Scholar] [CrossRef]
- Al MohamadSaleh, A.; Alzahrani, S. Development of a Maturity Model for Software Quality Assurance Practices. Systems 2023, 11, 464. [Google Scholar] [CrossRef]
- Seneta, E.; Fung, T. The t-Distribution in Financial Mathematics and Multivariate Testing Contexts. J. Risk Financ. Manag. 2025, 18, 224. [Google Scholar] [CrossRef]
- Galli, T.; Chiclana, F.; Siewe, F. On the Use of Quality Models to Address Distinct Quality Views. Appl. Syst. Innov. 2021, 4, 41. [Google Scholar] [CrossRef]
- Victoria State Government. Digital Twin Victoria. Available online: https://www.land.vic.gov.au/maps-and-spatial/digital-twin-victoria (accessed on 1 July 2025).
- Ara, M.A.; Tamanna, M.S.; Ali, M.; Amin, A.; Shabur, M.A. A Hybrid AHP and Statistical Validation Approach for Sustainable Supplier Selection in Apparel Industry. Discov. Sustain. 2025, 6, 538. [Google Scholar] [CrossRef]
- Ponsiglione, A.M.; Amato, F.; Cozzolino, S.; Russo, G.; Romano, M.; Improta, G. A Hybrid Analytic Hierarchy Process and Likert Scale Approach for the Quality Assessment of Medical Education Programs. Mathematics 2022, 10, 1426. [Google Scholar] [CrossRef]
- Yin Robert, K. Case Study Research and Applications: Design and Methods, 6th ed.; SAGE Publications: Thousand Oaks, CA, USA, 2017. [Google Scholar]
Disclaimer/Publisher’s Note: The statements, opinions and data contained in all publications are solely those of the individual author(s) and contributor(s) and not of MDPI and/or the editor(s). MDPI and/or the editor(s) disclaim responsibility for any injury to people or property resulting from any ideas, methods, instructions or products referred to in the content. |
© 2025 by the authors. Published by MDPI on behalf of the International Society for Photogrammetry and Remote Sensing. Licensee MDPI, Basel, Switzerland. This article is an open access article distributed under the terms and conditions of the Creative Commons Attribution (CC BY) license (https://creativecommons.org/licenses/by/4.0/).