Abstract
As geographic information visualization continues to gain prominence, dynamic symbols are increasingly employed in map-based applications. However, the optimal visual coding for dynamic point symbols—particularly concerning encoding type, animation rate, and modulation area—remains underexplored. This study examines how these factors influence user performance in visual search tasks through two eye-tracking experiments. Experiment 1 investigated the effects of two visual coding factors: encoding types (flashing, pulsation, and lightness modulation) and animation rates (low, medium, and high). Experiment 2 focused on the interaction between encoding types and modulation areas (fill, contour, and entire symbol) under a fixed animation rate condition. The results revealed that search performance deteriorates as the animation rate of the fastest target symbol exceeds 10 fps. Flashing and lightness modulation outperformed pulsation, and modulation areas significantly impacted efficiency and accuracy, with notable interaction effects. Based on the experimental results, three visual coding strategies are recommended for optimal performance in map-based interfaces: contour pulsation, contour flashing, and entire symbol lightness modulation. These findings provide valuable insights for optimizing the design of dynamic point symbols, contributing to improved user engagement and task performance in cartographic and geovisual applications.
1. Introduction
With the rapid development of geospatial information systems and visual analytics technologies, map-based visualizations have become essential tools for decision-making across diverse domains, such as smart city management, emergency response, and logistics monitoring. These visualizations facilitate the interpretation of spatial data by enabling users to detect, interpret, and respond to critical information in real time. As the complexity and density of geospatial data increase, the effectiveness of visual coding strategies becomes paramount for ensuring efficient information acquisition and task performance. Among various approaches, dynamic point symbols—which convey information through temporal changes in appearance—have emerged as promising techniques for capturing user attention and enhancing the salience of target elements in dense map interfaces, as illustrated in Figure 1.
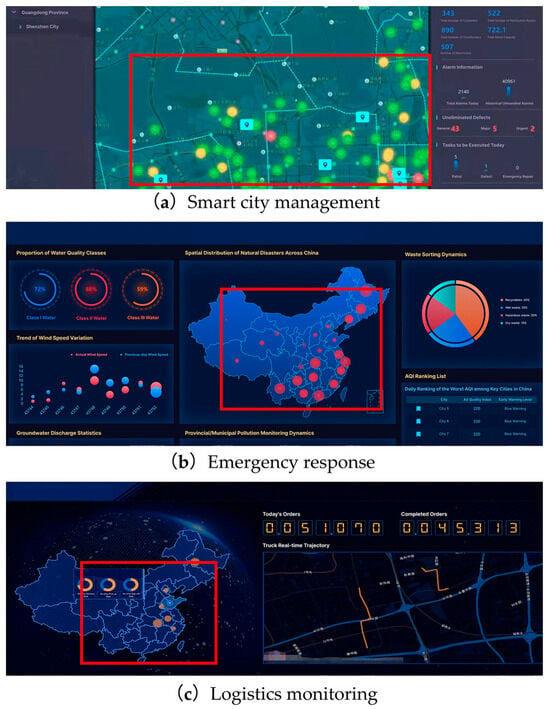
Figure 1.
Examples of dynamic point symbols in map-based visualizations with red boxes highlighting active symbol deployment zones).
Visual coding is pivotal for transmitting information via dynamic point symbols, requiring careful selection of encoding types (visual transformation techniques: pulsation, flashing, and lightness modulation), animation rates (defined by systematic combinations of target and distractor frame rates in fps), and modulation areas (spatial regions of dynamic change: fill, contour, or entire symbol). Appropriate configuration of these parameters enables designers to structure and streamline geographic information, clarify spatial relationships, and ultimately improve map readability and user comprehension [1].
Regarding encoding types, studies have identified multiple dimensions of visual variables, including size, orientation, transparency, color hue, color lightness, and color saturation, each possessing specific attributes suitable for conveying different types of information [2]. Among these variables, size, transparency, and lightness are particularly effective for dynamic symbols due to their ordinal properties and relatively predictable psychophysical scaling, which enable systematic visual coding while accounting for nonlinear perceptual effects (wherein physical stimulus changes yield disproportionate perceptual responses) [3,4]. Building upon these fundamental principles, previous studies have investigated specific dynamic encoding techniques. Cybulski et al. [5] demonstrated that rhythmic size variations in dynamic map symbols were most effective for representing quantitative data. Spalek et al. [6] showed that flashing serves as an effective primitive visual attribute for guiding visual search behavior. Parallel to these discoveries, recent psychophysical studies have advanced the understanding of lightness modulation mechanisms. Masumitsu et al. [7] demonstrated that lightness contrast modulation significantly affects perceptual adaptation in visual processing, while Vinke et al. [8] revealed the contextual dependencies of lightness induction across varying modulation frequencies. Despite these insights, few studies have systematically compared common encoding types (pulsation, flashing, and lightness modulation) within a unified experimental framework to assess their relative impacts on user performance in visual search tasks.
Research on animation rates in dynamic symbol design has produced divergent findings. Cybulski and Krassanakis [9] proposed a velocity distribution spanning a broad range of 10–100 fps, whereas earlier studies indicated that substantially lower rates suffice for effective visual attention capture. Specifically, research on peripheral stimuli demonstrated that rates as low as 2 fps ensure optimal visibility [10], and Tong et al. [11] further showed that low animation rates enhance visual search performance by improving alertness without inducing cognitive overload. Collectively, these results suggest that excessively high animation speeds may impair usability. However, further systematic investigations are warranted to determine the optimal animation rates for different encoding types—pulsation, flashing, and lightness modulation—given their distinct perceptual characteristics.
In terms of the modulation areas of dynamic point symbols, fill and contour represent two critical elements that define a point symbol’s area of interest. Recent advances in cartographic symbol design have increasingly emphasized the equal importance of both fill and contour as fundamental decisions in visual encoding [12]. However, empirical studies have reported divergent findings regarding the perceptual impacts of these components. For instance, Gong et al. [13] found that manipulating symbol fills improves symbol legibility in static contexts, and a subsequent study on animated pictorial symbols revealed that certain encoding types are perceived preattentively [14]. In contrast, Deng et al. [15] demonstrated that icon contours significantly influence visual attention processing, whereas Pisetta et al. [16] reported relatively minor effects resulting from contour variations alone. Additionally, Lai and Yeh [17] found that flashing entire symbols facilitates faster target acquisition, although excessive flashing may induce cognitive overload. Similarly, Cybulski and Krassanakis [9] investigated the effects of different dynamic behaviors of entire point symbols on visual search efficiency in map-based interfaces. Despite these insights, comprehensive investigations into the combined effects of modulation areas and commonly used encoding types in point symbols remain limited. Therefore, this study seeks to examine both the individual and combined roles of modulation areas and encoding types on visual search efficiency and accuracy within map-based visualization interfaces.
The published literature presents a wide range of studies on the use of dynamic point symbols in map-based visualizations. However, research that systematically investigates how specific visual encoding types—such as pulsation, flashing, and lightness modulation—affect users’ visual search efficiency and accuracy remains limited and inconclusive. While some findings suggest that dynamic visual effects can enhance symbol perceptibility, few studies have provided consistent comparisons across different encoding types within a controlled framework. In addition, the influence of animation rate on visual search performance is not yet fully understood, with some studies indicating a relationship between animation rate and attention, while others report inconsistent effects. Moreover, limited attention has been paid to the role of modulation area—whether the dynamic change occurs in the symbol’s fill, contour, or entire symbol—in shaping perceptual salience. These unresolved issues highlight the need for a comprehensive evaluation of how key visual variables interact to affect user performance in visual search tasks involving dynamic point symbols.
The aim of this study is to investigate the effects of encoding type, animation rate, and modulation area of dynamic point symbols on users’ visual search efficiency and accuracy in map-based visualizations. To address this, two within-subjects experiments were conducted. The first experiment explored the combined effects of different encoding types and animation rates on search performance, while the second experiment focused on the influence of modulation areas based on the optimal animation conditions identified earlier. By analyzing both main and interaction effects, this study is expected to deepen the theoretical understanding of visual attention mechanisms in dynamic geovisual contexts and to provide practical guidelines for designing more effective, user-centered map interfaces in time-critical, data-rich environments.
2. Methods
This study employed a two-stage experimental design to systematically isolate temporal and spatial factors in dynamic symbol perception. Experiment 1 focused on evaluating the individual and combined effects of encoding type and animation rate on search efficiency and accuracy. Building on Experiment 1’s finding, Experiment 2 maintained the optimal animation rate to isolate and examine the effects of spatial modulation areas (fill, contour, and entire symbol) on visual search performance. This two-phase approach adheres to rigorous psychophysical methodology, enabling controlled examination of how specific dynamic coding parameters influence search efficiency in map-based visualizations.
As shown in Figure 2, the technical flowchart of the study is as follows:
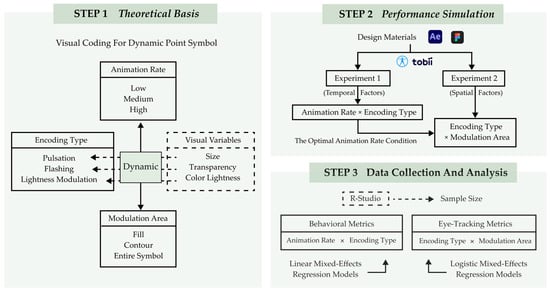
Figure 2.
The technical flowchart of this study.
2.1. Experiment 1: Encoding Type and Animation Rate
2.1.1. Participants
A total of thirty-four participants (5 males, 29 females, aged 18–28 years, M = 23, SD = 1.35) were recruited from the undergraduate student body at Nanjing Forestry University. Given that participants were recruited via campus-wide emails and poster advertisements, the resulting gender imbalance in our sample reflects the overall gender distribution of students enrolled in relevant design and visualization-related majors at the university, which tend to have a higher proportion of female students. All participants had normal or corrected-to-normal vision and reported no color blindness or color deficiency. Furthermore, all participants had prior experience with information visualization map interfaces.
A power analysis was conducted using the “pwr package” in R-studio [18] to ensure that the sample size provided adequate statistical power. Since every participant underwent 120 trials in total, we assumed a large effect size (ηp2 = 0.14 [19]). The achieved power was 0.999, with α = 0.05.
2.1.2. Apparatus
The experiment was conducted on an HP 27-inch monitor with a resolution of 1920 × 1080 pixels. Eye movement data were collected using the Tobii 250 Fusion Eye Tracker, a remote, screen-based eye tracker manufactured by Tobii Pro (Stockholm, Sweden), with a sampling rate of 250 Hz and an accuracy of 0.9°. Both behavioral and eye movement data were recorded using ErgoLAB 3.3.5 software developed by Kingfar Technologies Inc (Beijing, China).
2.1.3. Stimuli
Experiment 1 followed a 3 (encoding type) × 3 (animation rate) within-subjects design. The dynamic point symbols were designed as solid circles with 0.8° visual angle diameter (≈0.8 cm at 60 cm viewing distance). The encoding types encompassed three commonly used animation techniques for point symbols: pulsation, flashing, and lightness modulation. The lightness modulation symbols exhibited continuous changes in color brightness, based on Laar’s experimental results [20]. Three animation rate conditions were employed for the dynamic symbol presentation, adapted from Cybulski and Krassanakis’s study [9]: low animation rate, medium animation rate, and high animation rate, as shown in Figure 3.
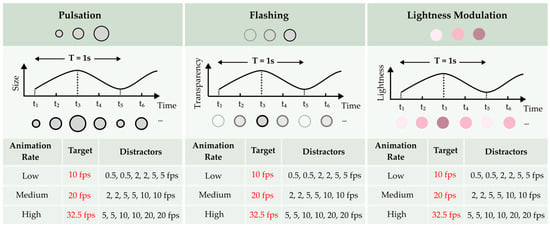
Figure 3.
Stimuli design for Experiment 1.
In each trial, the target symbol was consistently defined as the fastest changing element in the display (e.g., 10 fps in the low animation rate condition), while the six distractor symbols were systematically selected from multiple lower speed values within the corresponding rate category (e.g., for the low animation rate condition, distractors were presented at 0.5 fps, 2 fps, and 5 fps, with two symbols at each velocity), as shown in Figure 4.
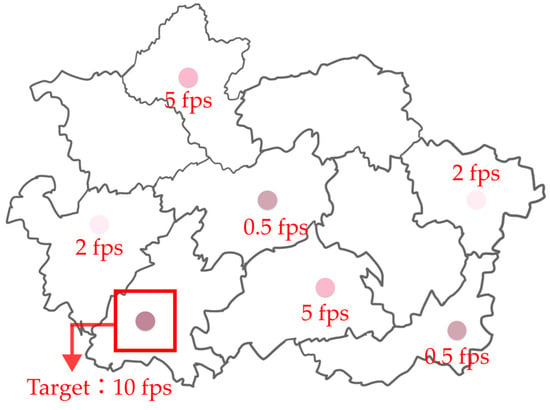
Figure 4.
Sample trial in the low animation rate condition (Experiment 1): lightness modulation target at 10 fps (red box highlighting) among six slower distractors.
Three different maps, which were randomly assigned as backgrounds in the experiment, were designed using Figma (version 116.15.15). The target and distractor symbols were evenly distributed across the map. The display screen was divided into a nine-grid layout, allowing participants to associate each target dynamic point symbol with a corresponding key on the numeric keypad, ensuring precise feedback.
The dynamic variations of the point symbols were created using Adobe After Effects with precisely controlled five-frame animation cycles for all encoding types (pulsation, flashing, and lightness modulation). We use frames per second (fps) to refer to the display refresh rate—that is, the number of frames rendered per second. The animation frequency (in Hz) of an encoding type is then determined by the fps and the number of frames per cycle, according to the formula
The standardized five-frame cycles ensured consistent temporal perception across conditions. For instance, a 10 fps target completed two full cycles per second while maintaining clear motion perception; its actual frequency is 2 Hz. We choose to report fps rather than directly reporting Hz, as fps more directly reflects the technical constraints of animation playback (e.g., display hardware, rendering pipeline) and aligns with common practice in cartographic animation research [9,14,21,22].
2.1.4. Procedure
Each participant was seated comfortably at a desk in a softly lit, soundproofed laboratory, with their gaze aligned with the center of the screen. The distance between the participants’ eyes and the screen was approximately 60 cm, resulting in horizontal and vertical viewing angles of 2.3°. To ensure accurate recording of eye movements throughout the experiment, an eye-tracking calibration procedure was performed. Prior to each session, the system was calibrated using a nine-point procedure to guarantee precise gaze data. The eye tracker was recalibrated at the start of each experiment, and participants’ eye movements were recorded as they performed the visual search task. Participants were instructed to focus on the tasks and were encouraged to take short breaks if they felt fatigued.
Before the formal experiment, participants engaged in a practice session, which included all nine encoding combinations. Experimental instructions were displayed on the monitor to ensure participants understood the task requirements. Each participant then completed an eye calibration before beginning the practice trials. After completing the practice session, participants rested for 30 s before starting the formal experiment.
The formal experiment consisted of a single-target visual search task involving 36 trials, with the 9 coding combinations repeated four times across different maps in a randomized order to counterbalance potential sequence effects, as shown in Figure 5. Each trial began with a fixation point displayed at the center of the screen. Participants were then presented with a randomly selected map for 30,000 ms, containing one target stimulus with the fastest-changing animation rate and six distractor symbols, all using the same encoding type. To minimize visual bias and encourage efficient map exploration, both target and distractor symbols were randomly positioned across nine potential locations on the map: top-left, center-left, bottom-left, top-center, center, bottom-center, top-right, center-right and bottom-right, as illustrated in Figure 6. Participants responded by pressing the corresponding key on the numeric keypad to indicate the location of the target symbol. They were instructed to identify the target symbol as accurately as possible by pressing the corresponding key (numbers 1–9) based on the target’s position. No feedback or answers were provided after each response.

Figure 5.
Flowchart illustrating the procedure for Experiment 1.
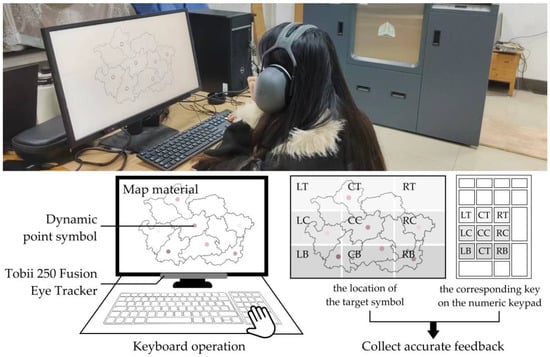
Figure 6.
Experimental scenario of the study.
Each participant completed the experiment in a counterbalanced order, with the experiment lasting approximately 20 min. Participants were compensated with CNY 20 for their participation.
To prevent the potential learning effect [23], the presentation order of conditions was randomized both within and across participants, effectively distributing any learning effects uniformly across all experimental treatments. Furthermore, all the trials in each experiment were divided into two blocks, with a mandatory 30 s break between blocks to mitigate fatigue, ensuring participants maintained optimal concentration throughout the task.
2.2. Experiment 2: Encoding Type and Modulation Area
2.2.1. Participants
The participants in this experiment were the same individuals as those in Experiment 1.
2.2.2. Apparatus
The apparatus used in this experiment was the same as that used in Experiment 1.
2.2.3. Stimuli
Experiment 2 employed a 3 (encoding type) × 3 (modulation area) within-subjects design to investigate how modulation areas influence the perceptual salience of dynamic point symbols under optimal animation conditions, as shown in Figure 7. The three encoding types—pulsation, flashing, and lightness modulation—were consistent with those used in Experiment 1, featuring a consistent contour width with a 0.1° visual angle for contour modulation conditions. Modulation areas referred to different regions within the point symbol where dynamic changes occurred: the symbol’s fill, the symbol’s contour, or the entire symbol. All dynamic symbols were animated at the low animation rate condition (the target animated at 10 fps, while the six distractors comprised two at 0.5 fps, two at 2 fps, and two at 5 fps), which had been identified as the optimal rate for enhancing visual search performance in Experiment 1.

Figure 7.
Stimuli design for Experiment 2.
Each trial presented one target symbol and six distractor symbols on a randomized map background, maintaining the same nine-grid layout as in Experiment 1. The dynamic variations of the symbols were created using Adobe After Effects, ensuring consistency in motion effects across different modulation areas.
2.2.4. Procedure
The procedure for Experiment 2 closely mirrored that of Experiment 1 to maintain methodological consistency. Participants were seated comfortably in a softly lit, soundproofed laboratory at a distance of approximately 60 cm from the screen. A nine-point calibration procedure was conducted using the eye tracker before the experiment, and recalibration was performed whenever necessary.
Participants first completed a practice session involving all nine combinations of encoding type and modulation area to familiarize themselves with the task. Instructions were clearly displayed on the monitor, and participants were encouraged to ask questions before proceeding.
During the formal experiment, participants performed a single-target visual search task across 36 trials. Each trial began with a central fixation point, followed by a randomly selected map displayed for 30,000 ms. Each map contained one target symbol and six distractor symbols positioned randomly within the nine predefined grid areas. Participants indicated the location of the target symbol by pressing the corresponding key (1–9) on the numeric keypad.
No feedback was provided during the trials. The total duration of Experiment 2 was approximately 20 min for each participant. Upon completion, participants received compensation of CNY 20.
2.3. Efficiency and Eye Movement Metrics
The experimental results consisted of both behavioral data and eye movement data. The behavioral data encompassed accuracy (ACC) and reaction time (RT), while the eye movement data encompassed total visit duration (TVD), total fixation duration (TFD), total fixation count (TFC), and heatmaps. The selection of eye-tracking metrics is well-grounded in established eye movement research paradigms for assessing visual search performance [24,25,26,27,28]. TVD refers to the cumulative duration of all visits during task completion, where shorter durations on targets suggest efficient detection (e.g., flashing symbols rapidly capturing attention), whereas longer durations may indicate hesitation or re-evaluation [29,30]. In contrast, TFD is a key metric reflecting both attentional engagement and task difficulty, with prolonged fixations on targets indicating deeper cognitive processing (e.g., evaluating symbol meaning), while extended fixations on distractors may signal interference or uncertainty [31,32,33]. Furthermore, TFC, quantifying the number of fixations within AOIs, has been shown to inversely correlate with search efficiency in dynamic displays [34,35,36]. Higher fixation counts frequently correspond to increased search difficulty and elevated error rates, as observed in complex visual search paradigms. Heatmaps provide an effective visualization of gaze behavior, with color gradients indicating varying levels of search difficulty. As the dynamic point symbols on the map served as search targets, they attracted the highest concentration of fixations. In these visualizations, red areas indicate prolonged fixation durations and higher search difficulty, yellow areas indicate moderate fixation durations, and green areas represent lower fixation durations, suggesting more efficient visual search and a balanced distribution of attention [37].
3. Results
3.1. Data Collection and Analysis
The ACC data were analyzed using logistic mixed-effects regression models, while the RT and eye movement data were analyzed using linear mixed-effects regression models [19]. In Experiment 1, for the RT analyses, only trials with correct responses were included, and trials with RTs exceeding three median absolute deviations from the median RT (3.54% of trials) were excluded to remove extreme outliers. In Experiment 2, a similar procedure was followed: only correct response trials were considered, and 3.125% of trials with extreme RTs (beyond three median absolute deviations from the median) were excluded.
3.2. Experiment 1: Encoding Type and Animation Rate
3.2.1. Behavioral Data
Figure 8 illustrates the participants’ ACC and RT in completing the visual search task under three encoding types and three animation rates.
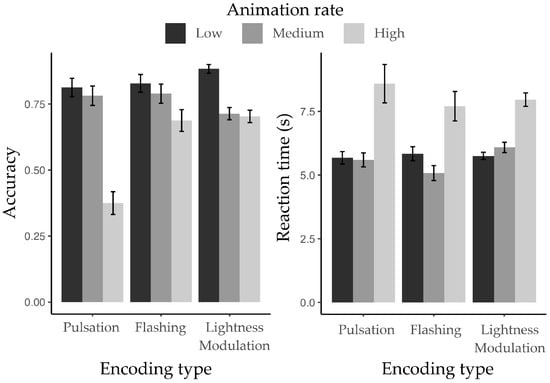
Figure 8.
Mean accuracy (left panel) and reaction time (right panel) for target symbol recognition across three encoding types at low, medium, and high animation rates.
In Experiment 1, the main effect of encoding type on ACC was significant (ΔAIC = −36.2, LLRχ2 (1) = 40.21, p < 0.001). Participants also showed significant differences in ACC across animation rates (ΔAIC = −83.1, LLRχ2 (1) = 87.07, p < 0.001), with ACC decreasing as the animation rate increased. Moreover, there was a significant interaction effect between encoding type and animation rate on ACC (ΔAIC = −24.2, LLRχ2 (1) = 32.24, p < 0.001).
For RT, no significant main effect of encoding type was found (ΔAIC = −0.8, LLRχ2 (1) = 4.74, p = 0.09). However, participants showed significant differences in RT across animation rates (ΔAIC = −184.8, LLRχ2(1) = 188.83, p < 0.001), with RT decreasing from low to medium animation rate but increasing again at high animation rate. Additionally, there was a significant interaction effect between encoding type and animation rate on RT (ΔAIC = −3.1, LLRχ2(1) = 11.12, p < 0.05).
3.2.2. Eye Movement Data
The mean and standard deviation results for TVD, TFD, and TFC are presented in Table 1 and Figure 9.

Table 1.
The mean and SD of eye movement data in TVD, TFD, and TFC in Experiment 1.
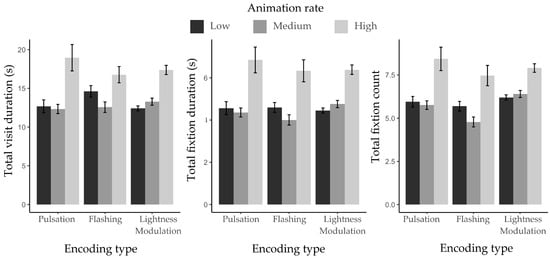
Figure 9.
Mean eye movement metrics for target identification across three encoding types and three animation rates.
Participants did not show significant main effects of encoding type on eye movement metrics. ΔAIC = −0.3, LLRχ2 (1) = 4.26, p = 0.12 for TVD; ΔAIC = 0.7, LLRχ2(1) = 3.31, p = 0.19 for TFD; and ΔAIC = −1.1, LLRχ2(1) = 5.13, p = 0.08 for TFC. However, significant differences were found across animation rates. ΔAIC = −165.1, LLRχ2 (1) = 169.06, p < 0.001 for TVD; ΔAIC = −167.9, LLRχ2 (1) = 171.97, p < 0.001 for TFD; and ΔAIC = −114, LLRχ2 (1) = 117.94, p < 0.001 for TFC. Significant interactions between encoding type and animation rate were also observed. ΔAIC = −4, LLRχ2 (1) = 12.02, p < 0.05 for TVD; ΔAIC = −0.9, LLRχ2 (1) = 171.97, p < 0.001 for TFD; and ΔAIC = −3.8, LLRχ2 (1) = 11.87, p < 0.05 for TFC.
Figure 10 presents representative eye-tracking heatmaps for different encoding types across three animation rates (top row: low animation rate; middle row: medium animation rate; and bottom row: high animation rate). Analysis revealed distinct attentional patterns. Pulsation symbols (a/d/g) required significantly longer fixation durations than other encoding types, indicating the highest visual search difficulty and lowest efficiency. Flashing symbols (b/e/h) and lightness modulation symbols (c/f/i) demonstrated a stable attention distribution across all animation rates, as evidenced by the systematic intensification of heatmap coloration from low (b/c) to high (h/i) animation rates. Notably, across all encoding types, high animation rate conditions (g/h/i) showed substantially increased heatmap values, with denser red regions compared to their low-rate counterparts (a/b/c), suggesting amplified cognitive load at elevated animation rates.
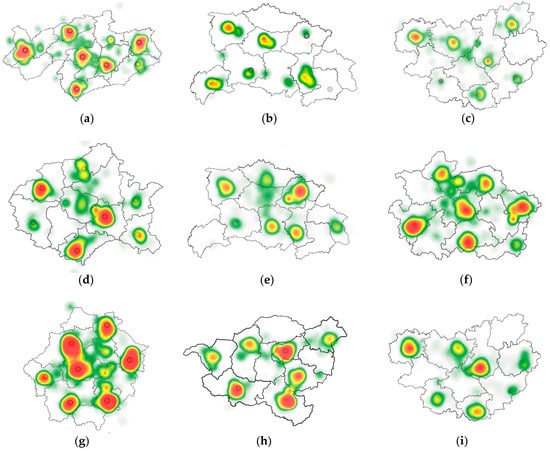
Figure 10.
Representative eye-tracking heatmaps showing participants’ gaze distribution for different encoding types (pulsation: (a,d,g); flashing: (b,e,h); lightness modulation: (c,f,i)) across three animation rates (top row: low; middle row: medium; bottom row: high). Heatmap colors indicate fixation intensity: red (high difficulty, long durations), yellow (moderate difficulty, moderate durations), and green (low difficulty, short durations), with warmer colors representing longer cumulative fixation durations and higher cognitive load.
3.3. Experiment 2: Encoding Type and Modulation Area
3.3.1. Behavioral Data
Figure 11 presents the participants’ ACC and RT in completing the visual search task using dynamic point symbols with low animation rate across three different modulation areas and three encoding types.
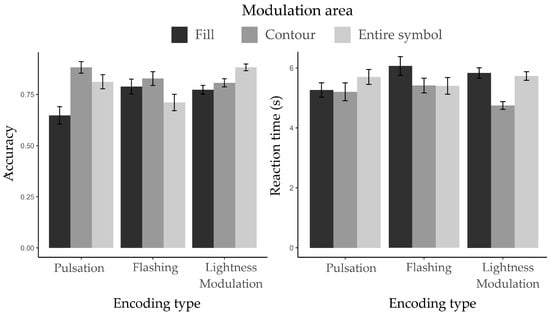
Figure 11.
Mean accuracy (left panel) and reaction time (right panel) for target symbol recognition across three modulation areas under three encoding types.
In Experiment 2, a significant main effect of encoding type on ACC was observed (ΔAIC = −7.6, LLRχ2 (1) = 11.62, p < 0.01), indicating ACC varied across the three typical encoding types—consistent with the results from Experiment 1. A significant main effect of modulation area was also found (ΔAIC = −13.2, LLRχ2 (1) = 17.21, p < 0.001), indicating that participants’ ACC differed depending on which part of the symbol was animated. Furthermore, a significant interaction effect between encoding type and modulation area was found in ACC (ΔAIC = −7.2, LLRχ2 (1) = 15.233, p < 0.01).
For RT, no significant main effect of encoding type was found (ΔAIC = 1.5, LLRχ2 (1) = 2.48, p = 0.29), while participants exhibited significant differences across modulation areas (ΔAIC = −48.5, LLRχ2 (1) = 52.55, p < 0.001). Additionally, a significant interaction between encoding type and modulation area was observed (ΔAIC = −9.2, LLRχ2 (1) = 17.21, p < 0.01).
3.3.2. Eye Movement Data
The mean and standard deviation results for TVD, TFD, and TFC are presented in Table 2 and Figure 12.

Table 2.
The mean and SD of eye movement data in TVD, TFD, and TFC in Experiment 2.
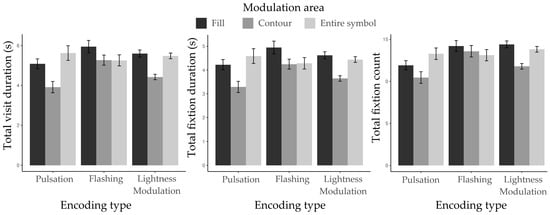
Figure 12.
Mean eye movement metrics for target identification across three modulation areas and three encoding types. Eye movement data illustrate participants’ mean performance on recognizing the target across three modulation areas under three encoding types.
As expected, participants exhibited significant main effects of encoding type. ΔAIC = −7.3, LLRχ2 (1) = 11.3, p < 0.01 for TVD; ΔAIC = −5.3, LLRχ2 (1) = 9.25, p < 0.01 for TFD; and ΔAIC = −14.9, LLRχ2 (1) = 18.98, p < 0.001 for TFC. Significant main effects of modulation area were also found. ΔAIC = −75.2, LLRχ2 (1) = 79.22, p < 0.001 for TVD; ΔAIC = −68.3, LLRχ2 (1) = 72.31, p < 0.001 for TFD; and ΔAIC = −48.5, LLRχ2 (1) = 52.47, p < 0.001 for TFC. Furthermore, significant interactions between encoding type and modulation area were observed. ΔAIC = −10, LLRχ2 (1) = 17.94, p < 0.01 for TVD; ΔAIC = −5.5, LLRχ2 (1) = 13.50, p < 0.01 for TFD; and ΔAIC = −9.2, LLRχ2 (1) = 17.18, p < 0.01 for TFC.
Figure 13 presents representative eye-tracking heatmaps for different encoding types at low animation rate, with different modulation areas. Analysis revealed distinct attentional patterns. Pulsation symbols (a/d/g) consistently resulted in the lowest visual search efficiency, with the poorest performance observed when the symbol’s fill served as the modulation area (a), as evidenced by widespread and diffused fixation distributions. Flashing symbols (b/e/h) exhibited more concentrated attention, with the contour modulation condition (e) yielding the highest search efficiency, while entire symbol flashing (h) produced broader, less focused gaze patterns. Lightness modulation symbols (c/f/i) demonstrated optimal efficiency when applied to the entire symbol (i), whereas fill-based modulation (c) led to greater search difficulty, indicated by more scattered and prolonged fixations. These findings suggest that the effectiveness of modulation areas in optimizing visual search efficiency within map interfaces is contingent upon the specific encoding types employed, indicating a significant interaction between encoding type and modulation area.
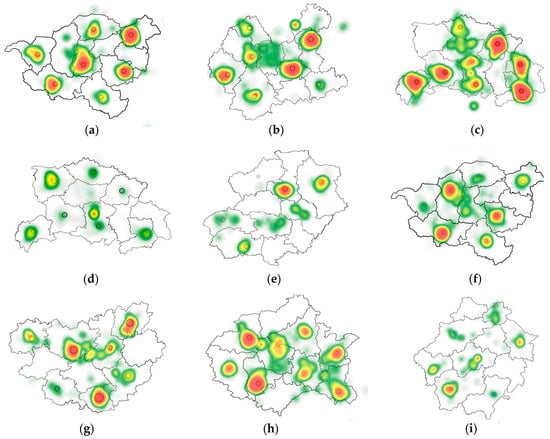
Figure 13.
Representative eye-tracking heatmaps showing participants’ gaze distribution across different combinations of encoding types (pulsation: (a,d,g); flashing: (b,e,h); lightness modulation: (c,f,i)) and modulation areas (top row: fill; middle row: contour; bottom row: entire symbol), at low animation rate. Heatmap colors indicate fixation intensity: red (high difficulty, long durations), yellow (moderate difficulty, moderate durations), and green (low difficulty, short durations), with warmer colors representing longer cumulative fixation durations and higher cognitive load.
4. Discussion
4.1. Effects of Encoding Type and Animation Rate
The experimental results demonstrate that different encoding types (pulsation, flashing, and lightness modulation) of dynamic point symbols can influence visual search efficiency and accuracy in map-based visualizations. Among them, flashing and lightness modulation yielded better performance, as indicated by more concentrated and balanced attention distributions in the eye-tracking heatmaps. In contrast, pulsation resulted in inferior performance, with heatmaps showing more dispersed fixation patterns, suggesting increased cognitive load and search difficulty. This outcome contrasts with the findings of Cybulski and Wielebski [5]. The discrepancy likely arises from differences in research focus, independent variables, and task design. For instance, Cybulski and Wielebski limited each dynamic map’s presentation time to 5–14 s, whereas we extended it to 30 s to ensure participants had adequate time for processing. This variation in exposure time may have influenced how participants responded to different dynamic encoding types. Moreover, while their study primarily investigated the effects of different dynamic forms on conveying quantitative data—requiring participants to first learn a legend and then locate specific points in the displayed map interface—our study focused on a more geospatially valid target localization task, better reflecting real-world contexts such as monitoring alert interfaces [38] and disaster map visualizations [39], where timely and direct detection of specific targets is critical.
Our findings also indicate that the low animation rate condition leads to the shortest search time and highest ACC, outperforming both medium and high animation rate conditions. This suggests that when the frame rate of the target symbol exceeds 10 fps in a dynamic map, search performance deteriorates, a result consistent with Spalek et al. [6]. One likely explanation is that higher animation rates increase either attentional dispersion or perceptual load, thereby complicating task performance [40]. This is supported by Cosman and Vecera [41], who found that higher perceptual load reduces the efficiency of motion-driven attention. In this context, increasing animation rate essentially elevates perceptual demands, hindering efficient visual processing.
4.2. Effects of Encoding Type and Modulation Area
The results of Experiment 2 provide compelling evidence that both encoding type and modulation area significantly influence visual search performance, with a notable interaction between the two. Specifically, for the pulsation encoding type, contour-based modulation again facilitated the most efficient search, followed by entire symbol condition, while fill condition remained the least effective. This result likely reflects the visual cortex’s heightened sensitivity to dynamic contour deformations. Supporting this, research by Berggren and Eimer [42] found that contour-based contraction or expansion movements elicited stronger N2pc components, thereby accelerating the segregation of targets from distractors.
With respect to the flashing encoding type, the contour condition again yielded the best performance, followed by the fill condition, while the entire symbol condition proved to be the least effective. One plausible explanation is that flashing the entire symbol induces a stronger visual masking effect, as opposed to modulating only the contour or the fill [43]. According to the object substitution masking theory [44], when attention has not fully consolidated onto the target, global flashing may replace the object representation, thereby disrupting recognition and search efficiency. Furthermore, fill-based flashing could create conflicts between internal flashing and contour boundaries, imposing additional processing demands on motion analysis mechanisms in the visual system [45].
Under the lightness modulation condition, participants achieved the highest performance when the entire symbol was modulated, followed by the contour condition, with the fill condition yielding the poorest results. This pattern may be explained by the characteristics of lightness modulation, which primarily activates the luminance channels of the visual system. Entire symbol modulation provides a larger spatial extent for brightness changes, making these variations more salient and easier to detect, thus enhancing search efficiency. In contrast, contour modulation provides edge information that supports shape recognition. However, the reduced area limits the salience of lightness modulation, resulting in slightly diminished performance. Recent neurophysiological studies in primates have further shown that neurons in the TE area of the inferotemporal cortex exhibit greater stability in representing overall lightness changes compared to local features, with stronger attentional modulation effects [46]. This finding may explain why the fill condition performed the worst—fragmented lightness changes likely interfere with feature integration along the V4–TE pathway, ultimately impairing visual search performance.
In summary, the optimal visual coding for dynamic point symbols, considering encoding type, modulation area, and animation rate, includes lightness modulation applied to the entire symbol, and flashing or pulsation applied to the contour. Conversely, under any encoding type condition, encoding the fill as the modulation area for point symbols is not recommended, as the experimental results clearly demonstrate that visual search time is longer and error rates are higher compared to the other two. These findings provide actionable guidance for the design of dynamic map interfaces that aim to maximize perceptual clarity while minimizing cognitive load, particularly in applications requiring rapid decision-making, such as crisis management maps [47,48,49,50,51], geospatial data visualizations [52,53], and dynamic maps for autonomous driving and drone geolocation [54,55].
4.3. Preattentive Processing and Perceptual Grouping
The experimental results can be interpreted through established theories of preattentive processing and perceptual grouping. Flashing demonstrated superior performance as an attentional cue, consistent with its classification as a primitive visual feature that activates transient visual pathways [6]. This effect was particularly pronounced in perceptual search tasks where rapid target detection was prioritized. In contrast, lightness modulation showed advantages in maintaining symbol recognizability, suggesting greater compatibility with sustained visual processing mechanisms essential for semantic interpretation. This finding resonates with recent work on visual working memory [56], where luminance-based features show greater stability in maintaining object representations. The differential performance between these encoding methods underscores the fundamental dichotomy in visual processing between transient detection systems and sustained identification mechanisms [57].
The intermediate performance of pulsation reveals a critical design tension in dynamic symbol implementation. While its rhythmic expansion engages motion-sensitive pathways [58], the accompanying spatial transformations disrupt object continuity and perceptual grouping [59]. Our finding that contour-only pulsation outperformed full-symbol pulsation provides empirical support for the object-based attention framework [60], where preserving core object properties enhances perceptual stability. This effect was particularly pronounced in tasks requiring semantic interpretation, suggesting that dynamic modifications must respect Gestalt principles of perceptual organization to maintain symbol meaning [61].
These insights extend current theoretical frameworks in cartographic visualization [9] by demonstrating how effective dynamic symbols must balance preattentive salience against semantic stability. The results suggest that optimal symbol design depends critically on task demands: while flashing may maximize detection in time-critical situations, lightness modulation better supports interpretation tasks requiring symbol recognition. This dual-process perspective bridges classic preattentive theory [62] with contemporary understanding of visual working memory constraints [63] in applied visualization contexts.
5. Conclusions
This study investigates the effects of dynamic point symbol visual coding, focusing on encoding type, animation rate, and modulation area. Two controlled eye-tracking experiments were conducted using dynamic map interfaces and single-target visual search tasks to evaluate the individual and interactive effects of these factors on users’ search efficiency and accuracy. The results indicate that these factors significantly affect users’ search performance with dynamic point symbols on map interfaces, offering valuable insights for map designers in creating more efficient and user-friendly information visualization interfaces with dynamic point symbols. First, when multiple dynamic symbols are present within a map interface, their animation rate should be carefully controlled. Specifically, maintaining the animation rate at a relatively low level (e.g., the search target not exceeding 10 fps) was found to enhance both the accuracy and efficiency of users’ visual search. Additionally, when encoding dynamic point symbols, the combination of encoding type and modulation area should be carefully considered. Based on the experimental results, the following three configurations are recommended for optimal performance in map-based interfaces: contour pulsation, contour flashing, and entire symbol lightness modulation.
Despite its contributions, this study has several limitations. First, the gender distribution in our participant pool was imbalanced. While existing evidence suggests minimal gender differences in low-level visual search tasks like ours [64,65,66,67], and our within-subjects design helps control for individual differences, future studies should aim for a more balanced demographic representation to enhance the generalizability of the findings. Second, while focusing on dynamic encoding optimization, the lack of static controls prevents direct performance comparisons. Future studies should incorporate static baselines using metrics like Time to First Fixation. Finally, our focus on perceptual search tasks with abstract symbols intentionally minimized semantic interference. However, symbol meaning—especially in crisis maps—may alter encoding effectiveness. Future research should examine how semantic meaning interacts with dynamic coding, particularly in applied contexts such as crisis mapping where rapid interpretation of warning symbols is critical.
Author Contributions
Conceptualization, Jing Zhang and Weijia Ge; methodology, Weijia Ge and Jing Zhang; validation, Weijia Ge and Jing Zhang; formal analysis, Jing Zhang; resources, Xingjian Shi and Longlong Qian; data curation, Weijia Ge and Xingjian Shi; writing—original draft preparation, Weijia Ge and Jing Zhang; writing—review and editing, Weijia Ge, Jing Zhang, and Wenzhe Tang; supervision, Jing Zhang and Wenzhe Tang. All authors have read and agreed to the published version of the manuscript.
Funding
This research was funded by the National Natural Science Foundation of China, grant number 72201128, and the China Postdoctoral Science Foundation, grant number 2023M730483.
Institutional Review Board Statement
After consideration by the Institutional Review Board of this institution, the experimental design and protocol of the study were found to be scientifically sound, fair, and impartial, and did not cause harm or risk to the subjects. Recruitment was conducted in accordance with the principles of voluntary participation and informed consent, ensuring the protection of participants’ rights, interests, and privacy. The study was determined to be free from conflicts of interest, ethical or moral violations, and legal noncompliance. It also complied with the ethical standards outlined in the Declaration of Helsinki. The Institutional Review Board confirmed that the project was proceeding as planned (approval date: 1 October 2024).
Informed Consent Statement
Informed consent was obtained from all subjects involved in the study.
Data Availability Statement
The original contributions presented in this study are included in the article. Further inquiries can be directed to the corresponding author.
Acknowledgments
We would like to thank all participants for taking the time to patiently complete the experimental content, and the College of Furnishings and Industrial Design for providing the experimental site. We are additionally thankful to Nuowen Zhang and Shangsong Jiang for their advice concerning project administration of the manuscript.
Conflicts of Interest
The authors declare no conflicts of interest.
References
- Olberding, H.; Vetter, M. Dynamic 3D-Cartographic Symbols for VR Geovisualizations. KN—J. Cartogr. Geogr. Inf. 2023, 73, 265–275. [Google Scholar] [CrossRef]
- Bertin, J. Semiology of Graphics; University of Wisconsin Press: Madison, WI, USA, 1983; ISBN 978-0-299-09060-9. [Google Scholar]
- Roth, R.E. Visual Variables. In International Encyclopedia of Geography; Richardson, D., Castree, N., Goodchild, M.F., Kobayashi, A., Liu, W., Marston, R.A., Eds.; Wiley: Hoboken, NJ, USA, 2017; pp. 1–11. ISBN 978-0-470-65963-2. [Google Scholar]
- Stevens, S.S. On the Psychophysical Law. Psychol. Rev. 1957, 64, 153–181. [Google Scholar] [CrossRef]
- Cybulski, P.; Wielebski, Ł. Effectiveness of Dynamic Point Symbols in Quantitative Mapping. Cartogr. J. 2019, 56, 146–160. [Google Scholar] [CrossRef]
- Spalek, T.M.; Kawahara, J.; Di Lollo, V. Flicker Is a Primitive Visual Attribute in Visual Search. Can. J. Exp. Psychol./Rev. Can. Psychol. Expérimentale 2009, 63, 319–322. [Google Scholar] [CrossRef]
- Masumitsu, T.; Mizokami, Y. Influence of Naturalness of Chroma and Lightness Contrast Modulation on Colorfulness Adaptation in Natural Images. J. Opt. Soc. Am. A 2020, 37, A294–A304. [Google Scholar] [CrossRef]
- Vinke, L.N.; Yazdanbakhsh, A. Lightness Induction Enhancements and Limitations at Low Frequency Modulations across a Variety of Stimulus Contexts. PeerJ 2020, 8, e8918. [Google Scholar] [CrossRef]
- Cybulski, P.; Krassanakis, V. Motion Velocity as a Preattentive Feature in Cartographic Symbolization. J. Eye Mov. Res. 2023, 16, 10–16910. [Google Scholar] [CrossRef] [PubMed]
- Lewandowska, A.; Dziśko, M.; Jankowski, J. Investigation the Role of Contrast on Habituation and Sensitisation Effects in Peripheral Areas of Graphical User Interfaces. Sci. Rep. 2022, 12, 15281. [Google Scholar] [CrossRef]
- Tong, M.; Chen, S.; Niu, Y.; Xue, C. Effects of Speed, Motion Type, and Stimulus Size on Dynamic Visual Search: A Study of Radar Human–Machine Interface. Displays 2023, 77, 102374. [Google Scholar] [CrossRef]
- Konstantinou, E.N.; Skopeliti, A.; Nakos, B. POI Symbol Design in Web Cartography—A Comparative Study. ISPRS Int. J. Geo-Inf. 2023, 12, 254. [Google Scholar] [CrossRef]
- Gong, X.; Lan, T.; Ti, P. Metric and Color Modifications for the Automated Construction of Map Symbols. ISPRS Int. J. Geo-Inf. 2023, 12, 331. [Google Scholar] [CrossRef]
- Cybulski, P. Animating Cartographic Meaning: Unveiling the Impact of Pictorial Symbol Motion Speed in Preattentive Processing. ISPRS Int. J. Geo-Inf. 2024, 13, 118. [Google Scholar] [CrossRef]
- Deng, L.; Zhang, Z.; Zhou, F.; Liu, R. Effects of App Icon Border Form and Interface Background Color Saturation on User Visual Experience and Search Performance. Adv. Multimed. 2022, 2022, 1166656. [Google Scholar] [CrossRef]
- Pisetta, J.A.; Faria Andrade, A.; Camboim, S.P. Proposal and Evaluation of Pictorial Symbols for Reference Mapping on Mobile Devices. Int. J. Cartogr. 2025, 11, 24–41. [Google Scholar] [CrossRef]
- Lai, P.-C.; Yeh, A.G.-O. Assessing the Effectiveness of Dynamic Symbols in Cartographic Communication. Cartogr. J. 2004, 41, 229–244. [Google Scholar] [CrossRef]
- Muller, K. Statistical Power Analysis for the Behavioral Sciences. Technometrics 1989, 31, 499–500. [Google Scholar] [CrossRef]
- Cohen, J. A Power Primer. Psychol. Bull. 1992, 112, 155–159. [Google Scholar] [CrossRef] [PubMed]
- Van Laar, D.L. Psychological and Cartographic Principles for the Production of Visual Layering Effects in Computer Displays. Displays 2001, 22, 125–135. [Google Scholar] [CrossRef]
- Yu, B.; Sui, L. Effects of Motion Type on Motion-Onset and Steady-State Visual Evoked Potentials: Rotation vs. Flicker. NeuroReport 2024, 35, 191–199. [Google Scholar] [CrossRef]
- Dong, W.; Ran, J.; Wang, J. Effectiveness and Efficiency of Map Symbols for Dynamic Geographic Information Visualization. Cartogr. Geogr. Inf. Sci. 2012, 39, 98–106. [Google Scholar] [CrossRef]
- Le Pelley, M.E.; Ung, R.; Mine, C.; Most, S.B.; Watson, P.; Pearson, D.; Theeuwes, J. Reward Learning and Statistical Learning Independently Influence Attentional Priority of Salient Distractors in Visual Search. Atten. Percept. Psychophys. 2022, 84, 1446–1459. [Google Scholar] [CrossRef]
- Zhang, N.; Zhang, J.; Jiang, S.; Ge, W. The Effects of Layout Order on Interface Complexity: An Eye-Tracking Study for Dashboard Design. Sensors 2024, 24, 5966. [Google Scholar] [CrossRef]
- Park, J.; Bae, J.; Cho, K. Eye Tracking Research on Cinemagraph E-Magazine. Agribus. Inf. Manag. 2015, 7, 1–11. [Google Scholar] [CrossRef]
- Wang, Y.; Song, F.; Liu, Y.; Li, Y.; Ma, X.; Wang, W. Research on the Correlation Mechanism between Eye-Tracking Data and Aesthetic Ratings in Product Aesthetic Evaluation. J. Eng. Des. 2023, 34, 55–80. [Google Scholar] [CrossRef]
- Gao, W.; Shen, S.; Ji, Y.; Tian, Y. Human Perception of the Emotional Expressions of Humanoid Robot Body Movements: Evidence from Survey and Eye-Tracking Measurements. Biomimetics 2024, 9, 684. [Google Scholar] [CrossRef]
- Tang, Y.; Chen, C. Can Stylized Products Generated by AI Better Attract User Attention? Using Eye-Tracking Technology for Research. Appl. Sci. 2024, 14, 7729. [Google Scholar] [CrossRef]
- Wan, Y.; Yang, J.; Ren, X.; Yu, Z.; Zhang, R.; Li, X. Evaluation of Eye Movements and Visual Performance in Patients with Cataract. Sci. Rep. 2020, 10, 9875. [Google Scholar] [CrossRef] [PubMed]
- Ernst, D.; Wolfe, J.M. How Fixation Durations Are Affected by Search Difficulty Manipulations. Vis. Cogn. 2022, 30, 339–353. [Google Scholar] [CrossRef]
- Harris, A.M.; Eayrs, J.O.; Lavie, N. The Effect of Perceptual Load on Gaze and EEG Signals in Multi-Target Visual Search with Free Eye-Movements. J. Vis. 2019, 19, 273. [Google Scholar] [CrossRef]
- Drews, M.; Dierkes, K. Strategies for Enhancing Automatic Fixation Detection in Head-Mounted Eye Tracking. Behav. Res. 2024, 56, 6276–6298. [Google Scholar] [CrossRef]
- Ge, W.; Zhang, J.; Jiang, S.; Shi, X.; Zhou, Y. Effects of Dynamic Visual Coding of Point Symbols in Map-Based Information Visualization Design: An Eye-Tracking Study. In Human Interface and the Management of Information; Mori, H., Asahi, Y., Eds.; Lecture Notes in Computer Science; Springer Nature Switzerland: Cham, Switzerland, 2025; Volume 15773, pp. 29–40. ISBN 978-3-031-93818-4. [Google Scholar]
- Guo, F.; Chen, J.; Li, M.; Lyu, W.; Zhang, J. Effects of Visual Complexity on User Search Behavior and Satisfaction: An Eye-Tracking Study of Mobile News Apps. Univers. Access Inf. Soc. 2022, 21, 795–808. [Google Scholar] [CrossRef]
- Samiei, M.; Clark, J.J. Target Features Affect Visual Search, a Study of Eye Fixations. arXiv 2022. [Google Scholar] [CrossRef]
- Chen, C.; Huang, K. Fewer Clicks, Lower Emissions: Eye-Tracking Analysis of Eco-Friendly Navigation in Tourism Websites. Sustainability 2025, 17, 5462. [Google Scholar] [CrossRef]
- Bonev, B.; Chuang, L.L.; Escolano, F. How Do Image Complexity, Task Demands and Looking Biases Influence Human Gaze Behavior? Pattern Recognit. Lett. 2013, 34, 723–730. [Google Scholar] [CrossRef]
- Tseng, F.Y.; Chao, C.J.; Yau, Y.J.; Feng, W.Y. Design and Evaluation of Military Geographical Intelligence System: An Ergonomics Case Study. Displays 2018, 51, 36–42. [Google Scholar] [CrossRef]
- Lei, X.; Wang, Y.; Han, W.; Song, W. Knowledge Graph Representation of Multi-Source Urban Storm Surge Hazard Information Based on Spatio-Temporal Coding and the Hazard Events Ontology Model. ISPRS Int. J. Geo-Inf. 2024, 13, 88. [Google Scholar] [CrossRef]
- Lavie, N.; Hirst, A.; De Fockert, J.W.; Viding, E. Load Theory of Selective Attention and Cognitive Control. J. Exp. Psychol. Gen. 2004, 133, 339–354. [Google Scholar] [CrossRef] [PubMed]
- Cosman, J.D.; Vecera, S.P. Attentional Capture by Motion Onsets Is Modulated by Perceptual Load. Atten. Percept. Psychophys. 2010, 72, 2096–2105. [Google Scholar] [CrossRef][Green Version]
- Brehaut, J.C.; Enns, J.T.; Di Lollo, V. Visual Masking Plays Two Roles in the Attentional Blink. Percept. Psychophys. 1999, 61, 1436–1448. [Google Scholar] [CrossRef]
- Stolte, M.; Ansorge, U. Automatic Capture of Attention by Flicker. Atten. Percept. Psychophys. 2021, 83, 1407–1415. [Google Scholar] [CrossRef]
- Enns, J.T.; Di Lollo, V. Object Substitution: A New Form of Masking in Unattended Visual Locations. Psychol. Sci. 1997, 8, 135–139. [Google Scholar] [CrossRef]
- Zhao, C.; Kong, Y.; Li, D.; Huang, J.; Kong, L.; Li, X.; Jensen, O.; Song, Y. Suppression of Distracting Inputs by Visual-Spatial Cues Is Driven by Anticipatory Alpha Activity. PLoS Biol. 2023, 21, 1–29. [Google Scholar] [CrossRef] [PubMed]
- Zhang, J.; Cao, R.; Zhu, X.; Zhou, H.; Wang, S. Distinct Attentional Characteristics of Neurons with Visual Feature Coding in the Primate Brain. Sci. Adv. 2025, 11, eadq0332. [Google Scholar] [CrossRef] [PubMed]
- Kuveždić Divjak, A.; Lapaine, M. Crisis Maps—Observed Shortcomings and Recommendations for Improvement. ISPRS Int. J. Geo-Inf. 2018, 7, 436. [Google Scholar] [CrossRef]
- Ma, X.; Cui, K.; Matta, N.; He, Z. Interacting with VDL-Based Structured Icons on Crisis Map for Emergency Coordination: Interactive Design and Experimental Demonstration. Displays 2021, 70, 102059. [Google Scholar] [CrossRef]
- Peng, G.; Yue, S.; Li, Y.; Song, Z.; Wen, Y. A Procedural Construction Method for Interactive Map Symbols Used for Disasters and Emergency Response. ISPRS Int. J. Geo-Inf. 2017, 6, 95. [Google Scholar] [CrossRef]
- Kostelnick, J.C.; Hoeniges, L.C. Map Symbols for Crisis Mapping: Challenges and Prospects. Cartogr. J. 2019, 56, 59–72. [Google Scholar] [CrossRef]
- Du, P.; Li, D.; Liu, T.; Zhang, L.; Yang, X.; Li, Y. Crisis Map Design Considering Map Cognition. ISPRS Int. J. Geo-Inf. 2021, 10, 692. [Google Scholar] [CrossRef]
- Castronovo, D.A.; Chui, K.K.; Naumova, E.N. Dynamic Maps: A Visual-Analytic Methodology for Exploring Spatio-Temporal Disease Patterns. Environ. Health 2009, 8, 61. [Google Scholar] [CrossRef]
- Nass, A.; van Gasselt, S. Dynamic Cartography: A Concept for Multidimensional Point Symbols. In Progress in Cartography: EuroCarto 2015; Gartner, G., Jobst, M., Huang, H., Eds.; Springer International Publishing: Cham, Switzerland, 2016; pp. 17–30. ISBN 978-3-319-19602-2. [Google Scholar] [CrossRef]
- Maiouak, M.; Taleb, T. Dynamic Maps for Automated Driving and UAV Geofencing. IEEE Wirel. Commun. 2019, 26, 54–59. [Google Scholar] [CrossRef]
- Li, J.; Wang, C.; Chen, M. Effects of Driving Background Complexity and Interface Opacity on Visual Cognition in AR-HUD Systems. J. Soc. Inf. Disp. 2025, 1–18. [Google Scholar] [CrossRef]
- Hollingworth, A.; Beck, V.M. Memory-Based Attention Capture When Multiple Items Are Maintained in Visual Working Memory. J. Exp. Psychol. Hum. Percept. Perform. 2016, 42, 911–917. [Google Scholar] [CrossRef]
- Lamme, V.A.F.; Roelfsema, P.R. The Distinct Modes of Vision Offered by Feedforward and Recurrent Processing. Trends Neurosci. 2000, 23, 571–579. [Google Scholar] [CrossRef]
- Livingstone, M.; Hubel, D. Psychophysical Evidence for Separate Channels for the Perception of Form, Color, Movement, and Depth. J. Neurosci. 1987, 7, 3416–3468. [Google Scholar] [CrossRef]
- Wagemans, J.; Elder, J.H.; Kubovy, M.; Palmer, S.E.; Peterson, M.A.; Singh, M.; Von Der Heydt, R. A Century of Gestalt Psychology in Visual Perception: I. Perceptual Grouping and Figure–Ground Organization. Psychol. Bull. 2012, 138, 1172–1217. [Google Scholar] [CrossRef]
- Egly, R.; Driver, J.; Rafal, R. Shifting Visual Attention Between Objects and Locations: Evidence From Normal and Parietal Lesion Subjects. J. Exp. Psychol. Gen. 1994, 123, 161–177. [Google Scholar] [CrossRef]
- Palmer, S.E. Vision Science: Photons to Phenomenology; MIT Press: Cambridge, MA, USA, 1999; ISBN 0262161834. [Google Scholar]
- Treisman, A.M.; Gelade, G. A Feature-Integration Theory of Attention. Cogn. Psychol. 1980, 12, 97–136. [Google Scholar] [CrossRef] [PubMed]
- Wolfe, J.M.; Horowitz, T.S. Five Factors That Guide Attention in Visual Search. Nat. Hum. Behav. 2017, 1, 0058. [Google Scholar] [CrossRef] [PubMed]
- Shaqiri, A.; Roinishvili, M.; Grzeczkowski, L.; Chkonia, E.; Pilz, K.; Mohr, C.; Brand, A.; Kunchulia, M.; Herzog, M.H. Sex-Related Differences in Vision Are Heterogeneous. Sci. Rep. 2018, 8, 7521. [Google Scholar] [CrossRef] [PubMed]
- Solianik, R.; Brazaitis, M.; Skurvydas, A. Sex-Related Differences in Attention and Memory. Medicina 2016, 52, 372–377. [Google Scholar] [CrossRef] [PubMed]
- Inukai, T.; Kawahara, J.I. Sex Differences in Temporal but Not Spatial Attentional Capture. Front. Psychol. 2018, 9, 1893. [Google Scholar] [CrossRef] [PubMed]
- English, M.C.W.; Maybery, M.T.; Visser, T.A.W. Magnitude of Sex Differences in Visual Search Varies with Target Eccentricity. Psychon. Bull. Rev. 2021, 28, 178–188. [Google Scholar] [CrossRef] [PubMed]
Disclaimer/Publisher’s Note: The statements, opinions and data contained in all publications are solely those of the individual author(s) and contributor(s) and not of MDPI and/or the editor(s). MDPI and/or the editor(s) disclaim responsibility for any injury to people or property resulting from any ideas, methods, instructions or products referred to in the content. |
© 2025 by the authors. Published by MDPI on behalf of the International Society for Photogrammetry and Remote Sensing. Licensee MDPI, Basel, Switzerland. This article is an open access article distributed under the terms and conditions of the Creative Commons Attribution (CC BY) license (https://creativecommons.org/licenses/by/4.0/).