Article

Application of Integrated Geospatial Analysis and Machine Learning in Identifying Factors Affecting Ride-Sharing Before/After the COVID-19 Pandemic

by
Afshin Allahyari
* and
Farideddin Peiravian
Department of Civil, Materials and Environmental Engineering, University of Illinois Chicago, Chicago, IL 60607, USA
*
Author to whom correspondence should be addressed.
ISPRS Int. J. Geo-Inf. 2025, 14(8), 291; https://doi.org/10.3390/ijgi14080291
Submission received: 23 April 2025 / Revised: 4 July 2025 / Accepted: 12 July 2025 / Published: 28 July 2025

Abstract

Ride-pooling, as a sustainable mode of ride-hailing services, enables different riders to share a vehicle while traveling along similar routes. The COVID-19 pandemic led to the suspension of this service, but Transportation Network Companies (TNCs) such as Uber and Lyft resumed it after a significant delay following the lockdown. This raises the question of what determinants shape ride-pooling in the post-pandemic era and how they spatially influence shared ride-hailing compared to the pre-pandemic period. To address this gap, this study employs geospatial analysis and machine learning to examine the factors affecting ride-pooling trips in pre- and post-pandemic periods. Using over 66 million trip records from 2019 and 43 million from 2023, we observe a significant decline in shared trip adoption, from 16% to 2.91%. The results of an extreme gradient boosting (XGBoost) model indicate a robust capture of non-linear relationships. The SHAP analysis reveals that the percentage of the non-white population is the dominant predictor in both years, although its influence weakened post-pandemic, with a breakpoint shift from 78% to 90%, suggesting reduced sharing in mid-range minority areas. Crime density and lower car ownership consistently correlate with higher sharing rates, while dense, transit-rich areas exhibit diminished reliance on shared trips. Our findings underscore the critical need to enhance transportation integration in underserved communities. Concurrently, they highlight the importance of encouraging shared ride adoption in well-served, high-demand areas where solo ride-hailing is prevalent. We believe these results can directly inform policies that foster more equitable, cost-effective, and sustainable shared mobility systems in the post-pandemic landscape.

1. Introduction

The rise of ride-hailing services has transformed urban mobility across the globe. One specific service within this space—ride-pooling, also called shared ride-hailing or ride-splitting—allows passengers with similar origins or destinations to share a single vehicle, reducing both total mileage and travel costs, which can then be shared among co-travelers such as UberPool and LyftShare services. By pooling passengers, ride-pooling not only decreases the number of trips on the road but also contributes to minimizing traffic congestion and air pollution [1,2,3]. Despite struggling to reach the critical mass in the pre-pandemic period and completely stopping during the pandemic [4,5,6], this service remains a promising mobility mode with significant potential to contribute to sustainability transitions. When effectively implemented, ride-pooling complements public transport systems. If demand reaches the necessary critical mass, it becomes efficient for all stakeholders: travelers benefit from lower costs, drivers can earn more, service providers better utilize their fleets, and cities benefit from reduced congestion and emissions [4,5,6].
However, the onset of the COVID-19 pandemic in early 2020 drastically altered global travel behaviors, including the use of ride-hailing services. The pandemic triggered widespread lockdowns, stay-at-home orders, and a significant reduction in urban travel as people shifted to remote work, curtailing non-essential activities. Public transportation ridership plummeted, and concerns over virus transmission led to an increase in private vehicle use [7,8,9]. In response to these challenges, Transportation Network Companies (TNCs) such as Uber and Lyft suspended their ride-pooling options to prioritize safety and minimize the risk of exposure to the virus. Uber, for example, suspended its UberPool service in Chicago in March 2020. It was not until August 2022 that Uber began gradually reintroducing a shared service, UberX Share, in the city [10]. Similarly, Lyft halted its shared rides in Chicago in March 2020. While Lyft reintroduced its shared rides in July 2022 [11], it ultimately decided to discontinue the service in May 2023, permanently [12].
Despite the gradual recovery of travel activity as pandemic restrictions have been eased, many aspects of pre-COVID mobility patterns have yet to return fully. Remote work, for instance, remains prevalent, and public transportation has struggled to regain its pre-pandemic ridership levels [13,14]. These lingering changes in travel behavior raise critical questions about the future of shared ride-hailing trips: Will ride-pooling services return to their pre-COVID levels? And how have the factors influencing the adoption of shared trips evolved in the wake of the pandemic?
Understanding the factors that influence ride-pooling trips is crucial for long-term transportation planning. Policymakers and TNCs alike are interested in increasing the share of these trips to advance sustainability goals and improve urban mobility. However, the pandemic may have altered the relative importance of various determinants that traditionally influenced users’ decisions to opt for ride-pooling. To optimize ride-pooling services in the post-pandemic era, it is essential to identify whether these factors have shifted and to what extent they continue to impact the demand for shared trips.
This study aims to evaluate the evolving landscape of shared ride-hailing adoption in Chicago during the post-pandemic era by addressing two primary research objectives. First, we quantify the change in shared ride popularity by comparing the percentage of shared trips between 2019 (pre-COVID) and 2023 (post-COVID). Second, we examine whether the relative influence of key predictors (such as race, income, car ownership, and built environment characteristics) has shifted between these two time periods. We apply geospatial analysis and a machine learning framework (XGBoost) to address these objectives to over 100 million ride records. We use SHAP values to interpret the model outputs, which provide insight into each feature’s contribution to predicted sharing rates and allow us to compare patterns across space and time. Our analysis focuses on changes in feature importance rankings and SHAP dependency patterns to assess how the drivers of ride-pooling behavior may have evolved in the wake of the COVID-19 pandemic.

2. Literature Review

Ride-pooling is increasingly recognized as more than just a cost-saving feature of ride-hailing platforms; it is also seen as a significant potential contributor to developing sustainable, equitable, and multimodal urban transport systems [2,4,5]. It offers the promise of reducing emissions, increasing vehicle occupancy, and expanding mobility access in underserved neighborhoods, particularly where public transit is limited or less reliable [1,3,5].
Recent studies indicate that various individual and social factors are influential in choosing shared trips with TNCs [15]. For instance, income levels play an essential role in shared ride preferences. As Brown found [16], users living in low-income areas are more likely to take shared trips compared to those in middle- and high-income areas, with 23% of trips in low-income areas made on Lyft Shared, compared to 20% and 19% in middle- and high-income census tracts, respectively. Also, Lavieri and Bhat [17] conducted research on shared ride users in the Dallas–Fort Worth area, revealing that individuals with a lower income strongly preferred shared ride service. Conversely, higher-income groups and whites were more inclined to prioritize private space, making them less likely to choose shared rides due to privacy concerns. Similarly, Shoman and Moreno [18] found that higher-income groups are willing to pay more for ride-hailing services. Also, Kang [19], in their study in Austin, Texas, observed that individuals with higher education, those employed, and residents of densely populated areas tended to favor shared rides over private ones. On the other hand, older adults, women, and white populations generally preferred solo trips, as privacy and personal space were higher priorities for these groups. In a study conducted in Hangzhou, China, Zheng [20] found that young, educated, and married individuals were more inclined to use shared ride services. This study also revealed that the primary factors influencing individuals’ preference for shared trips instead of using other modes of transportation were concerns over parking availability and the cost of transportation.
Research indicates that discrimination can influence whether victims adopt ride-sharing services, often creating disparities in service experiences and user preferences. For example, Ge [21] found that African American-sounding passengers’ names frequently encounter discrimination on ride-hailing platforms, facing longer wait times and higher cancellation rates compared to white sounding passenger names. Such practices deter minorities from availing pooled ride modes like UberPool or Lyft Line for reasons related to reliability and security. Similarly, Middleton and Zhao [22] documents that discrimination is not confined to drivers but can be extended to include passengers, since some are uncomfortable in vehicles occupied by members of a different race or socio-economic status.
In a study conducted in Chengdu, Kong [23] identified that ride-hailing usage was most influenced by public transportation infrastructure, while job availability in the area had little effect. In another study, Ghaffar [24] examined ride-hailing demand across different neighborhoods in Chicago and found that ride-hailing requests were higher in areas with a greater number of households without access to a personal vehicle, higher household income, greater population density, more job opportunities, a larger number of restaurants, limited parking, and a higher incidence of homicide.
While previous studies have explored ride-pooling behavior across various demographic and spatial lines, very few have specifically examined how these influencing factors may have shifted following the COVID-19 pandemic [10,17]. Most existing research tends to concentrate on overall demand or pricing structures, with considerably less attention paid to the evolving socio-spatial determinants of ride-pooling. Furthermore, even fewer investigations delve into these city-specific changes using interpretable predictive methodologies. This study directly addresses this notable gap by applying XGBoost and SHAP to tract-level ride-hailing data from Chicago, comparing observations from 2019 to 2023.

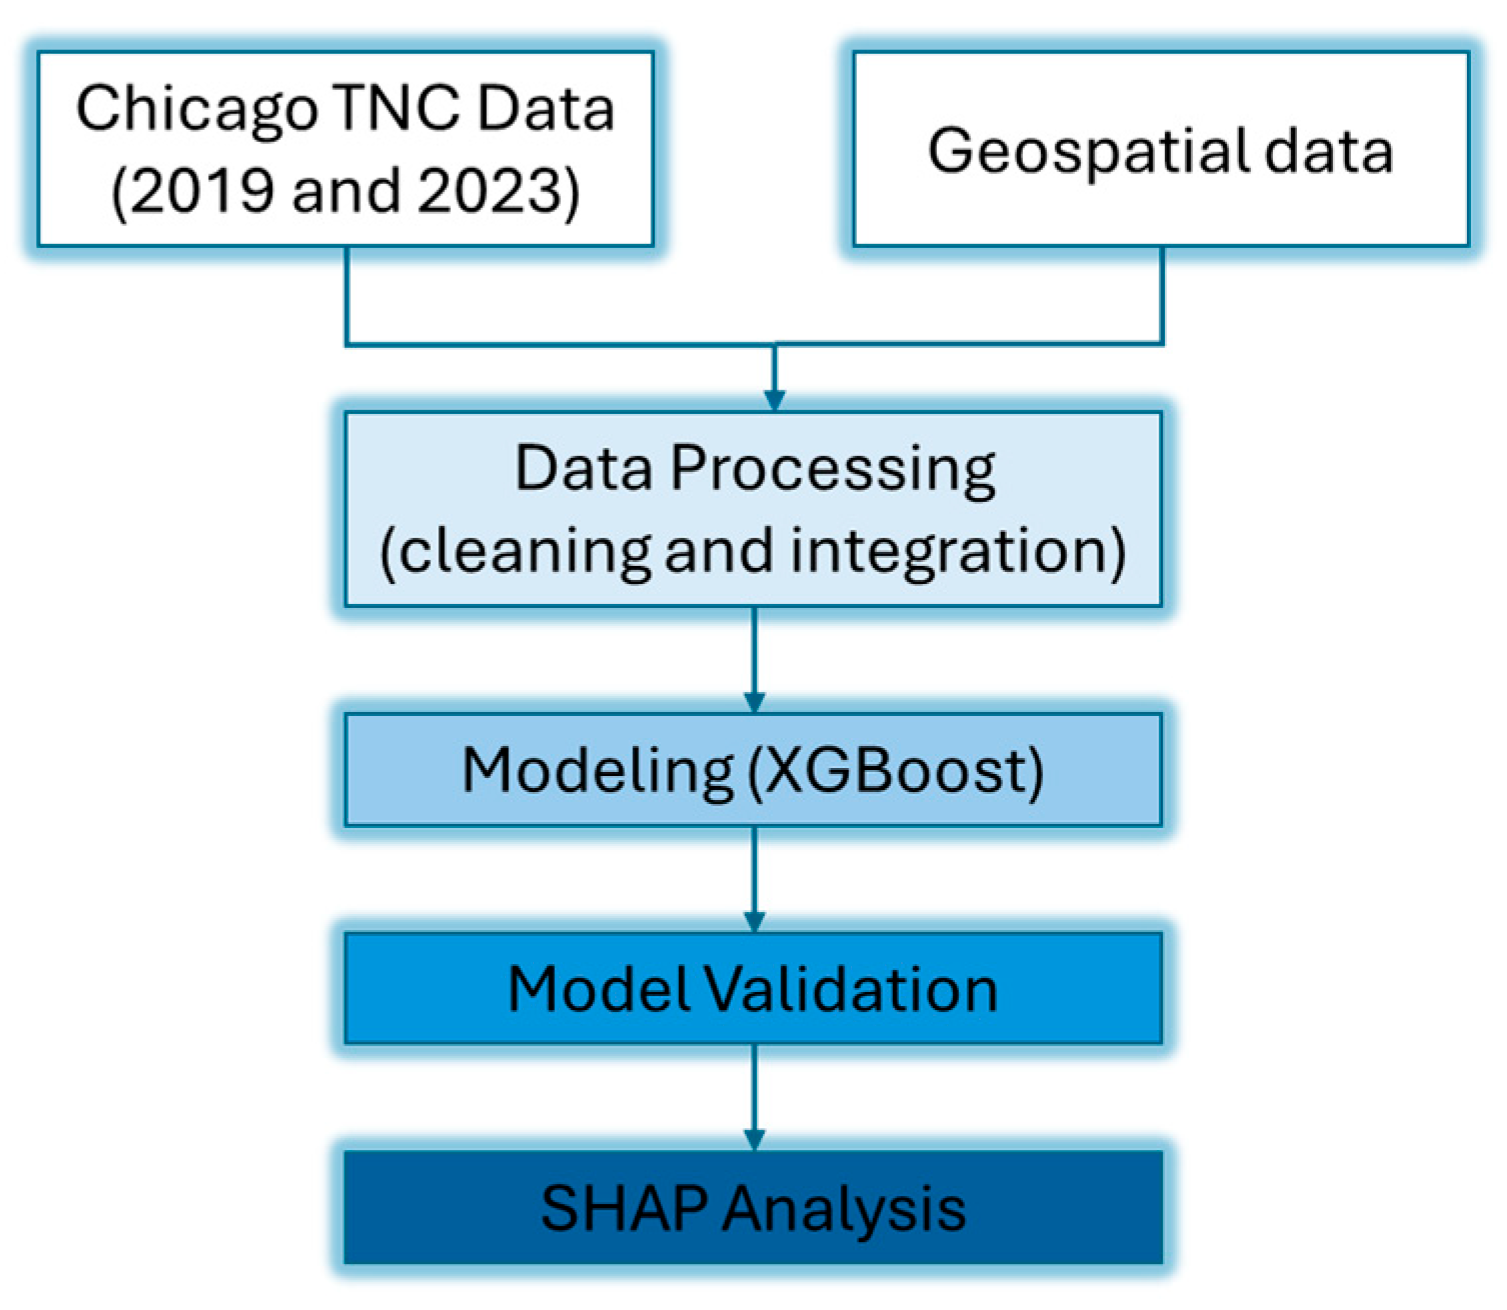
3. Materials and Methods

We used multiple sources in this research to investigate variables influencing individuals’ willingness to share Transportation Network Companies (TNC) trips, specifically Uber Technologies, Inc. (San Francisco, CA, USA) and Lyft, Inc. (San Francisco, CA, USA), within the urban environment of Chicago. These sources include records of TNC trips from the Chicago open data portal for the years 2019 and 2023, socio-economic metrics from the American Community Survey and the Chicago Police Department, built environment data from the United States Environmental Protection Agency’s Smart Location Database, and geographical boundaries from the Census Bureau. In the following, we discuss each dataset in more detail.
These datasets encompass detailed records of Uber and Lyft trips in Chicago, including 15 min rounded timestamps (which are used to maintain privacy while providing accurate temporal data for analysis) of pickups and drop-offs, census tract geo ID and centroid of origin and destination locations, community area ID and centroid of origin and destination locations, trip distances in miles, duration of trips in seconds, fare amounts rounded to the nearest USD 2.5, additional charges (including taxes and any other fees), tips rounded to the nearest USD 1, the total cost of the trip, whether the trip was authorized to be shared, how many trips were pooled, and the percentage of duration and distance of trips in Chicago (only in 2023 dataset). The 2019 dataset offers pre-pandemic insights into where customers’ behavior was unaffected by the COVID-19 pandemic, while the 2023 dataset is the first full-schedule year of data that reflects post-pandemic mobility patterns, allowing for a comparative analysis of ride-sharing trends.
As we explore this rich dataset, we utilize advanced data cleaning and integration techniques to ensure the accuracy and reliability of our analysis. In that process, we removed the trip record with the missing tract origin or destination information. Also, to filter out outliers that may have been included in the dataset, we removed trips that were shorter than 2 min and longer than 2 h, trips that were shorter than 1 mile and longer than 50 miles (the approximate network distance between two furthest points in the city of Chicago), trip base fares that were less than USD 2.5 and more than USD 50, and additional charges (including taxes and fees) that were more than USD 100. Our final dataset has over 66 million trip records in 2019, with a 16% sharing rate in the census tracts, and over 43 million trips in 2023, with a 2.91% sharing rate, which we aggregated into census tracts by only considering the pickup locations. Drop-offs were not included to avoid double-counting. In our dataset, we differentiated between authorized shared trips (rider opted for pooling) and matched shared trips (platform successfully paired the ride). For our analysis, we use the matched trip percentage, the proportion of all authorized and successfully paired trips, as the dependent variable. This choice reflects actual shared ride adoption more accurately than user intent alone.
This database provides statistics on socio-demographic traits such as income, employment, household size, and education, based on five-year estimates from the Census Bureau’s annual surveys. Since no estimate for 2023 was available at the time of this study, the 2022 dataset was used instead.
From the United States Environmental Protection Agency (Washington, DC, USA), this dataset includes metrics on land use, access to public transportation, and walkability. We used these environmental factors to assess how the built environment impacts the ride-sharing choice. The EPA smart location dataset is provided initially at the block group level. To incorporate it into our study, we aggregated its variables at the census tract level. For both the “Walkability Index” and “Job Accessibility,” we computed tract-level averages. For “Average Transit Frequency,” we also calculated the average, excluding block groups lacking bus stops or rail stations. The “Road Network Density” was calculated by summing the total length of the road network within each tract and dividing by the tract’s area. The “Job/Pop Ratio” was computed by dividing the number of jobs (sourced from the EPA smart location dataset) by the population (sourced from the ACS dataset).
This geographical dataset from the Census Bureau delineates the spatial boundaries of census tracts, facilitating the aggregation of socio-economic and environmental data at a standard spatial level. Boundaries of census block groups and tracts are revised every ten years following the decennial census. Although the EPA smart location dataset has been recently updated, it continues to rely on the 2010 census block group boundaries. To ensure spatial consistency across all data sources, we manually transformed the 2023-related datasets to align with the 2010 census tract boundaries. Table 1 describes the utilized variables in our study, and Table 2 and Table 3 show the summary statistics of the variables in both years.

4. Methodology

To understand how ride-pooling predictors have changed over time, we employed XGBoost, a machine learning model well-suited for identifying complex, non-linear relationships within large datasets. Unlike traditional regression models, XGBoost does not assume a linear structure and inherently accounts for interactions among variables. To ensure the interpretability of our results, we applied SHAP values, which help explain the unique contribution of each factor to the model’s prediction and provide clear insight into the factors shaping shared ride behavior before and after the pandemic. While this methodology offers robust predictive power and interpretability, it is essential to note that it does not provide a causal inference and may not explicitly account for all spatial dependencies present within the data. While a single decision tree uses only one set of rules from the root to a leaf, gradient boosting combines multiple decision trees sequentially, where each new tree corrects errors from previous trees to enhance the overall predictive power [25]. In the following sections, we outline the theoretical underpinnings of XGBoost and its regularization framework; a more detailed explanation can be found in [26]. We used Python 3.12 for all data preprocessing and model development, relying primarily on the XGBoost and scikit-learn libraries, such as GridSearchCV, for hyper-tuning the model. A visual summary of the methodological steps—including data sources, preprocessing, modeling using XGBoost, and SHAP-based interpretations is shown in Figure 1.

4.1. XGBoost

Assume we have a dataset of observations (i.e., ride records), each with m features describing trip attributes, demographic data, and the built environment. Let x i , y i i = 1,2 , , n .
Denote the features and outcome for each trip i, where x i R m is the feature vector (e.g., median income, transit accessibility, crime density), and y i 0 , 1 indicates whether a trip was unshared or shared. A tree-ensemble model (as in XGBoost) predicts y ^ i through a sum of K additive functions f k :
y ^ i = k = 1 K f k x i ,   f k F ,
where F is the space of all possible regression trees [26]. The objective of XGBoost is to find the set of functions f k that minimizes the following:
L = k = 1 n L ( y i , y i ) +   k = 1 K Ω f k ,
where L is a differentiable loss function (e.g., logistic loss for binary classification), and Ω is a regularization term penalizing model complexity:
Ω   f k = γ T + 1 2 λ j = 1 T w j 2
Here, T is the number of leaves in a tree, γ and λ are hyperparameters controlling complexity, and w j is the leaf weight. By iteratively adding trees to minimize this objective, XGBoost balances predictive accuracy with model simplicity.
w j * = i I j y ^ t 1 l y i , y ^ t 1 i I j y ^ t 1 2 l y i , y ^ t 1 + λ   ,
L ~ t q = 1 2 j = 1 T i I j y ^ t 1 l y i , y ^ t 1 2 i I j y ^ t 1 l y i , y ^ t 1 + λ + γ T .
An important advantage of decision tree-based algorithms (including XGBoost) is that they are typically not sensitive to multicollinearity [27]. That means if two variables capture overlapping phenomena in the ride-sharing ecosystem, both can still be included. This is especially relevant to our study, as we later perform SHAP-based feature analysis to interpret the role of each input variable in predicting shared-trip likelihood (detailed in Section 4.3).
XGBoost has multiple hyperparameters that require tuning to prevent overfitting and to achieve optimal performance. Key parameters include “Number of iterations”, which determines the number of trees, “Max depth”, which indicates the number of nodes in each tree, “Subsample”, where a fraction of training data will be randomly chosen for each tree, “Learning rate”, which scales the contribution of each tree by limiting the weight to enhance the model, and λ and α, which are L2 and L1 regularization terms on leaf weights, respectively, both of which help control model complexity.

4.2. XGBoost Model Evaluation

Because our prediction target is binary (whether a trip was shared vs. unshared), we evaluate the performance of our XGBoost classifier using the following:
-
Accuracy, where we evaluated our predictions by comparing them to the correct dependent variable,
A c c u r a c y = N u m b e r   o f   c o r r e c t   p r e d i c t i o n s T e s t   d a t a s e t   s i z e .
-
Log Loss (or Cross-Entropy Loss), a standard metric for probabilistic classification. Lower values indicate better calibration of predicted probabilities:
L o g L o s s = 1 N i = 1 N [ y i l n ( p ^ i + 1 y i l n ( 1 p ^ i )
where p ^ i is the predicted probability of a trip being shared.
-
Area under the ROC curve (AUC) is a commonly used metric that evaluates a classifier’s ability to distinguish between classes at all possible thresholds. The ROC curve plots the True Positive Rate (TPR) against the False Positive Rate (FPR). An AUC of 0.5 indicates random guessing, and 1.0 indicates a perfect classifier. Mathematically, it can be expressed as the integral of TPR over FPR from 0 to 1:
A U C = 0 1 T P R F P R 1 x d x .

4.3. Model Interpretation—SHAP

To interpret the output of our XGBoost model, we employ SHAP (Shapley Additive explanations), a method proposed by Lundberg and Lee [28]. SHAP is rooted in game theory [29] and local explanation techniques [30] providing a systematic way to estimate the impact of each predictor on the model’s output. We chose SHAP because of its powerful ability to interpret complex models like XGBoost, which provides both a global overview and insights into individual predictions. It offers a consistent, theoretically sound way to quantify each feature’s contribution. SHAP is also a well-established method in machine learning, especially with tree-based models, valued for its clear outputs and effectiveness with non-linear, high-dimensional data. However, SHAP can be sensitive to multicollinearity. When features are highly correlated, the importance attributed to them might not be evenly distributed, which can subtly affect how we interpret the results [31].
Assume an XGBoost model trained to predict whether a ride-hailing trip is shared ( y ). Let N be the set of all features used in the model, with n features contributing to the prediction. In SHAP, the contribution of each feature i is determined based on its marginal impact on the model’s output [30]. The SHAP value for the feature i represents how much it increases or decreases the probability that a given trip is shared, compared to a baseline prediction.
Mathematically, the Shapley value for a feature i is defined as follows:
ϕ i = S N { i } S ! n S 1 !   n ! [ f ( S { i } ) f ( S ) ] ,
where S is a subset of features not containing i , f ( S ) is the model’s prediction using only features in S , and f ( S { i } ) is the model’s prediction when the feature i is included. This equation ensures that each feature’s contribution is allocated fairly, considering all possible combinations of features.
To simplify this process for high-dimensional datasets, SHAP approximates these values efficiently using tree-based methods, allowing us to quantify the impact of variables such as income, transit accessibility, crime density, or job accessibility on ride-sharing behavior.
A linear function of binary features g is then defined using an additive feature attribution method:
g ( z ) = ϕ 0 + i = i M ϕ i z i ,
where z i = 1 if feature i is present, otherwise z i = 0 and M is the total number of features.
This formulation allows SHAP to generate global explanations (feature importance rankings) and local explanations (how each feature contributes to individual predictions). In this study, we analyzed SHAP summary plots to show the overall contribution of each feature across all predictions. The SHAP dependence plots are used to visualize the relationship between specific features and their SHAP values. Also, the Temporal Comparison will evaluate how the influence of factors like income, racial composition, or built environment has changed from 2019 (pre-pandemic) to 2023 (post-pandemic).

5. Results

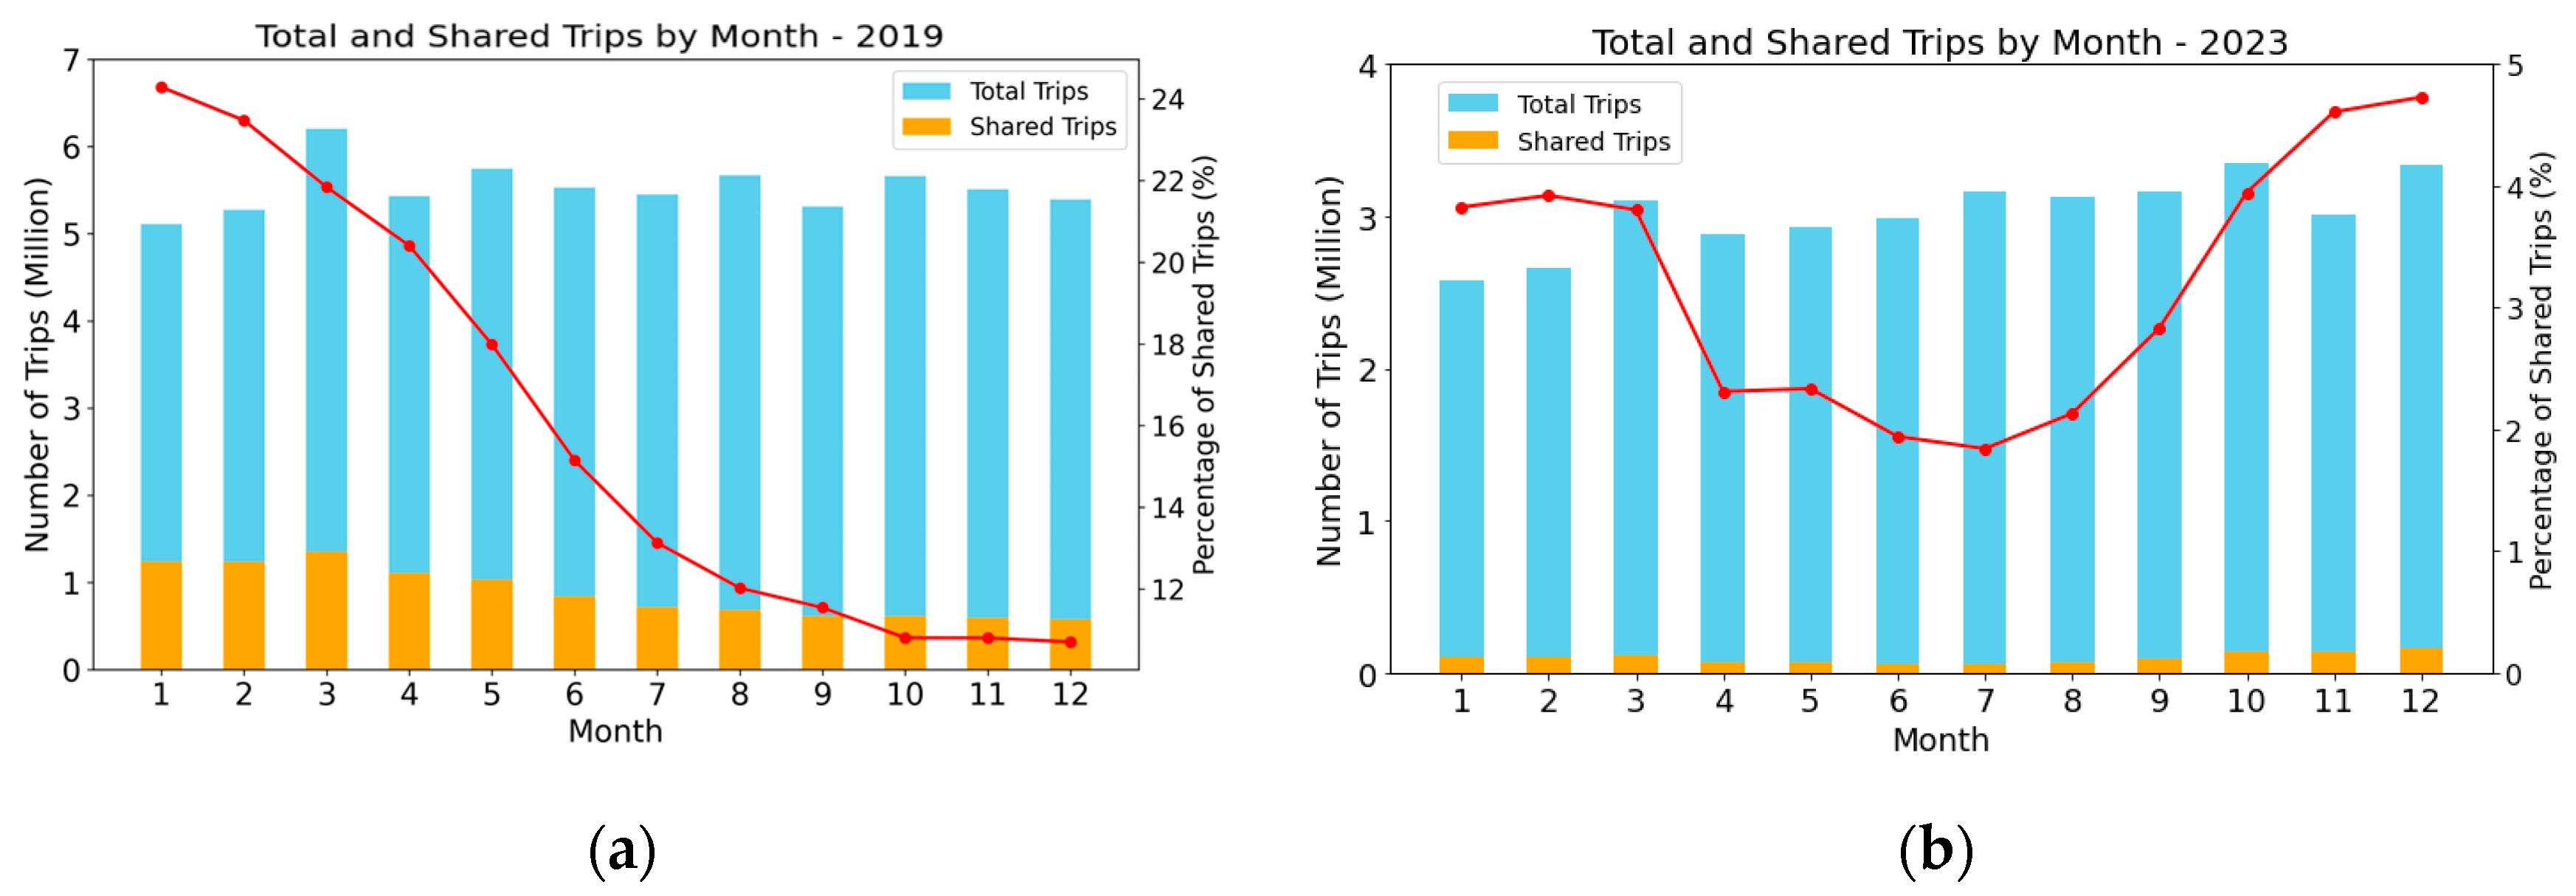
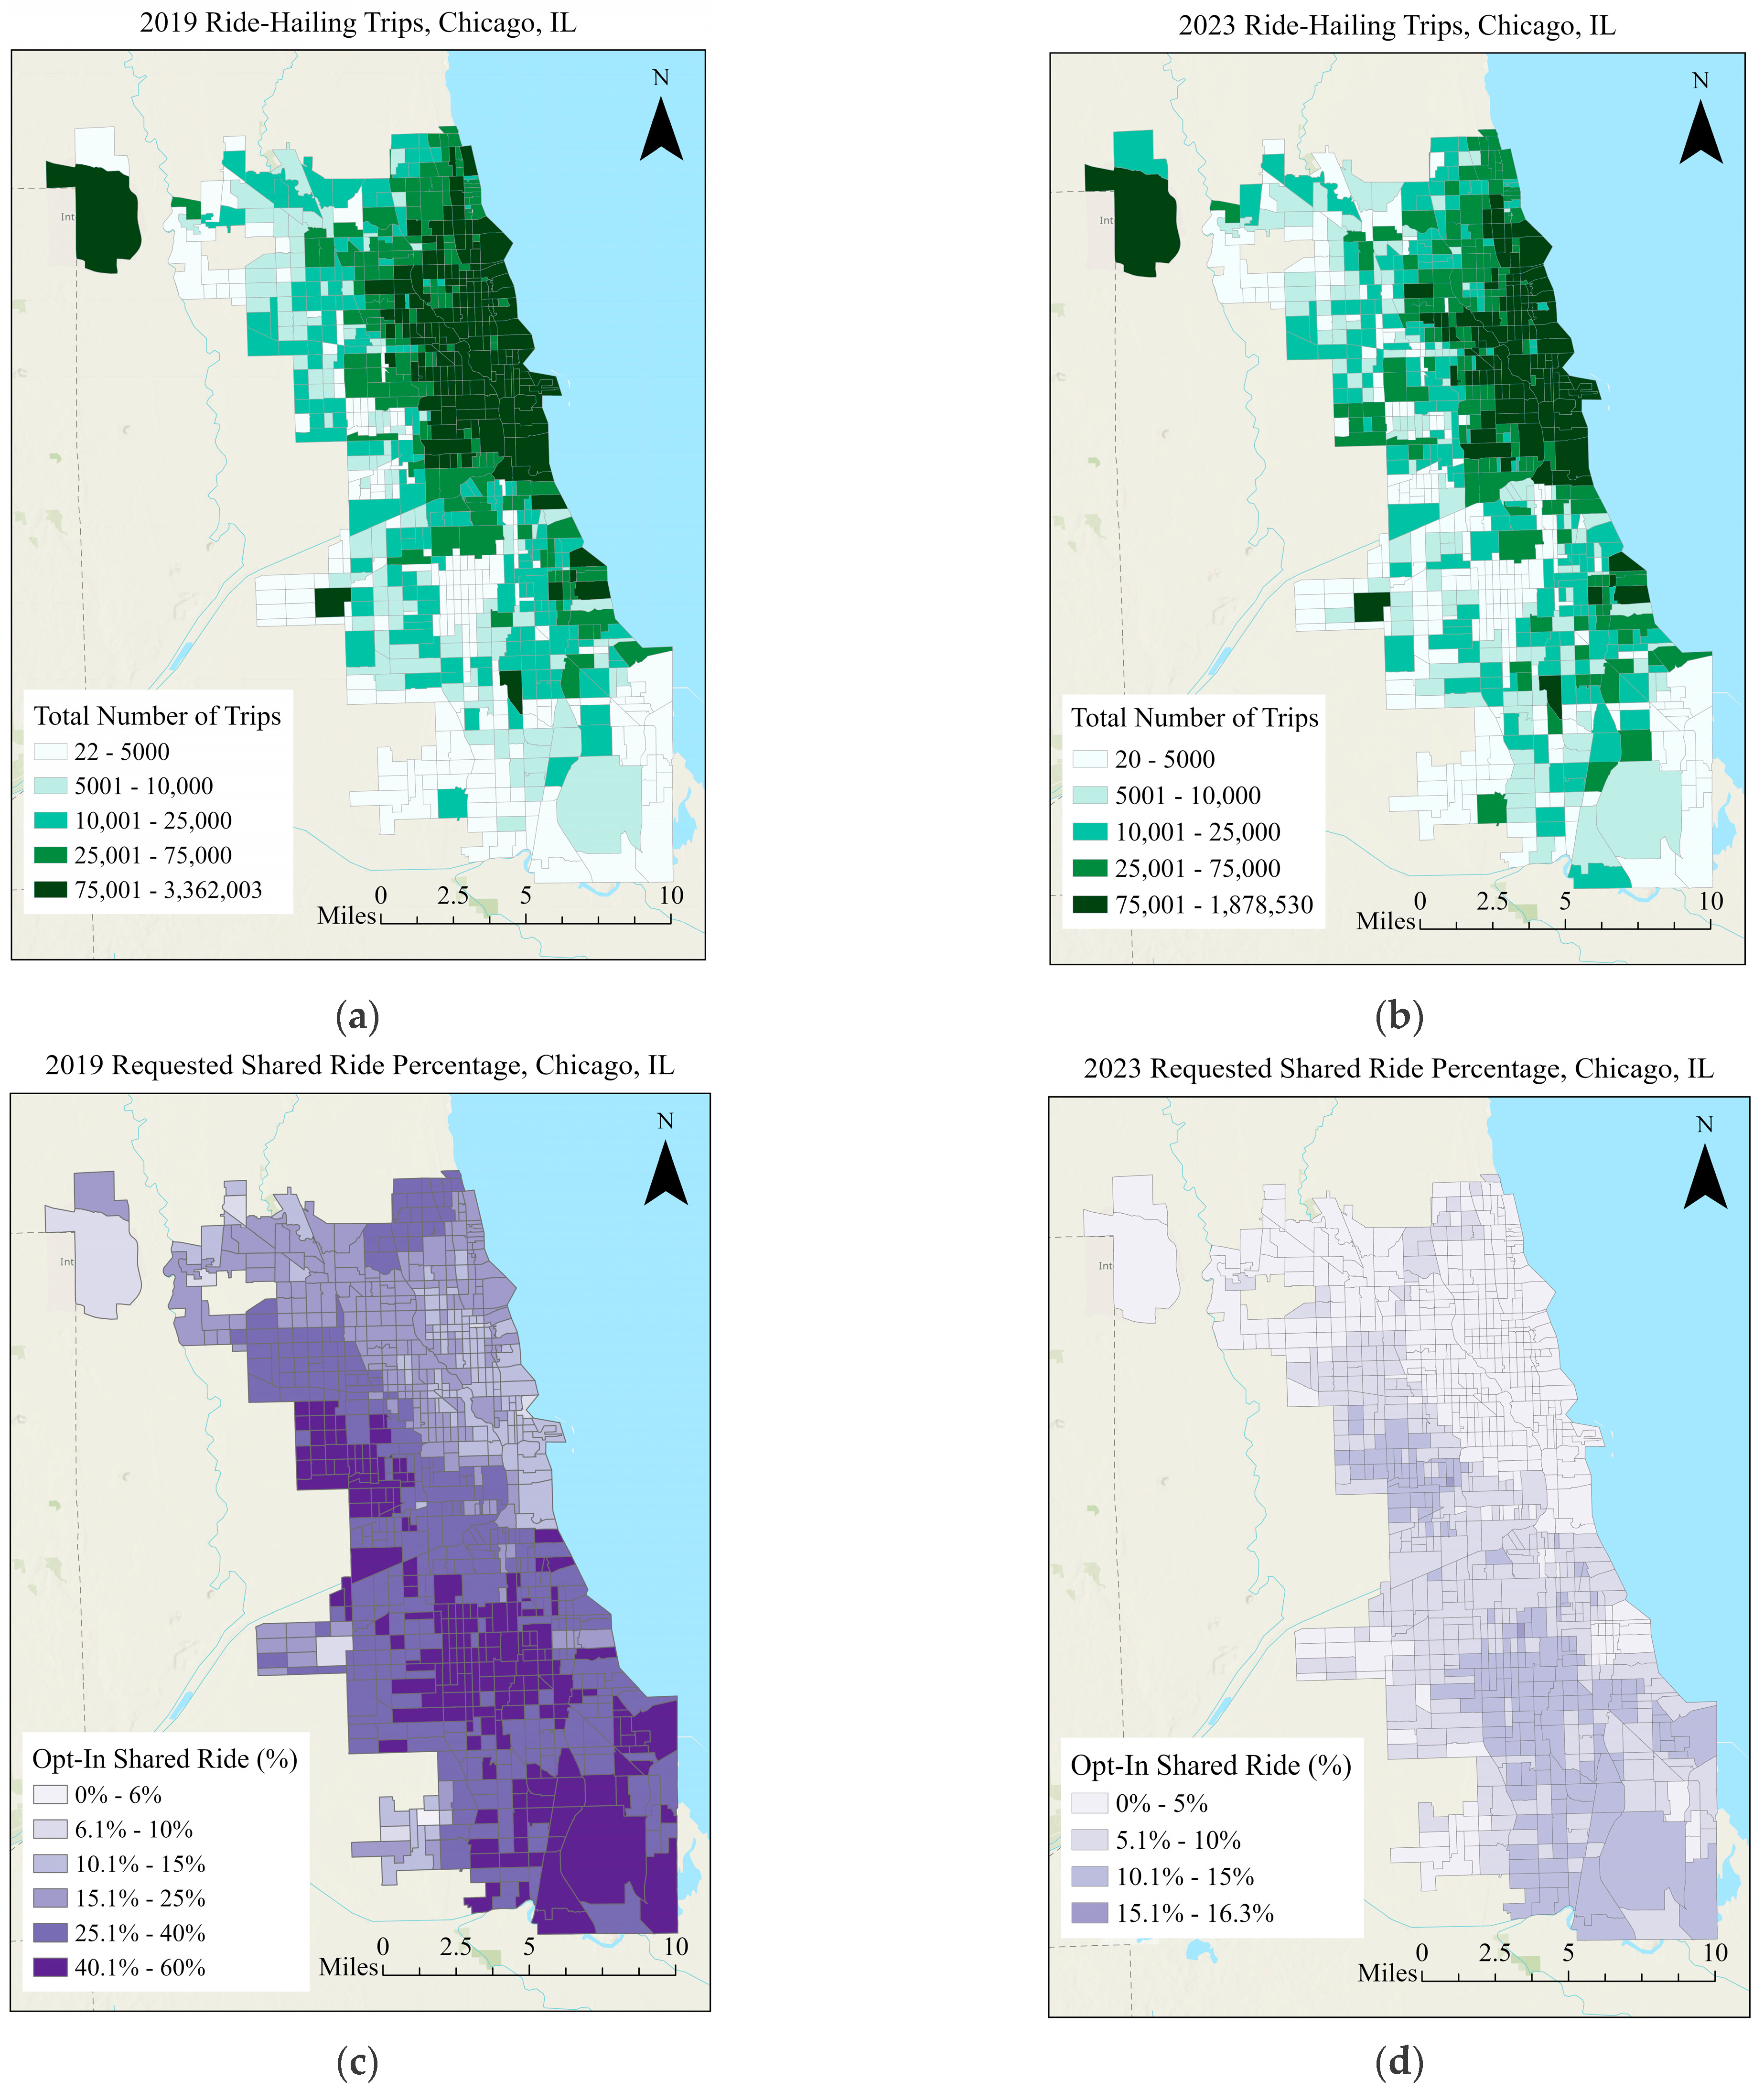
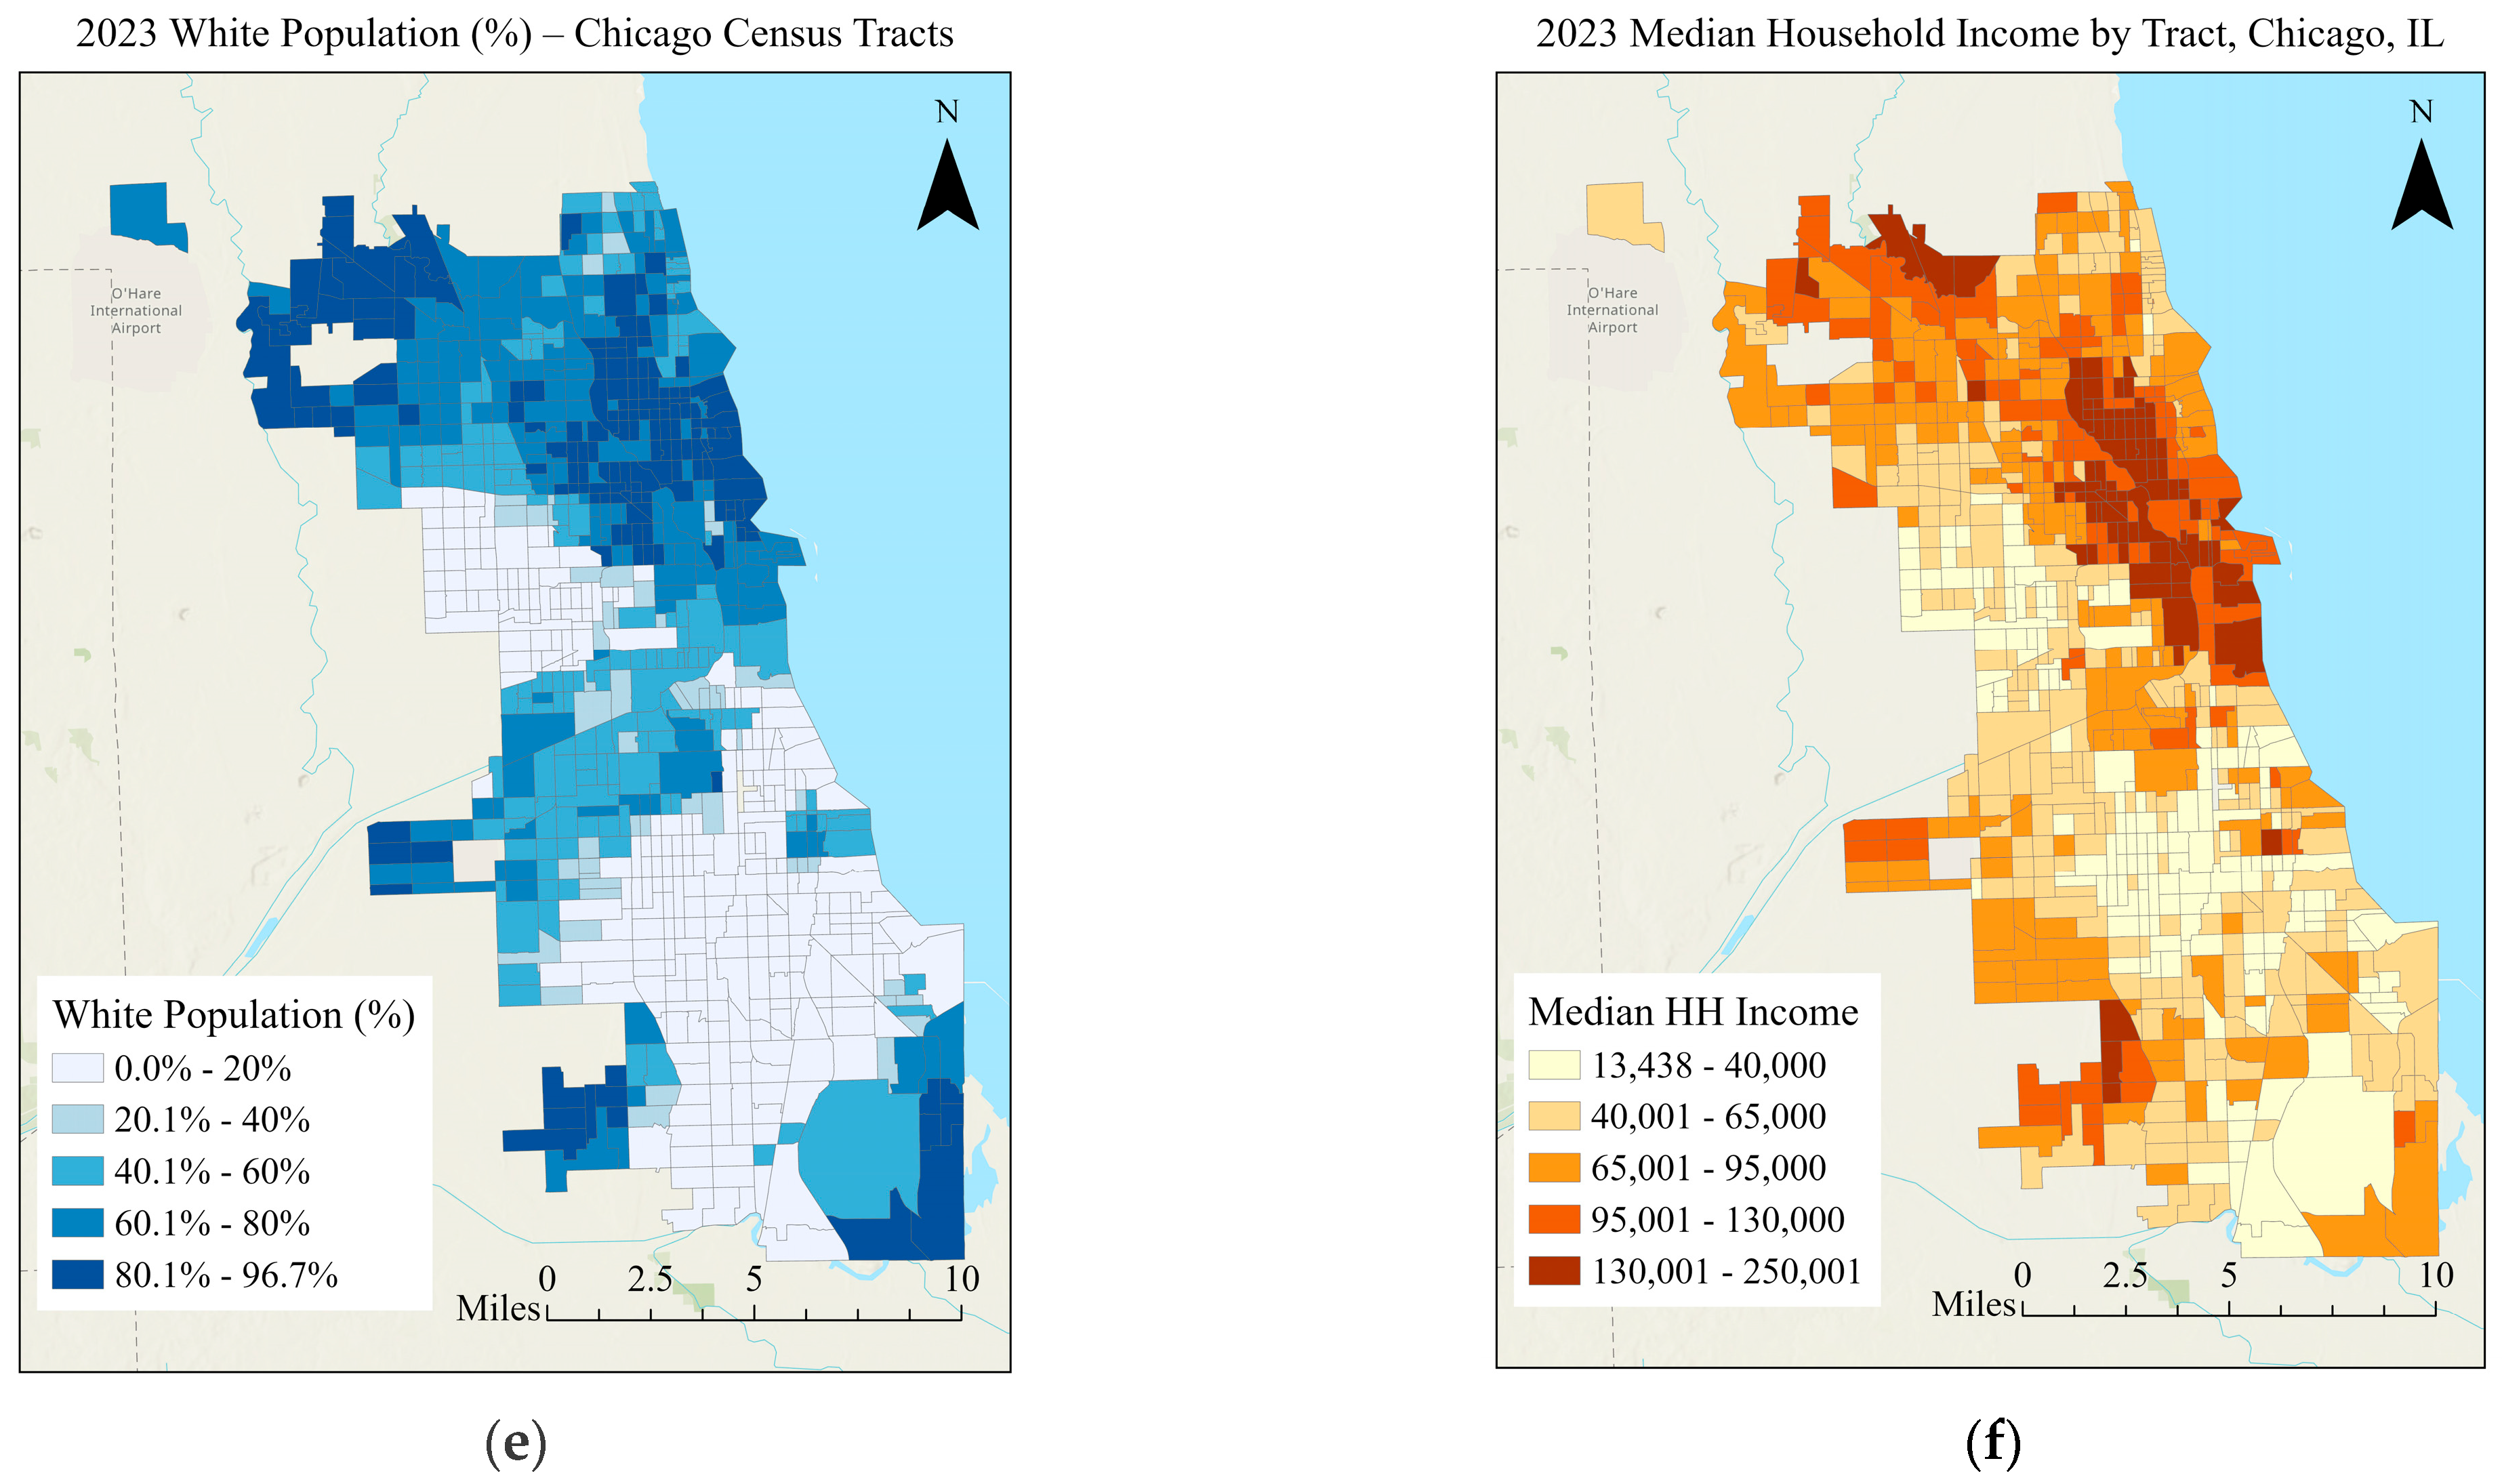
5.1. Descriptive Analysis

Figure 2 illustrates the total number of trips and shared trips for both years, represented by blue and yellow bars, respectively, while the percentage of shared trips is shown by a red line with points, indicating monthly changes throughout the year. This figure shows that while the overall number of monthly trips remained relatively stable, the percentage of shared trips fell significantly in April 2023, then gradually recovered to its highest level by year-end. We believe this modest increase reflects the behavioral shifts, such as greater comfort with sharing space post-pandemic. There were no significant pricing changes or incentives reported by TNCs during this time. Lyft, in fact, reduced support for shared rides earlier in the year, suggesting the increase in adoption was primarily driven by users.
In contrast, the gradual decline in shared ride percentages throughout 2019 may reflect a declining user preference for pooling, driven by increased per-mile costs and a shift in shorter trips to solo rides. Taiebat [32] found that, despite stable trip volumes and mileage, the share of requested pooled trips in Chicago steadily dropped throughout 2019, primarily due to changes in pricing and ride-type selection patterns.
Notably, the total number of ride-hailing trips in 2023 was 36% lower than in 2019, closely mirroring the 41% decrease in CTA ridership compared to pre-pandemic levels [33]. This concurrent decline may reflect broader shifts in commuting behavior, as telework appears to reduce demand for both ride-hailing and public transit. The sharp drop in shared ride usage in April 2023 also coincided with an increase of 21,000 rides on CTA services during that period. It is possible that some former shared ride users switched to public transit as an alternative, likely due to cost savings or convenience. To further analyze these patterns, the next section will examine trip density maps and ride-share maps across each census tract.
Figure 3a,b illustrate the total number of online TNC trips in the census tracts of Chicago for the years 2019 and 2023. Additionally, Figure 3c,d show the proportion of shared requested trips relative to total trips for both 2019 and 2023. Figure 3e,f show the average median income of households and the percentage of the white population in each census tract. As observed, the highest concentration of total trips in both years occurred in the eastern and northern areas of the city, as well as around the O’Hare and Midway airports, indicating a high demand for ride-hailing services in these regions. However, the total number of ride-hailing trips drastically decreased following the COVID-19 pandemic, dropping from over 67 million trips in 2019 to approximately 43 million in 2023. The decline was even more drastic for shared trips, which fell from 11 million to just 1.3 million.
The map of shared trips reveals that the highest densities were in the southern and western areas, with both airports contributing only a small share of shared rides. Comparing all four images shows that while northern and eastern areas exhibit a high volume of total trips, indicating substantial demand and a greater likelihood of finding a shared ride with shorter wait times, shared rides are relatively less popular in these high-demand areas. Conversely, despite having a lower overall trip demand, the western and southern areas exhibit a higher proportion of shared rides. This may reflect unique regional or demographic characteristics. Figure 3e,f show that the white population and average household income percentage follow the same pattern as the total number of ride-hailing trips. It also shows how the number of shared trips is associated with high earnings and white-dominant areas. To further explore these patterns, we will examine the results from the XGBoost and OLS models.

5.2. Statistical Analysis

For both model years, we utilized an 80/20 train–test split. This approach was implemented to mitigate the risk of overfitting and to assess the model’s predictive performance on previously unobserved data.
Regarding the 2023 data, the XGBoost model demonstrated a test R2 of 0.85 and a training R2 of 0.95. Similarly, for the 2019 data, the test R2 was 0.87, with a training R2 of 0.98. These outcomes collectively indicate the strong predictive capability of the XGBoost model. Given that the modeling process is deterministic under fixed conditions, repeated executions with identical data and parameters consistently yielded these results, thereby reinforcing the reliability of the reported performance metrics.
In contrast, the Ordinary Least Squares (OLS) model produced an R2 of 0.643 for the 2023 and 0.722 for the 2019 data. A comprehensive summary of the performance metrics for the XGBoost and OLS models is presented in Table 4.
Based on the results of the OLS models for both years, the constant term in 2023 decreased by more than 77% compared to 2019, indicating an overall decline in the baseline popularity of shared TNC trips. This trend is also reflected in most of the statistically significant independent variables (as indicated by their p-values). The main variables identified, such as the percentage of bachelor’s degree, population density, job density, walkability index, rail station and bus stop density, and crime incident density, have all been statistically significant in both years under study. Table 5 and Table 6 show the OLS results. These variables can be compared across the two years for further analysis.
As observed, there is a higher tendency for shared trips in census tracts with a higher percentage of non-white populations, lower incomes, higher crime incident rates, limited higher job accessibility, and inadequate pedestrian-friendly infrastructure. Although these census tracts host fewer ride-hailing trips compared to the citywide average, the higher percentage of shared trips reflects distinct demographic and urban characteristics. Therefore, by employing more advanced modeling techniques that can capture non-linear relationships (such as XGBoost in our study) and comparing changes in independent variables over time, particularly in relation to the pre-COVID-19 period, we can have a deeper understanding of the key factors behind the decline in the popularity of shared rides. By bypassing OLS limits such as linearity, nature, and autocorrelations, this analysis can help identify solutions to address the challenges affecting shared ride adoption.
Based on Table 4, it is evident that the XGBoost model performs better in predicting the root causes of shared trips. The strong performance metrics indicate that the model effectively captures the complex, non-linear relationships within the data, both before and after the COVID-19 pandemic. This result suggests that the selected variables were effective in capturing the key factors influencing ride-sharing decisions despite the temporal differences.
Following model training, we used SHAP values to interpret each feature’s contribution to the predicted likelihood of shared trips. To compare changes in predictor influence over time, we examined shifts in SHAP value rankings and dependency plot patterns between the 2019 and 2023 models, focusing on differences in variable importance and threshold behavior. This method not only identified the most influential variables in each year but also revealed how their predictive impact changed between 2019 and 2023, offering insight into how shared ride behavior evolved in the post-pandemic period. The SHAP summary plots for 2019 and 2023 further highlight the significant influence of demographic, socio-economic, and urban characteristic variables on the likelihood of shared trips. As shown in Figure 4, the percentage of non-white residents consistently emerges as the most influential predictor in both years, with higher values of this variable strongly associated with an increased probability of requesting a shared ride.
In addition to race, socio-economic factors such as median income, bachelor’s degree percentages, and population density are also important variables in predicting the likelihood of shared rides. In the 2019 data, lower median income and population density were associated with a higher ride-sharing intention, which persisted in 2023. Nonetheless, median income remains a key determinant in both years, with lower-income areas continuing to show a stronger tendency toward shared trips. Crime density is a significant factor in both years, with higher crime rates positively correlated with the likelihood of shared rides.
In 2019, the SHAP values show that the percentage of households without a car was positively correlated with the likelihood of shared trips. Areas with a higher proportion of carless households had a stronger tendency to rely on shared ride-hailing services. This is consistent with expectations, as households without access to a private vehicle depend more on alternative transportation options, including shared rides, to meet their mobility needs. For individuals in these areas, sharing rides likely provided a cost-effective option. However, by 2023, the relationship between the percentage of households without a car and shared trips has dropped significantly. Therefore, investigating SHAP dependency plots of the zero auto ownership percentages and other variables is needed to further analyze the complex impact of our dependent variables. Figure 5 illustrates the shift in SHAP-based feature importance rankings between 2019 and 2023. Green arrows indicate variables that moved up in rank over time, while red arrows represent variables that declined in relative importance. Gray arrows show features whose rankings remained unchanged. It can be seen that the bachelor’s degree %, which was the second most important factor in 2019, has fallen from second to fourth, and walkability had a considerable leap from ninth to sixth, while zero auto ownership% became the second least important factor.
To further understand how the most significant factors have influenced shared rides during the COVID-19 period, we examine the SHAP dependence plots. These plots illustrate the relationship between a feature’s value and its SHAP value, which reflects the impact of that feature on the model’s prediction for each instance. The X-axis represents the actual value of the feature, while the Y-axis shows the SHAP value, indicating the contribution of that feature to the prediction.
In Figure 6, we observe the effect of the percentage of the non-white population in each census tract. The plot shows that as the percentage of non-white residents increases, the SHAP value also rises, indicating a stronger positive influence on the likelihood of shared rides. Interestingly, the critical breakpoint—or the threshold where shared trips become more likely—has shifted from approximately 78% to 90% of the non-white population between 2019 and 2023. This suggests that neighborhoods with very high concentrations of non-white residents have seen a decline in shared ride usage, aligning with our earlier findings of increased unshared trips and a lower shared ride rate in predominantly non-white census tracts.
Figure 7 displays the impact of median income on the likelihood of sharing rides for both 2019 and 2023. It shows that in 2019, the influence of median income on ride-sharing decisions started to decline around a threshold of USD 58,000. Residents of the census tracts with median incomes below this level were more likely to engage in shared rides, with higher SHAP values reflecting a stronger positive impact on the probability of sharing. In 2023, however, this threshold has shifted downward to approximately USD 53,000, suggesting that shared rides have become less common even in census tracts with slightly lower incomes. The sharp decline in SHAP values beyond this threshold indicates that as median income rises, the likelihood of sharing rides decreases significantly, underscoring a preference for unshared trips among higher-income residents.
Figure 8 displays the impact of the percentage of residents with a bachelor’s degree or higher on ride-sharing behavior. In 2019, shared rides were more common in census tracts where fewer than 10% of residents held a bachelor’s degree or higher, as indicated by the positive SHAP values in this range. Beyond this 10% threshold, the likelihood of shared rides sharply decreased, reflecting a strong negative relationship between higher education levels and ride-sharing. By 2023, however, the breakpoint has shifted, with a more gradual decline observed until around 20% of the population holds a bachelor’s degree or higher. Additionally, areas with less than 5% higher-educated residents show a notable change in behavior, as the SHAP values for this group approach zero or even negative values, indicating a reduced preference for shared rides. This trend suggests that shared ride adoption has decreased even in areas with very low-educated residents.
Figure 9 shows the impact of crime density on the likelihood of shared ride adoption. As shown in the plots, the influence of crime density remains relatively stable in areas with fewer than five crimes per square mile. In these lower-crime areas, the SHAP values indicate minimal change between 2019 and 2023, suggesting that although crimes are important factors that influence shared rides, they have not been a significant factor affecting the behavioral change regarding shared rides in these regions.
The SHAP dependence plot for the average frequency of transit service (Figure 10) shows that, in both 2019 and 2023, areas with very low transit frequency (less than three) exhibited minimal interest in shared rides. However, there is a noticeable increase in shared ride usage in areas with moderate transit service (between three and fifteen). Beyond this point, as transit frequency increases further, there is a significant drop in the likelihood of shared rides.

6. Discussion

The percentage of the non-white population was the most important factor in both years. This finding aligns with the literature, which indicates that shared trips are more popular in minority communities [34], but it is in contrast with other studies that found discrimination and an unpleasant experience may reduce the willingness of the non-white population to use ride-sharing services [21,22]. This suggests that in certain urban environments, socio-economic factors such as lower vehicle ownership, greater reliance on affordable transportation, and denser population centers may outweigh the barriers posed by discrimination. Non-white residents in Chicago may be more inclined to use shared ride services due to cost sensitivity and limited access to private vehicles, which aligns with previous studies emphasizing the economic motivations for shared rides [16]. These findings highlight the complex relationship between race, socio-economic status, and shared ride preferences, indicating that local context influences ride-hailing behaviors, particularly in diverse urban areas. However, SHAP dependence plots show that the tendency to share rides has become less sensitive to the effect of race after the COVID-19 pandemic, showing that individuals in areas with a non-white population between 78% and 90%, who previously shared rides more frequently, have shifted towards not taking trips, using unshared rides, or using other modes of transportation. This may reflect increased concerns about health and safety post-pandemic, as well as the availability of more transportation options for these communities. In contrast, tracts with a higher percentage of non-white residents (above 90%) appear to continue using shared rides at higher rates. This suggests that while mid-range non-white areas have started opting out of shared rides, communities with higher concentrations of non-white residents may still rely on shared ride-hailing due to economic constraints or the limited availability of alternative transportation [35].
The reduced effect of job accessibility in 2023 may reflect changes in commuting patterns, particularly as more individuals shifted to remote work or alternative modes of transportation after the pandemic [36]. Our other findings, regarding the job density, median income, and high education also suggests that the teleworking has resulted in reduced number of shared trips, where in high educated areas where the teleworking is more possible, the sharing rate of ride hailing has been decreased but in less educated areas where the teleworking is a less available option, the demand for sharing shared trips has remained the same. Additionally, in the downtown area, which has a highly educated population, a dense concentration of jobs, and better pedestrian infrastructure, the proximity of jobs to residential areas also contributes to the decline in shared rides. In such areas, given the frequent traffic jams and difficulties finding a parking space, active transportation modes like walking or cycling are often preferred over shared ride-hailing or private cars, further reducing the demand for shared rides.
The results regarding crime density suggest that in higher-crime areas, where income levels may be lower [37], residents are more inclined to share rides, potentially viewing it as a more convenient and safer transportation option compared to active modes such as walking or biking in less walkable and potentially dangerous areas or public transit where they still need to wait longer in transit stations and be potentially more exposed to crimes. This finding supports earlier work suggesting that shared ride-hailing may serve as a perceived safer alternative to walking or transit in high-crime areas [24]. Previous studies have shown that one of the main deterrents to sharing rides in ride-hailing services is the safety and discomfort concerns associated with being in a confined space with strangers [38]; however, the influence of cost may outweigh concerns about safety and social discomfort, leading individuals in lower-income or high-crime areas to choose shared rides despite these concerns. Interestingly, as can also be seen in dependency plots, despite the consistent importance of crime density, its influence remains relatively stable between 2019 and 2023, even as the impact of other variables has shifted or changed over time.
Transportation infrastructure also indicates notable impacts on shared ride preferences. Opposite to what might be expected, population density, job density, and network density are negatively associated with the likelihood of sharing a trip in both years. The SHAP summary plots indicate that shared trips are more likely to occur in areas with a lower population and job density, which contrasts with denser urban areas like downtown, where ride-hailing trips are more frequent (Figure 3a,b) but less likely to be shared Figure 3c,d). This pattern may reflect the socio-economic and infrastructural differences between regions. For instance, areas with a high job density, such as downtown, tend to have a higher concentration of solo ride-hailing trips due to leisure and shopping trips, while shared trips are more prevalent in lower-density areas such as the western and southern parts of the city. While previous studies have noted that ride-pooling often complements public transit and can be more viable in dense, infrastructure-rich areas [2,4], our findings suggest that in the post-pandemic context, socio-economic factors may be more influential than transit availability in shaping ride-sharing behavior. This indicates that while shared trips are more common in denser urban environments, they are less reliant on traditional transit infrastructure or fixed routes and more influenced by broader socio-economic and demographic factors. By improving the transportation infrastructure in less-served areas where the demand for shared trips is higher, ride-hailing users show a greater tendency to use public transportation instead. However, it is worth noting that spatial spillover effects, such as transit access or behavior in one neighborhood influencing neighboring areas, are not explicitly captured by the XGBoost model, which operates under an assumption of spatial independence. As such, some patterns related to transportation infrastructure may be underestimated or diffuse across tract boundaries.

7. Conclusions

This study examined the factors influencing shared Transportation Network Company (TNC) trips in Chicago before and after the COVID-19 pandemic, comparing data from 2019 to 2023. Our results show a substantial decline in the proportion of shared trips, dropping from the average of 16% in 2019 to just 2.91% in 2023. This decline is attributed to several factors, including shifting travel behaviors, increased remote work, and changing socio-economic conditions.
Our analysis using XGBoost and SHAP values revealed that the percentage of the non-white population remained the most significant predictor of shared trip adoption in both years, reaffirming that shared ride-hailing is more commonly used in minority communities. However, the post-pandemic period saw a reduction in sensitivity to racial composition, suggesting that external factors such as cost concerns, safety perceptions, and new travel alternatives may be altering the role of race in shared ride decisions. Additionally, median income, job accessibility, and education levels considerably influenced shared ride participation, with lower-income areas and communities with limited job access demonstrating a higher likelihood of using shared services. Notably, while higher-income and white-dominant areas generate a larger total number of ride-hailing trips, they exhibit a lower percentage of shared rides, indicating a stronger preference for private trips. Given that these areas are generally less sensitive to pricing incentives, increasing service quality, such as improving ride matching efficiency, reducing waiting times, along with targeted awareness campaigns, could help encourage shared ride adoption.
The built environment also played an important role, with walkability, transit accessibility, and crime density emerging as key determinants of shared ride adoption. Interestingly, we found that high-crime areas had a stronger reliance on shared rides, possibly due to safety concerns associated with walking or public transit. However, despite transit frequency being a relevant factor, shared rides were less common in dense, transit-rich areas, bringing the possibility of TNCs serving as a complement rather than a substitute for public transit.
The post-pandemic landscape has reshaped ride-sharing dynamics, with teleworking and changing commuter patterns decreasing the necessity for shared trips in traditionally high-demand areas. In contrast, lower-income and transit-dependent areas have maintained their reliance on shared rides, though at lower overall rates. These findings highlight the importance of targeted policy interventions to revitalize shared mobility, particularly in underserved communities, while also exploring strategies to increase shared ride adoption in high-income areas.
To increase shared ride adoption in the post-pandemic era, policymakers and providers should consider a dual strategy tailored to both lower and higher-income areas. In underserved or transit-poor neighborhoods, efforts should focus on improving integration with public transit and expanding access to shared rides to ensure equitable mobility options. In higher-income areas, where shared ride usage remains low, although we believe more comprehensive studies are needed to identify the attitudinal barriers, cities could implement dedicated ride-pooling lanes or preferred curb zones to reduce waiting and travel time and improve convenience. Additionally, integrating ride-pooling into corporate commuter benefit programs could incentivize adoption by embedding shared mobility into workplace culture. These strategies, aligned with shifting commuter behavior, can support more inclusive, efficient, and sustainable urban transportation systems.

Limitations and Future Studies

This study, while providing valuable insights, has several limitations that are important to consider. Our analysis was conducted at the census tract level, which effectively identifies spatial patterns but does not directly capture individual-level behaviors or motivations. Although we aligned 2023 data with 2019 census tract boundaries to enable a consistent comparison, this spatial harmonization may introduce minor distortions in areas where boundary changes occurred. We also excluded trips with missing geographic data, which might affect the overall representativeness of our findings. Due to limited access to COVID-19 case data at the tract level, we could not directly examine health-related impacts on ride-sharing behavior. Additionally, the absence of private operational data from TNCs, such as specific pricing strategies, driver supply, and algorithmic changes, limits our ability to account for supply-side dynamics fully. While crime density was found to be a significant predictor of ride-pooling usage, our analysis used overall crime rates and did not differentiate between crime types. Disaggregating crime categories could provide more nuanced insights, and subsequent research may investigate how specific crime types relate to shared ride adoption. Building on this work, future analyses could also incorporate survey-based data, individual-level trip records, and health-related variables to offer deeper behavioral insights. Future studies could build upon this work by incorporating survey-based data, individual-level trip records, and health-related variables to offer deeper behavioral insights.
Finally, future research should continue to explore the long-term recovery of shared ride services, the role of emerging business models, and the influence of new mobility options (e.g., micromobility) in reshaping ride-pooling demand. Shared rides remain a promising element of sustainable urban mobility, but their continued viability will depend on adaptive strategies that address both behavioral and operational challenges.

Author Contributions

Conceptualization, Afshin Allahyari and Farideddin Peiravian; methodology, Afshin Allahyari and Farideddin Peiravian; software Afshin Allahyari; validation, Afshin Allahyari and Farideddin Peiravian; formal analysis, Afshin Allahyari; investigation, Afshin Allahyari; resources, Afshin Allahyari and Farideddin Peiravian; data curation, Afshin Allahyari; writing—original draft preparation, Afshin Allahyari; writing—review and editing, Afshin Allahyari and Farideddin Peiravian; visualization, Afshin Allahyari; supervision, Farideddin Peiravian. All authors have read and agreed to the published version of the manuscript.

Funding

This research received no external funding.

Data Availability Statement

The data presented in this study are available on request from the corresponding author due to preparation and formatting requirements.

Conflicts of Interest

The authors declare no conflict of interest.

References

  1. Cai, H.; Wang, X.; Adriaens, P.; Xu, M. Environmental Benefits of Taxi Ride Sharing in Beijing. Energy 2019, 174, 503–508. [Google Scholar] [CrossRef]
  2. De Ruijter, A.; Cats, O.; Alonso-Mora, J.; Hoogendoorn, S. Ride-Pooling Adoption, Efficiency and Level of Service under Alternative Demand, Behavioural and Pricing Settings. Transp. Plan. Technol. 2023, 46, 407–436. [Google Scholar] [CrossRef]
  3. Yan, L.; Luo, X.; Zhu, R.; Santi, P.; Wang, H.; Wang, D.; Zhang, S.; Ratti, C. Quantifying and Analyzing Traffic Emission Reductions from Ridesharing: A Case Study of Shanghai. Transp. Res. Part D Transp. Environ. 2020, 89, 102629. [Google Scholar] [CrossRef]
  4. Cats, O.; Kucharski, R.; Danda, S.R.; Yap, M. Beyond the Dichotomy: How Ride-Hailing Competes with and Complements Public Transport. PLoS ONE 2022, 17, e0262496. [Google Scholar] [CrossRef]
  5. Shaheen, S.; Cohen, A.; Zohdy, I. Shared Mobility: Current Practices and Guiding Principles; Federal Highway Administration: Washington, DC, USA, 2016.
  6. Shulika, O.; Bujak, M.; Ghasemi, F.; Kucharski, R. Spatiotemporal Variability of Ride-Pooling Potential—Half a Year New York City Experiment. J. Transp. Geogr. 2024, 114, 103767. [Google Scholar] [CrossRef]
  7. Shulika, O.; Kucharski, R. Can We Start Sharing Our Rides Again? The Postpandemic Ride-Pooling Market. Transp. Telecommun. 2025, 26, 194–207. [Google Scholar]
  8. Shafiee, A.; Rastegar Moghadam, H.; Merikhipour, M.; Lin, J. Analyzing Post-Pandemic Remote Work Accessibility for Equity through Machine Learning Analysis. In Proceedings of the International Conference on Transportation and Development 2024, Atlanta, GA, USA, 15–18 June 2024; pp. 453–462. [Google Scholar]
  9. Shamshiripour, A.; Rahimi, E.; Shabanpour, R.; Mohammadian, A. (Kouros) How Is COVID-19 Reshaping Activity-Travel Behavior? Evidence from a Comprehensive Survey in Chicago. Transp. Res. Interdiscip. Perspect. 2020, 7, 100216. [Google Scholar] [CrossRef] [PubMed]
  10. Bursztynsky, J. Uber Restarting Shared Rides in U.S. Cities like New York and San Francisco. Available online: https://www.nbcnews.com/tech/tech-news/uber-restarting-shared-rides-us-cities-new-york-san-francisco-rcna34532 (accessed on 6 February 2025).
  11. Gastelu, G. Uber, Lyft and Other Apps Suspend Shared Rides Due to Coronavirus. Available online: https://www.foxnews.com/auto/uber-lyft-suspend-shared-rides-coronavirus (accessed on 5 February 2025).
  12. Davalos, J. Lyft Will Discontinue Pooled Rides. The Mercury News, 11 May 2023. Available online: https://www.mercurynews.com/2023/05/11/lyft-will-discontinue-pooled-rides (accessed on 25 July 2025).
  13. Fitzpatrick, A.; Beheraj, K. Where Public Transit Is Recovering—And Where It’s Not. Available online: https://www.axios.com/2023/12/14/public-trasnportation-transit-america-recovery-pandemic-covid (accessed on 6 February 2025).
  14. Roman, A. Public Transit Ridership Continues Post-COVID Bounce Back. Available online: https://www.metro-magazine.com/10216134/public-transit-ridership-continues-post-covid-bounce-back (accessed on 6 February 2025).
  15. de Ruijter, A.; Cats, O.; van Lint, H. Ridesourcing Platforms Thrive on Socio-Economic Inequality. Sci. Rep. 2024, 14, 7371. [Google Scholar] [CrossRef]
  16. Brown, A.E. Who and Where Rideshares? Rideshare Travel and Use in Los Angeles. Transp. Res. Part A Policy Pract. 2020, 136, 120–134. [Google Scholar] [CrossRef]
  17. Lavieri, P.S.; Bhat, C.R. Modeling Individuals’ Willingness to Share Trips with Strangers in an Autonomous Vehicle Future. Transp. Res. Part A Policy Pract. 2019, 124, 242–261. [Google Scholar] [CrossRef]
  18. Shoman, M.; Moreno, A.T. Exploring Preferences for Transportation Modes in the City of Munich after the Recent Incorporation of Ride-Hailing Companies. Transp. Res. Rec. J. Transp. Res. Board. 2021, 2675, 329–338. [Google Scholar] [CrossRef]
  19. Kang, S.; Mondal, A.; Bhat, A.C.; Bhat, C.R. Pooled versus Private Ride-Hailing: A Joint Revealed and Stated Preference Analysis Recognizing Psycho-Social Factors. Transp. Res. Part C Emerg. Technol. 2021, 124, 102906. [Google Scholar] [CrossRef]
  20. Zheng, H.; Chen, X.; Chen, X. How Does On-Demand Ridesplitting Influence Vehicle Use and Purchase Willingness? A Case Study in Hangzhou, China. IEEE Intell. Transp. Syst. Mag. 2019, 11, 143–157. [Google Scholar] [CrossRef]
  21. Ge, Y.; Knittel, C.R.; MacKenzie, D.; Zoepf, S. Racial Discrimination in Transportation Network Companies. J. Public Econ. 2020, 190, 104205. [Google Scholar] [CrossRef]
  22. Middleton, S.; Zhao, J. Discriminatory Attitudes between Ridesharing Passengers. Transportation 2020, 47, 2391–2414. [Google Scholar] [CrossRef]
  23. Kong, H.; Zhang, X.; Zhao, J. How Does Ridesourcing Substitute for Public Transit? A Geospatial Perspective in Chengdu, China. J. Transp. Geogr. 2020, 86, 102769. [Google Scholar] [CrossRef]
  24. Ghaffar, A.; Mitra, S.; Hyland, M. Modeling Determinants of Ridesourcing Usage: A Census Tract-Level Analysis of Chicago. Transp. Res. Part C Emerg. Technol. 2020, 119, 102769. [Google Scholar] [CrossRef]
  25. Friedman, J.H. Greedy Function Approximation: A Gradient Boosting Machine. Ann. Statist. 2001, 29, 1189–1232. [Google Scholar] [CrossRef]
  26. Chen, T.; Guestrin, C. XGBoost: A Scalable Tree Boosting System. In Proceedings of the Proceedings of the 22nd ACM SIGKDD International Conference on Knowledge Discovery and Data Mining, San Francisco, CA, USA, 13 August 2016; pp. 785–794. [Google Scholar]
  27. Badr, W. Why Feature Correlation Matters … A Lot! Towards Data Science, 18 January 2019. Available online: https://towardsdatascience.com/why-feature-correlation-matters-a-lot-847e8ba439c4 (accessed on 25 July 2025).
  28. Lundberg, S.M.; Lee, S.-I. A Unified Approach to Interpreting Model Predictions. In Proceedings of the 31st International Conference on Neural Information Processing Systems (NIPS’17); Curran Associates Inc.: Red Hook, NY, USA, 2017; pp. 4768–4777. [Google Scholar] [CrossRef]
  29. Shapley, L.S. A Value for n-Person Games. In Contributions to the Theory of Games (AM-28), Volume II; Kuhn, H.W., Tucker, A.W., Eds.; Princeton University Press: Princeton, NJ, USA, 1953; pp. 307–318. ISBN 978-1-4008-8197-0. [Google Scholar]
  30. Štrumbelj, E.; Kononenko, I. Explaining Prediction Models and Individual Predictions with Feature Contributions. Knowl. Inf. Syst. 2014, 41, 647–665. [Google Scholar] [CrossRef]
  31. Molnar, C. Interpretable Machine Learning: A Guide for Making Black Box Models Explainable, 3rd ed.; Self-Published, 2023; Available online: https://christophm.github.io/interpretable-ml-book/ (accessed on 25 July 2025).
  32. Taiebat, M.; Amini, E.; Xu, M. Sharing Behavior in Ride-Hailing Trips: A Machine Learning Inference Approach. Transp. Res. Part D Transp. Environ. 2022, 103, 103166. [Google Scholar] [CrossRef]
  33. Chicago Transit Agency. CTA Annual Ridership Report, 2023 Full Year Report; Chicago Transit Agency: Chicago, IL, USA, 2024.
  34. Igielnik, R.; Anderson, M. Ride-Hailing Services Are Seen by Minorities as a Benefit to Areas Underserved by Taxis; Pew Research Center: Washington, DC, USA, 2016. [Google Scholar]
  35. Asgharpour, S.; Allahyari, A.; Mohammadi, M.; Mohammadian, R.; Mohammadian, A.; Abraham, C. Investigating Equity of Public Transit Accessibility: Comparison of Accessibility among Disadvantaged Groups in Cook County, IL. In Proceedings of the International Conference on Transportation and Development, Austin, TX, USA, 14–17 June 2023; pp. 639–650. [Google Scholar] [CrossRef]
  36. Liu, L.; Miller, H.J.; Scheff, J. The Impacts of COVID-19 Pandemic on Public Transit Demand in the United States. PLoS ONE 2020, 15, e0242476. [Google Scholar] [CrossRef] [PubMed]
  37. Hipp, J.R.; Yates, D.K. Ghettos, Thresholds, and Crime: Does Concentrated Poverty Really Have an Accelerating Increasing Effect on Crime?*: Poverty and Crime. Criminology 2011, 49, 955–990. [Google Scholar] [CrossRef]
  38. Mitropoulos, L.; Kortsari, A.; Ayfantopoulou, G. A Systematic Literature Review of Ride-Sharing Platforms, User Factors and Barriers. Eur. Transp. Res. Rev. 2021, 13, 61. [Google Scholar] [CrossRef] [PubMed]
Figure 1. Workflow of data processing, modeling, and SHAP-based analysis.
Ijgi 14 00291 g001
Figure 2. Monthly trends of total trips and shared trips in 2019 and 2023. (a) Total trips (blue bars) and shared trips (orange bars) by month in 2019, with the percentage of shared trips shown by the red line; (b) total trips and shared trips by month in 2023, following the same format.
Ijgi 14 00291 g002
Figure 3. (a,b) Total number of TNC trips in the city of Chicago, 2019 and 2023; (c,d) percentage of requested shared ride in the city of Chicago, 2019 and 2023; (e) 2023 percentage of white population in the census tracts of Chicago; (f) 2023 median household income in the census tracts of Chicago.
Ijgi 14 00291 g003aIjgi 14 00291 g003b
Figure 4. SHAP summary plots of XGBoost model: (a) 2019; (b) 2023.
Ijgi 14 00291 g004
Figure 5. Changes in predictive importance of variables 2019 vs. 2023. Green arrows indicate features that increased in rank, red arrows indicate features that decreased, and gray arrows represent no change.
Ijgi 14 00291 g005
Figure 6. Sharp Dependency plot of the percentage of non-white population; (a) 2019; (b) 2023.
Ijgi 14 00291 g006
Figure 7. Sharp Dependency plot of the median income in census tracts; (a) 2019; (b) 2023.
Ijgi 14 00291 g007
Figure 8. Sharp Dependency plot of the percentage of residents holding a bachelor’s degree or higher; (a) 2019; (b) 2023.
Ijgi 14 00291 g008
Figure 9. Sharp Dependency plot of the crime density in census tracts; (a) 2019; (b) 2023.
Ijgi 14 00291 g009
Figure 10. Sharp Dependency plot of transit frequency in census tracts; (a) 2019; (b) 2023.
Ijgi 14 00291 g010
Table 1. Description of variables.
VariableDescriptionSource
Walkability index (0–20)A composite score (0 = least walkable, 20 = most walkable) reflects how friendly an area is for walking, based on land use mix, street connectivity, and pedestrian infrastructure.EPA Smart Location
Job accessibility (D5BR)Jobs within a 45-min transit commute.EPA Smart Location
Average transit frequency (D4D)The aggregate frequency of peak hour transit service per square mile in an area.EPA Smart Location
Road network density (mi/sq mi)Total length of roadway facilities in miles per square mile of land area.EPA Smart Location
Job density (jobs/acre)The number of jobs located per acre of an area, indicating job concentration.EPA Smart Location
Population density (pop/acre)Number of people per acre in an area, representing residential concentration.American Community Survey
Job/Pop ratioThe ratio of jobs to population in an area.EPA Smart Location
Median income (USD 1000/household)Median annual household income in thousands of dollars.American Community Survey
Percentage of non-white populationProportion of the population in an area that identifies as a race or ethnicity other than non-Hispanic white.American Community Survey
Percentage of bachelor’s or higher degreesPotion of population with a bachelor’s degree or higher in an area.American Community Survey
Percentage of households with no carPortion of households without owned cars in an area.American Community Survey
Bus stop density (stops/sq mi)Number of bus stops per square mile of an area.Chicago Metropolitan Agency for Planning
Rail station density (station/sq mi)Number of urban rail stations per square mile of an area.Chicago Metropolitan Agency for Planning
Crime density (crimes/sq mi)Number of crime incidents per square mile of an area Chicago Police Department (Chicago, IL, USA)
Table 2. 2019 Summary Statistics.
VariableMeanStdMinMax
Total number of trips79,383230,770393,307,656
Average cost (USD/trip)112823
Number of shared trips requested12,95329,50416463,168
Number of unshared trips66,430202,071232,844,488
Total shared (matched) trips10,09123,79211389,279
Shared (matched) trip percentage22.1%9.0%3.6%41.2%
Crime density (crimes/sq mi)168515851415,014
Walkability index (0-20)14.511.738.5819.67
Job accessibility by transit (D5BR)539247111498
Total transit frequency (d4d)188541201559,709
Average transit frequency (d4d)63711451412,637
Employment167812,3950331,288
Population3413187234720,087
Road network density (mi/sq mi)30.417.259.0468.66
Job density (jobs/acre)11.5454.5601216.63
Population density (pop/acre)29.4924.460.75403.82
Job/pop02044
Median income (USD 1000/household)60.47234.59911.146194.167
Percentage of bachelor’s or higher degrees15.5%11.4%0%45.5%
Percentage of non-white population69.4%29.5%7.6%100%
Percentage of households with no car26.6%15.1%0.5%75.3%
Bus stop density (stops/sq mi)63133203029
Rail station density (station/sq mi)10350399
Table 3. 2023 Summary Statistics.
VariableMeanStdMinMax
Total number of trips49,504142,267191,827,425
Average cost (USD/trip)18.91.814.532.7
Number of shared trips requested15292931038,347
Number of unshared trips47,975139,572191,789,078
Total Shared (matched) trips7841574022,411
Shared (matched) trip percentage3.2%2.1%0%9.9%
Crime density (crimes/sq mi)170913791415,332
Walkability index (0–20)14.51.78.619.7
Job accessibility by transit (D5BR)539247111498
Total transit frequency (d4d)188541201559,709
Average transit frequency (d4d)63711451412,637
Employment167812,3950331,288
Population3425186037519,889
Road network density (mi/sq mi)30.417.259.0468.66
Job density (jobs/acre)11.5454.5601216.63
Population density (pop/acre)29.5524.440.72411.31
Job/Pop0.421.89045.06
Median income (USD/household)74.04641.36113.438250.001
Percentage of bachelor’s or higher degrees16.5%11.5%0%48.5%
Percentage of non-white population69.9%28.7%10.4%100%
Percentage of households with no car4.4%3.9%0%28.2%
Bus stop density (stops/sq mi)63133203029
Rail station density (station/sq mi)10350399
Table 4. XGBoost and OLS performance.
Model2019 R22023 R2
XGBoost (Training Dataset)0.980.95
XGBoost (Test Dataset)0.870.85
OLS (Entire Dataset)0.7220.643
Table 5. 2019 OLS Results.
VariableCoefficientStd ErrorT-Statisticp-ValueVIF
Constant41.60801.62925.5370
Bachelor’s Degree %−0.53710.02−27.32404.4
Population Density−0.07310.009−8.06503.9
Job Density−0.0160.004−4.36601.4
Job Accessibility0.34090.0834.10808.5
Crime Density0.11290.0147.81903.8
Walkability Index−0.94260.118−7.98508.6
Bus Stop Density0.18530.0672.7660.0068
Rail Station Density−0.00760.005−1.4860.1381.2
R20.722
Adjusted R20.719
Table 6. 2023 OLS Results.
VariableCoefficientStd ErrorT-Statisticp-ValueVIF
Constant9.2850.42621.8120
Bachelor’s Degree %−0.09710.005−19.9304.4
Population Density−0.02490.002−10.66803.7
Job Density−0.00390.001−4.19501.3
Job Accessibility0.10550.0224.81308.6
Crime Density0.04720.00510.43504.8
Walkability Index−0.35450.031−11.5108.6
Bus Stop Density0.02190.0181.2310.2198.2
Rail Station Density−0.00280.001−2.0470.0411.25
R20.647
Adjusted R20.643
Disclaimer/Publisher’s Note: The statements, opinions and data contained in all publications are solely those of the individual author(s) and contributor(s) and not of MDPI and/or the editor(s). MDPI and/or the editor(s) disclaim responsibility for any injury to people or property resulting from any ideas, methods, instructions or products referred to in the content.

