


Abstract
Tyrosol and kynurenic acid (KYNA) are natural antioxidants with complementary radical-scavenging and photo-absorbing properties, but their combined performance in a cosmetic formulation has not been reported. We developed an oil-in-water (O/W) emulsion containing tyrosol, KYNA, or a 1:1 mixture, using an unloaded emulsion as control. Formulations were evaluated for four weeks at 4, 25, and 40 °C using differential scanning calorimetry (DSC), rheology, spreadability, centrifugation, pH, DPPH antioxidant activity, HPLC quantification and release through a dialysis membrane; compositional stability was assessed by elemental (CHN) analysis. Chemical equilibrium parameters showed a consistent trend: the first week represented a maturation phase, likely reflecting redistribution of actives within the matrix, followed by a stable equilibrium state. The results are therefore discussed as initial versus equilibrated conditions. At equilibrium, the binary formulation maintained a skin-compatible pH (4.40 ± 0.04) with lower variability than single-active systems. HPLC confirmed nominal loading without degradation (0.89 ± 0.08% tyrosol, 0.97 ± 0.10% KYNA, and 1.00 ± 0.18% total in the mixture). DPPH analysis of standards revealed cooperative antioxidant enhancement in the mixture, exceeding the activity of either compound alone. In the creams, this produced a modest but reproducible antioxidant effect (9.00 ± 3.94%, 8.91 ± 3.56%, and 7.02 ± 3.59% inhibition for tyrosol, KYNA, and the mixture, respectively, versus 0.67 ± 4.80% for the control). The mixture showed a significant sub-additive interaction only at 4 °C (p = 0.014). Mechanical stability depended mainly on storage temperature: centrifugation-induced phase separation increased from 8% to 28% between weeks 2 and 4 and was largely prevented at room temperature or above. In the dialysis model, the mixture markedly increased tyrosol release while reducing KYNA release, a behavior tentatively attributed to proton-exchange/keto–enol interactions. Overall, room temperature was the optimal storage condition, and the tyrosol-KYNA combination emerged as a stable, skin-compatible antioxidant system for topical application.
1. Introduction
The skin is continuously exposed to oxidative insult from ultraviolet radiation, atmospheric pollutants and pathogens, all of which drive the formation of reactive oxygen species (ROS) and accelerate extrinsic aging [1]. Topical antioxidants are among the most widely used functional ingredients in modern cosmetics precisely because they can intercept this cascade, by donating electrons or hydrogen atoms to propagating radicals, by chelating redox-active metals, or by absorbing the incident radiation itself [2]. Naturally occurring antioxidants are attractive in this context for their favorable safety and ecological profiles, although they frequently suffer from limited stability, photosensitivity and low bioavailability that complicate their incorporation into finished products [3].
Tyrosol (2-(4-hydroxyphenyl)ethanol) is a phenolic compound abundant in olive-mill by-products and a recognized contributor to the biological activity of extra-virgin olive oil [4,5]. Beyond its intrinsic radical-scavenging activity, it absorbs strongly across the UVA–UVB range—a property already exploited when olive-derived phenols are used as UV boosters in cosmetics [6]—and acts as the natural precursor of salidroside, a glucoside implicated in the reversal of UVB-induced photoaging [7]. Kynurenic acid (KYNA, 4-hydroxyquinoline-2-carboxylic acid) is an endogenous tryptophan metabolite that scavenges superoxide, hydroxyl and peroxynitrite radicals; importantly, its antioxidant action appears largely independent of its receptor antagonist activity, making it relevant as a direct ROS quencher in a topical setting [8]. A recurrent obstacle for both molecules is their limited aqueous solubility, which constrains their delivery; encapsulation in cyclodextrins (CDs) is an established route to overcome this. We have previously characterized the interaction of KYNA with natural and modified CDs in detail, showing that β-CD forms the most efficient complex among the natural CDs and that complexation is strongly pH-dependent, weakening once the carboxylic group of KYNA deprotonates above its pKa [9]. Tyrosol likewise forms 1:1 inclusion complexes with β-CD without loss of its radical-scavenging capacity [10]. These precedents motivated the incorporation of β-cyclodextrin into the present matrix as a solubilizing and stabilizing excipient, in line with the broad use of CDs across the cosmetic industry [11]. The two actives are also chemically complementary: tyrosol is a small, weakly acidic phenol that exists predominantly in its neutral form near physiological pH, whereas KYNA is a more lipophilic, multiply ionizable species carrying carboxylic and quinolone functionalities. This physicochemical complementarity is the basis of our rationale for combining them. Antioxidant combinations spanning different partition behaviors are reported to extend protection across both the aqueous and lipid phases of a formulation and, where the partner compounds’ radical-scavenging potentials differ, to allow the more easily regenerated species to partially restore the activity of the other after it reacts with a radical—mechanisms increasingly documented for antioxidant mixtures in lipid-peroxidation-prone systems such as cosmetic emulsions [12]. Tyrosol and KYNA fit this pattern: tyrosol is predominantly neutral and more hydrophilic at the pH of the finished cream, favoring the aqueous continuous phase, whereas KYNA’s carboxylic/quinolone functionalities make it more lipophilic and pH-responsive, favoring interaction with the surfactant film and dispersed phase (Section 3.4). We therefore expect their co-loading to provide broader compartmental coverage against oxidative and pH-dependent instability than either compound alone, a hypothesis this study tests directly.
Despite individual evidence for both compounds, the behavior of tyrosol and KYNA when co-formulated in a single cosmetic vehicle—and in particular the way their distinct acid–base and partitioning properties interact within an emulsion—has not been reported. The present work addresses this gap. Prior work has established the radical-scavenging activity of tyrosol [4,5] and of KYNA [8] individually, and our own earlier studies characterized their cyclodextrin complexation behavior separately [9,10]; however, none of these studies evaluated the two together in a finished formulation, or addressed whether their markedly different partitioning behavior (a small, weakly acidic, predominantly neutral phenol versus a more lipophilic, multiply ionizable species) would be complementary or antagonistic once co-loaded into a single emulsion. This is not a purely descriptive gap: combining antioxidants with differing solubility and ionization behavior is a recognized strategy for extending protection across both the aqueous and lipid compartments of a formulation and for enabling mutual regeneration between radical-scavenging species, but whether it succeeds is compound-specific and cannot be assumed from the individual profiles alone [12]. Establishing whether tyrosol and KYNA behave additively, synergistically or antagonistically once co-formulated—in stability, antioxidant capacity and release—is therefore a necessary step before either compound, or their combination, can be rationally developed as a topical antioxidant system. We developed an O/W emulsion, optimized its matrix against a commercial reference cream, and loaded it with tyrosol, KYNA and their 1:1 mixture. The characterization battery applied here—elemental (CHNS) analysis, DSC, HPLC quantification and membrane release—follows the multi-technique workflow we and others have used to characterize CD-based carriers for bioactives such as KYNA and melatonin [13,14]. We then characterized the four resulting systems through these mechanical and chemical assays over four weeks at three storage temperatures.
A central methodological observation shaped our analysis. For every parameter governed by chemical equilibrium—pH, active ingredient concentration and antioxidant capacity within the matrix—the first week of monitoring behaved as a transient: freshly prepared emulsions had not yet reached compositional homogeneity, and the Brownian redistribution of the dispersed actives required roughly one week to complete. This is consistent with the well-documented need for a maturation period in freshly emulsified systems. We therefore analyze the chemical data as an initial state (week 1) versus an equilibrated state (week 4), rather than treating each weekly point as an independent measurement of a stationary system. Conversely, for parameters whose evolution in time is itself the result of interest—notably mechanical resistance to centrifugation and the rheological drift of the matrix—we retain the full temporal axis, because there the time dependence is the signal rather than noise.
2. Materials and Methods
2.1. Materials
Kynurenic acid (4-hydroxyquinoline-2-carboxylic acid, C10H7NO3, 98%) was obtained from Sigma-Aldrich (Milan, Italy) and tyrosol (2-(4-hydroxyphenyl)ethanol, C8H10O2, 98%) from Thermo Scientific (Rome, Italy). 2,2-Diphenyl-1-picrylhydrazyl (DPPH, 95%), 2-propanol (HPLC grade) and the remaining matrix components—water, glycerin, sodium dodecyl sulfate (SDS), cetyl alcohol, stearic acid and benzyl alcohol—were purchased from Sigma-Aldrich (Milan, Italy). Maltodextrin and β-cyclodextrin were kindly donated by Roquette Frères (Lestres, France). A commercial O/W hand cream (Neutrogena®, purchased at a local supermarket [Roma, Italy]), selected for its formulary similarity to the experimental matrix, served as the DSC reference.
2.2. Emulsion Preparation
The emulsion was prepared from three separately heated phases. Phase A (aqueous: water 74.8%, glycerin 15%, maltodextrin 0.5%, SDS 0.1% w/w) and phase B (lipidic: cetyl alcohol 5%, stearic acid 2.5%) were each brought to 80 °C; phase B was then added dropwise to phase A under magnetic stirring to promote gradual emulsification. Phase C (benzyl alcohol 1%, β-cyclodextrin 0.1%, and active ingredient 1%) was incorporated cold to avoid thermal degradation of the actives. Relative to an earlier prototype, the emulsification temperature was raised from 60 to 80 °C, soybean oil was replaced by stearic acid to improve compositional definition, and part of the SDS was replaced by β-cyclodextrin to exploit surfactant mixing and active ingredient complexation, an approach widely documented for cosmetic formulations [11]. The full composition is given in Table 1. The matrix composition reported in Table 1 was selected following a DSC-based optimization against a commercial O/W reference cream (Section 3.1): candidate matrices were compared by their thermal transition profile, and the formulation whose calorimetric signature converged to a single, broad, featureless transition analogous to the reference cream—rather than the discrete component peaks observed in less homogeneous prototypes—was adopted as the working matrix (see Section 3.1 for the comparative DSC rationale). Four formulations were produced: matrix + tyrosol, matrix + KYNA, matrix + 1:1 tyrosol/KYNA mixture (0.5% each), and unloaded matrix (control).
Table 1.
Composition of the optimized experimental O/W matrix (total batch 300 g) with the functional role of each component.
2.3. Thermal Analysis (DSC)
Matrix quality was first assessed by DSC against the commercial reference using a linear 5 °C/min ramp [14,15]. For the stability study, the crystallization (freezing) temperature was used as a comparability parameter: samples were equilibrated at 25 °C and ramped at 5 °C/min to −50 °C on a TA Instruments Q200 calorimeter (New Castle, DE, USA, EEUU), with hermetic aluminum pans. Measurements were repeated weekly for four weeks on samples stored at 4, 25 and 40 °C.
2.4. Rheometry and Spreadability
Two published protocols [14] were followed with few modifications: Apparent viscosity was measured on a Discovery HR-1 rheometer (TA Instruments; 20 mm parallel-plate steel geometry, 1.0 mm gap) on 0.35–0.40 g of sample, using a three-step program: (i) conditioning at 25 °C for 120 s; (ii) a linear flow ramp from 0 to 500 s−1 over 120 s (1 s/pt sampling), applied as a reproducible pre-shear rather than as a reported value; and (iii) a flow peak-hold at a constant shear rate of 100 s−1 for 60 s (1 s/pt sampling), from which the reported apparent viscosity was taken. A shear rate of 100 s−1 is the laboratory’s standard operating condition for this type of measurement. To ensure reproducibility, each sample underwent the same conditioning/pre-shear step (i–ii above) immediately before the reported measurement (iii). Spreadability was determined by the parallel-plate method: 0.250 g of cream placed between two glass plates was allowed to spread under gravity for ~10 min, and the spreadability S was computed as S = M × L/T, where M is the sample mass (g), L is the diameter of the spread circle (cm) and T is the time elapsed (s) [14], expressed in g·cm·s−1. Both assays were repeated weekly for four weeks across the three storage temperatures.
2.5. Mechanical Stability (Centrifugation)
A published protocol [14] was followed with few modifications: Aliquots of ~0.40 g in Eppendorf tubes were centrifuged at 6000 rpm (2000× g; Sprout® Plus mini-centrifuge, Heathrow Scientific LLC, Vernon Hills, IL, USA) for 20 min, with re-analysis after 30 and 120 min, scoring each sample binary for phase separation (0 = stable, 1 = separated); centrifugation is a standard accelerated test of the physical stability of O/W emulsions [16,17]. A full factorial design across formulation (4), analysis time (3), storage time (4) and storage temperature (3) yielded 144 samples. Representative photographs of stable and phase-separated samples for each storage temperature are provided in Supplementary Figure S1.
2.6. pH
A published protocol [14] was followed with few modifications: Cream was dispersed at 4 g/L in milliQ water, held for 2 h at 36.5 °C with stirring, and measured in triplicate at the same temperature with an Orion 420A digital pH-meter (Thermo Scientific, Waltham, MA, USA). Measurements were repeated weekly for four weeks across the three storage temperatures.
2.7. Antioxidant Capacity Measurement (DPPH)
A published protocol [13] was used with few modifications: A DPPH stock in 2-propanol (40 ppm) was diluted 1:5 with alcoholic solutions of the test species to a final DPPH concentration of 8 ppm, incubated for 30 min in the dark and read at 515 nm in triplicate, with 2-propanol as blank and L-ascorbic acid as positive standard [18]. Pure standards (ascorbic acid, tyrosol, KYNA, and a 1:1 w/w tyrosol/KYNA mixture prepared by combining equal mass concentrations of the two stock solutions) were used to derive percentage inhibition (I%) and the antiradical power ARP = 1/ED50 [19]; for the mixture, the reported concentration corresponds to the total combined mass of both actives. Cream samples (~2 mg diluted to 400 ppm, i.e., ~2–4 ppm active depending on formulation) were assayed weekly for four weeks at the three storage temperatures, including the unloaded matrix (control) formulation at every time point, to account for any antioxidant activity or spectrophotometric interference arising from the cream matrix itself (Section 3.5).
2.8. HPLC: Active Ingredient Stability and Release
For HPLC determination, a published protocol [12] was used with few modifications: Quantification used a water/acetonitrile 86:14 mobile phase adjusted to pH 3.95 with acetic acid and UV detection at 220 nm (retention: tyrosol 4.7 min, KYNA ~11.5 min). Calibrations were linear from 0.1 to 100 ppm (tyrosol R2 = 0.996; KYNA R2 = 0.999).
For stability, cream aliquots were sampled with a tared 50 µL tip, eluted in 1 mL mobile phase and quantified at weeks 1 and 4 across the three storage temperatures. For release, formulation aliquots were enclosed in 25 mm cellulose dialysis tubing (Sigma-Aldrich; molecular weight cut-off 1000 Da, selected to retain larger species while allowing passage of the small-molecule actives, approximating a physiologically realistic permeation barrier) immersed in 30 mL PBS (pH 7.4, 36.5 °C, magnetic stirring), a receptor volume selected to remain in excess of the mass of active enclosed in the membrane relative to the low reported aqueous solubility of the free actives [13], thereby approximating sink conditions; 5 mL aliquots were withdrawn at 0.5, 1, 1.5, 2, 2.5, 3.5, 4.5, 5.5, 6.5 and 24 h and replaced with an equal volume of fresh buffer, and analyzed by HPLC in triplicate. Cumulative release at each time point was calculated as the amount detected in the withdrawn aliquot plus the amounts removed at all previous sampling points, thereby correcting for the active ingredient removed during earlier sampling, following a dialysis membrane release protocol analogous to that used for CD-based melatonin carriers [14].
Cumulative release profiles were fitted to three release-kinetic models: zero-order (Qt = Q0 + k0t, where Qt is the cumulative amount released at time t and k0 is the zero-order rate constant), first-order (ln(Q0 − Qt) = ln Q0 − k1t, where k1 is the first-order rate constant), and Higuchi (Qt = k_H·t^½, where k_H is the Higuchi diffusion rate constant) [20,21]. Models were fitted to the full 0.5–24 h release profile of each formulation by linear regression, and goodness-of-fit was assessed by the coefficient of determination (R2).
2.9. Elemental Analysis (Compositional Stability)
Carbon mass fraction of lyophilized samples was measured at time zero and after four weeks (FlashEA 1112 analyser, FlashEA 1112 CHNS-O, Thermo Fisher Scientific, Waltham, MA, USA, EE.UU) as an indicator of the compositional stability of the matrix, two replicates at t0 and six to eight (two to three per storage temperature) at the final time. Samples were loaded into 5 × 9 mm aluminum pans (Tecmat) at 0.35–0.45 mg per determination. The rationale is that microbial proliferation in a substrate would be accompanied by measurable changes in its carbon content [22], a principle also exploited when carbon mineralization and microbial biomass are tracked by elemental analysis of organic matter [23]; while a stable carbon fraction is therefore consistent with the absence of substantial microbial proliferation, this elemental proxy does not by itself constitute a validated microbiological stability test. Dedicated microbiological testing (e.g., viable microbial counts and/or a preservative efficacy/challenge test) was not performed in this study; this is acknowledged explicitly as a limitation (Section 4).
2.10. Data Analysis
All quantitative comparisons were assessed with two-tailed Student’s t-tests at a significance level of α = 0.05. A one-sample t-test was used to compare measured HPLC concentrations against the nominal 1% w/w loading, and to test whether the difference between DPPH absorbances at 120 and 30 min differed from zero; Welch’s two-sample t-test (t0 vs. each storage temperature) and a one-way ANOVA across all four conditions (t0, 4, 25 and 40 °C) were used to compare the carbon mass fraction of each formulation. Paired t-tests were additionally used to compare the observed DPPH inhibition of the mixture against the value expected under additivity, by storage temperature (Section 3.5), and to compare week 1 against week 4 HPLC concentrations within each formulation (Section 3.6); 95% Wilson score confidence intervals were computed for the binary centrifugation outcomes (Section 3.3); and release-kinetic model parameters (Section 2.8) were obtained by linear regression, with goodness-of-fit assessed by the coefficient of determination (R2). Descriptive statistics are reported as mean ± standard deviation (SD). Data handling and statistical tests were performed in Python (v3.12) with the pandas and NumPy libraries; rheological data were acquired and processed with TRIOS software (v3.3.0.4055, TA Instruments); and figures were generated with Matplotlib (Version 3.11.2).
3. Results and Discussion
3.1. Matrix Optimization and Thermal Behavior
Preliminary DSC comparison with the commercial reference cream guided matrix optimization. The reference cream showed a broad, featureless phase-transition region stable to ~88 °C, whereas the first prototype displayed discrete peaks attributable to incompletely homogenized components (cetyl alcohol melting near 55 °C; a water fraction separating near 99 °C). Raising the emulsification temperature to 80 °C, replacing soybean oil with the better-defined stearic acid, and introducing β-cyclodextrin alongside reduced SDS produced a more homogeneous system adopted as the working matrix. The disappearance of discrete component peaks in favor of a single broad transition—as in the commercial reference—is the calorimetric signature of a well-integrated emulsion and is consistent with β-CD acting as a co-structuring excipient that homogenizes the dispersed phase [11].
In the stability study, the freezing transitions appeared as loop-shaped rather than Gaussian signals, a feature the instrument documentation attributes to scan rate-dependent thermal lag and which, in a complex emulsion, is compatible with supercooling, a distribution of droplet sizes freezing at different temperatures, and non-linear crystallization kinetics [24]. The crystallization temperature showed no systematic dependence on the active ingredient; instead it was governed by the matrix and by storage temperature. Samples stored at 4 °C crystallized close to the freshly prepared value (T0 = −22.5 °C; mean at 4 °C = −23.8 ± 0.5 °C), whereas storage at 25 and 40 °C shifted crystallization to lower temperatures and then plateaued (mean −26.6 ± 1.0 °C and −26.8 ± 1.1 °C, respectively). Storage at or above room temperature thus appears to anneal nucleation sites and slightly stabilize the dispersed phase, the crystallization temperature reaching a plateau near −27 °C [24].
3.2. Rheology: Apparent Viscosity and Spreadability
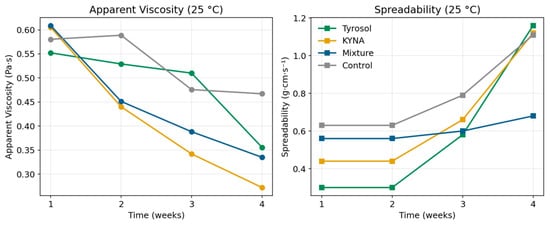
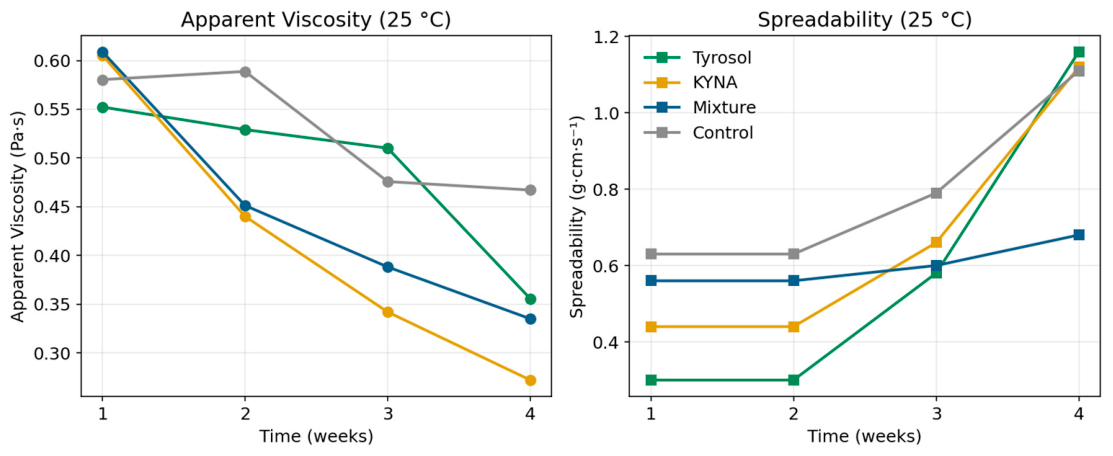
Storage temperature alone was a weak predictor of apparent viscosity, the data scattering around a common mean. The interaction of storage time and temperature was more informative: at 25 °C apparent viscosity decreased roughly linearly over the four weeks, with a corresponding rise in spreadability, the two parameters tracking each other inversely as expected from the reciprocal relationship between fluidity and apparent viscosity (Figure 1). At 4 °C both parameters were essentially constant. Because this drift in time is itself the phenomenon of interest, we retain the full weekly axis here rather than collapsing to two endpoints.
Figure 1.
Inverse evolution of apparent viscosity (left) and spreadability (right) over four weeks for samples stored at 25 °C. Tyrosol (green), KYNA (gold), mixture (blue), control (gray).
The mixture displayed apparent viscosity values intermediate between the two single actives and the smallest spreadability drift, with no phase separation observed. This is consistent with the dipolar tyrosol and KYNA molecules coordinating with the surfactant film and modulating droplet size and distribution, an interplay between emulsifier system and active ingredients that is known to govern both the rheological and the sensory behavior of cosmetic emulsions [25]. The same trend—the binary system being more rheologically stable than either single-active formulation—recurs across DSC, spreadability and centrifugation, and is one of the central observations of this study; the difficulty of preserving stability when plant-derived actives are incorporated into O/W systems is well recognized [25]. Apparent viscosity values (~0.50–0.60 Pa·s at 100 s−1) were about half those of the commercial reference cream (~1.27 Pa·s) but within the accepted range for topical emulsions. In sensory terms, these rheological parameters carry a direct interpretation: apparent viscosity and the related yield behavior of an O/W cream map onto the perceived firmness at pick-up and the ease of spreadability at rub-out, so that the gradual decrease in apparent viscosity and the increase in spreadability we observe at 25 °C would be felt by a user as a slightly softer, more easily spread product over the four weeks [26]. The comparatively lower apparent viscosity of our matrix relative to the commercial cream therefore predicts a lighter, more readily spreadable sensory profile rather than a deficiency, while the small drift of the mixture indicates good sensory consistency over storage.
3.3. Mechanical Stability Under Centrifugation
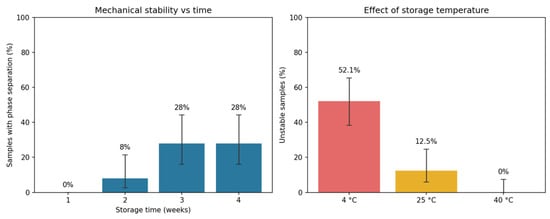
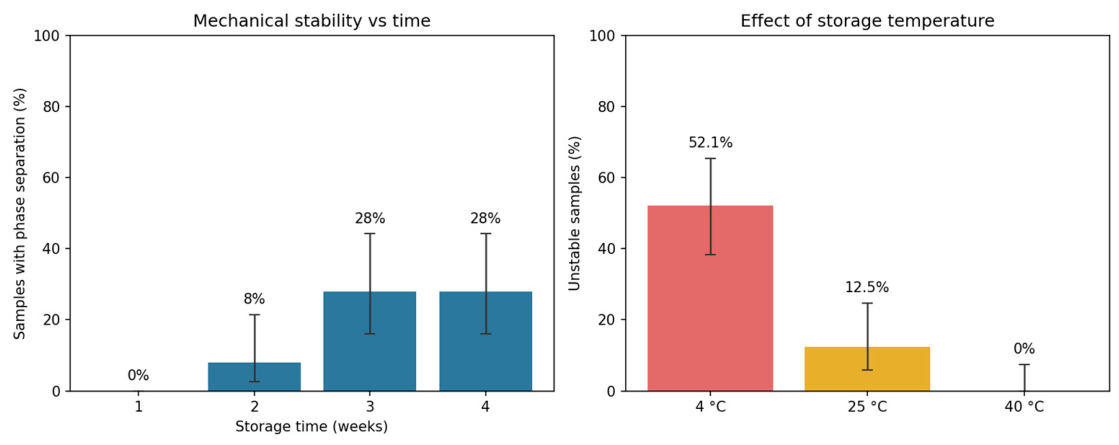
Centrifugation is the parameter where the temporal axis is the result. Without centrifugation, all samples remained stable for the full month. Under load, stability was excellent in week 1 but degraded progressively thereafter: the fraction of samples showing phase separation rose from 8% in week 2 to 28% in weeks 3 and 4 (Figure 2, left). Had we collapsed these data to an initial-versus-final comparison, this progressive loss—arguably the most actionable mechanical finding—would have been masked. The dominant controllable factor was storage temperature (Figure 2, right): samples stored at 40 °C remained fully stable, those at 25 °C lost 12.5%, and those at 4 °C lost 52.1% (95% Wilson CI: 38.3–65.5%; n = 48 determinations per temperature). Storage at or above room temperature therefore secured mechanical stability above 90%.
Figure 2.
Mechanical stability under centrifugation. (Left): progressive increase in phase separation with storage time. (Right): fraction of unstable samples by storage temperature.
A plausible mechanistic explanation for this temperature-dependent instability emerges from the DSC data reported in Section 3.1. Storage at or above room temperature annealed the crystallization transition of the cetyl alcohol/stearic acid structuring network to a stable, more negative plateau (−26.6 ± 1.0 °C at 25 °C; −26.8 ± 1.1 °C at 40 °C), whereas storage at 4 °C left the network closer to its as-prepared state (−23.8 ± 0.5 °C vs. T0 = −22.5 °C). We propose that restricted molecular mobility at 4 °C kinetically traps the structuring lipids in a less-ordered configuration before the thermodynamically favored, tightly packed gel network phase can fully develop, consistent with the classical gel network/lamellar liquid-crystalline model of O/W cream structuring and with recent evidence that the degree of crystallization of the structuring lipid at the time of storage—rather than storage temperature per se—governs microstructural rigidity and resistance to centrifugal stress in emulsion-based semisolids due to the composition [27,28,29].
Notably, the inclusion of active ingredients did not by itself improve resistance to centrifugation relative to the control, indicating that gains in mechanical robustness beyond ~90% will require chemical strategies acting on the actives themselves rather than mere loading.
3.4. pH: Compatibility and Buffering
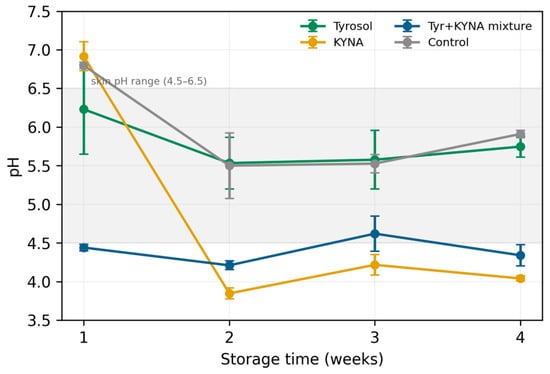
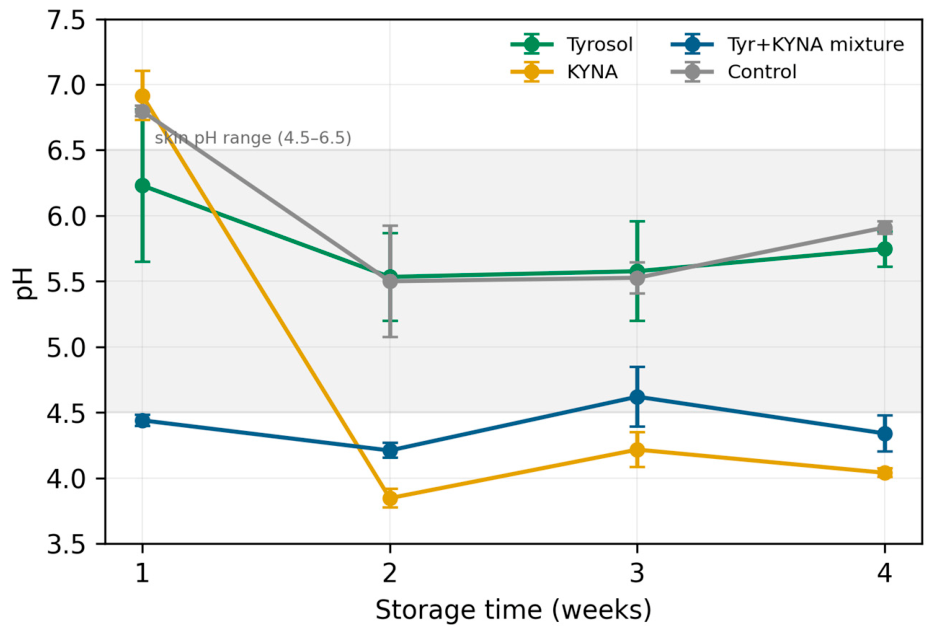
The pH measurements illustrate the maturation transient most clearly. During week 1, the matrix and the KYNA formulation registered elevated values (~6–7) that subsequently settled: the matrix stabilized near 5.6 and KYNA near 4.0 from week 2 onward (Figure 3). This downward settling is consistent with a pH drift, the gradual acidification commonly observed during storage of non-buffered emulsions as ester and fatty acid components slowly hydrolyze and release free fatty acids into the medium [27]. Storage temperature itself had little effect, the formulation-wise means varying within narrow standard deviations. We therefore read pH as an initial state relaxing to an equilibrated state [27].
Figure 3.
pH evolution over four weeks (mean ± SD across storage temperatures). The shaded band indicates the normal skin surface pH range (4.5–6.5) [30]. The binary mixture (blue) is both the most acidic and the most reproducible.
At equilibrium the binary formulation was the most acidic and by far the most reproducible, buffering to 4.40 ± 0.04 against 5.77 ± 0.15 (tyrosol), 4.76 ± 0.09 (KYNA) and 5.93 ± 0.07 (control). Tyrosol alone tracked the control, indicating that its phenolic and alcoholic groups are largely inert as proton donors at these pH values; KYNA, bearing carboxylic and quinolone functionalities, dominated the acid–base behavior of the mixture. The combination of both actives produced a flatter, more strongly buffered pH profile than either alone. All single-active formulations and the control fell squarely within the normal skin surface pH range of 4.5–6.5 reported for healthy adults [30], while the binary mixture sat just below it at 4.4.
We regard this marginal position as advantageous rather than problematic. A mildly acidic finish is widely held to support the stratum corneum acid mantle and barrier homeostasis, and tailoring the pH of a topical formulation to the skin is an explicit formulation objective [25]. Many efficacious cosmetic actives are deliberately formulated well below the skin’s resting pH: topical L-ascorbic acid, for instance, is optimally formulated at pH < 3.5 to keep the molecule in its uncharged, skin-permeable form, and such low-pH serums are nonetheless considered safe and recommendable for daily use [26]. Against this benchmark, a binary formulation buffering to 4.4 is far gentler than a vitamin C serum yet still benefits from the barrier-supporting effect of a sub-neutral pH. In short, the mixture sits just outside the conventional band but comfortably within the territory of well-tolerated acidic cosmetics—“just below, but well placed”.
3.5. Antioxidant Capacity (DPPH)
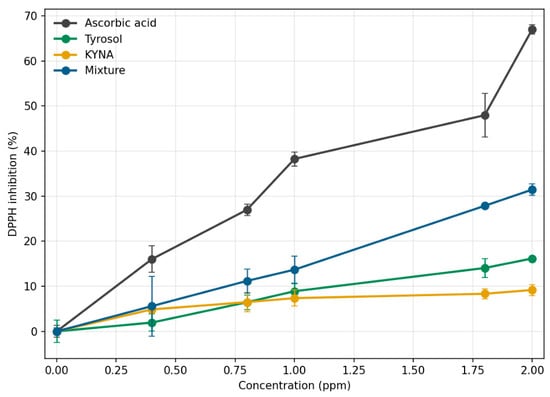
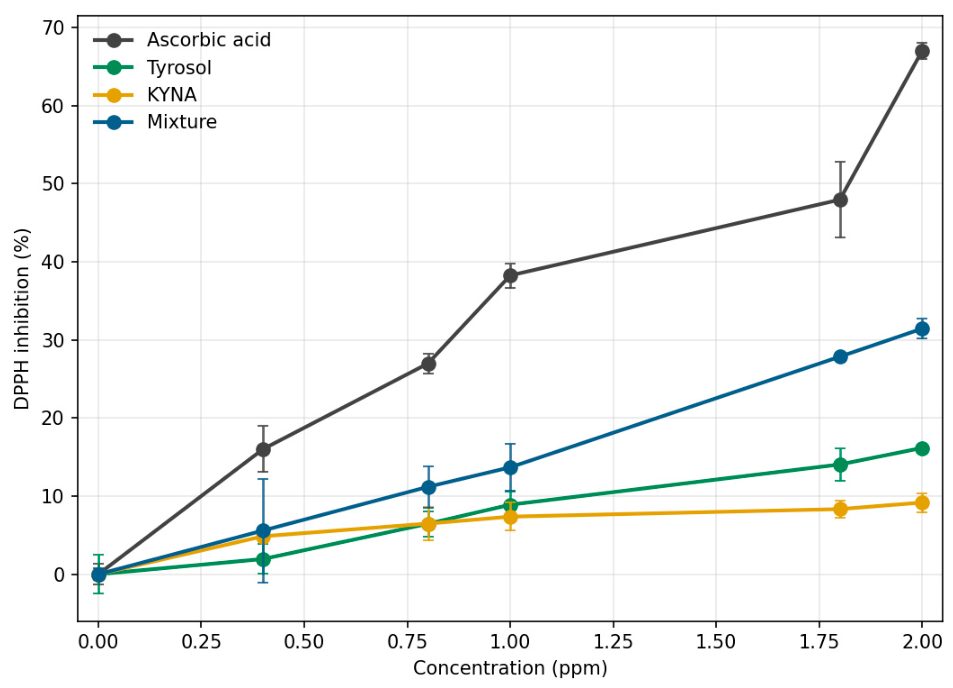
Among the pure standards, both actives showed measurable radical-scavenging activity, and at every concentration tested, the tyrosol + KYNA mixture produced higher percentage inhibition than either compound alone (Figure 4), indicating a cooperative interaction between the two actives. Because none of tyrosol, KYNA or their 1:1 mixture reached 50% DPPH inhibition within the tested concentration range (0–2 ppm), their comparison is presented here directly in terms of the measured percentage inhibition rather than as an IC50/ED50-derived antiradical power. Ascorbic acid, the positive standard, was the only sample for which the tested range bracketed 50% inhibition (C50 = 1.5 ppm, ED50 = 0.42, ARP = 2.40); this value is reported here as an internal reference confirming that the assay performed as expected.
Figure 4.
DPPH inhibition versus concentration for the pure standards. The tyrosol + KYNA mixture (blue) lies above either single active, indicating near-additive cooperation.
Within the finished cream, absolute inhibition dropped relative to the pure standards, converging to 9.00 ± 3.94% (tyrosol), 8.91 ± 3.56% (KYNA) and 7.02 ± 3.59% (mixture) across all storage conditions and the four weeks of monitoring (mean ± SD, n = 36 per formulation), while the unloaded control remained at 0.67 ± 4.80%, confirming that the measured inhibition is attributable to the actives rather than to the matrix itself. Three factors plausibly contribute: incomplete extraction of the actives from a matrix deliberately rich in surfactants and cyclodextrin carriers; concentration gradients in the viscous cream complicating exact dosing; and a matrix contribution to the signal, since even the unloaded control suppressed DPPH, most likely through lipid radical formation rather than competing absorbance. Reassuringly, β-CD complexation has been shown not to impair the intrinsic DPPH-scavenging capacity of tyrosol [10] or of CD-bound KYNA [13], so the attenuation we observe reflects extraction and matrix effects rather than loss of antioxidant function.
A temperature-resolved comparison further shows that the Mix formulation’s inhibition does not simply average that of the two single-active formulations at every storage temperature (Table 2). The observed Mix inhibition matches the value expected under additivity (mean of the individually loaded formulations) at 25 °C and 40 °C, but is significantly lower than expected at 4 °C (6.25% observed vs. 11.23% expected; p = 0.014). This parallels the mechanical stability behavior reported in Section 3.3, where phase separation after centrifugation was likewise most frequent at 4 °C. A plausible common explanation is that low-temperature-induced changes in the continuous phase—including the less-annealed crystalline state of the cetyl alcohol/stearic acid structuring network discussed in Section 3.1, Section 3.2 and Section 3.3—restrict molecular mobility and interfacial accessibility of the two actives, limiting their combined radical-scavenging efficiency at refrigerated storage. We present this as a plausible, data-consistent link between the mechanical and antioxidant behavior of the formulation rather than as a mechanistically confirmed effect.
Table 2.
Comparison of the observed DPPH inhibition of the Mix formulation against the value expected under additivity (mean of the individually loaded tyrosol and KYNA formulations), by storage temperature (n = 12 week × replicate pairs per temperature; n = 36 pooled). Bold p-values denote a statistically significant deviation from additivity (α = 0.05).
In the finished cream, the ~2 mg of sample diluted to 400 ppm in the assay (Section 2.7) corresponds to an active ingredient concentration of approximately 4 ppm for the single-active formulations (1.0% w/w loading) and approximately 2 ppm per component for the mixture (0.5% w/w each). At these concentrations, the 8–12% inhibition measured in the cream is lower than the inhibition the pure standards show at comparable concentrations (Figure 4), consistent with the extraction and matrix effects discussed above partially screening the actives’ intrinsic radical-scavenging activity from the DPPH radical. This modest but reproducible antioxidant effect, stable across four weeks of storage, represents the antioxidant activity the formulation is expected to deliver at the skin-relevant dose; improving the extraction/release efficiency of the actives from the matrix, rather than increasing their nominal loading, is therefore the more promising route to enhance in-use antioxidant performance.
The near-additive, temperature-dependent cooperation between tyrosol and KYNA observed here (Table 2) is consistent with established mechanisms of antioxidant synergy, including mutual redox regeneration between antioxidants and complementary partitioning of antioxidants of different polarity across a heterogeneous matrix, both recently reviewed for lipid-based systems [31]; the loss of cooperation specifically at 4 °C parallels the mechanical instability observed under the same storage condition (Section 3.3) and may reflect restricted molecular mobility limiting this complementary interaction at low temperature, as discussed above.
3.6. Active Ingredient Stability (HPLC): Initial Versus Equilibrated State
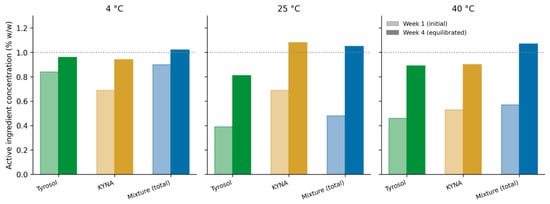
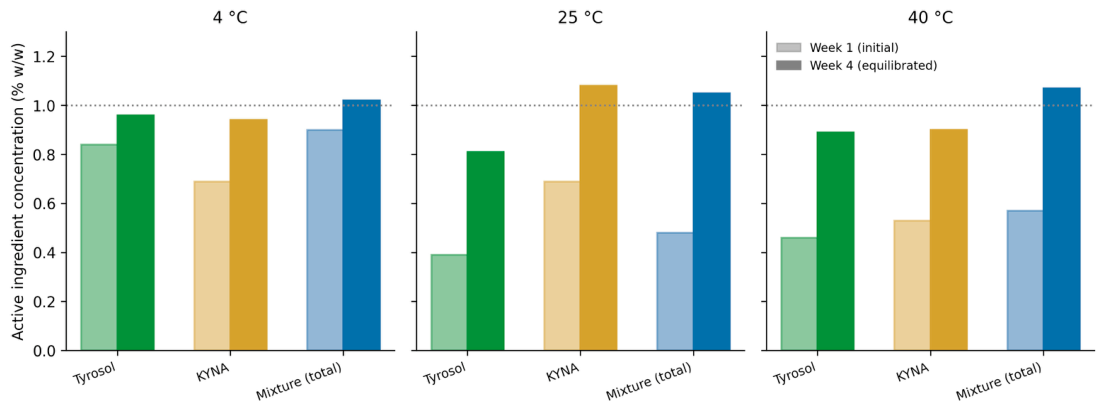
HPLC quantification is the parameter that most directly motivates the initial-versus-equilibrated framing. Measured active concentrations rose between week 1 and week 4 toward their nominal loading, an increase that was statistically significant for KYNA (paired t-test across storage temperatures, n = 3, t = 7.70, p = 0.016) and followed the same trend for tyrosol (t = 3.18, p = 0.086) (Figure 5). This apparent increase is not synthesis of material but the resolution of an initial concentration gradient: in a freshly prepared emulsion the actives are not yet evenly distributed, and Brownian motion within the matrix requires time to maximize interactions with the surfactants and carriers and achieve homogeneous incorporation [14]. Presenting the week 1 and week 4 determinations separately by storage temperature (Figure 5) shows that the magnitude of this increase was itself temperature-dependent, smaller at 4 °C (+0.12–0.25 percentage points) than at 25 or 40 °C (+0.37–0.43 percentage points), consistent with a more rapidly structuring matrix at 4 °C limiting the time window for post-preparation redistribution of the actives. Reading week 1 as an initial transient and week 4 as the equilibrated state, the data show convergence to target without any degradative loss. The comparison must be made against the correct nominal value for each system: in the single-active formulations each active is loaded at 1.0% w/w, whereas in the mixture the two actives are each loaded at 0.5% w/w so that the total active content remains 1.0% in all formulations [32,33,34,35].
Figure 5.
Active ingredient concentration (% w/w) at week 1 (initial, light bars) versus week 4 (equilibrated, dark bars), presented separately for each storage temperature (4, 25 and 40 °C). Tyrosol (green) and KYNA (gold): single-active formulations; Mixture (blue): total active content (sum of the two components) in the combined formulation. The dotted line marks the 1.0% w/w nominal total loading. Each bar is a single determination (n = 1 per formulation, temperature and time point).
Averaged over the equilibrated state, the single tyrosol formulation reached 0.89 ± 0.08% and the single KYNA formulation 0.97 ± 0.10% against their 1.0% targets. In the mixture, the two components converged toward their respective 0.5% targets, summing to a total active content of 1.00 ± 0.18% with a tyrosol:KYNA ratio of 1.05 ± 0.03. A one-sample t-test confirmed no significant difference in the single-active concentrations from their 1.0% nominal value, or in the mixture total from 1.0% (α = 0.05). The practical recommendation that follows is to improve initial homogenization of phase C—or to allow a defined maturation period before release testing—so that the transient does not bias early-time quality control.
3.7. Transdermal Release: An Asymmetric Mixture Effect
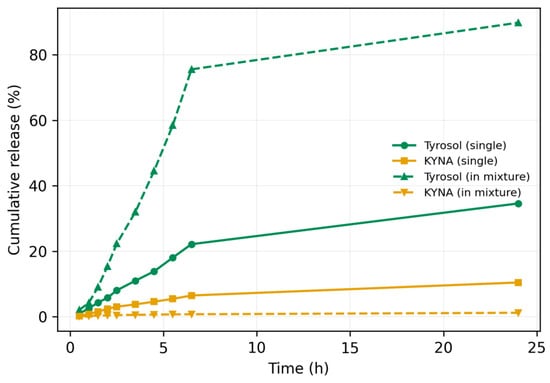
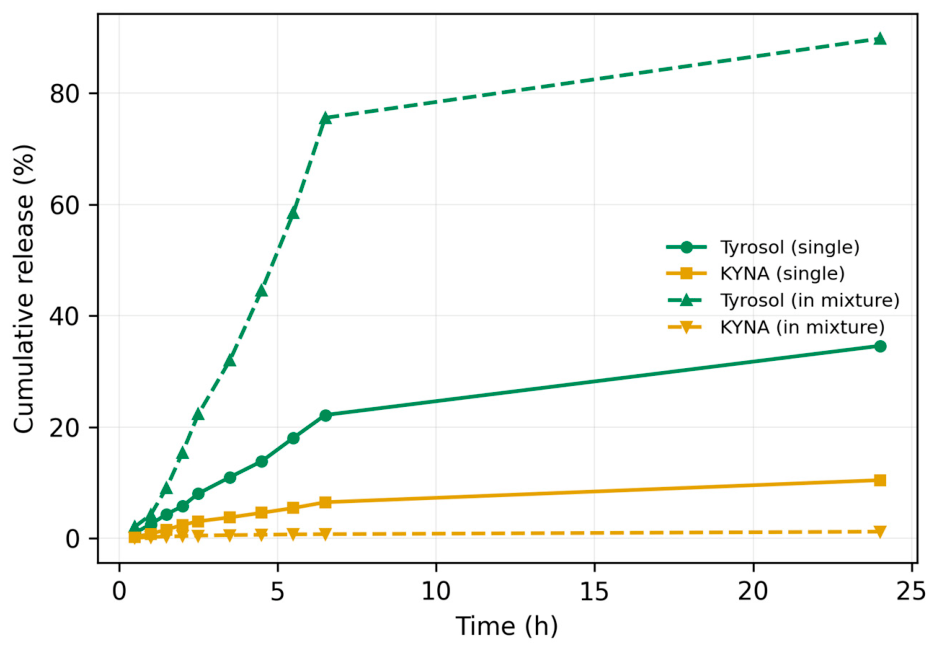
Release through the dialysis model was linear over the first ~8 h (R2 > 0.99 for all formulations) and clearly differentiated the two actives (Figure 6). KYNA released poorly (10.4% at 24 h as a single active), consistent with its higher logP, larger molecular volume, lower HLB, and its fully ionized carboxylate form at pH 7.4 that favors interaction with the surfactant film over partitioning into the aqueous buffer. Tyrosol, predominantly neutral, released far more readily (34.6% at 24 h).
Figure 6.
Cumulative release through a cellulose dialysis membrane (PBS, pH 7.4, 36.5 °C). Single actives (solid) versus the same actives within the mixture (dashed). Tyrosol release is strongly enhanced in the mixture while KYNA release is suppressed. Data are mean ± SD (n = 3 independent replicates per time point).
To characterize the release behavior more quantitatively, we fitted zero-order, first-order and Higuchi models (Section 2.8) to each of the four release profiles (Table 3). The Higuchi (diffusion-controlled) model gave the best or near-best fit for the two single-active profiles and for KYNA within the mixture (R2 = 0.94–0.96), consistent with membrane diffusion-limited transport. Tyrosol within the mixture, which releases fastest and most completely, was instead best described by first-order kinetics (R2 = 0.87), consistent with a depletion-limited process as the donor-compartment concentration gradient diminishes toward the end of the release window.
Table 3.
Goodness-of-fit (R2) of release-kinetic models fitted to the four cumulative-release profiles (0.5–24 h, n = 3 per time point).
The mixture produced a striking asymmetry: tyrosol release was strongly enhanced (to ~90% at 24 h) while KYNA release was further suppressed (to ~1%). A consistent explanation is a proton exchange coupled to the keto–enol tautomerism of tyrosol. At pH 7.4 and in the absence of proton acceptors the enol form of tyrosol may predominate; the presence of carboxylate KYNA provides an acceptor, shifting tyrosol toward its smaller, more hydrophilic keto form (the keto form being smaller and more hydrophilic, i.e., of lower logP, than the enol) that crosses the membrane more readily, while KYNA is driven toward its neutral, membrane-retained form. The strong pH-dependence of the KYNA–β-CD interaction we reported previously—complexation weakening once KYNA is deprotonated above its pKa—supports a picture in which the local protonation state set by the partner active governs both complexation and partitioning [9]. A dilution contribution is also plausible, since tyrosol is present at 0.5% in the mixture versus 1% alone and release is normalized to initial load. The net effect is that co-formulation can be used to tune release—here favoring tyrosol delivery while retaining KYNA in the vehicle, although in all the cases the mixture promoted the release.
This proton-exchange/keto–enol interpretation is consistent with the general principle that tautomeric state affects a molecule’s water solubility, acid–base character and partition coefficient, as recently reviewed in the context of drug behavior [36] and as might be inferred from our study.
3.8. Elemental/Compositional Stability Analysis
Carbon mass fraction did not differ significantly between time zero and any of the three storage temperatures for any formulation (Welch’s two-sample t-test per temperature and one-way ANOVA across all four conditions, α = 0.05; Table 4), consistent with the compositional stability of the matrix over the monitoring period. While this elemental proxy does not independently confirm microbiological stability, the constancy of the carbon fraction together with the inclusion of benzyl alcohol as a preservative/fragrance agent is consistent with adequate preservation over the monitoring period; dedicated microbiological testing was not performed in this study and is identified as a priority for future work (Section 2.9). Table 4 summarizes the elemental data, presented separately by storage temperature with the exact replicate count (n) for each condition and the corresponding p-values.
Table 4.
Carbon mass fraction (%, mean ± SD) at t0 and at the final time point for each storage temperature, with the exact number of replicates (n) per condition. p-values (Welch’s two-sample t-test vs. t0) and the one-way ANOVA p-value across all four conditions are also reported. No comparison reached statistical significance (α = 0.05).
3.9. Perspectives and Limitations
To our knowledge, this is the first study to characterize tyrosol and kynurenic acid co-loaded, individually and in combination, within a finished cosmetic O/W emulsion. The rationale for combining the two actives rests on their chemically complementary antioxidant profiles: tyrosol is a classical phenolic hydrogen-donating radical scavenger, whereas KYNA is a kynurenine-pathway metabolite with a distinct antioxidant chemistry and reported photosensitizing activity [37], and a more lipophilic, ionizable (carboxylate) character that gives it a different phase distribution within the emulsion than the more hydrophilic tyrosol. Combining actives with complementary, rather than redundant, antioxidant mechanisms and phase partitioning is an active area of current formulation research, illustrated by recently reported dual-antioxidant dermal delivery systems designed explicitly around synergistic or complementary release [38]. The present findings should be read as hypothesis-generating: the near-additive antioxidant cooperation and the asymmetric release behavior we report are consistent with, but do not by themselves prove, the mechanisms proposed above, and dedicated mechanistic studies (e.g., spectroscopic evidence of the proposed proton exchange, or direct synergy assays at controlled stoichiometry) remain necessary to confirm them. The main limitations of the present study are the single-determination design for several physical parameters (apparent viscosity, spreadability, pH and weekly DSC; Section 2.4), the restriction of textural characterization to the spreadability assay without a full texture-profile analysis (Section 2.4), and the absence of a dedicated microbiological challenge test beyond the elemental analysis compositional stability proxy (Section 2.9).
4. Conclusions
We have designed and characterized an O/W cosmetic emulsion co-loaded with tyrosol and kynurenic acid and tracked its mechanical and chemical behavior over four weeks at three storage temperatures. Treating the chemical equilibrium parameters as an initial transient relaxing to an equilibrated state—rather than as a stationary system sampled weekly—clarified the data considerably and is justified by the Brownian maturation of the freshly emulsified matrix evident in the HPLC, pH and DPPH results.
Three findings stand out. First, the two actives are mutually stabilizing: across DSC, rheology and spreadability the binary formulation was consistently more stable than either single-active system, and at equilibrium it buffered to a skin-compatible pH of 4.40 ± 0.04, narrower and more reproducible than tyrosol or KYNA alone. Second, the antioxidant cooperation is near-additive, so combining the two recovers scavenging capacity that each lacks individually. Third, co-formulation tunes release asymmetrically—strongly enhancing tyrosol permeation while retaining KYNA in the vehicle—possibly via a proton-exchange/keto–enol mechanism between the partners.
Mechanical stability, by contrast, was driven by storage conditions: resistance to centrifugation degraded progressively from week 2 to week 4 but exceeded 90% whenever samples were stored at or above room temperature, with 25 °C emerging as the optimal compromise between mechanical robustness and acceptable antioxidant performance. Microbiological stability was secured by benzyl alcohol throughout. Loading the actives did not by itself improve resistance to centrifugation, indicating that further gains will require chemical modification of the actives—for example, amphiphilic ester derivatives—rather than additional loading. Practically, this study recommends room-temperature storage and an initial maturation/homogenization step before quality control. Together, these results establish the tyrosol + KYNA pair as a skin-compatible, mutually stabilizing antioxidant combination suitable for topical cosmetic development.
Supplementary Materials
The following supporting information can be downloaded at: https://www.mdpi.com/article/10.3390/cosmetics13050258/s1, Figure S1. Representative photographs of the four formulations after centrifugation (6000 rpm/2000× g, Sprout® Plus mini-centrifuge, Heathrow Scientific LLC, Vernon Hills, IL, USA; re-analysed at 2 h) at week 2 of storage at 40 °C, 25 °C and 4 °C, illustrating the extent of phase separation described in Section 3.3.
Author Contributions
Conceptualization, F.T. and A.M.; methodology, F.C., S.D.P. and A.M.; validation, S.B.; formal analysis, A.M.; investigation, S.D.P. and A.M.; resources, F.T.; data curation, S.D.P.; writing—original draft preparation, A.M.; writing—review and editing, S.D.P., S.B., F.C., F.T. and A.M.; visualization, A.M.; supervision, S.B. and A.M.; project administration, A.M.; funding acquisition, F.T. and A.M. All authors have read and agreed to the published version of the manuscript.
Funding
This research was partially supported by the Spanish Ministry of Science and Innovation, project PID2021-122896NB-I00 (MCI/AEI/10.13039/501100011033/FEDER, UE). UNITO authors acknowledge support from the Project CH4.0 under the MUR program “Dipartimenti di Eccellenza 2023–2027” (CUP: D13C22003520001).
Institutional Review Board Statement
Not applicable.
Informed Consent Statement
Not applicable.
Data Availability Statement
The data presented in this study are available on request from the corresponding author.
Acknowledgments
The authors are grateful to Gjylije Hoti (UNITO) for the initial viscosity training. This work is the result, for A.M., of an RTDA contract from the D.M. 1062/2021 (Ministero dell’Università e della Ricerca) for the University of Turin, and currently, A.M. is receiving a Ramon y Cajal Contract (Grant RYC2023-043196-I) funded by MICIU/AEI/10.13039/501100011033 and by the FSE+. During the preparation of this work the authors used CLAUDE Sonnet 5 (Anthropic, September 2026) in order to improve and rephrase the text. After using this tool/service, the authors reviewed and edited the content as needed and take full responsibility for the content of the publication.
Conflicts of Interest
The authors declare no conflicts of interest.
References
- Farage, M.A.; Miller, K.W.; Elsner, P.; Maibach, H.I. Intrinsic and Extrinsic Factors in Skin Ageing: A Review. Int. J. Cosmet. Sci. 2008, 30, 87–95. [Google Scholar] [CrossRef] [Scilit]
- Silva, S.; Ferreira, M.; Oliveira, A.S.; Magalhães, C.; Sousa, M.E.; Pinto, M.; Sousa Lobo, J.M.; Almeida, I.F. Evolution of the Use of Antioxidants in Anti-Ageing Cosmetics. Int. J. Cosmet. Sci. 2019, 41, 378–386. [Google Scholar] [CrossRef] [Scilit]
- de Lima Cherubim, D.J.; Buzanello Martins, C.V.; Oliveira Fariña, L.; da Silva de Lucca, R.A. Polyphenols as Natural Antioxidants in Cosmetics Applications. J. Cosmet. Dermatol. 2020, 19, 33–37. [Google Scholar] [CrossRef] [Scilit]
- Servili, M.; Sordini, B.; Esposto, S.; Urbani, S.; Veneziani, G.; Di Maio, I.; Selvaggini, R.; Taticchi, A. Biological Activities of Phenolic Compounds of Extra Virgin Olive Oil. Antioxidants 2014, 3, 1–23. [Google Scholar] [CrossRef] [Scilit]
- Romero, C.; Brenes, M. Analysis of Total Contents of Hydroxytyrosol and Tyrosol in Olive Oils. J. Agric. Food Chem. 2012, 60, 9017–9022. [Google Scholar] [CrossRef] [Scilit]
- Galanakis, C.M.; Tsatalas, P.; Galanakis, I.M. Implementation of Phenols Recovered from Olive Mill Wastewater as UV Booster in Cosmetics. Ind. Crops Prod. 2018, 111, 30–37. [Google Scholar] [CrossRef] [Scilit]
- Mao, G.X.; Xing, W.M.; Wen, X.L.; Jia, B.B.; Yang, Z.X.; Wang, Y.Z.; Jin, X.Q.; Wang, G.F.; Yan, J. Salidroside Protects against Premature Senescence Induced by Ultraviolet B Irradiation in Human Dermal Fibroblasts. Int. J. Cosmet. Sci. 2015, 37, 321–328. [Google Scholar] [CrossRef] [Scilit]
- Lugo-Huitrón, R.; Blanco-Ayala, T.; Ugalde-Muñiz, P.; Carrillo-Mora, P.; Pedraza-Chaverrí, J.; Silva-Adaya, D.; Maldonado, P.D.; Torres, I.; Pinzón, E.; Ortiz-Islas, E.; et al. On the Antioxidant Properties of Kynurenic Acid: Free Radical Scavenging Activity and Inhibition of Oxidative Stress. Neurotoxicol. Teratol. 2011, 33, 538–547. [Google Scholar] [CrossRef] [Scilit]
- Matencio, A.; Caldera, F.; Rubin Pedrazzo, A.; Khazaei Monfared, Y.; Dhakar, N.K.; Trotta, F. A Physicochemical, Thermodynamical, Structural and Computational Evaluation of Kynurenic Acid/Cyclodextrin Complexes. Food Chem. 2021, 356, 129639. [Google Scholar] [CrossRef] [Scilit]
- Aree, T.; Jongrungruangchok, S. Structure–Antioxidant Activity Relationship of β-Cyclodextrin Inclusion Complexes with Olive Tyrosol, Hydroxytyrosol and Oleuropein: Deep Insights from X-ray Analysis, DFT Calculation and DPPH Assay. Carbohydr. Polym. 2018, 199, 661–669. [Google Scholar] [CrossRef] [Scilit]
- Conesa, I.; Vidal-Sánchez, F.J.; Navarro-Orcajada, S.; Abril-Sánchez, C.; Matencio, A.; López-Nicolás, J.M. Cyclodextrin Applications in the Cosmetic Industry: A Review. Cosmetics 2025, 12, 244. [Google Scholar] [CrossRef] [Scilit]
- Chaib, N.; Elouardi, M.; Azdem, D.; Mabrouki, J.; Boutakiout, A.; Rouas, S.; Chafai, Y.; Wissal, J.; Alaoui El Belghiti, M. Synergistic Interactions of Antioxidants in Lipid Peroxidation: Mechanistic Insights and Applications. Euro-Mediterr. J. Environ. Integr. 2026, 11, 164. [Google Scholar] [CrossRef] [Scilit]
- Dhakar, N.K.; Caldera, F.; Bessone, F.; Cecone, C.; Rubin Pedrazzo, A.; Cavalli, R.; Dianzani, C.; Trotta, F. Evaluation of Solubility Enhancement, Antioxidant Activity, and Cytotoxicity Studies of Kynurenic Acid Loaded Cyclodextrin Nanosponge. Carbohydr. Polym. 2019, 224, 115168. [Google Scholar] [CrossRef] [Scilit]
- Hoti, G.; Ferrero, R.; Caldera, F.; Trotta, F.; Corno, M.; Pantaleone, S.; Desoky, M.M.H.; Brunella, V. A Comparison between the Molecularly Imprinted and Non-Molecularly Imprinted Cyclodextrin-Based Nanosponges for the Transdermal Delivery of Melatonin. Polymers 2023, 15, 1543. [Google Scholar] [CrossRef] [Scilit]
- Gill, P.; Moghadam, T.T.; Ranjbar, B. Differential Scanning Calorimetry Techniques: Applications in Biology and Nanoscience. J. Biomol. Tech. 2010, 21, 167–193. [Google Scholar]
- Ondracek, J.; Boller, F.H.; Zulliger, H.W.; Niederer, R.R. Comparison among Five Methods for Testing the Physical Stability of O/W Emulsions. Acta Pharm. Technol. 1985, 31, 42–48. [Google Scholar]
- Cosmetics Europe. Guidelines on Stability Testing of Cosmetic Products; Cosmetics Europe: Brussels, Belgium, 2004. [Google Scholar]
- Brand-Williams, W.; Cuvelier, M.E.; Berset, C. Use of a Free Radical Method to Evaluate Antioxidant Activity. LWT-Food Sci. Technol. 1995, 28, 25–30. [Google Scholar] [CrossRef] [Scilit]
- Sánchez-Moreno, C.; Larrauri, J.A.; Saura-Calixto, F. A Procedure to Measure the Antiradical Efficiency of Polyphenols. J. Sci. Food Agric. 1998, 76, 270–276. [Google Scholar] [CrossRef]
- Higuchi, T. Rate of Release of Medicaments from Ointment Bases Containing Drugs in Suspension. J. Pharm. Sci. 1961, 50, 874–875. [Google Scholar] [CrossRef] [Scilit]
- Costa, P.; Sousa Lobo, J.M. Modeling and Comparison of Dissolution Profiles. Eur. J. Pharm. Sci. 2001, 13, 123–133. [Google Scholar] [CrossRef] [Scilit]
- Mason-Jones, K.; Breidenbach, A.; Dyckmans, J.; Banfield, C.C.; Dippold, M.A. Intracellular Carbon Storage by Microorganisms Is an Overlooked Pathway of Biomass Growth. Nat. Commun. 2023, 14, 2240. [Google Scholar] [CrossRef] [Scilit]
- Palucha, N.; Fojt, J.; Holátko, J.; Hammerschmiedt, T.; Kintl, A.; Brtnický, M.; Řezáčová, V.; De Winter, K.; Uitterhaegen, E.; Kučerík, J. Does Poly-3-Hydroxybutyrate Biodegradation Affect the Quality of Soil Organic Matter? Chemosphere 2024, 352, 141300. [Google Scholar] [CrossRef] [Scilit]
- Adejokun, D.A.; Dodou, K. Quantitative Sensory Interpretation of Rheological Parameters of a Cream Formulation. Cosmetics 2020, 7, 2. [Google Scholar] [CrossRef] [Scilit]
- Moravkova, T.; Filip, P. The Influence of Emulsifier on Rheological and Sensory Properties of Cosmetic Lotions. Adv. Mater. Sci. Eng. 2013, 2013, 168503. [Google Scholar] [CrossRef] [Scilit]
- Semenzato, A.; Costantini, A.; Meloni, M.; Maramaldi, G.; Meneghin, M.; Baratto, G. Formulating O/W Emulsions with Plant-Based Actives: A Stability Challenge for an Effective Product. Cosmetics 2018, 5, 59. [Google Scholar] [CrossRef] [Scilit]
- Simões, A.; Veiga, F.; Vitorino, C. Progressing Towards the Sustainable Development of Cream Formulations. Pharmaceutics 2020, 12, 647. [Google Scholar] [CrossRef] [Scilit]
- Yang, R.; Tee, X.Y.; Poornachary, S.K.; Simone, E.; Chow, P.S. Influence of Processing and Stabilizer Selection on Microstructure, Stability and Rheology of Emulsion-Based Semisolid Formulations. Pharmaceutics 2025, 17, 1221. [Google Scholar] [CrossRef] [Scilit]
- Li, M.; Babayev, H.; D’Avino, P.; Zeyneloğlu, C.; Bicer, C.; Yazici, D.; Pat, Y.; Svedenhag, P.; Gaudenzio, N.; Akdis, C.A.; et al. Rapid Human Skin Barrier Disruption by Sodium Dodecyl Sulfate and Associated Molecular Mechanisms. Allergy 2026, 81, 2478–2489. [Google Scholar] [CrossRef] [Scilit]
- Komatsu, H.; Inasawa, S. Propagation of Freezing in Supercooled Water-in-Antifreeze-Oil Emulsions. Langmuir 2024, 40, 15838–15846. [Google Scholar] [CrossRef] [Scilit]
- Bayram, I.; Decker, E.A. Underlying Mechanisms of Synergistic Antioxidant Interactions during Lipid Oxidation. Trends Food Sci. Technol. 2023, 133, 219–230. [Google Scholar] [CrossRef] [Scilit]
- Ali, S.M.; Yosipovitch, G. Skin pH: From Basic Science to Basic Skin Care. Acta Derm. Venereol. 2013, 93, 261–267. [Google Scholar] [CrossRef] [Scilit]
- Lukić, M.; Pantelić, I.; Savić, S.D. Towards Optimal pH of the Skin and Topical Formulations: From the Current State of the Art to Tailored Products. Cosmetics 2021, 8, 69. [Google Scholar] [CrossRef] [Scilit]
- Pinnell, S.R.; Yang, H.; Omar, M.; Riviere, N.M.; DeBuys, H.V.; Walker, L.C.; Wang, Y.; Levine, M. Topical L-Ascorbic Acid: Percutaneous Absorption Studies. Dermatol. Surg. 2001, 27, 137–142. [Google Scholar] [CrossRef] [Scilit]
- Xiao, T.; Ma, X.; Hu, H.; Xiang, F.; Zhang, X.; Zheng, Y.; Dong, H.; Adhikari, B.; Wang, Q.; Shi, A. Advances in Emulsion Stability: A Review on Mechanisms, Role of Emulsifiers, and Applications in Food. Food Chem. X 2024, 29, 102792. [Google Scholar] [CrossRef] [Scilit]
- Araujo de Oliveira, A.P.; Wegermann, C.A.; Ferreira, A.M.D.C. Keto-Enol Tautomerism in the Development of New Drugs. Front. Chem. Biol. 2024, 3, 1400642. [Google Scholar] [CrossRef] [Scilit]
- Alves, L.d.F.; Moore, J.B.; Kell, D.B. The Biology and Biochemistry of Kynurenic Acid, a Potential Nutraceutical with Multiple Biological Effects. Int. J. Mol. Sci. 2024, 25, 9082. [Google Scholar] [CrossRef] [Scilit]
- Dzurická, L.; Hoová, J.; Dribňáková, B.; Skoumalová, P.; Rappelli, P.; Márová, I. Nanostructured Dual-Delivery System with Antioxidant and Synergistic Approach for Targeted Dermal Treatment. Int. J. Mol. Sci. 2025, 26, 9485. [Google Scholar] [CrossRef] [Scilit]

Disclaimer/Publisher’s Note: The statements, opinions and data contained in all publications are solely those of the individual author(s) and contributor(s) and not of MDPI and/or the editor(s). MDPI and/or the editor(s) disclaim responsibility for any injury to people or property resulting from any ideas, methods, instructions or products referred to in the content. |
© 2026 by the authors. Licensee MDPI, Basel, Switzerland. This article is an open access article distributed under the terms and conditions of the Creative Commons Attribution (CC BY) license.