


Abstract
Engineered wood is increasingly valued for its use of renewable raw materials, low environmental impact, and good performance characteristics. The wide variety of raw materials used to produce engineered wood requires detailed research to select rational technological production parameters. This paper examines engineered wood produced from furniture-recycling waste and different polyurethane compositions. The factors under analysis include mixture pressure level, binder type, and filler preparation. The effect of the mixture’s pressure level on density, structure, strength, and moisture indicators was evaluated. The pressure levels were 1.5, 2.0, 2.5, 3.0, and 3.5 MPa. Tests have shown that the mixture pressure level significantly affects compressive strength, absorption, swelling, and structure formation. A rational pressure level of 3.0 MPa was determined. When using this level, there are no voids in the samples. Depending on the binder composition, the resulting compressive strength ranges from 20.5 to 25.6 MPa, water absorption from 7.62 to 10.3 kg/m2, and swelling from 8.65 to 12.6%. At a pressure of 3.5 MPa, the properties of engineered wood improve further, but the binder begins to separate from the mixture. A significant influence of the binder on compressive strength, absorption, and swelling was observed. A detailed kinetic analysis was performed to evaluate changes in sample strength following production. The tests showed that the compressive strength increased markedly 14 days after sample preparation.
1. Introduction
Large quantities of wood waste are generated worldwide every year [1,2,3]. This waste originates from municipal sources, construction and demolition activities, furniture, sawmills, and agriculture [4,5,6,7,8]. Most wood waste is recycled or incinerated for energy recovery, with the remainder disposed of in landfills [9]. The disposal of wood waste in landfills poses a significant environmental threat because, during degradation, methane (CH4) and carbon dioxide (CO2) are produced [10,11]. Burning biomass also makes a complex mixture of particulate matter and gaseous pollutants that affects air quality, health, and climate [12]. The use of recycled wood waste in composites can confer economic and environmental benefits [13]. In addition, wood waste, as a biomass source, provides an alternative means of storing captured CO2, which is integrated into plant tissues through photosynthesis [2,14].
Reusing wood waste poses serious challenges. Different types of wood waste, such as construction debris, industrial offcuts, and post-consumer products, exhibit varying characteristics that influence their potential for reuse and recycling [15]. In addition, the recycling of wood waste is complicated by the presence of physical and chemical impurities in the waste stream [16].
To reuse wood waste, a series of procedures is carried out. First, the collected wood waste is sorted and mechanically shredded [17,18]. Sorting is defined as a three-step process: wood handling, identification, and separation [19]. Mechanical recycling methods include shredding, screening, and magnetic separation [18,20].
The primary contaminant of recycled wood is glue [21]. The presence of only 6% by weight of residual glue may result in a reduction of up to 50% in the strength of new wood products. Glue purification can be carried out by physicochemical or biological methods [21]. Other authors report that combining mechanical processing of wood particles improves efficiency in raw material preparation [22]. Recycled wood waste can be used to produce cement composite boards [1,23], wood–plastic composites [24,25], plywood and engineered wood products [26], ceiling panels [27], plasterboards incorporating wood powder waste [28], and other products.
Using different binding materials with wood waste yields construction products with distinct properties, advantages, and disadvantages. Mineral, polymer, and organic binders are used to produce construction products.
Cement is the most used mineral binder. Sawdust concrete and wood fibre concrete are most made from wood waste and cement [29], wood–cement compounds [30], wood waste ash concrete [31], wood waste–cement composites [32], and others. Cement-based products exhibit high compressive strength [33,34], whereas those with higher strength or density also exhibit high thermal conductivity [35,36]. The main disadvantage of cement is its high energy consumption and the pollution it generates during production. Approximately 2%–8% of global power consumption is attributable to the cement manufacturing process [37].
It is estimated that synthetic resins, with formaldehyde being the most common, account for more than 95% of all adhesives used in the production of wood-based panels. The synthesis of such resins is achieved through the reaction of formaldehyde with a variety of substances, including but not limited to mostly used urea, and then phenol, melamine, resorcinol, as well as combinations of these components [38]. A significant disadvantage of phenol-formaldehyde is that curing requires heat treatment, which not only consumes substantial energy but also limits product dimensions [39]. Another substantial disadvantage is that phenol is mutagenic, while formaldehyde is carcinogenic to humans, even at low concentrations [40].
Starch is one of the most abundant organic compounds, which is used as a binder in various fields. Starch is a key raw material in the adhesive and adhesives industry due to its high availability, biodegradability, and low price [41,42]. One of the most significant drawbacks of starch is its water solubility, which limits its industrial applications [43]. Another significant disadvantage of starch is that hardening requires heat treatment, which not only consumes substantial energy but also limits the product’s dimensions [44]. Hardening starch at high temperatures helps to obtain greater product strength. The curing temperature is usually 100–140 °C [45,46].
In the last two decades, biopolyurethane has been increasingly used [47,48,49]. In the composition of such biopolyurethane, a substantial portion of petroleum-derived materials can be replaced with natural oils. The curing time of biopolyurethane, depending on its composition, can range from a few minutes to several tens of minutes [50]. Polyurethane adhesive hardens through a chemical reaction between isocyanate groups (-NCO) and hydroxyl groups (-OH) [51,52]. This reaction does not require additional heat treatment. The most significant disadvantage of polyurethane glues is their high cost [53]. The amount of polyurethane glue used in product production can be reduced through various measures, thereby reducing the impact on price.
Engineered wood products in wood technology include a wide range, from fibreboard (hardboard) and particleboard to plywood, laminated veneer lumber, and glulam. In our work, engineered wood is a composite consisting of an organic filler and a polyurethane mixture with additives, hardened without thermal treatment. It differs from other traditional engineered wood products not only in its production technology and binder, but also in its purpose. Such products can be used instead of wooden logs to form beams or other construction products of various shapes.
This work aims to evaluate technological factors that influence the strength and moisture indicators of engineered wood, as well as the structural characteristics.
The work examines the kinetics of compressive strength, the effects of initial mixture pressure and density on compressive strength, and moisture indices. It evaluates the characteristics of structure formation across varying mixture pressures and polyurethane compositions. The polyurethane formulations are designed with environmental considerations in mind. In one case, 65% of the petroleum-derived polyol was replaced with a plant-based polyol and oil. In contrast, in another case, only 28% of the petroleum-derived polyol was replaced with a plant-based polyol.
2. Materials and Methods
2.1. Materials
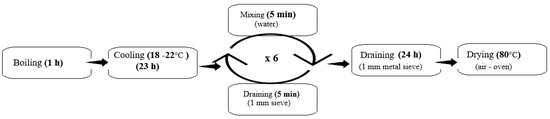
Construction, demolition, and furniture waste collected from JSC Ekobaze (Vilnius, Lithuania) was used to produce the samples. The initial waste samples were notably large; consequently, they were subjected to mechanical processing, including shredding at 3000 rpm using a 10 mm diameter screen. The resulting wood waste samples were then thermochemically treated with a sodium carbonate (Na2CO3) solution (10% w/w) from UAB Larochem (Klaipėda, Lithuania). This solution was prepared by boiling the wood waste samples in the sodium carbonate solution for one hour, after which the wood particles were left to cool in the soda solution. The wood particles were then washed in six cycles of water, followed by an overnight drainage period. Thereafter, they were dried in a hot air oven. The general scheme for processing wood waste is illustrated in Figure 1.
Figure 1.
The general scheme for processing wood waste.
Thereafter, the moisture content of the wood waste particles prepared for impregnation was measured to be 8%. The fillers were impregnated with the hydrophobic agent BEIPHOB FR (CHT R. Beitlich GmbH, Tübingen, Germany) by immersing the wood waste particles in a mixture of water and 5%, 10%, and 15% (calculated based on the dry mass of the wood waste particles) of this hydrophobic agent for 5 min. BEIPHOB FR hydrophobic agent was chosen due to its environmental friendliness and previous work showing good effects in the treatment of natural fibres. The hydrophobic agent is a chemical additive that repels water. Surfaces coated with a hydrophobic agent become water-resistant by preventing water absorption and improving durability, often by forming a non-polar layer that increases the water contact angle. Following treatment with the impregnation solution, the moisture content of all three wood waste sample groups (Equation (1)) was measured, with a result of (69.71 ± 0.49)%. Wood waste particles that have been impregnated with a solution of a hydrophobic agent were then placed in an air oven at 80 °C for 24 h (Figure 2). The use of higher temperatures is limited by the hydrophobic agent’s low thermal stability.
Figure 2.
The general scheme for processing wood waste with a hydrophobic agent.
The moisture content was calculated using the standardized measurement method specified in ISO 12570 [54], applying the relevant formula. The moisture was computed using the standardized measurement method specified in ISO 12570, with the formula:
where w is the total moisture of the sample, m is the mass of the sample before drying, and m0 is the mass of the sample after drying.
Despite the moisture content of the wood waste particles being measured at approximately (8.1 ± 0.32)% prior to impregnation, all calculations of hydrophobic agent content and impregnation solution mass were based on the oven-dry mass of the wood waste.
As binders, two-component polyurethane resins were used to form the samples, whose compositions are given in Table 1.
Table 1.
Engineered wood composite mixture compositions.
In the composition of the first binder, Lupranat M20S polymeric 4,4-diphenylmethane diisocyanate with 31.5% NCO (provided by BASF, Berlin, Germany), polyol Biopolyol RD (SIA PolyLabs, Riga, Latvia), which had a polyol hydroxyl number of 350 KOH/g (with a water content of less than 0.2%), and natural rapeseed oil (UAB “Lomista”, Kaišiadorys, Lithuania) were used. Hereinafter, this binder is referred to as biopolyurethane. For the composition of the second binder, Lupranat M20S polymeric 4,4-diphenylmethane diisocyanate with 31.5% NCO (obtained from BASF Services Europe GmbH, Berlin, Germany), polyol Biopolyol RD (SIA PolyLabs, Riga, Latvia), which had a polyol hydroxyl number of 350 KOH/g (with a water content of less than 0.2%) and glycerol (>99.5%), BerChem (JSC “BERCHEM”, Klaipėda, Lithuania) was used. Hereinafter, this binder is referred to as polyurethane.
Both compositions and the binder formulation were defined in terms of mass percentages, where the sum of all binder components equalled 100% of the total binder mass.
In the first composition, a bio-based polyurethane binder was prepared from rapeseed oil (22%), polyol (43%), and isocyanate (35%). The individual components were weighed according to the specified mass percentages and thoroughly mixed until a homogeneous binder was formed.
In the second composition, a polyurethane binder was formulated using polyol (28%), glycerol (9%), and isocyanate (63%). As in Composition 1, the components were mixed according to their mass percentages until a homogenous binder was formed.
After preparing the binders, they were mixed with wood waste at a 1:1 mass ratio. Therefore, the final composites consisted of 50% binder and 50% wood waste, despite the variation in the internal binder composition. It is important to note that all percentage values reported for binder components refer exclusively to the binder mass and not to the total composite mass.
Before composite formation, the wood waste was treated with a hydrophobic agent to reduce its moisture absorption. The hydrophobic agent content was calculated relative to the dry mass of wood waste and applied at levels of 0, 5, 10, or 15%.
The required quantity of hydrophobic agent was diluted with water to prepare the impregnation solution. The total mass of the solution (hydrophobic agent + water) was maintained at 200% of the dry mass of the wood waste. To express this more precisely, it should be noted that the mass of the impregnation solution was twice the mass of the wood waste being treated. The wood waste was impregnated in the prepared solution, drained, and used for composite production.
2.2. Engineered Wood Composite Formation
To assess the influence of mixture pressure on the formation of specimens, specimens were formed using biopolyurethane and polyurethane binders and wood waste (construction, demolition, and furniture industry) particles. Detailed granulometric composition of wood waste particles is presented in Table 2.
Table 2.
Granulometric composition of wood waste particles.
The prepared mixtures were compressed at pressures of 1.5 MPa, 2 MPa, 2.5 MPa, 3 MPa, and 3.5 MPa, respectively. To evaluate the influence of hydrophobic material on swelling and short-term water absorption, additional samples were prepared with 5, 10, and 15% hydrophobic material. The compositions of the formed samples are presented in Table 1.
Fifty-litre plastic containers were used to prepare the samples, in which fillers and binders were mixed for 60 s using an Apex ST2 mixer (Wagner S.p.A., Valmadrera, Italy) at 200 revolutions per minute. The mixture prepared for sample formation was transferred to a metal mould, and the samples were formed by pressing at 1.5–3.5 MPa. The samples were formed for a period of 30 min by means of a pneumatic-hydraulic Tongrun T40 press (Tongrun Imp. & Exp. Co., Ltd., Shanghai, China).
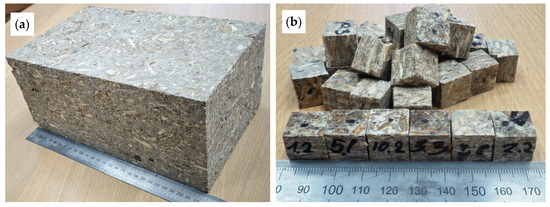
A view of the formed engineered wood specimen is presented in Figure 3.
Figure 3.
View of engineered wood specimen: (a) view of the formed sample in the mould; (b) view of samples prepared for testing.
2.3. Test Methods
The moisture content of wood particles was determined using a KERN DAB moisture analyser (KERN & Sohn GmbH, Balingen, Germany). The analysis was conducted on three samples from each impregnated wood particle group, drawn from different locations. The analyser’s measurement results were processed to calculate the mean moisture content for each sample group.
The apparent density was determined in accordance with ISO 29470 [55] using 15 mm × 15 mm × 15 mm cube-shaped samples. The samples were initially weighed and subsequently measured for length, width, and thickness. The apparent density of the samples was then calculated using the following Equation (2):
where ρ is the apparent density, in kg/m3; m is the mass of the tested sample, in kg; and V is the volume of the tested sample, in m3.
ρ = m/V
The compressive strength was determined in accordance with ISO 29469 [56], using cube-shaped samples measuring 15 mm × 15 mm × 15 mm. There is no unified methodology for determining the compressive strength of engineered wood products; the standard applicable to thermal insulation and wood-wool products was selected. This standard applies to materials in which the structure compacts during compression and a clear breakdown limit is not observed. The experimental tests were carried out using a Hounsfield H10KS universal test press (Hounsfield Test Equipment, Redhill, UK). The compressive strength of each composition was measured on three occasions. These measurements were taken after 1 day, 3 days, 1 week, 2 weeks, 4 weeks, 6 weeks, 8 weeks, 10 weeks, and 12 weeks. The statistical analysis was performed using Statistica. Analysis has been conducted at the α = 0.05 significance level.
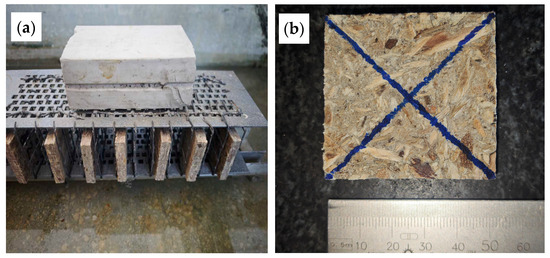
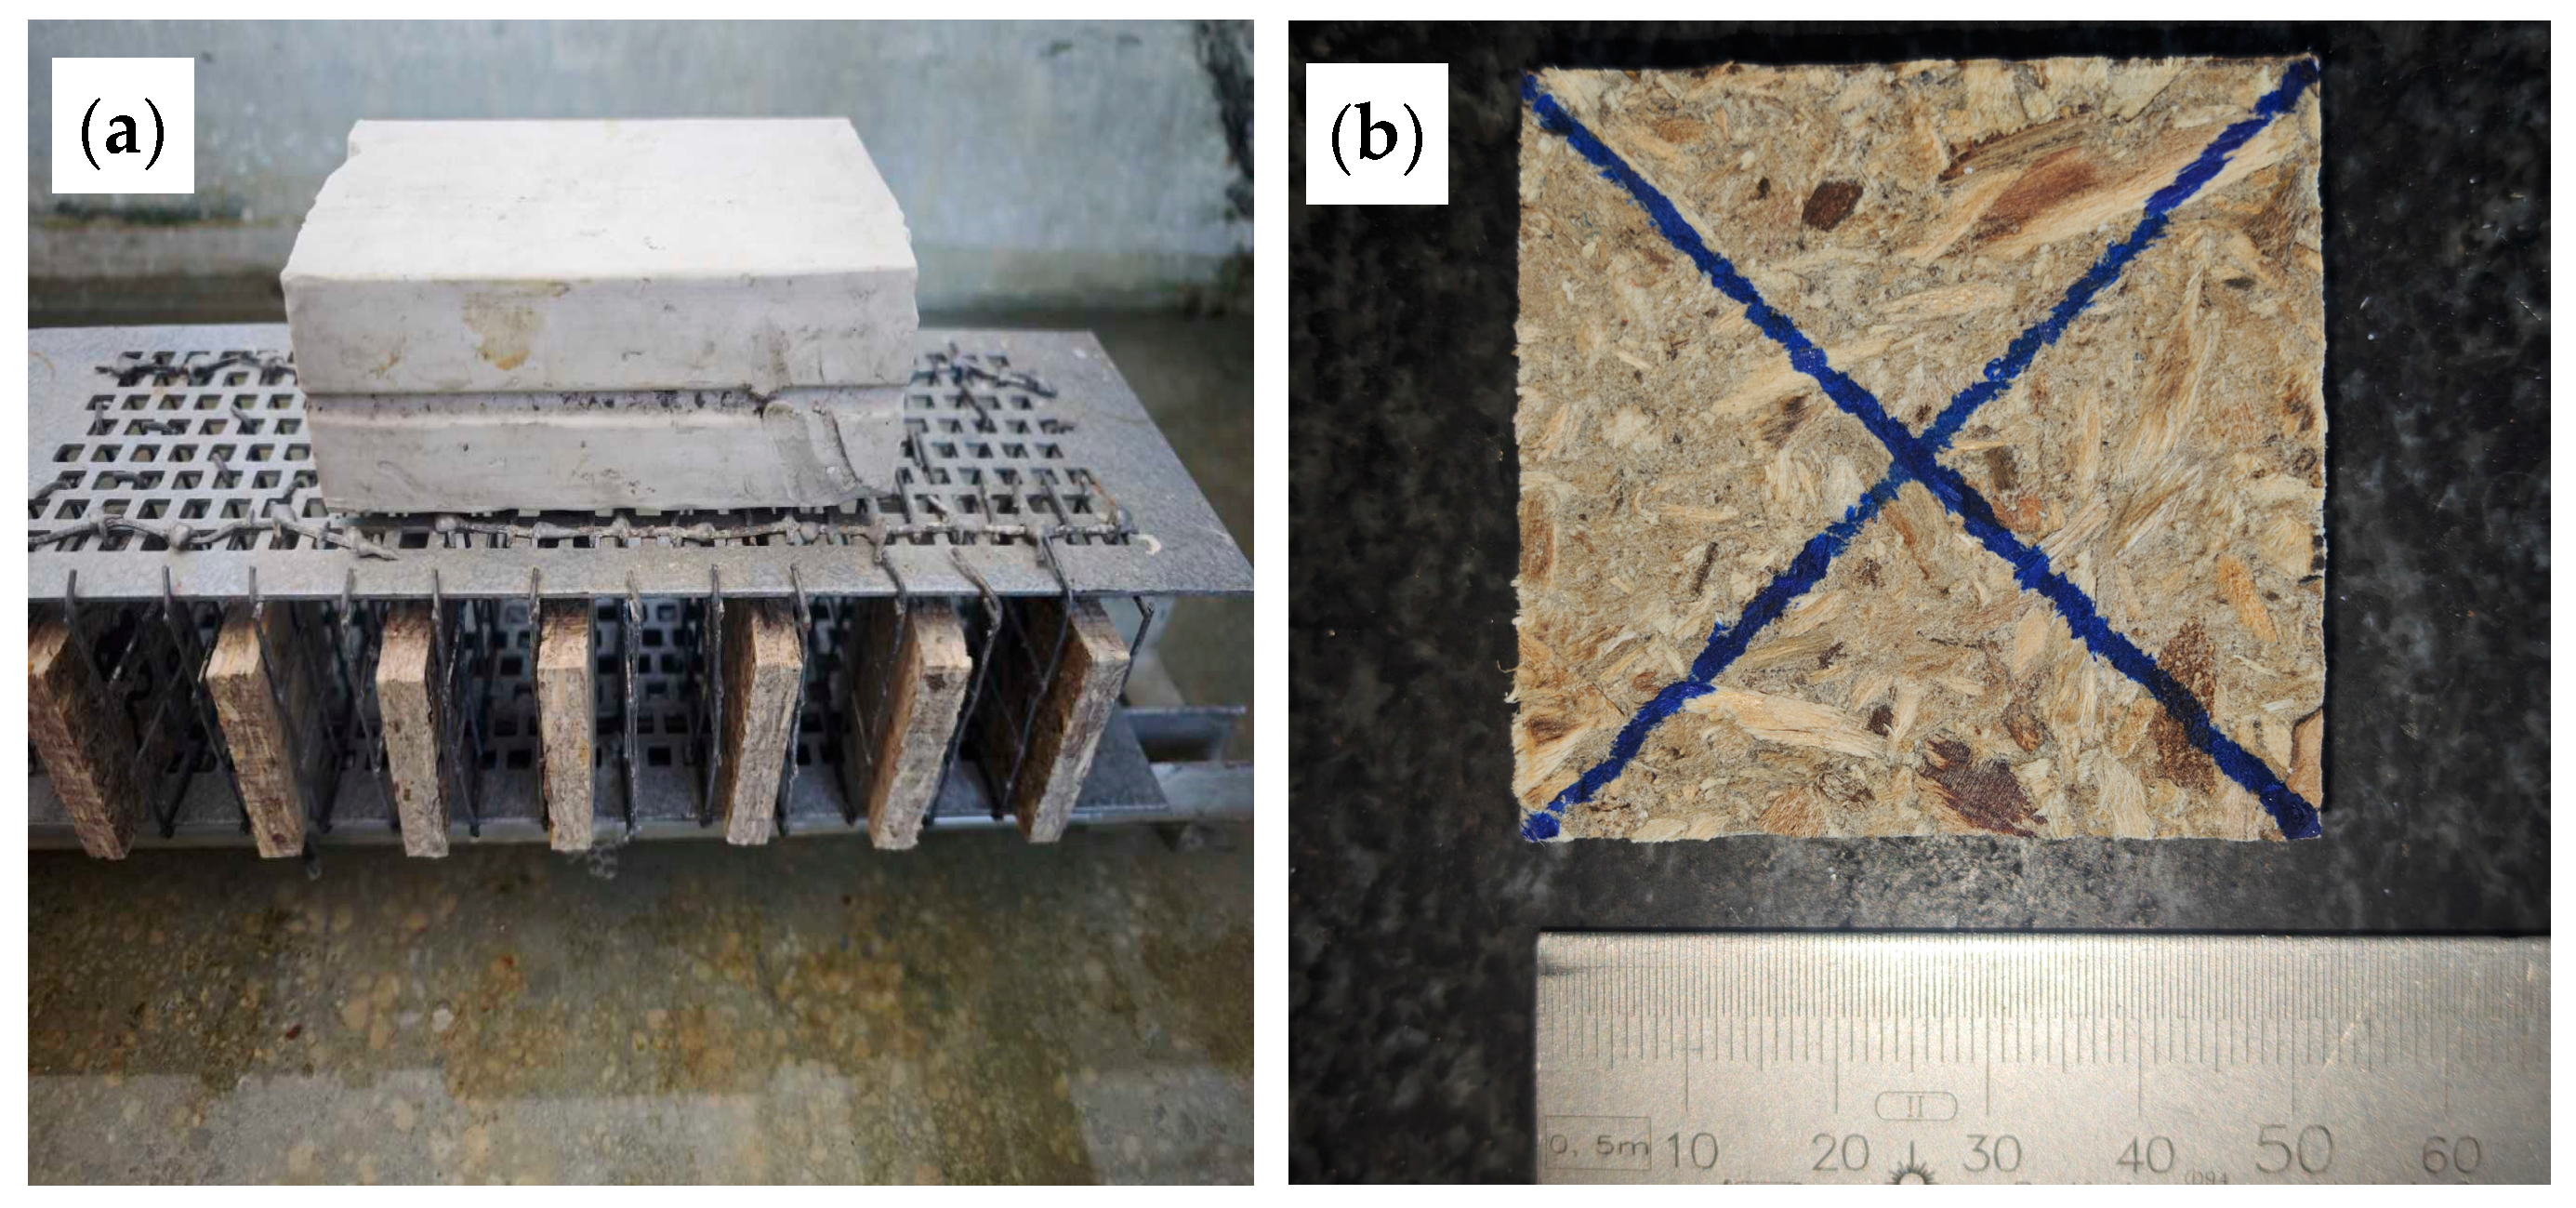
The determination of thickness swelling after immersion was performed in accordance with EN 317 [57]. The samples were square, measuring 50 mm × 50 mm × 10 mm. Determinations of outcomes following a 24 h immersion period were conducted employing Equation (3):
where Gt is the swelling in thickness; t1 is the thickness of the sample before immersion; t2 is the thickness of the sample after 24 h immersion. The general scheme for determining the sample swelling is presented in Figure 4.
Figure 4.
General scheme for determining the sample swelling: (a) placing the samples in the frame before filling with water; (b) the intersection of the lines indicates the measurement location of the specimen thickness before and after the swelling test.
Short-term absorption following partial immersion was determined in accordance with ISO 29767 [58]. For engineered wood products, swelling in water is usually determined, and there is no unified methodology for determining short-term absorption; therefore, as for determining compression, the standard applicable to thermal insulation and wood wool products was chosen. Determining short-term absorption for engineered wood products becomes relevant when their intended use expands. Short-term water absorption was calculated according to Equation (4):
where Wp is the short-term water absorption, kg/m2; m24 is the mass of the specimen after partially immersed in water for 24 h, kg; m0 is the initial mass of the dry specimen, kg; and A0 is the area of the lower plane where the specimen is immersed in water, m2.
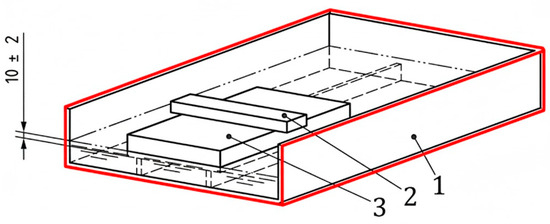
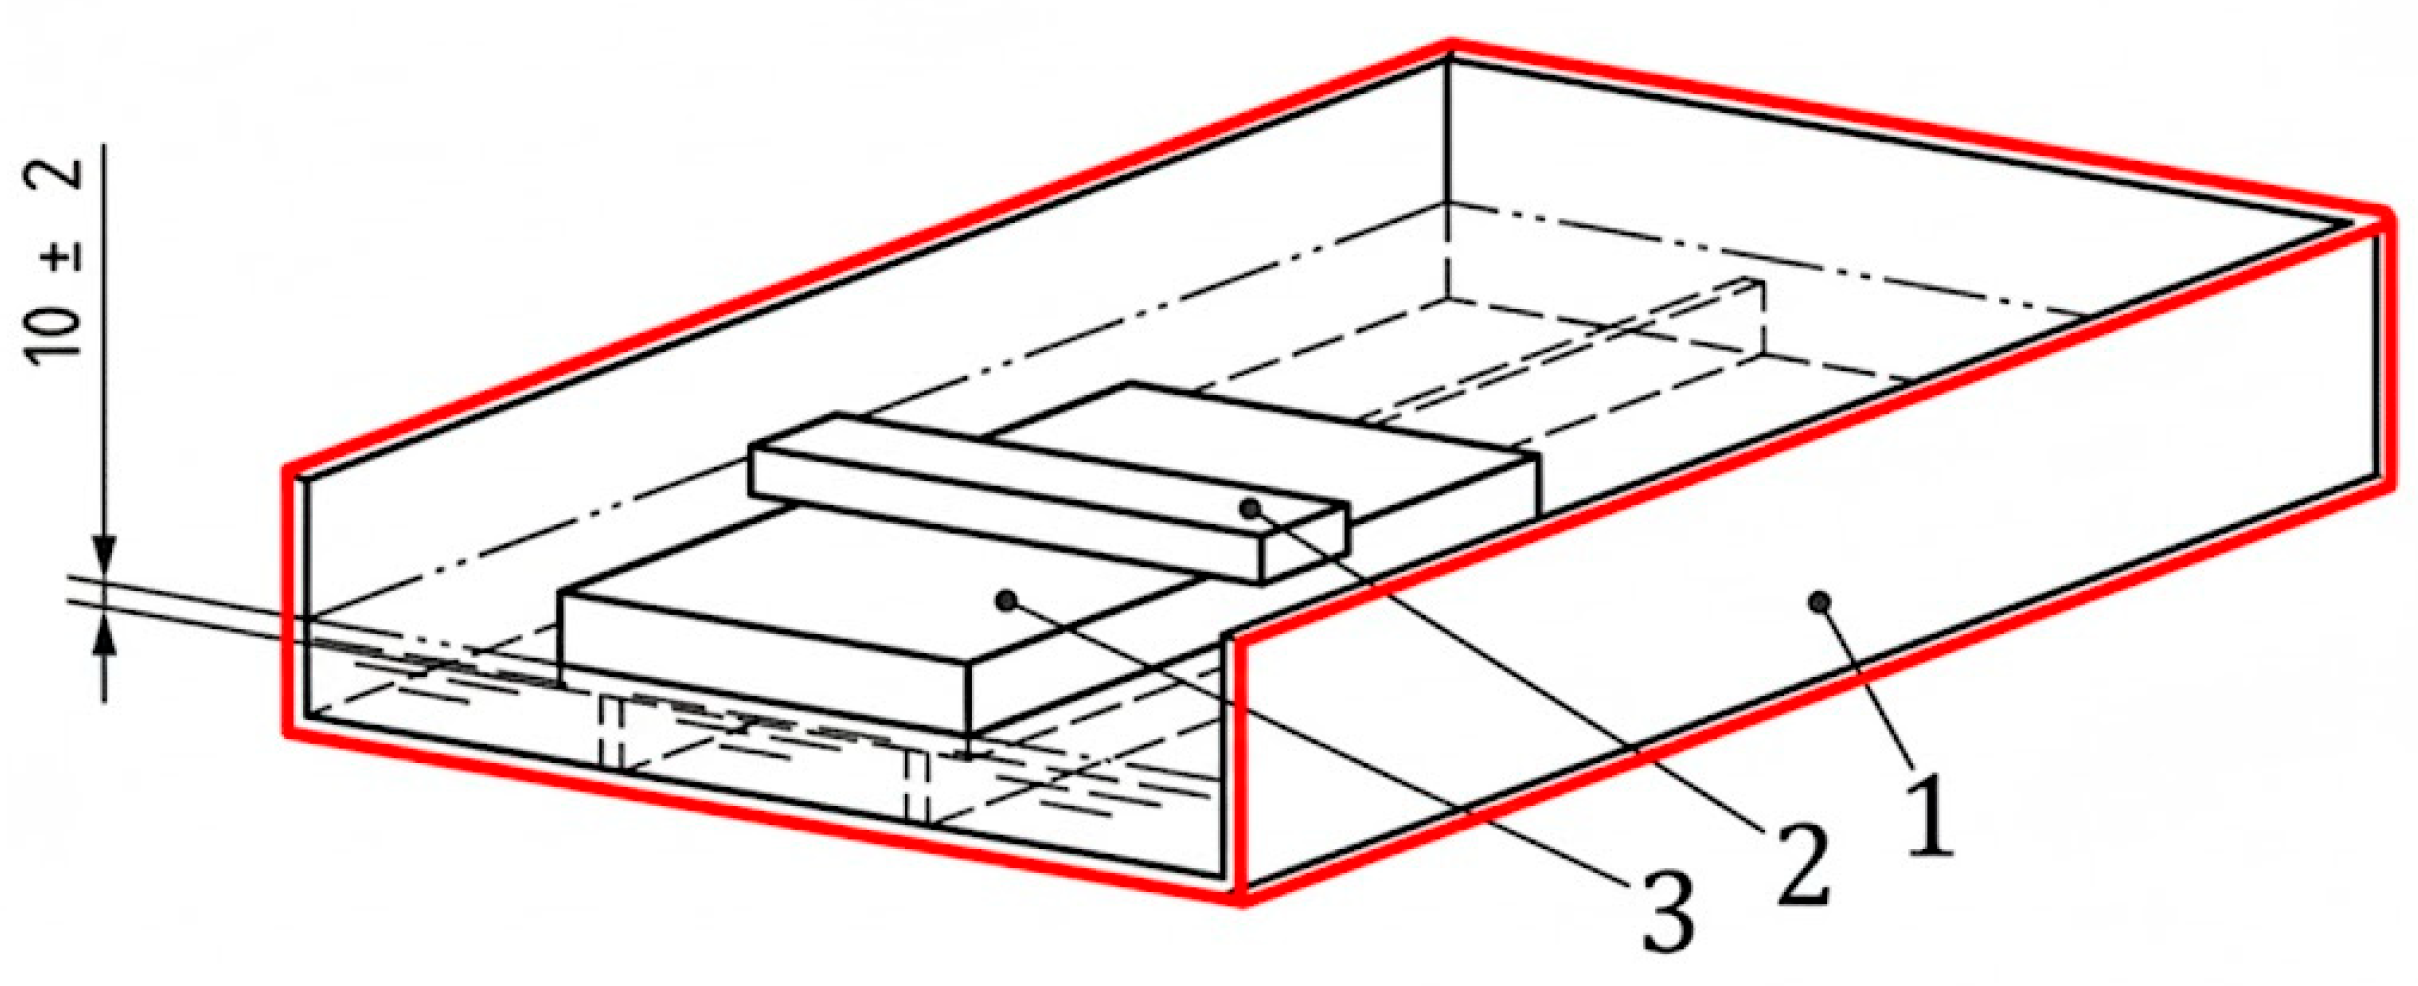
The sample immersion depth during the experiment was 10 mm. The general scheme for determining the sample water absorption is presented in Figure 5.
Figure 5.
Schematic diagram of short-term water absorption by partial immersion: 1—water container; 2—load holding the specimen immersed; 3—test specimen.
A study was conducted on the structure of the engineered wood, both with and without impregnated wood-waste fillers. This study was performed using a scanning electron microscope (SEM), the EVO-50 (Carl Zeiss SMT, Oberkochen, Germany).
3. Results
3.1. Compressive Strength
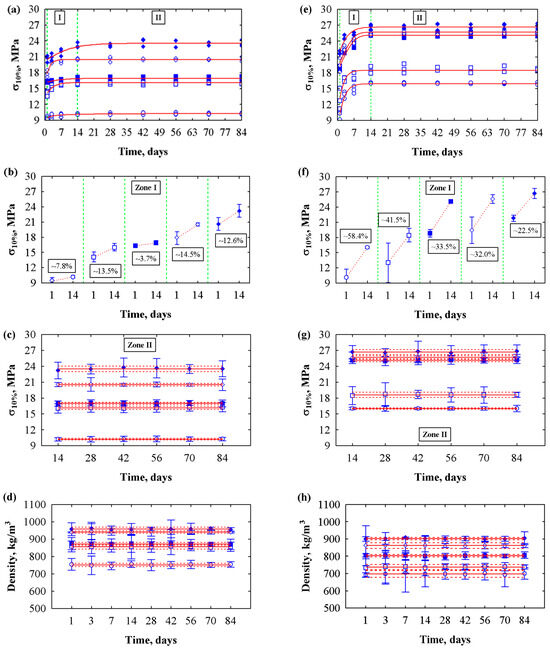
The results for compressive strength after different holding times, at various pressure levels, and with two different polyurethane compositions are presented in Figure 6a,e. The holding times were 1, 3, 7, 14, 28, 42, 56, 70, and 84 days, and the pressure levels during sample formation were 1.5, 2.0, 2.5, 3.0, and 3.5 MPa. The experimental studies showed that the dependence of the compressive strength of composites with biopolyurethane and polyurethane binders on holding time can be divided into two zones (see Figure 6a,e).
Figure 6.
Compressive strength versus holding time of engineered wood samples prepared with different binder composition: (a) biopolyurethane, holding time of specimens from 0 to 84 days; (b) biopolyurethane, holding time of 1–14 days; (c) biopolyurethane, holding time of 14 to 84 days; (d) biopolyurethane, density versus holding time; (e) polyurethane, holding time of specimens from 0 to 84 days; (f) polyurethane, holding time of 1–14 days; (g) polyurethane, holding time of 14 to 84 days; (h) polyurethane, density versus holding time; ○—1.5 MPa, □—2.0 MPa, ■—2.5 MPa, ◊—3.0 MPa, ♦—3.5 MPa mixture pressure level during specimen formation.
The first zone reflects the increase in compressive strength, which persists for 1–14 days. The second zone lasts from 14 to 84 days; it can be considered stationary, in which compressive strength does not change.
First, a regression analysis of the engineered wood composites was performed (Figure 6a,e). The regression analysis showed that compressive strength can be described by Equation (5) (Table 3).
Table 3.
Regression analysis results of engineered wood samples.
Figure 6b,f show the first zone of the engineered wood samples, where a pronounced increase in compressive strength is observed from 1 to 14 days. At different pressure levels, the increase in compressive strength during the formation of engineered wood with biopolyurethane varied (Figure 6b): 1.5 MPa—9.46 ± 0.293 to 10.2 ± 0.130 MPa, which amounted to ~7.8%; 2.0 MPa—14.1 ± 0.482 to 16.0 ± 0.366 MPa, ~13.5%; 2.5 MPa—16.3 ± 0.150 to 16.9 ± 0.206 MPa, ~3.7%; 3.0 MPa—17.9 ± 0.629 to 20.5 ± 0.159 MPa, ~14.5%; 3.5 MPa—20.6 ± 0.644 to 23.2 ± 0.626 MPa, ~12.6%. The greatest increase in compressive strength is observed in engineered wood samples at 3.0 MPa. The increase in compressive strength of engineered wood with polyurethane was as follows (Figure 6f): 1.5 MPa—10.1 ± 0.831 to 16.0 ± 0.101 MPa, which amounted to ~58.4%; 2.0 MPa—13.0 ± 1.95 to 18.4 ± 0.681 MPa, ~41.5%; 2.5 MPa—18.8 ± 0.376 to 25.1 ± 0.0992 MPa, ~33.5%; 3.0 MPa—19.4 ± 1.32 to 25.6 ± 0.435 MPa, ~32.0%; 3.5 MPa—21.8 ± 0.307 to 26.7 ± 0.504 MPa, ~22.5%. The greatest increase in compressive strength is observed in engineered wood samples at 1.5 MPa. In the period from 1 to 14 days (zone I), the greatest increase in compressive strength is observed in engineered wood with polyurethane.
Figure 6c,g show the second zone of the engineered wood samples, where the compressive strength transitions to a stationary state that persists from 14 to 18 days. The analysis of variance (Figure 6c,g; Table 4) showed that the group means did not differ significantly, indicating no statistically significant difference in compressive strength.
Table 4.
Anova analysis results of engineered wood samples.
At different pressure levels during the formation of engineered wood with biopolyurethane, the average compressive strength values are as follows (Figure 6c): 1.5 MPa—10.2 ± 0.154 MPa; 2.0 MPa—16.1 ± 0.293 MPa; 2.5 MPa—17.0 ± 0.198 MPa; 3.0 MPa—20.5 ± 0.253 MPa; 3.5 MPa—23.5 ± 0.522 MPa. The lowest compressive strength is observed in engineered wood at 1.5 MPa, whereas the highest is at 3.5 MPa. When the pressure level is increased by ~2.3 times, the compressive strength increases by ~130%. The average compressive strength for engineered wood with polyurethane can be accepted as follows (Figure 6g): 1.5 MPa—16.0 ± 0.130 MPa; 2.0 MPa—18.6 ± 0.501 MPa; 2.5 MPa—25.1 ± 0.244 MPa; 3.0 MPa—25.7 ± 0.285 MPa; 3.5 MPa—26.7 ± 0.476 MPa. The lowest compressive strength is observed for engineered wood at 1.5 MPa, whereas the highest is at 3.5 MPa. With a pressure increase of ~2.3 times, the compressive strength increased by ~67%. When comparing the compressive strength of engineered wood prepared with biopolyurethane and polyurethane at a mixture pressure level of 1.5 MPa, the difference was ~57%. When comparing the compressive strength values of composites with biopolyurethane and polyurethane at a pressure of 3.5 MPa, the difference was ~14%.
Additionally, the influence of the densities of engineered wood prepared with biopolyurethane and polyurethane on holding time was evaluated (Figure 6d,h). To assess the impact of engineered wood density changes on time, analysis of variance was used. The study of variance (Figure 6d,h; Table 5) showed that the group means did not differ significantly, indicating no statistically significant differences in engineered wood density.
Table 5.
Anova analysis results of engineered wood density.
After performing the analysis of variance, it was determined that the average values of the densities of engineered wood with biopolyurethane with varying retention time from 1 to 84 days can be accepted (Figure 6d): 1.5 MPa—753 ± 9.37 kg/m3; 2.0 MPa—856 ± 13.1 kg/m3; 2.5 MPa—872 ± 9.85 kg/m3; 3.0 MPa—942 ± 6.99 kg/m3; 3.5 MPa—959 ± 10.7 kg/m3. The lowest density is observed in engineered wood at 1.5 MPa, whereas the highest is at 3.5 MPa. With a pressure increase of ~2.3 times, the density of the engineered wood increased by ~27%. The average densities of engineered wood prepared with polyurethane can be accepted (Figure 6h): 1.5 MPa—698 ± 20.2 kg/m3; 2.0 MPa—738 ± 14.81 kg/m3; 2.5 MPa—804 ± 6.85 kg/m3; 3.0 MPa—862 ± 15.9 kg/m3; 3.5 MPa—903 ± 7.20 kg/m3. The lowest density is observed in engineered wood at a pressure of 1.5 MPa, whereas the highest density is observed at 3.5 MPa. With a pressure increase of ~2.3 times, the density of the engineered wood increased by ~29%. When comparing the density values of engineered wood prepared with biopolyurethane and polyurethane, at a pressure level of 1.5 MPa, the difference was ~7%. At a pressure level of 3.5 MPa, the density of engineered wood prepared with biopolyurethane was ~6% higher than that of polyurethane.
The analysis showed that the density of engineered wood prepared with polyurethane was slightly lower than that of engineered wood prepared with biopolyurethane. However, the compressive strength values of the engineered wood prepared with polyurethane are higher than those of the engineered wood prepared with biopolyurethane.
Next, the dependence of the compressive strength in engineered wood on holding time, material density, and pressure level was evaluated. Multiple regression analysis was chosen to assess which composite parameters have the greatest influence on compressive stress. The regression equation can describe the compressive strength of the engineered wood (6):
where are constant coefficients; T—holding time; ρ—density of engineered wood samples; p.l—pressure level of mixture during formation of engineered wood samples.
After performing a mathematical-statistical analysis of the experimental results of engineered wood, the values of the regression dependence coefficients were obtained: prepared with biopolyurethane, ; ; ; prepared with polyurethane, ; ; .
It should be emphasized that the obtained coefficients of determination of the regression Equation (5) range from 0.981 to 0.906. This indicates that the regression equations obtained can be used reliably to predict properties from known values.
3.2. Short-Term Water Absorption and Swelling
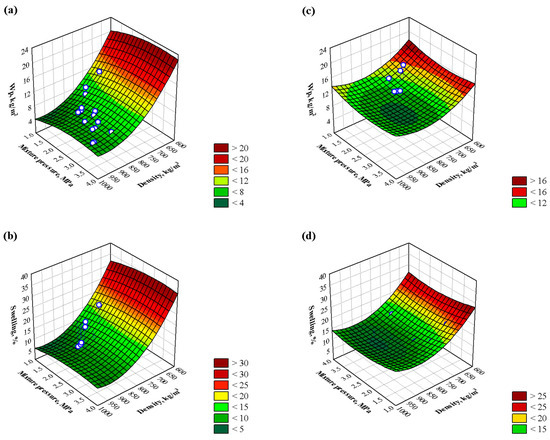
Figure 5 presents an analysis of the moisture properties of engineered wood, evaluating changes in short-term water absorption, Wp, and swelling, Sw, as functions of material density and applied pressure. Figure 7a,b present the changes in short-term water absorption and swelling of engineered wood prepared with biopolyurethane depending on the density of the material and the pressure level of the mixture. The short-term water absorption and swelling properties of engineered wood were assessed using multicriteria analysis. Multiple regression analysis was chosen to assess which composite parameters have the greatest influence on short-term water absorption and swelling. The multicriteria analysis method is based on the mathematical expression presented in Table 6.
Figure 7.
Analysis of moisture properties of engineered wood prepared with different binder: (a) biopolyurethane; short-term water absorption (Wp) relationship from material density and pressure level; (b) biopolyurethane; swelling relationship from material density and pressure level; (c) polyurethane; short-term water absorption (Wp) relationship from material density and pressure level; (d) polyurethane; swelling relationship from material density and pressure level.
Table 6.
Multicriteria regression analysis results of water absorption and swelling properties.
Figure 7a,b show the experimental results of short-term water absorption and swelling changes in engineered wood prepared with biopolyurethane (Figure 7a): 1.5 MPa—765 ± 42.2 kg/m3–10.4 ± 2.38 kg/m2, 2.0 MPa—871 ± 9.07 kg/m3–7.49 ± 0.460 kg/m2, 2.5 MPa—868 ± 28.8 kg/m3–7.82 ± 0.817 kg/m2, 3.0 MPa—902 ± 14.0 kg/m3–7.81 ± 0.795 kg/m2, 3.5 MPa—936 ± 51.2 kg/m3–7.33 ± 0.388 kg/m2. The results of Wp calculated according to Equation (6) are presented below: 1.5 MPa—765 kg/m3–10.0 kg/m2, 2.0 MPa—871 kg/m3–7.02 kg/m2, 2.5 MPa—868 kg/m3–7.64 kg/m2, 3.0 MPa—902 kg/m3–7.22 kg/m2, 3.5 MPa—936 kg/m3–6.78 kg/m2. We can see that the results of Wp calculated according to Equation (6) describe the experimental results very well. The analysis of the experimental results showed that the highest Wp is observed for samples at a pressure level of 1.5 MPa—10.4 ± 2.38 kg/m2, while at a pressure range of 2.0–2.5–3.0–3.5 MPa Wp remains relatively unchanged. This was confirmed by the analysis of variance, at the pressure range of 2.0–2.5–3.0–3.5 MPa, the average Wp values do not differ. The F-criterion statistics were 0.423, p = 0.74, R = 0.370, and R2 = 0.187, indicating a statistically insignificant difference between the studies. At the pressure range of 2.0–2.5–3.0–3.5 MPa, the average Wp values can be accepted as 7.62 ± 0.591 kg/m2. We see that the difference between the highest and lowest values was ~36.5%.
The experimental swelling results at the same density and pressure levels are presented below (Figure 7b): 1.5 MPa—13.7 ± 3.92%, 2.0—8.61 ± 0.594%, 2.5—9.03 ± 1.20%, 3.0—8.67 ± 1.00%, 3.5—8.29 ± 0.439%. The swelling results calculated according to Equation (7) are presented below: 1.5 MPa—13.5%, 2.0 MPa—8.50%, 2.5 MPa—9.25%, 3.0 MPa—8.58%, 3.5 MPa—8.03%. We observe that the swelling results calculated using Equation (7) are well described. As with the short-term water absorption, the swelling results also show the same trend. At 1.5 MPa—13.7 ± 3.92%, the swelling is the highest, and at pressure ranges 2.0–2.5–3.0–3.5 MPa, the swelling remains relatively unchanged. This was confirmed by the analysis of variance, at pressure range 2.0–2.5–3.0–3.5 MPa, the average swelling values do not differ. The F-criterion statistic was 0.376 (p = 0.77), R = 0.352, and R2 = 0.124, indicating a statistically insignificant difference between the studies. At pressure range 2.0–2.5–3.0–3.5 MPa, the average swelling values can be accepted as 8.65 ± 0.787 kg/m2. We observe that the difference between the highest and lowest values was ~36.9%.
Figure 7c,d show the changes in short-term water absorption and swelling of engineered wood prepared with polyurethane as a function of material density and mixture pressure level. The experimental results of Wp were obtained as follow (Figure 7c): 1.5 MPa—717 ± 40.8 kg/m3—13.0 ± 1.07 kg/m2, 2.0 MPa—774 ± 15.0 kg/m3—10.5 ± 0.290 kg/m2, 2.5 MPa—827 ± 27.7 kg/m3—10.1 ± 0.645 kg/m2, 3.0 MPa—845 ± 40.3 kg/m3—10.1 ± 0.384 kg/m2, 3.5 MPa—800 ± 48.9 kg/m3—10.3 ± 0.663 kg/m2. The results of Wp calculated according to Equation (7) are presented below: 1.5 MPa—717 kg/m3—12.7 kg/m2, 2.0 MPa—774 kg/m3—10.9 kg/m2, 2.5 MPa—827 kg/m3—9.91 kg/m2, 3.0 MPa—845 kg/m3—9.73 kg/m2, 3.5 MPa—800 kg/m3—10.3 kg/m2. We can see that the results of Wp calculated according to Equation (7) describe the experimental results very well. The analysis of the experimental results showed that the highest Wp is characterized by samples at a pressure level of 1.5 MPa—13.0 ± 2.38 kg/m2, and at a pressure range of 2.0–2.5–3.0–3.5 MPa Wp remains relatively unchanged. This was confirmed by the analysis of variance, at a pressure range of 2.0–2.5–3.0–3.5 MPa, the average Wp values do not differ. The F-criterion statistics were 0.552, p = 0.66, R = 0.414, R2 = 0.172, indicating a statistically insignificant difference in the experimental results. At a pressure range of 2.0–2.5–3.0–3.5 MPa, the average Wp values can be accepted as 10.3 ± 0.488 kg/m2. We observe that the difference between the highest and lowest values was ~20.8%.
The experimental swelling results for the engineered wood prepared with polyurethane at the same density and pressure levels (Figure 7d) are presented below: 1.5 MPa—15.7 ± 2.62%; 2.0 MPa—13.2 ± 0.766%; 2.5 MPa—11.7 ± 1.38%; 3.0 MPa—12.5 ± 0.0850%; 3.5 MPa—13.8 ± 1.95%. The swelling results, calculated according to Equation (8), are presented below: 1.5 MPa—17.5%; 2.0 MPa—13.7%; 2.5 MPa—11.6%; 3.0 MPa—11.2%; 3.5 MPa—12.6%. We can see that the swelling results calculated according to Equation (8) describe the experimental results very well. As with short-term water absorption, the swelling results show the same trend. The highest swelling is observed in samples at a pressure level of 1.5 MPa—15.7 ± 2.62%, while at a pressure range of 2.0–2.5–3.0–3.5 MPa, the swelling remains relatively unchanged. This was confirmed by analysis of variance: across the pressure range of 2.0–2.5–3.0–3.5 MPa, the average swelling values do not differ. The F-criterion statistic was 1.12 (p = 0.40), R = 0.543, and R2 = 0.295, indicating a statistically insignificant difference in the test results. Over the pressure range of 2.0–2.5–3.0–3.5 MPa, the average swelling value can be taken as 12.6 ± 1.120%. We see that the difference between the highest and lowest values was ~19.8%.
After comparing the short-term water absorption of engineered wood prepared with biopolyurethane and polyurethane at a pressure level of 1.5 MPa, we see that the water absorption of engineered wood samples with biopolyurethane is ~20.5% lower than that of engineered wood samples prepared with polyurethane. When comparing the water absorption values in the pressure range 2.0–2.5–3.0–3.5 MPa, this difference was 30.5%.
After comparing the swelling of engineered wood prepared with biopolyurethane and polyurethane at a pressure level of 1.5 MPa, we see that the swelling of engineered wood samples with biopolyurethane is ~14.6% lower than that of engineered wood samples prepared with polyurethane. When comparing the swelling values in the pressure range 2.0–2.5–3.0–3.5 MPa, this difference was 45.7%.
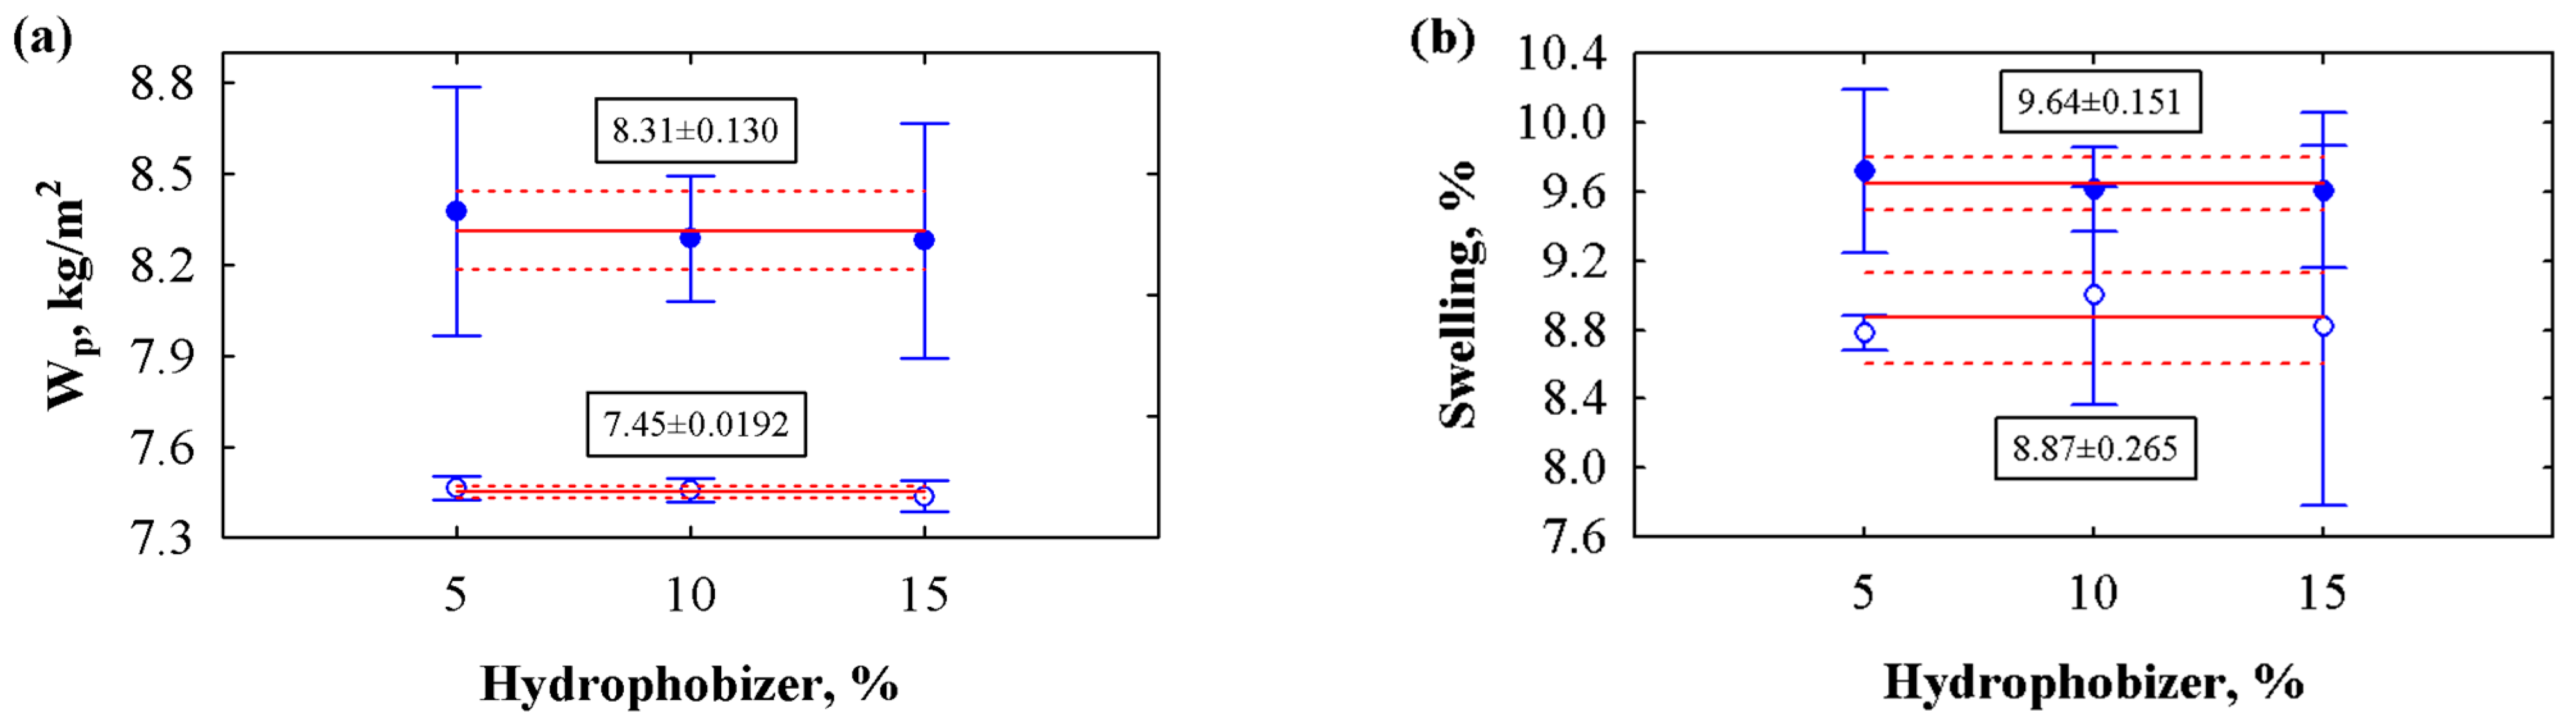
Also, an attempt was made to evaluate the short-term water absorption of engineered wood samples by introducing an additional hydrophobizer (Figure 8). The analysis was performed on engineered wood samples prepared at 3.0 MPa pressure with hydrophobizer contents of 5, 10, and 15%.
Figure 8.
Analysis of the moisture properties of hydrophobized engineered wood samples: (a)—short-term water absorption (Wp) relationship with the amount of hydrophobizer; (b)—swelling relationship with the amount of hydrophobizer; ○—samples with biopolyurethane; ●—samples with polyurethane.
The analysis of variance showed that the average values of the samples prepared with biopolyurethane did not differ among those containing 5, 10, and 15% hydrophobizer. This was confirmed by the obtained statistical values, the F-criterion statistics were 1.93, p = 0.26, R = 0.625, R2 = 0.391. This indicates a statistically insignificant difference between the study results. The average short-term water absorption of engineered wood samples is 7.45 ± 0.0192 kg/m3.
The average values of the engineered wood samples prepared with polyurethane do not differ among those containing 5, 10, and 15% hydrophobizer. This was confirmed by the statistical values obtained: F-criterion = 0.447, p = 0.66, R = 0.360, R2 = 0.130. This indicates a statistically insignificant difference in the test results. The average value of the artificial wood samples prepared with polyurethane containing 5, 10, and 15% hydrophobizer is 8.31 ± 0.130 kg/m2.
Figure 8b shows the swelling analysis of engineered wood specimens prepared with biopolyurethane. The study of variance showed that the mean values do not differ between samples containing 5, 10, and 15% hydrophobizer. This was confirmed by the obtained statistical values: F-criterion = 0.485, p = 0.64, R = 0.373, R2 = 0.139. This indicates a statistically insignificant difference in the test results. For engineered wood specimens prepared with biopolyurethane containing 5, 10, and 15% hydrophobizer, the average value is 8.87 ± 0.265 kg/m2. The analysis of variance showed that the mean values do not differ between samples containing 5, 10, and 15% hydrophobizer. This was confirmed by the obtained statistical values; the F-criterion statistics were 0.447, p = 0.66, R = 0.360, R2 = 0.130, which indicates a statistically insignificant difference in the test results. For engineered wood specimens prepared with polyurethane containing 5, 10, and 15% hydrophobizer, the average value is 9.64 ± 0.151 kg/m2.
Analysis of variance on engineered wood specimens prepared with biopolyurethane showed that the average densities of samples containing 5, 10, and 15% hydrophobizer did not differ. This was confirmed by the obtained statistical values: F-criterion = 0.469, p = 0.65, R = 0.368, R2 = 0.135. This indicates a statistically insignificant difference in the test results. The average density of the engineered wood samples prepared with biopolyurethane is 840 ± 25.3 kg/m3. The analysis of variance for the engineered wood samples prepared with polyurethane also confirmed that the average densities were not significantly different. The F-criterion statistic was 1.373, p = 0.32, R = 0.560, R2 = 0.314. This indicates a statistically insignificant difference in the test results. The average density of engineered wood samples prepared with polyurethane is 862 ± 32.3 kg/m3. The density difference between engineered wood samples prepared with biopolyurethane and polyurethane is ~2.6%. Repeated analysis of variance confirmed that there are no differences in average density values among engineered wood samples prepared with different binders. The following statistical values were obtained: p = 0.13; R = 0.375, R2 = 0.140.
Comparing short-term water absorption and swelling values of hydrophobized engineered wood samples prepared with biopolyurethane and polyurethane, we observe that those prepared with biopolyurethane exhibit lower values. Water absorption is lower by ~11.5%, and swelling is lower by ~8.7%.
3.3. Structure Analysis
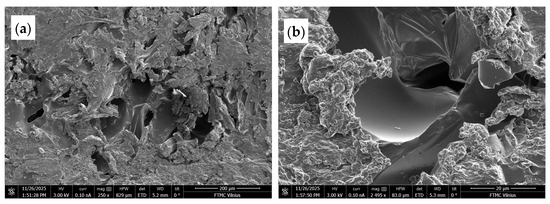
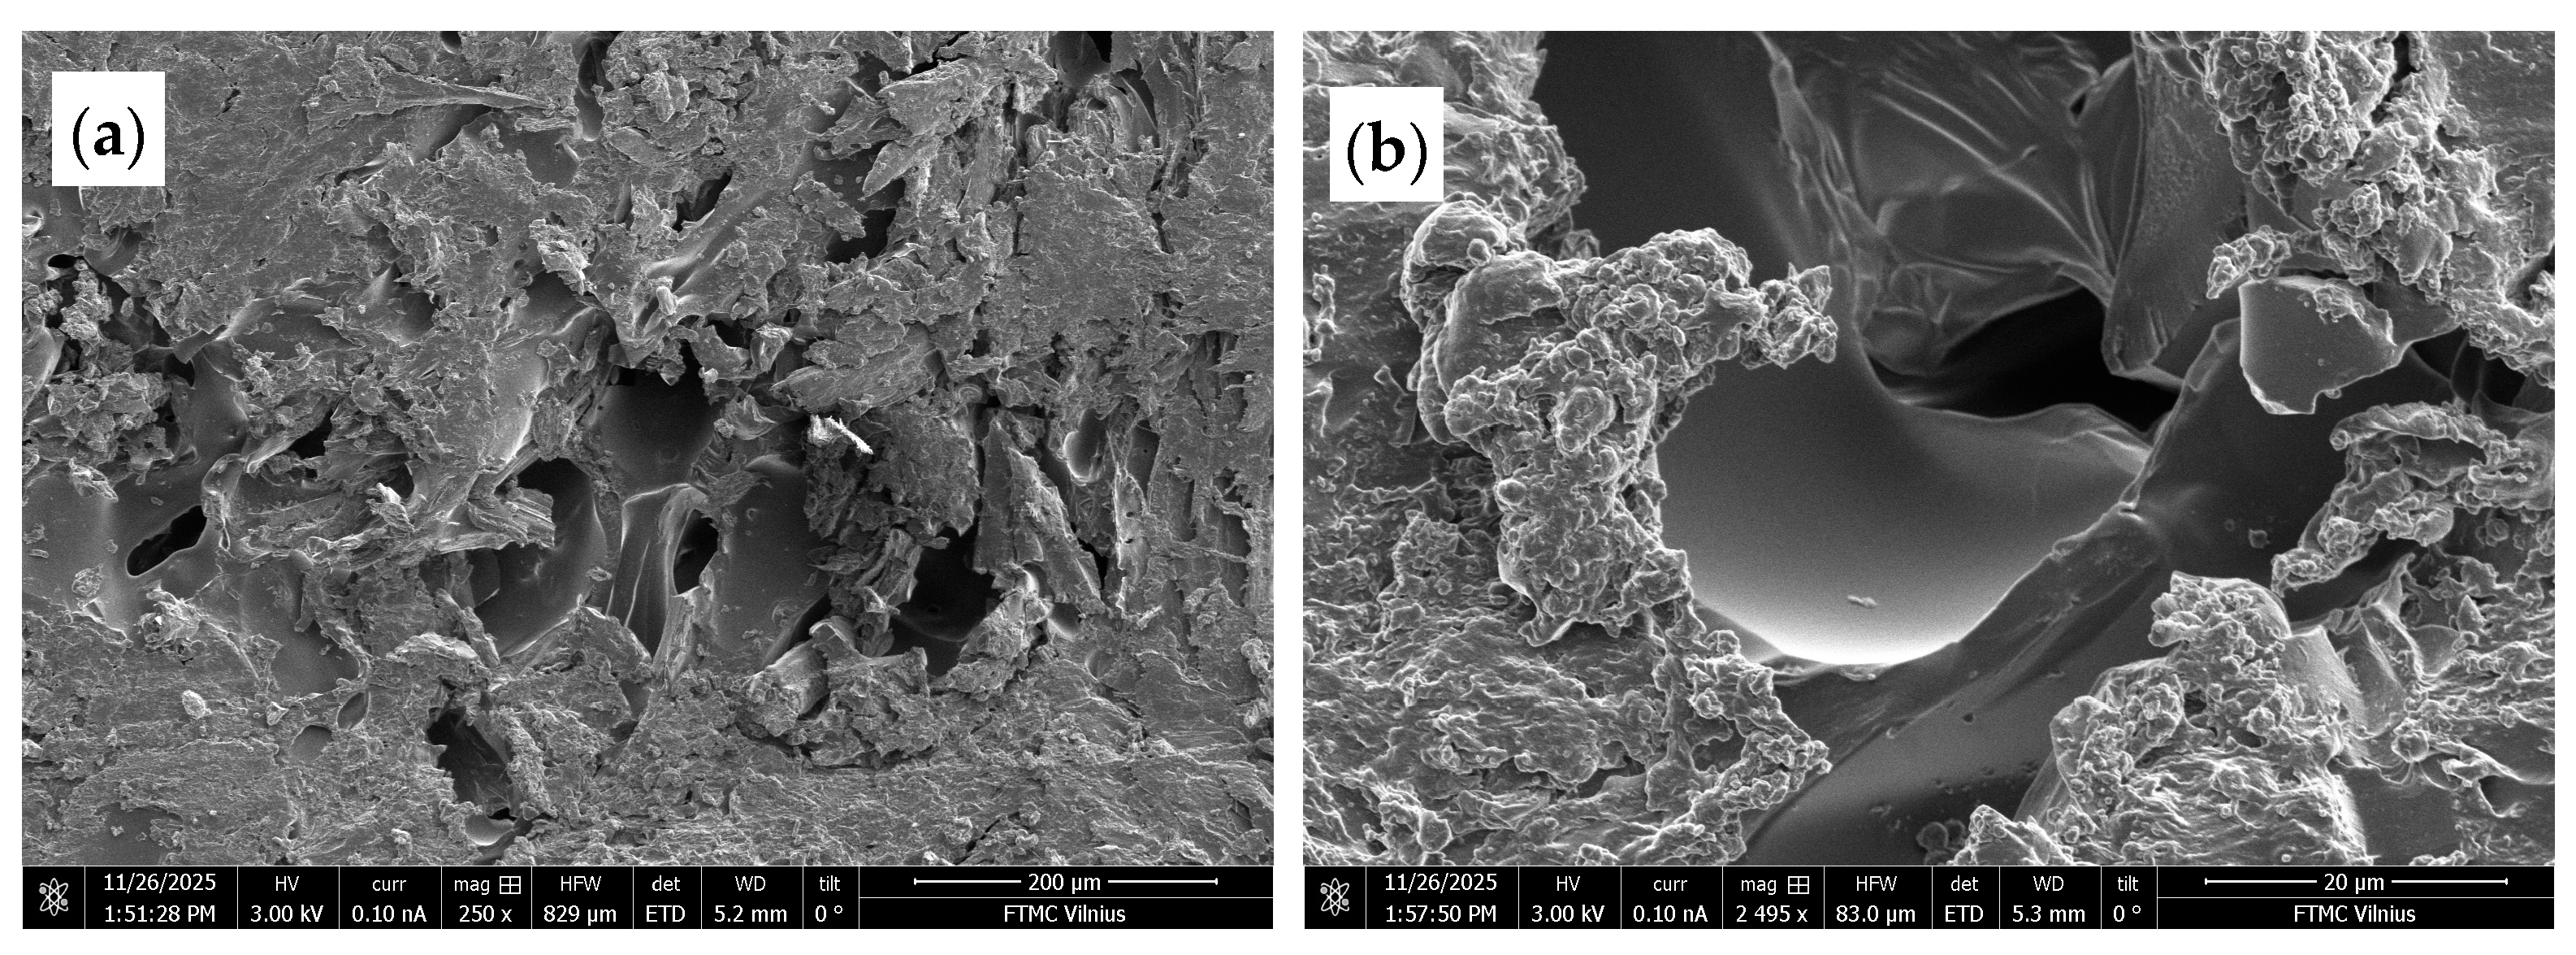
Analysis of the structure of engineered wood clarified the influence of the mixture’s initial pressure on its formation. Figure 9 shows a view of the engineered wood structure with biopolyurethane. Figure 9a,b show an image of engineered wood at an initial mixture pressure of 1.5 MPa. In this way, numerous large voids remain in the sample’s structure, which worsens the formation of contact zones and operational indicators.
Figure 9.
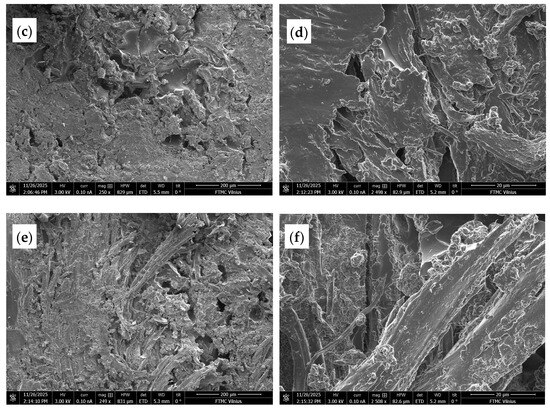
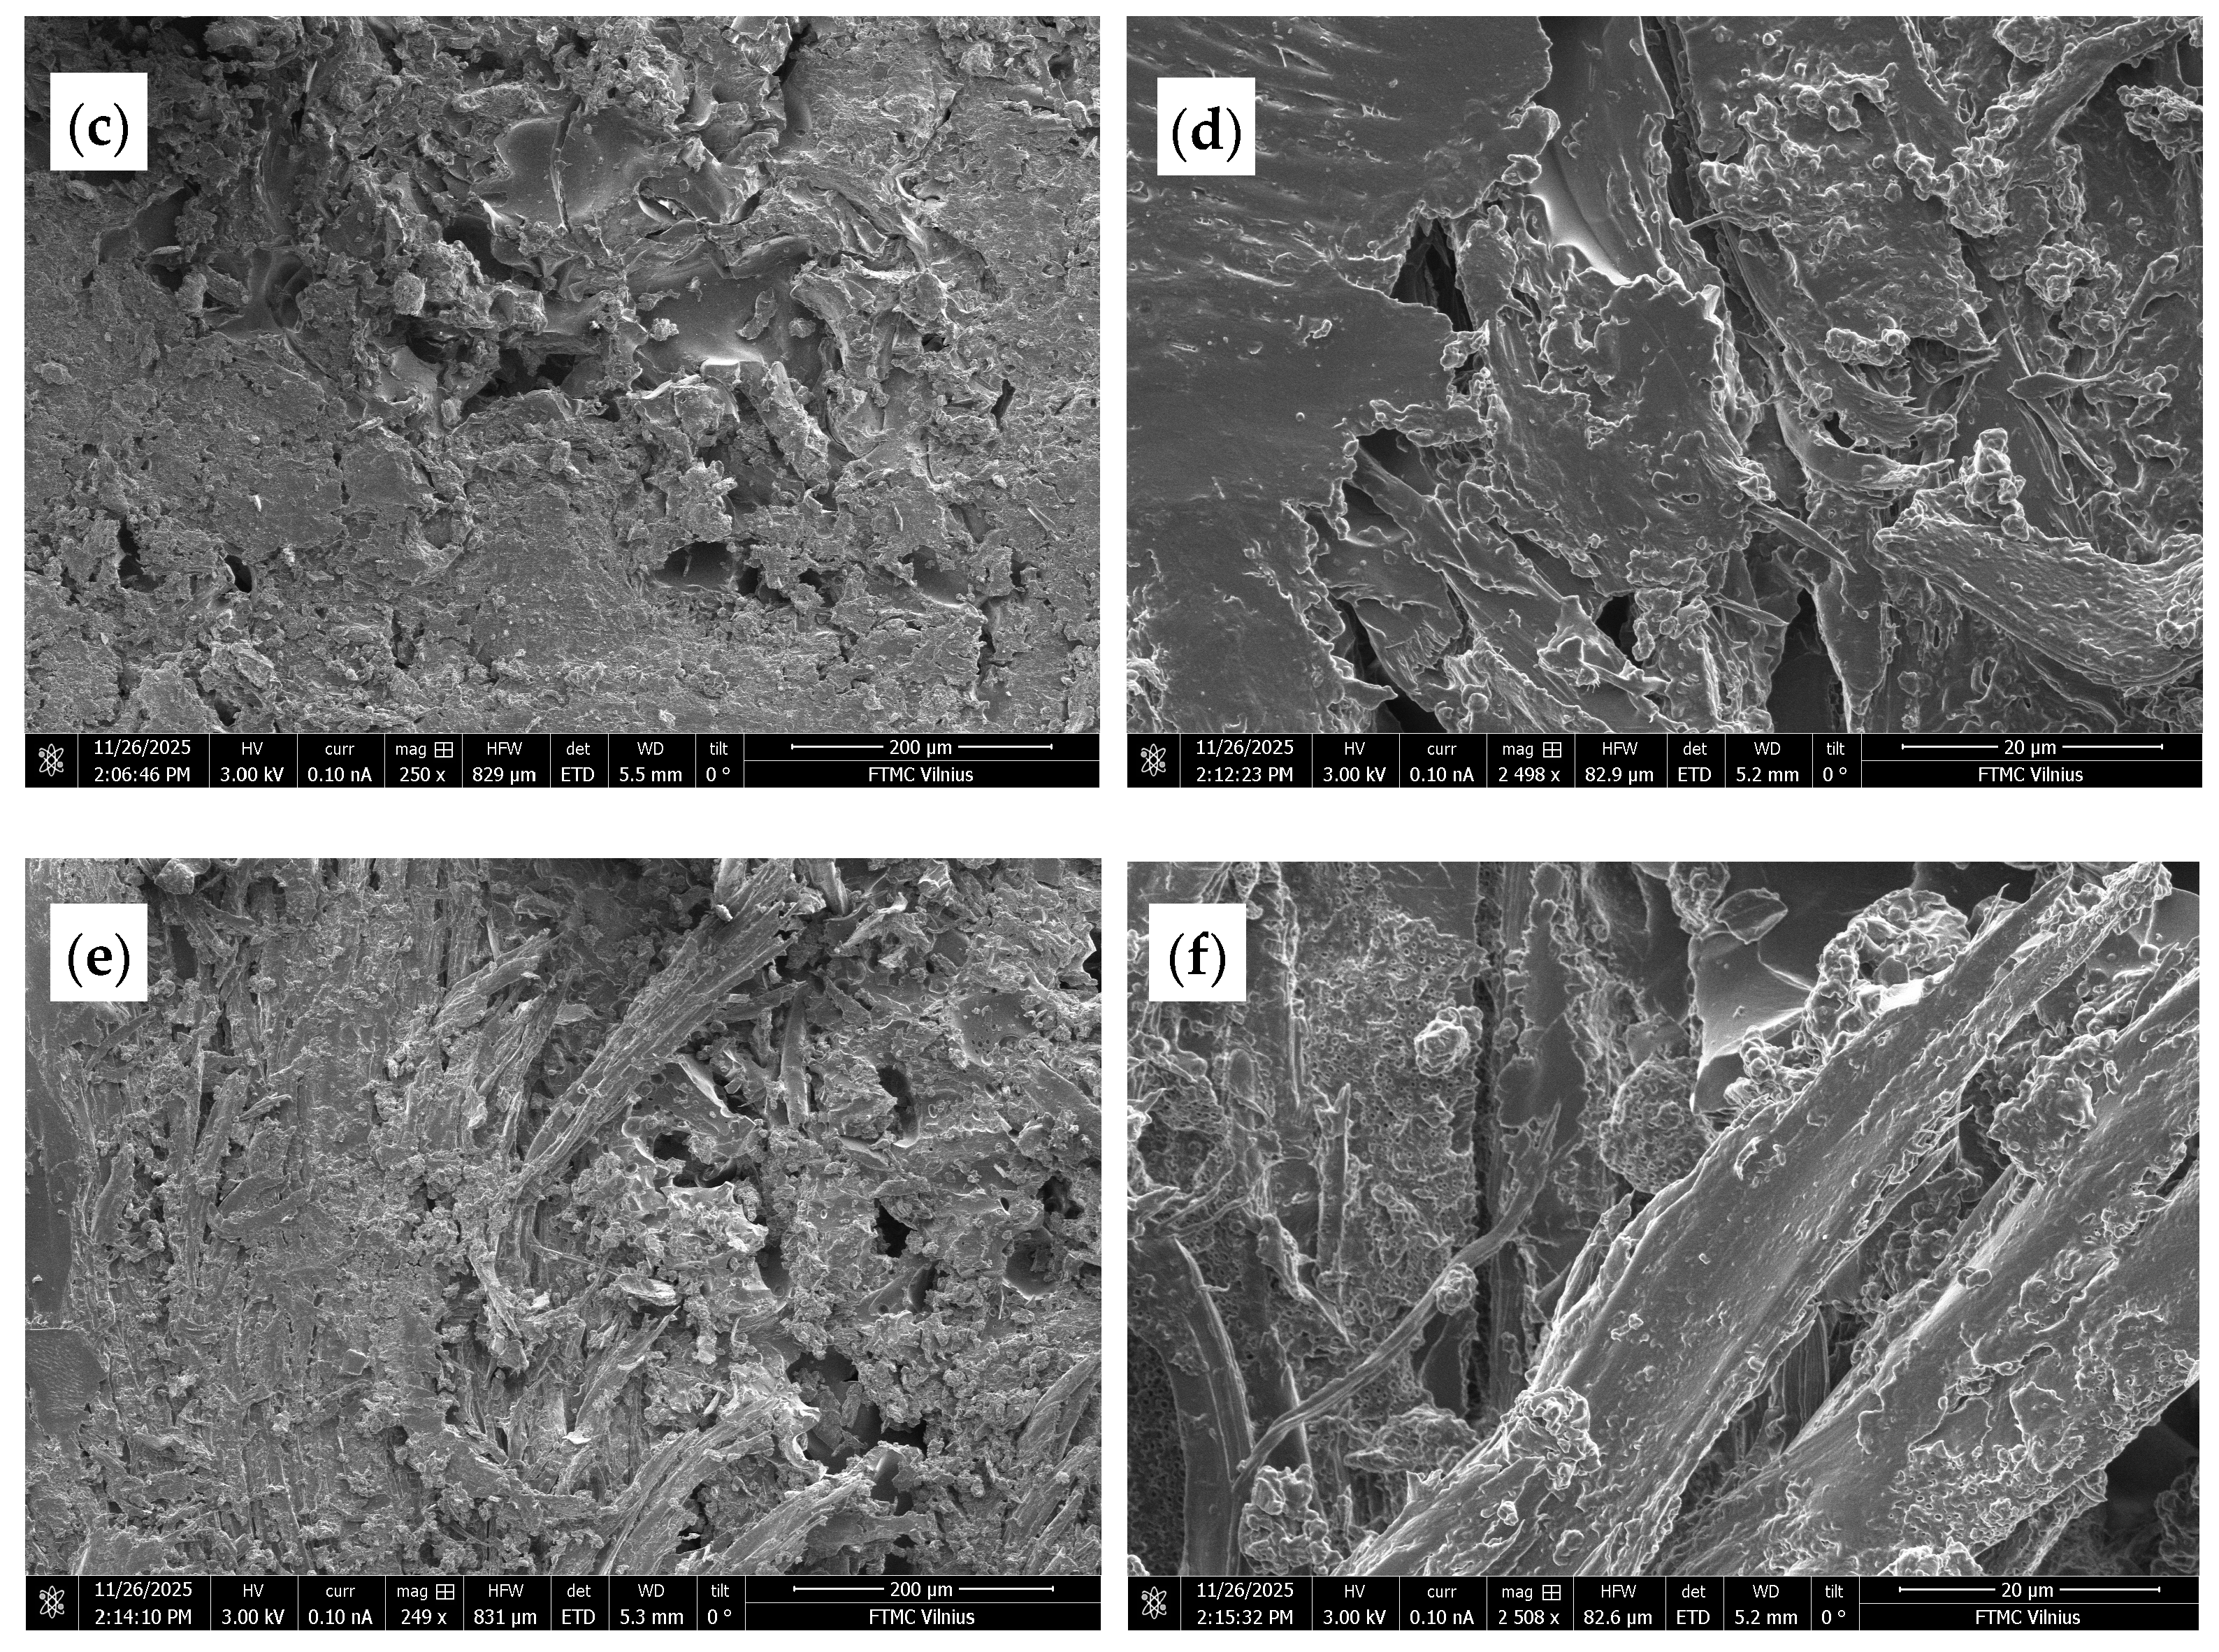
Formation of the microstructure of engineered wood prepared with biopolyurethane when the mixture pressure level is: (a) 1.5 MPa, ×250; (b) 1.5 MPa, ×2500; (c) 2.5 MPa, ×250; (d) 2.5 MPa, ×2500; (e) 3.5 MPa, ×250; (f) 3.5 MPa, ×2500.
Figure 9c,d show the microstructure of engineered wood under a mixture pressure of 2.5 MPa. Small voids are observed in the structure, but there are many such voids throughout the sample. Figure 9e,f show a relatively uniform, dense surface. Only single voids occur in the sample; their shape and location indicate that they are formed due to the deformation of wood particles under the pressure of the mixture.
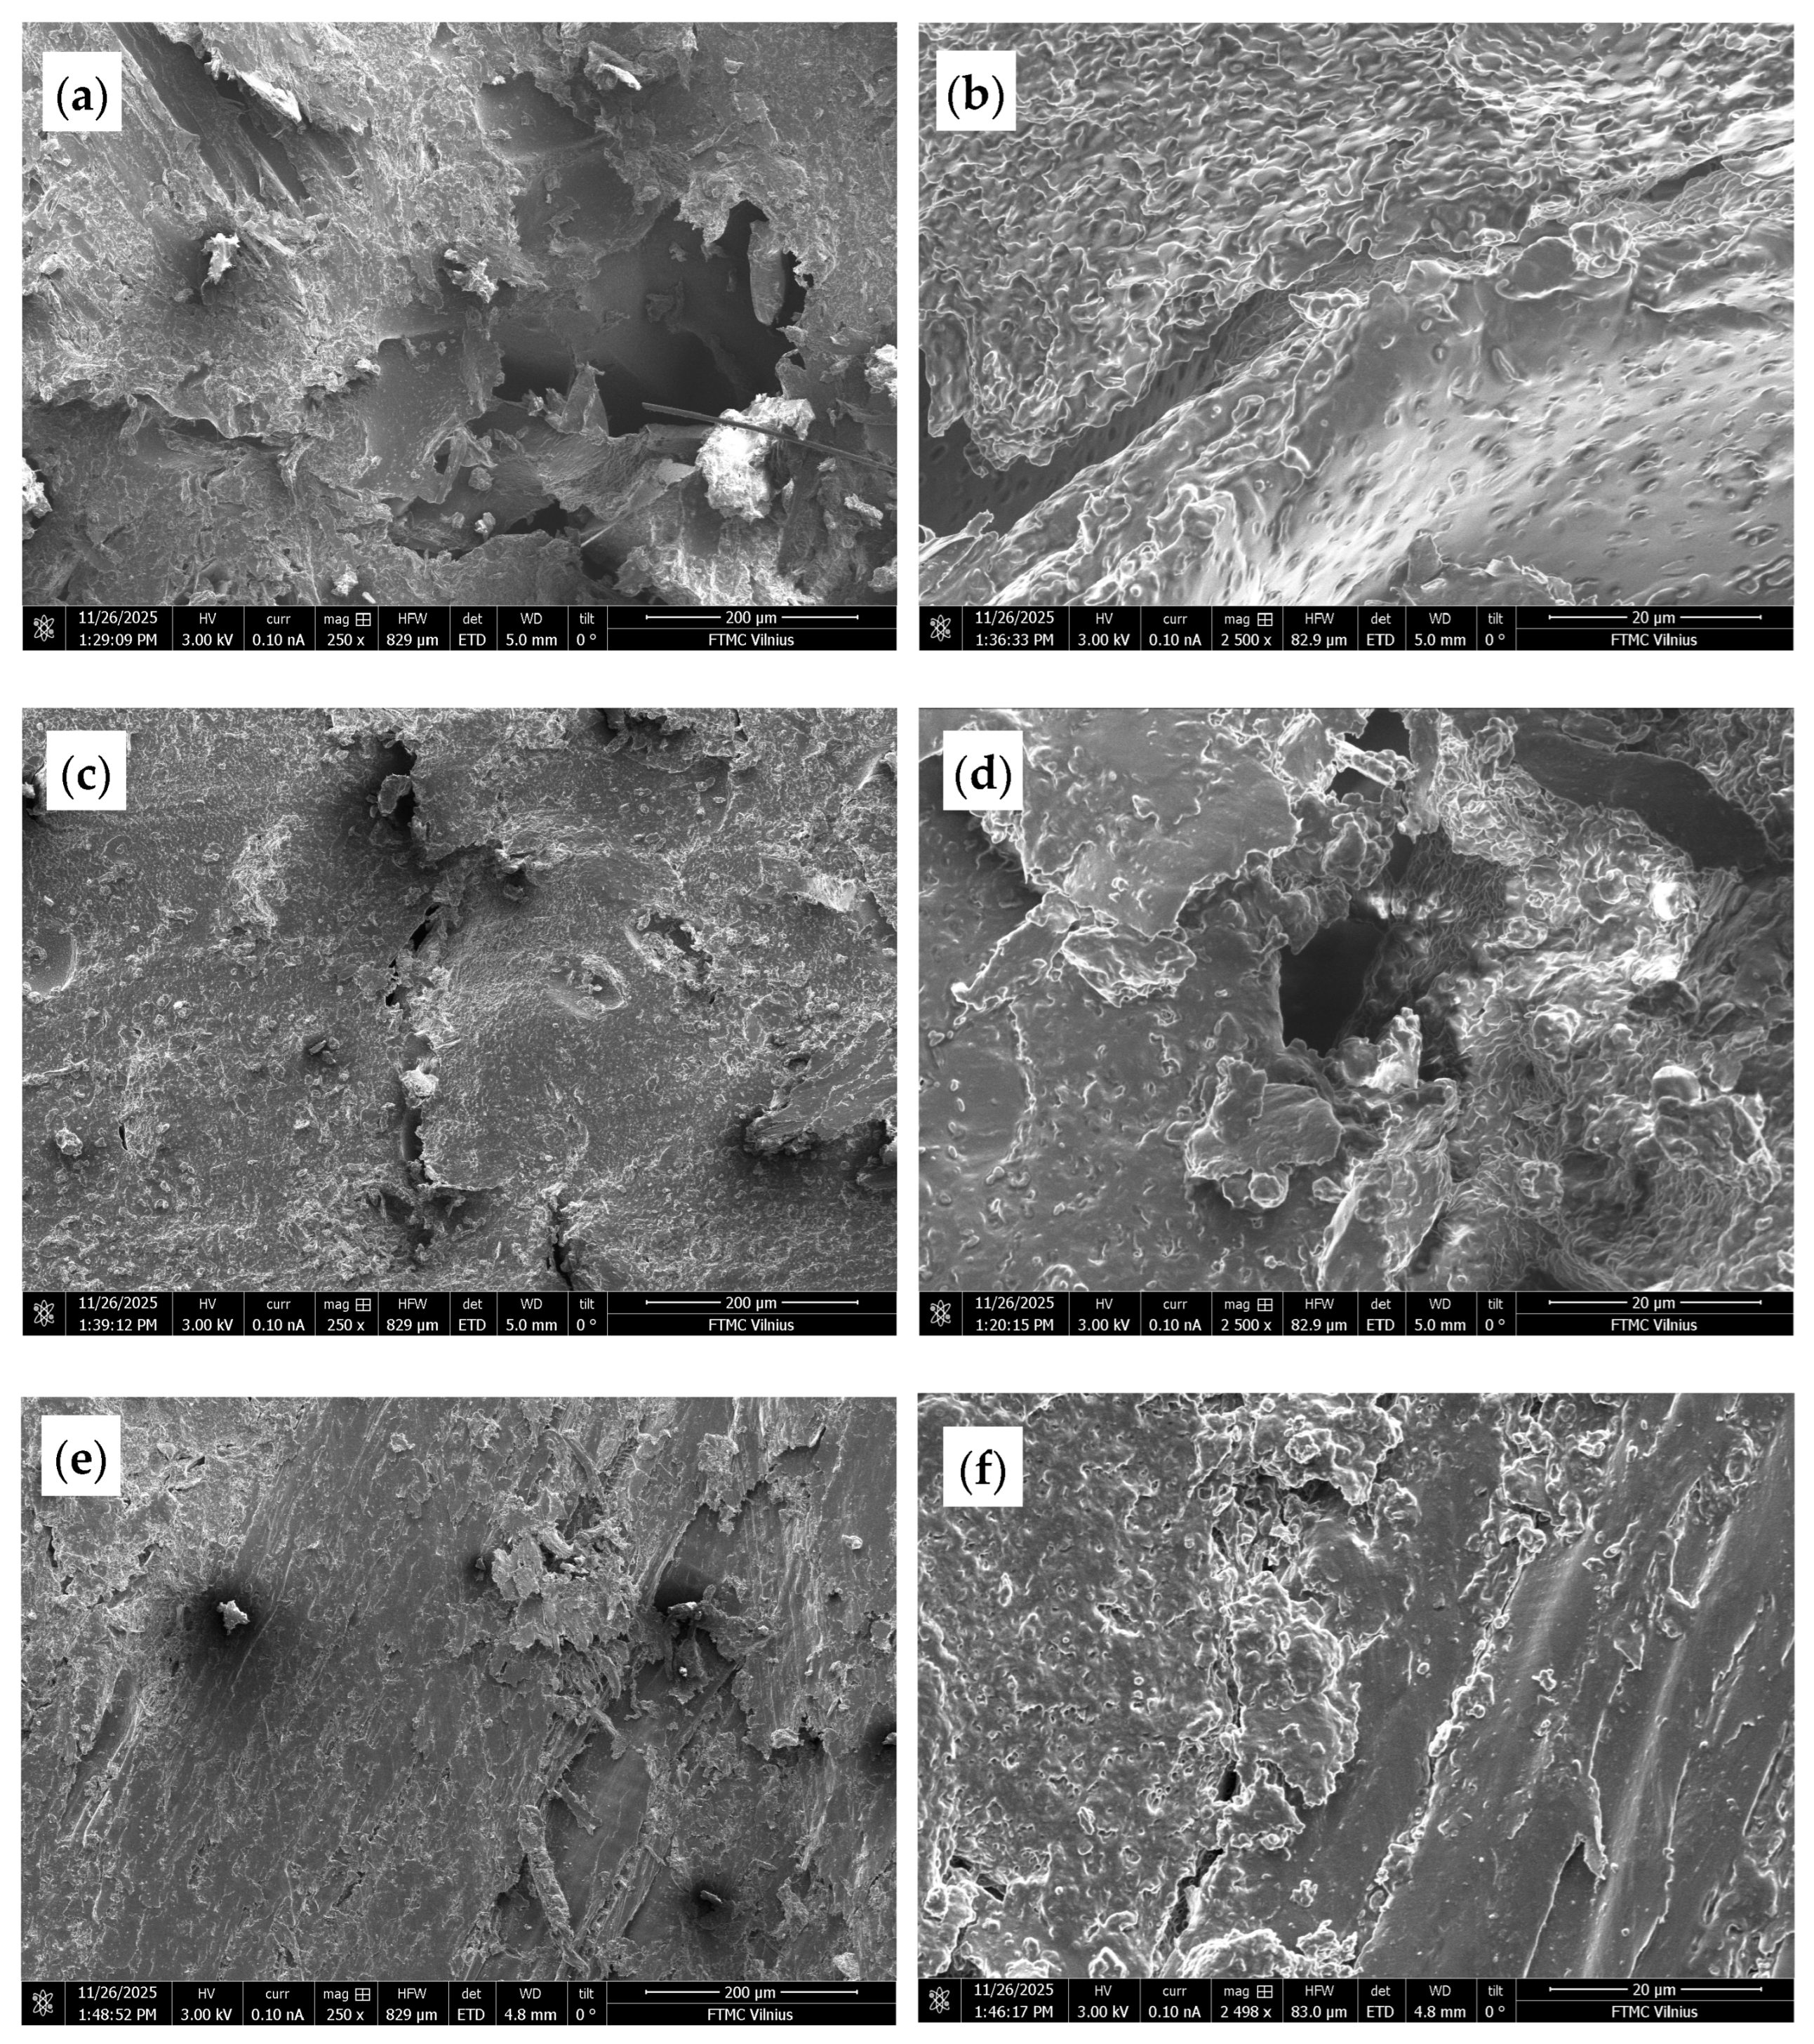
A very similar view is shown in Figure 10, where the samples were fabricated using polyurethane. Here, greater attention should be paid to Figure 10b,d,f, where the distribution of the binder on the wood particles is clearly visible.
Figure 10.
Formation of the microstructure of engineered wood prepared with polyurethane when the mixture pressure level is: (a) 1.5 MPa, ×250; (b) 1.5 MPa, ×2500; (c) 2.5 MPa, ×250; (d) 2.5 MPa, ×2500; (e) 3.5 MPa, ×250; (f) 3.5 MPa, ×2500.
All the figures above show that polyurethane adheres very well to wood particles, as if it were a single material. It can be assumed that the polyurethane composition is better suited to producing products with stronger mechanical properties.
4. Discussion
The potential for using engineered wood products is increasing, as their properties are continually improved and the range of products expands. Great attention is also paid to the use of more environmentally friendly binders. In our work, binders based on bio-polyurethane and polyurethane were selected. In the case of bio-polyurethane, up to 65% of the petroleum-based components were replaced with natural-oil-based materials, whereas in polyurethane, petroleum-based components were replaced by only 28%. Studies have shown that the use of natural raw materials in binder production has both advantages and disadvantages. Compressive strength with polyurethane is up to 20% higher because better contact zones form between the binder and wood particles. The choice of binder does not affect the growth of strength over time. Meanwhile, absorption and swelling are up to 25% lower when using bio-polyurethane. The density of engineered wood is not significantly dependent on the selected binder. In the works of other authors, it is noted that petroleum-based polyurethane has a high hydroxyl content, resulting in strong mechanical properties [59,60]. However, there are cases in which natural oil-based polyurethane exhibits mechanical properties comparable to or superior to those of conventional polyurethane. For instance, polyurethane made with soy-based polyols showed a 512% increase in compressive strength compared to petroleum-based polyurethanes [61]. Such differences may be influenced by the nature of the aggregate, its processing method, and the components of the binder itself. Researchers [62] studied the absorption and swelling of composites with bio-polyurethane. They found that the absorption and swelling of samples prepared with classical polyurethane were lower. Their studies showed that greater amounts of bio-polyurethane reduce the absorption and swelling of composites. The hydrophobic agent used in our work did not show a significant effect on the absorption and swelling of the samples, although in previous studies [63,64] significant improvements in these properties were observed. Also, the analysis of the sample structure confirmed that a hydrophobic agent layer forms on the wood particles. This shows that research in this area needs to continue, and that the reasons and processes underlying the formation of a water barrier need to be clarified.
Apart from relatively small differences in performance, bio-polyurethanes with a large amount of natural raw materials have great potential to replace environmentally unfriendly petroleum-based polyurethanes.
5. Conclusions
- The compressive strength of engineered wood is related to various technological parameters. The results of the studies showed that the rational selection of the initial mixture pressure can increase compressive strength by more than twofold; up to 12.5% of the compressive strength can be adjusted by selecting the binder composition, and up to 14.5% of the compressive strength depends on the product holding time after forming.
- The level of pressure of the initial mixture has the most significant influence on the absorption and swelling of engineered wood. With the application of pressure, the number and size of cavities decrease. Meanwhile, the use of a hydrophobic agent did not significantly reduce the absorption and swelling values.
- Microstructural analysis showed that in engineered wood, the structure densifies due to the increased pressure of the mixture. The higher the pressure, the fewer voids remain in the structure of engineered wood samples; however, excessive pressure can cause cracks due to wood-particle deformation. In addition, microstructural analysis showed that the polyurethane binder produced closer contact zones between wood particles and the binder than the biopolyurethane.
In the future, the aim will be to create the most environmentally friendly engineered wood possible; therefore, the objective will be to use biopolyurethane as efficiently as possible by improving the formation of contact zones between the filler and the binder, the aim will be to reduce the amount of binder to reduce the cost of engineered wood and to use a larger amount of wood waste.
Author Contributions
Conceptualization, A.R. and S.V. (Sigitas Vėjelis); methodology, A.R. and S.V. (Sigitas Vėjelis).; software, A.R. and S.V. (Saulius Vaitkus).; validation, A.R. and S.V. (Sigitas Vėjelis); formal analysis, S.V. (Sigitas Vėjelis) and S.V. (Saulius Vaitkus); investigation, A.R., S.V. (Sigitas Vėjelis) and S.V. (Saulius Vaitkus); resources, A.R. and S.V. (Sigitas Vėjelis); data curation, A.R. and S.V. (Sigitas Vėjelis); writing—original draft preparation, A.R. and S.V. (Sigitas Vėjelis); writing—review and editing, A.R. and S.V. (Sigitas Vėjelis); visualization, A.R. and S.V. (Sigitas Vėjelis); supervision, A.R. and S.V. (Sigitas Vėjelis). All authors have read and agreed to the published version of the manuscript.
Funding
This research received no external funding.
Data Availability Statement
Data are contained within the article.
Conflicts of Interest
The authors declare no conflicts of interest.
References
- Berger, F.; Gauvin, F.; Brouwers, H.J.H. The Recycling Potential of Wood Waste into Wood-Wool/Cement Composite. Constr. Build. Mater. 2020, 260, 119786. [Google Scholar] [CrossRef] [Scilit]
- Obata, Y.; Takeuchi, K.; Soma, N.; Kanayama, K. Recycling of Wood Waste as Sustainable Industrial Resources—Design of Energy Saving Wood-Based Board for Floor Heating Systems. Energy 2006, 31, 2341–2349. [Google Scholar] [CrossRef] [Scilit]
- Bond, C.E.; Killingsworth, J.; Elliott, J.W.; Schaller, Z.; Conrad, S. Wood Waste Reduction through Volumetric Modular Building Techniques. Clean. Waste Syst. 2025, 11, 100253. [Google Scholar] [CrossRef] [Scilit]
- Abdel Kader, A.H.; Fahmy, T.Y.A.; Kamel, S. Lignocellulosic Reinforced Composites: A Snapshot of Progress. J. Wood Chem. Technol. 2025, 45, 167–195. [Google Scholar] [CrossRef] [Scilit]
- Castaldo, R.; De Falco, F.; Avolio, R.; Bossanne, E.; Cicaroni Fernandes, F.; Cocca, M.; Di Pace, E.; Errico, M.E.; Gentile, G.; Jasiński, D.; et al. Critical Factors for the Recycling of Different End-of-Life Materials: Wood Wastes, Automotive Shredded Residues; Dismantled Wind Turbine Blades. Polymers 2019, 11, 1604. [Google Scholar] [CrossRef] [Scilit]
- Leone, R.; La Scalia, G.; Saeli, M. A Critical Review on Reuse Potentials of Wood Waste for Innovative Products and Applications: Trends and Future Challenges. Sustain. Futures 2025, 10, 100869. [Google Scholar] [CrossRef] [Scilit]
- Sikhosana, T.S.; Malebo, N.J.; Mofokeng, T.G.; Motloung, M.P.; Mochane, M.J. Sawdust as a Byproduct of Wood Processing: Properties, Applications and a Reinforcing Filler in Hybrid Polymer Composites. Polymers 2025, 17, 1523. [Google Scholar] [CrossRef] [Scilit]
- Zhu, S.; Feng, H. Enhancing Circularity of Wood Waste through Deconstruction in Building Sector. J. Clean. Prod. 2024, 485, 144382. [Google Scholar] [CrossRef] [Scilit]
- Bergeron, F.C. Energy and Climate Impact Assessment of Waste Wood Recovery in Switzerland. Biomass Bioenergy 2016, 94, 245–257. [Google Scholar] [CrossRef] [Scilit]
- Sari, D.A.P.; Nasython, K.; Irawan, D.S.; Fadiilah, D. Reduction of CH4 and CO2 Emissions from Waste Generation through the Use of Refuse Derived Fuel Technology. Heliyon 2025, 11, e43104. [Google Scholar] [CrossRef] [Scilit]
- Araye, A.A.; Yusoff, M.S.; Awang, N.A.; Abd Manan, T.S.B. Evaluation of the Methane (CH4) Generation Rate Constant (k Value) of Municipal Solid Waste (MSW) in Mogadishu City, Somalia. Sustainability 2023, 15, 14531. [Google Scholar] [CrossRef] [Scilit]
- Timonen, H.; Mylläri, F.; Simonen, P.; Aurela, M.; Maasikmets, M.; Bloss, M.; Kupri, H.-L.; Vainumäe, K.; Lepistö, T.; Salo, L.; et al. Household Solid Waste Combustion with Wood Increases Particulate Trace Metal and Lung Deposited Surface Area Emissions. J. Environ. Manag. 2021, 293, 112793. [Google Scholar] [CrossRef] [Scilit]
- Souza, A.M.; Nascimento, M.F.; Almeida, D.H.; Lopes Silva, D.A.; Almeida, T.H.; Christoforo, A.L.; Lahr, F.A.R. Wood-Based Composite Made of Wood Waste and Epoxy Based Ink-Waste as Adhesive: A Cleaner Production Alternative. J. Clean. Prod. 2018, 193, 549–562. [Google Scholar] [CrossRef] [Scilit]
- Gayathri, R.; Mahboob, S.; Govindarajan, M.; Al-Ghanim, K.A.; Ahmed, Z.; Al-Mulhm, N.; Vodovnik, M.; Vijayalakshmi, S. A Review on Biological Carbon Sequestration: A Sustainable Solution for a Cleaner Air Environment, Less Pollution and Lower Health Risks. J. King Saud Univ. Sci. 2021, 33, 101282. [Google Scholar] [CrossRef] [Scilit]
- Korba, A.; Lekawska-Andrinopoulou, L.; Chatziioannou, K.; Tsimiklis, G.; Amditis, A. Wood Waste Valorization and Classification Approaches: A Systematic Review. Open Res. Eur. 2025, 5, 5. [Google Scholar] [CrossRef] [Scilit] [PubMed]
- Faraca, G.; Boldrin, A.; Astrup, T. Resource Quality of Wood Waste: The Importance of Physical and Chemical Impurities in Wood Waste for Recycling. Waste Manag. 2019, 87, 135–147. [Google Scholar] [CrossRef] [Scilit]
- Mancini, M.; Rinnan, Å. Classification of Waste Wood Categories According to the Best Reuse Using FT-NIR Spectroscopy and Chemometrics. Anal. Chim. Acta 2023, 1275. [Google Scholar] [CrossRef] [Scilit]
- Hariyani, D.; Hariyani, P.; Mishra, S.; Sharma, M.K. A Literature Review on Waste Management Treatment and Control Techniques. Sustain. Futures 2025, 9, 100728. [Google Scholar] [CrossRef] [Scilit]
- Hasan, A.R.; Solo-Gabriele, H.; Townsend, T. Online Sorting of Recovered Wood Waste by Automated XRF-Technology: Part II. Sorting Efficiencies. Waste Manag. 2011, 31, 695–704. [Google Scholar] [CrossRef] [Scilit]
- Makenji, K. Mechanical Methods for Recycling Waste Composites. In Management, Recycling and Reuse of Waste Composites; Elsevier: Amsterdam, The Netherlands, 2010; pp. 217–252. [Google Scholar] [CrossRef] [Scilit]
- Besserer, A.; Troilo, S.; Girods, P.; Rogaume, Y.; Brosse, N. Cascading Recycling of Wood Waste: A Review. Polymers 2021, 13, 11. [Google Scholar] [CrossRef] [Scilit] [PubMed]
- Atanasov, V.; Savov, V.; Kovatchev, G. Energy demand of hammer milling in medium-density fibreboard (MDF) recycling: Effect of hydrolysis time and feed volume. Wood Mater. Sci. Eng. 2025, 1–7. [Google Scholar] [CrossRef] [Scilit]
- Taiwo, A.S.; Ayre, D.S.; Khorami, M.; Rahatekar, S.S. Optimizing the Mechanical Properties of Cement Composite Boards Reinforced with Cellulose Pulp and Bamboo Fibers for Building Applications in Low-Cost Housing Estates. Materials 2024, 17, 646. [Google Scholar] [CrossRef] [Scilit]
- Grison, K.; Pistor, V.; Scienza, L.C.; Zattera, A.J. The Physical Perspective on the Solid and Molten States Associated with the Mechanical Properties of Eco-friendly HDPE/P Inus Taeda Wood-plastic Composites. J. Appl. Polym. Sci. 2016, 133, 42887. [Google Scholar] [CrossRef] [Scilit]
- Babatunde, F.O.; Omotayo, A.B.; Oluwole, O.I.; Ukoba, K. A Review on Waste-Wood Reinforced Polymer Matrix Composites for Sustainable Development. IOP Conf. Ser. Mater. Sci. Eng. 2021, 1107, 012057. [Google Scholar] [CrossRef] [Scilit]
- Koynov, D. Design Opportunities for Added Value By-Products in Woodworking Industry. Drv. Ind. 2025, 76, 79–89. [Google Scholar] [CrossRef] [Scilit]
- da Rocha Paixão, S.; Pires, T.N.N.; Almeida, R.V.F.; da Costa Ribeiro, R.J.; Ribeiro, L.C.N. Analysis of the Feasibility of Manufacturing Ceiling Panels Using Sawdust and Castor Oil Resin. Bio-Based Building Materials. In Proceedings of the ICBBM 2025, Rio de Janeiro, Brazil, 17–20 June 2025; Amziane, S., Toledo Filho, R.D., da Gloria, M.Y.R., Page, J., Eds.; Springer Nature: Cham, Switzerland, 2025; pp. 58–73. [Google Scholar]
- Gigar, F.Z.; Khennane, A.; Liow, J.-L.; Tekle, B.H.; Li, Z. Development of Wood-Geopolymer Composites for Masonry Units: Effect of Alkaline Solution Ratio and Wood Type. In Proceedings of the fib Symposium, Christchurch, New Zealand, 11–13 November 2024; pp. 860–869. Available online: https://www.scopus.com/inward/record.uri?eid=2-s2.0-85216921515&partnerID=40&md5=b43e29195d6078023820c6945062dbe7 (accessed on 10 December 2025).
- Alharishawi, S.S.C.; Abd, H.; Abas, S. Employment of Recycled Wood Waste in Lightweight Concrete Production. Arch. Civ. Eng. 2020, 66, 675–688. [Google Scholar]
- Macchi, N.; Zwicky, D. Pourable wood-cement compounds—Properties, potential and challenges of a new structural material. In Structures and Architecture: Beyond Their Limits; DA Sousa, P., Ed.; CRC Press: Boca Raton, FL, USA, 2016. [Google Scholar] [CrossRef] [Scilit]
- Danraka, M.N.; Aziz, F.N.A.A.; Jaafar, M.S.; Nasir, N.M.; Abdulrashid, S. Application of Wood Waste Ash in Concrete Making: Revisited. In Proceedings of the GCEC 2017, Kuala Lumpur, Malaysia, 25–28 June 2017; Pradhan, B., Ed.; Springer: Singapore, 2019; pp. 69–78. [Google Scholar] [CrossRef] [Scilit]
- Maier, D.; Manea, D.L.; Tămaș-Gavrea, D.-R.; Țiriac, A.; Costin, P. Comparative Analysis of Wood Waste Species on the Mechanical Performance of Sustainable Cement-Based Mortars. J. Compos. Sci. 2025, 9, 634. [Google Scholar] [CrossRef] [Scilit]
- Lima, A.J.M.D.; Iwakiri, S.; Trianoski, R. Determination of the Physical and Mechanical Properties of Wood-Cement Boards Produced with Pinus Spp and Pozzolans Waste. Maderas Cienc. Tecnol. 2020, 22, 527–536. [Google Scholar] [CrossRef] [Scilit]
- Woraphot, P.; Abideng, H.; Thaniya, K. Feasibility Study of Cement Composites with Para Wood Particle Wastes: Strength and Durability. Glob. NEST J. 2013, 13, 182–191. [Google Scholar] [CrossRef] [Scilit]
- Gholami, K.; Feng, Z.; Zhao, J.; Huang, G.; Liu, W.V. Developing Thermal Insulation Concrete with Enhanced Mechanical Strength Using Belitic Calcium Sulfoaluminate Cement and Wood Chips. Constr. Build. Mater. 2024, 447, 138146. [Google Scholar] [CrossRef] [Scilit]
- Fois, M.; Salem, T.; Manuel, R.; Ibos, L. Study of Thermal and Mechanical Properties of Cement-Based Composites Reinforced with Vegetal Sponge Wastes and Silica Fume. 28ème Congrès Français de Thermique 2020; p. 8. Available online: https://hal.science/hal-04312806v1/document (accessed on 10 December 2025).
- Mohamad, N.; Muthusamy, K.; Embong, R.; Kusbiantoro, A.; Hashim, M.H. Environmental Impact of Cement Production and Solutions: A Review. Mater. Today Proc. 2022, 48, 741–746. [Google Scholar] [CrossRef] [Scilit]
- Rimkienė, A.; Kairytė, A.; Vėjelis, S.; Kremensas, A.; Vaitkus, S.; Šeputytė-Jucikė, J. Structure Formation in Engineered Wood Using Wood Waste and Biopolyurethane. Materials 2024, 17, 4087. [Google Scholar] [CrossRef] [Scilit]
- Karthäuser, J.; Raskop, S.; Slabohm, M.; Militz, H. Modification of Plywood with Phenol–Formaldehyde Resin: Substitution of Phenol by Pyrolysis Cleavage Products of Softwood Kraft Lignin. Eur. J. Wood Wood Prod. 2024, 82, 309–319. [Google Scholar] [CrossRef] [Scilit]
- Dos Reis, S.A.; Dos Santos, D.V.; Zagui, G.S.; Paschoalato, C.F.P.R.; Neri, C.R.; Martin, M.T.; Novo, H.S.; Mazzeo, D.E.C.; Marin-Morales, M.A.; Nadal, M.; et al. Chemical Characterization and Phytotoxicity Assay of Novolac Phenolic Foam Resin from Healthcare Services: Challenging Environmental Liability. Sci. Total Environ. 2025, 966, 178717. [Google Scholar] [CrossRef] [Scilit] [PubMed]
- Mohd, N.A.; Amini, M.H.M.; Masri, M.N. Properties and Characterization of Starch as a Natural Binder: A Brief Overview. J. Trop. Resour. Sustain. Sci. (JTRSS) 2021, 4, 117–121. [Google Scholar] [CrossRef] [Scilit]
- Kulshreshtha, Y.; Schlangen, E.; Jonkers, H.M.; Vardon, P.J.; Van Paassen, L.A. CoRncrete: A Corn Starch Based Building Material. Constr. Build. Mater. 2017, 154, 411–423. [Google Scholar] [CrossRef] [Scilit]
- Ribba, L.; Garcia, N.L.; D’Accorso, N.; Goyanes, S. Disadvantages of Starch-Based Materials, Feasible Alternatives in Order to Overcome These Limitations. In Starch-Based Materials in Food Packaging; Elsevier: Amsterdam, The Netherlands, 2017; pp. 37–76. [Google Scholar] [CrossRef] [Scilit]
- Tulip, S.; Sarker, N.; Nahar, N.; Yang, M.; Monono, E. Effect of Process Parameters on the Physical and Mechanical Properties of Cornstarch-Based Construction Materials. Constr. Mater. 2023, 3, 320–336. [Google Scholar] [CrossRef] [Scilit]
- Ferrandez-García, M.T.; Ferrandez-Garcia, C.E.; Garcia-Ortuño, T.; Ferrandez-Garcia, A.; Ferrandez-Villena, M. Study of Waste Jute Fibre Panels (Corchorus capsularis L.) Agglomerated with Portland Cement and Starch. Polymers 2020, 12, 599. [Google Scholar] [CrossRef] [Scilit]
- Chiang Liew, K.; En Yee Chin, G. Mechanical Properties of 3 Ply Plywood Made from Acacia Mangium Veneers and Green Starch-Based Adhesives. MATEC Web Conf. 2016, 78, 01021. [Google Scholar] [CrossRef] [Scilit]
- Vėjelis, S.; Kairytė, A.; Vaitkus, S.; Kremensas, A. The Use of Bio-Polyurethane Binder for the Development of Engineered Wood Composites. Polymers 2025, 17, 1434. [Google Scholar] [CrossRef] [Scilit]
- Kairytė, A.; Šeputytė-Jucikė, J.; Członka, S.; Vėjelis, S.; Vaitkus, S. Impact of Different Ratios of Lignin Waste and Liquid Glass on the Performance Characteristics of Biopolyurethane Foams. Polymers 2023, 15, 818. [Google Scholar] [CrossRef] [Scilit] [PubMed]
- Ämmälä, A.; Piltonen, P. Sphagnum Moss as a Functional Reinforcement Agent in Castor Oil-Based Biopolyurethane Composites. Mires Peat 2019, 24, 28. [Google Scholar] [CrossRef] [Scilit]
- Kairytė, A. Research of Biopolyurethane Foam Modified with Paper Production Waste. Doctoral Dissertation, Vilnius Gediminas Technical University, Vilnius, Lithuania, 2017. [Google Scholar] [CrossRef] [Scilit]
- Guo, J.; Chai, T.; Liu, Y.; Cui, J.; Ma, H.; Jing, S.; Zhong, L.; Qin, S.; Wang, G.; Ren, X. Kinetic Research on the Curing Reaction of Hydroxyl-Terminated Polybutadiene Based Polyurethane Binder System via FT-IR Measurements. Coatings 2018, 8, 175. [Google Scholar] [CrossRef] [Scilit]
- Li, T.; Xu, J.; An, M.; Wang, T.; Ma, Y.; Luo, Y. Curing Kinetics of Block Copolymerization Thermoset Polyurethane by Non-isothermal DSC Method. J. Appl. Polym. Sci. 2025, 142, e56374. [Google Scholar] [CrossRef] [Scilit]
- Kanchanapiya, P.; Intaranon, N.; Tantisattayakul, T. Assessment of the Economic Recycling Potential of a Glycolysis Treatment of Rigid Polyurethane Foam Waste: A Case Study from Thailand. J. Environ. Manag. 2021, 280, 111638. [Google Scholar] [CrossRef] [Scilit] [PubMed]
- ISO 12570; Hygrothermal Performance of Building Materials and Products—Determination of Moisture Content by Drying at Elevated Temperature. International Organization for Standardization: Geneva, Switzerland, 2024.
- ISO 29470; Thermal Insulating Products for Building Applications—Determination of the Apparent Density. International Organization for Standardization: Geneva, Switzerland, 2020.
- ISO 29469; Thermal Insulating Products for Building Applications—Determination of Compression Behaviour. International Organization for Standardization: Geneva, Switzerland, 2022.
- EN 317; Particleboards and Fibreboards—Determination of Swelling in Thickness After Immersion in Water. European Committee for Standardization: Brussels, Belgium, 1993.
- ISO 29767; Thermal Insulating Products for Building Applications—Determination of Short-Term Water Absorption by Partial Immersion. International Organization for Standardization: Geneva, Switzerland, 2019.
- Falope, F.Y.; Osamudiamen, P.M.; Obanla, O.R.; Illesami, N.Y.; Adeoye, A.P. Preparation and Characterisation of Rigid Polyurethane Foam from Terminalia catappa (Tropical Almond) seed oil-based polyol. In Proceedings of the 2024 International Conference on Science, Engineering and Business for Driving Sustainable Development Goals (SEB4SDG), Omu-Aran, Nigeria, 2–4 April 2024; pp. 1–5. [Google Scholar] [CrossRef] [Scilit]
- Li, Z.; Chen, K.; Wang, M. Green Materials for the Synthesis of Polyurethanes. In Materials and Chemistry of Flame-Retardant Polyurethanes Volume 1: A Fundamental Approach; Oxford University Press Inc.: New York, NY, USA, 2021; Volume 1399, pp. 37–58. [Google Scholar] [CrossRef] [Scilit]
- Gurjot, S.D.; Sudharshan, A.; Chandrashekhara, K.; Lees, J.; Nam, P. Development and characterization of polyurethane foams with substitution of polyether polyol with soy-based polyol. Eur. Polym. J. 2018, 107, 105–117. [Google Scholar] [CrossRef] [Scilit]
- Protzek, G.R.; Magalhães, E.; Berti, W.L.; Azevedo, L.F. On Mechanical Behavior of Pine Nut Shell and Polyurethane Derived from Castor Oil Green Composite. J. Nat. Fibers 2020, 19, 7454–7469. [Google Scholar] [CrossRef] [Scilit]
- Aglinskaitė, U.K.; Vėjelis, S. Development and Research of Engineered Wood Composite from Organic Waste. Available online: https://lmt.lrv.lt/public/canonical/1759480850/6371/Mokslo%20vasara%202025%20leidinys%20A4_WEB%20(3).pdf (accessed on 12 December 2025).
- Vėjelis, S.; Vaitkus, S.; Skulskis, V.; Kremensas, A.; Kairytė, A. Performance Evaluation of Thermal Insulation Materials from Sheep’s Wool and Hemp Fibres. Materials 2024, 17, 3339. [Google Scholar] [CrossRef] [Scilit]



Disclaimer/Publisher’s Note: The statements, opinions and data contained in all publications are solely those of the individual author(s) and contributor(s) and not of MDPI and/or the editor(s). MDPI and/or the editor(s) disclaim responsibility for any injury to people or property resulting from any ideas, methods, instructions or products referred to in the content. |
© 2026 by the authors. Licensee MDPI, Basel, Switzerland. This article is an open access article distributed under the terms and conditions of the Creative Commons Attribution (CC BY) license.