


Abstract
The balance between gross primary productivity (GPP) and ecosystem respiration (ER) defines an ecosystem’s carbon sink-source status. Under global warming, hydrothermal conditions critically shape carbon fluxes, yet their differential impacts on GPP and ER remain insufficiently understood, especially across biomes. Elucidating these differences is essential for reducing uncertainties in terrestrial carbon cycle projections under ongoing climate change. Here, based on flux observations from global terrestrial sites with a focus on forest ecosystems, we selected mean annual temperature (MAT), latent heat flux (LH), vapor pressure deficit (VPD), soil water content (SWC), and annual precipitation as representative indicators of hydrothermal conditions, and employed mixed-effects models to examine how these key environmental drivers influence GPP and ER. After analyzing the fixed effects, LH and MAT promoted GPP more strongly than ER (slope = 0.5 > 0.253, slope = 0.595 > 0.392, respectively), whereas VPD suppressed GPP more than ER (slope = −0.658 < −0.499), yet accounted for a greater proportion of variance in ER than in GPP (R2 = 0.14 > 0.07). Although SWC had a significant (p < 0.001) positive effect on GPP, the effect size was minimal, and its impact on ER was insignificant. R2 decomposition showed that marginal R2 values were similar for the GPP and ER models (0.43 and 0.44), whereas the GPP model exhibited a substantially higher conditional R2 (0.82 vs. 0.63), indicating that MAT exerted a stronger influence on GPP than on ER across ecosystem types. The combined analysis of fixed and random effects indicated that MAT affected GPP more variably than ER across ecosystem types, with the strongest responses in mixed forests and savannas, intermediate responses in evergreen needleleaf forests, and the weakest responses in evergreen broadleaf forests. Overall, this study advances our understanding of how environmental factors differently influence GPP and ER, and incorporating these differences can improve predictions of forest carbon fluxes and climate-carbon feedbacks.
1. Introduction
Although gross primary productivity (GPP) and ecosystem respiration (ER) are both key components of the carbon balance within ecosystems, they reflect distinct physiological processes [1,2,3]. GPP represents the total carbon fixed by photosynthesis, serving as the primary pathway for carbon entering ecosystems, whereas ER quantifies carbon released to the atmosphere through autotrophic (plants) and heterotrophic (microbes and animals) respiration [3,4]. Together, these two processes determine the net ecosystem exchange (NEE) of carbon between ecosystems and the atmosphere [4,5]. The balance between GPP and ER determines whether an ecosystem acts as a carbon sink or source, and is regulated by environmental drivers such as temperature, water, and nutrients [6,7,8,9].
In terrestrial ecosystems, temperature and water availability are generally considered the two primary environmental factors driving variations in GPP and ER [10,11]. Warming can enhance GPP by accelerating enzymatic reactions in photosynthesis [12,13], while simultaneously increasing ER through both enhanced plant respiration (Rp) and elevated microbial activity [10,14,15]. Owing to the differential temperature sensitivities of GPP and ER, the net impact of warming on ecosystem carbon balance remains uncertain and debated. Some remote sensing studies indicated that warming enhanced regional and even global greening, thereby increasing vegetation productivity [7,16,17]. In contrast, other research showed that ER responded more sensitively to warming, potentially tipping the balance such that respiration exceeded carbon uptake [18,19]. Meanwhile, shifts in water availability under warming weave additional intricacy into the way hydrothermal conditions shape ecosystem carbon fluxes [20,21]. Zeng et al. (2022) reported that the sensitivity of vegetation productivity to precipitation declined between 2001 and 2018 [22], whereas Zhang et al. (2025) observed a reversal from 2001 to 2021, with sensitivity initially decreasing and then increasing, with both studies highlighting the pivotal role of VPD in modulating this response [23]. In contrast, the sensitivity of ER to precipitation varies markedly among different biomes, and within the same biome, GPP and ER also exhibit distinct sensitivities to precipitation [24,25]. Zhang et al. (2024) further revealed that water limitation constrains the positive feedback of ER to warming [26]. An experimental study in semi-arid grasslands indicated that drought suppressed GPP more than ER, potentially transforming carbon sinks into carbon sources during stress periods [27]. Nevertheless, the contrasting roles of hydrothermal conditions in regulating GPP and ER, especially across biomes, have yet to be clearly elucidated.
Two objective constraints have delayed progress in this important line of research. First, unlike GPP, ER is not easily represented by optical vegetation indices, even though advances in remote sensing have yielded rich datasets for unraveling the spatiotemporal dynamics and underlying drivers of vegetation productivity [7,17]. Direct retrieval of ER from remote sensing is inherently constrained by its composite nature, as it comprises both autotrophic and heterotrophic respiration (Ra and Rh), and the tight physiological coupling of Ra with photosynthesis introduces substantial uncertainty [28,29]. Secondly, there remains no consensus on which environmental variables best represent hydrothermal conditions. Building on this, we leveraged flux data, the most precise and widely embraced resource for capturing ecosystem–atmosphere carbon exchanges across scales from individual sites to entire regions [30,31]. Drawing on the data characteristics, we selected mean annual temperature (MAT), latent heat flux (LH), vapor pressure deficit (VPD), soil water content (SWC), and annual precipitation (AP) as key indicators capturing the hydrothermal environment. Here, these variables are treated as integrative proxies summarizing the coupled energy-water state of ecosystems, rather than as isolated or fully independent causal drivers. In particular, LH is included to represent realized surface energy partitioning and ecosystem water demand, providing complementary information that cannot be fully captured by meteorological variables alone. Based on global eddy covariance data from the FLUXNET2015 network, this study aims to elucidate how environmental drivers regulate ecosystem carbon fluxes across different biomes. Specifically, this study has three objectives: (i) to identify the most influential environmental factors affecting GPP and ER at the global scale; (ii) to compare the overall differential impacts of environmental drivers on GPP and ER; and (iii) to investigate biome-specific differences in the responses of GPP and ER to environmental drivers across ecosystem types.
2. Materials and Methods
2.1. Data Collection
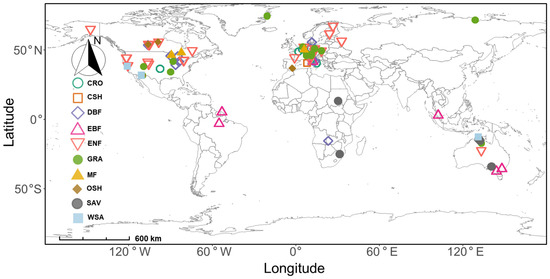
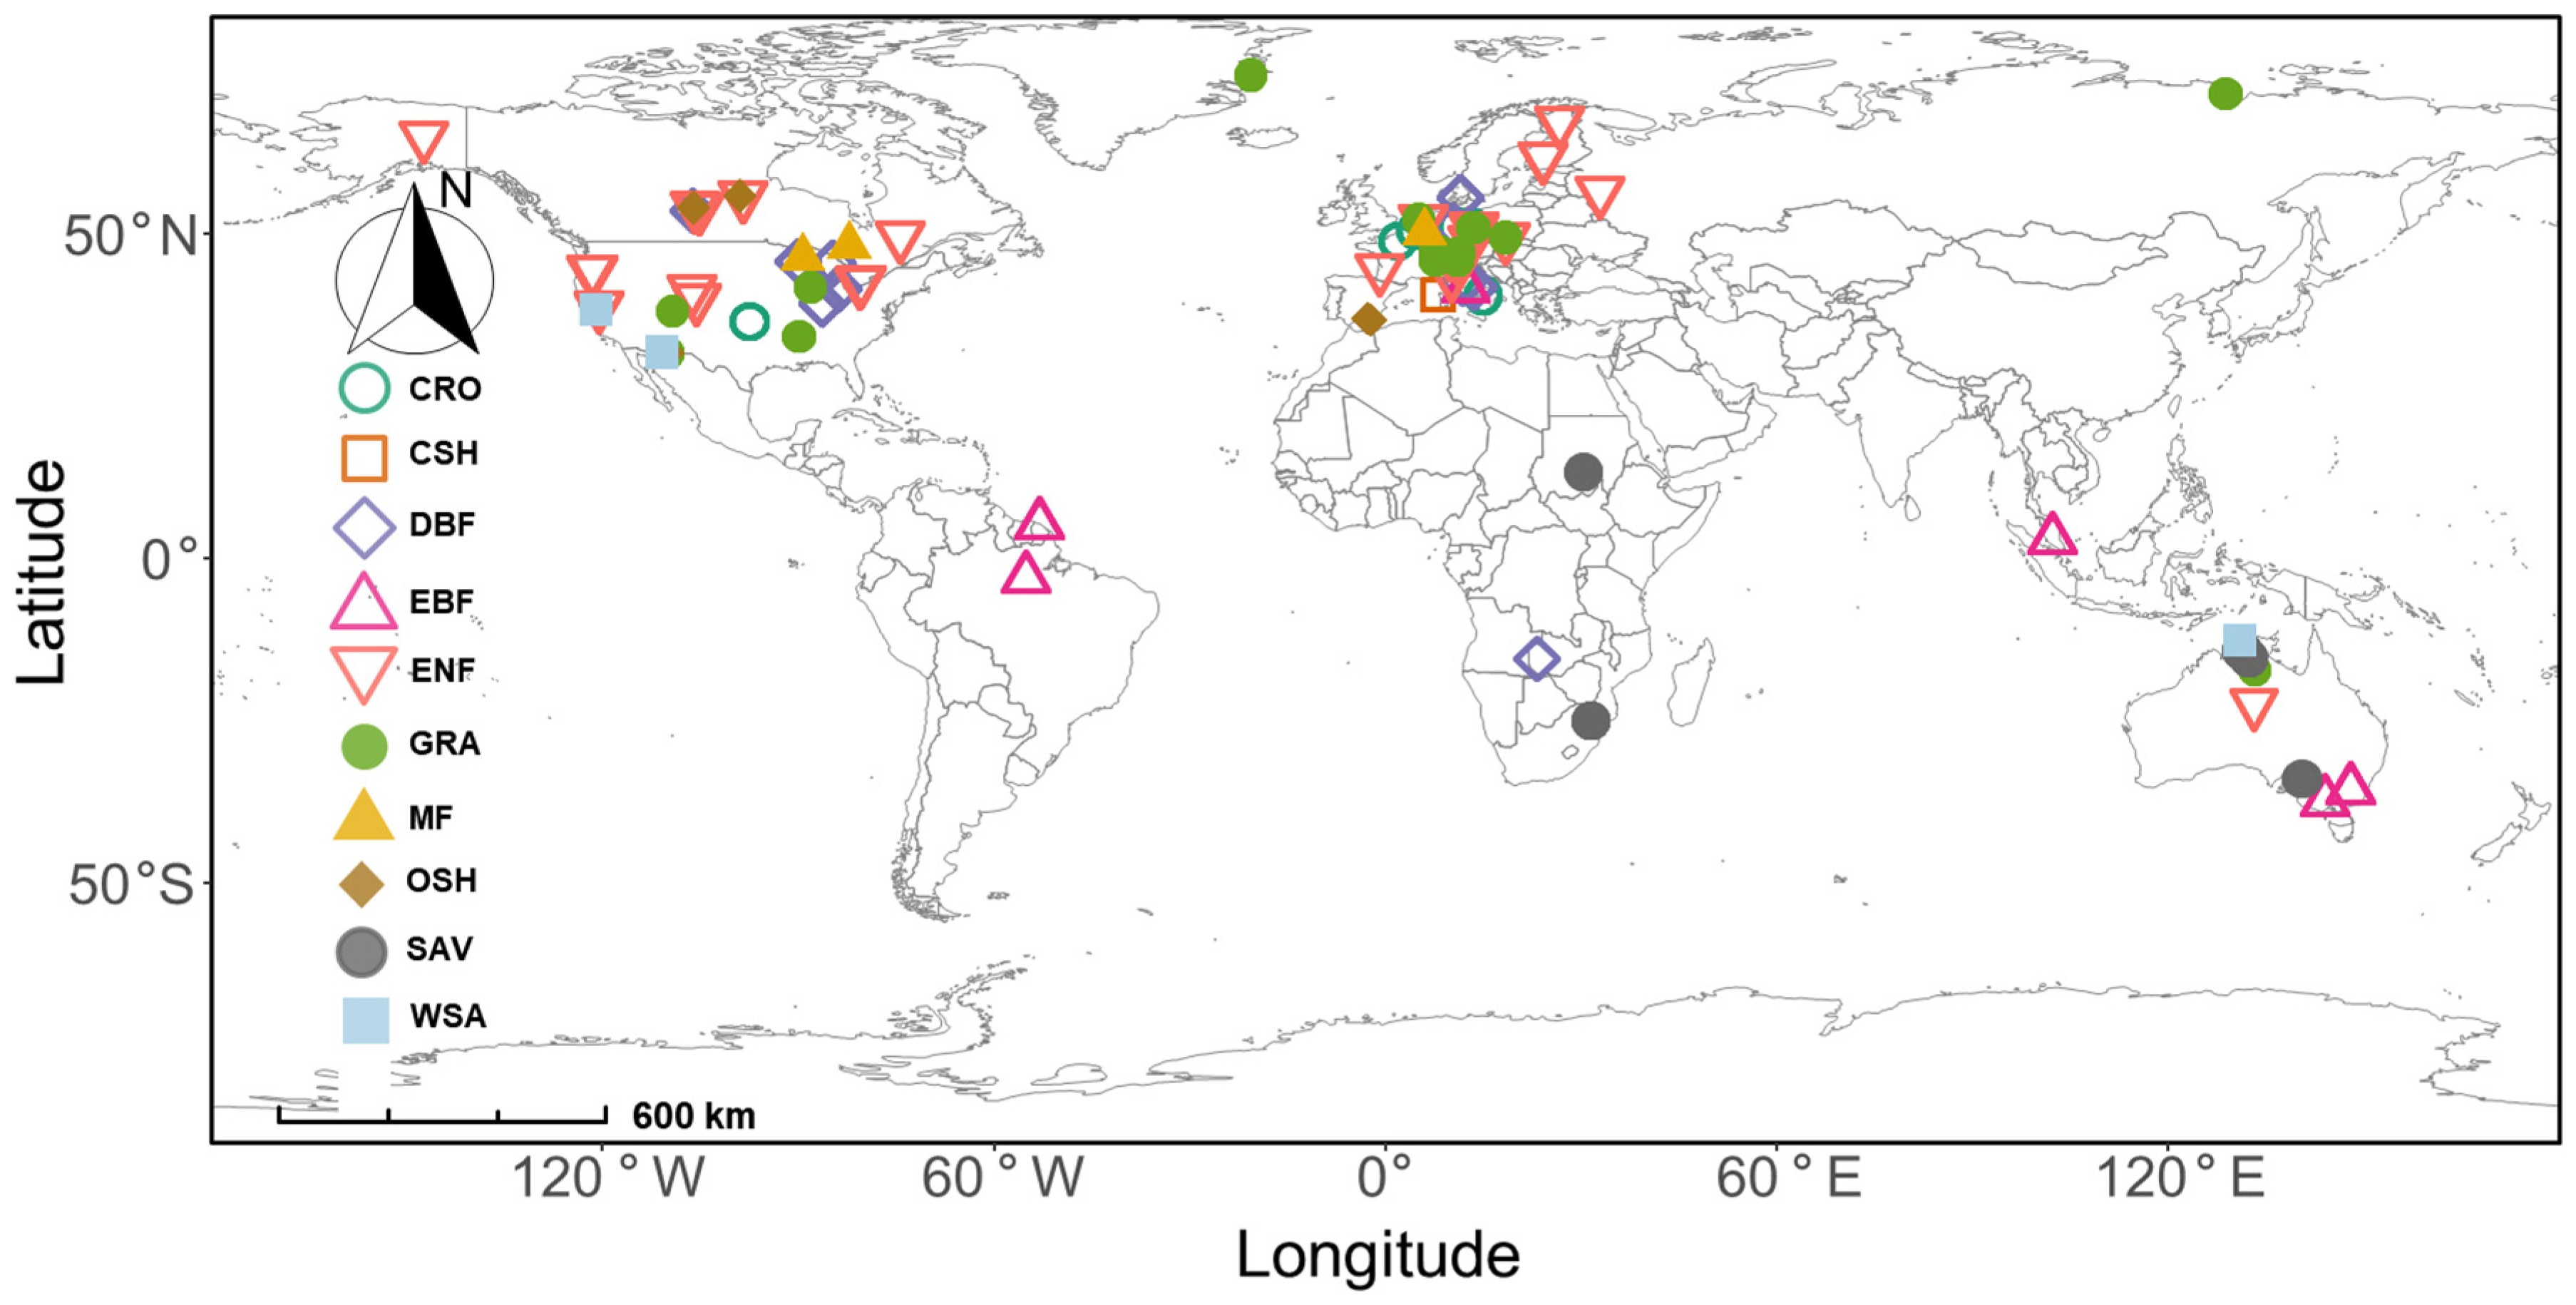
We utilized the global FLUXNET2015 eddy covariance network, which represents the most comprehensive collection of in situ ecosystem-scale carbon flux observations currently available, to obtain daily mean carbon fluxes and meteorological data (https://fluxnet.org/ (accessed on 12 April 2025)). The FLUXNET2015 dataset integrates measurements from 212 sites worldwide, spanning all major continents and climate zones, and encompassing a wide range of terrestrial ecosystem types. It provides standardized, quality-controlled, gap-filled observations of CO2, water, and energy exchanges between terrestrial ecosystems and the atmosphere, ensuring data consistency and comparability across regions [30]. In this study, we selected gross GPP and ER estimates derived from the daytime partitioning method to reduce autocorrelation in CO2 fluxes. A data-cleaning procedure was applied to ensure data quality and analytical robustness. Specifically, sites with more than 30% missing data were excluded, and ecosystem types with insufficient site representation were removed. For the retained sites, the datasets were largely complete, with only infrequent short gaps filled via linear interpolation between adjacent valid points. The final dataset comprised 95 globally distributed sites across 10 ecosystem types, totaling 885 site-years of observations (Figure 1), providing a global basis for assessing ecosystem-specific and cross-biome responses of carbon fluxes to environmental drivers. Precipitation was calculated as annual sums, while other environmental variables (MAT, LH, VPD, and SWC) were computed as annual means to represent their prevailing regulatory effects on ecosystem carbon processes. Each site-year was treated as an independent sample to analyze the differential impacts of environmental factors on GPP and ER. Major terms and their acronyms appear in Table A1 and Table A2.
Figure 1.
Global distribution of study sites and ecosystem types, classified by International Geosphere-Biosphere Programme ecosystem type: cropland (CRO), closed shrubland (CSH), deciduous broadleaf forest (DBF), evergreen broadleaf forest (EBF), evergreen needleleaf forest (ENF), grassland (GRA), mixed forest (MF), open shrubland (OSH), savanna (SAV), and woody savanna (WSA).
2.2. Statistical Analysis
To enhance modeling accuracy, we first standardized preprocessed flux data using z-score normalization. Generalized linear mixed-effects models were subsequently fitted, with GPP and ER as response variables, to evaluate the influence of environmental factors, using the ‘lmer’ function from the package ‘lme4’ (version 1.1-35.1) in R version 4.5.0 [32]. Given our research objective of comparing broad-scale differences in environmental controls across ecosystem types, IGBP was specified as a random intercept to account for systematic baseline differences among major ecosystem types, rather than site-specific idiosyncrasies. Site-level variability is partially absorbed through aggregation at the site-year level and through the inclusion of biome-level random effects, which capture shared ecological characteristics among sites within the same ecosystem type. Random slope structures for selected environmental predictors were evaluated by comparing alternative random-effect specifications using the log-likelihood ratio test (LRT) and Akaike information criterion (AIC), where higher LRT values and lower AIC values indicated improved model performance [32,33]. The LRT compares the goodness-of-fit of nested models to select optimal random effects, and restricted maximum likelihood estimation (REML) is used for parameter optimization, ensuring accurate variance estimates and model stability [33]. The results of random-effect structure selection for the GPP and ER models are summarized in Table A3 and Table A4, respectively.
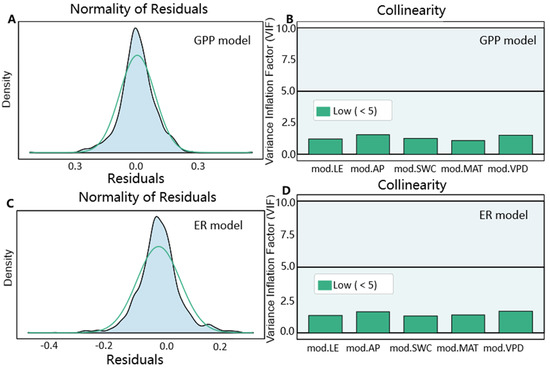
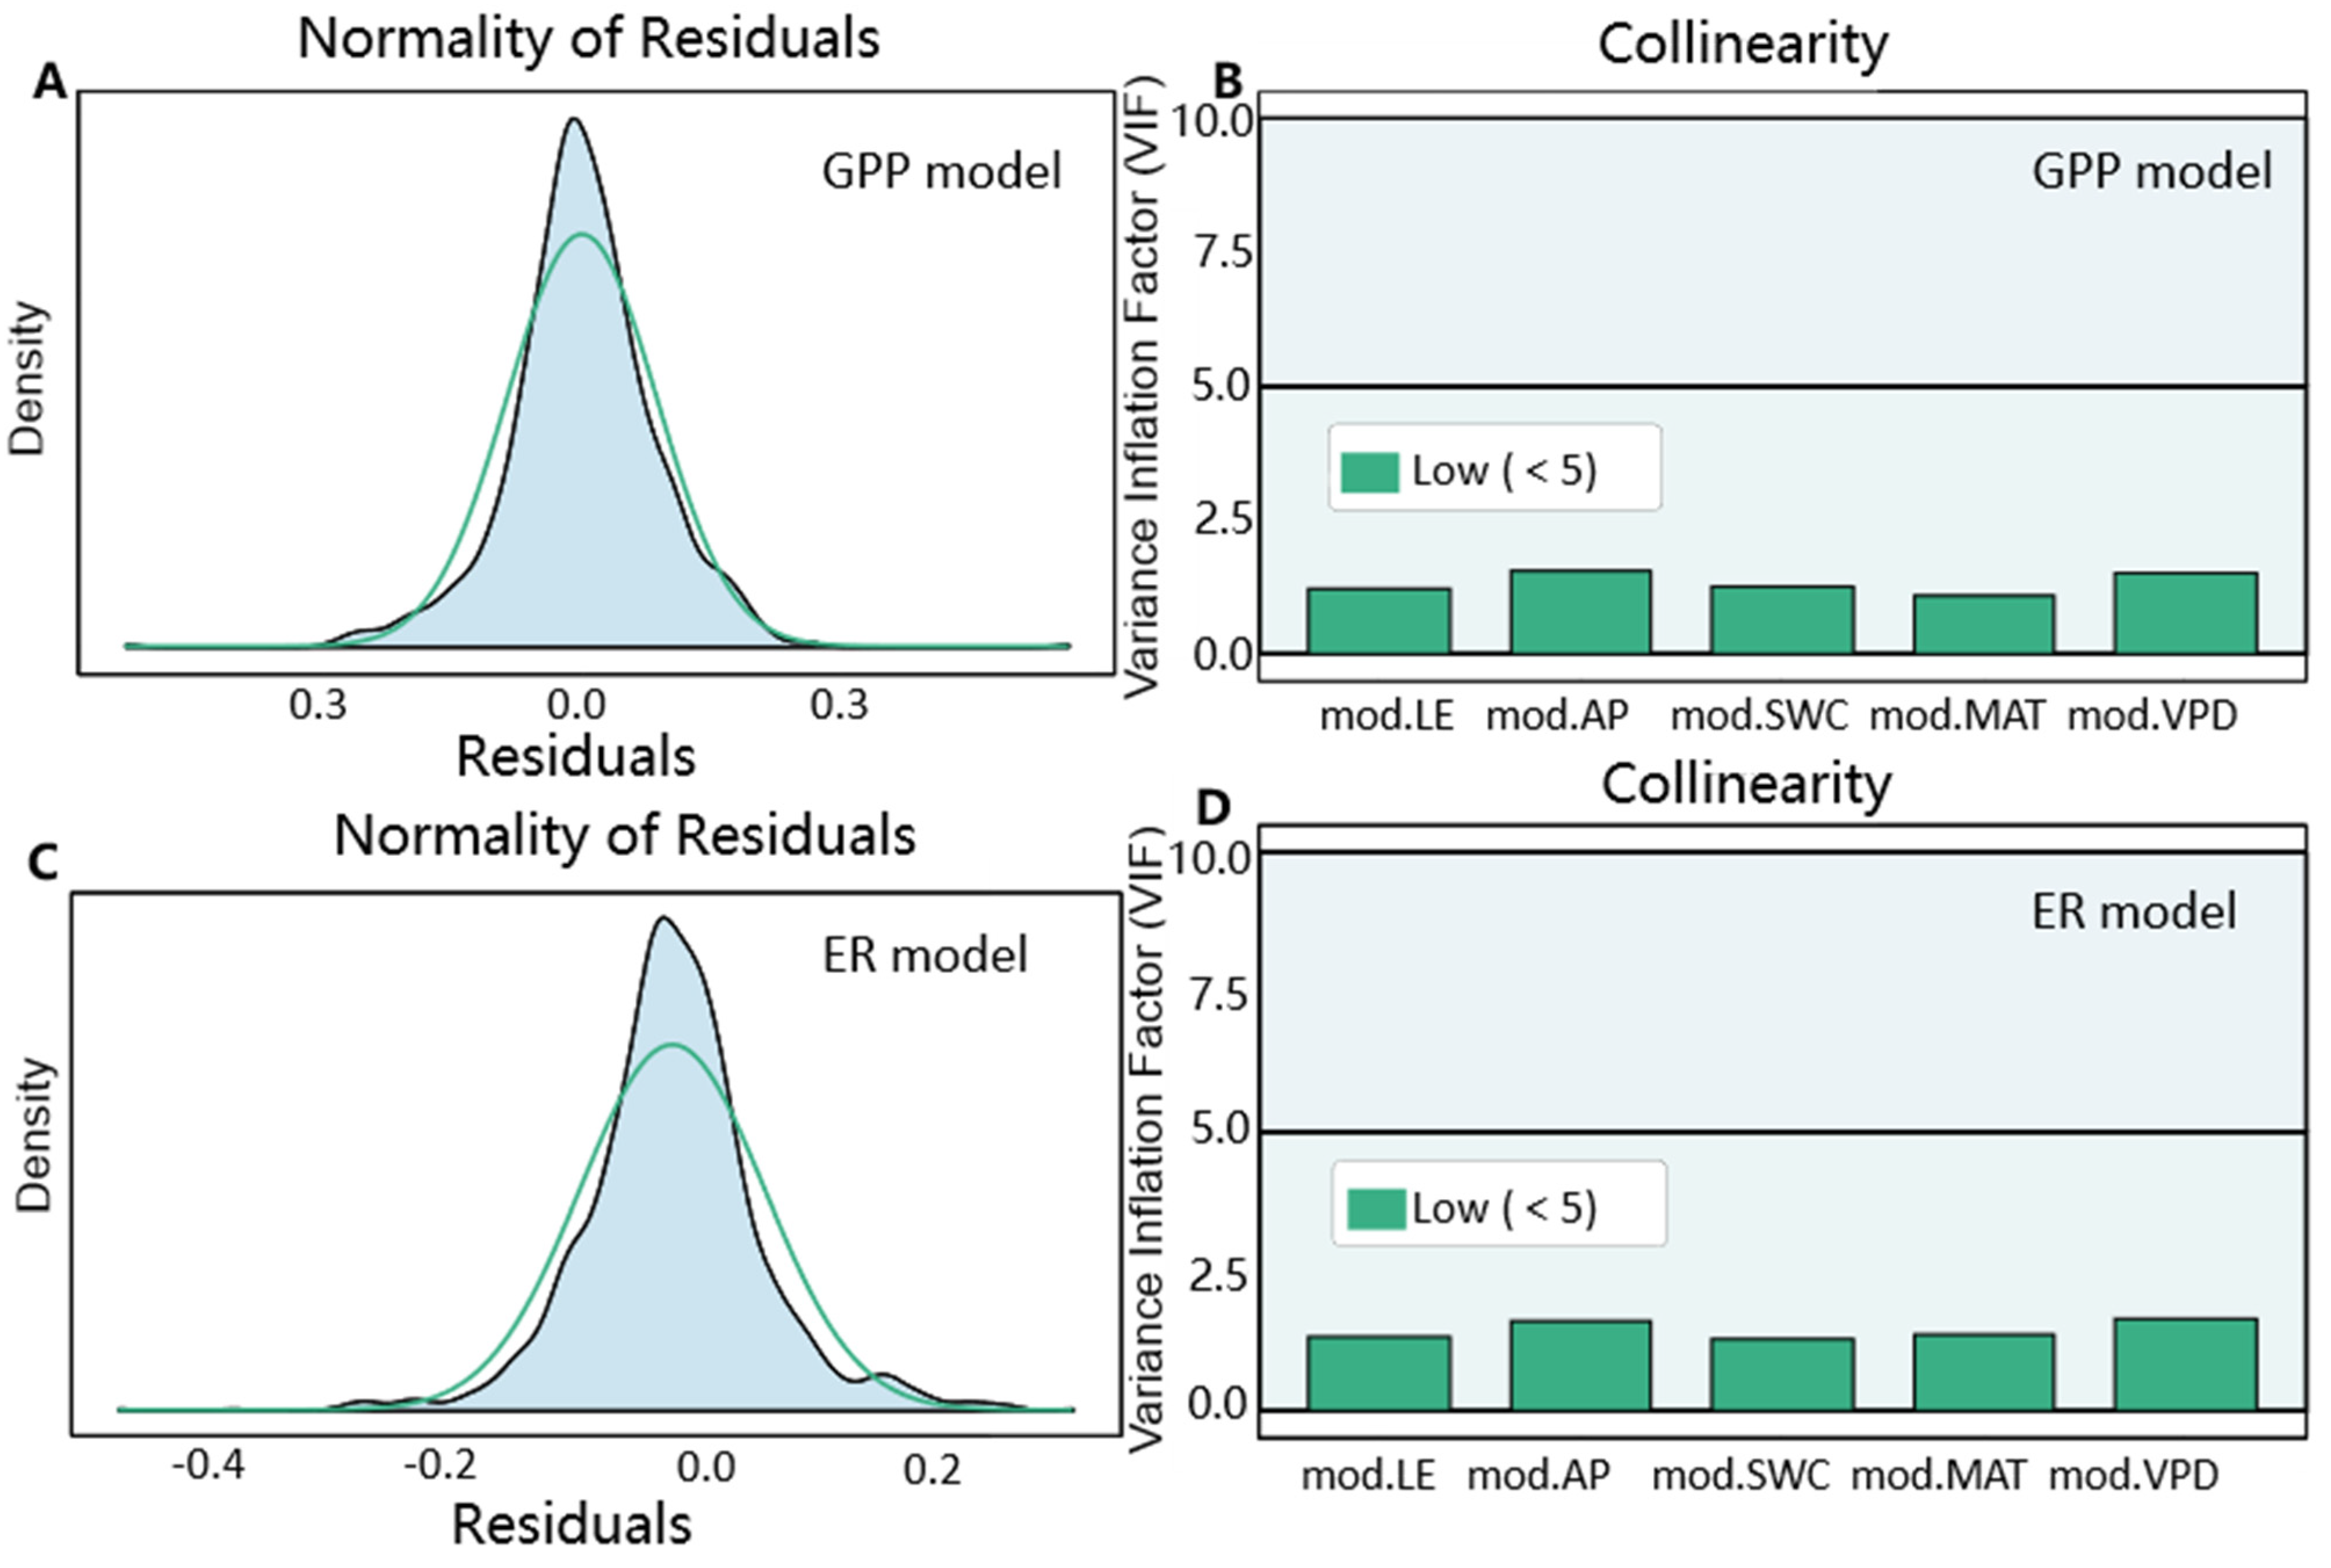
Maximum likelihood estimation (MLE) was employed to select fixed effects, refining parameter estimates through the maximization of the likelihood function [34]. Fixed effects were chosen based on model fit, statistical significance (p < 0.05), and research objectives. Collinearity among predictors was assessed using the variance inflation factor (VIF) < 5 [35], and model assumptions were evaluated using the ‘check_normality’ function from the ‘performance’ package in R version 4.5.0 and residual plots [36]. The model evaluation results are shown in Figure 2. Finally, two final models were developed to describe the environmental responses of GPP and ER:
where i, j, and k index vegetation type, site, and year, respectively. and denote the annual GPP and ER for the k-th year at the j-th site within the i-th vegetation type. and are the fixed intercepts. β1–β5 represent the fixed effect slopes of MAT, AP, VPD, LH, and SWC, respectively. αi represents the random slope of MAT for each biome, allowing the temperature sensitivity of GPP and ER to vary among biomes. εijk is the residual error term, assumed to be normally distributed with mean zero and constant variance. This model structure enables the estimation of both overall environmental effects and biome-specific deviations in temperature responses through partial pooling.
Figure 2.
Normality and collinearity tests for the GPP and ER models: (A) Kernel density plot of residuals from the GPP model, (B) Variance inflation factor values for predictor variables in the GPP model, (C) Kernel density plot of residuals from the ER model, and (D) Variance inflation factor values for predictor variables in the ER model.
To quantify the individual effects of fixed factors on the GPP and ER models, a bootstrap resampling approach was employed, with 1000 iterations used to derive coefficient estimates and their 95% confidence intervals [37]. All independent variables were standardized to enhance convergence efficiency and improve interpretability. All analyses were conducted using the R package ‘lme4’ (version 1.1-35.1) [32]. We employed the ‘glmm.hp’ function from the R package ‘glmm.hp’ (version 1.0.0) to decompose the R2 of the GPP and ER models, quantifying the differences between Marginal R2 attributable to fixed effects and Conditional R2 attributable to both fixed and random effects, and assessing the relative contributions of individual fixed effect factors to the variability in GPP and ER [38]. In our models, temperature was included as both a fixed effect and a random effect to explore its differential impacts on GPP and ER (Figure 2). In addition, we also used multiple linear regression models for both GPP and ER as a supplement to verify the robustness.
3. Results
3.1. Temperature Influence on GPP and ER in Different Ecosystems
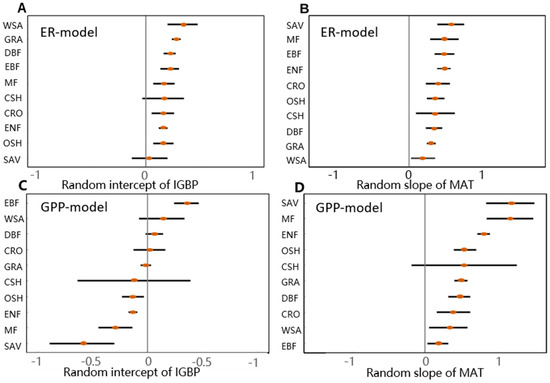
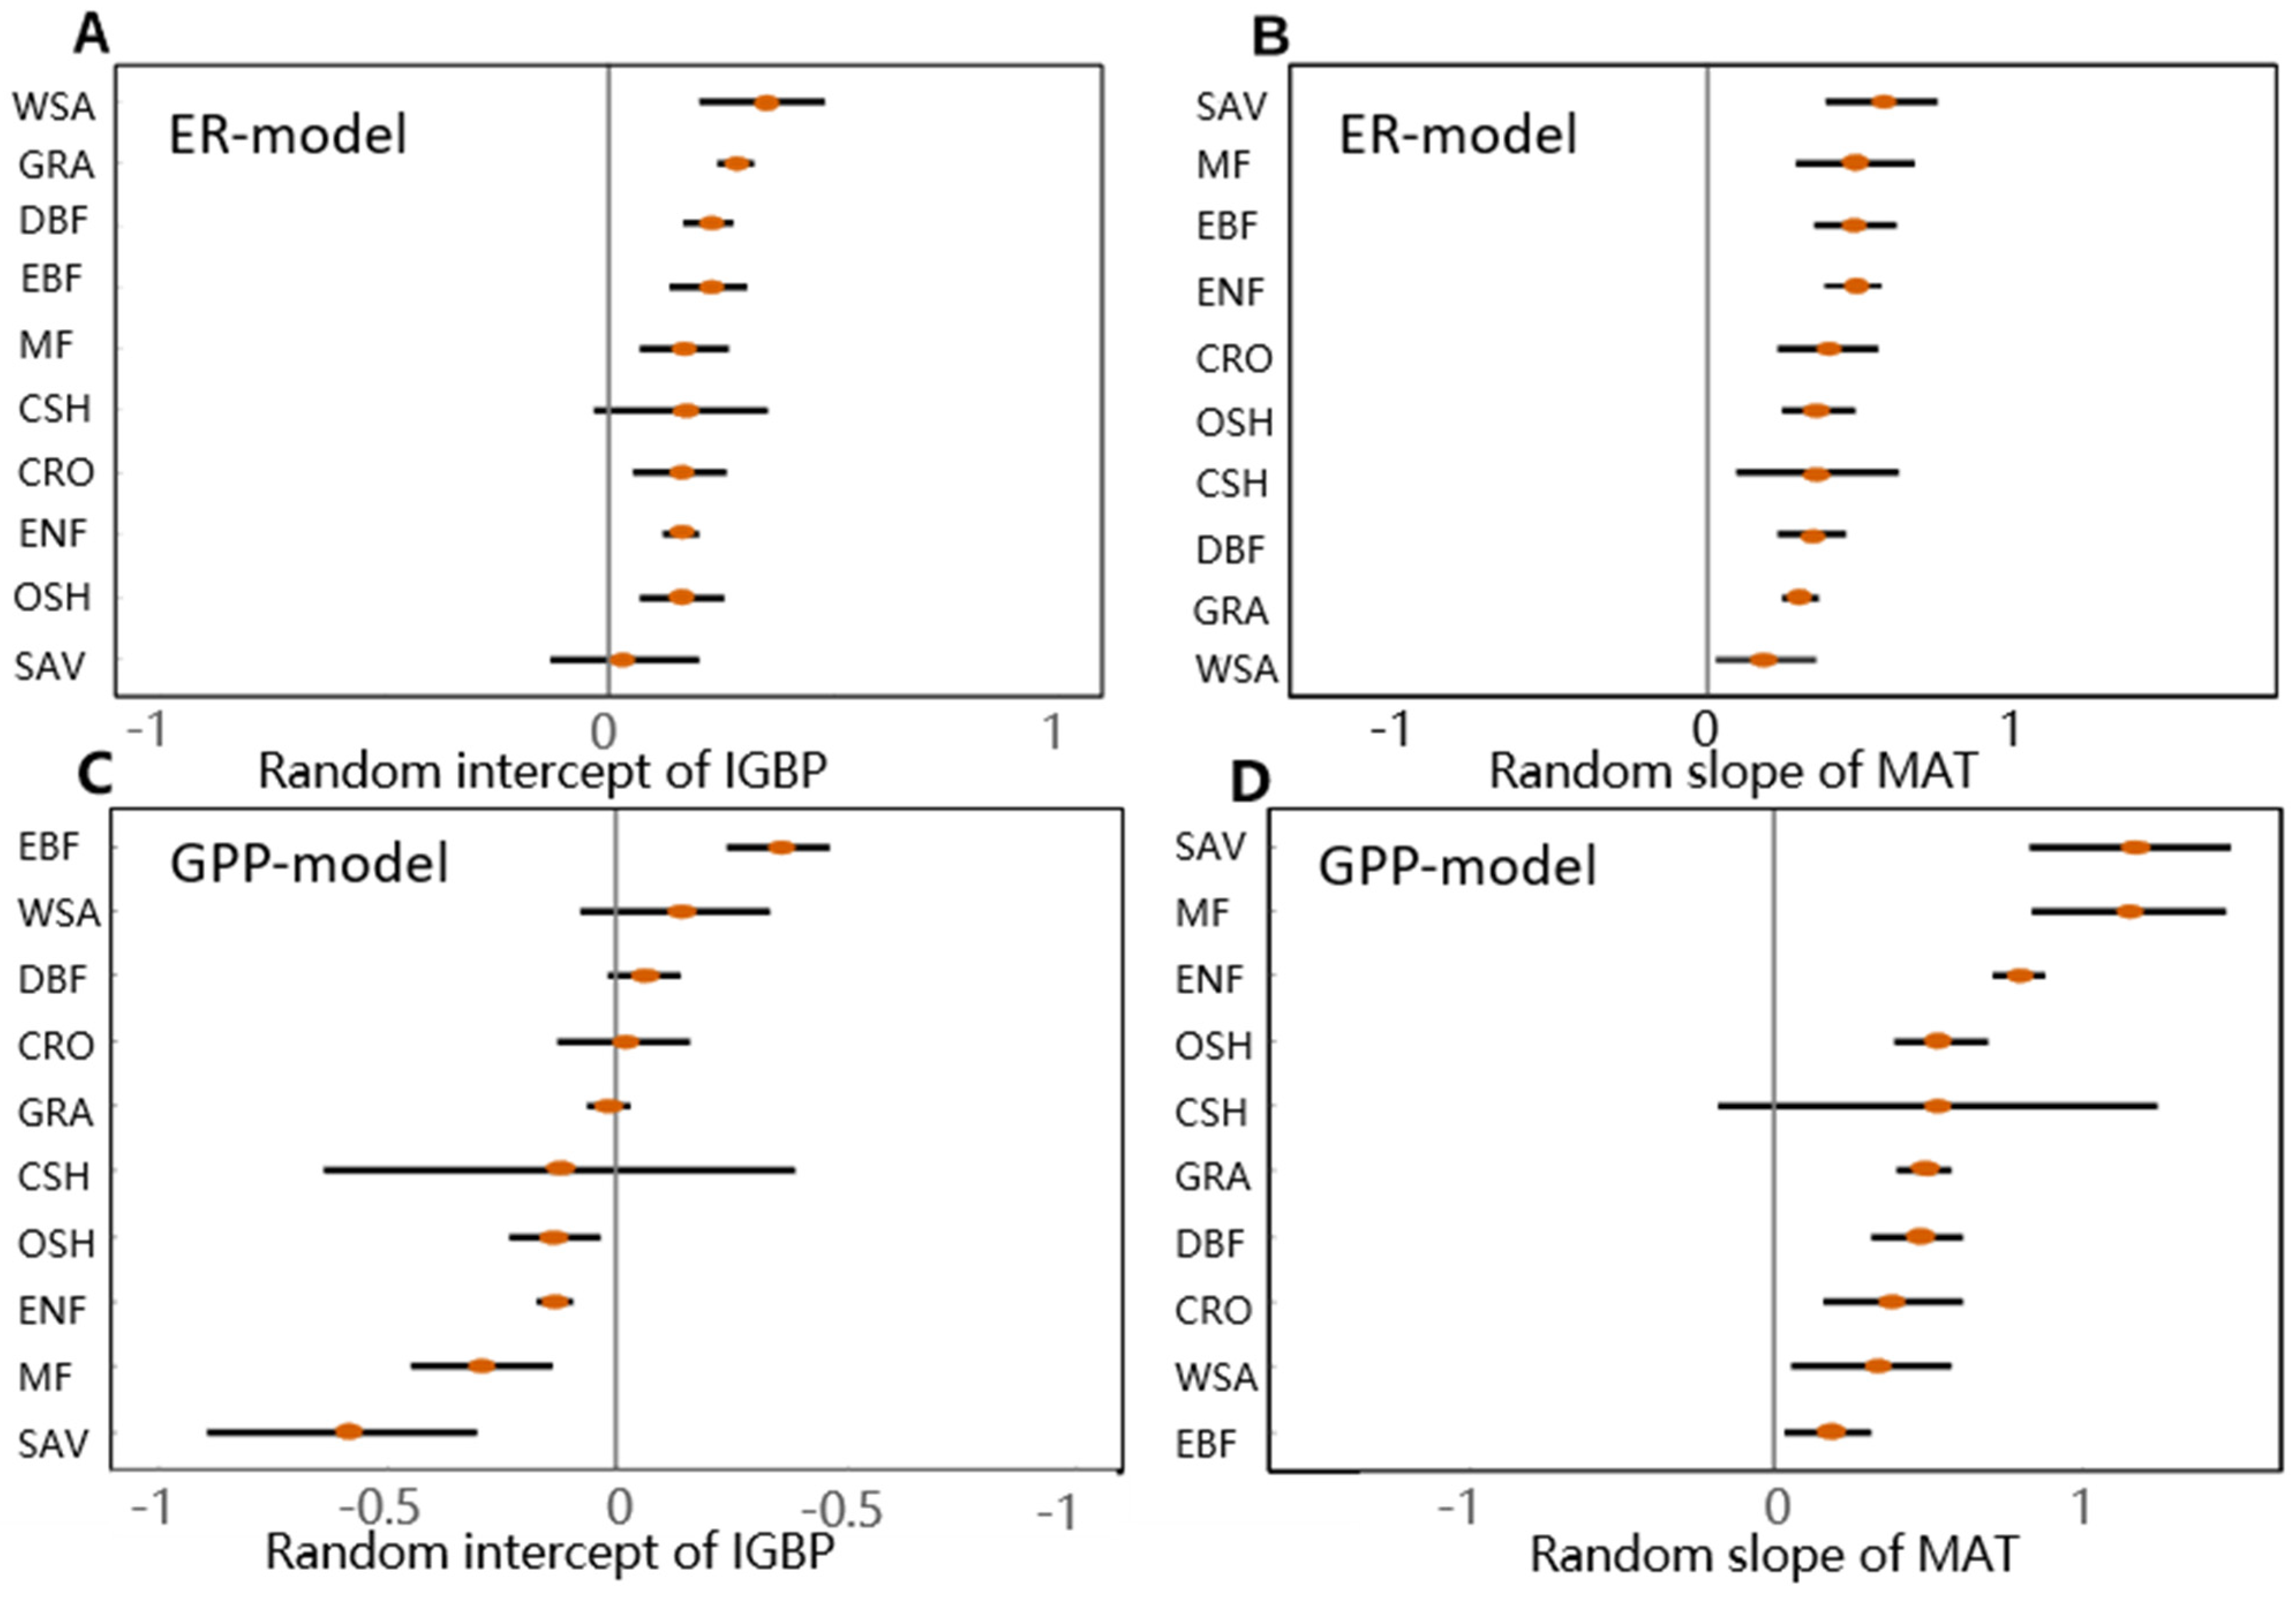
We found that ER was generally more stable than GPP across ecosystems, exhibiting relatively minor variability in ER and considerably larger differences in GPP (Figure 3A,B). By extracting the random effects of the GPP and ER models, we found that MAT had a consistently significant positive effect on ER across different ecosystems. However, this positive effect varied among ecosystems, being the strongest in SAV and the weakest in WSA. The positive effect of MAT on the three forest types (MF, EBF, and ENF) was largely consistent. Across all ecosystems, the variability in MAT’s positive effect on CSH was the greatest (Figure 3B). MAT also exhibited a significant positive effect on GPP across different ecosystems, though the variation in its influence on GPP among ecosystems was greater compared to its effect on ER, with the strongest positive effect observed in SAV and MF, the weakest in EBF, and no significant positive effect detected in CSH (Figure 3D). Additionally, a qualitative summary of the hydrothermal effects on GPP and ER is provided in Table A5.
Figure 3.
Random intercepts and random slopes for ER and GPP models: (A) random intercept of the ER model, (B) random slope of the ER model, (C) random intercept of the GPP model, and (D) random slope of the GPP model. In each panel, the point represents the estimated random effect (intercept or slope) for a given ecosystem type, and the horizontal line denotes the 95% confidence interval (CI) around that estimate. When the horizontal line does not cross the zero line, the random effect is statistically significant (p < 0.05), indicating meaningful variation across ecosystem types in the baseline level (intercept) or the sensitivity (slope) to the environmental driver. Conversely, when the horizontal line crosses or includes the zero line, the random effect is not statistically significant.
3.2. Differential Effects of Hydrothermal Conditions on GPP and ER
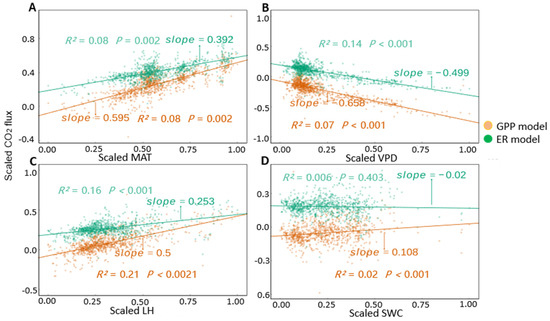
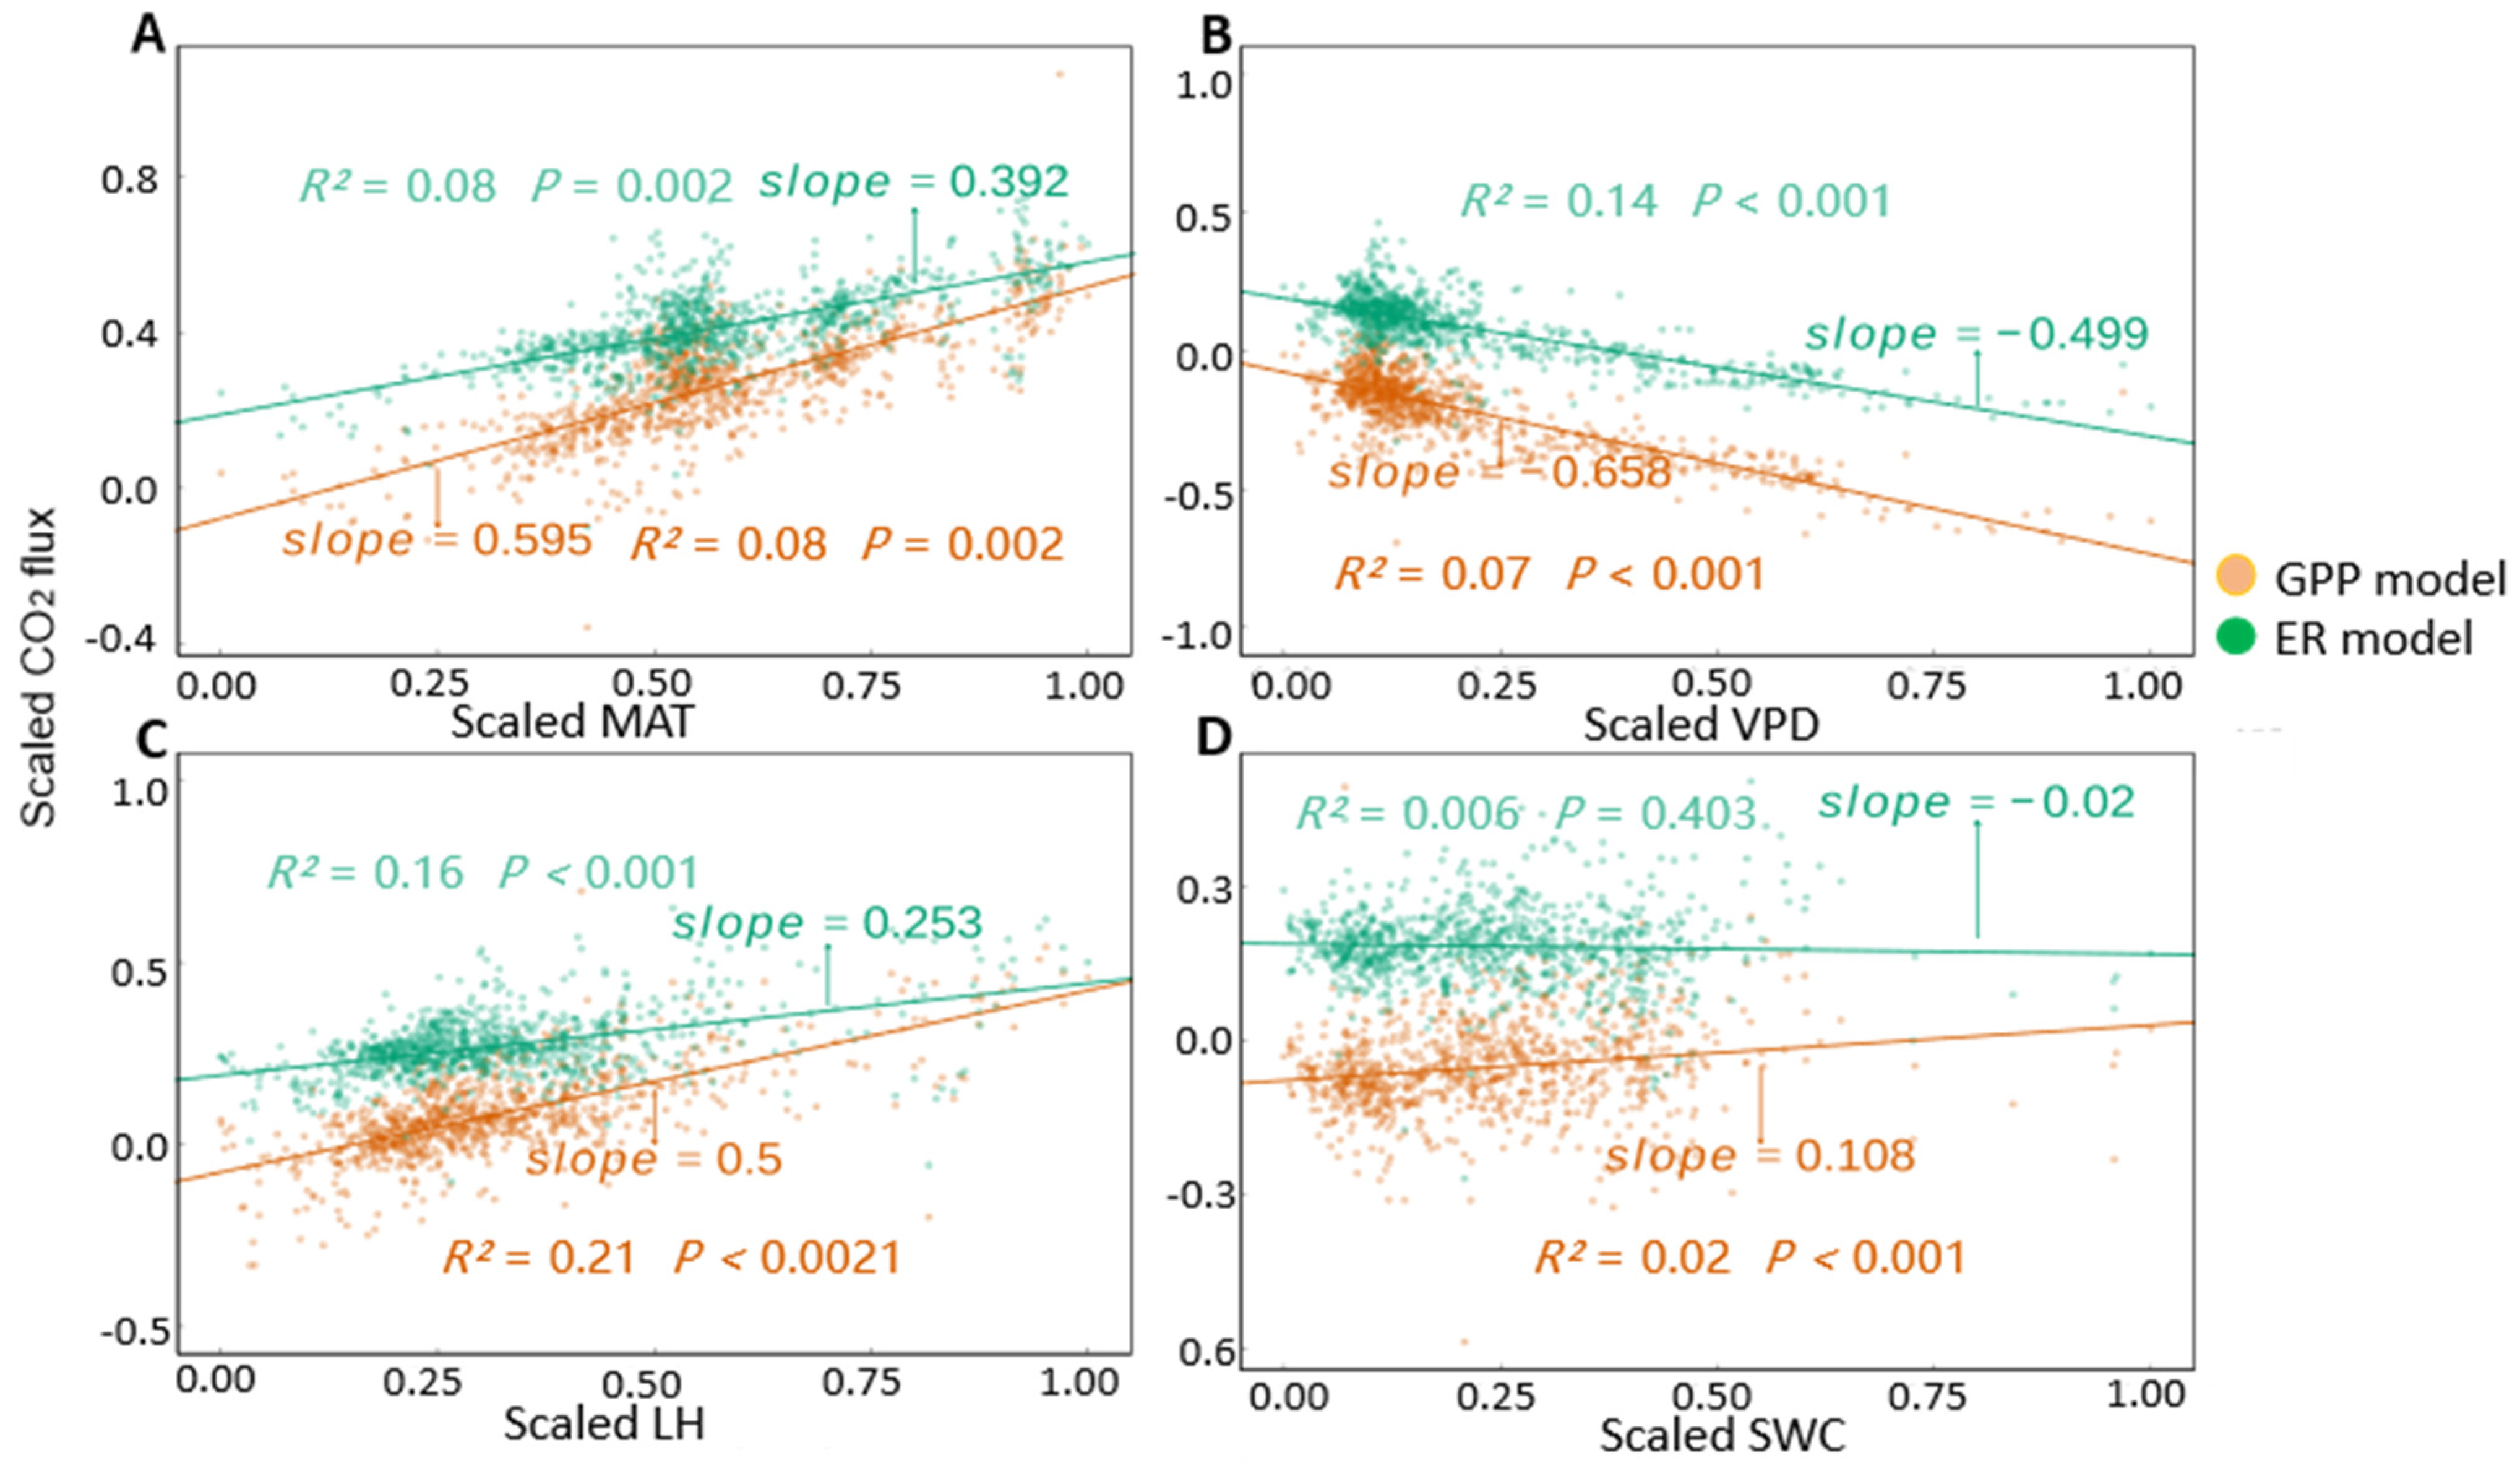
Controlling for biome variation, MAT consistently enhanced both GPP and ER (p < 0.05), yet its effect was more pronounced on GPP (slope = 0.595) than on ER (slope = 0.392) (Figure 4A). VPD had a highly significant inhibitory effect on both GPP and ER (p < 0.001), but its suppression of GPP (slope = –0.658) was notably stronger than that of ER (slope = –0.499) (Figure 4B). Notably, VPD accounted for nearly twice as much variation in ER (R2 = 0.14) as in GPP (R2 = 0.07) (Figure 4B). Similarly, LH promoted both processes, yet its positive effect was more substantial on GPP (slope = 0.50) than on ER (slope = 0.253), and it explained more variance in GPP (Figure 4C). Finally, SWC exerted a significant positive effect on GPP but showed no detectable influence on ER (Figure 4D).
Figure 4.
Effects of individual hydrothermal factors with statistically significant influences (p < 0.05) on GPP and ER after controlling for the effects of other factors: (A) mean annual temperature (MAT), (B) vapor pressure deficit (VPD), (C) latent heat (LH), and (D) soil water content (SWC).
3.3. The Difference in the Effects of Temperature on GPP and ER
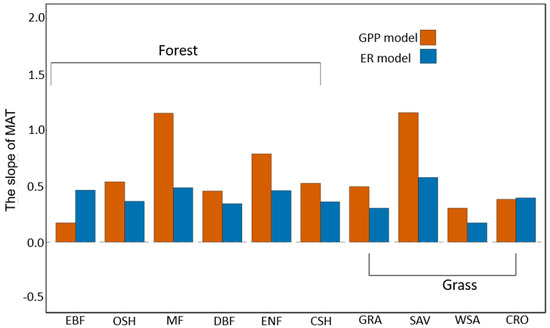
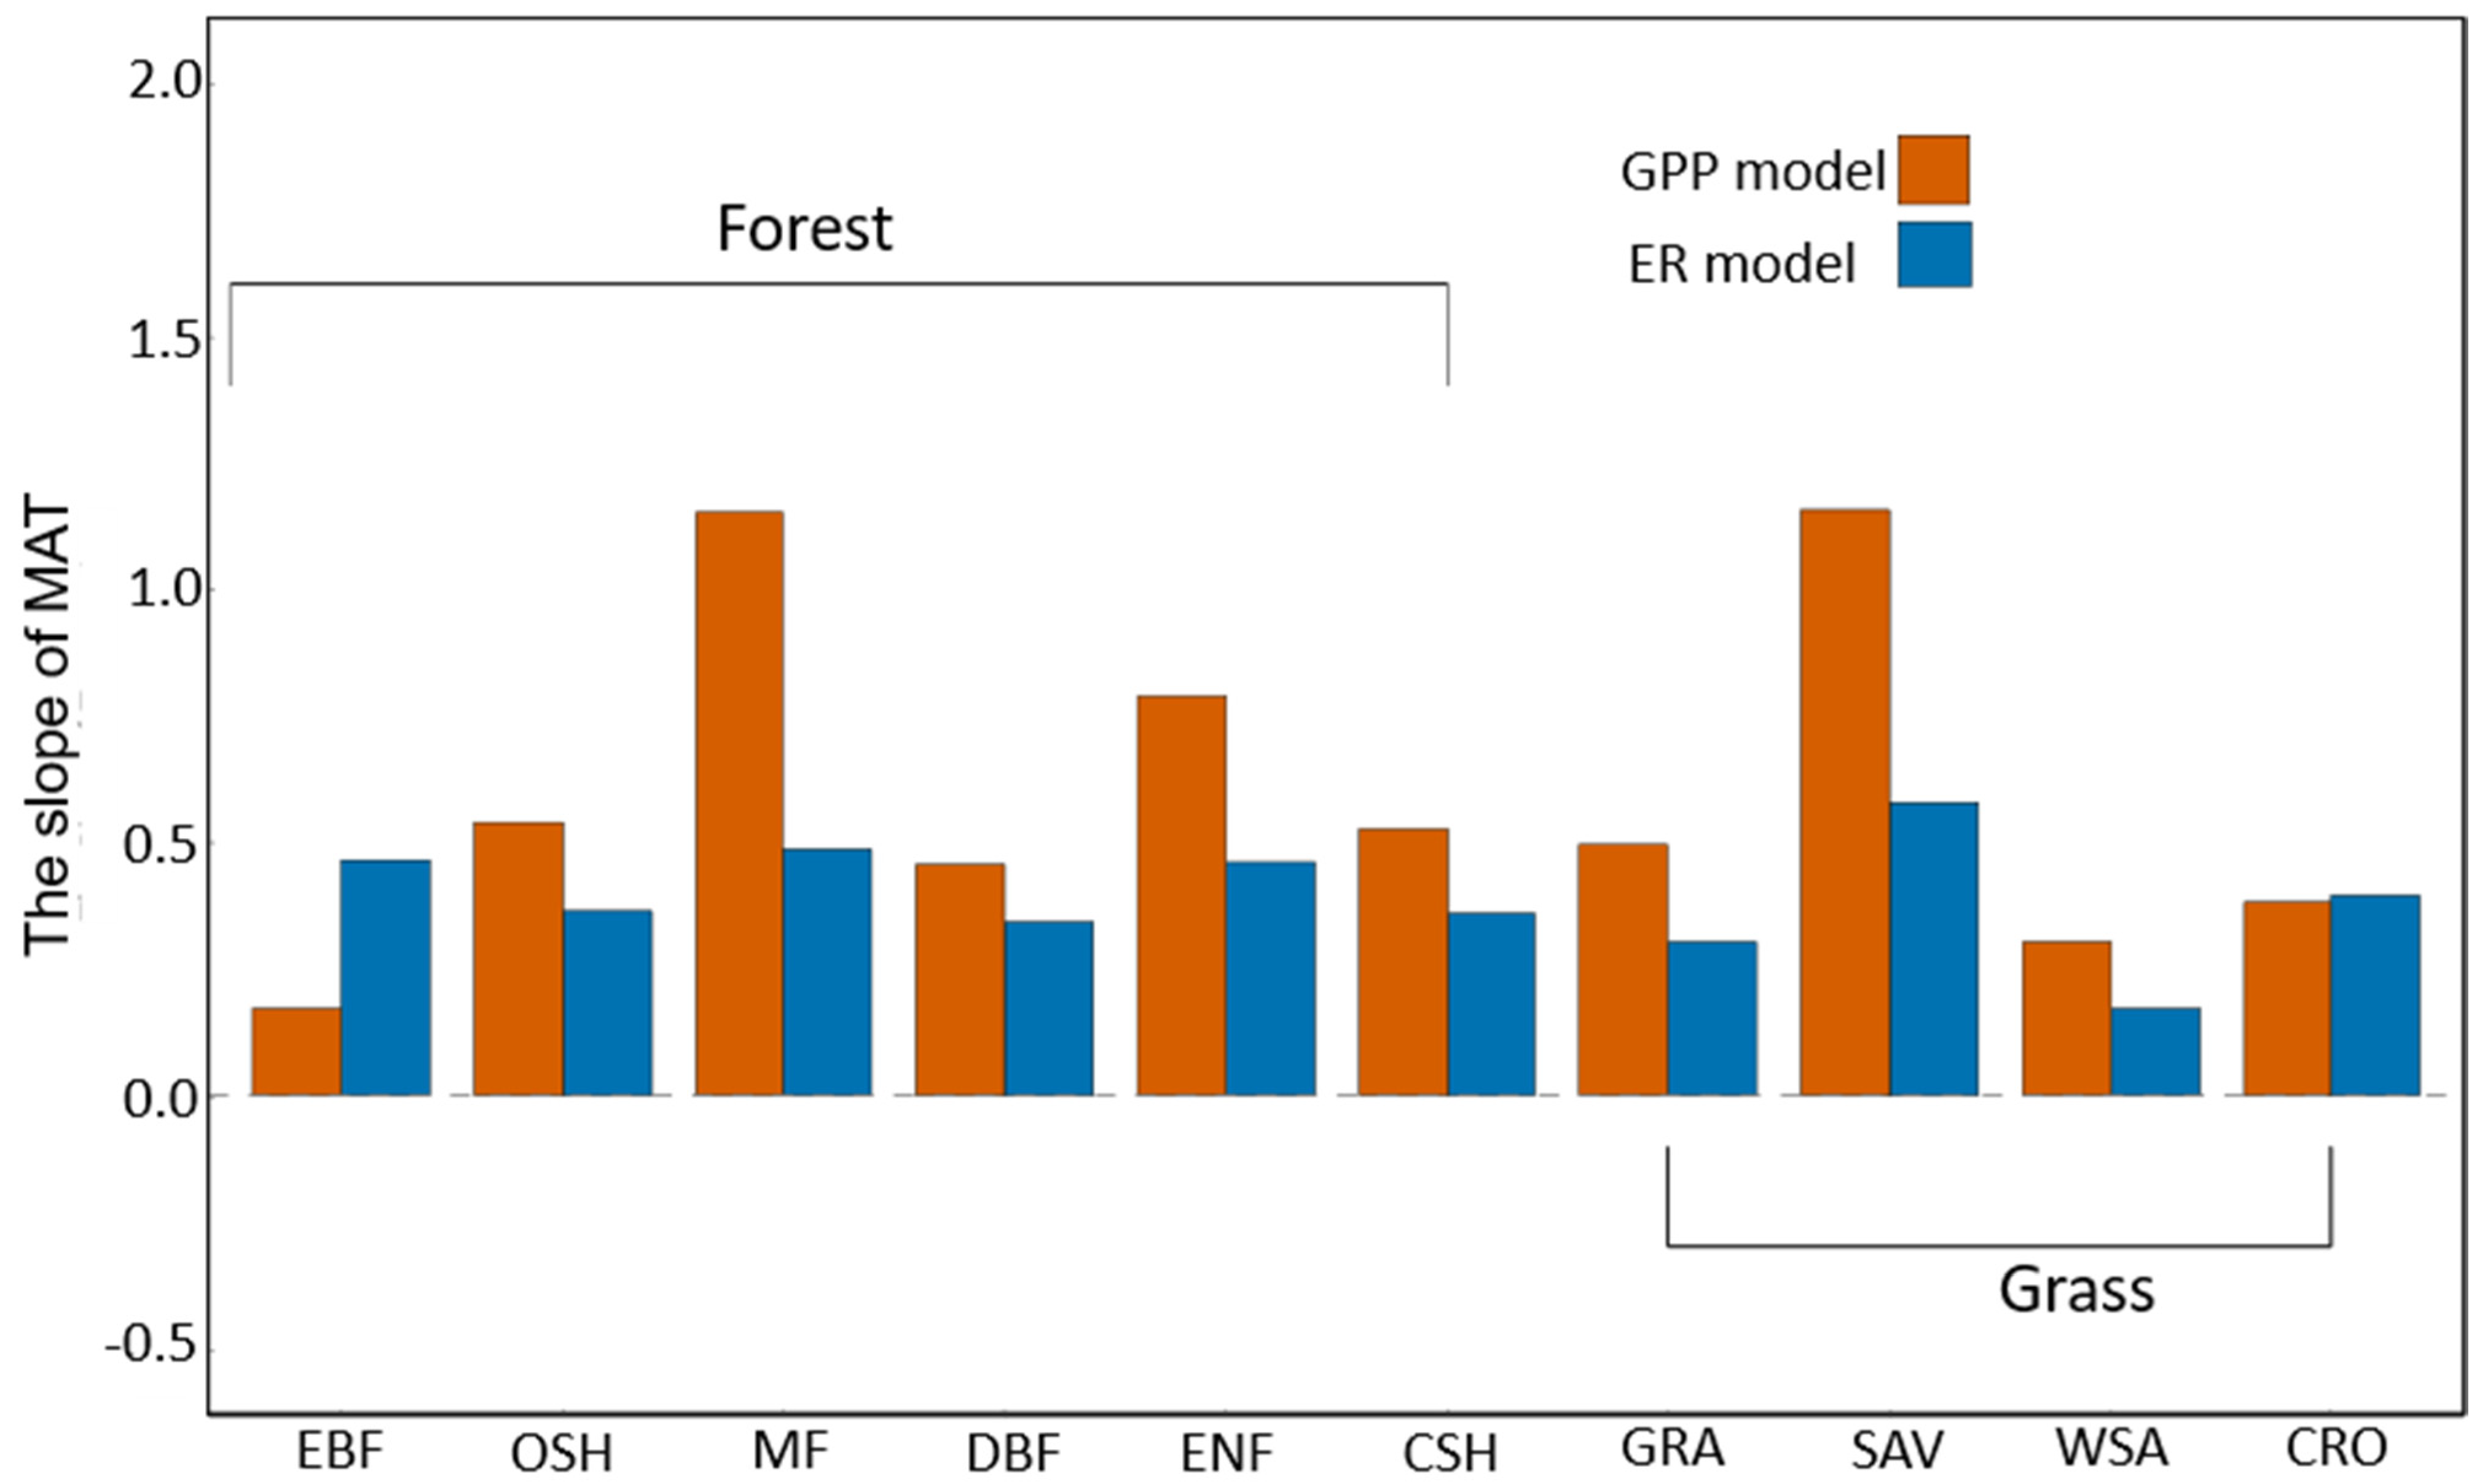
In this study, MAT was incorporated as both a fixed and a random effect. To disentangle its overarching influence on GPP and ER and highlight their contrasts, we extracted the aggregated MAT effects on both processes for direct comparison. The results revealed that, with the exception of EBF and CRO, MAT exerted a stronger influence on GPP than on ER across ecosystems. Moreover, while its effects on ER showed relatively minor variation among ecosystems, the variability in its effects on GPP was considerably larger (Figure 5). MAT had the greatest effect on GPP in MF and SAV, which was approximately twice its effect on their ER, while its effect on GPP in EBF and on ER in WSA was the smallest (Figure 5). Interestingly, it was not the coldest ecosystems whose carbon fluxes were most sensitive to MAT; instead, fluxes in cooler and temperate ecosystems exhibited the strongest responses (Figure 5). Overall, the effect of MAT on carbon flux exhibited a parabolic pattern, first increasing and then decreasing with MAT, and this nonlinear trend was more pronounced for GPP than for ER (Figure 5).
Figure 5.
Differential effects of mean annual temperature (MAT) on GPP and ER. Note: slopes represent the influence of MAT as both a fixed and random effect.
3.4. R2 Decomposition in GPP and ER Models
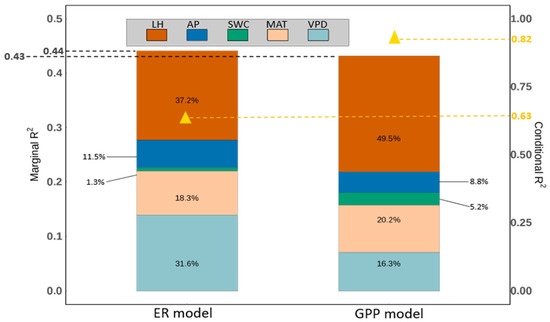
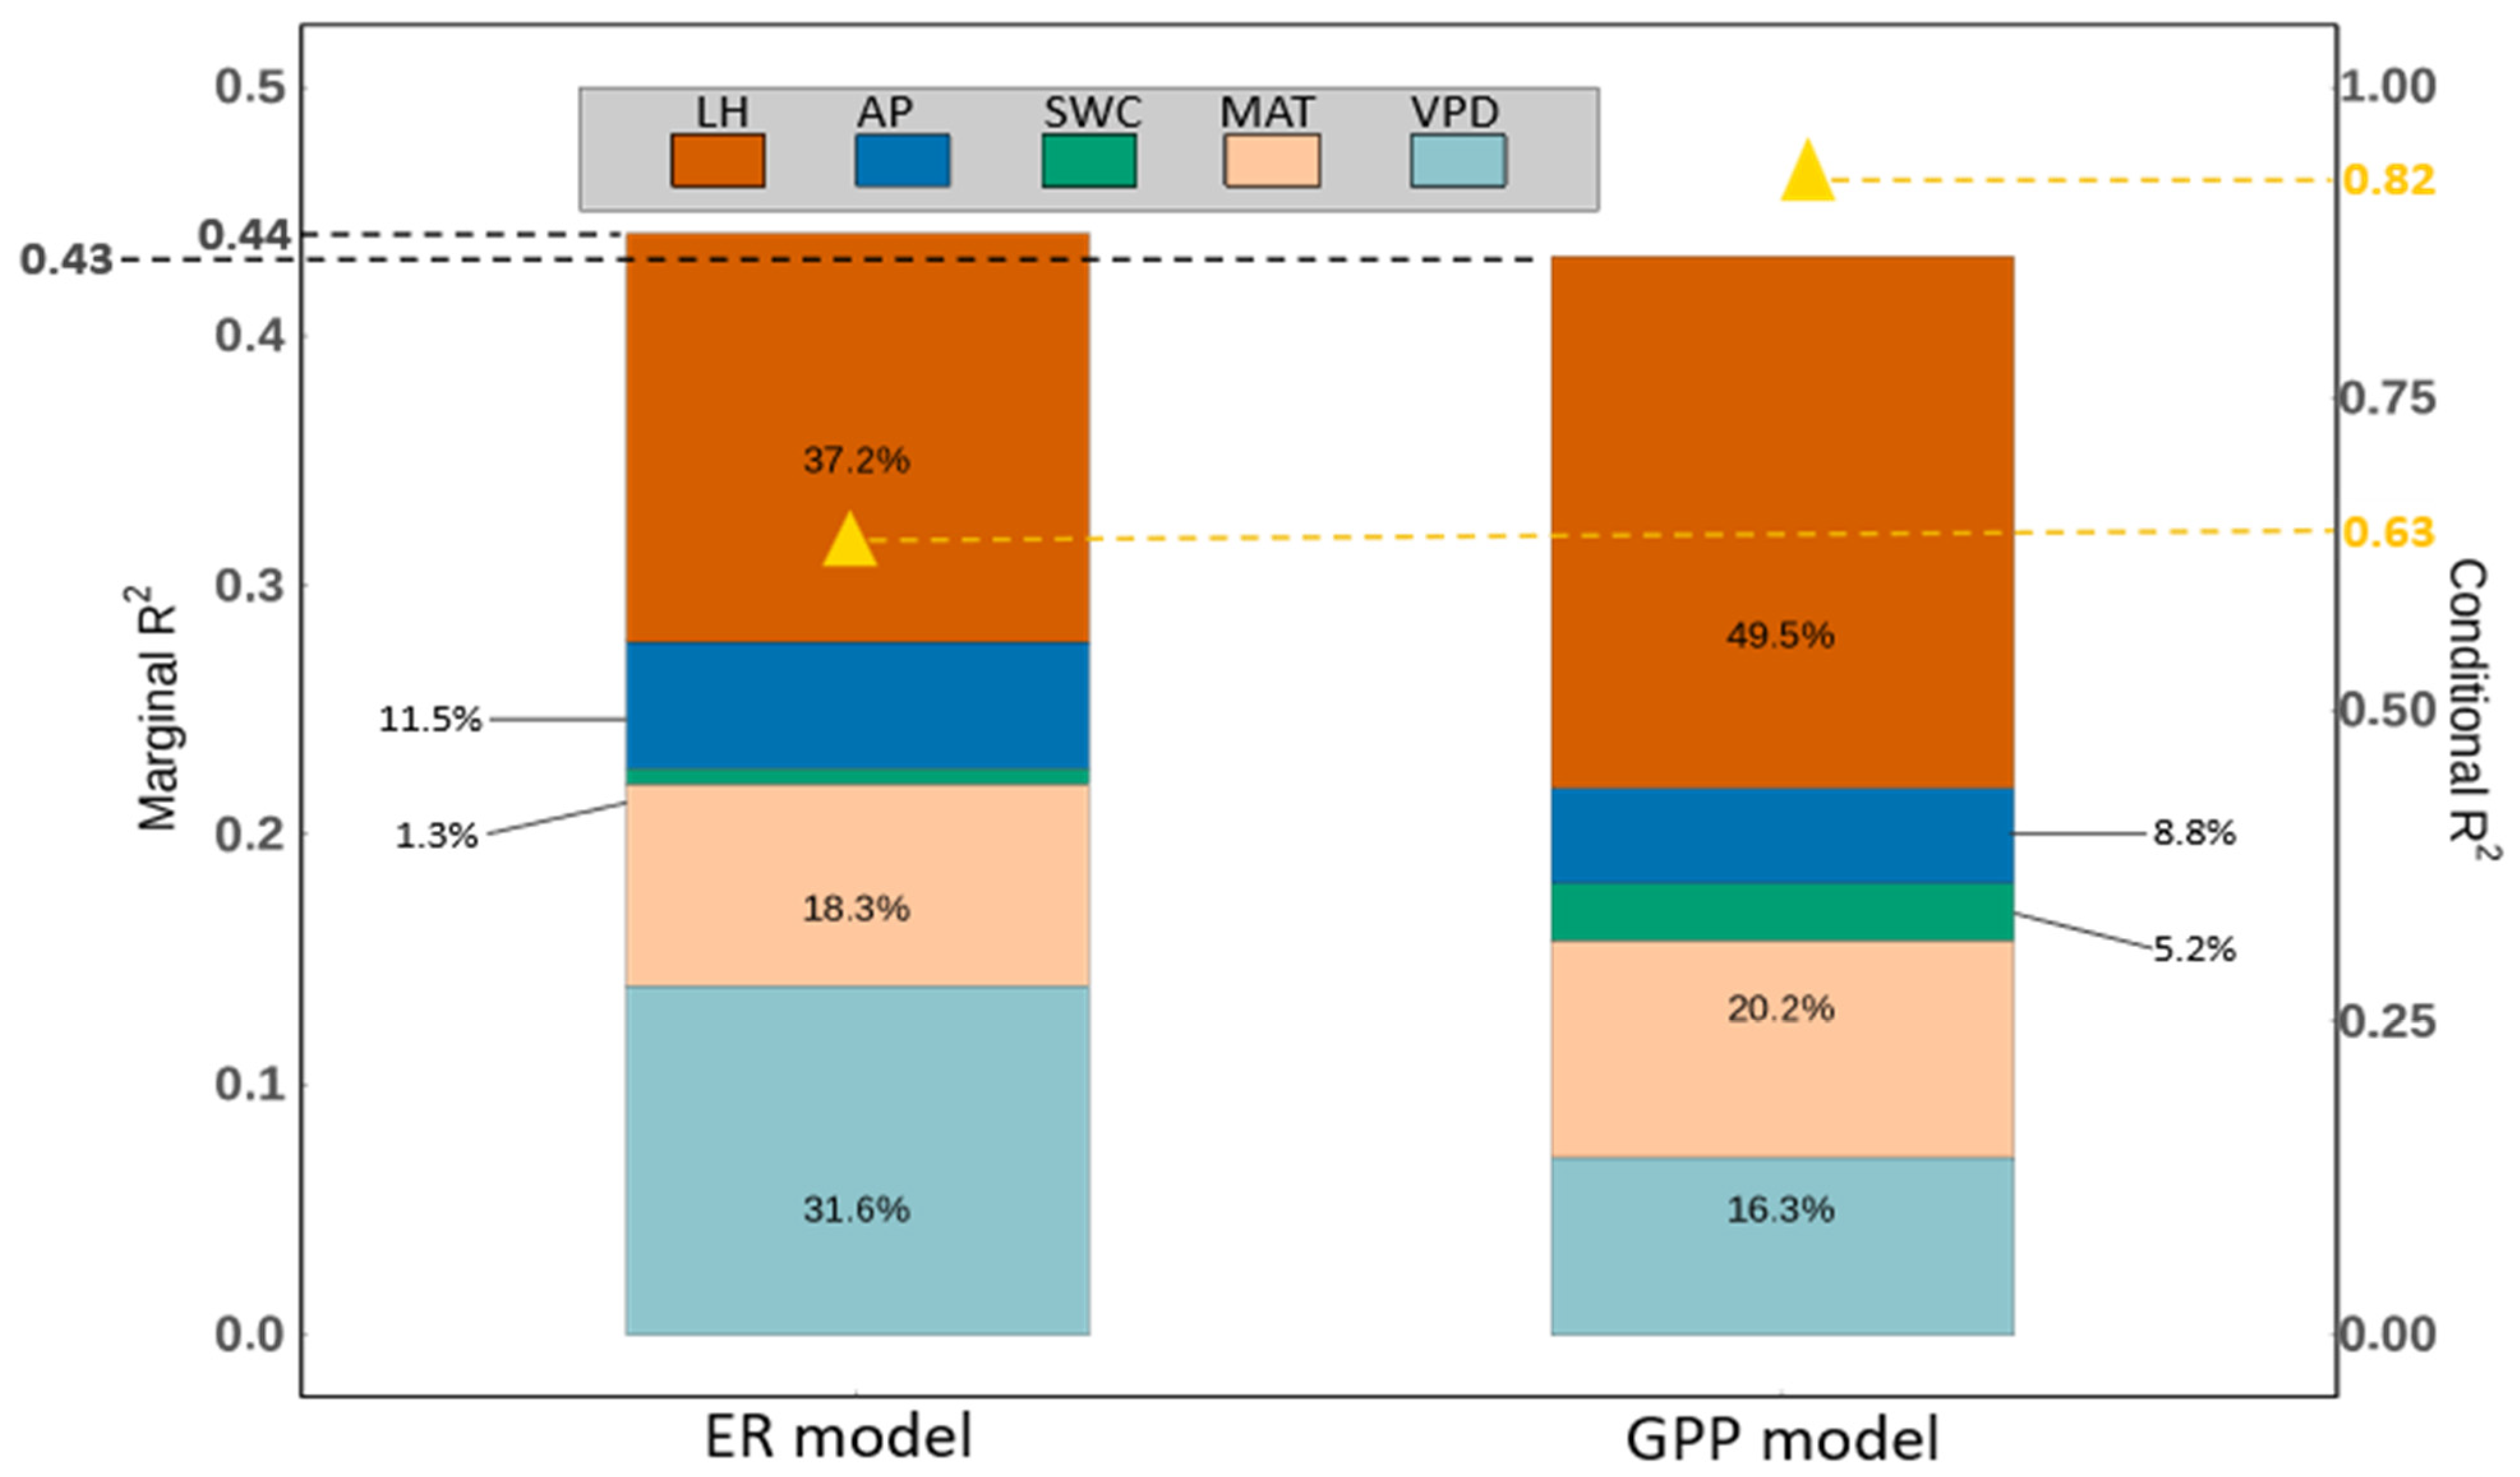
Overall, the fixed effects in the GPP and ER models accounted for nearly equivalent portions of variance, with marginal R2 values of 0.43 and 0.44, respectively (Figure 6), indicating comparable explanatory power of the selected environmental predictors for both carbon fluxes. In contrast, the conditional R2 values differed markedly, with 0.82 for the GPP model and 0.63 for the ER model, reflecting differences in the amount of structured variability captured when both fixed effects and the random-effect structure were considered (Figure 6). This discrepancy suggests that while hydrothermal predictors provide a comparable baseline for both fluxes, GPP is subject to much stronger ecosystem-level modulation. Specifically, the gap between conditional R2 and marginal R2 for GPP (0.39) is nearly double that for ER (0.19), reflecting a higher sensitivity of photosynthetic processes to site-specific biotic factors, such as canopy structure, leaf functional traits, and successional stages, which are captured within the IGBP random effect structure. In contrast, the lower conditional R2 for ER suggests that ecosystem respiration may be more universally constrained by the immediate hydrothermal state, with less dependency on unobserved site-level heterogeneity compared to GPP. Therefore, the explanatory power of our mixed-effects framework underscores that carbon uptake is an integrated product of environmental forcing and complex biological “legacy effects,” whereas carbon release aligns more closely with direct environmental variability. Regarding the fixed effects of the two models, the influence of individual hydrothermal factors differed substantially between carbon flux processes. LH accounted for a larger proportion of the explained variance in GPP (49.5%) than in ER (37.2%), VPD contributed more strongly to ER (31.6%) than to GPP (16.3%), and MAT exhibited nearly equal explanatory power for both GPP and ER (Figure 6).
Figure 6.
Decomposition of R2 for the GPP and ER models. The left y-axis represents the marginal R2 of the ER and GPP models, and the right y-axis represents their conditional R2. Different colored segments within each bar, along with the numbers inside them, indicate the proportion of each environmental factor (fixed effect) contributing to the marginal R2. The yellow triangles in the figure and the yellow numbers on the right y-axis represent the conditional R2 values of the two models.
3.5. Multiple Linear Regression Model
We explored an alternative model formulation, i.e., multiple linear regression models for both GPP and ER. The results are summarized in Table 1 and Table 2. The multiple linear regression model for GPP achieved an R2 of 0.738 (Table 1), which is close to the marginal R2 (0.82) of the mixed-effects model reported in Figure 6 of the manuscript. Similarly, the ER regression model yielded an R2 of 0.624 (Table 2), comparable to the marginal R2 (0.63) of the corresponding mixed-effects model. These results provide independent support for the robustness and reliability of the mixed-effects modeling framework used in our study.
Table 1.
Summary of the multiple linear regression model for GPP.
Table 2.
Summary of the multiple linear regression model for ER.
Furthermore, we conducted hierarchical partitioning of R2 for the multiple linear regression models. The resulting contributions of individual predictors were highly consistent with those reported in Figure 4 of the manuscript. For example, the Individual R2 of LH in the GPP regression model was 0.237 (Table 3), compared to 0.21 in Figure 4, while for ER the corresponding values were 0.174 (Table 4) and 0.16, respectively. These close agreements indicate that the key drivers and their relative importance are stable across different modeling approaches.
Table 3.
Hierarchical partitioning of explained variance (R2) for the GPP model.
Table 4.
Hierarchical partitioning of explained variance (R2) for the ER model.
4. Discussion
4.1. Differential Contributions of Fixed Effects to GPP and ER Models
After accounting for vegetation type, the GPP and ER models showed comparable marginal R2 values (Figure 6), which may reflect the carbon balance strategies that vascular plants have developed throughout their long evolutionary history in response to environmental changes [39,40,41], indicating that the four key hydrothermal factors explained both fluxes to a similar degree. As complementary processes, GPP and ER are not only jointly regulated by environmental drivers but are also tightly coupled, exhibiting broad covariation across ecosystems [25,42].
Further comparison revealed that GPP and ER differed in their response magnitude and sensitivity to the same hydrothermal factors (Figure 4). This divergence may arise from differences in the physiological, biochemical, and ecological processes underlying carbon uptake and release. Photosynthesis is more directly regulated by light availability and temperature, influencing key physiological and biochemical processes such as carbon fixation and electron transport [12,43], whereas ER, due to the heterogeneity of its components, is more strongly influenced by soil moisture conditions and temperature-driven regulation of microbial activity, especially with regard to soil respiration (Rs) [44,45,46]. Furthermore, as a major component of ER, Rp is intrinsically linked to photosynthetic activity [47].
Specifically, LH explained more variation in GPP than in ER, and GPP exhibited a stronger response (Figure 4C and Figure 6), a pattern that likely reflects the fact that LH directly mirrors ecosystem evapotranspiration and plant stomatal conductance, which in turn regulate CO2 uptake [48,49]. The response involves a coordinated interaction between plant transpiration and photosynthesis [50]. In contrast to GPP, ER is more complex and is regulated by multiple factors, including temperature [51,52], soil moisture [51,53], nutrient availability [54], and microbial activity [55]. This multi-factor regulation tends to attenuate the responsiveness of ER to any single environmental driver. Moreover, changes in LH influence soil moisture and root respiration with a temporal lag, requiring time to accumulate before significantly affecting microbial activity and Rp rates [56,57].
In contrast to LH, VPD accounted for almost twice the variation in ER compared to GPP, yet its negative impact on GPP was markedly stronger than on ER (Figure 4C and Figure 6). This pattern may stem from differences in the sensitivity of ER and GPP to water stress. Higher VPD generally indicates more severe water limitation [58,59], and the photolysis of water in photosystem II (PSII) is essential for sustaining photosynthesis [60]. Under water deficit, photosynthesis is inhibited, leading to reduced GPP [61]. Moreover, under high VPD conditions, the dry atmosphere drives rapid stomatal closure to minimize water loss, which directly restricts CO2 uptake by leaves [62]. Simultaneously, many plants, especially woody species, possess well-developed root systems that enable them to access deeper soil water reserves [63,64], which under elevated VPD conditions can partially alleviate water limitations and thereby diminish the explanatory power of VPD for GPP. Studies have revealed an asymmetric parabolic relationship between VPD and GPP, whereby GPP increases or remains stable at low VPD, declines at moderate VPD, and the negative effect attenuates at extremely high VPD [65,66].
In contrast, the components of ER differ in their sensitivity to water and are closely linked to both the atmospheric dryness reflected by VPD and soil water limitation. Generally, Rp is more responsive to high VPD [67], whereas Rs is more strongly influenced by SWC [68]. As a result, although the inhibitory effect of VPD on total ER is less pronounced than on GPP, VPD nonetheless accounts for a larger fraction of ER variability, reflecting its cumulative influence across the individual respiratory components.
4.2. Differential Temperature on GPP and ER Across Biomes
The conditional R2 of the GPP model was 0.82, substantially higher than that of the ER model, which was 0.63 (Figure 6). This suggests that, when MAT was treated as a random effect nested within ecosystem types, the model captured a larger proportion of the variability in GPP, whereas a considerable fraction of ER variability remained unexplained. As the direct product of photosynthesis, GPP is primarily driven by temperature and the availability of water and light [12,69,70], and is further modulated by vegetation type and physiological characteristics [71,72], resulting in relatively high predictability. For instance, a study evaluating satellite-based models with GPP data from 119 eddy covariance sites across the Northern Hemisphere showed that GPP estimates are strongly influenced by temperature, solar radiation, and precipitation, and that model performance varies across vegetation types [73].
Compared with GPP, the response of ER to temperature varies little among different ecosystem types, which may result from the convergence in ER temperature sensitivity [74]. Niu et al. (2021) further showed that climate warming leads to a more uniform apparent temperature sensitivity of ER, indicating that the temperature sensitivity of ER across ecosystems is becoming increasingly consistent [75]. Furthermore, Rs constitutes a major fraction of ER [76,77,78], and its temperature sensitivity varies little among different ecosystems, being primarily regulated by soil organic carbon and soil moisture [79,80]. Given the stability of soil organic carbon pools, the limited plasticity of Rs to temperature changes contributes to a convergence in overall ER temperature sensitivity across ecosystems [81,82,83].
Among ecosystem types, temperature exerted the strongest influence on GPP in MF and SAV, a moderate influence in ENF, and the weakest in EBF (Figure 5). This pattern may be related to the degree of matching between the optimum temperature for photosynthesis and prevailing environmental conditions across ecosystems [84]. In regions with moderate temperatures, warming brings leaf temperatures closer to the photosynthetic optimum, enhancing carbon assimilation and photosynthesis [85,86,87]. In contrast, in cold high-latitude forests, rising temperatures may still fall well below the optimal range, leading to only modest enhancements in photosynthesis [88,89]. In low-latitude tropical rainforests, where ambient temperatures are already close to or exceed the optimum, further warming may lead to declines in enzymatic activity, increased water stress, and heat-induced photoinhibition, thereby dampening the positive effect of temperature on GPP [90,91,92].
Furthermore, the synergistic effects of hydrothermal conditions are also a significant factor. In regions with moderate temperatures and minimal water limitations, increasing temperatures can substantially enhance GPP [93,94,95]. In contrast, in high-latitude cold regions, although summer hydrothermal conditions may be favorable, the prolonged winter still imposes strong constraints on vegetation productivity, thereby partially limiting the effect of temperature on GPP [96,97]. Overall, GPP in MF and SAV responds most strongly to temperature, likely because temperature changes bring them closer to the photosynthetic optimum under favorable hydrothermal conditions, whereas high-latitude forests exhibit weaker responses due to thermal deviation and hydrothermal constraints. For EBF, due to its unique habitat, temperature is not a limiting factor for GPP, and thus variations in temperature have the least effect on GPP [98,99,100].
4.3. Uncertainties and Limitations of the Study
Despite the broad climatic gradients covered by FLUXNET2015, the absolute number of available eddy covariance sites remains small relative to the immense spatial, climatic, and ecological heterogeneity of terrestrial ecosystems. This inherent limitation constrains the extent to which site-based statistical relationships can be confidently extrapolated beyond the observational domain of the network. In particular, regions, biomes, and climate regimes with sparse or no flux tower coverage may exhibit ecosystem responses to hydrothermal drivers that differ from those captured by the existing observations. Consequently, while our results reveal robust large-scale patterns across sampled ecosystems, caution is warranted when extending these findings to underrepresented regions or unsampled environmental conditions.
Specifying fixed and random effects is a key decision in mixed-effects modeling [101]. While factors with many levels and unclear sources are often treated as random, factors with numerous levels and clear ecological significance can also be reasonably modeled as random. The essence of random-effects models lies in their ability to achieve a balance between general patterns and group-specific differences through partial pooling [102,103]. In this study, ecosystem types were modeled as a random effect to capture the overall influence of hydrothermal drivers on GPP and ER while accounting for variability across vegetation types. Although site-level heterogeneity could be explicitly modeled by including site as an additional random effect, doing so would substantially increase model complexity and reduce the interpretability of large-scale environmental drivers, which was not the primary objective of this study. This approach uses shrinkage to maintain biome-specific estimates for well-sampled biomes near group means while drawing sparsely sampled ones toward the overall mean, avoiding unstable inferences. It identifies environmental driver effects but may slightly mask biome differences.
It should be noted that forest ecosystems are more heavily represented in the FLUXNET2015 dataset than non-forest biomes, reflecting the network’s inherent distribution. Although our mixed-effects framework mitigates this imbalance through partial pooling, results for well-sampled forests are more robust. Inferences for underrepresented biomes should therefore be interpreted with caution. Beyond biome imbalances, geographic sampling in FLUXNET2015 is skewed toward Europe and North America, leaving tropical and high-latitude regions underrepresented. This spatial bias may influence our findings in sparsely sampled climate regimes. Consequently, while our study covers broad climatic gradients, the results should be extrapolated to underrepresented regions with caution. Expanding flux tower networks in these data-poor areas remains essential for robust global inferences. Importantly, the mixed effects modeling framework ensures greater statistical stability for ecosystem types with larger sample sizes by shrinking estimates from sparsely sampled groups toward the global mean. While this property enhances overall robustness, it does not eliminate underlying geographic or biome-level sampling biases.
In addition to this modeling choice, several other important limitations must be acknowledged. First, our models assumed linear and additive effects of the hydrothermal drivers on GPP and ER. This is a simplification, as the ecological responses to these drivers are often non-linear and interactive. For example, the effect of temperature on carbon fluxes is likely constrained by water availability (VPD or SWC), but such interactions were not included in our final models. Indeed, when responses are aggregated across biomes, our results suggest an apparent non-linear, parabolic pattern in the MAT effect (Figure 5), reflecting substantial heterogeneity among ecosystem types, which a simple linear term cannot fully capture. Second, our analysis treated each ‘site-year’ as an independent sample to robustly analyze the differential impacts. This approach, while common, may be susceptible to pseudo replication, as observations from the same site across consecutive years are not truly independent. This lack of temporal independence could potentially lead to an overestimation of statistical significance, i.e., narrower confidence intervals and lower p-values than are strictly warranted. Future studies could employ more complex hierarchical models that explicitly nest ‘year’ within ‘site’ to better account for this data structure. Third, the selected hydrothermal drivers are inherently correlated. Although we assessed collinearity using VIF, interpreting the coefficients or the R2 decomposition as purely causal, independent contributions is challenging. The effect attributed to one variable may be partially mediated by another correlated driver. Therefore, the reported slope coefficients should be interpreted as the strength of association within the context of the specific model, rather than as definitive, isolated causal effects.
5. Conclusions
This study used mixed effects models to compare the effects of key hydrothermal drivers on GPP and ER across global biomes, with a particular focus on forest ecosystems. We found that LH and MAT had stronger positive effects on GPP than on ER (slope = 0.5 > 0.253; slope = 0.595 > 0.392), whereas VPD had a stronger negative effect on GPP than on ER (slope = −0.658 < −0.499), yet explained more variance in ER than in GPP (R2 = 0.14 > 0.07). The marginal R2 of the GPP and ER models were similar (0.43 and 0.44), but the conditional R2 of GPP was substantially higher (0.82 and 0.63), indicating that MAT has a stronger effect on GPP than on ER across different ecosystem types. By examining the combined effects of MAT on GPP and ER, we found that the influence of temperature on GPP varied more across different ecosystem types than on ER, with the strongest effects in MF and SAV, moderate effects in ENF, and the weakest effects in EBF. Overall, this study provides deeper insight into the differences and underlying mechanisms of environmental drivers on GPP and ER, offering critical implications for predicting the carbon balance of forest ecosystems under changing hydrothermal regimes.
Author Contributions
Methodology, W.C. and W.Z.; Software, W.C., W.Z., Q.Z., X.G. and J.Z.; Validation, W.Z. and C.J.; Formal analysis, W.C., W.Z., Q.Z., X.G. and J.Z.; Data curation, W.C. and W.Z.; Writing—original draft, W.C.; Writing—review and editing, W.Z. and C.J.; Supervision, C.J. All authors have read and agreed to the published version of the manuscript.
Funding
The study was supported by the National Natural Science Foundation of China (Grant No. 62472216; 32201282), and the start-up Fund for New Talented Researchers of Nanjing University of Industry Technology (Grant No. YK23-08-01). The U.S.–China Carbon Consortium (USCCC) promoted this work by providing opportunities for discussion and exchange of ideas.
Data Availability Statement
This study used openly available eddy covariance measurements provided by FLUXNET2015 dataset (https://fluxnet.fluxdata.org/data/fluxnet2015-dataset/, accessed on 12 April 2025). All data supporting the results and conclusions presented in this manuscript are available at the following link: https://github.com/weirongzhng-oss/data-and-code (accessed on 10 October 2025).
Conflicts of Interest
The authors declare no conflicts of interest.
Appendix A
Table A1.
Environmental variables and carbon flux indicators used in this study.
Table A2.
Ecosystem types of study sites based on the IGBP classification.
Table A3.
Model comparison for random effects structure in the GPP mixed-effects models.
Table A4.
Model comparison for random effects structure in the ER mixed-effects models.
Table A5.
Qualitative summary of hydrothermal effects on GPP and ER.
References
- Griffis, T.J.; Black, T.A.; Gaumont-Guay, D.; Drewitt, G.B.; Nesic, Z.; Barr, A.G.; Morgenstern, K.; Kljun, N. Seasonal variation and partitioning of ecosystem respiration in a southern boreal aspen forest. Agric. For. Meteorol. 2004, 125, 207–223. [Google Scholar] [CrossRef] [Scilit]
- Wang, S.; Chen, W.; Fu, Z.; Li, Z.; Wang, J.; Liao, J.; Niu, S. Seasonal and inter-annual variations of carbon dioxide fluxes and their determinants in an Alpine meadow. Front. Plant Sci. 2022, 13, 894398. [Google Scholar] [CrossRef] [Scilit] [PubMed]
- Wohlfahrt, G.; Gu, L. The many meanings of gross photosynthesis and their implication for photosynthesis research from leaf to globe. Plant Cell Environ. 2015, 38, 2500–2507. [Google Scholar] [CrossRef] [Scilit]
- Baldocchi, D.; Chu, H.; Reichstein, M. Inter-annual variability of net and gross ecosystem carbon fluxes: A review. Agric. For. Meteorol. 2018, 249, 520–533. [Google Scholar] [CrossRef] [Scilit]
- Reichstein, M.; Falge, E.; Baldocchi, D.; Papale, D.; Aubinet, M.; Berbigier, P.; Bernhofer, C.; Buchmann, N.; Gilmanov, T.; Granier, A.; et al. On the separation of net ecosystem exchange into assimilation and ecosystem respiration: Review and improved algorithm. Glob. Change Biol. 2005, 11, 1424–1439. [Google Scholar] [CrossRef] [Scilit]
- Niu, S.; Sherry, R.A.; Zhou, X.; Wan, S.; Luo, Y. Nitrogen regulation of the climate–carbon feedback: Evidence from a long-term global change experiment. Ecology 2010, 91, 3261–3273. [Google Scholar] [CrossRef]
- Piao, S.; Wang, X.; Wang, K.; Li, X.; Bastos, A.; Canadell, J.G.; Ciais, P.; Friedlingstein, P.; Sitch, S. Interannual variation of terrestrial carbon cycle: Issues and perspectives. Glob. Change Biol. 2020, 26, 300–318. [Google Scholar] [CrossRef] [Scilit]
- Qiu, H.; Hao, D.; Zeng, Y.; Zhang, X.; Chen, M. Global and northern-high-latitude net ecosystem production in the 21st century from CMIP6 experiments. Earth Syst. Dyn. 2023, 14, 1–16. [Google Scholar] [CrossRef] [Scilit]
- Tang, X.; Fan, S.; Du, M.; Zhang, W.; Gao, S.; Liu, S.; Chen, G.; Yu, Z.; Yang, W. Spatial and temporal patterns of global soil heterotrophic respiration in terrestrial ecosystems. Earth Syst. Sci. Data 2020, 12, 1037–1051. [Google Scholar] [CrossRef] [Scilit]
- Von Buttlar, J.; Zscheischler, J.; Rammig, A.; Sippel, S.; Reichstein, M.; Knohl, A.; Jung, M.; Menzer, O.; Arain, M.A.; Buchmann, N.; et al. Impacts of droughts and extreme-temperature events on gross primary production and ecosystem respiration: A systematic assessment across ecosystems and climate zones. Biogeosciences 2018, 15, 1293–1318. [Google Scholar] [CrossRef] [Scilit]
- Niu, S.; Wu, M.; Han, Y.; Xia, J.; Li, L.; Wan, S. Water-mediated responses of ecosystem carbon fluxes to climatic change in a temperate steppe. New Phytol. 2008, 177, 209–219. [Google Scholar] [CrossRef] [Scilit]
- Farquhar, G.D.; von Caemmerer, S.; Berry, J.A. A biochemical model of photosynthetic CO2 assimilation in leaves of C3 species. Planta 1980, 149, 78–90. [Google Scholar] [CrossRef] [Scilit]
- Sage, R.F.; Kubien, D.S. The temperature response of C3 and C4 photosynthesis. Plant Cell Environ. 2007, 30, 1086–1106. [Google Scholar] [CrossRef] [Scilit]
- Perkins, D.M.; Yvon-Durocher, G.; Demars, B.O.L.; Reiss, J.; Pichler, D.E.; Friberg, N.; Trimmer, M.; Woodward, G. Consistent temperature dependence of respiration across ecosystems contrasting in thermal history. Glob. Change Biol. 2012, 18, 1300–1311. [Google Scholar] [CrossRef] [Scilit]
- Yvon-Durocher, G.; Caffrey, J.M.; Cescatti, A.; Dossena, M.; del Giorgio, P.; Gasol, J.M.; Montoya, J.M.; Pumpanen, J.; Staehr, P.A.; Trimmer, M.; et al. Reconciling the temperature dependence of respiration across timescales and ecosystem types. Nature 2012, 487, 472–476. [Google Scholar] [CrossRef] [Scilit] [PubMed]
- Yan, Y.; Piao, S.; Hammond, W.M.; Chen, A.; Hong, S.; Xu, H.; Munson, S.M.; Myneni, R.B.; Allen, C.D. Climate-induced tree-mortality pulses are obscured by broad-scale and long-term greening. Nat. Ecol. Evol. 2024, 8, 912–923. [Google Scholar] [CrossRef] [Scilit]
- Chen, C.; Park, T.; Wang, X.; Piao, S.; Xu, B.; Chaturvedi, R.K.; Fuchs, R.; Brovkin, V.; Ciais, P.; Fensholt, R.; et al. China and India lead in greening of the world through land-use management. Nat. Sustain. 2019, 2, 122–129. [Google Scholar] [CrossRef] [Scilit]
- Heimann, M.; Reichstein, M. Terrestrial ecosystem carbon dynamics and climate feedbacks. Nature 2008, 451, 289–292. [Google Scholar] [CrossRef] [Scilit] [PubMed]
- Lee, J.-Y.; Chae, N.; Kim, Y.; Yun, J.; Jeong, S.; Choi, T.; Kim, S.-J.; Lee, B.-Y.; Park, S.-J. Differential responses of respiration and photosynthesis to air temperature over a moist tundra ecosystem of Alaska and its impact on changing carbon cycle. Environ. Res. Commun. 2024, 6, 041003. [Google Scholar] [CrossRef] [Scilit]
- Fischer, E.M.; Sippel, S.; Knutti, R. Increasing probability of record-shattering climate extremes. Nat. Clim. Change 2021, 11, 689–695. [Google Scholar] [CrossRef] [Scilit]
- Pendergrass, A.G.; Knutti, R. The uneven nature of daily precipitation and its change. Geophys. Res. Lett. 2018, 45, 11,980–11,988. [Google Scholar] [CrossRef] [Scilit]
- Zeng, X.; Hu, Z.; Chen, A.; Yuan, W.; Hou, G.; Han, D.; Liang, M.; Di, K.; Cao, R.; Luo, D. The global decline in the sensitivity of vegetation productivity to precipitation from 2001 to 2018. Glob. Change Biol. 2022, 28, 6823–6833. [Google Scholar] [CrossRef] [Scilit]
- Zhang, W.; Fan, Z.; Jin, C.; Jiao, Y.; Di, K.; Feng, M.; Lu, Y.; Zhao, K.; Zhao, H.; Hao, S.; et al. Reversal of the sensitivity of vegetation productivity to precipitation in global terrestrial biomes over the recent decade. Agric. For. Meteorol. 2025, 370, 110598. [Google Scholar] [CrossRef] [Scilit]
- Zhang, W.; Chen, W.; Xu, M.; Di, K.; Feng, M.; Wu, L.; Wang, M.; Yang, W.; Xie, H.; Chen, J.; et al. Differences in the sensitivity of gross primary productivity and ecosystem respiration to precipitation. Forests 2025, 16, 153. [Google Scholar] [CrossRef] [Scilit]
- Chen, Z.; Yu, G.; Zhu, X.; Wang, Q.; Niu, S.; Hu, Z. Covariation between gross primary production and ecosystem respiration across space and the underlying mechanisms: A global synthesis. Agric. For. Meteorol. 2015, 203, 180–190. [Google Scholar] [CrossRef] [Scilit]
- Zhang, Q.; Yi, C.; Destouni, G.; Wohlfahrt, G.; Kuzyakov, Y.; Li, R.; Kutter, E.; Chen, D.; Rietkerk, M.; Manzoni, S.; et al. Water limitation regulates positive feedback of increased ecosystem respiration. Nat. Ecol. Evol. 2024, 8, 1870–1876. [Google Scholar] [CrossRef] [Scilit] [PubMed]
- Yang, Z.; Wei, Y.; Fu, G.; Xiao, R.; Chen, J.; Zhang, Y.; Wang, D.; Li, J. Decreased precipitation in the late growing season weakens an ecosystem carbon sink in a semi-arid grassland. J. Appl. Ecol. 2021, 58, 2101–2112. [Google Scholar] [CrossRef] [Scilit]
- Jägermeyr, J.; Gerten, D.; Lucht, W.; Hostert, P.; Migliavacca, M.; Nemani, R. A high-resolution approach to estimating ecosystem respiration at continental scales using operational satellite data. Glob. Change Biol. 2014, 20, 1191–1210. [Google Scholar] [CrossRef] [Scilit]
- Konings, A.G.; Bloom, A.A.; Liu, J.; Parazoo, N.C.; Schimel, D.S.; Bowman, K.W. Global satellite-driven estimates of heterotrophic respiration. Biogeosciences 2019, 16, 2269–2284. [Google Scholar] [CrossRef] [Scilit]
- Pastorello, G.; Trotta, C.; Canfora, E.; Chu, H.; Christianson, D.; Cheah, Y.-W.; Poindexter, C.; Chen, J.; Elbashandy, A.; Humphrey, M.; et al. The FLUXNET2015 dataset and the ONEFlux processing pipeline for eddy covariance data. Sci. Data 2020, 7, 225. [Google Scholar] [CrossRef] [Scilit] [PubMed]
- Stoy, P.C.; Katul, G.G.; Siqueira, M.B.S.; Juang, J.-Y.; Novick, K.A.; Uebelherr, J.M.; Oren, R. An evaluation of models for partitioning eddy covariance-measured net ecosystem exchange into photosynthesis and respiration. Agric. For. Meteorol. 2006, 141, 2–18. [Google Scholar] [CrossRef] [Scilit]
- Bates, D.; Mächler, M.; Bolker, B.; Walker, S. Fitting Linear Mixed-Effects Models Using lme4. J. Stat. Softw. 2015, 67, 1–48. [Google Scholar] [CrossRef] [Scilit]
- Zuur, A.F.; Ieno, E.N.; Walker, N.; Saveliev, A.A.; Smith, G.M. Mixed Effects Models and Extensions in Ecology with R; Springer: New York, NY, USA, 2009. [Google Scholar] [CrossRef] [Scilit]
- McCulloch, C.E.; Searle, S.R. Generalized, Linear, and Mixed Models; John Wiley & Sons: Hoboken, NJ, USA, 2004. [Google Scholar]
- Akinwande, M.O.; Dikko, H.G.; Samson, A. Variance inflation factor: As a condition for the inclusion of suppressor variable(s) in regression analysis. Open J. Stat. 2015, 5, 754–767. [Google Scholar] [CrossRef]
- Lüdecke, D.; Ben-Shachar, M.S.; Patil, I.; Waggoner, P.; Makowski, D. performance: An R package for assessment, comparison and testing of statistical models. J. Open Source Softw. 2021, 6, 3139. [Google Scholar] [CrossRef] [Scilit]
- Searle, E.B.; Chen, H.Y.H. Complementarity effects are strengthened by competition intensity and global environmental change in the central boreal forests of Canada. Ecol. Lett. 2020, 23, 79–87. [Google Scholar] [CrossRef] [Scilit] [PubMed]
- Lai, J.; Zou, Y.; Zhang, S.; Zhang, X.; Mao, L. glmm.hp: An R package for computing individual effect of predictors in generalized linear mixed models. J. Plant Ecol. 2022, 15, 1302–1307. [Google Scholar] [CrossRef] [Scilit]
- Beerling, D.J.; Berner, R.A. Feedbacks and the coevolution of plants and atmospheric CO2. Proc. Natl. Acad. Sci. USA 2005, 102, 1302–1305. [Google Scholar] [CrossRef] [Scilit]
- Gavazov, K.; Albrecht, R.; Buttler, A.; Dorrepaal, E.; Garnett, M.H.; Gogo, S.; Hagedorn, F.; Mills, R.T.E.; Robroek, B.J.M.; Bragazza, L. Vascular plant-mediated controls on atmospheric carbon assimilation and peat carbon decomposition under climate change. Glob. Change Biol. 2018, 24, 3911–3921. [Google Scholar] [CrossRef] [Scilit] [PubMed]
- Neto-Bradley, B.M.; Muir, C.D.; Whitton, J.; Pennell, M.W. Phylogenetic history of vascular plant metabolism revealed using a macroevolutionary common garden. Proc. R. Soc. B Biol. Sci. 2021, 288, 20210605. [Google Scholar] [CrossRef] [Scilit]
- Giling, D.P.; Broadhurst, B.; Dyer, F.; Grace, M.; Joehnk, K.; McInerney, P.J.; Pollino, C.; Rees, G.; Sengupta, A.; Tschierschke, A.; et al. Season and Flow Drive Productivity of a Regulated River. Ecosystems 2025, 28, 5. [Google Scholar] [CrossRef] [Scilit]
- Mathur, S.; Agrawal, D.; Jajoo, A. Photosynthesis: Response to high temperature stress. J. Photochem. Photobiol. B Biol. 2014, 137, 116–126. [Google Scholar] [CrossRef] [Scilit] [PubMed]
- Barba, J.; Cueva, A.; Bahn, M.; Barron-Gafford, G.A.; Bond-Lamberty, B.; Hanson, P.J.; Jaimes, A.; Kulmala, L.; Pumpanen, J.; Scott, R.L.; et al. Comparing ecosystem and soil respiration: Review and key challenges of tower-based and soil measurements. Agric. For. Meteorol. 2018, 249, 434–443. [Google Scholar] [CrossRef] [Scilit]
- Chen, L.-F.; He, Z.-B.; Zhao, W.-Z.; Kong, J.-Q.; Gao, Y. Empirical evidence for microbial regulation of soil respiration in alpine forests. Ecol. Indic. 2021, 126, 107710. [Google Scholar] [CrossRef] [Scilit]
- Nissan, A.; Alcolombri, U.; Peleg, N.; Galili, N.; Jimenez-Martinez, J.; Molnar, P.; Holzner, M. Global warming accelerates soil heterotrophic respiration. Nat. Commun. 2023, 14, 3452. [Google Scholar] [CrossRef] [Scilit]
- Yamori, W. Chapter 12—Photosynthesis and respiration. In Plant Factory, 2nd ed.; Kozai, T., Niu, G., Takagaki, M., Eds.; Academic Press: Cambridge, MA, USA, 2020; pp. 197–206. [Google Scholar] [CrossRef] [Scilit]
- Baca Cabrera, J.C.; Hirl, R.T.; Schäufele, R.; Macdonald, A.; Schnyder, H. Stomatal conductance limited the CO2 response of grassland in the last century. BMC Biol. 2021, 19, 50. [Google Scholar] [CrossRef] [Scilit]
- Lawson, T.; Vialet-Chabrand, S. Speedy stomata, photosynthesis and plant water use efficiency. New Phytol. 2019, 221, 93–98. [Google Scholar] [CrossRef] [Scilit]
- Wong, S.C.; Cowan, I.R.; Farquhar, G.D. Stomatal conductance correlates with photosynthetic capacity. Nature 1979, 282, 424–426. [Google Scholar] [CrossRef] [Scilit]
- Li, W.; Zhang, Y.; Zhang, X.; He, Y.; Hou, G.; Shen, R.; Xia, J.; Zheng, J.; Jiang, Q.; Zhu, J. The drivers of respiration shift from soil nutrients to water with the increase in temperature. Funct. Ecol. 2025, 39, 2790–2802. [Google Scholar] [CrossRef] [Scilit]
- Liberati, D.; Guidolotti, G.; de Dato, G.; De Angelis, P. Enhancement of ecosystem carbon uptake in a dry shrubland under moderate warming: The role of nitrogen-driven changes in plant morphology. Glob. Change Biol. 2021, 27, 5629–5642. [Google Scholar] [CrossRef] [Scilit]
- Cantarel, A.A.M.; Bloor, J.M.G.; Pommier, T.; Guillaumaud, N.; Moirot, C.; Soussana, J.; Poly, F. Four years of experimental climate change modifies the microbial drivers of N2O fluxes in an upland grassland ecosystem. Glob. Change Biol. 2012, 18, 2520–2531. [Google Scholar] [CrossRef] [Scilit]
- Bai, E.; Li, S.; Xu, W.; Li, W.; Dai, W.; Jiang, P. A meta-analysis of experimental warming effects on terrestrial nitrogen pools and dynamics. New Phytol. 2013, 199, 441–451. [Google Scholar] [CrossRef] [Scilit] [PubMed]
- Maes, S.L.; Dietrich, J.; Midolo, G.; Schwieger, S.; Kummu, M.; Vandvik, V.; Aerts, R.; Althuizen, I.H.J.; Biasi, C.; Björk, R.G.; et al. Environmental drivers of increased ecosystem respiration in a warming tundra. Nature 2024, 629, 105–113. [Google Scholar] [CrossRef] [Scilit] [PubMed]
- Carbone, M.S.; Still, C.J.; Ambrose, A.R.; Dawson, T.E.; Williams, A.P.; Boot, C.M.; Schaeffer, S.M.; Schimel, J.P. Seasonal and episodic moisture controls on plant and microbial contributions to soil respiration. Oecologia 2011, 167, 265–278. [Google Scholar] [CrossRef] [Scilit]
- Salazar-Villegas, A.; Blagodatskaya, E.; Dukes, J.S. Changes in the size of the active microbial pool explain short-term soil respiratory responses to temperature and moisture. Front. Microbiol. 2016, 7, 524. [Google Scholar] [CrossRef] [Scilit]
- Grossiord, C.; Buckley, T.N.; Cernusak, L.A.; Novick, K.A.; Poulter, B.; Siegwolf, R.T.W.; Sperry, J.S.; McDowell, N.G. Plant responses to rising vapor pressure deficit. New Phytol. 2020, 226, 1550–1566. [Google Scholar] [CrossRef] [Scilit]
- Schönbeck, L.C.; Schuler, P.; Lehmann, M.M.; Mas, E.; Mekarni, L.; Pivovaroff, A.L.; Turberg, P.; Grossiord, C. Increasing temperature and vapour pressure deficit lead to hydraulic damages in the absence of soil drought. Plant Cell Environ. 2022, 45, 3275–3289. [Google Scholar] [CrossRef] [Scilit]
- Renger, G.; Renger, T. Photosystem II: The machinery of photosynthetic water splitting. Photosynth. Res. 2008, 98, 53–80. [Google Scholar] [CrossRef] [Scilit]
- Zhang, Y.; Fang, J.; Smith, W.K.; Wang, X.; Gentine, P.; Scott, R.L.; Migliavacca, M.; Jeong, S.; Litvak, M.; Zhou, S. Satellite solar-induced chlorophyll fluorescence tracks physiological drought stress development during 2020 southwest US drought. Glob. Change Biol. 2023, 29, 3395–3408. [Google Scholar] [CrossRef] [Scilit]
- Zhong, Z.; He, B.; Wang, Y.-P.; Chen, H.W.; Chen, D.; Fu, Y.H.; Chen, Y.; Guo, L.; Deng, Y.; Huang, L.; et al. Disentangling the effects of vapor pressure deficit on northern terrestrial vegetation productivity. Sci. Adv. 2023, 9, eadf3166. [Google Scholar] [CrossRef] [Scilit]
- Chitra-Tarak, R.; Xu, C.; Aguilar, S.; Anderson-Teixeira, K.J.; Chambers, J.; Detto, M.; Faybishenko, B.; Fisher, R.A.; Knox, R.G.; Koven, C.D.; et al. Hydraulically-vulnerable trees survive on deep-water access during droughts in a tropical forest. New Phytol. 2021, 231, 1798–1813. [Google Scholar] [CrossRef] [Scilit] [PubMed]
- Roby, M.C.; Scott, R.L.; Moore, D.J.P. High vapor pressure deficit decreases the productivity and water use efficiency of rain-induced pulses in semiarid ecosystems. J. Geophys. Res. Biogeosci. 2020, 125, e2020JG005665. [Google Scholar] [CrossRef] [Scilit]
- Bai, Y.; Jing, C.; Liu, Y.; Wang, Y. Vapor Pressure Deficit Thresholds and Their Impacts on Gross Primary Productivity in Xinjiang Arid Grassland Ecosystems. Sustainability 2025, 17, 6261. [Google Scholar] [CrossRef] [Scilit]
- Wang, Y.; Sun, Y.; Chen, Y.; Wu, C.; Huang, C.; Li, C.; Tang, X. Non-linear correlations exist between solar-induced chlorophyll fluorescence and canopy photosynthesis in a subtropical evergreen forest in Southwest China. Ecol. Indic. 2023, 157, 111311. [Google Scholar] [CrossRef] [Scilit]
- Fu, Z.; Ciais, P.; Prentice, I.C.; Gentine, P.; Makowski, D.; Bastos, A.; Luo, X.; Green, J.K.; Stoy, P.C.; Yang, H.; et al. Atmospheric dryness reduces photosynthesis along a large range of soil water deficits. Nat. Commun. 2022, 13, 989. [Google Scholar] [CrossRef] [Scilit]
- Xu, S.; Gentine, P.; Li, L.; Wang, L.; Yu, Z.; Dong, N.; Ju, Q.; Zhang, Y. Response of ecosystem productivity to high vapor pressure deficit and low soil moisture: Lessons learned from the global eddy-covariance observations. Earth’s Future 2023, 11, e2022EF003252. [Google Scholar] [CrossRef] [Scilit]
- Bloomfield, K.J.; Stocker, B.D.; Keenan, T.F.; Prentice, I.C. Environmental controls on the light use efficiency of terrestrial gross primary production. Glob. Change Biol. 2023, 29, 1037–1053. [Google Scholar] [CrossRef] [Scilit] [PubMed]
- Lawson, T.; Blatt, M.R. Stomatal size, speed, and responsiveness impact on photosynthesis and water use efficiency. Plant Physiol. 2014, 164, 1556–1570. [Google Scholar] [CrossRef] [Scilit] [PubMed]
- Flach, M.; Brenning, A.; Gans, F.; Reichstein, M.; Sippel, S.; Mahecha, M.D. Vegetation modulates the impact of climate extremes on gross primary production. Biogeosciences 2021, 18, 39–53. [Google Scholar] [CrossRef] [Scilit]
- Guo, R.; Chen, T.; Chen, X.; Yuan, W.; Liu, S.; He, B.; Li, L.; Wang, S.; Hu, T.; Yan, Q.; et al. Estimating global GPP from the plant functional type perspective using a machine learning approach. J. Geophys. Res. Biogeosci. 2023, 128, e2022JG007100. [Google Scholar] [CrossRef] [Scilit]
- Xie, X.; Li, A.; Tan, J.; Jin, H.; Nan, X.; Zhang, Z.; Bian, J.; Lei, G. Assessments of gross primary productivity estimations with satellite data-driven models using eddy covariance observation sites over the northern hemisphere. Agric. For. Meteorol. 2020, 280, 107771. [Google Scholar] [CrossRef] [Scilit]
- Mahecha, M.D.; Reichstein, M.; Carvalhais, N.; Lasslop, G.; Lange, H.; Seneviratne, S.I.; Vargas, R.; Ammann, C.; Arain, M.A.; Cescatti, A.; et al. Global convergence in the temperature sensitivity of respiration at ecosystem level. Science 2010, 329, 838–840. [Google Scholar] [CrossRef] [Scilit]
- Niu, B.; Zhang, X.; Piao, S.; Janssens, I.A.; Fu, G.; He, Y.; Zhang, Y.; Shi, P.; Dai, E.; Yu, C.; et al. Warming homogenizes apparent temperature sensitivity of ecosystem respiration. Sci. Adv. 2021, 7, eabc7358. [Google Scholar] [CrossRef] [Scilit]
- Janssens, I.A.; Lankreijer, H.; Matteucci, G.; Kowalski, A.S.; Buchmann, N.; Epron, D.; Pilegaard, K.; Kutsch, W.; Longdoz, B.; Grünwald, T.; et al. Productivity overshadows temperature in determining soil and ecosystem respiration across European forests. Glob. Change Biol. 2001, 7, 269–278. [Google Scholar] [CrossRef] [Scilit]
- Law, B.E.; Ryan, M.G.; Anthoni, P.M. Seasonal and annual respiration of a ponderosa pine ecosystem. Glob. Change Biol. 1999, 5, 169–182. [Google Scholar] [CrossRef] [Scilit]
- Schimel, D.S.; House, J.I.; Hibbard, K.A.; Bousquet, P.; Ciais, P.; Peylin, P.; Braswell, B.H.; Apps, M.J.; Baker, D.; Bondeau, A.; et al. Recent patterns and mechanisms of carbon exchange by terrestrial ecosystems. Nature 2001, 414, 169–172. [Google Scholar] [CrossRef] [Scilit] [PubMed]
- Wang, X.; Piao, S.; Ciais, P.; Janssens, I.A.; Reichstein, M.; Peng, S.; Wang, T. Are ecological gradients in seasonal Q10 of soil respiration explained by climate or by vegetation seasonality. Soil Biol. Biochem. 2010, 42, 1728–1734. [Google Scholar] [CrossRef] [Scilit]
- Zhou, T.; Shi, P.; Hui, D.; Luo, Y. Global pattern of temperature sensitivity of soil heterotrophic respiration (Q10) and its implications for carbon-climate feedback. J. Geophys. Res. Biogeosci. 2009, 114, G02016. [Google Scholar] [CrossRef] [Scilit]
- Davidson, E.A.; Janssens, I.A. Temperature sensitivity of soil carbon decomposition and feedbacks to climate change. Nature 2006, 440, 165–173. [Google Scholar] [CrossRef] [Scilit] [PubMed]
- Jackson, R.B.; Lajtha, K.; Crow, S.E.; Hugelius, G.; Kramer, M.G.; Piñeiro, G. The ecology of soil carbon: Pools, vulnerabilities, and biotic and abiotic controls. Annu. Rev. Ecol. Evol. Syst. 2017, 48, 419–445. [Google Scholar] [CrossRef] [Scilit]
- Von Lützow, M.; Kögel-Knabner, I. Temperature sensitivity of soil organic matter decomposition—What do we know? Biol. Fertil. Soils 2009, 46, 1–15. [Google Scholar] [CrossRef] [Scilit]
- Wu, T.; Tissue, D.T.; Jiang, M.; Slot, M.; Crous, K.Y.; Yuan, J.; Liu, J.; Jin, S.; Wu, C.; Deng, Y.; et al. Leaf photosynthetic and respiratory thermal acclimation in terrestrial plants in response to warming: A global synthesis. Glob. Change Biol. 2025, 31, e70026. [Google Scholar] [CrossRef] [Scilit]
- Bennett, A.C.; Arndt, S.K.; Bennett, L.T.; Knauer, J.; Beringer, J.; Griebel, A.; Hinko-Najera, N.; Liddell, M.J.; Metzen, D.; Pendall, E.; et al. Thermal optima of gross primary productivity are closely aligned with mean air temperatures across Australian wooded ecosystems. Glob. Change Biol. 2021, 27, 4727–4744. [Google Scholar] [CrossRef] [Scilit]
- Bennett, A.C.; Knauer, J.; Bennett, L.T.; Haverd, V.; Arndt, S.K. Variable influence of photosynthetic thermal acclimation on future carbon uptake in Australian wooded ecosystems under climate change. Glob. Change Biol. 2024, 30, e17021. [Google Scholar] [CrossRef] [Scilit] [PubMed]
- Scafaro, A.P.; Xiang, S.; Long, B.M.; Bahar, N.H.A.; Weerasinghe, L.K.; Creek, D.; Evans, J.R.; Reich, P.B.; Atkin, O.K. Strong thermal acclimation of photosynthesis in tropical and temperate wet-forest tree species: The importance of altered Rubisco content. Glob. Change Biol. 2017, 23, 2783–2800. [Google Scholar] [CrossRef] [Scilit]
- Kattge, J.; Knorr, W. Temperature acclimation in a biochemical model of photosynthesis: A reanalysis of data from 36 species. Plant Cell Environ. 2007, 30, 1176–1190. [Google Scholar] [CrossRef] [Scilit] [PubMed]
- Way, D.A.; Oren, R. Differential responses to changes in growth temperature between trees from different functional groups and biomes: A review and synthesis of data. Tree Physiol. 2010, 30, 669–688. [Google Scholar] [CrossRef] [Scilit] [PubMed]
- Crous, K.Y.; Uddling, J.; De Kauwe, M.G. Temperature responses of photosynthesis and respiration in evergreen trees from boreal to tropical latitudes. New Phytol. 2022, 234, 353–374. [Google Scholar] [CrossRef] [Scilit]
- Dusenge, M.E.; Duarte, A.G.; Way, D.A. Plant carbon metabolism and climate change: Elevated CO2 and temperature impacts on photosynthesis, photorespiration and respiration. New Phytol. 2019, 221, 32–49. [Google Scholar] [CrossRef] [Scilit]
- Tan, Z.-H.; Zeng, J.; Zhang, Y.-J.; Slot, M.; Gamo, M.; Hirano, T.; Kosugi, Y.; da Rocha, H.R.; Saleska, S.R.; Goulden, M.L.; et al. Optimum air temperature for tropical forest photosynthesis: Mechanisms involved and implications for climate warming. Environ. Res. Lett. 2017, 12, 054022. [Google Scholar] [CrossRef] [Scilit]
- Chen, Y.; Zhu, Z.; Zhao, W.; Li, M.; Cao, S.; Zheng, Y.; Tian, F.; Myneni, R.B. The direct and indirect effects of the environmental factors on global terrestrial gross primary productivity over the past four decades. Environ. Res. Lett. 2023, 19, 014052. [Google Scholar] [CrossRef] [Scilit]
- Fang, Z.; Zhang, W.; Wang, L.; Schurgers, G.; Ciais, P.; Peñuelas, J.; Brandt, M.; Yang, H.; Huang, K.; Shen, Q.; et al. Global increase in the optimal temperature for the productivity of terrestrial ecosystems. Commun. Earth Environ. 2024, 5, 466. [Google Scholar] [CrossRef] [Scilit]
- Li, M.-W.; Zhang, J.; Wu, Z.-F.; Fu, Y.-S. Effect of growing season length on gross primary productivity increased in the Jinsha River watershed. J. Plant Ecol. 2025, 18, rtae108. [Google Scholar] [CrossRef] [Scilit]
- Kuai, L.; Parazoo, N.C.; Shi, M.; Miller, C.E.; Baker, I.; Bloom, A.A.; Bowman, K.; Lee, M.; Zeng, Z.; Commane, R.; et al. Quantifying northern high latitude gross primary productivity (GPP) using carbonyl sulfide (OCS). Glob. Biogeochem. Cycles 2022, 36, e2021GB007216. [Google Scholar] [CrossRef] [Scilit] [PubMed]
- Wang, A.; Zhang, M.; Chen, E.; Zhang, C.; Han, Y. Impact of seasonal global land surface temperature (LST) change on gross primary production (GPP) in the early 21st century. Sustain. Cities Soc. 2024, 110, 105572. [Google Scholar] [CrossRef] [Scilit]
- Gatti, L.V.; Gloor, M.; Miller, J.B.; Doughty, C.E.; Malhi, Y.; Domingues, L.G.; Basso, L.S.; Martinewski, A.; Correia, C.S.C.; Borges, V.F.; et al. Drought sensitivity of Amazonian carbon balance revealed by atmospheric measurements. Nature 2014, 506, 76–80. [Google Scholar] [CrossRef] [Scilit] [PubMed]
- Malhi, Y.; Aragão, L.E.O.C.; Galbraith, D.; Huntingford, C.; Fisher, R.; Zelazowski, P.; Sitch, S.; McSweeney, C.; Meir, P. Exploring the likelihood and mechanism of a climate-change-induced dieback of the Amazon rainforest. Proc. Natl. Acad. Sci. USA 2009, 106, 20610–20615. [Google Scholar] [CrossRef] [Scilit]
- Wu, J.; Guan, K.; Hayek, M.; Restrepo-Coupe, N.; Wiedemann, K.T.; Xu, X.; Wehr, R.; Christoffersen, B.O.; Miao, G.; da Silva, R.; et al. Partitioning controls on Amazon forest photosynthesis between environmental and biotic factors at hourly to interannual timescales. Glob. Change Biol. 2017, 23, 1240–1257. [Google Scholar] [CrossRef] [Scilit]
- Harrison, X.A.; Donaldson, L.; Correa-Cano, M.E.; Evans, J.; Fisher, D.N.; Goodwin, C.E.D.; Robinson, B.S.; Hodgson, D.J.; Inger, R. A brief introduction to mixed effects modelling and multi-model inference in ecology. PeerJ 2018, 6, e4794. [Google Scholar] [CrossRef] [Scilit]
- Harrison, X.A. A comparison of observation-level random effect and Beta-Binomial models for modelling overdispersion in Binomial data in ecology & evolution. PeerJ 2015, 3, e1114. [Google Scholar] [CrossRef] [Scilit]
- Gelman, A.; Hill, J. Data Analysis Using Regression and Multilevel/Hierarchical Models; Cambridge University Press: Cambridge, UK, 2007. [Google Scholar]

Disclaimer/Publisher’s Note: The statements, opinions and data contained in all publications are solely those of the individual author(s) and contributor(s) and not of MDPI and/or the editor(s). MDPI and/or the editor(s) disclaim responsibility for any injury to people or property resulting from any ideas, methods, instructions or products referred to in the content. |
© 2026 by the authors. Licensee MDPI, Basel, Switzerland. This article is an open access article distributed under the terms and conditions of the Creative Commons Attribution (CC BY) license.