


Appl. Sci. 2024, 14(12), 5350; https://doi.org/10.3390/app14125350 - 20 Jun 2024
Cited by 5 | Viewed by 2075
Abstract
►
Show Figures
Seismic vulnerability assessment is one of the most impactful engineering challenges faced by modern societies. Thus, authorities require a reliable tool that has the potential to rank given structures according to their seismic vulnerability. Various countries and organizations over the past decades have
[...] Read more.
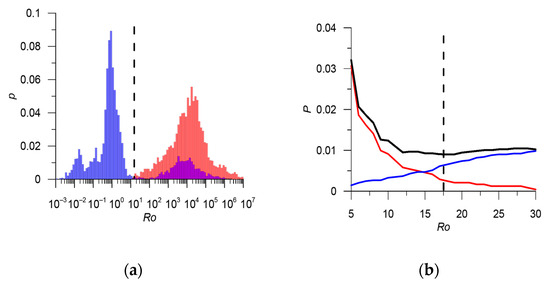
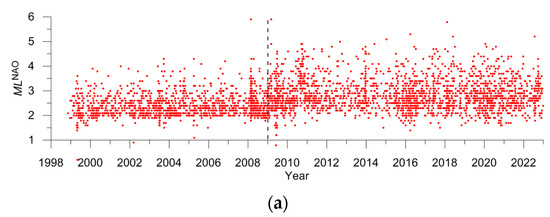
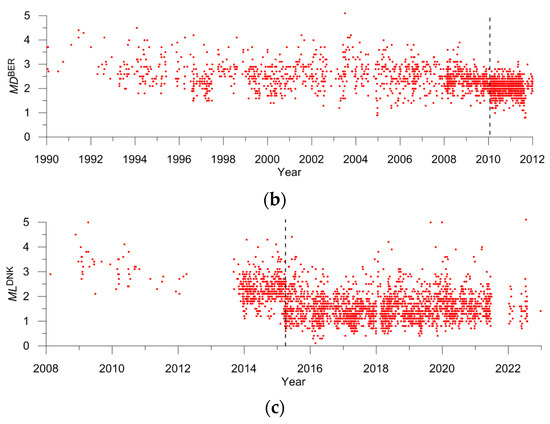
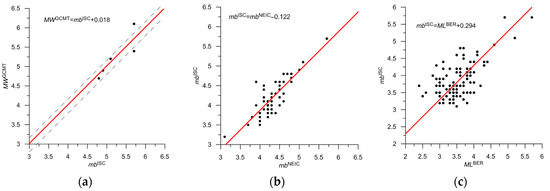
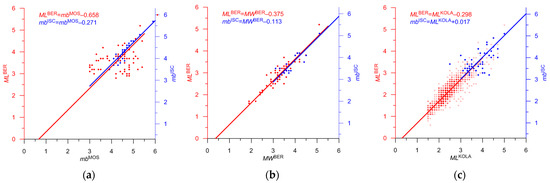
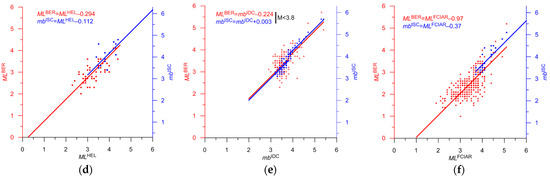
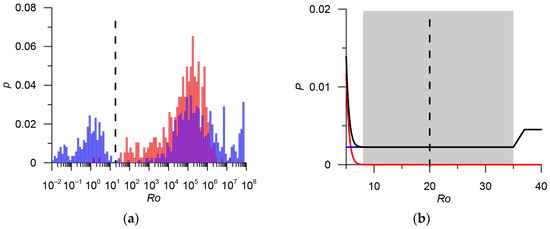
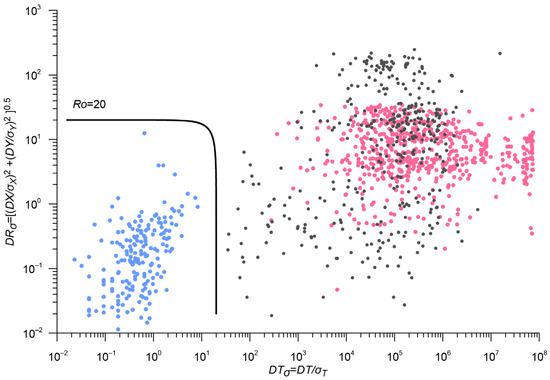
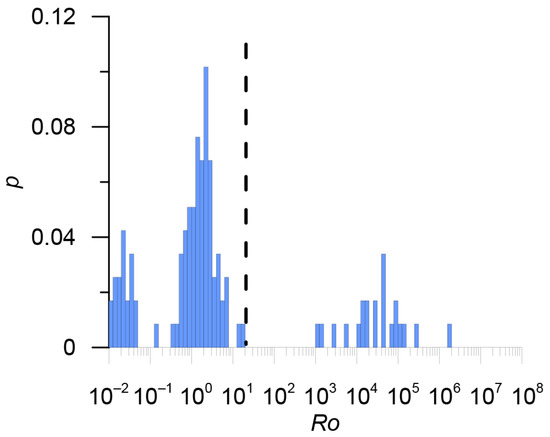
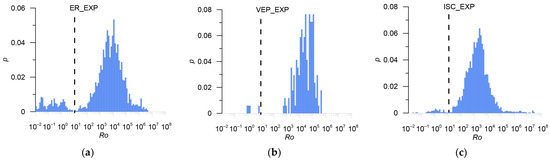
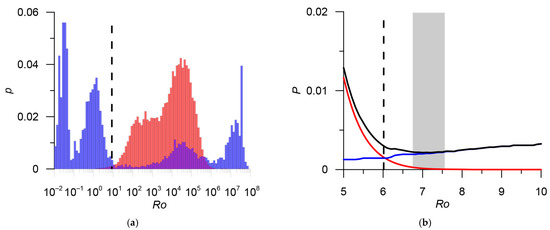
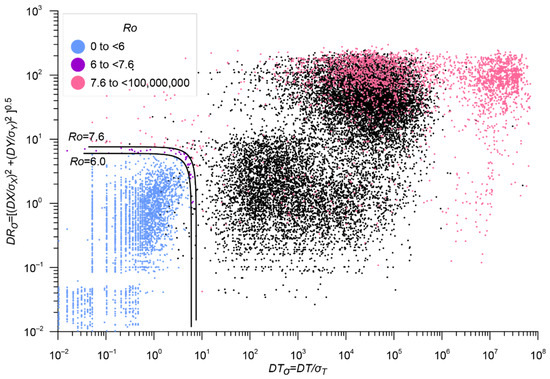
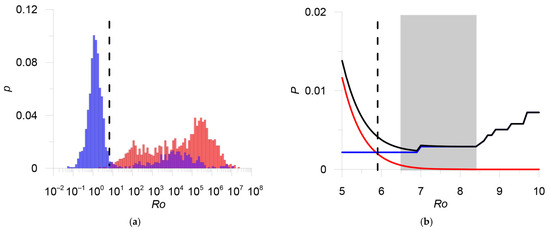
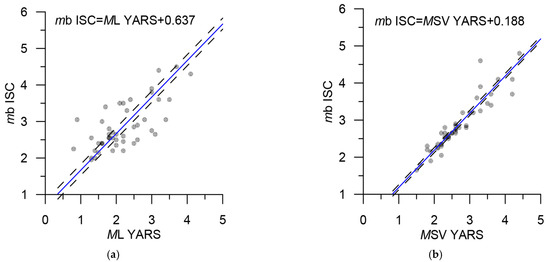
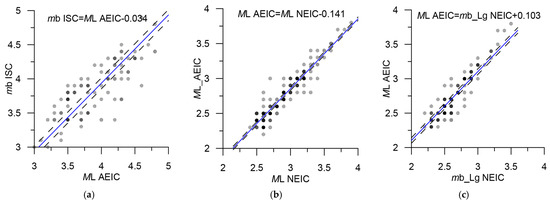
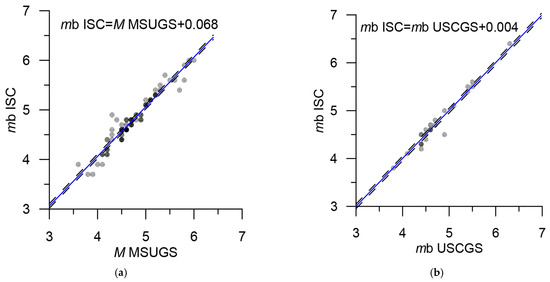
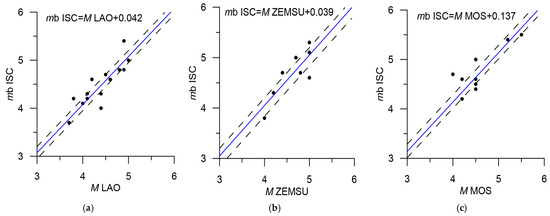
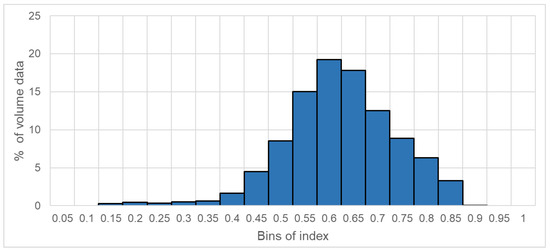
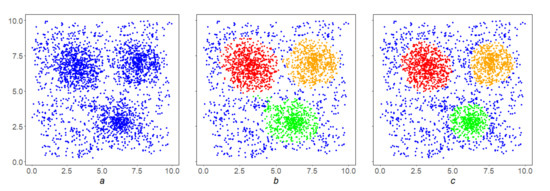
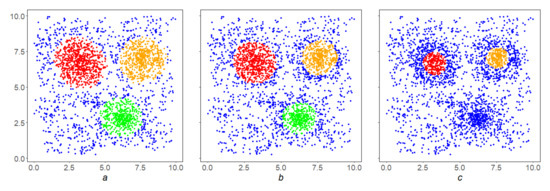
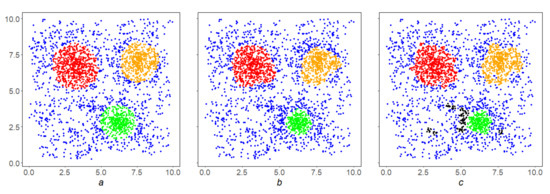
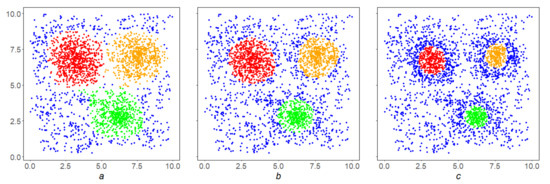
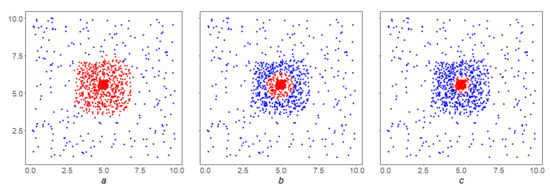
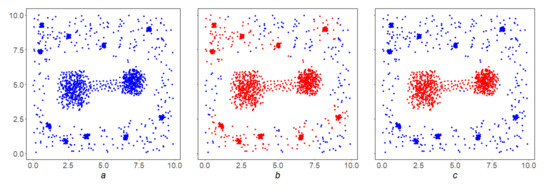
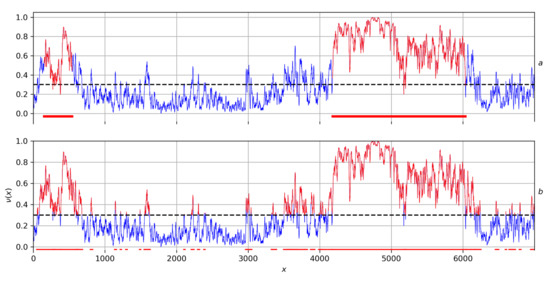
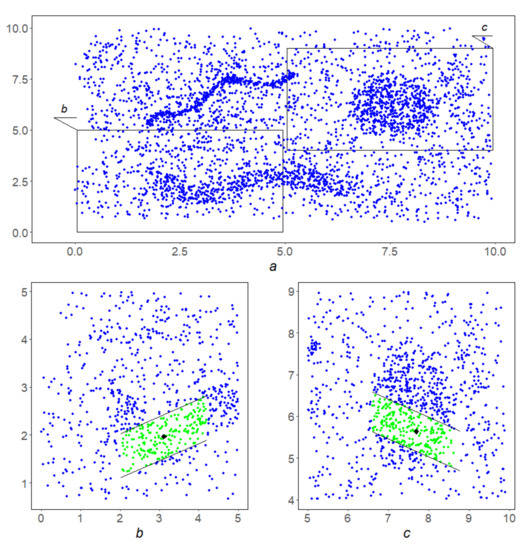
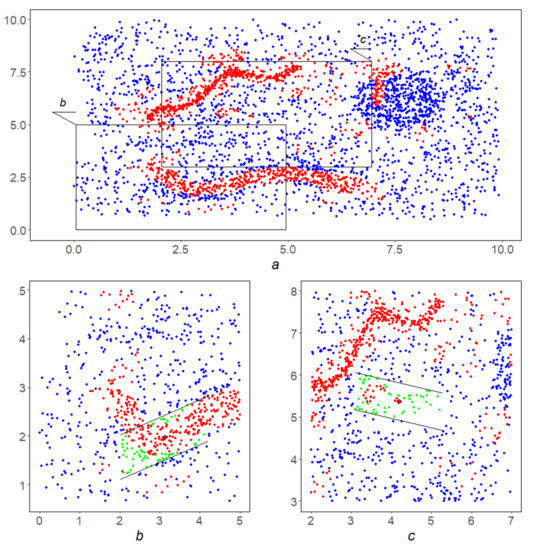
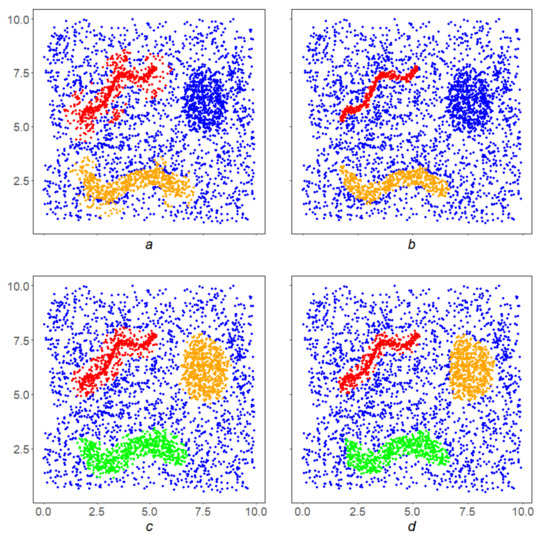
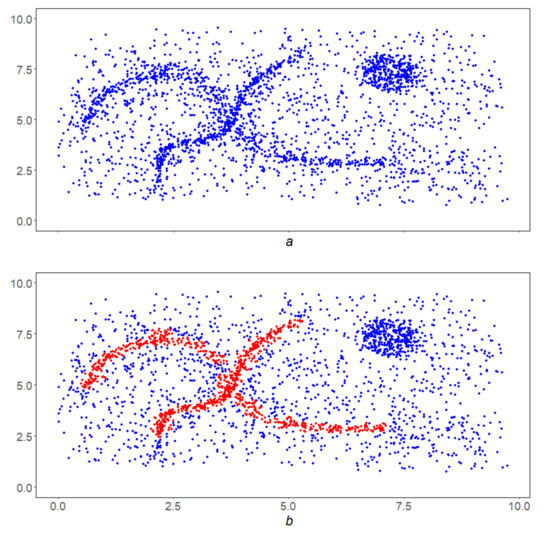
Seismic vulnerability assessment is one of the most impactful engineering challenges faced by modern societies. Thus, authorities require a reliable tool that has the potential to rank given structures according to their seismic vulnerability. Various countries and organizations over the past decades have developed Rapid Visual Screening (RVS) tools aiming to efficiently estimate vulnerability indices. In general, RVS tools employ a set of structural features and their associated weights to obtain a vulnerability index, which can be used for ranking. In this paper, Machine Learning (ML) models are implemented within this framework. The proposed formulation is used to train binary classifiers in conjunction with ad hoc rules, employing the features of various Codes (e.g., the Federal Emergency Management Agency, New Zealand, and Canada). The efficiency of this modeling effort is evaluated for each Code separately and it is clearly demonstrated that ML-based models are capable of outperforming currently established engineering practices. Furthermore, in the spirit of the aforementioned Codes, a linearization of the fully trained ML model is proposed. ML feature attribution techniques, namely SHapley Additive exPlanations (SHAP) are employed to introduce weights similar to engineering practices. The promising results motivate the potential applicability of this methodology towards the recalibration of the RVS procedures for various types of cases.
Full article

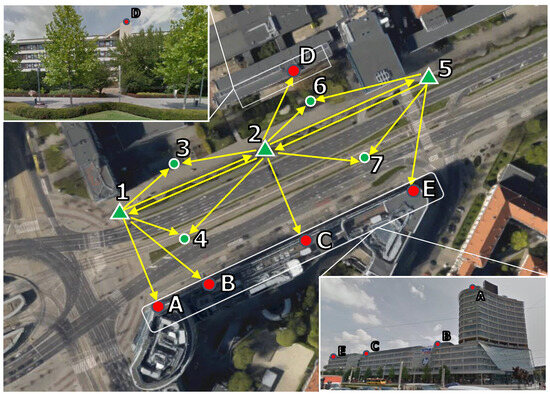
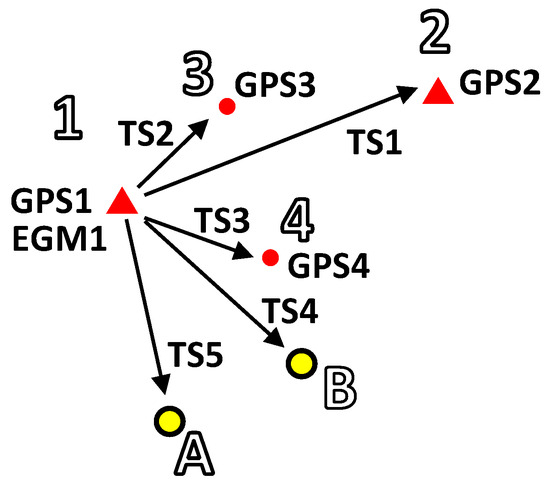
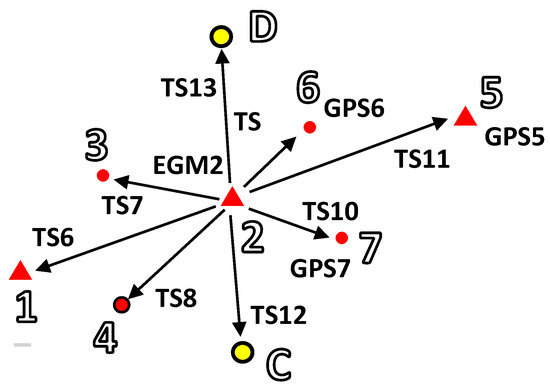
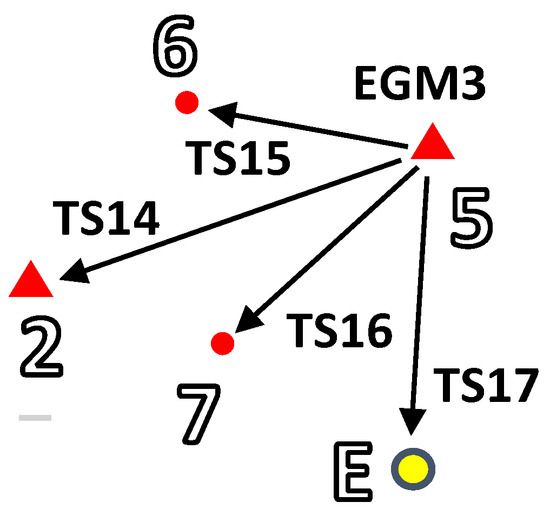
Figure 1


