
Integrated Earthquake Catalog II: The Western Sector of the Russian Arctic


 ,
,  , ,
, ,
Abstract
1. Introduction
- The sequential merging of two regional catalogs of GS RAS, the ISC catalog, and the catalog from [24], identifying duplicates that arise during merging and excluding explosions and other anthropogenic events from the final catalog;
- The unification of magnitude estimates in the integrated catalog by constructing correlation ratios for different types of magnitude/energy class for the same events.
2. Materials and Methods
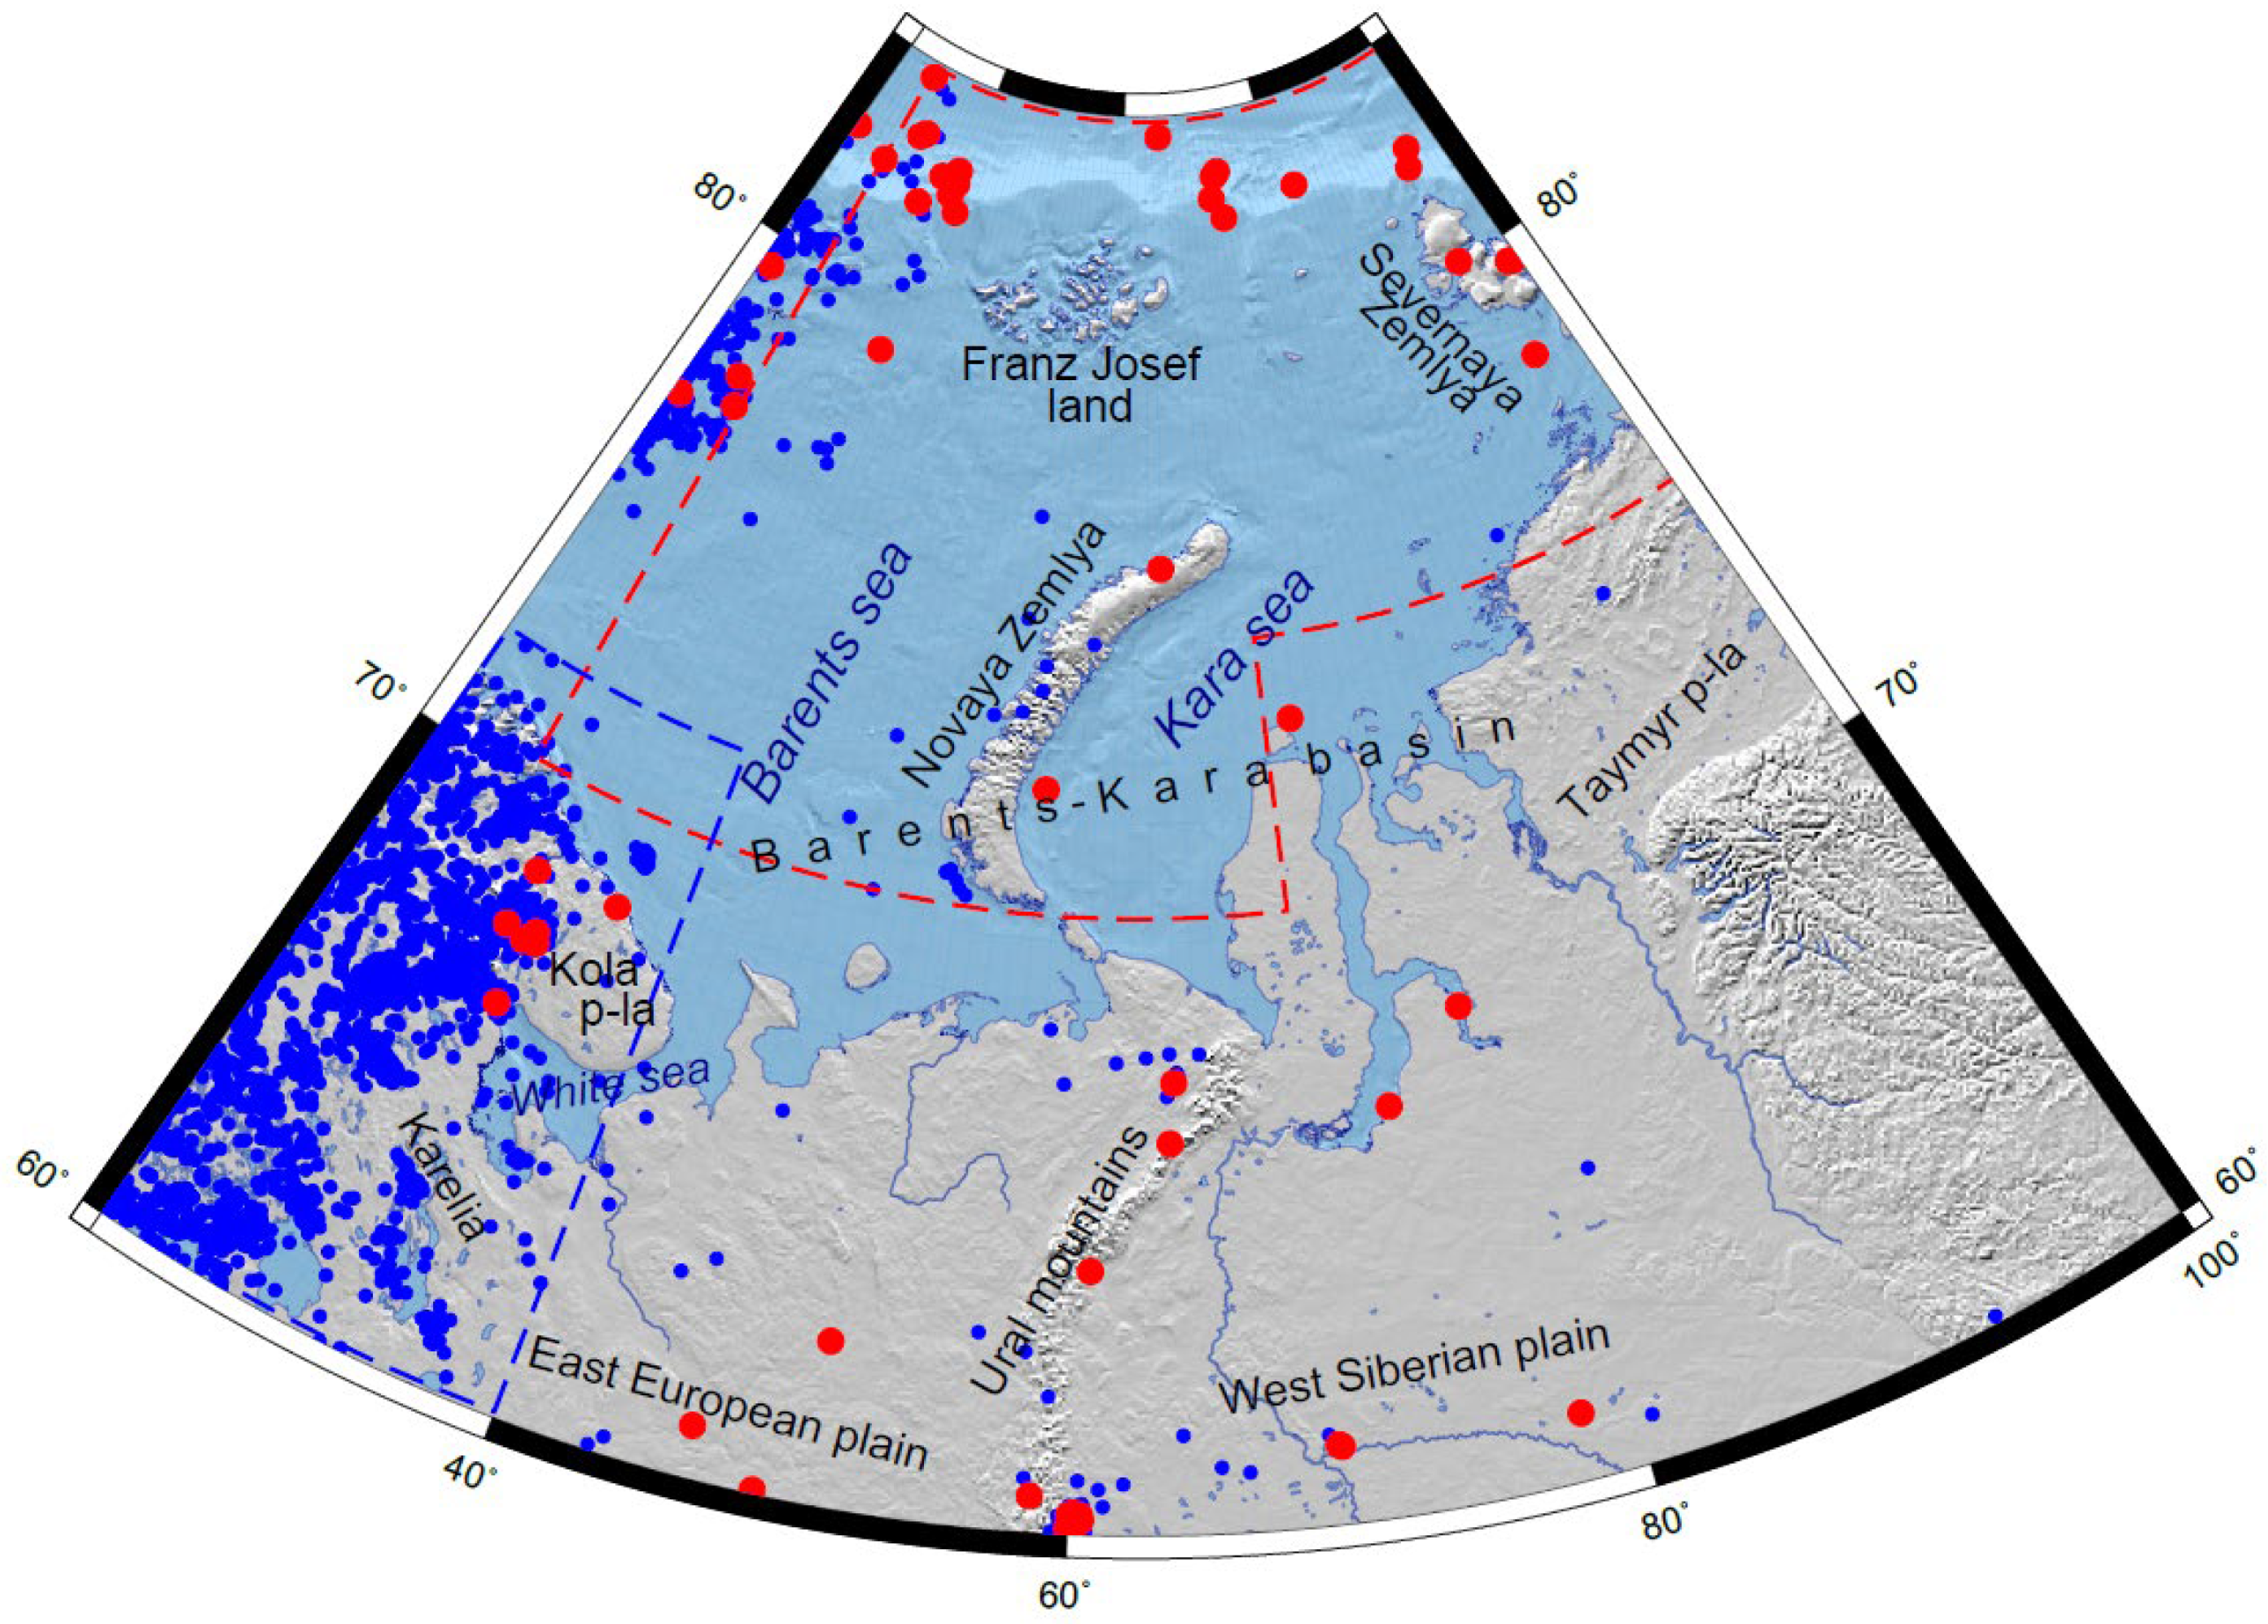
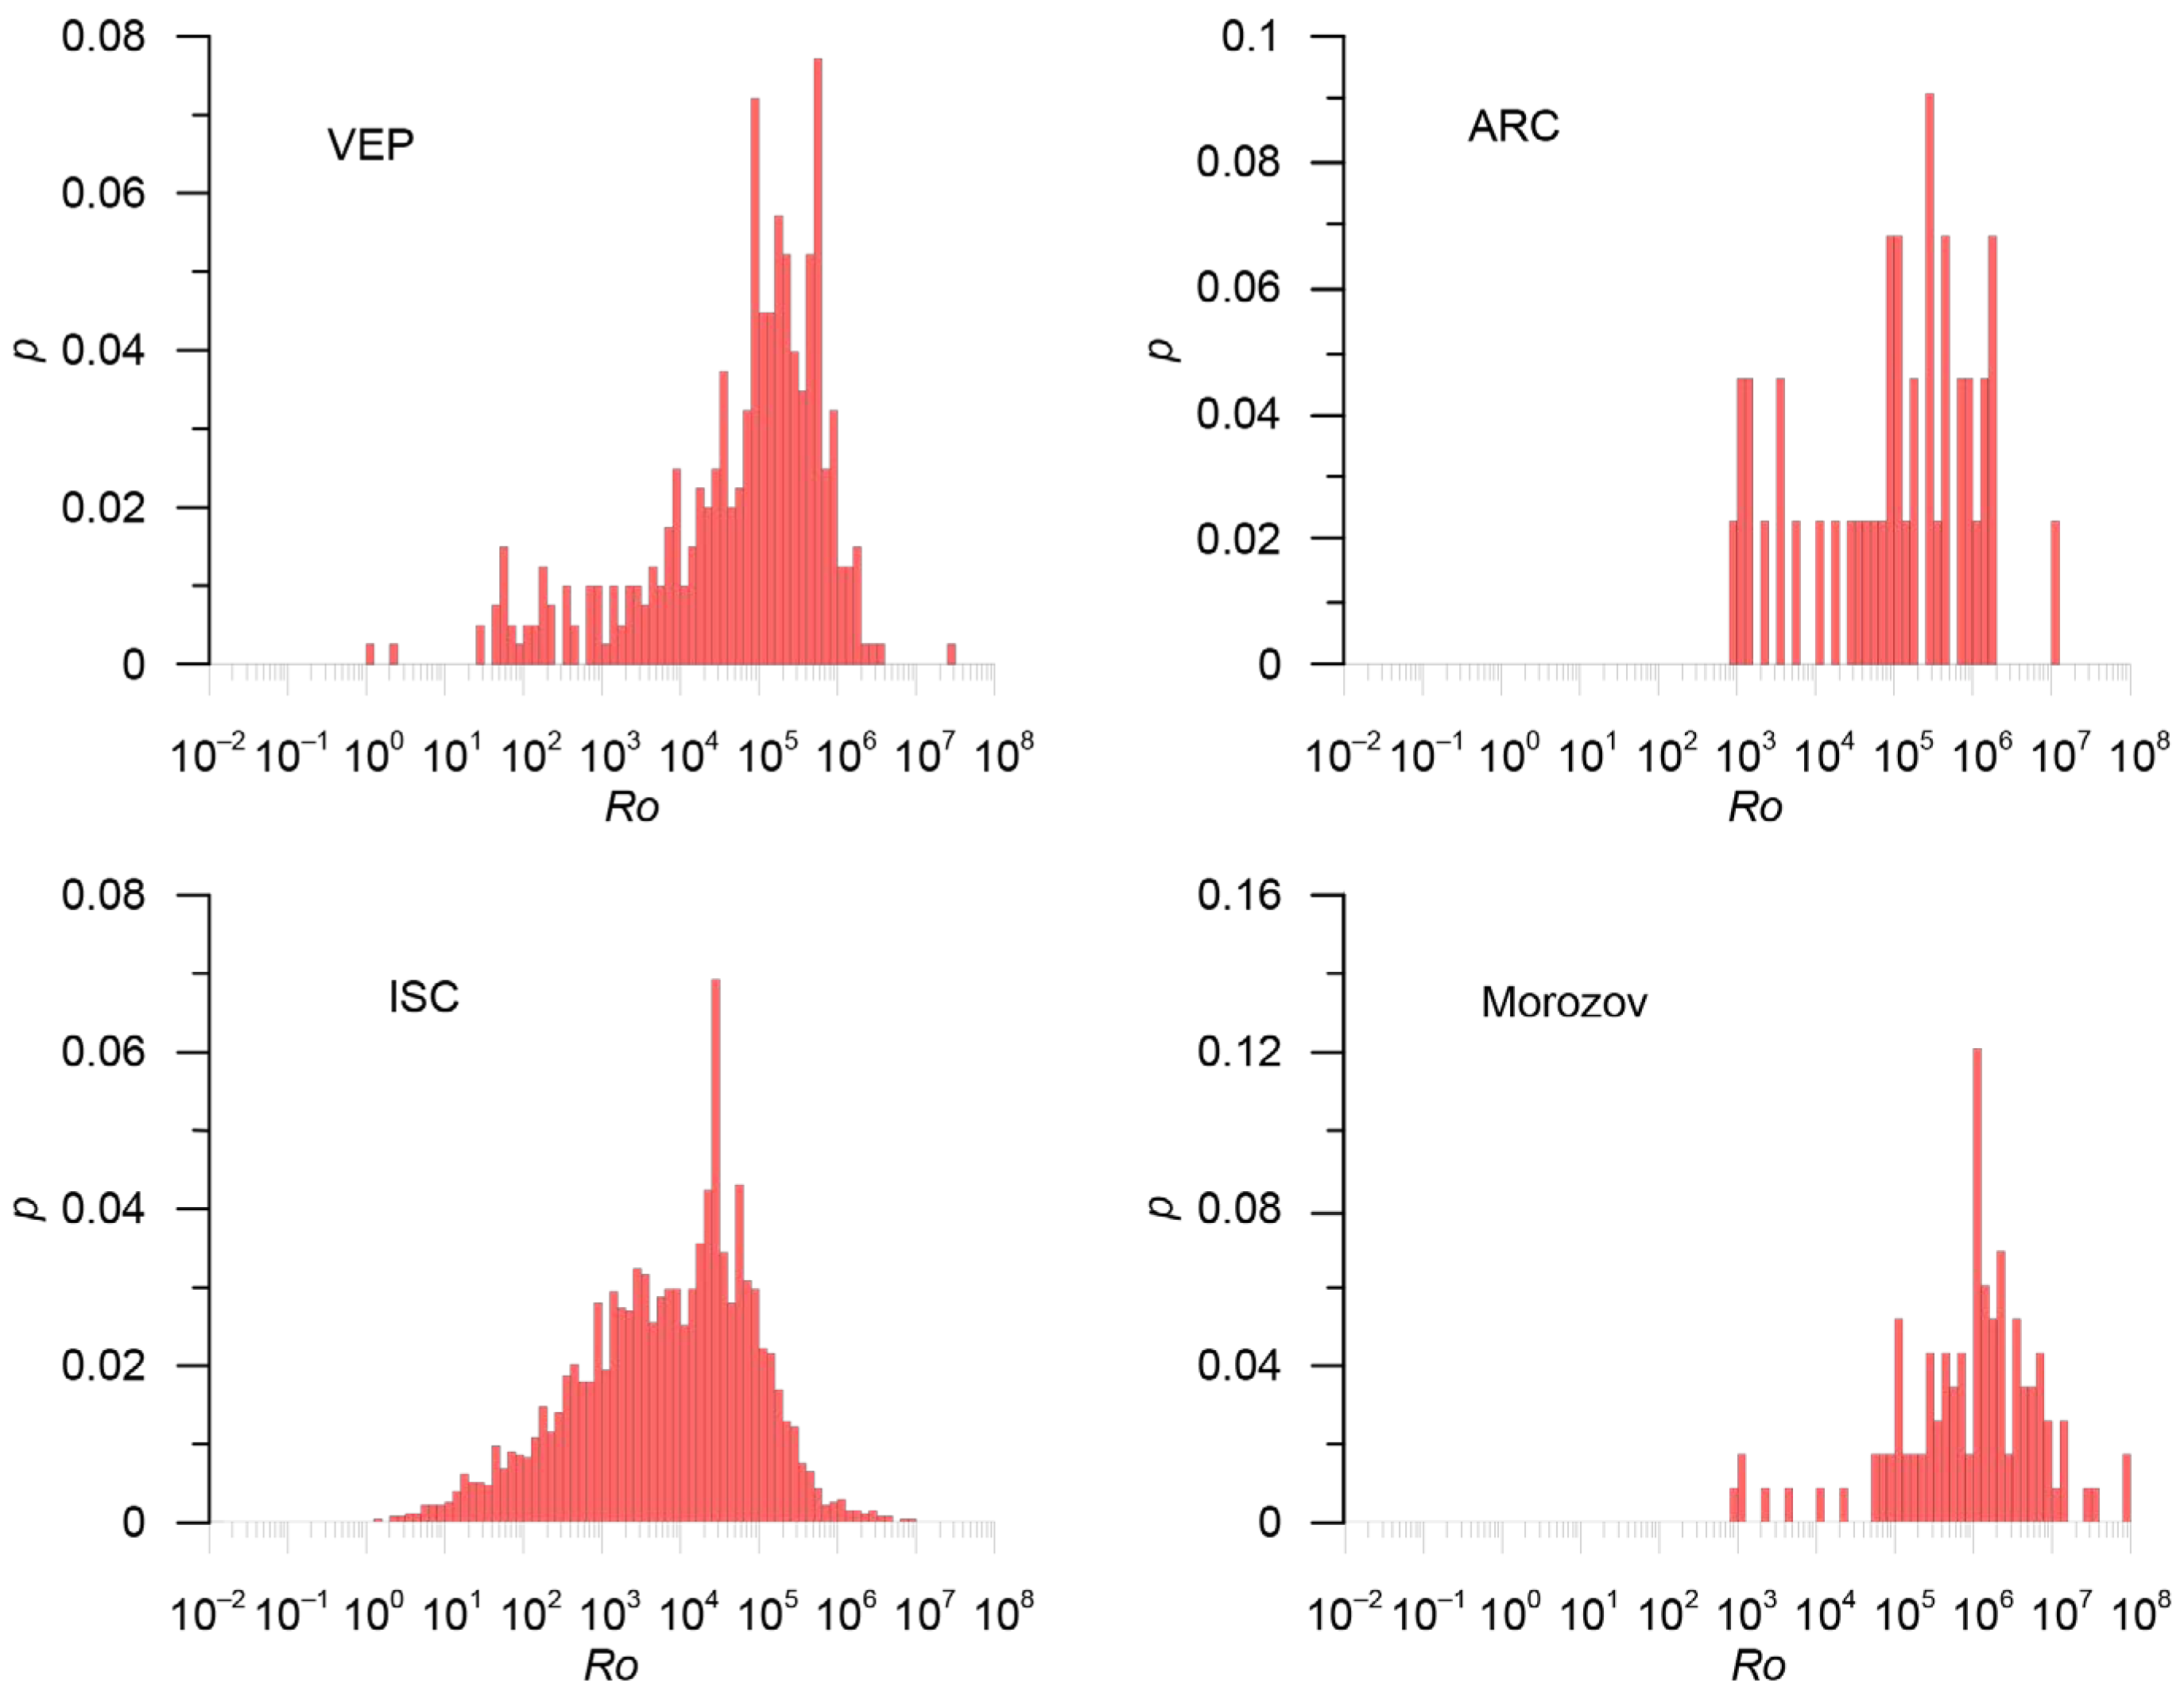
- The Arctic catalog from the annual journals Earthquakes in the USSR 1962–1991, Earthquakes in Northern Eurasia 1992–2017, and Earthquakes in Russia 2018–2020 (hereinafter ARC);
- The merged earthquake catalog of the territory of the East European platform and its nearest surroundings from the annual journals Earthquakes in the USSR 1962–1991, Earthquakes in Northern Eurasia 1992–2017, and Earthquakes in Russia 2018–2020 (hereinafter VEP);
- The ISC 1962–2022 catalog, which is a composite and contains data from many world and also Russian agencies (Table 2);
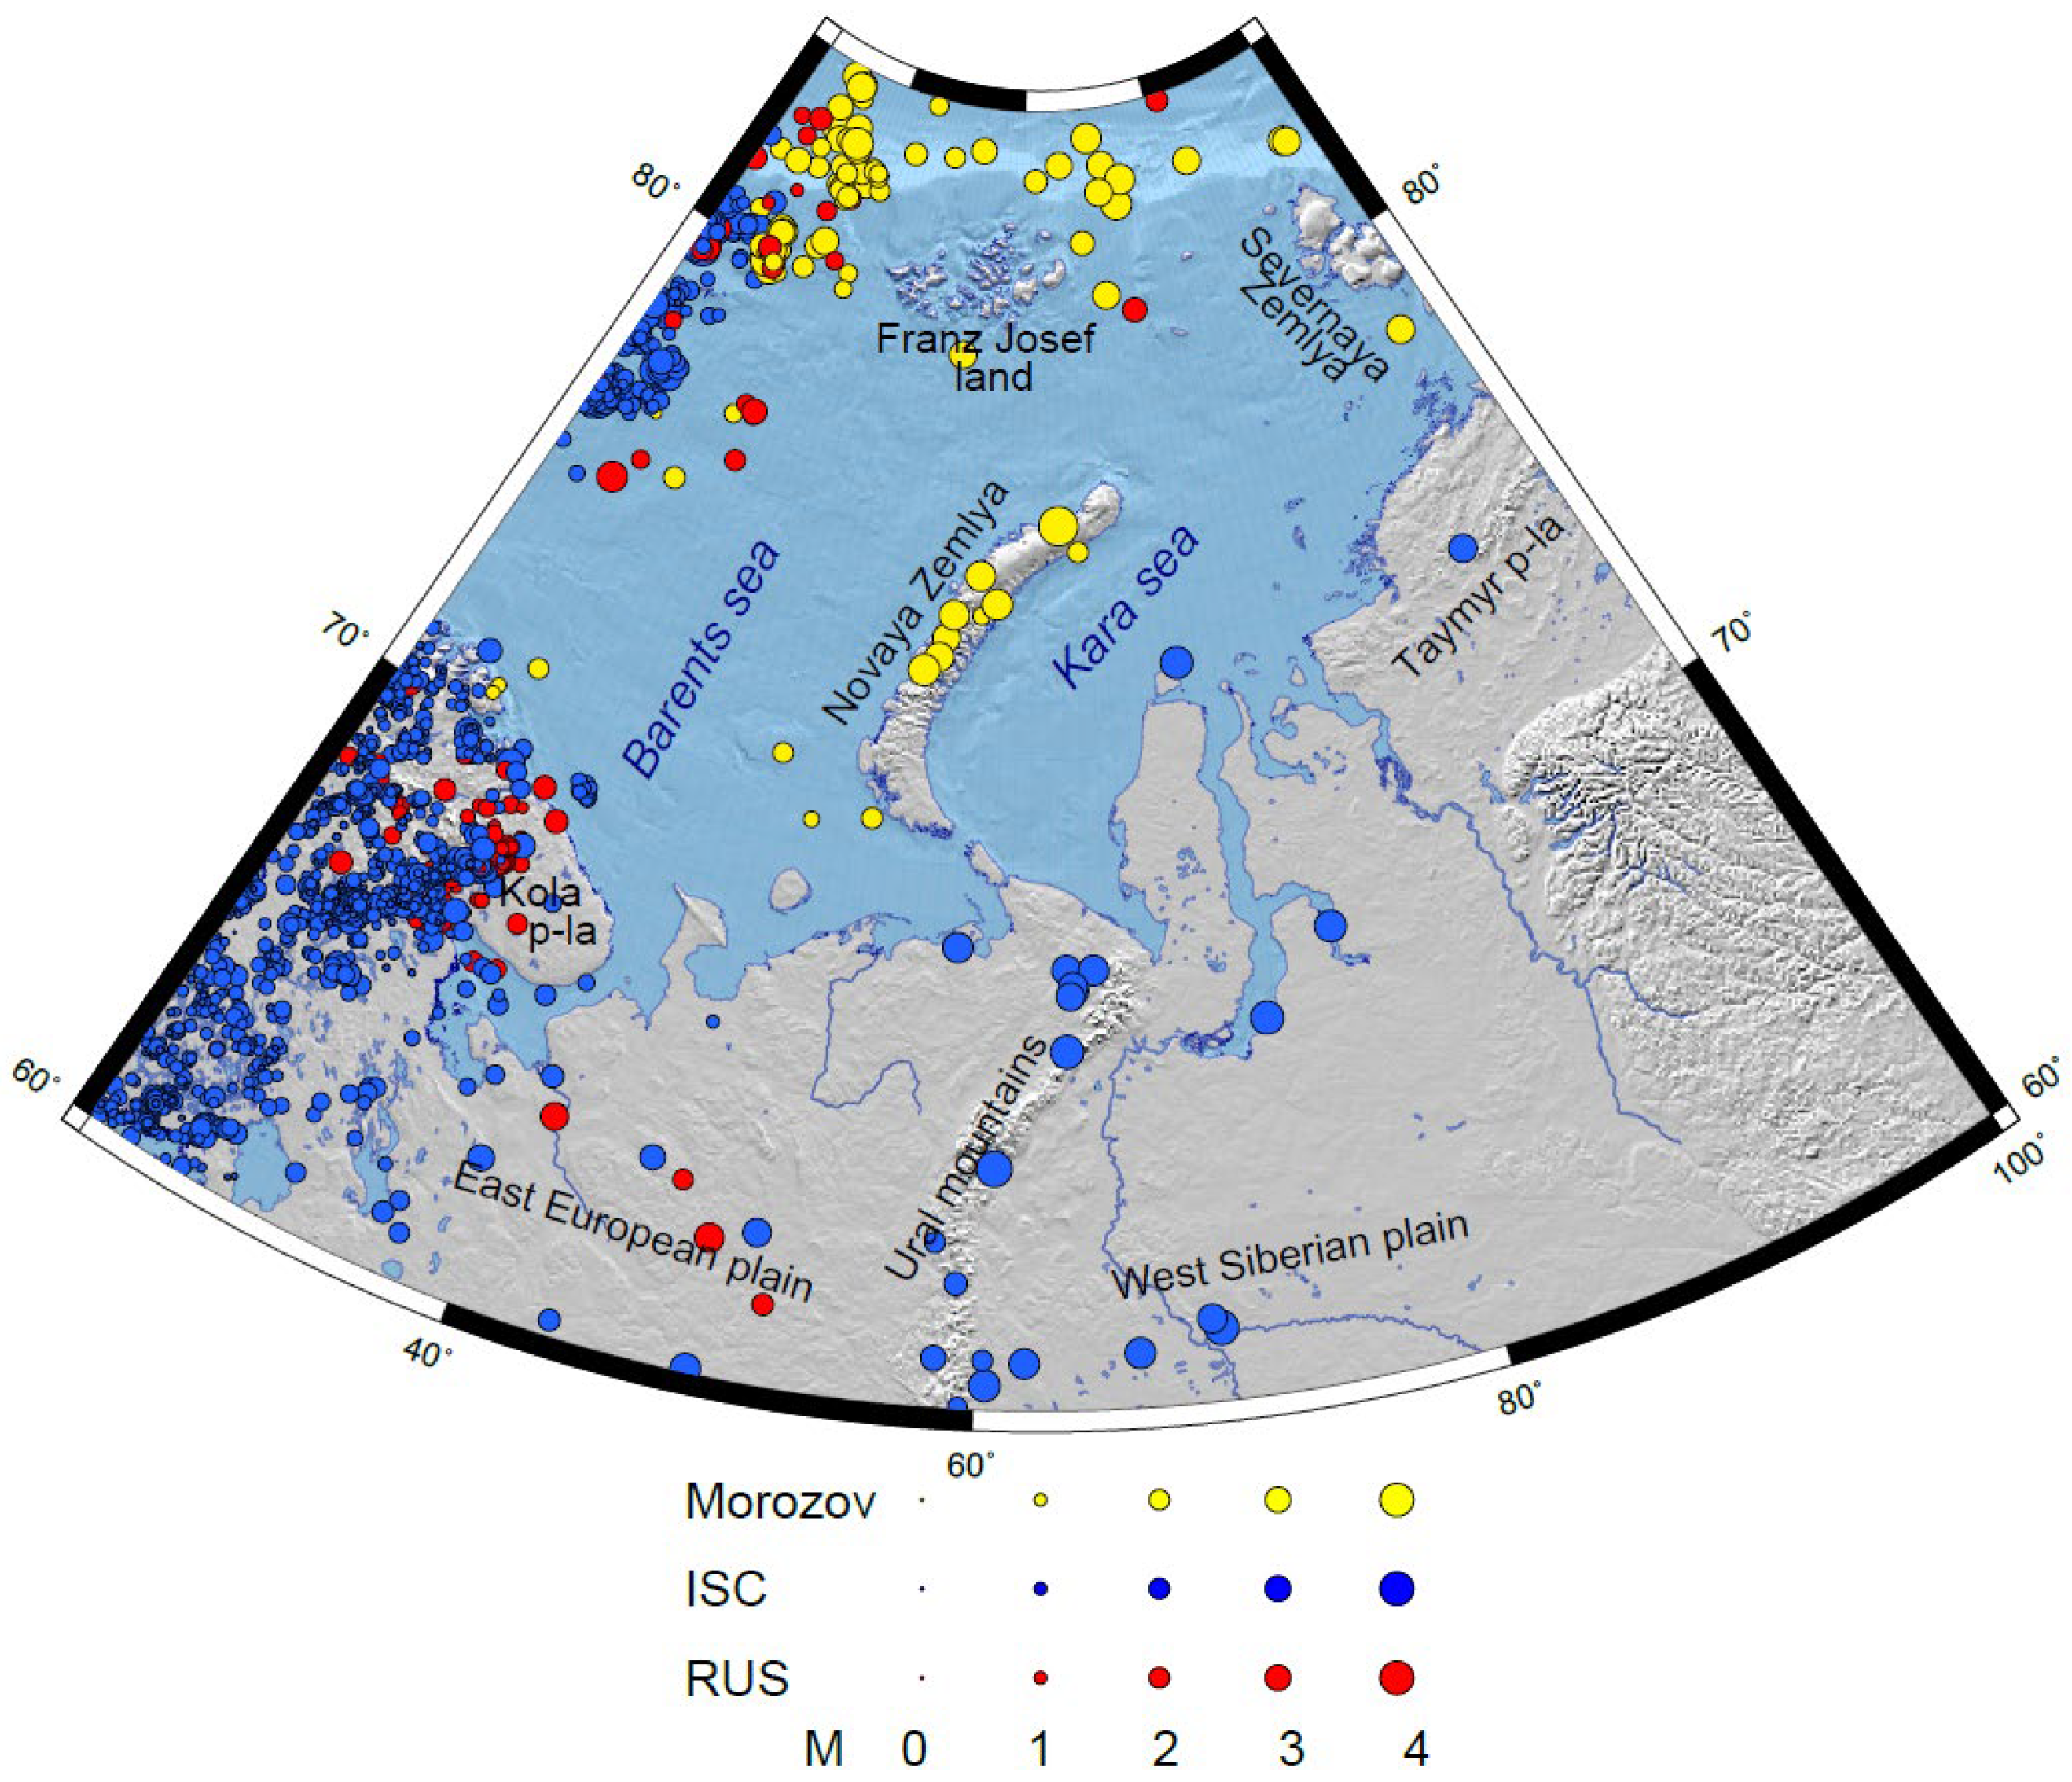
- The catalog Seismicity of the western sector of the Russian Arctic [24] (hereinafter Morozov) 1962–2020;
- The merged catalog of seismic events in the territory of the Russian Federation from the annual journals Earthquakes in Russia 2003–2020. Only data on events that are non-earthquakes are used (hereinafter ER_EXP).


| Catalog | Period | Number of Events | Number of Earthquakes with Energy Classes and/or Magnitudes | Number of Non-Earthquakes |
|---|---|---|---|---|
| ARC | 1965–2020 | 175 | 175 | 0 |
| VEP | 1987–2020 | 971 | 742 | 170 |
| ISC | 1962–2022 | 105,656 | 4418 | 100,112 |
| Morozov | 1962–2020 | 118 * | 118 | 0 |
| ER_EXP | 2003–2020 | 14,990 | - | 14,990 |
| Agency Abbreviation | Agency | With Magnitude |
|---|---|---|
| BER | University of Bergen, Norway | 316 |
| CSEM | Centre Sismologique Euro-Méditerranéen, France | 36 |
| EIDC | Experimental (GSETT3) International Data Center, U.S.A. | 729 |
| FCIAR | Federal Center for Integrated Arctic Research, Russia | 13 |
| HEL | Institute of Seismology, University of Helsinki, Finland | 1390 |
| HFS | Hagfors Observatory, Sweden | 55 |
| IDC | International Data Centre, CTBTO, Austria | 356 |
| IEPN | Institute of Environmental Problems of the North, Russian Academy of Sciences, Russia | 6 |
| ISC | International Seismological Centre, United Kingdom | 495 |
| KOLA | Kola Regional Seismic Centre, GS RAS, Russia | 433 |
| LVSN | Latvian Seismic Network, Latvia | 124 |
| MIRAS | Mining Institute of the Ural Branch of the Russian Academy of Sciences, Russia | 211 |
| MOS | Geophysical Survey of Russian Academy of Sciences, Russia | 3 |
| NAO | Stiftelsen NORSAR, Norway | 171 |
| NEIC | National Earthquake Information Center, USA | 15 |
| NNC | National Nuclear Center, Kazakhstan | 3 |
| UPP | University of Uppsala, Sweden | 62 |
| TOTAL: | 4418 |
3. Results
3.1. Integrated Catalog of the Western Sector of the AZRF
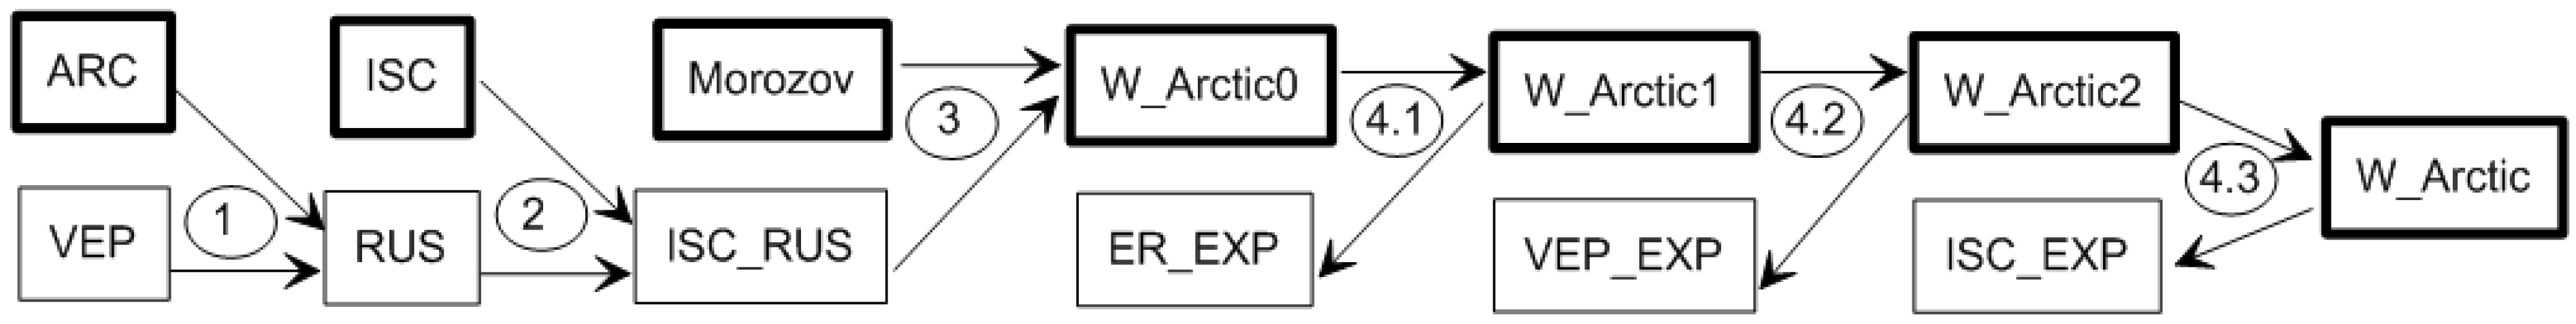
- Earthquakes from the Morozov catalog (118 events);
- Earthquakes from the ISC catalog (4418 events);
- Earthquakes from Russian catalogs ARC and VEP (175 + 742 events), with preference given to data from the ARC catalog in overlapping areas.
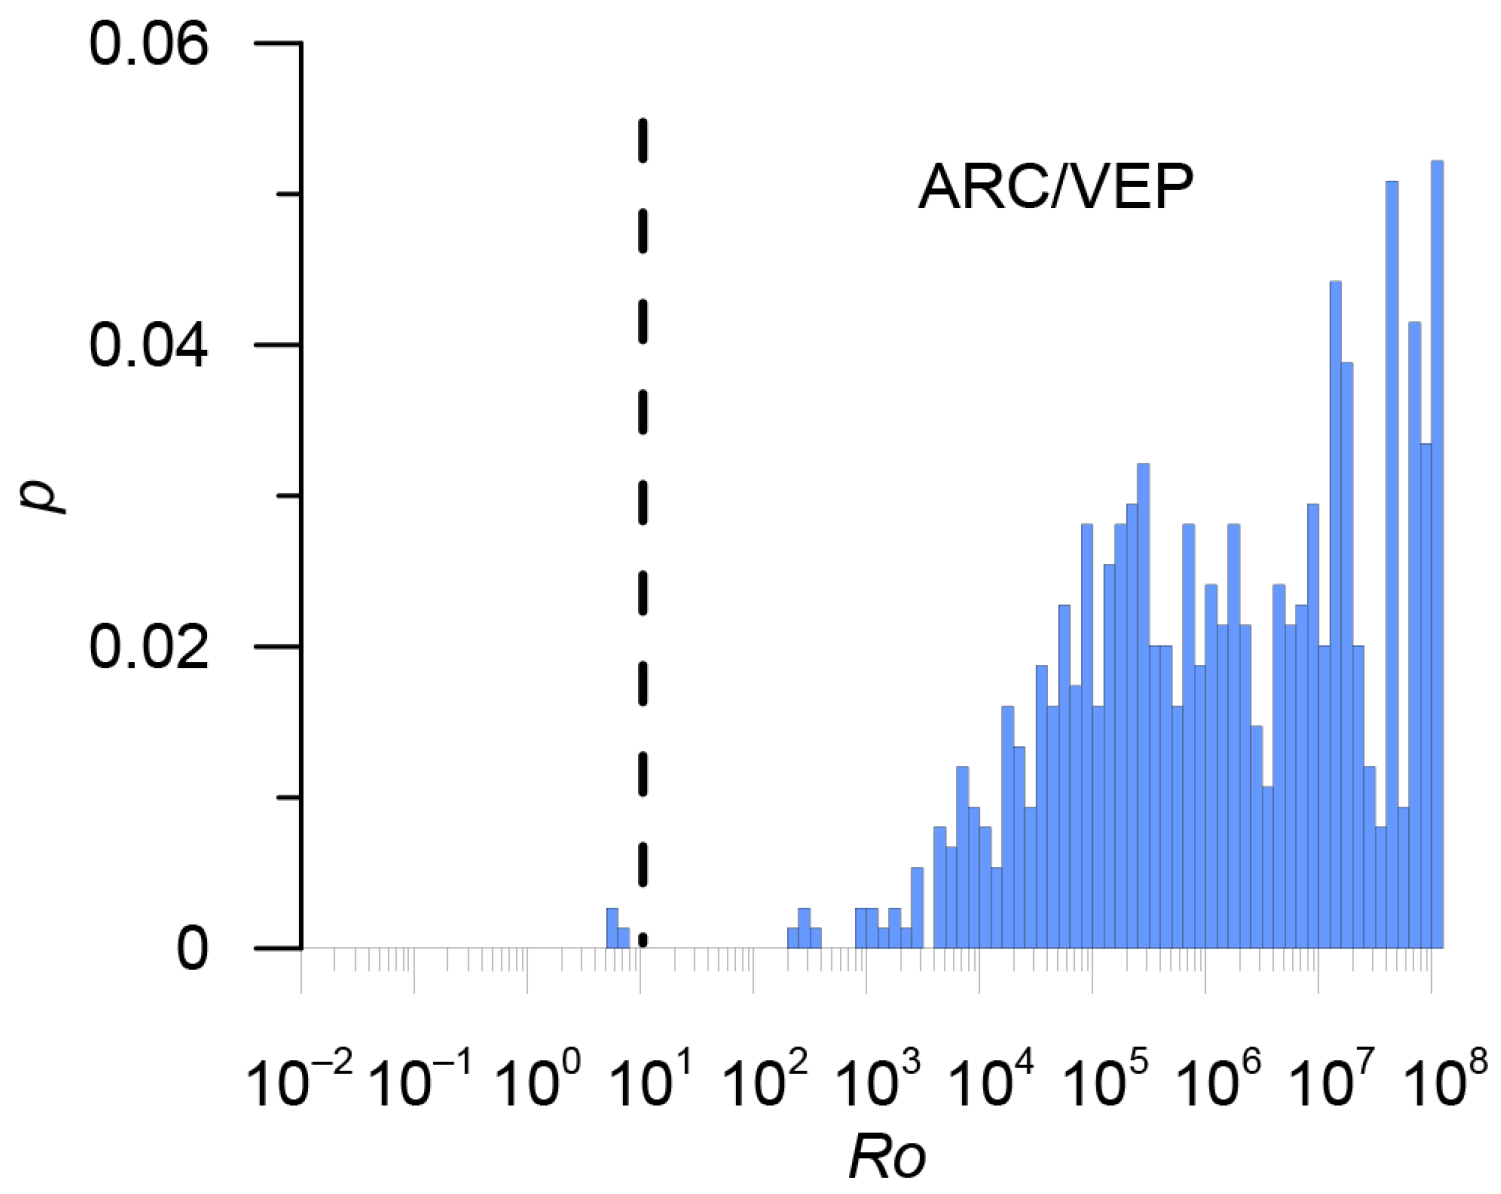
3.1.1. Stage 1. Merging the ARC and VEP Catalogs
3.1.2. Stage 2. Merging the ISC and RUS Catalogs
3.1.3. Stage 3. Merging Morozov and ISC_RUS Catalogs
3.1.4. Stage 4. Exclusion of Explosions and Other Anthropogenic Events
3.2. Magnitudes in the Integrated Catalog of the Western Sector of the AZRF
3.2.1. The Kola Peninsula and Karelia
3.2.2. The Kara and Barents Seas Shelf
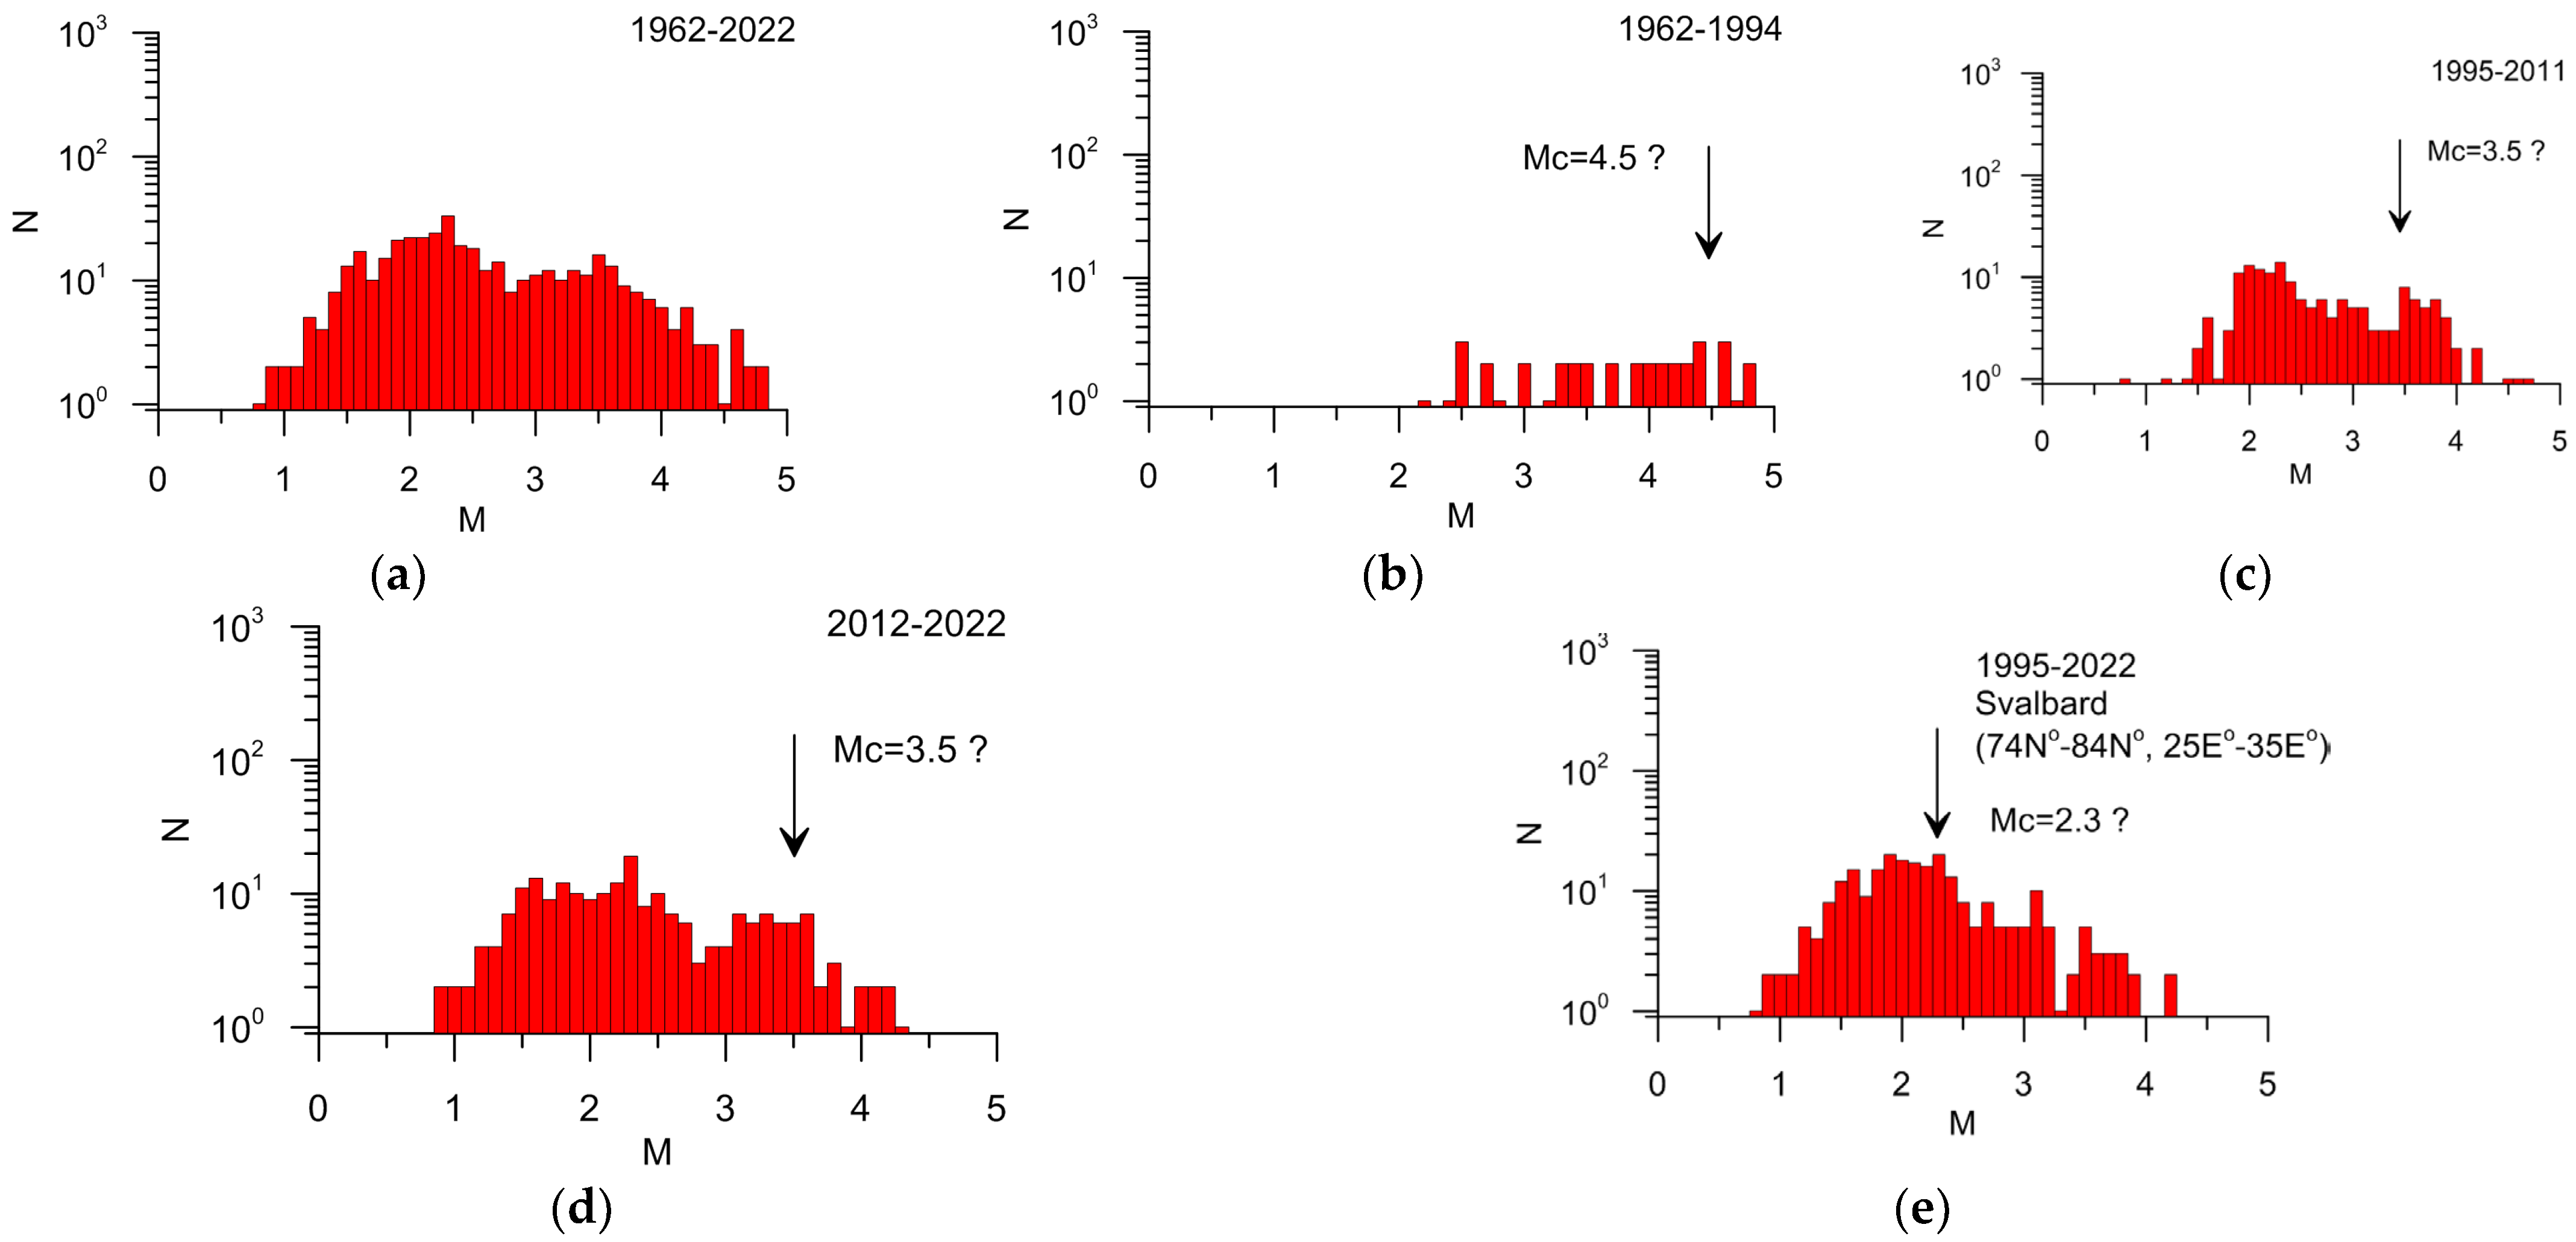
3.3. Statistics of the Integrated Catalog for Two Sub-Regions
4. Conclusions
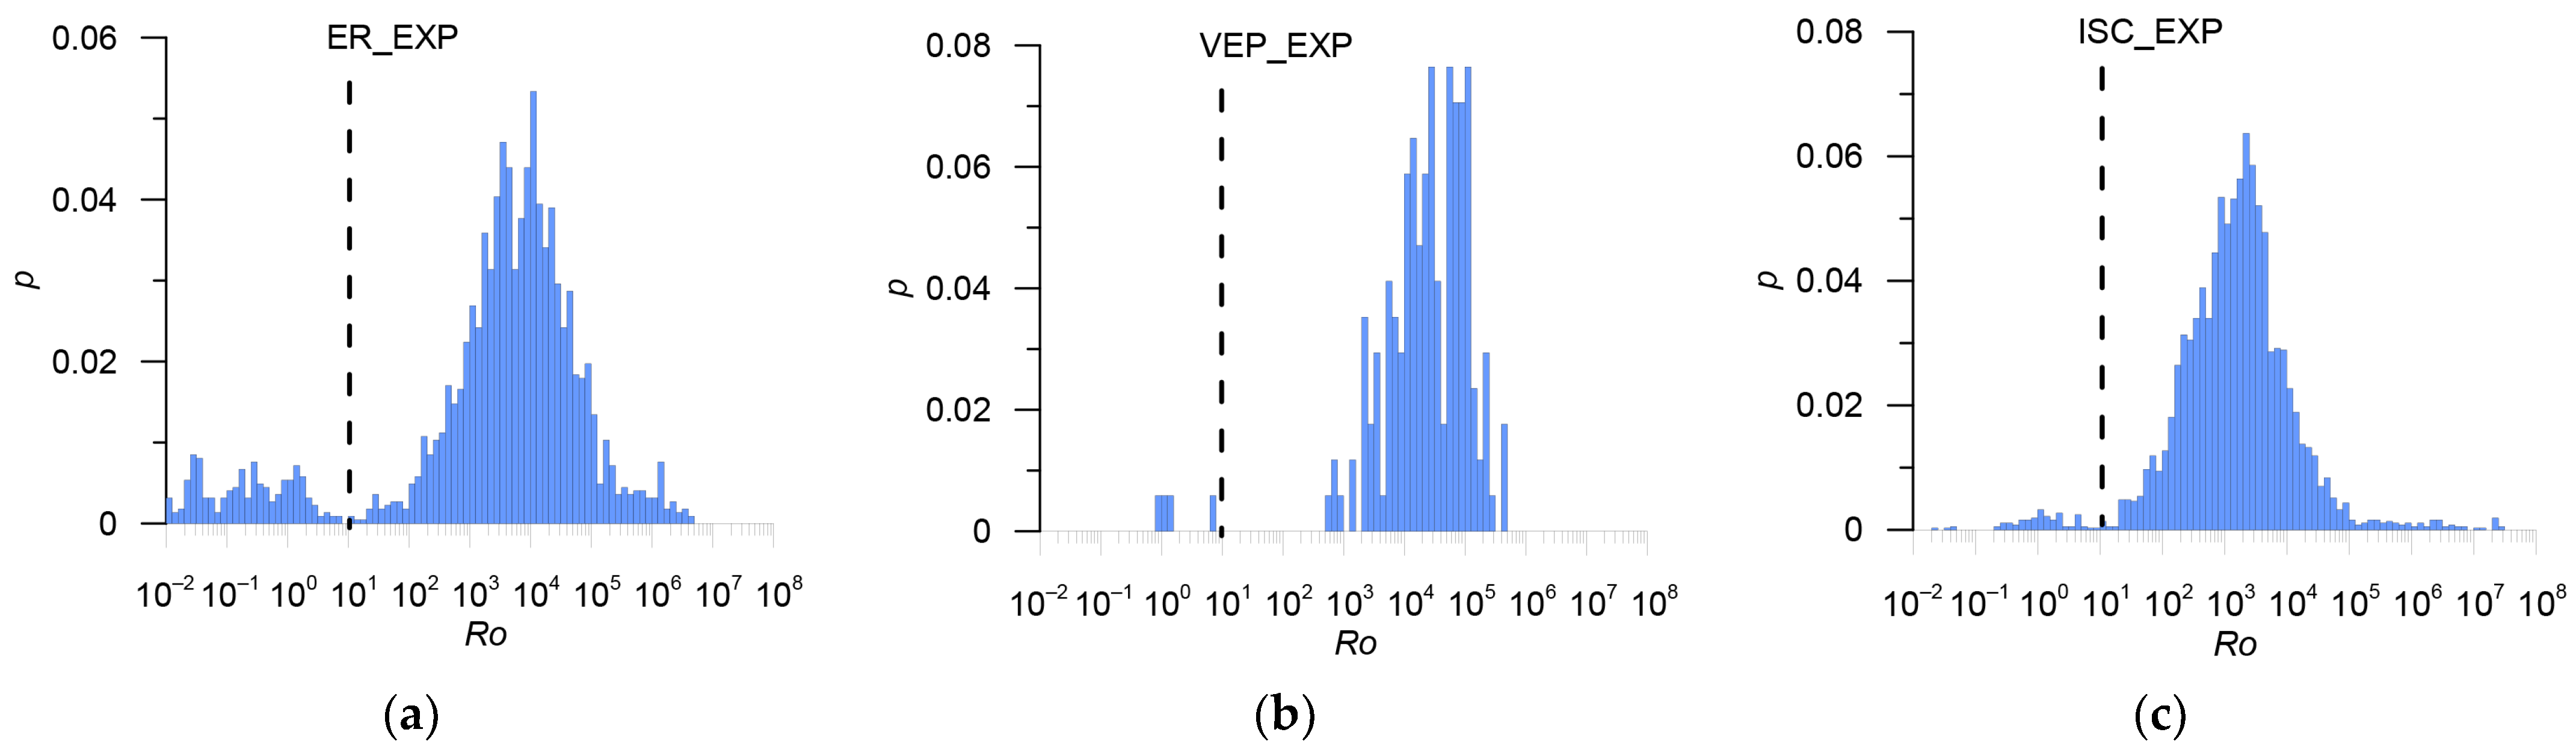
- Information on explosions and other events that are not tectonic earthquakes, presented in the catalogs of GS RAS and ISC, is incomplete. Approximately 300 such events from the GS RAS catalog (ER_EXP in Table 1) are classified as earthquakes in the ISC catalog, and conversely, about 100 explosions from the ISC catalog are classified as earthquakes in the GS RAS catalogs (Figure 9, Table 3);
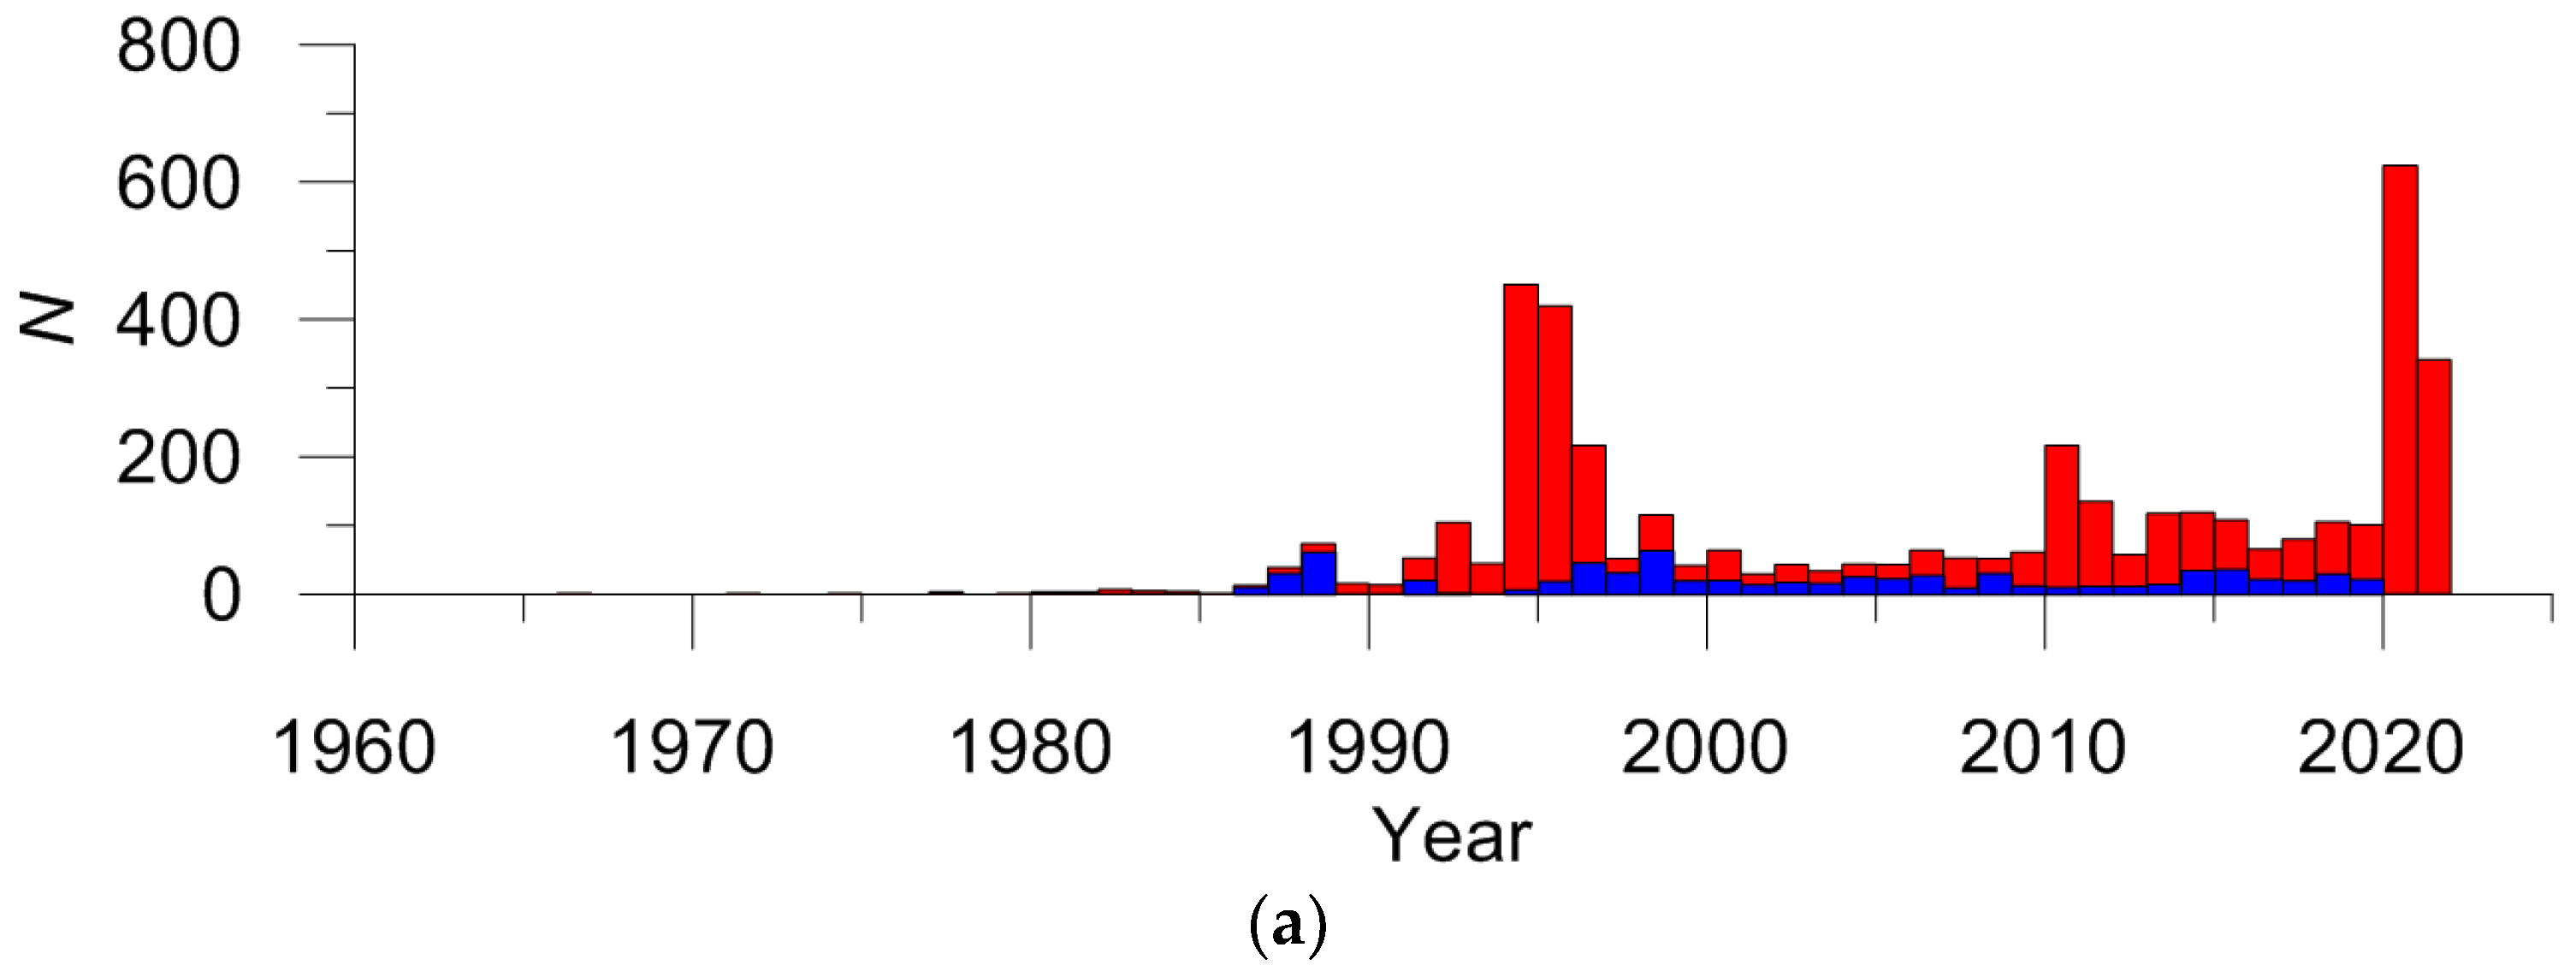
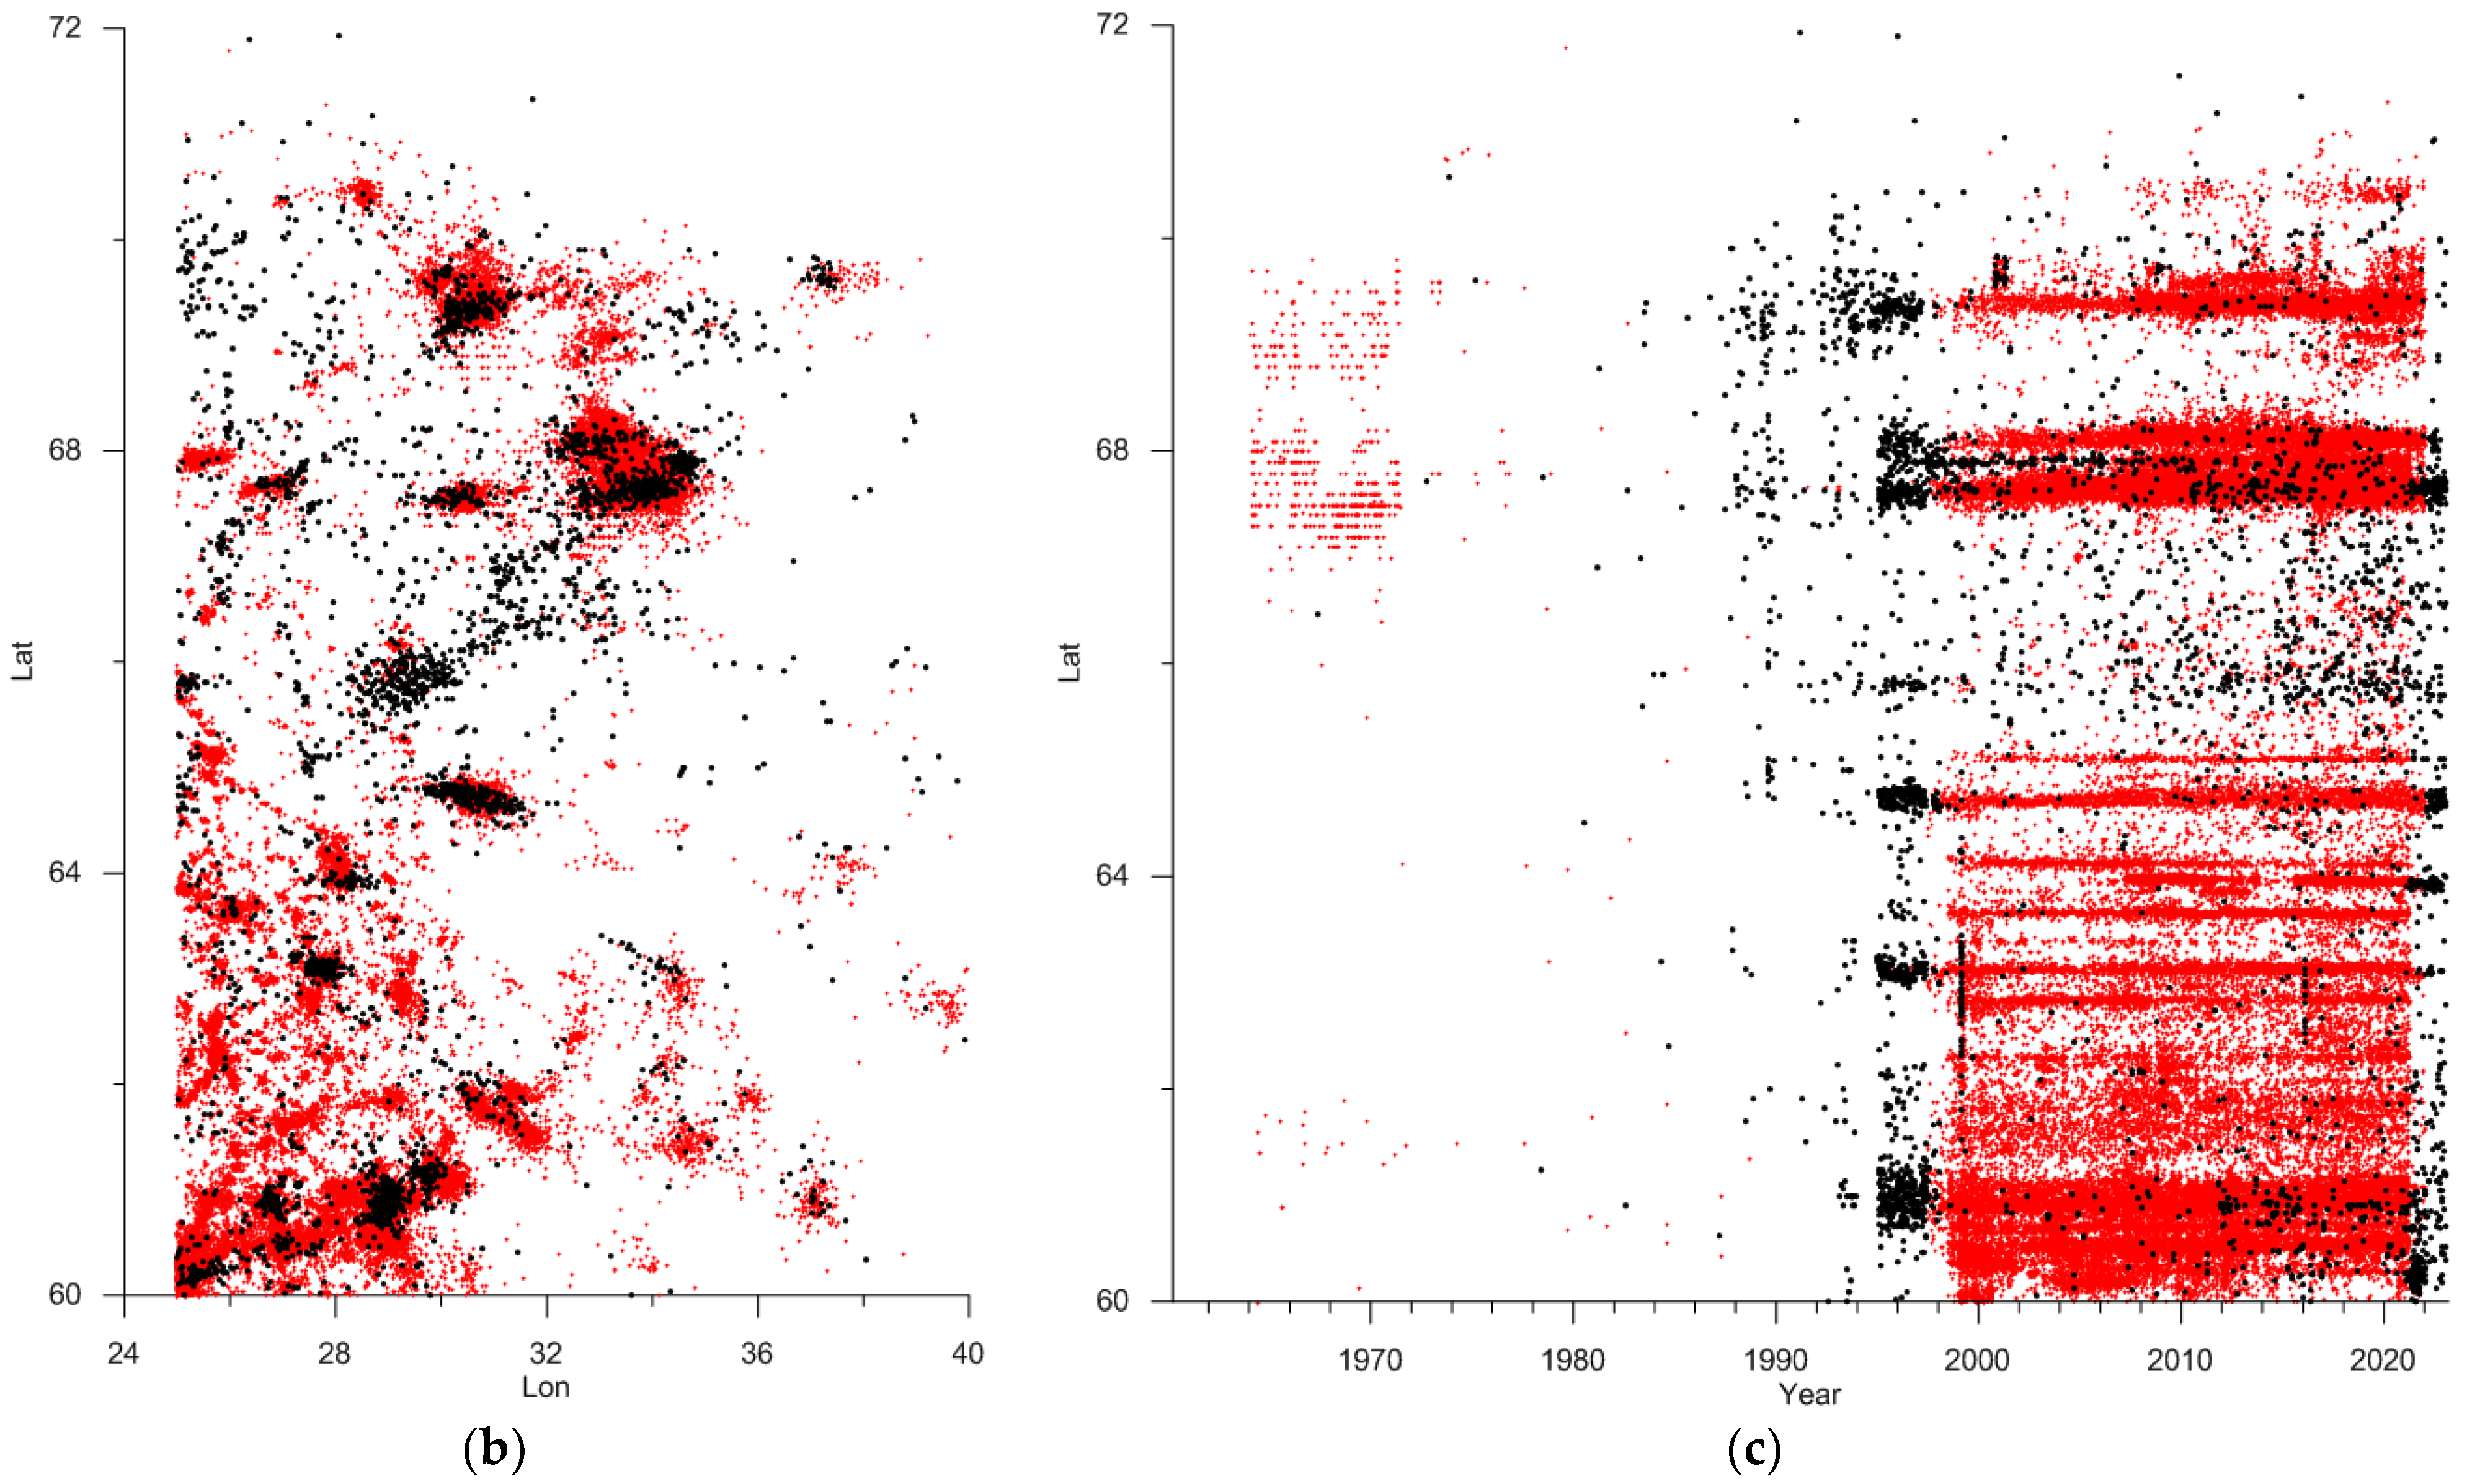
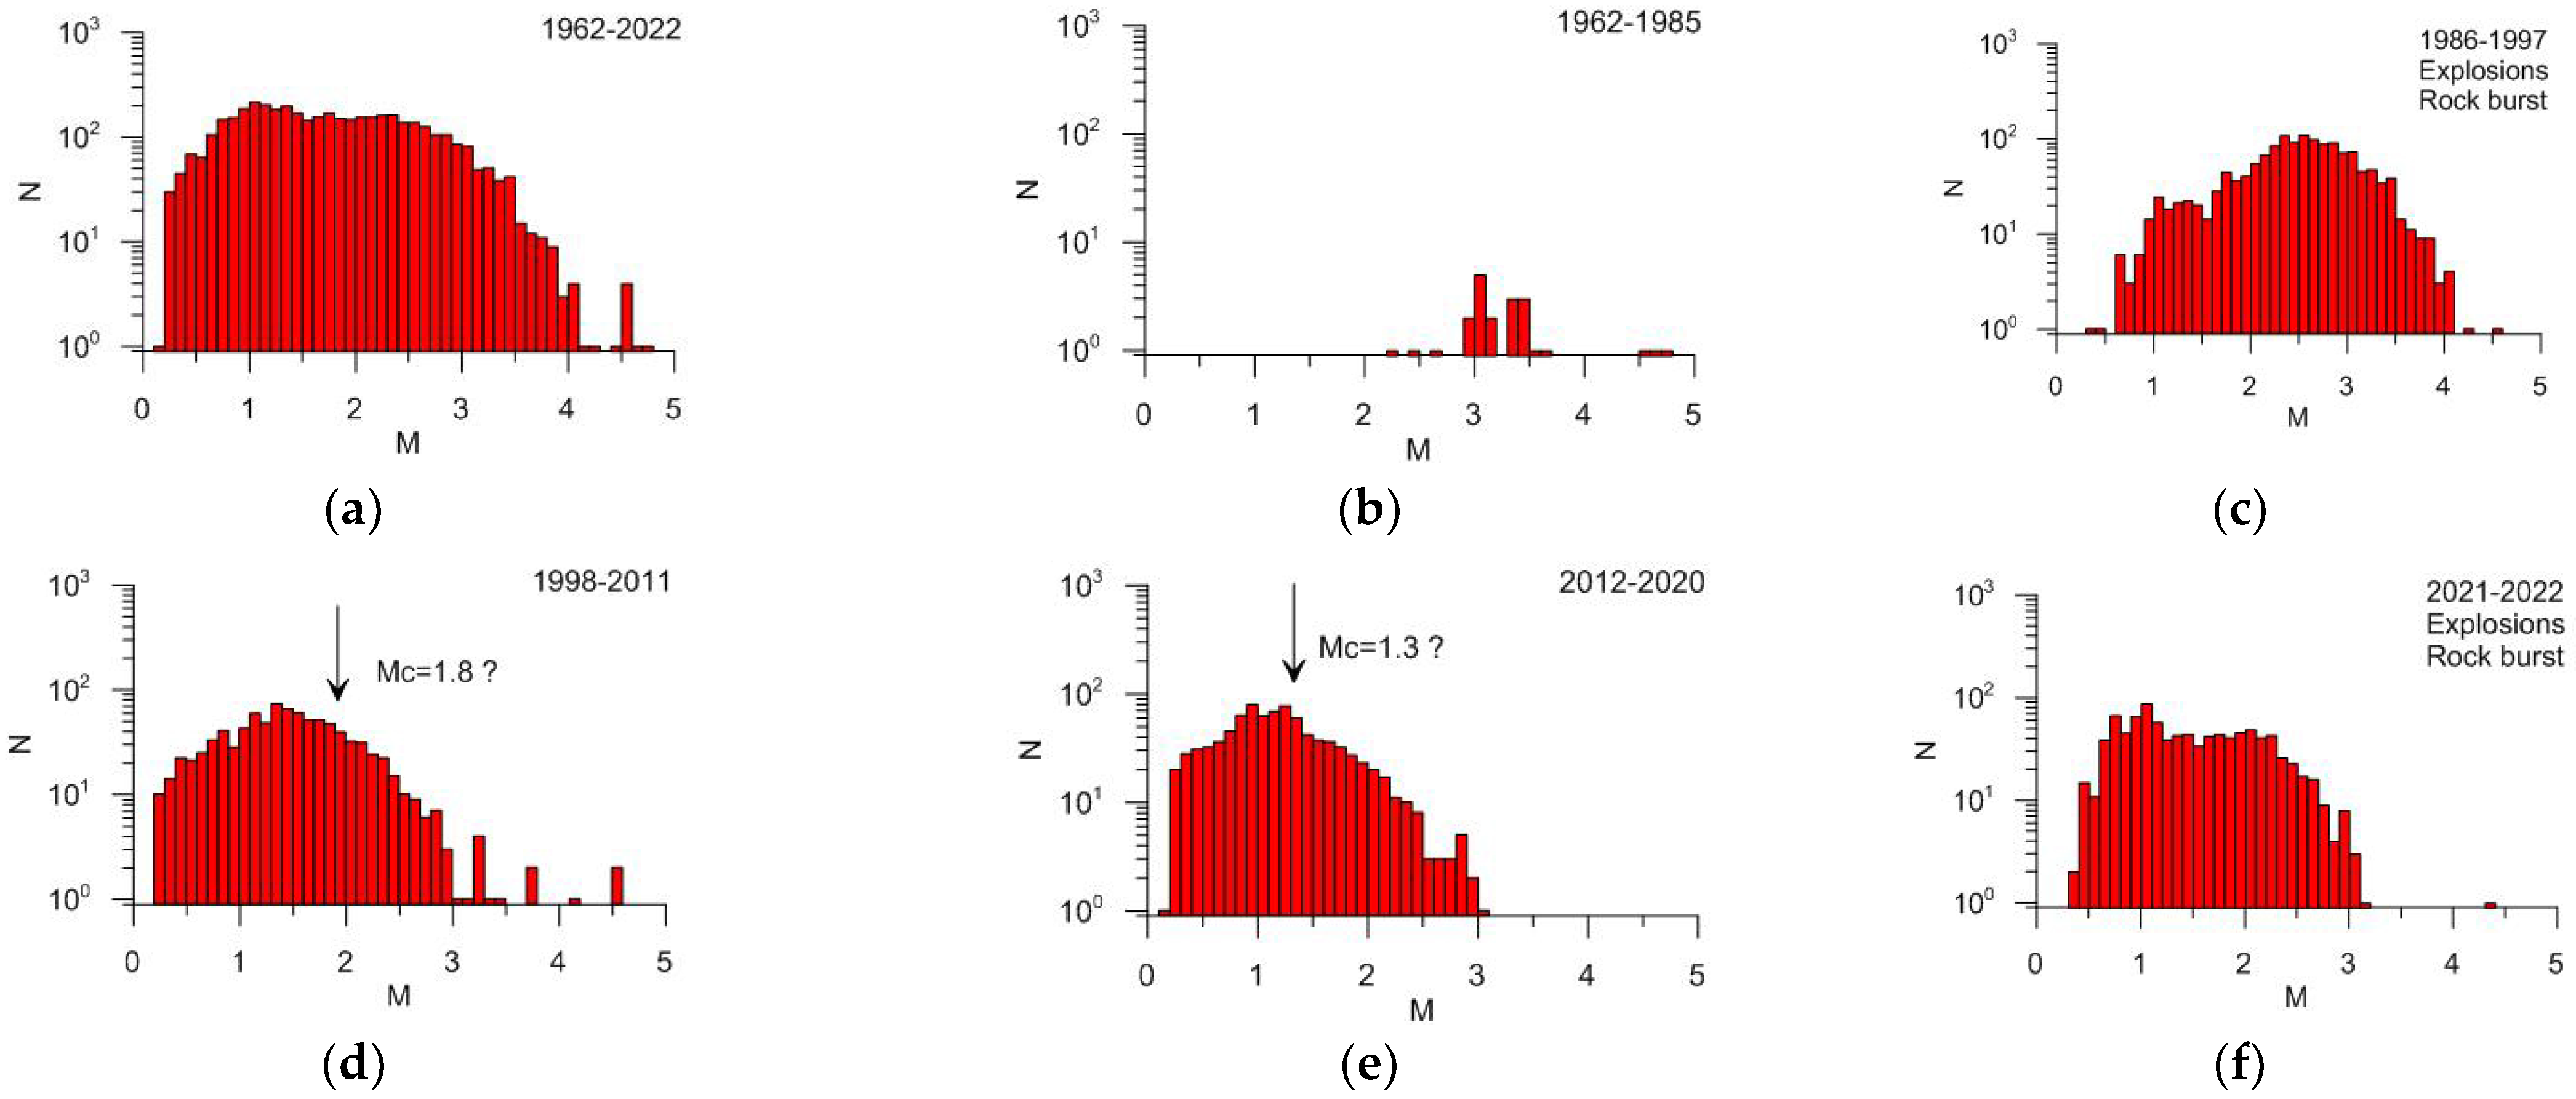
- Explosions before 1998 and after 2020 have not been removed (Figure 10). Explosions after 2020 may be removed with the arrival of new data–GS RAS catalogs and reviewed ISC catalog. Identifying and removing explosions that occurred before 1998 is an extremely difficult task beyond the scope of the mathematical methods used in this study;
- In general, there is no sufficient guarantee that “non-earthquakes” have been completely removed from the combined catalog during the period of 1998–2020. However, there are reasons to believe that the number of such events is small and they will not have a significant impact on regional seismicity statistics;
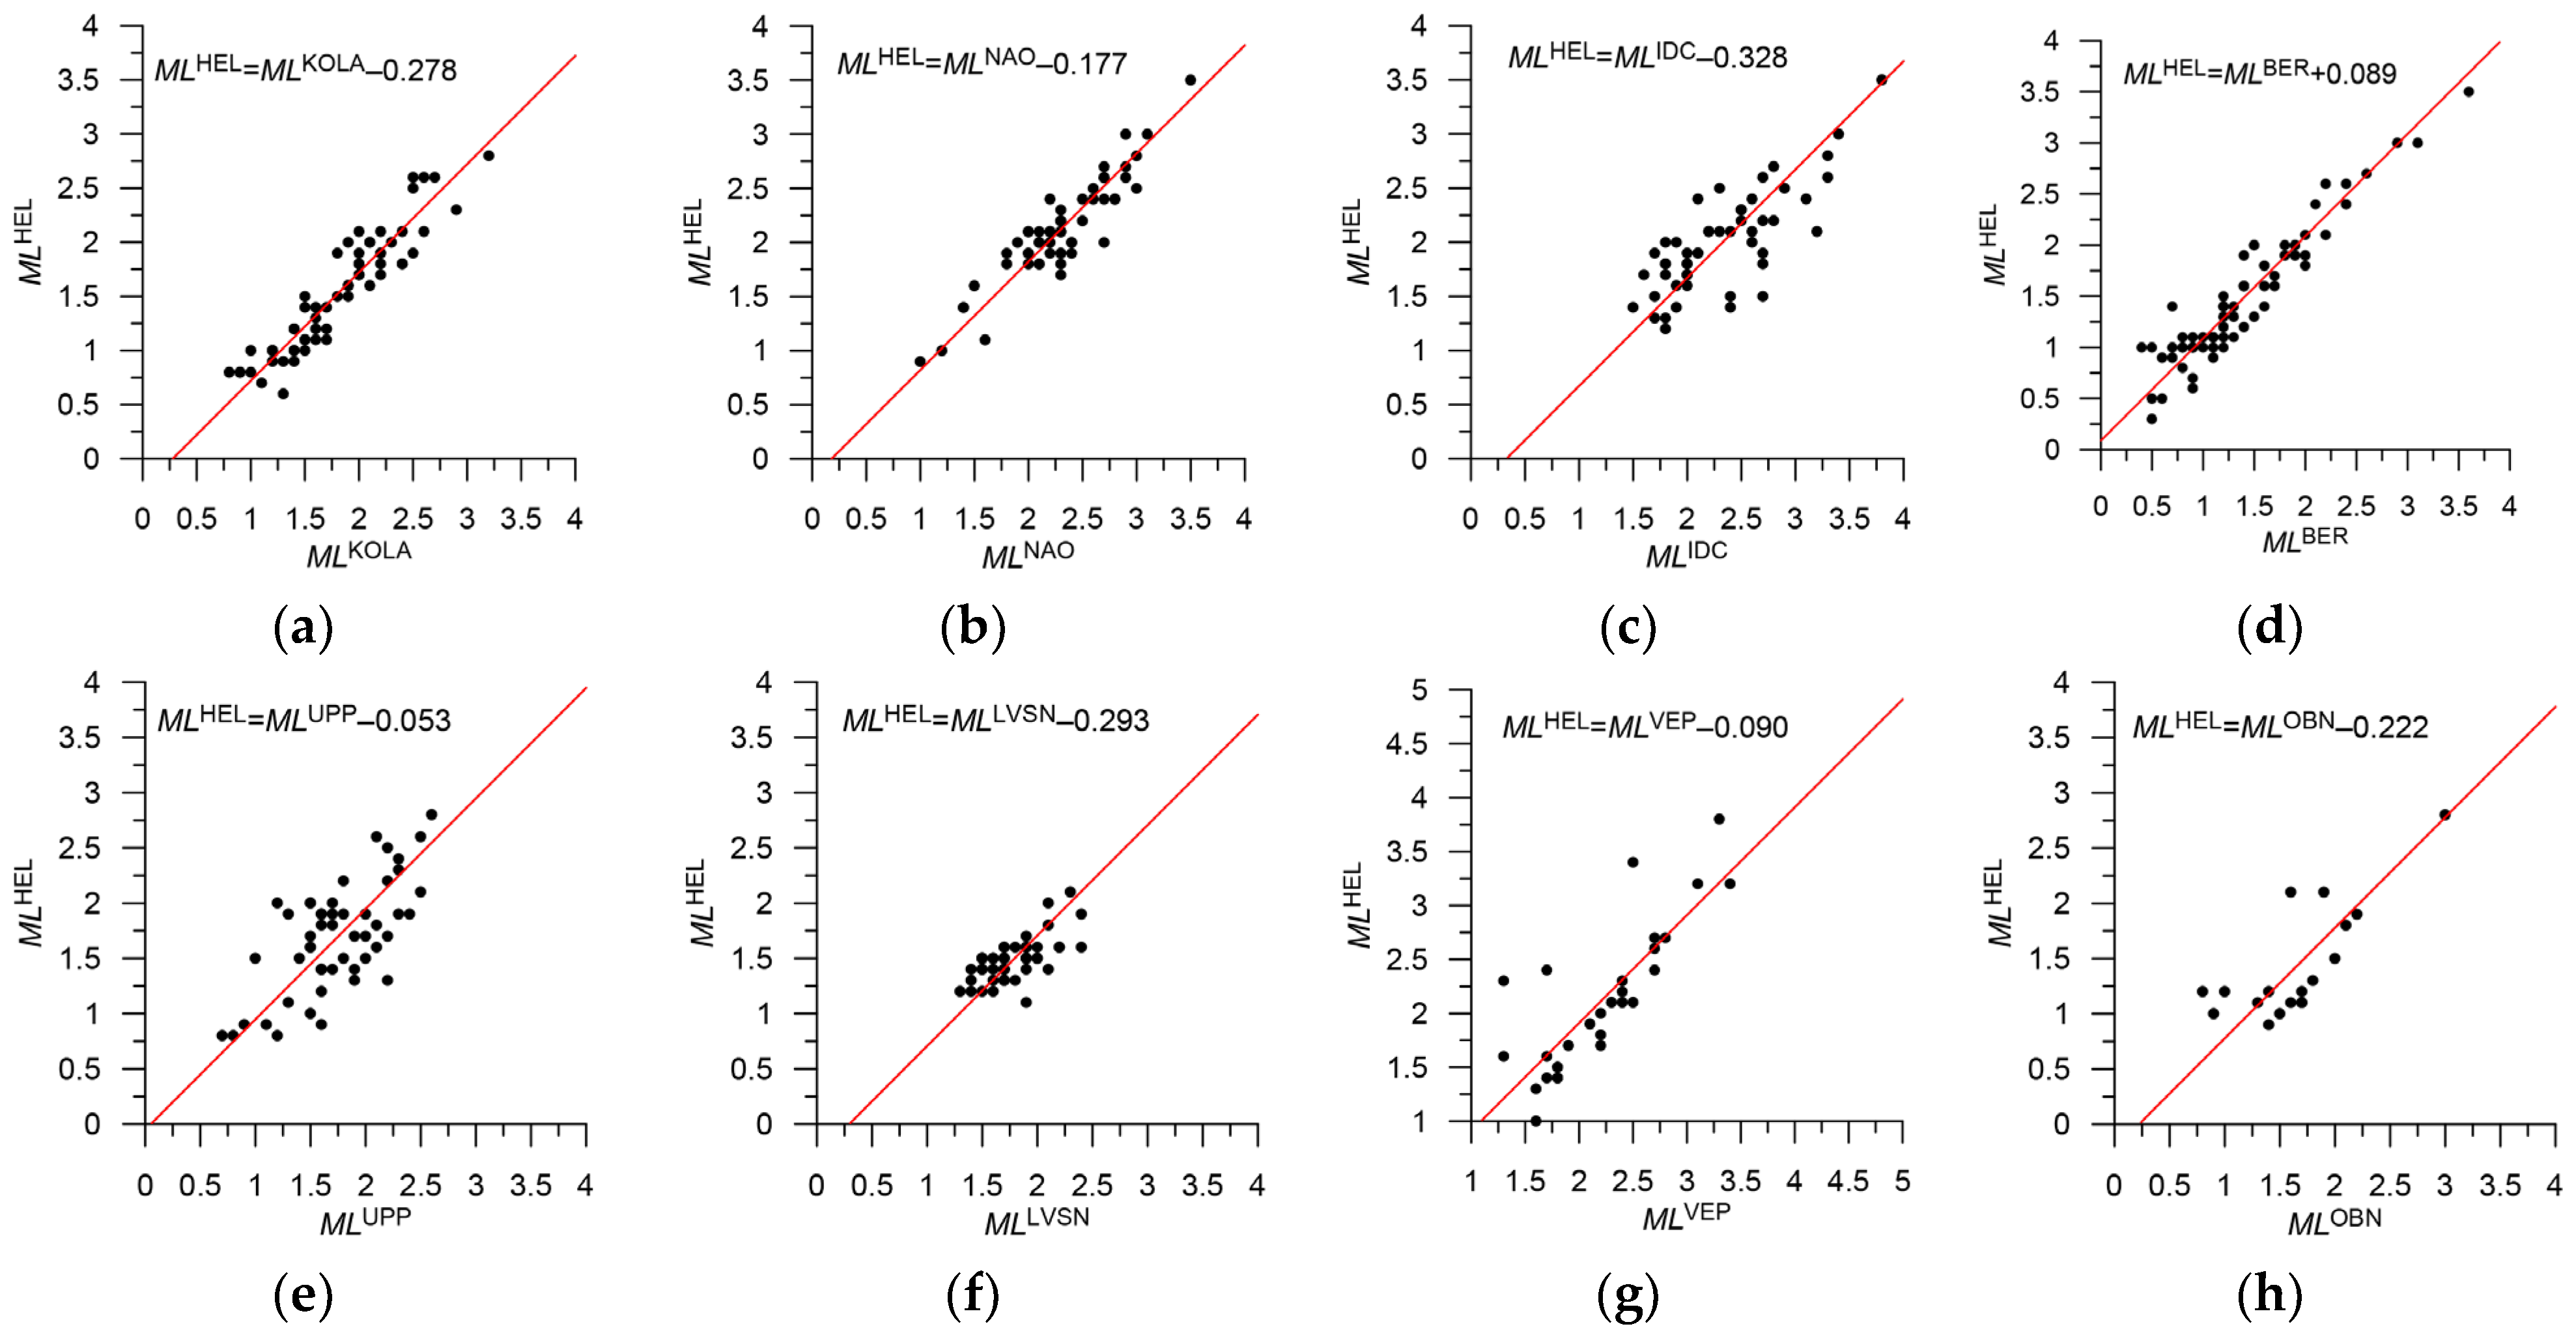
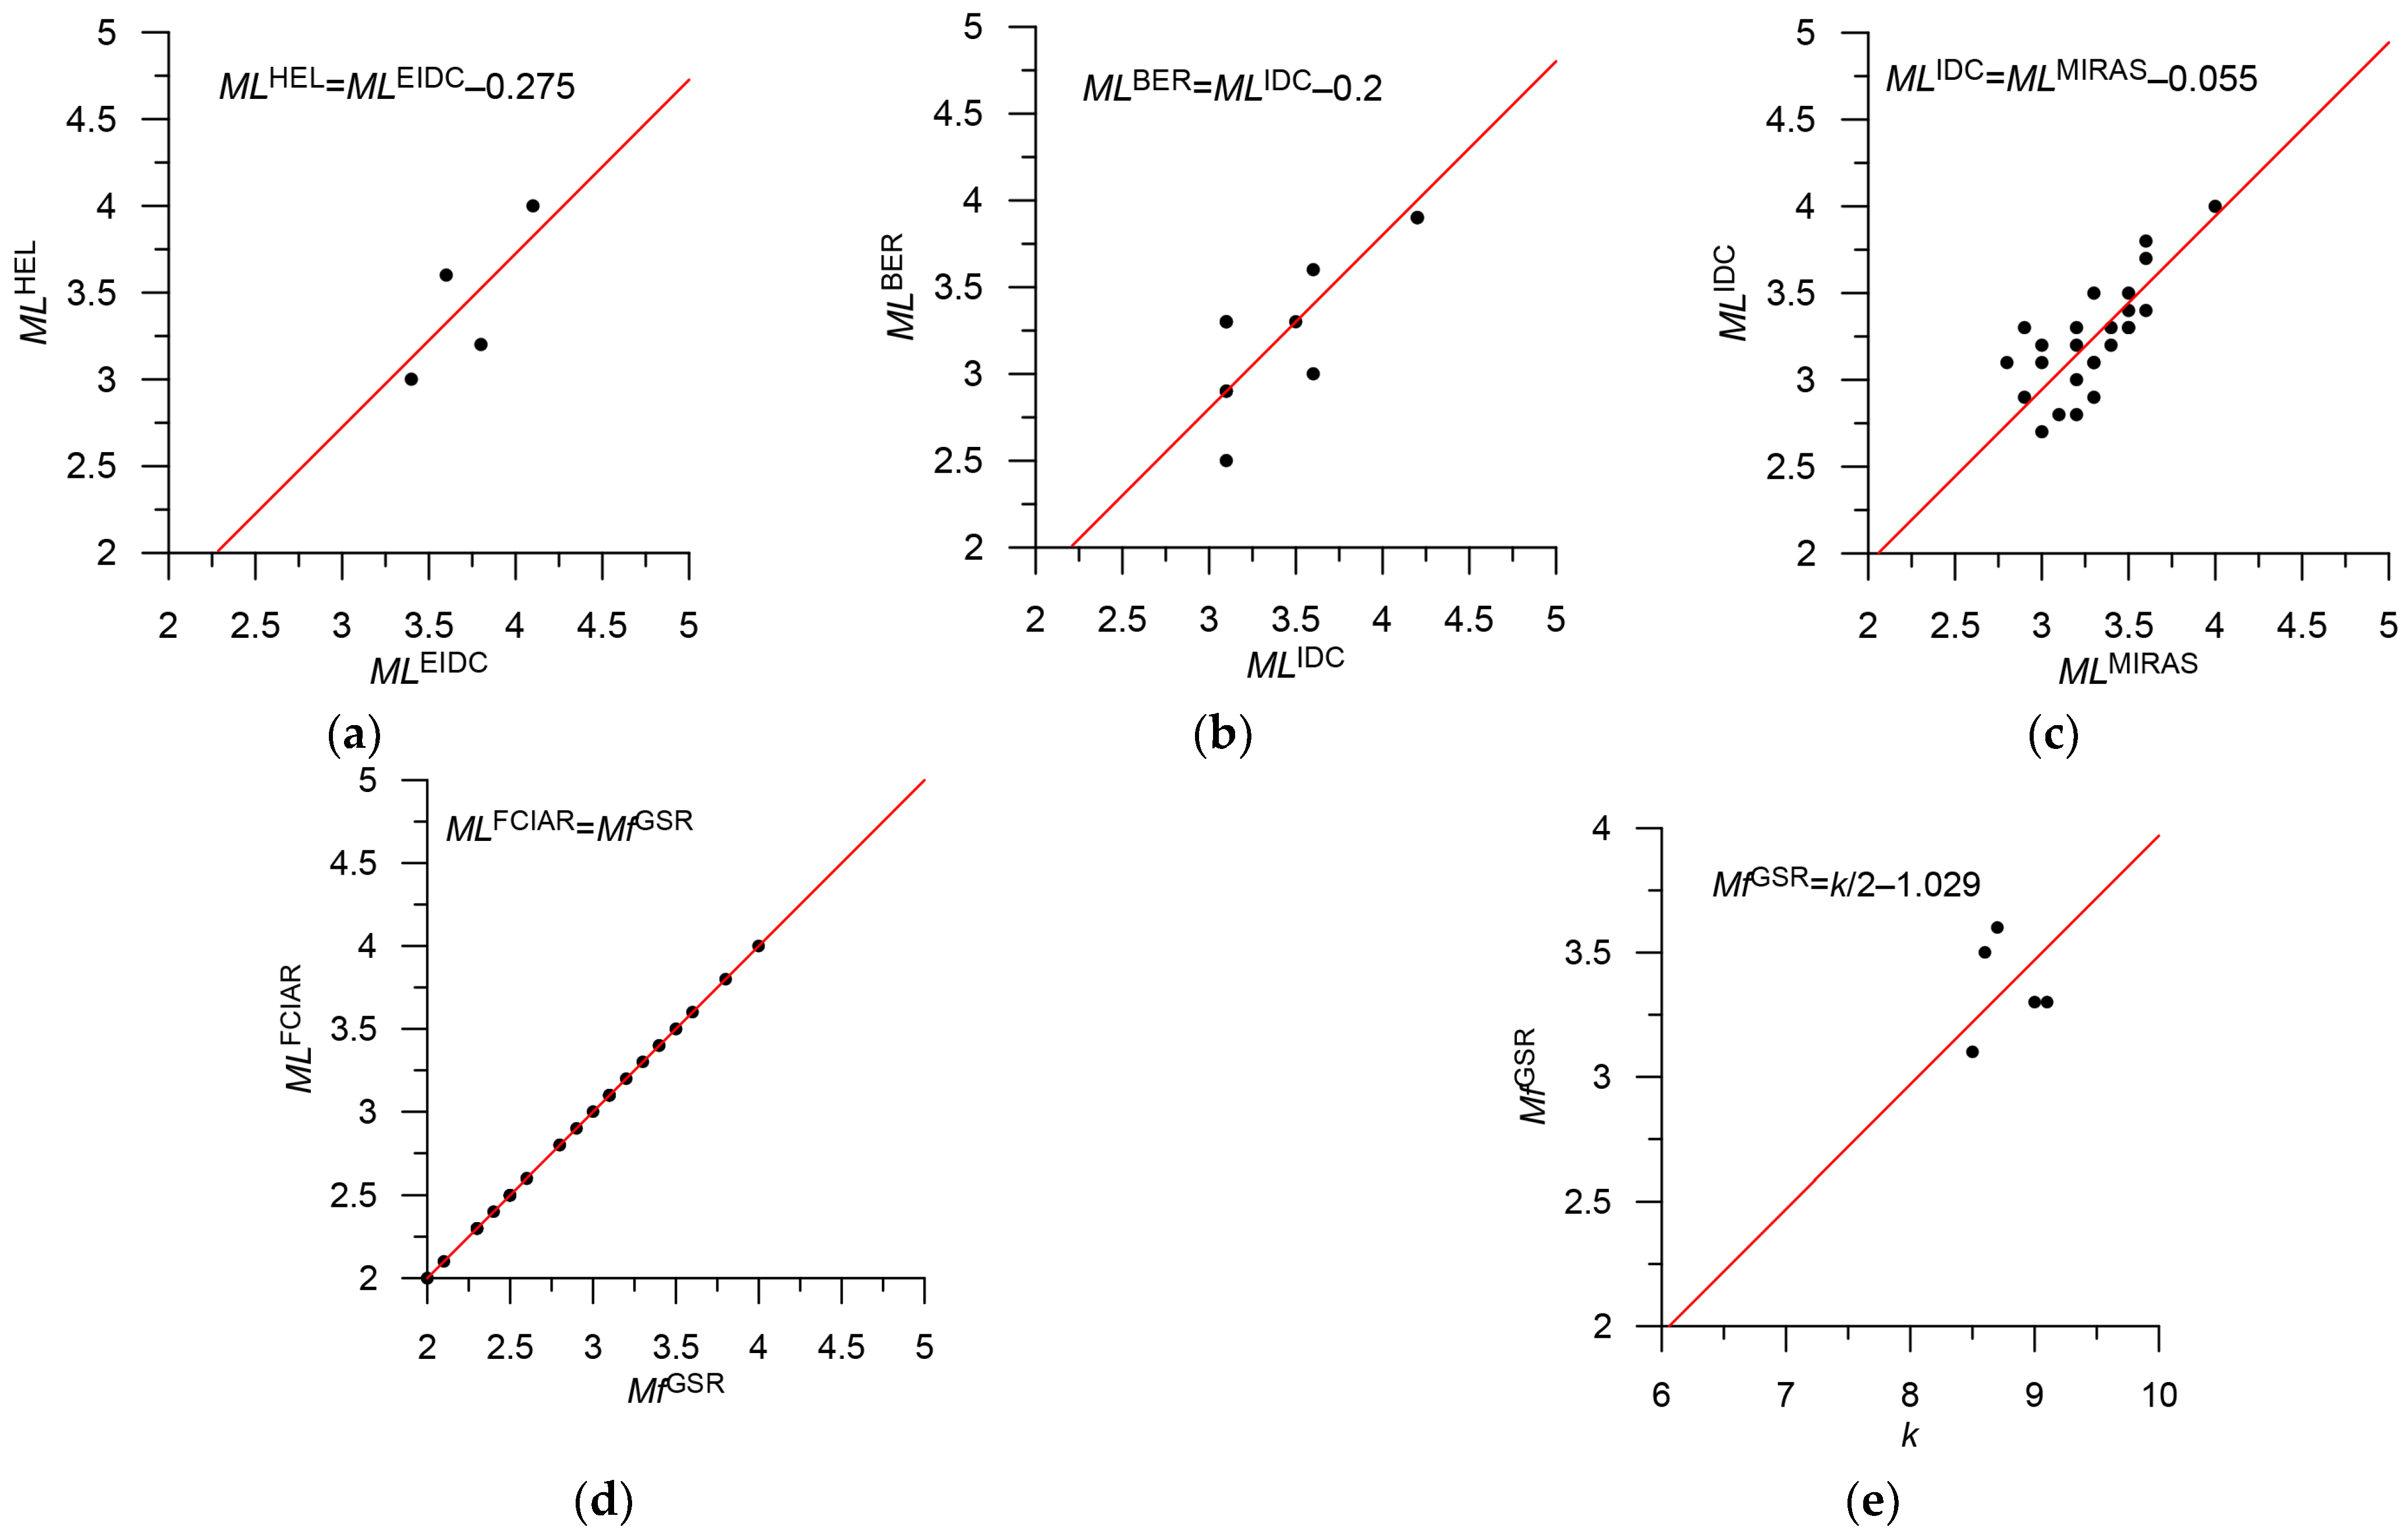
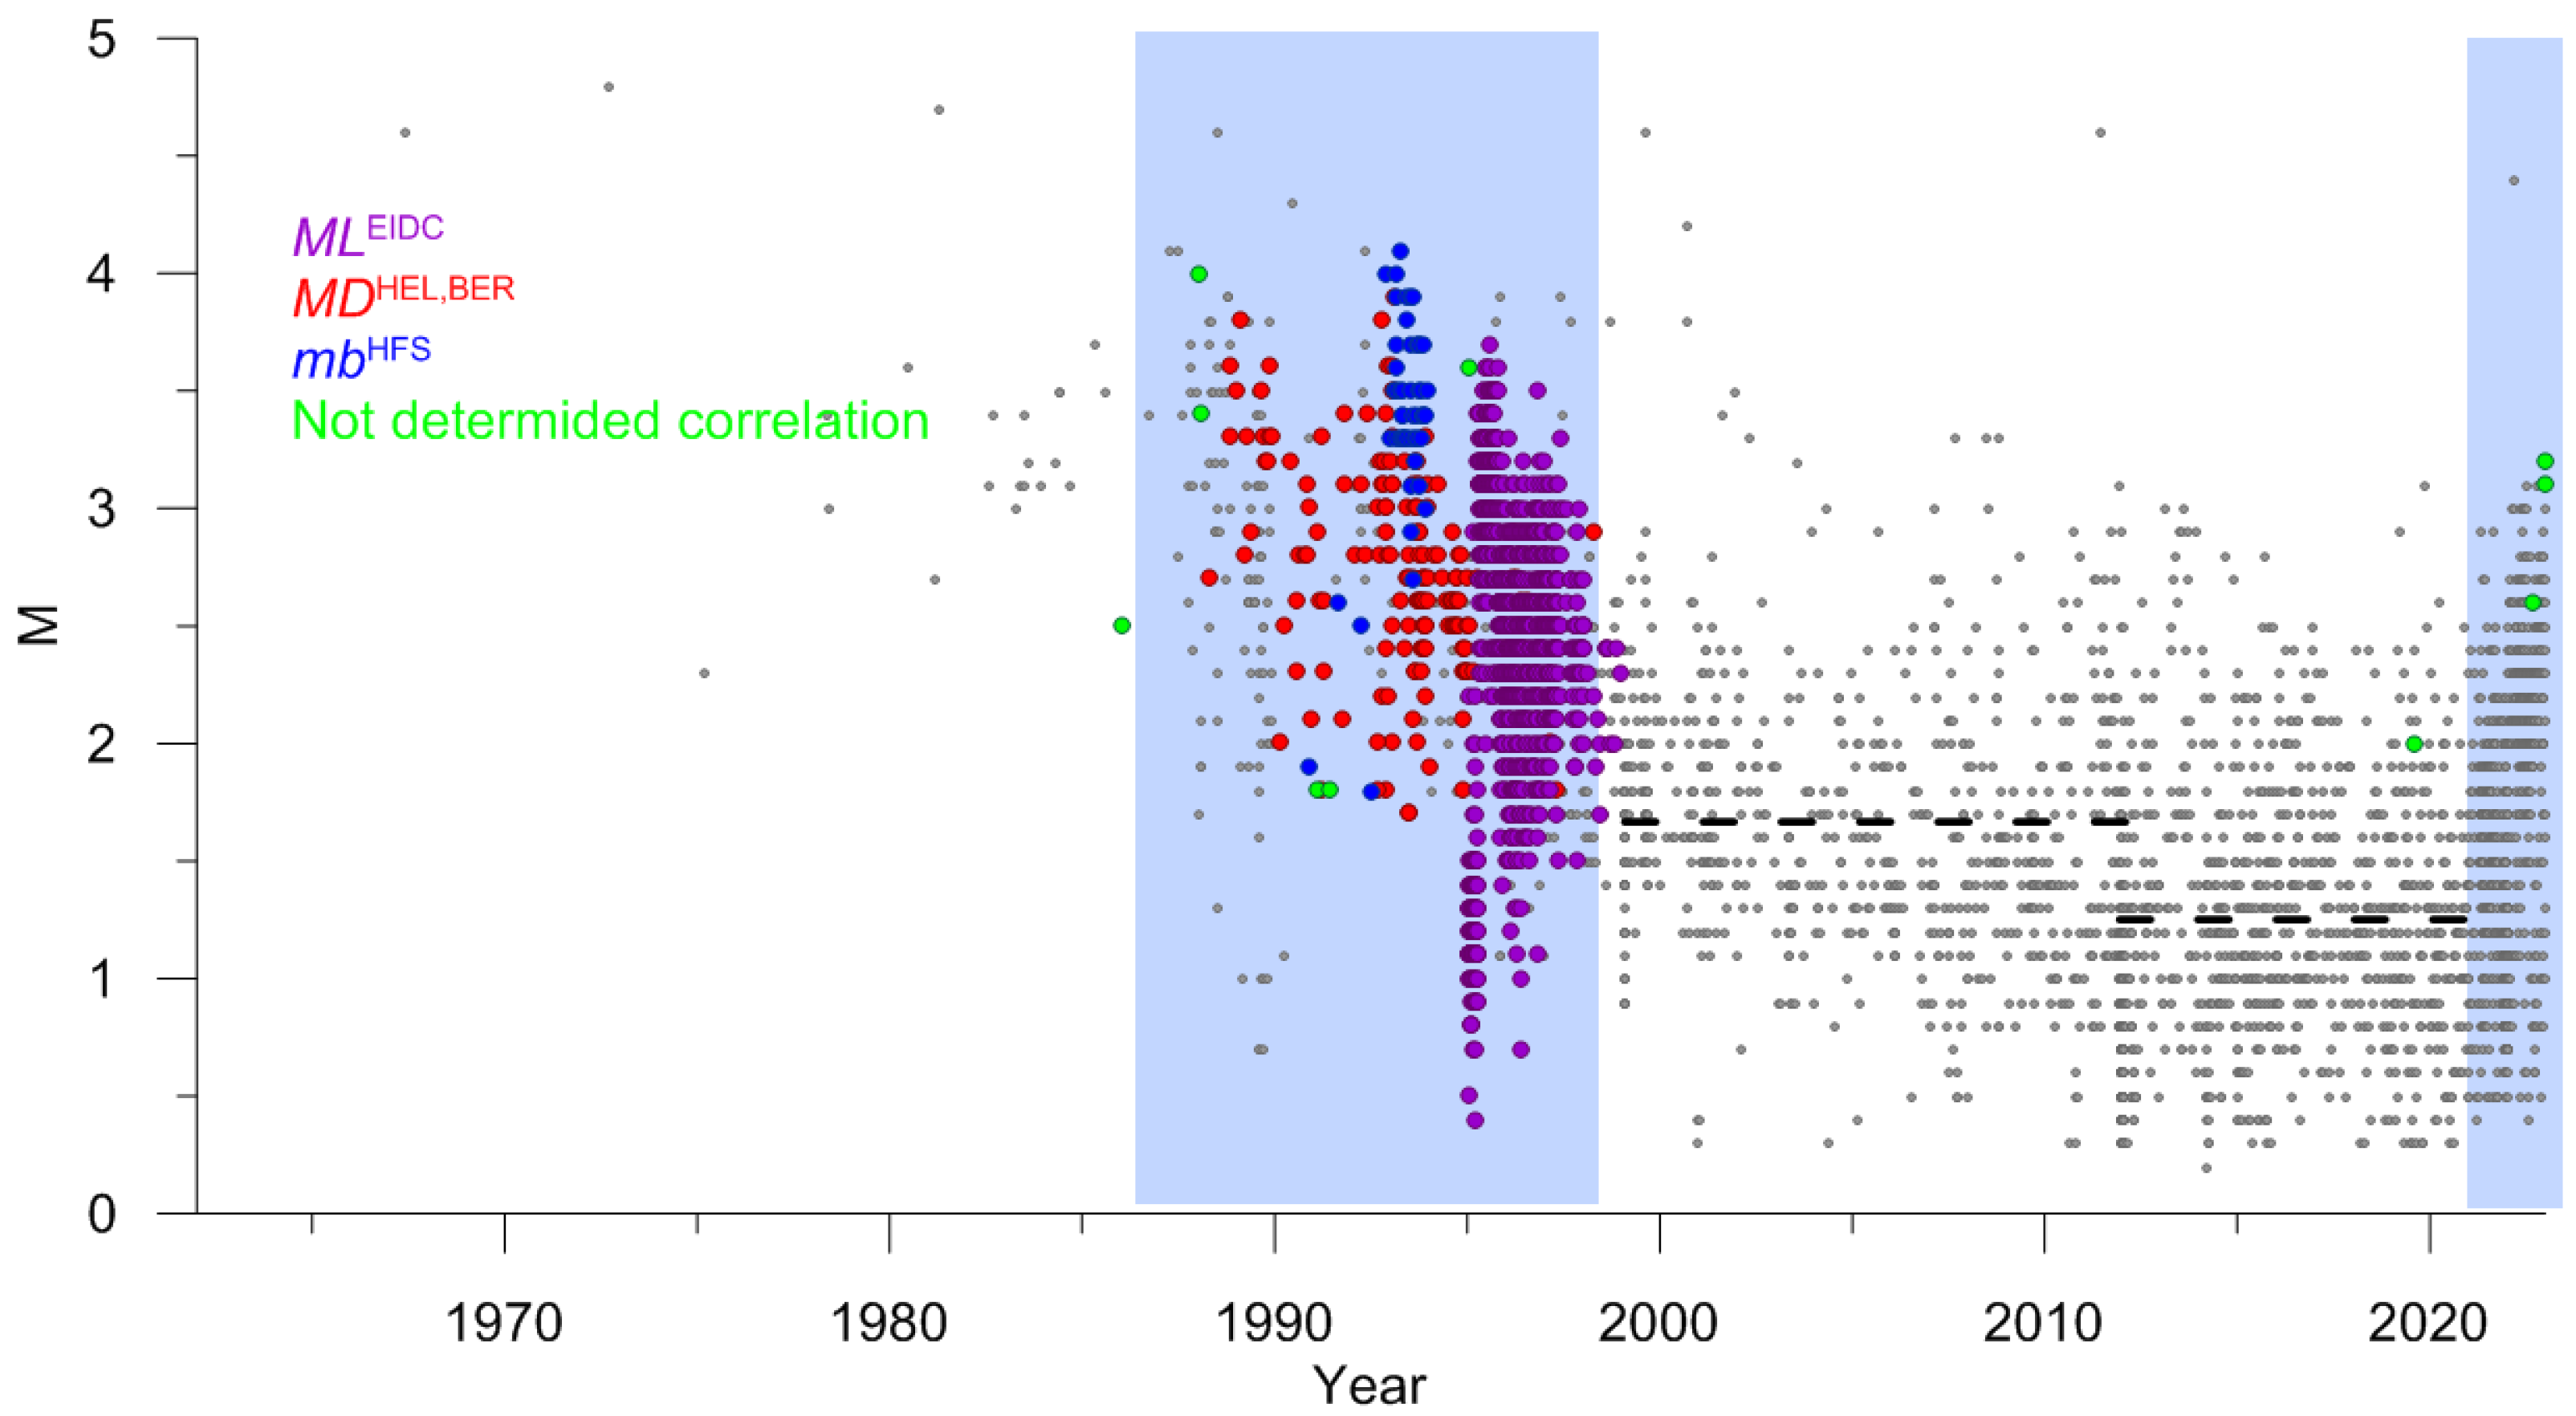
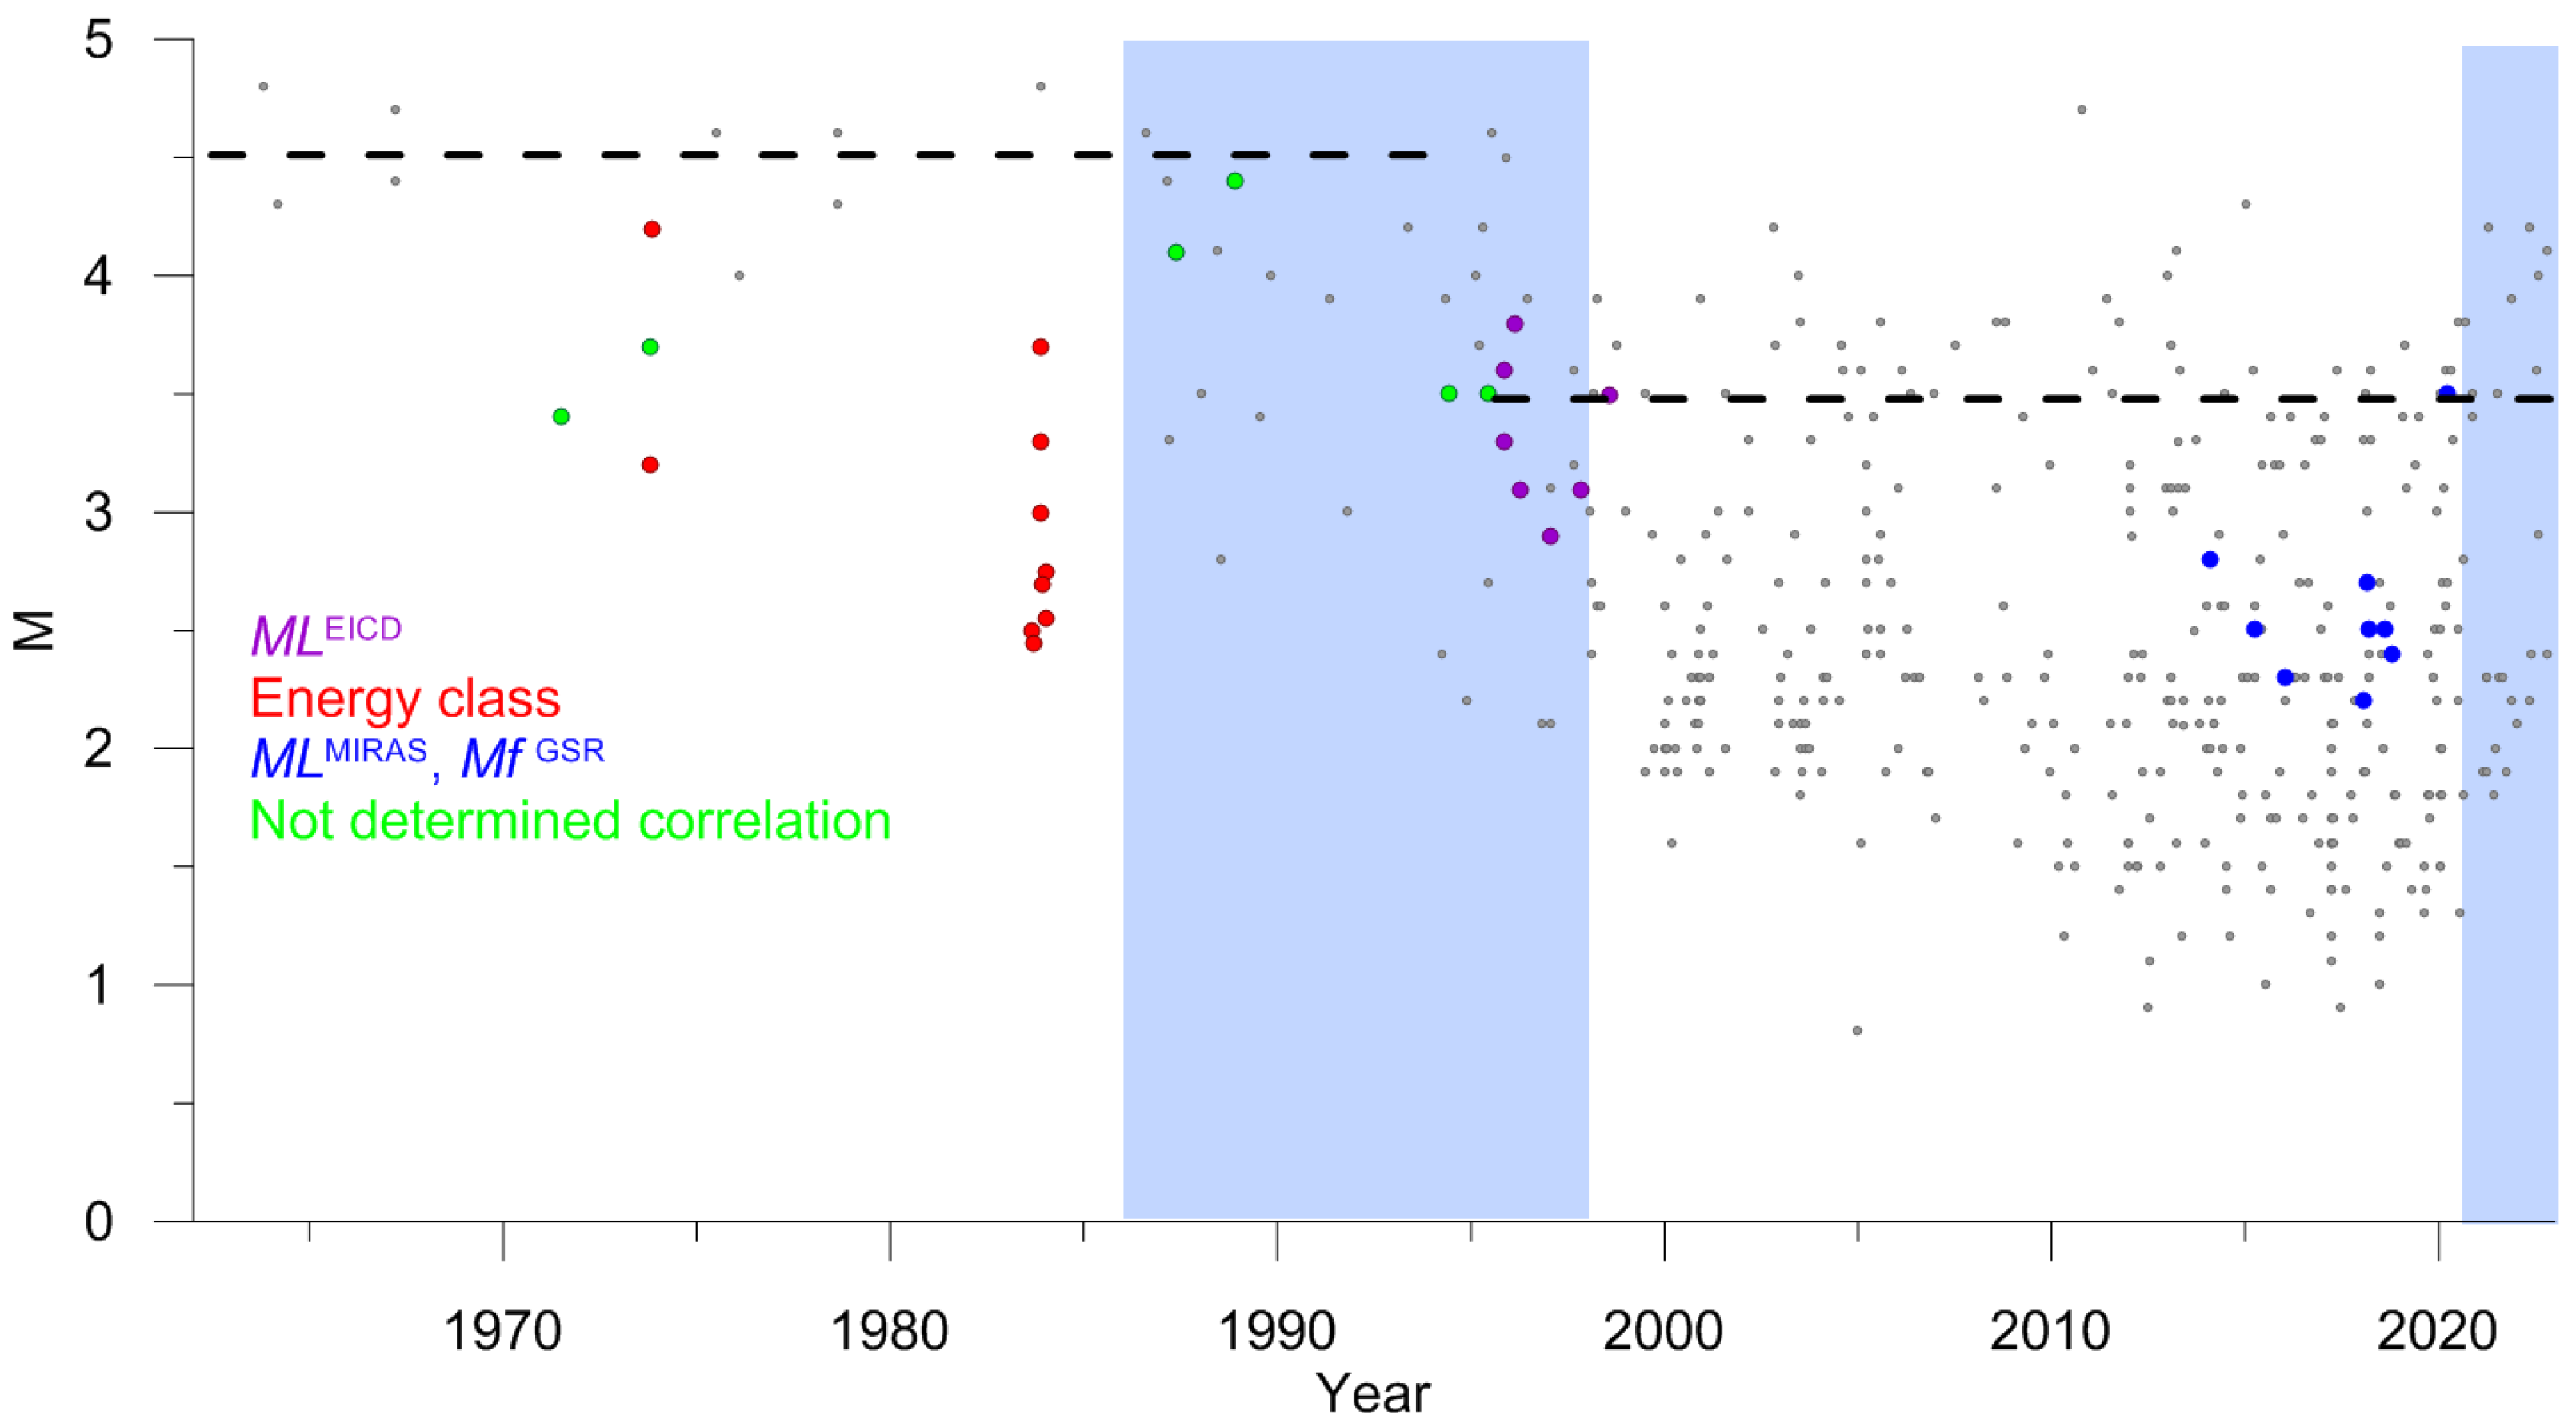
- In the western sector of the AZRF, there are no MwGCMT determinations. Therefore, a direct unification of magnitude to moment magnitude scale was impossible. However, there were a sufficient number of mbISC determinations, which are used in ISC practice to obtain proxy-Mw estimates for earthquakes with M < 5.0 [46]. In the eastern sector of the AZRF, the MwGCMT = mbISC ratio is directly confirmed [7]. All magnitude scales were aligned with mbISC (Figure 14 and Figure 18), and it was hypothesized that the estimates made could be used as proxy-Mw in the western sector of the AZRF for regionally strong earthquakes with M ≥ 3.5, for the overwhelming majority of which mbISC and mbNEIC determinations are known. Interpreting weaker magnitudes as proxy-Mw is certainly controversial, since they fall outside the range for which regression relationships are constructed.
- Unlike the eastern sector of the AZRF, where the overwhelming majority of events had only three types of magnitude estimates (MwGCMT, mbISC, and energy class k), the diversity of magnitude estimates for weak earthquakes in the western sector is very high. This reduces the reliability of determining a unified magnitude scale. For some earthquakes, regression relationships are not determined or extremely unreliable. It should be noted that the number of such events is insignificant during the period of 1998–2020 (Figure 20 and Figure 22);
- The quality of the catalog after 1998 is significantly better. Therefore, for statistical analysis of seismicity parameters, such as the slope of the magnitude–frequency graph (b-value) and the level of seismic activity, we recommend using the catalog for the period of 1998–2020. However, data prior to 1998 may also be useful for other studies, for example, for studying possible sources of regionally strong earthquakes in the basins of the Barents and Kara Seas, where, for natural reasons, the presence of technogenic events is unlikely.
Author Contributions
Funding
Institutional Review Board Statement
Informed Consent Statement
Data Availability Statement
Acknowledgments
Conflicts of Interest
References
- Vorobieva, I.; Gvishiani, A.; Dzeboev, B.; Dzeranov, B.; Barykina, Y.; Antipova, A. Nearest Neighbor Method for Discriminating Aftershocks and Duplicates when Merging Earthquake Catalogs. Front. Earth Sci. 2022, 10, 820277. [Google Scholar] [CrossRef]
- Imanishi, K.; Ando, R.; Kuwahara, Y. Unusual shallow normal-faulting earthquake sequence in compressional northeast Japan activated after the 2011 off the Pacific coast of Tohoku earthquake. Geophys. Res. Lett. 2012, 39, L09306. [Google Scholar] [CrossRef]
- Asano, Y.; Saito, T.; Ito, Y.; Shiomi, K.; Hirose, H.; Matsumoto, T.; Aoi, S.; Hori, S.; Sekiguchi, S. Spatial distribution and focal mechanisms of aftershocks of the 2011 off the Pacific coast of Tohoku Earthquake. Earth Planets Space 2011, 63, 669–673. [Google Scholar] [CrossRef]
- Shebalin, P.N.; Baranov, S.V.; Dzeboev, B.A. The Law of the Repeatability of the Number of Aftershocks. Dokl. Earth Sci. 2018, 481, 963–966. [Google Scholar] [CrossRef]
- Zaliapin, I.; Ben-Zion, Y. Earthquake clusters in southern California. I: Identification and stability. J. Geophys. Res. Solid Earth 2013, 118, 2847–2864. [Google Scholar] [CrossRef]
- Zaliapin, I.; Ben-Zion, Y. A global classification and characterization of earthquake clusters. Geophys. J. Int. 2016, 207, 608–634. [Google Scholar] [CrossRef]
- Gvishiani, A.D.; Vorobieva, I.A.; Shebalin, P.N.; Dzeboev, B.A.; Dzeranov, B.V.; Skorkina, A.A. Integrated Earthquake Catalog of the Eastern Sector of the Russian Arctic. Appl. Sci. 2022, 12, 5010. [Google Scholar] [CrossRef]
- Wetmiller, R.J.; Forsyth, D.A. Seismicity of the Arctic, 1908–1975. Arctic Geophysical Review. Publ. Earth Phys. Br. 1978, 45, 15–24. [Google Scholar]
- Burtman, V.S.; Kolodyazhnyi, S.Y. Fault systems in multiply deformed regions of Eurasia. Russ. J. Earth Sci. 2023, 1, 1–9. [Google Scholar] [CrossRef]
- Kondorskaya, N.V.; Shebalin, N.V. (Eds.) New Catalog of Strong Earthquakes in the USSR from Ancient Times through 1977; Report SE-31; World Data Center A for Solid Earth Geophysics: Boulder, CO, USA, 1982; 608p. [Google Scholar]
- Morozov, A.N.; Vaganova, N.V.; Konechnaya, Y.V. The October 14, 1908 MW 6.6 earthquake in the Barents and Kara Sea region of the Arctic: Relocation based on instrumental data. Polar Sci. 2019, 20, 160–166. [Google Scholar] [CrossRef]
- Morozov, A.N.; Vaganova, N.V.; Asming, V.E.; Kremenetskaya, E.O. Relocation of Early Instrumental Earthquakes in the Arctic. Seism. Instrum. 2022, 58, 32–34. [Google Scholar] [CrossRef]
- Morozov, A.N.; Vaganova, N.V.; Shakhova, E.V.; Konechnaya, Y.V.; Asming, V.E.; Antonovskaya, G.N.; Evtyugina, Z.A. Seismicity of the Arctic in the Early Twentieth Century: Relocation of the 1904–1920 Earthquakes. Bull. Seismol. Soc. Am. 2019, 109, 2000–2008. [Google Scholar] [CrossRef]
- Morozov, A.N.; Vaganova, N.V.; Konechnaya, Y.V.; Asming, V.E.; Dulentsova, L.G.; Evtyugina, Z.A. Seismicity in the far Arctic areas: Severnaya Zemlya and the Taimyr Peninsula. J. Seismol. 2021, 25, 1171–1188. [Google Scholar] [CrossRef]
- Rogozhin, E.A.; Kapustian, N.K.; Antonovskaya, G.N.; Konechnaya, Y.V. New seismicity map for the European sector of the Russian arctic region. Geotectonics 2016, 50, 238–243. [Google Scholar] [CrossRef]
- Nikonov, A.A.; Shvarev, S.V. Holocene Tectonic Activity and Seismicity of the White Sea Basin. Abstract of the Paleoseismological Seminar of the IPE RAS on 16 December 2013. Available online: http://www.ifz.ru/fundamental/tektonicheskaja-aktivnost-belomorskogo-basseina/ (accessed on 1 June 2023). (In Russian).
- Panasenko, G.D. Problems of seismic zoning of the Western sector of the Soviet Arctic. Nat. Econ. North 1986, 14, 4–6. (In Russian) [Google Scholar]
- Avetisov, G.P. Tectonic factors of intraplate seismicity of the Western Arctic. Izvestiya. Phys. Solid Earth 1996, 32, 975–985. [Google Scholar]
- Antonovskaya, G.N.; Kovalev, S.M.; Konechnaya, Y.V.; Smirnov, V.N.; Danilov, A.V. New information about the seismicity of the Russian Arctic based on the work of the seismic station “Severnaya Zemlya”. Arct. Antarct. Res. 2018, 64, 170–181. (In Russian) [Google Scholar] [CrossRef]
- Antonovskaya, G.N.; Kapustiana, N.K.; Konechnaya, Y.V.; Danilov, A.V. Registration capabilities of Russian island-based seismic stations: Case study of the Gakkel ridge monitoring. Seism. Instrum. 2020, 56, 33–45. [Google Scholar] [CrossRef]
- Antonovskaya, G.; Morozov, A.; Vaganova, N.; Konechnaya, Y. Seismic monitoring of the European Arctic and adjoining regions. In The Arctic. Current Issues and Challenges; Nova Science Publishers, Inc.: New York, NY, USA, 2020; pp. 303–368. [Google Scholar]
- Schweitzer, J.; Paulsen, B.; Antonovskaya, G.N.; Fedorov, A.V.; Konechnaya, Y.V.; Asming, V.E.; Pirli, M. A 24-Yr Long Seismic Bulletin for the European Arctic. Seismol. Res. Lett. 2021, 92, 2758–2767. [Google Scholar] [CrossRef]
- Morozov, A.N.; Vaganova, N.V. The Travel Times of Regional P and S for Spreading Ridges in the European Arctic. J. Volcanol. Seismol. 2017, 11, 156–163. [Google Scholar] [CrossRef]
- Morozov, A.N.; Vaganova, N.V.; Asming, V.E.; Peretokin, S.A.; Aleshin, I.M. Seismicity of the western sector of the Russian Arctic. Phys. Solid Earth 2023, 2, 115–148. (In Russian) [Google Scholar]
- Shebalin, P.N.; Gvishiani, A.D.; Dzeboev, B.A.; Skorkina, A.A. Why Are New Approaches to Seismic Hazard Assessment Required? Dokl. Earth Sci. 2022, 507, 930–935. [Google Scholar] [CrossRef]
- Giardini, D. The Global Seismic Hazard Assessment Program (GSHAP)—1992/1999. Ann. Geofis. 1999, 42, 957–974. [Google Scholar] [CrossRef]
- Giardini, D.; Grunthal, G.; Shedlock, K.M.; Zhang, P. The GSHAP Global Seismic Hazard Map. Ann. Geofis. 1999, 42, 1225–1228. [Google Scholar] [CrossRef]
- Ulomov, V.I. General seismic zoning of the territory of Russian Federation: GSZ-2012. Seism. Instrum. 2014, 50, 290–304. [Google Scholar] [CrossRef]
- Ulomov, V.I. Seismic hazard of Northern Eurasia. Ann. Geofis. 1999, 42, 1023–1038. [Google Scholar] [CrossRef]
- Ulomov, V.I.; Peretokin, S.A.; Medvedeva, N.S.; Akatova, K.N.; Danilova, T.I. Seismological aspects of general seismic zoning for the territory of the Russian Federation territory (OSR-97, OSR-2012, and OSR-2014 Maps). Seism. Instrum. 2015, 51, 311–328. [Google Scholar] [CrossRef]
- Zavyalov, A.D.; Peretokin, S.A.; Danilova, T.I.; Medvedeva, N.S.; Akatova, K.N. General Seismic Zoning: From Maps GSZ-97 to GSZ-2016 and New-Generation Maps in the Parameters of Physical Characteristics. Seism. Instr. 2019, 55, 445–463. [Google Scholar] [CrossRef]
- Malovichko, A.A.; Malovichko, D.A.; Golubeva, I.V.; Ivanova, Y.V. Natural and technogenic seismicity of the Ural region. J. Min. Sci. 2005, 41, 6–13. [Google Scholar] [CrossRef]
- Adushkin, V.V. Tectonic earthquakes of anthropogenic origin. Izv. Phys. Solid Earth 2016, 52, 173–194. [Google Scholar] [CrossRef]
- Petrov, V.A.; Minaev, V.A.; Ustinov, S.A.; Nafigin, I.O.; Lexin, A.B. Assessment of Seismogeodynamic Activity of Mining Areas on the Basis of 3D Geoinformation Modeling. Russ. J. Earth Sci. 2022, 6, 1–12. [Google Scholar] [CrossRef]
- Manconi, A.; Picozzi, M.; Coviello, V.; De Santis, F.; Elia, L. Real-time detection, location, and characterization of rockslides using broadband regional seismic networks. Geophys. Res. Lett. 2016, 43, 6960–6967. [Google Scholar] [CrossRef]
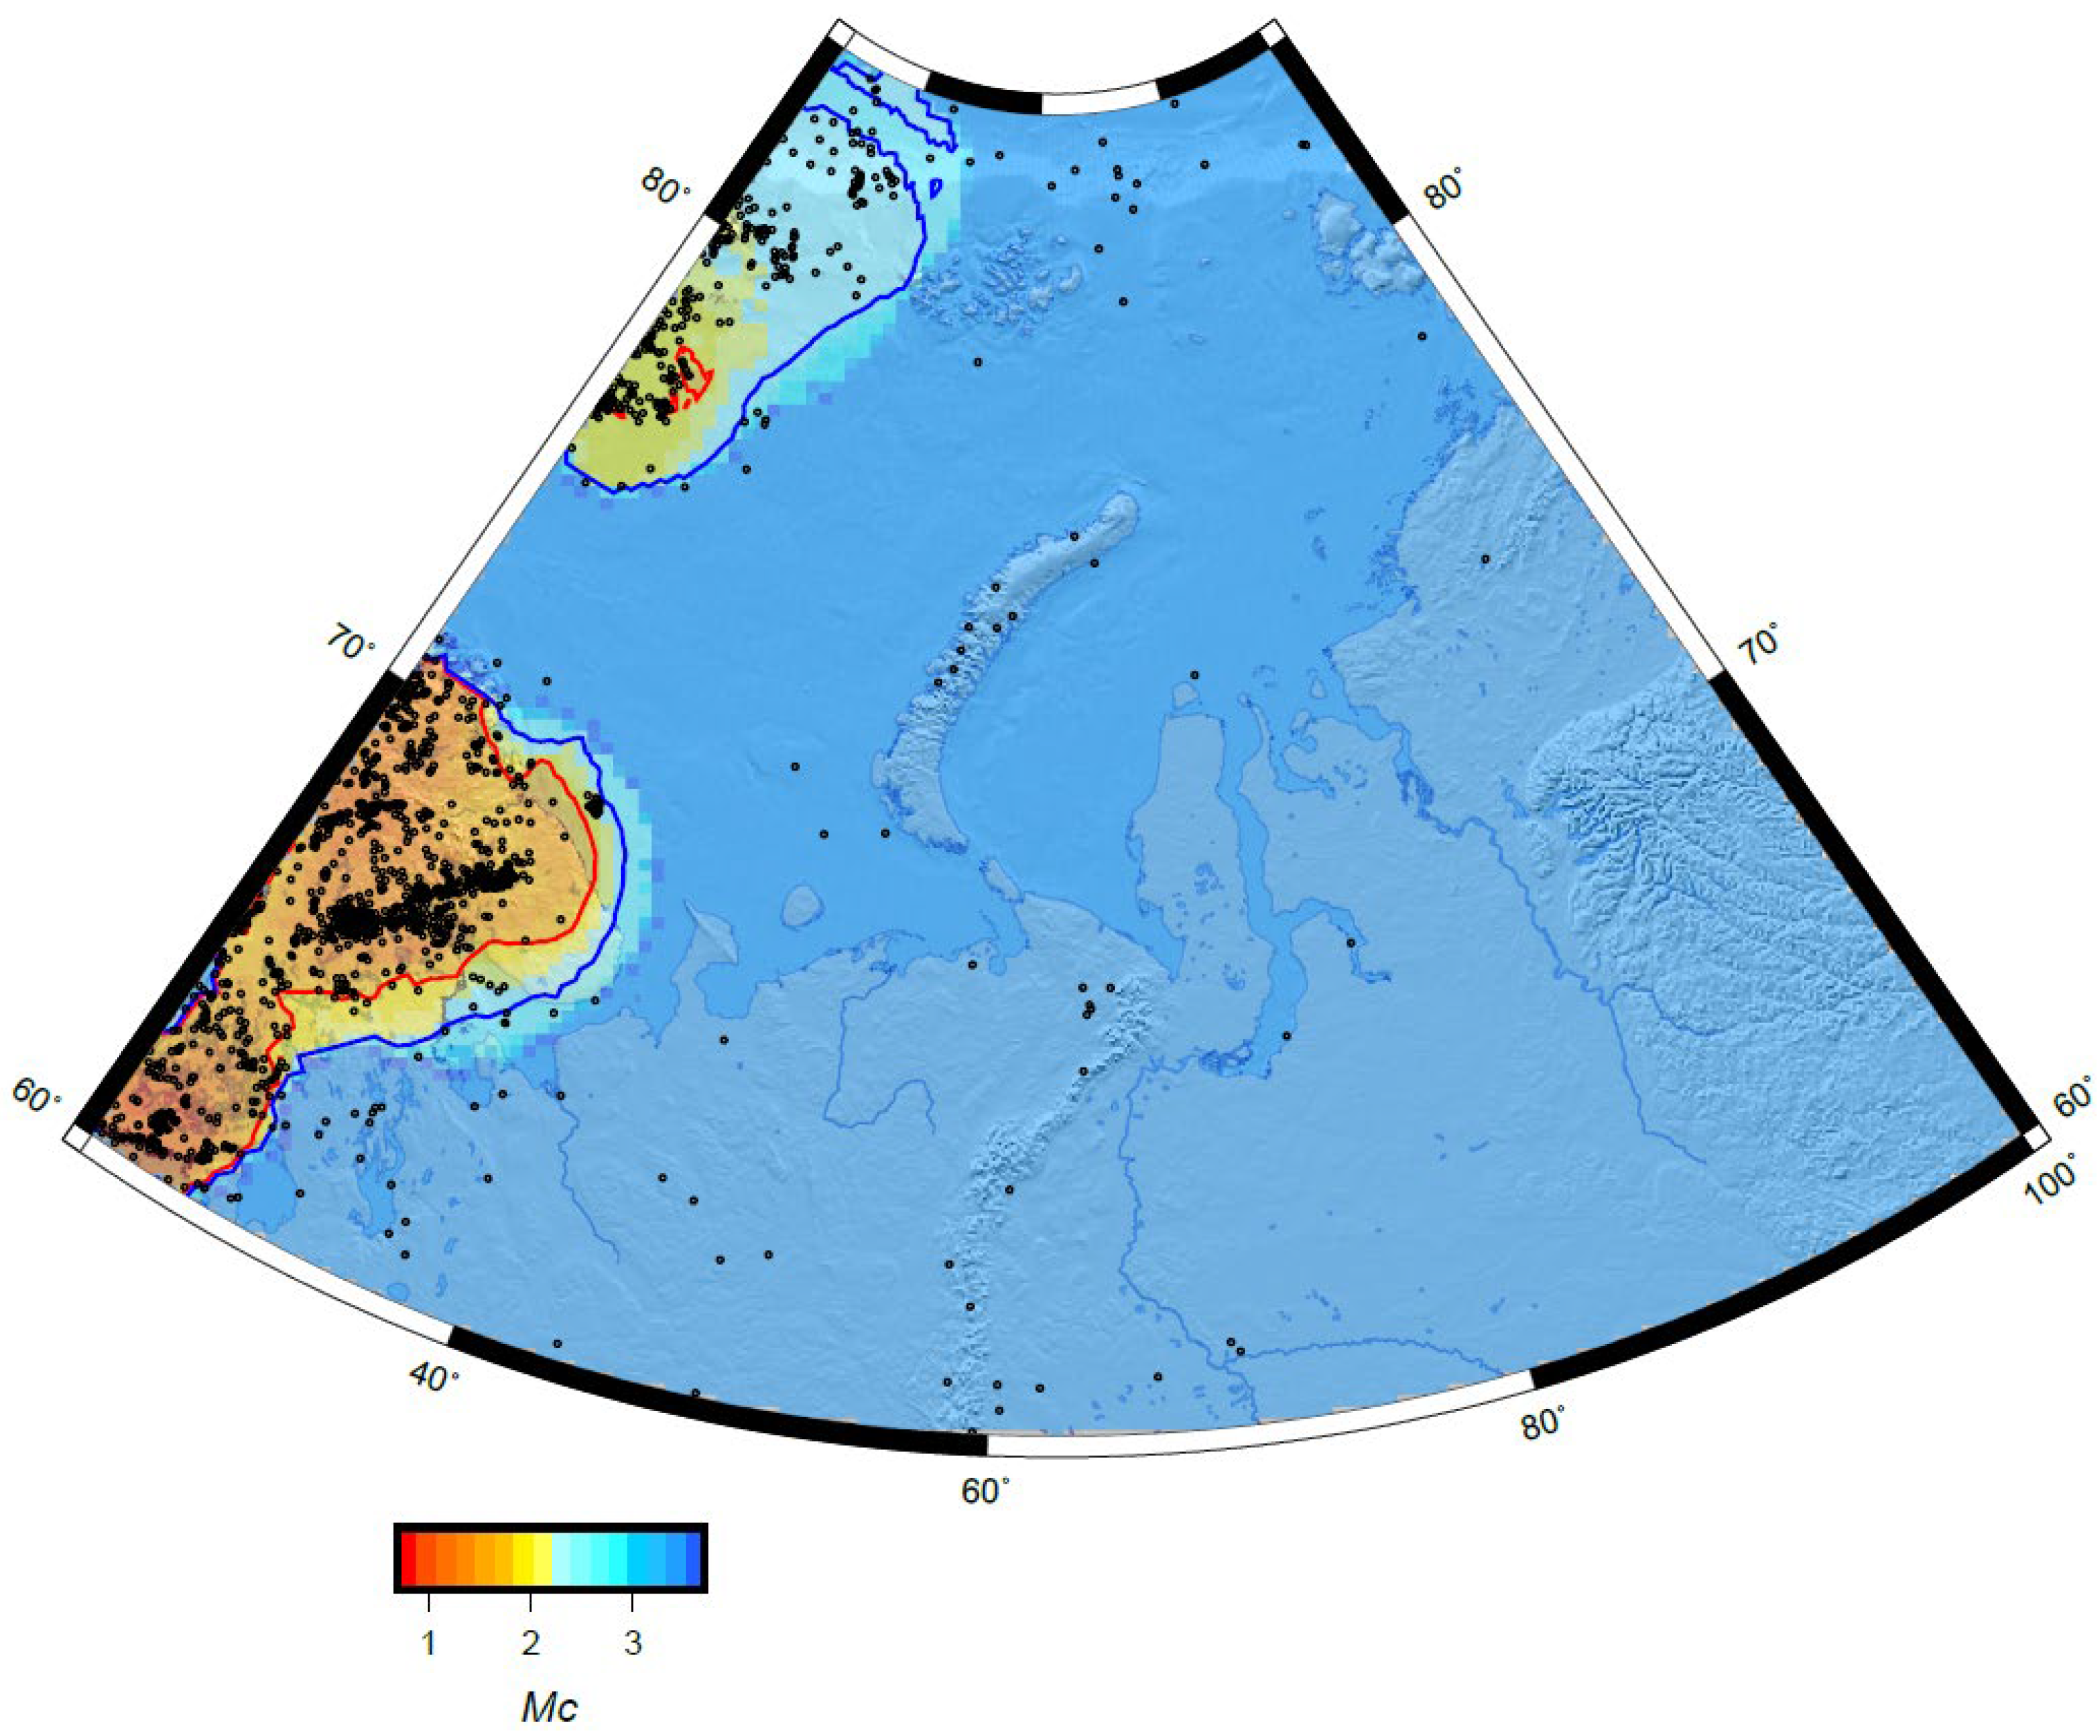
- Vorobieva, I.; Shebalin, P.; Narteau, C.; Beauducel, F.; Nercessian, A.; Clouard, V.; Bouin, M.-P. Multiscale mapping of completeness magnitude of earthquake catalogs. Bull. Seism. Soc. Am. 2013, 103, 2188–2202. [Google Scholar] [CrossRef]
- Dzeboev, B.A.; Gvishiani, A.D.; Agayan, S.M.; Belov, I.O.; Karapetyan, J.K.; Dzeranov, B.V.; Barykina, Y.V. System-Analytical Method of Earthquake-Prone Areas Recognition. Appl. Sci. 2021, 11, 7972. [Google Scholar] [CrossRef]
- Dzeboev, B.A.; Gvishiani, A.D.; Belov, I.O.; Agayan, S.M.; Tatarinov, V.N.; Barykina, Y.V. Strong Earthquake-Prone Areas Recognition Based on an Algorithm with a Single Pure Training Class: I. Altai-Sayan-Baikal Region, M ≥ 6.0. Izv. Phys. Solid Earth 2019, 55, 563–575. [Google Scholar] [CrossRef]
- Dzeboev, B.A.; Soloviev, A.A.; Dzeranov, B.V.; Karapetyan, J.K.; Sergeeva, N.A. Strong earthquake-prone areas recognition based on the algorithm with a single pure training class. II. Caucasus, M ≥ 6.0. Variable EPA method. Russ. J. Earth Sci. 2019, 19, ES6005. [Google Scholar] [CrossRef]
- Dzeboev, B.A.; Karapetyan, J.K.; Aronov, G.A.; Dzeranov, B.V.; Kudin, D.V.; Karapetyan, R.K.; Vavilin, E.V. FCAZ-recognition based on declustered earthquake catalogs. Russ. J. Earth Sci. 2020, 20, ES6010. [Google Scholar] [CrossRef]
- Gorshkov, A.I.; Soloviev, A.A. Recognition of earthquake-prone areas in the Altai-Sayan-Baikal region based on the morphostructural zoning. Russ. J. Earth Sci. 2021, 21, ES1005. [Google Scholar] [CrossRef]
- Gvishiani, A.D.; Dzeboev, B.A.; Agayan, S.M. FCAZm intelligent recognition system for locating areas prone to strong earthquakes in the Andean and Caucasian mountain belts. Izv. Phys. Solid Earth 2016, 52, 461–491. [Google Scholar] [CrossRef]
- Gvishiani, A.D.; Soloviev, A.A.; Dzeboev, B.A. Problem of Recognition of Strong-Earthquake-Prone Areas: A State-of-the-Art Review. Izv. Phys. Solid Earth 2020, 56, 1–23. [Google Scholar] [CrossRef]
- Kossobokov, V.G.; Soloviev, A.A. Pattern recognition in problems of seismic hazard assessment. Chebyshevskii Sb. 2018, 19, 55–90. (In Russian) [Google Scholar] [CrossRef]
- Agayan, S.M.; Tatarinov, V.N.; Gvishiani, A.D.; Bogoutdinov, S.R.; Belov, I.O. FDPS algorithm in stability assessment of the Earth’s crust structural tectonic blocks. Russ. J. Earth Sci. 2020, 20, ES6014. [Google Scholar] [CrossRef]
- Di Giacomo, D.; Bondár, I.; Storchak, D.A.; Engdahl, E.R.; Bormann, P.; Harris, J. ISC-GEM: Global Instrumental Earthquake Catalogue (1900–2009), III. Re-computed MS and mb, proxy MW, final magnitude composition and completeness assessment. Phys. Earth Planet. Inter. 2015, 239, 33–47. [Google Scholar] [CrossRef]


| Stage | Main Catalog | Additional Catalog | Metric Parameters min, km, | Threshold Value of the Metric | Estimation of the Number of Errors | Number of Duplicates | Merged Catalog |
|---|---|---|---|---|---|---|---|
| 1 | ARC 175 events | VEP 748 events | 0.05; 15.0; 15.0 | 10 * | - | 3 * | RUS 920 events |
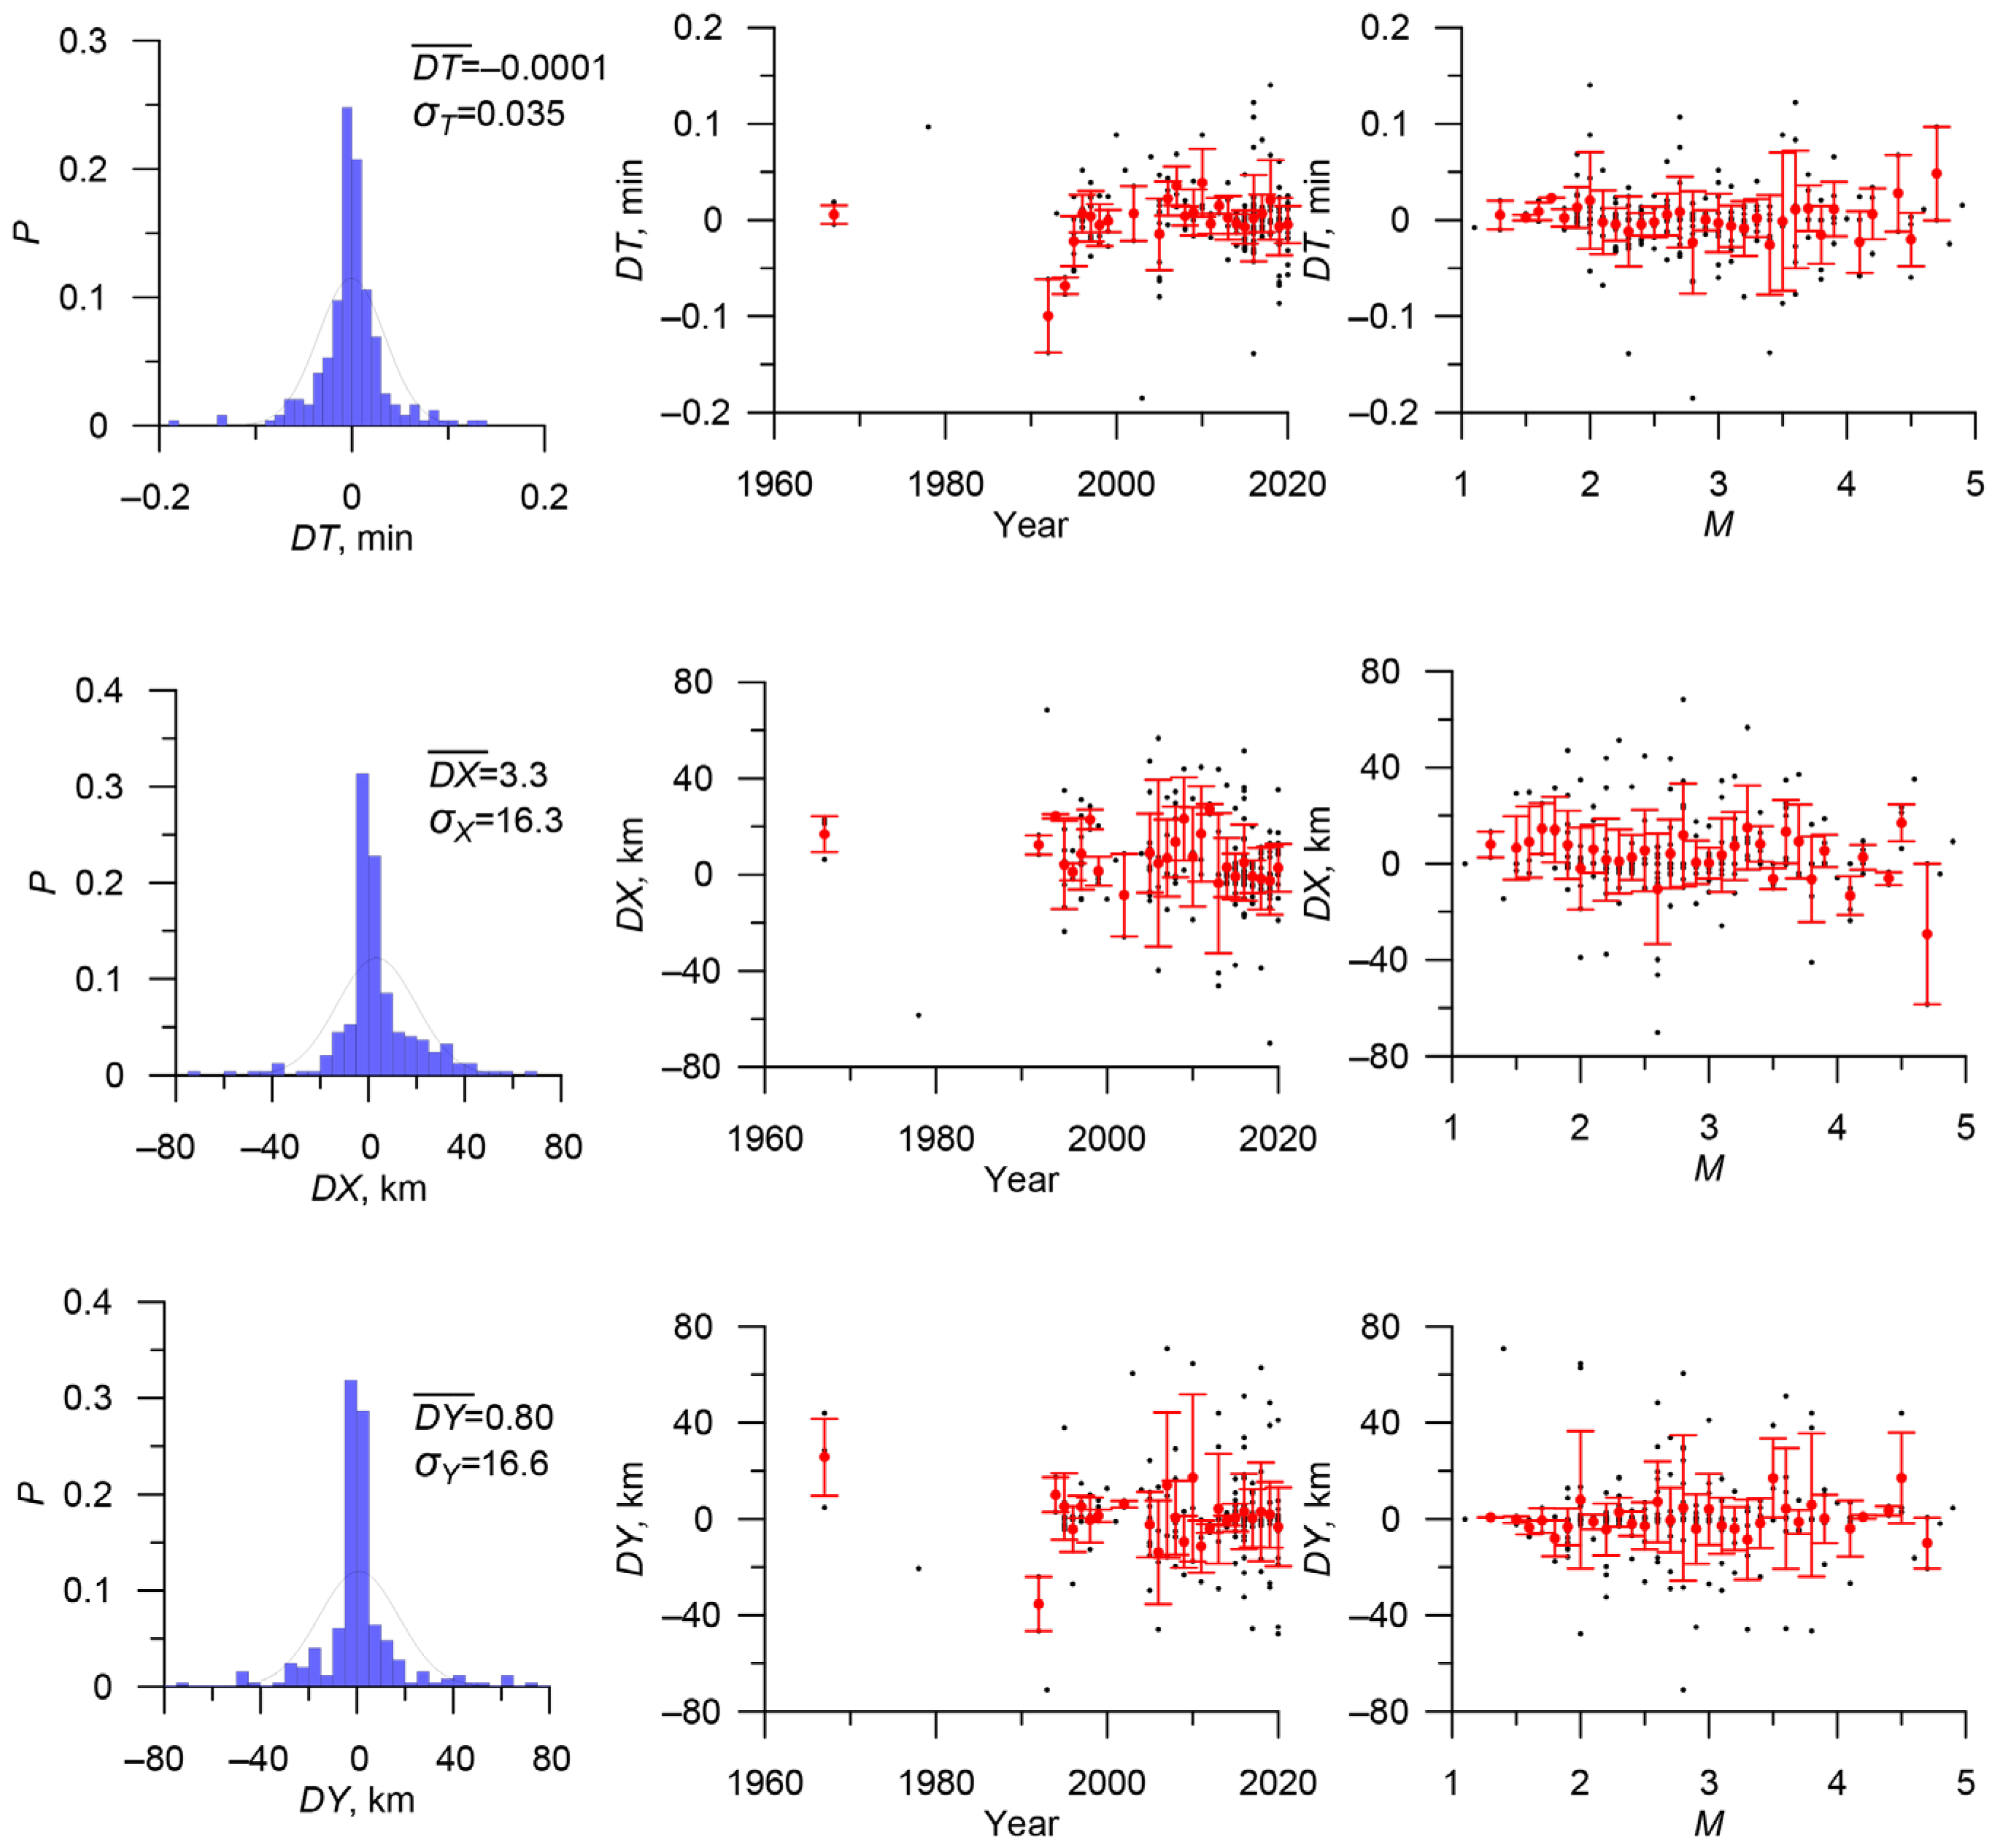
| 2 | ISC 4418 events | RUS 920 events | 0.035; 16.3; 16.6 | 13 | 0.2% | 282 | ISC_RUS 5056 events |
| 3 | Morozov 118 events | ISC_RUS 5056 events | 0.05; 15.0; 15.0 | 20 | 108 | W_ARCTIC0 5066 | |
| 4.1 | W_ARCTIC0 5066 | ER_EXP 14,490 events | 0.05; 15.0; 15.0 | 10 | - | 284 | W_ARCTIC1 4782 events |
| 4.2 | W_ARCTIC1 4782 events | VEP_EXP 170 events | 0.05; 15.0; 15.0 | 10 | - | 4 | W_ARCTIC2 4778 events |
| 4.3 | W_ARCTIC2 4778 events | ISC_EXP 100,112 events | 0.05; 15.0; 15.0 | 10 | - | 92 | W_ARCTIC 4686 events |
| Agency | Type of Magnitude | Priority | Number of Events | Magnitude in the Integrated Catalog | Figure | Mmin—Mmax. Initial Magnitude Scale | Note |
|---|---|---|---|---|---|---|---|
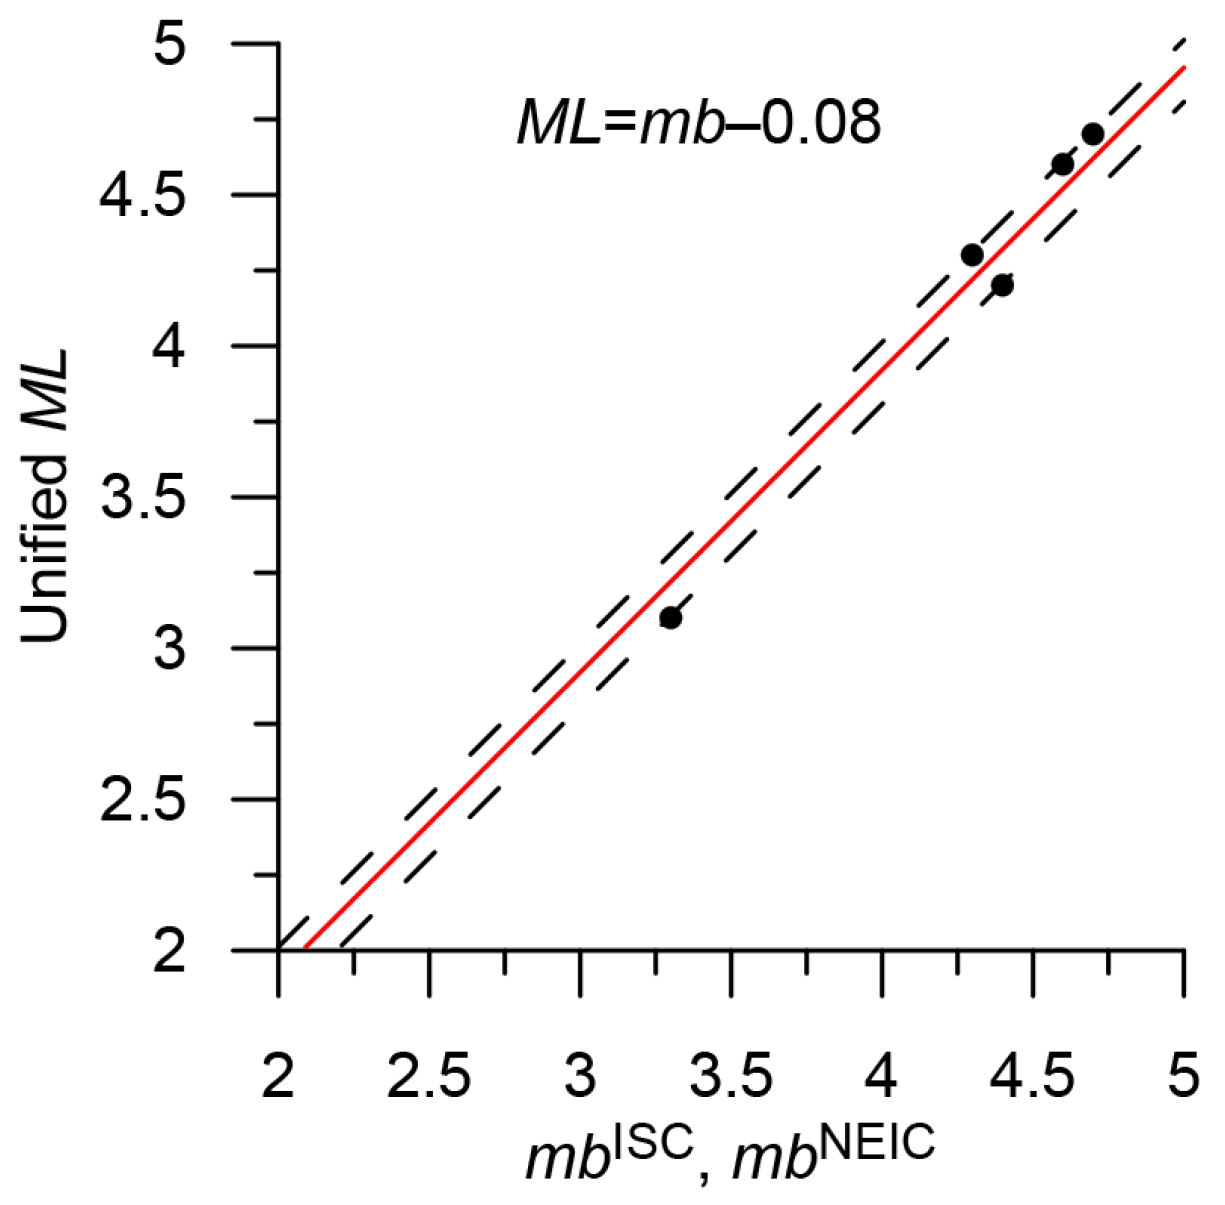
| ISC | mb | 1 | 4 | mb = mbISC | 3.3–4.8 | ||
| NEIC, NEIS | mb | 1 | 3 | mb = mbNEIC | 4.3–4.7 | ||
| KOLA | ML | 2 | 398 | ML = MLKOLA | 0.3–2.7 | ||
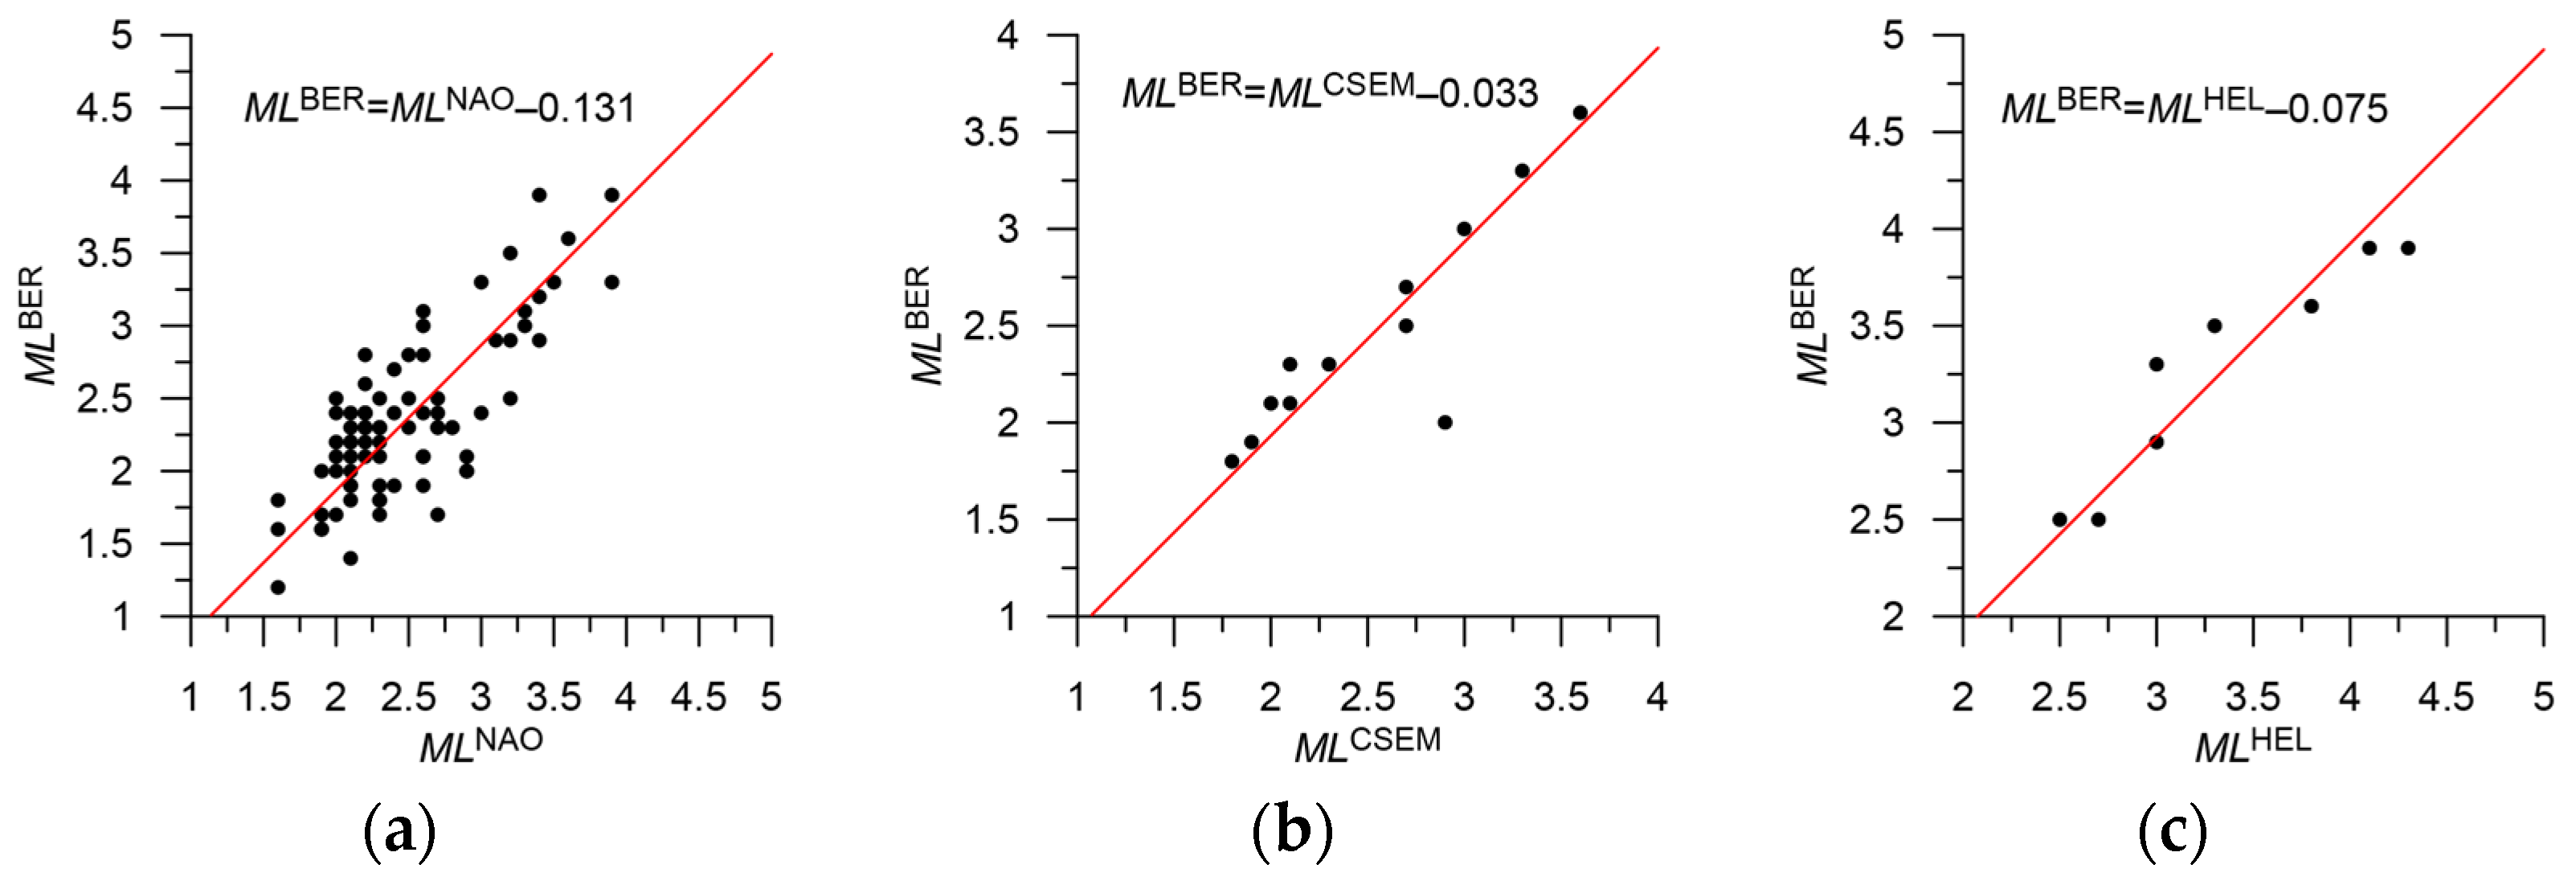
| HEL | ML | 3 | 1554 | ML = MLHEL + 0.3 | Figure 11a | 0.0–3.6 | |
| NAO | ML | 3 | 140 | ML = MLNAO + 0.1 | Figure 11b | 1.1–4.5 | |
| IDC | ML | 3 | 309 | ML = MLIDC | Figure 11c | 0.8–3.4 | |
| BER | ML | 3 | 27 | ML = MLBER + 0.4 | Figure 11d | 0.3–3.4 | |
| UPP | ML | 3 | 42 | ML = MLUPP + 0.2 | Figure 11e | 1.5–3.2 | |
| LVSN | ML | 3 | 76 | ML = MLLVSM | Figure 11f | 0.8–2.4 | |
| VEP | ML | 3 | 319 | ML = MLVEP + 0.2 | Figure 11g | 0.1–4.0 | |
| OBN | ML | 3 | 4 | ML = MLOBN + 0.1 | Figure 11h | 0.1–1.0 | |
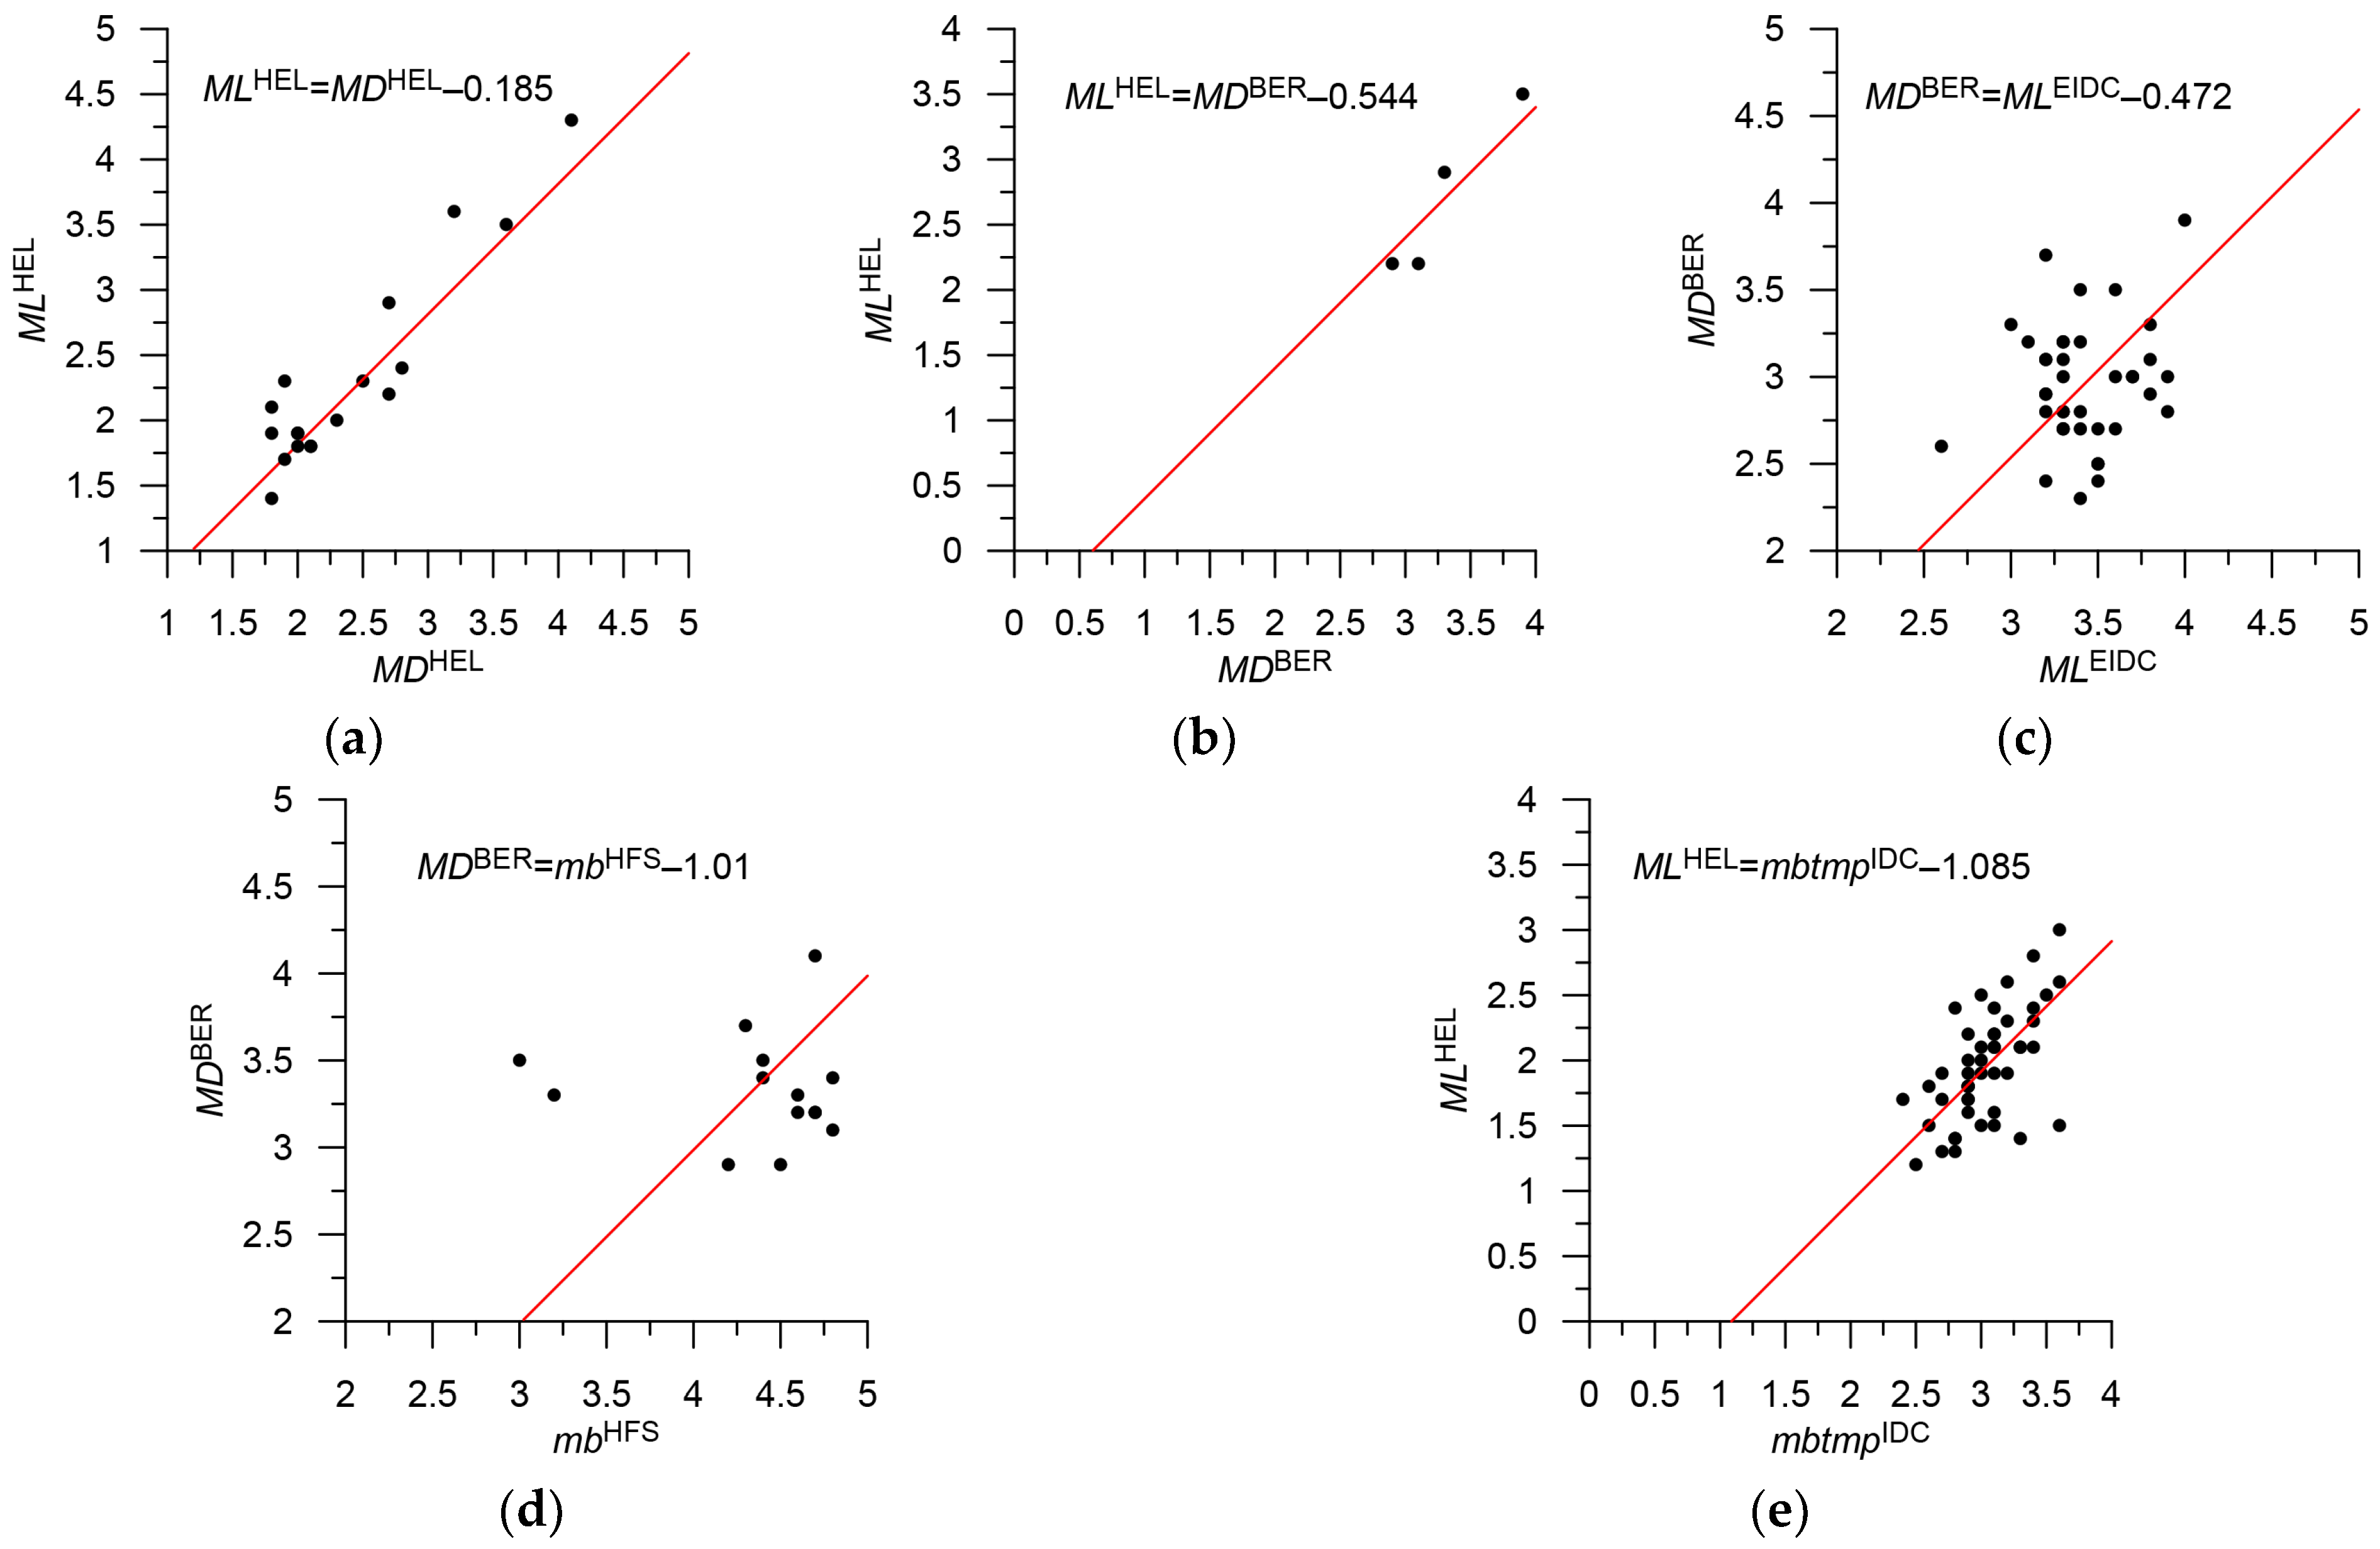
| HEL | MD | 4 | 16 | ML = MDHEL + 0.1 | Figure 13a | 1.6–2.6 | Probably non-earthquakes |
| BER | MD | 4 | 150 | ML = MDBER − 0.2 | Figure 13b | 2.0–4.1 | Probably non-earthquakes |
| EIDC | ML | 4 | 1001 | ML = MLEIDC − 0.7 | Figure 13c | 1.1–4.4 | Indirect correlation through MDBER. Probably non-earthquakes |
| HFS | mb | 4 | 52 | ML = mbHFS − 1.2 | Figure 13d | 3.0–5.3 | Indirect correlation through MDBER. Probably non-earthquakes |
| IDC | mbtmp | 4 | 2 | ML = mbtmpIDC − 0.8 | Figure 13e | 2.8–3.4 | |
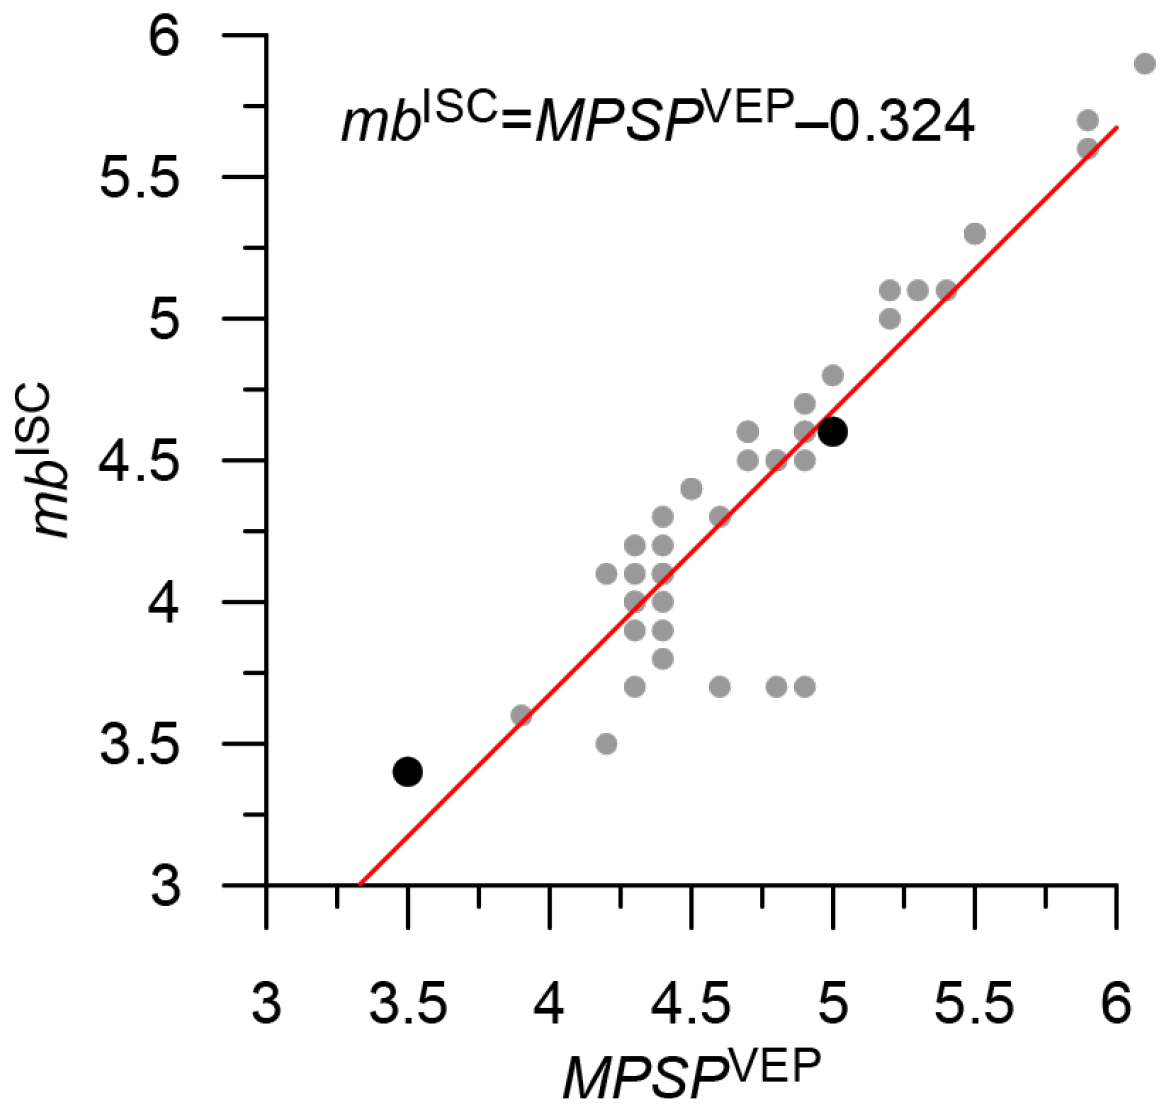
| VEP | MPSP | 4 | 102 | mb = MPSPVEP − 0.3 | Figure 12 | 1.0–4.9 | See note to Figure 12. Probably non-earthquakes |
| NAO | mb | 5 | 2 | M = mbNAO | 3.1–3.2 | Not determined | |
| EIDC | mb | 5 | 1 | M = mbEIDC | 3.6 | Not determined | |
| BER | M | 5 | 3 | M = MBER | 2.5–4.0 | Not determined | |
| HEL | M | 5 | 2 | M = MHEL | 1.8 | Not determined | |
| 4207 |
| Agency | Type of Magnitude | Priority | Number of Events | Magnitude in the Integrated Catalog | Figure | Mmin—Mmax. Initial Magnitude Scale | Note |
|---|---|---|---|---|---|---|---|
| ISC | mb | 1 | 42 | mb = mbISC | - | 3.2–4.8 | |
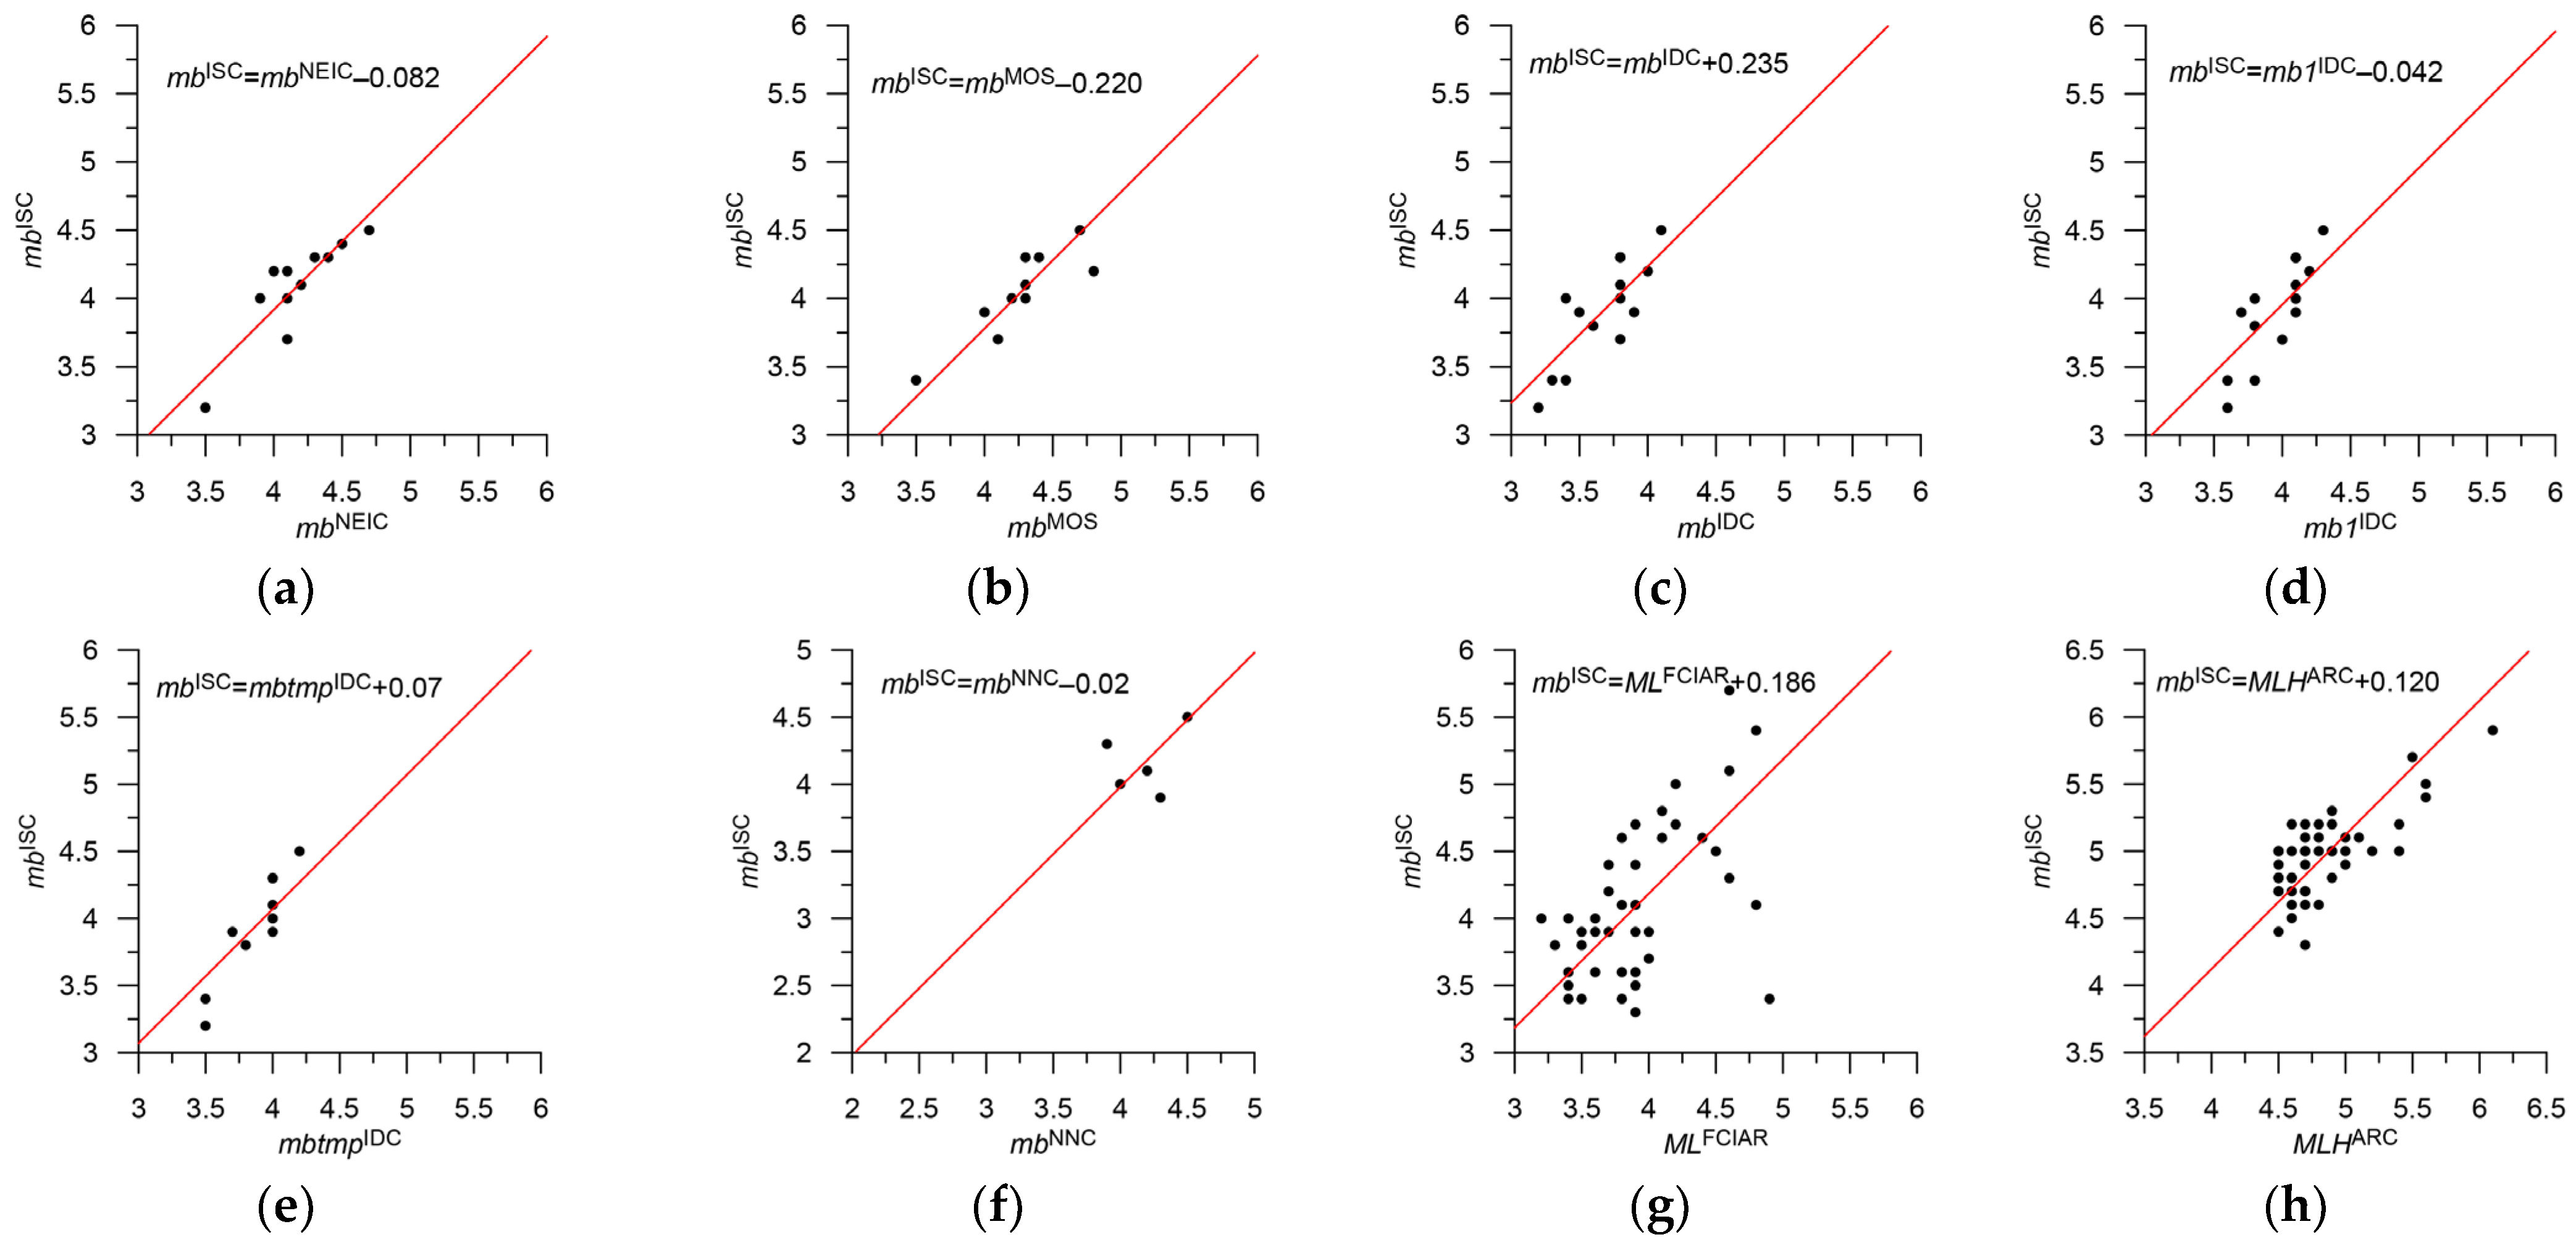
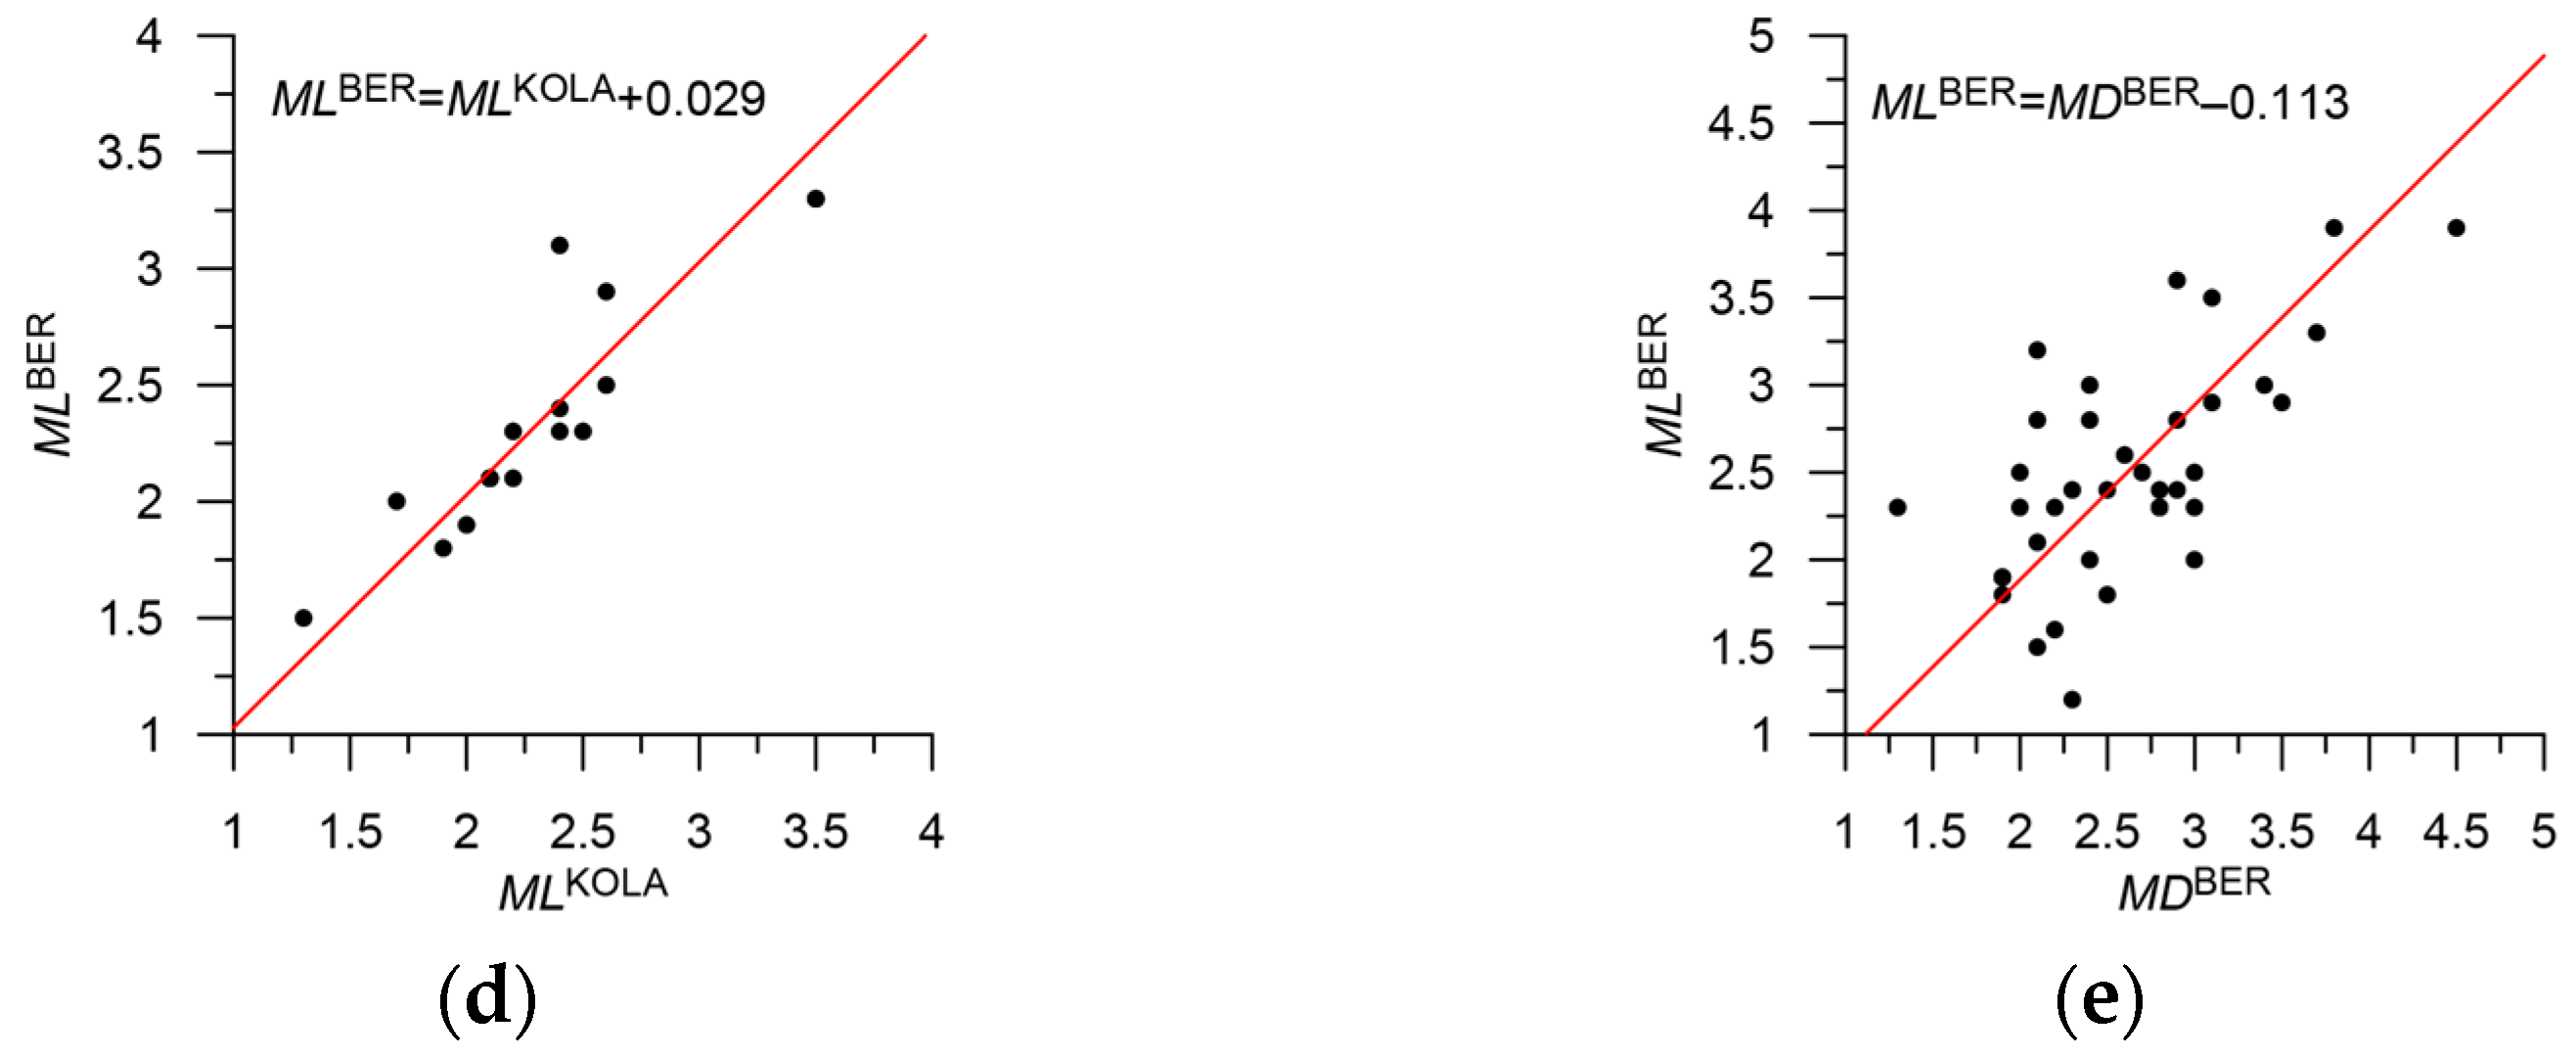
| NEIC, NEIS | mb | 1 | 3 | mb = mbNEIC − 0.1 | Figure 15a | 4.2–4.3 | |
| MOS | mb | 2 | 3 | mb = mbMOS − 0.2 | Figure 15b | 3.6–3.9 | |
| IDC | mb | 3 | 12 | mb = mbIDC + 0.2 | Figure 15c | 2.8–3.7 | |
| IDC | mb1 | 3 | 4 | mb = mb1IDC | Figure 15d | 3.5–3.8 | |
| IDC | mbtmp | 3 | 2 | mb = mbtmpIDC + 0.1 | Figure 15e | 3.6–3.7 | |
| NNC | mb | 3 | 2 | mb = mbNNC | Figure 15f | 3.5–4.0 | |
| BER | ML | 4 | 140 | ML = MLBER | - | 0.9–3.5 | |
| NAO | ML | 4 | 45 | ML = MLNAO − 0.1 | Figure 16a | 1.7–3.7 | |
| CSEM | ML | 4 | 3 | ML = MLCSEM | Figure 16b | 2.9–3.8 | |
| HEL | ML | 4 | 10 | ML = MLHEL − 0.1 | Figure 16c | 1.6–4.0 | |
| KOLA | ML | 4 | 12 | ML = MLKOLA | Figure 16d | 1.5–2.3 | |
| FCIAR | ML | 4 | 92 | mb = MLFCIAR + 0.2 | Figure 15g | 1.3–3.6 | |
| BER | MD | 4 | 11 | ML = MDBER − 0.1 | Figure 16e | 2.2–4.0 | |
| ARC | MLH | 4 | 1 | mb = MLHARC + 0.1 | Figure 15h | 4.7 | |
| MIRAS | ML | 5 | 4 | ML = MLMIRAS − 0.3 | Figure 17b,c | 2.6–3.1 | Indirect corr thru MLIDC |
| VEP | MPSP | 5 | 8 | mb = MPSPVEP − 0.3 | Figure 13 | 2.9–4.8 | See note to Figure 12 |
| EIDC | ML | 5 | 7 | ML = MLEIDC − 0.3 | Figure 17a Figure 16c | 3.2–4.1 | Indirect corr thru MLHEL |
| GSR | Mf | 5 | 5 | mb = MfGSR + 0.2 | Figure 17d Figure 15g | 2.0–3.3 | In the region under study MfGSR = MLFCIAR |
| GSR | Klass | 5 | 10 | mb = k/2 − 1.2 | Figure 17e | 8.5–12 | See note to Figure 17. Probably non-earthquakes |
| NAO | mb | 5 | 4 | M = mbNAO | 3.4–4.4 | Not determined | |
| UPP | ML | 5 | 1 | M = MLUPP | - | 4.1 | Not determined |
| LAO | M | 5 | 1 | M = MLAO | - | 3.7 | Not determined |
| Total | 4022 |
| Time Period, Catalog | N Total | N from ISC | N from GS RAS, Morozov | Mc | N, M ≥ Mc | Mmax |
| 1962–2022 | ||||||
| E_Arctic | 4629 | 4072 (88%) | 558 (12%) | 4.8 | ||
| Kola–Karelia | 4207 | 3754 (89%) | 454 (11%) | 4.8 | ||
| The Kara and Barents shelf | 422 | 256 (61%) | 166 (39%) | 4.8 | ||
| 1998–2020 | ||||||
| E_Arctic | 2126 | 1715 (81%) | 411 (19%) | 3.5 | 50 | 4.7 |
| Kola–Karelia | 1715 | 1506 (88%) | 209 (12%) | 1.7 | 561 | 4.6 |
| The Kara and Barents shelf | 410 | 209 (51%) | 201 (49%) | 3.5 | 44 | 4.7 |
Disclaimer/Publisher’s Note: The statements, opinions and data contained in all publications are solely those of the individual author(s) and contributor(s) and not of MDPI and/or the editor(s). MDPI and/or the editor(s) disclaim responsibility for any injury to people or property resulting from any ideas, methods, instructions or products referred to in the content. |
© 2023 by the authors. Licensee MDPI, Basel, Switzerland. This article is an open access article distributed under the terms and conditions of the Creative Commons Attribution (CC BY) license (https://creativecommons.org/licenses/by/4.0/).
Share and Cite
Vorobieva, I.A.; Gvishiani, A.D.; Shebalin, P.N.; Dzeboev, B.A.; Dzeranov, B.V.; Skorkina, A.A.; Sergeeva, N.A.; Fomenko, N.A. Integrated Earthquake Catalog II: The Western Sector of the Russian Arctic. Appl. Sci. 2023, 13, 7084. https://doi.org/10.3390/app13127084
Vorobieva IA, Gvishiani AD, Shebalin PN, Dzeboev BA, Dzeranov BV, Skorkina AA, Sergeeva NA, Fomenko NA. Integrated Earthquake Catalog II: The Western Sector of the Russian Arctic. Applied Sciences. 2023; 13(12):7084. https://doi.org/10.3390/app13127084
Chicago/Turabian StyleVorobieva, Inessa A., Alexei D. Gvishiani, Peter N. Shebalin, Boris A. Dzeboev, Boris V. Dzeranov, Anna A. Skorkina, Natalia A. Sergeeva, and Natalia A. Fomenko. 2023. "Integrated Earthquake Catalog II: The Western Sector of the Russian Arctic" Applied Sciences 13, no. 12: 7084. https://doi.org/10.3390/app13127084
APA StyleVorobieva, I. A., Gvishiani, A. D., Shebalin, P. N., Dzeboev, B. A., Dzeranov, B. V., Skorkina, A. A., Sergeeva, N. A., & Fomenko, N. A. (2023). Integrated Earthquake Catalog II: The Western Sector of the Russian Arctic. Applied Sciences, 13(12), 7084. https://doi.org/10.3390/app13127084