Glacies 2026, 3(1), 5; https://doi.org/10.3390/glacies3010005 - 23 Mar 2026
Abstract
►
Show Figures
Future contributions to sea level rise from the Antarctic Ice Sheet due to climate change remain one of the largest uncertainties for future sea level. Improving predictions of ice mass loss is a major goal of numerical ice sheet models, but a major
[...] Read more.
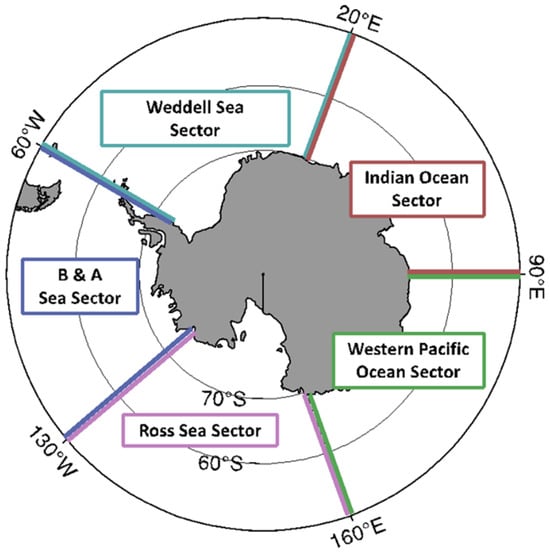
Future contributions to sea level rise from the Antarctic Ice Sheet due to climate change remain one of the largest uncertainties for future sea level. Improving predictions of ice mass loss is a major goal of numerical ice sheet models, but a major difficulty is that ice sheet models assume an empirical fit to modern-day observed speeds to infer sliding parameters. While this results in accurate modern-day comparisons, predictions for future or past climates that have substantially different conditions will be inaccurate if the empirical sliding law used is not appropriate. To help constrain which basal physics is most appropriate and therefore which basal parameterizations should be used in ice sheet models, here, we pursue an understanding of which physical mechanisms are most likely to explain the spatial variability in flowline speeds throughout the Antarctic Ice Sheet. Specifically, we compare observed flowline surface speeds with predictions of speeds from internal ice deformation and Weertman sliding using a conservative range of physical parameters. Despite large uncertainties, we find a number of flowlines where the predictions can be distinguished from each other and one can infer that one of the two mechanisms, or a third mechanism, Coulomb frictional failure, may likely be principally responsible. Geographic patterns in the dominant mechanism are observed. Weertman sliding appears dominant in several flowline clusters in East Antarctica, and there are regional consistencies in the estimated nearness to flotation at locations of inferred initiation of Coulomb failure. Weertman sliding at faster rates is also observed within regions of inferred Coulomb failure, consistent with theoretical expectations. The key finding that the dominant deformation mechanism varies along and between Antarctic flowlines may complicate how ice sheet models need to be parameterized if accurate predictions of future ice loss and sea level rise are to be accurate.
Full article

Figure 1


