Abstract
Glaciers and glacierets of the Kuznetsky Alatau Mountains are distributed at altitudes of 1200–1500 m above sea level, which is not typical for continental areas. The main factor contributing to the persistence of glaciation here is abundant winter precipitation. According to ground surface temperature measurements, the negative annual values are typical for upper glacier boundaries only. Since intensive study during the compilation of the USSR Glacier Inventory (1965–1980), the glaciation of the region has undergone notable changes. To assess the current state of glaciation, Sentinel-2 satellite images were used; contours of the glaciers were traced on the basis of images from 2021 to 2023. In total, 78 glaciers and 57 glacierets were identified. UAV imagery and field inspection were used for validation. The total glaciated area has reduced from 8.5 to 3.1 km2, which is 50–75% for selected river basins, with slope morphological types decreasing the most. According to our opinion, the morphological classification requires clarification due to absence of hanging glaciers, described previously.
1. Introduction
The Kuznetsky Alatau Mountains extend in the submeridional direction along the southeastern border of the West Siberian Plain (Figure 1). This is the most northwestern mountain structure of the Altai–Sayan mountain country and consists of many ridges and plateaus with average altitude of 400–800 m a.s.l. Numerous rivers of the Tom and Chulym River basins (Ob System) originate here (Figure 1). All rivers, whose basins are shown in Figure 1, have a mountainous character; the biggest is Bely Iyus basin (5370 km2), the second by size—Cherny Iyus (4290 km2), the third—Usa basin (3610 km2). The elevation range covers 300–2200 m a.s.l.
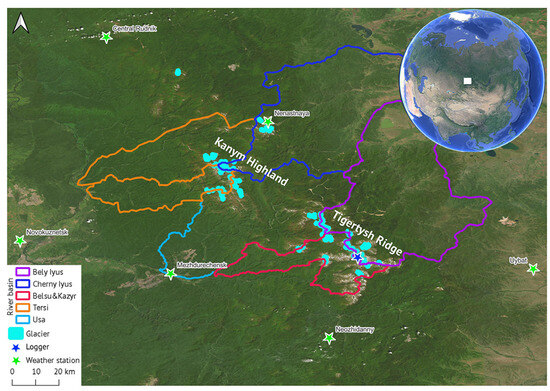
Figure 1.
Study area of the Kuznetsky Alatau region. The boundaries of river basins are shown in different colors. Glaciers are not shown to scale.
A peculiarity of the Kuznetsky Alatau Mountains’ relief is the widespread sharp asymmetry of the western and eastern slopes. The eastern slope has a dissected relief with deeply incised valleys, glacial cirques and Pleistocene moraine complexes. The western macroslope is relatively gentle. It is dissected into slightly incised valleys with steep dips. The most elevated structures are the Kanym Highlands and Tigertysh Ridge (Figure 1).
Permafrost is an important component of the geosystem in the study area and is distributed discontinuously above the tree line with a maximum thickness of 100–150 m [1]. The mean annual air/ground temperatures (MAAT/MAGT) are in the range of a few degrees below zero, according to [2].
The relief of the Kuznetsky Alatau Mountains influences the formation of the region’s climate, which is characterized here by great diversity [3]. The sharp frontal orographic uplift of the mountain system, together with the presence of latitudinally orientated valleys and ridges, favors the occurrence of strong upward air currents, intensive development of condensation processes and moisture release in a relatively small territory. Therefore, the Kuznetsky Alatau Mountains’ slopes are a powerful moisture condenser. The western slopes are the first to intercept moisture, and the amount of precipitation here reaches 2000 mm/year or more, whereas the eastern slopes are significantly less moistened—400–800 mm/year. The relief influences the direction of cyclones, forcing them to shift to the northeast. The slopes of the ridges and massifs of the Kuznetsk Alatau are mostly covered with stone placers—kurums. At altitudes of over 1200–1300 m a.s.l., stone polygons, medallion spots, and mountain and solifluction terraces are common. The most favorable physical and geographical conditions for the formation of kurums were during the Ice Age, when large parts of the goltsy regions were in periglacial zones. Thus, favorable conditions were formed for the energetic disintegration of rocks.
Climatic conditions are favorable for the existence of glaciers and perennial snowfields. These objects are located at relatively low absolute altitudes well below the equilibrium line altitude (ELA) in the continental regions of Eurasia and are of great interest for research in the context of current climate change.
The notable regional feature is a large proportion of glacierets [4], small ice masses of indefinite shape in hollows, river beds and on protected slopes, which develop from snowdrifts, avalanches and/or especially heavy accumulation in certain years; usually, no marked flow pattern is visible, and they exist for at least two consecutive years. These objects are always included in inventories based on satellite data but are obviously more variable year to year.
2. Materials and Methods
The study of glaciers in the Kuznetsky Alatau Mountains began in the late 20th century. The first glacier was discovered in 1967. The identification of glaciers was based on aerial photographs and field observations by P.S. Shpin’; 91 glaciers with a total area of 6.8 km2 were identified [5].
In the beginning of 2000s, A.A. Syubaev studied 8 glaciers and reported that the number of glaciers had greatly decreased [6]. Between 2004 and 2006, 6 glaciers of the Kuznetsk Alatau were visited and measured by N.V. Kovalenko [7]. Starting from 2002, M.M. Adamenko monitored 30 glaciers [8] and studied the features and dynamics of snow accumulation in the Alatau Mountains against the background of modern climate change [9].
Between 2016 and 2018, a group of scientists [10] updated the “Glaciers of Russia” inventory for the Kuznetsky Alatau Mountains on the basis of Sentinel-2 satellite images; 101 glaciers with a total area of 3.4 km2 were identified. These data were also included in the Randolph Glacier Inventory 7.0.
Since 2022, researchers from the Institute of Geography (Moscow, Russia) started investigations in the region, described in this paper.
To assess changes in the glaciation area, we used published glacier inventories, different satellite imaginary (Table 1) and climate data (Table 2). To analyze the trends in the total glaciated area dynamics, the area values for individual glaciers and total area values for different time periods (1980, 2018, 2021 and 2023) were compared in Excel.

Table 1.
List of satellite images scenes used in this study.

Table 2.
Main climatic characteristics according to weather station data (1970–2024) used in this study: temperature (MAAT—mean annual air; tsum—mean annual summer) and precipitation (Pyear—mean annual; Pwarm—mean annual warm period; Pcold—mean annual cold period).
The CORONA program was a series of American strategic reconnaissance satellites (KH-1…4) produced and operated from 1960 to 1972 by the Central Intelligence Agency Directorate of Science & Technology with substantial assistance from the U.S. Air Force. HEXAGON was a series of photographic reconnaissance satellites (KH-9) launched by the United States between 1971 and 1986.
The Sentinel-2A satellite was launched in 2015 as part of the European Space Agency’s Copernicus program. The satellite carries a multispectral instrument with 13 spectral bands in the visible, near-infrared and shortwave infrared spectra. The contours of snow and ice objects were decrypted manually in the ArcGIS-ArcMap program via multispectral imaging capabilities. The Sentinel-2 normalized difference snow index (NDSI) has been used to differentiate between cloud and snow cover as snow absorbs shortwave infrared light but reflects visible light, whereas clouds are generally reflective of both wavelengths. Snow cover is represented in bright vivid blue (Figure 2d). False color and vegetation indices based on shortwave infrared (SWIR) were used for cross-validation (Figure 2b,d). All images were acquired at the end of the ablation season, ranging from mid-August to mid-September, when glaciers are mostly free of seasonal snow, under cloud-free (<10%) conditions. Shape files with the glacier contours are available at “www.glacru.ru (accessed on 1 February 2025)” [10].
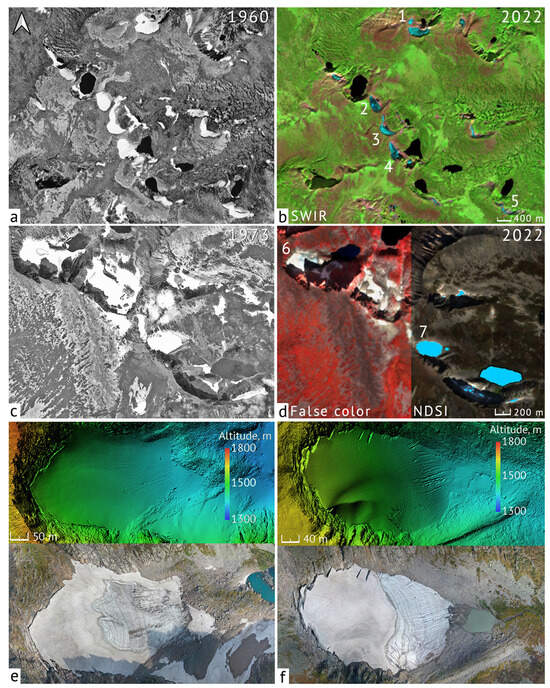
Figure 2.
Selected glaciers at different time periods. Iyus region: KH-1 Corona image (18 August 1960) (a); Sentinel-2 image (10 September 2022) (b), 1—Uchastnikov ekspedicii, 2—Centralny, 3—Tolmacheva, 4—Churakova, 5—Cherno Iyussky. Tigertysh region: KH-9 Hexagon image (11 August 1973) (c); Sentinel-2 image (10 September 2022) (d), 6—Tronova, 7—Karatash. Digital elevation models and orthophotos (DJI Mavic 2 Pro) (31 August 2022) of the Tronova (e) and Karatash (f) glaciers.
The interpretation error mainly depends on the resolution of the satellite image in terms of what can be seen and the contrast between the glacier and adjacent terrain. The accuracy is approximately equal to the image resolution plus the objective uncertainty of what to consider as the glacier boundary. Taking into account the pixel size in the images and the small size of the glaciers, the total error of area determination can reach up to 10%, and up to 15% for glacierets due to even smaller dimensions. This is comparable with the uncertainty in other studies, like in [11]. Orthophotos of the selected glaciers taken from UAVs (Mavic 2 Pro and Mavic 3 Classic by DJI, Nanshan, China and Evo II by Autel, Nanshan, China) in 2022 and 2024 were used to validate measurements based on satellite data. Agisoft Metashape 2.2.0 software was used for ortho-transformation and DEM creation.
The ASTER GDEM V3 DEM with a resolution of 30 m/pixel and a vertical error of ±20 m was used to determine elevation and aspects.
Data from the HOBO MX temperature loggers, installed at the ground surface during 2022–2024, were used to evaluate temperature conditions (MAGST) in the glacier’s adjacent area.
The analysis of meteorological parameters from weather stations consisted of determining the trends in temperature and precipitation in the study area.
The repeat photography method was used to evaluate the area changes of glaciers and to separate glacierets. The small size allows the whole glacier to be covered by the one overview photograph. Comparing photographs from different years (from a similar point and date), it is possible to visually identify changes in the size, shape and ice thickness. This method has been applied to those years for which remote sensing and aerial photography data are not available. Among those objects that were identified in 2023, paired photographs were collected for 29 sites, and overview photographs were collected for 72 sites. The oldest photographs date from the early 20th century.
3. Results
3.1. Glaciation Review
All glaciers of the Kuznetsky Alatau Mountains feed tributaries of the Chulym and Tom Rivers (belonging to the Ob River system) and are concentrated in the most elevated areas (Figure 1). More than 70% of the glaciers occupy slopes with northeastern and eastern aspects. The common size of the glaciers is 0.01–0.15 km2, and they are located at low hypsometric levels (1200–2000 m for the lowest point and 1300–2080 m for the highest, Figure 3). There is no strong correlation between size and elevation range of each glacier. The larger the glacier is, the wider the average elevation range it covers. The largest glaciers typically sit in the range of 1300–1900 m a.s.l.
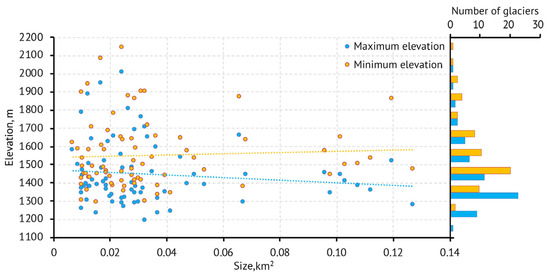
Figure 3.
Elevation of highest and lowest points vs. glacier size. The number of glaciers with certain maximum (orange) and minimum (blue) values in each elevation interval is shown on the right panel.
Glaciers are represented by cirque and slope morphological types. Slope glaciers (Figure 4e–h) dominate in areas of mountain slops immediately below the watershed line or under the curve of mountain terraces and are usually characterized by a convex transverse profile and sickle-shaped longitudinal plan. Cirque glaciers exist on the shaded walls of the relict cirques formed by Pleistocene glaciation (Figure 4a–d). These glaciers do not occupy the entire cirque but rather adjoin to its back walls. The bottom of the cirques is often occupied by lakes, separated from glaciers by modern moraines. In previous inventories, the hanging type was distinguished, but at present it is not possible to find one. Glacierets look similar to slope glaciers (Figure 4i,j).
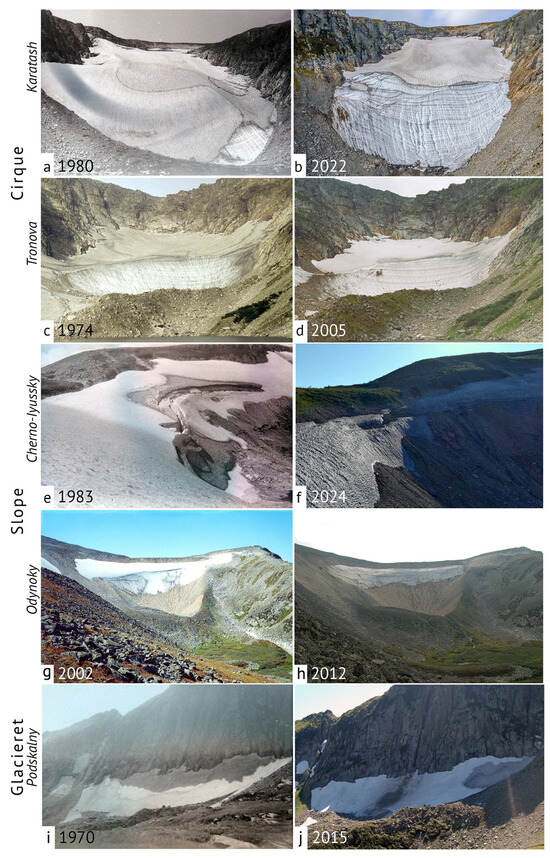
Figure 4.
Changes in glaciers boundaries shown by paired photographs taken in late August. Cirque type: Karatash (a) 1980 (P.S. Shpin’) and (b) 2022 (A.A. Abramov); Tronova (c) 1974 (P.S. Shpin’) and (d) 2005 (M.M. Adamenko). Slope type: Cherno-Iyussky (e) 1983 (P.S. Shpin’) and (f) 2024 (M.M. Adamenko); Odinokiy (g) 2002 (A.A. Subaev) and (h) 2012 (M.M. Adamenko). Glacieret: Podskalny (i) 1970s (P.S. Shpin’) and (j) 2015 (M.M. Adamenko).
According to previous studies, snow accumulation on the glaciers is up to 8000–10,000 mm in the water layer, with ice thicknesses ranging from several meters to 60–70 m [12].
We used a list of features to distinguish glaciers from glacierets. The features indicating glacierets when analyzing the satellite images were as follows:
- Area less than 0.02 km2;
- Significant changes in the spatial configuration of the object—the 2018, 2021 and 2023 contours do not correspond to each other;
- Spatial configuration that does not resemble a glacial shape.
The glacieret features investigated during the field observations were as follows:
- Presence of snow and firn;
- The absence of an ice core and annual layering;
- Absence of movement: no ogives, moraines or fracture cracks;
- A time of continuous existence ranging from several years to a few decades.
The field observations are crucial, as distinguishing glacierets by remote sensing analysis is hard, due to their size and short-term changes in appearance. As a result of the analysis, we identified 78 glaciers and 58 glacierets among 135 objects (Table 3).

Table 3.
Number of decrypted objects in the Kuznetsky Alatau Mountains by river basins for 2023.
3.2. Historical Photos
Comparison of photos from Figure 3 illustrates changes for glaciers of different morphological types since the 1980s. Karatash and Tronova glaciers (Figure 4a–d) were classified by P.S. Shpin’ as a hanging valley [12], but now they are obviously typical cirque glaciers. Despite the current climate changes, they are still sustainable and have all the features of a glacier: they are composed of ice and have a convex profile; in the second half of August, the ice core is free from seasonal snow, and annual layers can be clearly traced.
The area reduction since the 1980s was mainly due to the separation of the upper firn field. From the 2000s to 2015, a tendency toward an increase in ice thickness and the advance of the glacier front was revealed. Figure 4i,j show Podskalny, which is classified as a slope-type glacier [12]. In our opinion, this object is a glacieret. As shown in the photographs from 2005 and 2015, it lacks an ice core, is composed of snow and firn, and follows the shape of the slope, with a thickness of several meters.
Figure 4e,f show Cherno-Iyussky, which is classified as a slope-type glacier [12]. This glacier is the most studied one in the area. In the central part, there is a rocky ledge, which is the reference point for assessing the change in glacier size (60–70% reduction since the 1980s, Figure 5). Slope glaciers do not have developed niches to accumulate snow, which leads to higher ablation due to warmer summers.
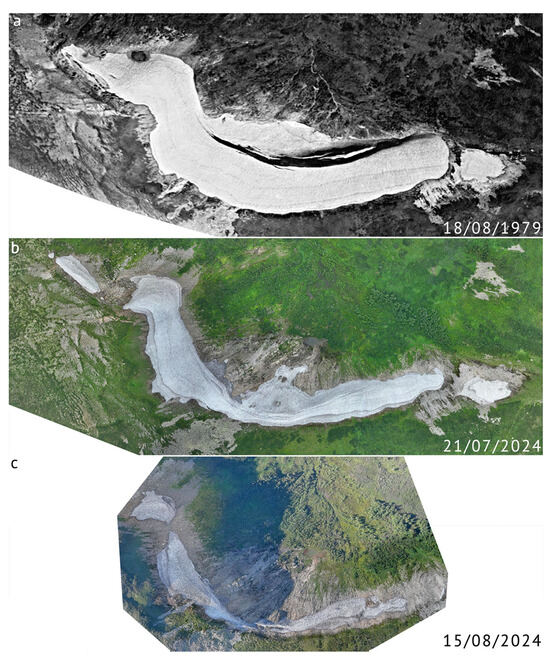
Figure 5.
Cherno-Iyussky glacier in different years and seasons: (a) late summer of 1979; (b) mid-summer of 2024; (c) late summer of 2024.
Figure 4g,h show Odinokiy glacier, which was originally classified as a hanging type [12], but now it is obviously a typical slope glacier. It was observed in 2002 and 2012 and was constantly shrinking. In fact, in 2012, we observed only the ledge, which consisted of stratified white ice that was a few tens of meters thick. Approximately 12 annual layers of ice could be counted. In the past, the glacier lay at the back wall of the north-northeast Pleistocene cirque and was surrounded by a powerful moraine shaft. The moraine slope proximal to the glacier is composed of brown material completely free of vegetation. This indicates that glacier retreat did not occur a long time ago. Moreover, if we assume that in the 1980s, the glacier probably covered the inner slope of the moraine, its area could not be more than 0.09 km2, although the USSR Glacier Inventory indicated 0.13 km2, probably due to increased snow accumulation in this particular year.
3.3. Climate Data Analysis
According to the analyzed data from the meteorological stations (Table 1), the MAAT over the last three decades ranged from −1.7 °C in the high-mountain central areas to ~1.0 °C in the northeastern macroslope.
Precipitation decreases from west to east in the foothills, with the maximum during the warm period of the year. In high mountains, precipitation reaches 1000 mm/year (up to 10,000 mm/year on the glaciers), mainly in the solid state.
The climate conditions of the mountain area are insufficiently studied. The only permanent weather stations, Nenastnaya (1178 m) and Kommunar (842 m), are located on the eastern slope in the forest zone; their observation results should be used cautiously for climate of the subalpine and alpine belts of the Kuznetsky Alatau, where glaciers are located. In previous publications, we proved the representativeness of data from the Nenastnaya station for estimating the temperatures of summer months in the glacio-nival zone of the Kuznetsk Alatau, on the basis of a comparison of the station dataset with the measurements of P.S. Shpin’ on the Karatash glacier [8].
The available meteorological stations do not allow estimation of the amount of precipitation on the windward (western) macroslope, which was proven by comparing the data of snow measurement surveys in the reserve “Kuznetsky Alatau” with their data.
Thus, the snow cover height for the first half of March at the Nenastnaya weather station is 15–18% of the snow cover height on the western macroslope (Rybnoye Lake, 1029 m a.s.l.), with only 41 km in a straight line between the observation points [9].
According to published data, precipitation in the foothills of the western macroslope varies greatly. The maximum annual precipitation is estimated to reach 1500 mm/year [13]. P.S. Shpin’ estimated the maximum amount of precipitation to be high as 2190 mm/year. The results of snow surveys in the watershed zone of the windward macroslope indicate a possible amount of precipitation of up to 3000 mm/year or more [9,14].
According to our analysis of the weather stations’ records, the trends of the mean summer air temperature (tsum) revealed a slight positive trend (0.5 °C/10 year, 1970–2024). The solid precipitation (Pcold) increased slightly (up to 200 mm) in the foothills and was stable in the mountains (Figure 6). These climate conditions in recent decades were not optimal for glacier development in the Kuznetsky Alatau. However, this statement requires verification by glaciological monitoring given the insufficient meteorological data on solid precipitation on the western macroslope.
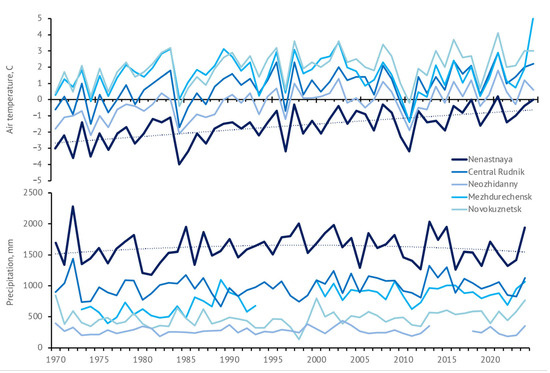
Figure 6.
Dynamics of climate parameters at the region’s weather stations for 1970–2024. Mean annual air temperature and precipitation values are shown. Polynomial trends (n = 2) are shown for the Nenastnaya data by dotted lines.
Ground Temperatures
To better understand the temperature conditions in the mountain area, we analyzed data from the temperature loggers (Figure 7). The mean annual ground surface temperature was below 0 °C only near the upper boundary of the Karatash glacier (−1.7 °C) and 2.1 °C for the terminal part correspondingly. These data are obtained for the first time and are a good indicator of permafrost presence at the plateaus. Numerous sorted circles, patterned ground and solifluction terraces are observed around.
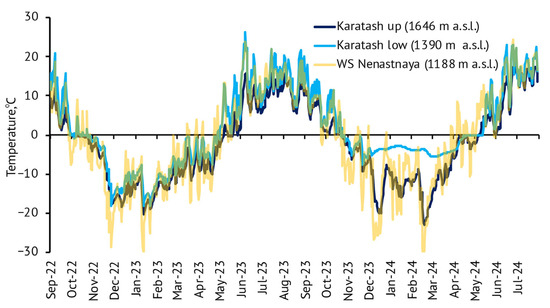
Figure 7.
Mean daily ground surface temperatures in the vicinity of the Karatash glacier according to automated measurements from 2022 to 2024. Mean daily air temperatures for the Nenastnaya weather station are shown for comparison.
The terminal part of the Karatash glacier is more sensitive to snow accumulation. The 2024 winter temperatures were obviously higher due to thicker snow cover.
3.4. Assessment of Glacier Area Changes Since the 1980s
Climatic changes toward warming resulted in a response from glaciers. After the inventory of 1980s, the total glacier area in the region as a whole showed a decreasing trend due to the increase in air temperature during the ablation period (Table 4). The greatest reduction in the glacier area was observed from 2002 to 2004 for slope glaciers and glacierets.

Table 4.
Reduction in the glaciated area (Darea, %) for the 1980–2023 period, averaged by basin.
During the period from 2004 to 2015, some noticeable glacier advances were recorded in the region [8]. The area of the largest cirque glaciers tended to increase. Thus, the areas of the Karatash and Central’ny glaciers increased by 0.02 and 0.04 km2, respectively, which was 15% and 20% of their area in the 1980s [5]. This was caused by an increase in winter precipitation. The increase in the glacier area was accompanied by an increase in ice thickness, as revealed by surveys of the Karatash glacier in 2005 and 2015 [8].
Table 4 compares the glaciated area of the entire mountain system by basins according to the USSR Glacier Inventory and the results of Sentinel-2 satellite imagery analysis for 2023. Since the 1980s, a significant reduction (up to 75% for some areas) has been observed (Figure 8a–c). All the objects (glaciers and glacierets in total) have shrunk significantly since the 1980s, with maximum changes observed for the Usa River basin (where glacierets prevail) and minimum changes in the Tersi River basin (approximately equal numbers of glacierets and glaciers). In general, slope glaciers have reduced their area the most, as have, to a lesser extent, cirque glaciers (Figure 8a).
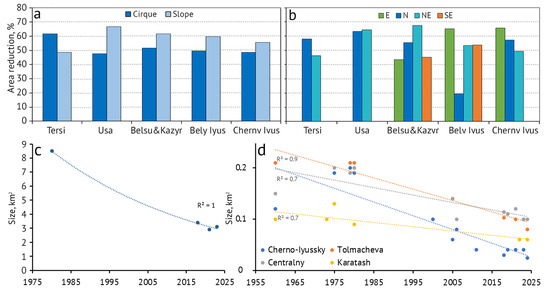
Figure 8.
Reduction in the glaciated areas for 1980–2023: (a) by morphological type; (b) by aspect; (c) total area, with exponential trend shown by the dotted line; (d) selected glaciers, with linear trends shown by dotted lines.
A comparison of the USSR Glacier Inventory data from the 1980s with the “Glaciers of Russia” inventory revealed that the total area of the identified glaciers strongly decreased, whereas their number increased by 10. Moreover, 31 objects were not identified and described previously, and only 70 objects from the USSR Glacier Inventory were included in the RGI.
Only two glaciers (Uchastnikov ekspedicii and Cherno-Iyusskiy) have disintegrated into separate fragments in recent years, with the formation of five separate parts. While the disappearance of small forms of glaciation in the context of climate change toward warming is easy to explain, the appearance of new forms requires further investigation.
The comparison of areas for the Kuznetsky Alatau glaciers derived from Sentinel-2 images for 2021 and 2023, the “Glaciers of Russia” inventory for 2016–2019 and scientific articles for the period 2000–2021, which provide data on the area measurements of individual glaciers shown in Figure 2 and Table 5, shows a reduction in the glacier areas for 1980–2024. Table 5 summarizes all published data about the areas of the most studied glaciers in the Iyussko–Tersinsky and Tigertish groups (Figure 8d).

Table 5.
Changes in the areas (km2) of selected glaciers of the Iussko–Tersinsky and Tigertish groups from the late 20th–early 21st centuries.
The data were obtained by different authors via different measurement methods (direct ground measurements and photogrammetry). At the present time, the total area of the four glaciers was approximately 35% of that in the 1980s. This comparison allows us to identify the intradecadal variability of the Kuznetsky Alatau glaciers, which is estimated at 2–5 years. Similar variations in the size and dynamics of small forms with periods of 2–5 years have been described for other areas of intracontinental Asia. The common features of the Kuznetsky Alatau glaciers are their small size, location at low altitudes and high sensitivity to meteorological parameters (precipitation and temperature). Inherently, the area fluctuations from year to year could be controversial—decreasing due to high summer temperatures and increasing due to snowstorm transport and accumulation of precipitation on leeward slopes.
Monitoring with the use of UAVs on the established dates of imagery will allow a more accurate assessment of the short-term dynamics of glaciers in the area.
Measurement accuracy is important, especially for small-sized glaciers of the Kuznetsky Alatau Mountains. The interpretation error mainly depends on the glacier boundary, as it is not always possible to use images with the surface completely free of seasonal snow and detrital material. We compared archive KH-9 Hexagon and Sentinel-2 imagery with UAV imagery from 2022 for the selected glaciers—Cherno-Iyussky (Figure 2a,b and Figure 5), Karatash and Tronova (Figure 2c–f). The resolution of the orthophotos was 15 cm/pixel. The areas of glaciers from orthophotos and Sentinel-2 images for 2022–24 differ by less than 1%.
4. Discussion
Stabilization of ice loss for the selected glaciers in the Kuznetsky Alatau Mountains since 2005 is consistent with the data for the neighboring mountainous regions of inner Asia. In the Mongun-Taiga and Tavan Bogdo-Ola massifs, the deceleration of glacier retreat was observed after 2007 [17]. At the same time, there are a large number of publications which indicate the current retreat of glaciers in the Altai Mountains (the mountain glaciation center closest to the study area) and show the increase in the rate of glacier degradation [18].
Such asynchronous dynamics of glaciers require a careful analysis. We suppose that glaciers at the periphery of the Altai–Sayan Mountain country during the current climate change had more favorable conditions than the glaciers in the interior regions. Perhaps the topography of the Kuznetsky Alatau Mountains with widespread, wide, flat watersheds contributes to the preservation of glaciers. Such watersheds in winter act as areas of snow deflation (wind removal). In such conditions, all negative relief forms on the leeward slopes are fully filled by snow. Perennial snow accumulation here is much higher than the climate norm. In addition, small glaciers of the investigated region have a short response delay (in our case, 2–5 years, for four glaciers), and therefore, they react to the transition into a cool, wet climate phase much faster than large valley glaciers [17].
By assessing the variability of small glaciers within time intervals that correlate with their glaciation inertia (2–3 years), it is possible to identify small-period climatic cycles of changes in the snow cover of the region.
By the beginning of 21st century, it was already clear that small-sized mountain glaciers had significantly reduced in area due to climate change. Glacierets and glaciers of the Kuznetsky Alatau have also reduced their areas since 1980, according to our observations; their areas fluctuate slightly from year to year, since the state of these objects depends not only on air temperature but also on the amount of incoming snow and wind redistribution.
5. Conclusions
This work aimed to provide a comprehensive analysis of glaciation in the Kuznetsky Alatau Mountains, studying its current state, relation with climate conditions and classifying the transition stages from glaciers to glacierets. Small forms of glaciation are an integral part of the mid-mountain geosystems of the western fringe of the Altai–Sayan Mountain system. We recommend monitoring such small forms of glaciation, which are located within the Kuznetsky Alatau Mountains, because these objects are sensitive to climate change. They are an indicator of the snowiness of vast mountainous areas that are poorly covered by the network of weather stations. In a continental climate, winter snowiness is an important component of the volume of river runoff during the flood period. The studied objects are also of recreational value as attractive objects of mountain, ecological and scientific tourism, which is actively developing in the area. The glaciers and glacierets also feed the relevant rivers.
A positive trend of Tsum (0.5 °C/decade) is observed in the region, and solid precipitation increased by 100–200 mm in the foothills and was stable in the mountains for the period 1970–2024. All glaciers have lost a significant amount of ice since the 1980s. The maximum is in the Usa River basin, with the minimum in the Tersi River basin. In general, slope glaciers have reduced their area the most, with a more stable situation for cirque glaciers. The hanging glaciers, described previously, are now absent.
According to Sentinel-2 imagery, the updated inventory consists of 78 glaciers (2.6 km2) and 57 glacierets (0.5 km2), with total area of 3.1 km2. The total glacier area reduction since the 1980s was 50–75% for the selected river basins. The results of the comparison show a high variability of changes in the areas for these time periods: glaciers have mostly decreased their area, but in the period 2021–2023 some glaciers increased their area a little (by 0.04–0.001 km2). Comparison of satellite images with field measurement data (in 2002–2024) revealed good agreement, with a difference of less than 1%. The error of processing the Satellite-2 images in case of glacier area determination is up to 10–15%, mainly due to seasonal snow remnants and small size of the objects. This paper describes a number of local criteria for separating glaciers from glacierets, based mainly on size and shape.
New data from the temperature loggers for 2022–24 indicate that a MAGST below 0 °C is only found near the upper boundary of the Karatash glacier (−1.7 °C), proving the presence of permafrost at elevated plateaus.
Author Contributions
Conceptualization, M.A. (Maria Ananicheva), M.A. (Marina Adamenko) and A.A.; methodology, M.A. (Maria Ananicheva), M.A. (Marina Adamenko) and A.A.; validation, M.A. (Marina Adamenko) and A.A.; formal analysis, M.A. (Maria Ananicheva), M.A. (Marina Adamenko) and A.A.; writing—original draft preparation, M.A. (Maria Ananicheva), M.A. (Marina Adamenko) and A.A.; writing—review and editing, M.A. (Maria Ananicheva), M.A. (Marina Adamenko) and A.A.; visualization, A.A.; funding acquisition, M.A. (Maria Ananicheva) All authors have read and agreed to the published version of the manuscript.
Funding
This research was funded by the Russian Science Foundation, grant number 24-27-00310.
Institutional Review Board Statement
Not applicable.
Data Availability Statement
The data presented in the study are openly available. Glaciers contours are distributed via https://www.glacru.ru (https://drive.google.com/file/d/1bbGy7xvO6nzY2hRuBGIpq4CB7Sc-iuyD/view?usp=sharing), Corona and Hexagon archive satellite images are distributed by https://earthexplorer.usgs.gov/. The raw data supporting the conclusions of this article will be made available by the authors on request.
Acknowledgments
We would like to express our gratitude to the Kuznetsky Alatau Nature Reserve director Vasilchenko A.A. and stuff for their field logistics assistance.
Conflicts of Interest
The authors declare no conflicts of interest. The funders had no role in the design of the study; in the collection, analyses or interpretation of data; in the writing of the manuscript; or in the decision to publish the results.
Abbreviations
The following abbreviations are used in this manuscript:
| UAV | Unmanned aerial vehicle |
| USSR | Union of Soviet Socialist Republics |
| NDSI | Normalized difference snow index |
| SWIR | Shortwave infrared |
| KH | Key hole |
| DEM | Digital elevation model |
| ELA | Equilibrium line altitude |
| MAAT | Mean annual air temperature |
| MAGT | Mean annual ground temperature |
| MAGST | Mean annual surface ground temperature |
References
- Fedorov, V.S. Kurums of the central part of the Kuznetsky Alatau, their physical and geographical role and formation conditions. Sci. Notes Chelyabinsk Inst. 1957, 3, 25–35. (In Russian) [Google Scholar]
- Obu, J.; Westermann, S.; Bartsch, A.; Berdnikov, N.; Christiansen, H.H.; Dashtseren, A.; Delaloye, R.; Elberling, B.; Etzelmüller, B.; Kholodov, A.; et al. Northern Hemisphere permafrost map based on TTOP modelling for 2000–2016 at 1 km2 scale. Earth-Sci. Rev. 2019, 193, 299–316. [Google Scholar] [CrossRef]
- Orlova, V. USSR Climate V. 4 Western Siberia; Hydrometeorological Publishing House: Leningrad, Russia, 1962. (In Russian) [Google Scholar]
- Cogley, J.; Hock, R.; Rasmussen, L.; Arendt, A.; Bauder, A.; Braithwaite, R.; Jansson, P.; Kaser, G.; Möller, M.; Nicholson, L.; et al. Glossary of Glacier Mass Balance and Related Terms; IHP-VII Technical Documents in Hydrology No. 86, IACS Contribution No. 2; UNESCO-IHP: Paris, France, 2011. [Google Scholar] [CrossRef]
- Spin’, P. USSR Glacier Inventory; Hydrometeorological Publishing House: Leningrad, Russia, 1980; Volume 15, Issue 2, Part. 1. (In Russian) [Google Scholar]
- Syubaev, A.; Kovalev, E. The current state of glaciation in the Kuznetsk Alatau and its dynamics in the second half of the 20th century. Nat. Econ. Kuzbass 2004, 9, 41–49. (In Russian) [Google Scholar]
- Kovalenko, N. Current state of small glaciers of the Kuznetsk Alatau and Putorana Plateau. Bull. Mosc. Univ. 2008, 3, 67–71. (In Russian) [Google Scholar] [CrossRef]
- Adamenko, M.; Gutak, Y.; Antonova, V. Climate change and the size of glaciers in the Kuznetsky Alatau Mountains between 1975 and 2015. Ice Snow 2017, 57, 334–342. (In Russian) [Google Scholar] [CrossRef][Green Version]
- Adamenko, M.M.; Gutak, Y.M.; Trenkov, I.P. Changes in the intra-annual distribution of precipitation and the dynamics of snowfall in the Kuznetsky Alatau mountains. Geosph. Res. 2021, 2, 101–109. (In Russian) [Google Scholar] [CrossRef]
- Khromova, T.; Nosenko, G.; Glazovsky, A.; Muraviev, A.; Nikitin, S.; Lavrentiev, I. New Inventory of Russian Glaciers Based on Satellite Data (2016–2019). Water Resour. 2022, 49, 55–68. [Google Scholar] [CrossRef]
- Tielidze, L.; Wheate, R. The Greater Caucasus Glacier Inventory (Russia, Georgia and Azerbaijan). Cryosphere 2018, 12, 81–94. [Google Scholar] [CrossRef]
- Spin, P. Glaciation of the Kuznetsky Alatau Mountains; Nauka: Moscow, Russia, 1980. (In Russian) [Google Scholar]
- Vaskovsky, M. Surface Water Resources of the USSR; Hydrometeorological Publishing House: Leningrad, Russia, 1972; Volume 15, Part 1. (In Russian) [Google Scholar]
- Spin, P. About Snow and Precipitation in the Southern Part of the Kuznetsk Alatau Mountains. Glaciological Climatology of Western Siberia; Geographical Society of the USSR: Leningrad, Russia, 1975; pp. 74–88. (In Russian) [Google Scholar]
- Adamenko, M.M.; Gutak, Y.M.; Solomina, O.N. Glacial history of the Kuznetsky Alatay mountains. Environ. Earth Sci. 2015, 74, 2065–2082. [Google Scholar] [CrossRef]
- Makhrova, M. (Khakas State University, Abakan, Russia); Ermakov, V. (Khakas State University, Abakan, Russia). Personal communication, 2018.
- Chistyakov, K.; Ganyushkin, D.; Kurochkin, Y. Present state and dynamics of glacio-nival systems of Mongun-Taiga and Tavan-Bogdo-Ola mountain massifs. Ice Snow 2015, 129, 49–60. (In Russian) [Google Scholar] [CrossRef]
- Nosenko, G.; Nikitin, S.; Khromova, T. Glacier area and volume changes in the Mountain Altay (Russia) since the mid-twentieth century from space imagery data. Ice Snow 2014, 2, 5–13. (In Russian) [Google Scholar] [CrossRef]
Disclaimer/Publisher’s Note: The statements, opinions and data contained in all publications are solely those of the individual author(s) and contributor(s) and not of MDPI and/or the editor(s). MDPI and/or the editor(s) disclaim responsibility for any injury to people or property resulting from any ideas, methods, instructions or products referred to in the content. |
© 2025 by the authors. Licensee MDPI, Basel, Switzerland. This article is an open access article distributed under the terms and conditions of the Creative Commons Attribution (CC BY) license (https://creativecommons.org/licenses/by/4.0/).