Skip to Content
  • 19 days
    Submission to First Decision
  • 7 days
    Acceptance to Publication

Glacies

Glacies is an international, peer-reviewed, open access journal on all aspects of the studies related to ice published quarterly online by MDPI.

Get Alerted

Add your email address to receive forthcoming issues of this journal.

All Articles (39)

  • Article
  • Open Access

Glaciers in Wind River Range, Wyoming, have experienced substantial reductions in surface area and volume in recent decades, yet existing inventories contain temporal gaps and often mix glaciers with seasonal snowpack. We mapped and classified glacier outlines using high-resolution satellite imagery in 2006 in Google Earth Pro (version 7.3.7.1327) and compared them against inventories from 1963–1974, 2015, and 2020. A classification approach was applied to distinguish glaciers from snowpack based on Welch’s t-test of significant difference in elevation changes within and surrounding mapped outlines based on four digital elevation models from 2000 to 2019. Results show an 11% decrease in mapped glacier/snowpack features from 1963–1974 to 2006 (476 to 423), with a 21% reduction in mapped outlines classified as glaciers (314 to 247). Total glacier area declined from 48.35 km2 in 1963–1974 to 34.06 km2 in 2006, while volume decreased from 0.998 km3 to 0.701 km3. From 1963–1974 to 2015, area and volume losses reached 47% and 49%, respectively, consistent with accelerated regional retreat. An unusually low reduction observed from 2015 to 2020 is likely caused by methodological inconsistencies between existing inventories. This study underscores the need for standardized mapping protocols and robust classification between glaciers and snowpack to accurately document glacier changes and assess their impact on water resources.

Glacies

6 October 2026
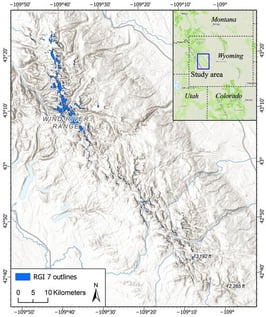
Location of the WRR in Wyoming with RGI 7 (1963–1974) glacier and snowpack outlines. The shaded relief map is the terrain basemap provided in ArcGIS Pro, which was compiled from various data source providers, including Esri, NASA, NSA, NOAA, and USGS (https://www.arcgis.com/home/item.html?id=c61ad8ab017d49e1a82f580ee1298931, accessed on 25 August 2026). The dashed line in the inlet map represents the state boundary and the blue box shows the extent of the study area.
  • Article
  • Open Access

Toward a Coordinated Snow Monitoring Network in the Northeastern United States

  • Franklin B. Sullivan,
  • Elizabeth Burakowski and
  • Lucas Zukiewicz
  • + 17 authors

The Northeast Snow Survey Feasibility Study began in October 2023 to characterize snow monitoring in the Northeastern United States and identify data and knowledge gaps to guide the deployment of a snow monitoring network similar to the western United States’ automated Snow TELemetry (SNOTEL) network. Researchers and interest holders in the region were contacted and engaged through online surveys, interviews, and email, using snowball sampling to identify and evaluate data breadth, gaps, and needs for snow monitoring in the region. Surveys identified important data gaps, including under-sampling of high-elevation areas, temporal gaps early in winter, low-frequency (weekly to monthly) temporal resolution in manual snow survey efforts, and a paucity of automated snow monitoring infrastructure. The data gaps, combined with previously published interest holder data needs, led to the development of three primary network objectives and guided the systems engineering and spatial design. Here, an open-source workflow using Google Earth Engine and R was developed to identify potential sites in the northern New England states of Maine, New Hampshire, and Vermont. This process identified 4015 sq km of suitable land for network siting across the three states that would help overcome the identified spatial and temporal data gaps while meeting interest holder data needs. This study establishes the need for a coordinated snow monitoring network in the Northeastern United States and presents a spatial design workflow that can be implemented to meet the identified objectives.

Glacies

27 September 2026

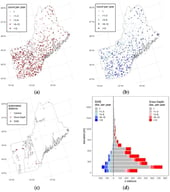
Snow monitoring stations distribution in the Northeast showing (a) snow depth stations with manual observations, (b) SWE stations with manual observations, (c) automated observation stations, and (d) the distribution of stations by elevation.
  • Article
  • Open Access

Permafrost is a defining feature of the Arctic and sub-Arctic environments. The extent of the permafrost region accounts for about a quarter of the Northern Hemisphere’s terrestrial surface. While most research on permafrost has focused on the summer season—when the active layer is thawed and carbon emissions peak—the late shoulder season, marking the transition season between summer and winter and ending by surface freeze-back at the large scale, has received less attention. Yet, about 14% of the annual mean methane emissions from the permafrost occur during the refreezing period of the active layer. Understanding the seasonality, interannual variability and long-term trends of the surface freeze-back is therefore crucial to better constrain the high-latitude atmospheric carbon budget and improve Earth System Model projections. In this study, we analyze the evolution of surface freeze-back onset from 1950 to 2020 using the ERA5-Land reanalysis (0.1° spatial resolution) over a large region of Siberia encompassing the four main permafrost types. We find that surface freeze-back onset has been delayed by five days on average over that 70-year period. Through spatial regression modeling, we show that while several climatic and geographic factors influence freeze-back timing, the principal control on freeze-back seasonality at the large scale (~kilometers) is the date when the 2 m air temperature first falls below 0 °C, followed by the snow cover depth. These findings complement previous research that focused on the small scale (~meters), which emphasized the importance of the vegetation type and the snow cover characteristics at these spatial scales. Our results provide new insights into changes during the late shoulder season in one of the world’s fastest-warming regions and identify key variables to monitor for improving sub-seasonal forecasts that could become relevant to infrastructure upgrade and logistics planning in permafrost-affected areas.

Glacies

22 September 2026

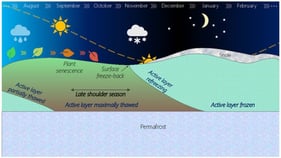
Conceptual scheme of the seasonal transition between summer and winter with the late shoulder season marking the transition between plant senescence and surface freeze-back, and the active layer refreezing period. Note that the figure is not to scale and misses many characteristics such as the seasonality of methane fluxes.
  • Article
  • Open Access

Lake ice is a reliable indicator of climate variability and change. This research investigates annual and spatial variations in lake ice phenology of small lakes (<2 km2) in the Cascade Mountain Range (U.S.A.) using high-temporal frequency remote-sensing data and a probabilistic model. Data from the Harmonized Landsat-Sentinel-2 (HLS-2) project were analyzed to detect the presence of lake ice for 2872 small lakes and characterize ice phenology during each of the 10 ice seasons (2014–2023). A multiple logistic regression model (Accuracy ~0.80 and AUC 0.88 for cross-validation) was used to predict the probability of ice for every non-imaged day during each ice season. From the time-continuous combination of HLS-2 observations and modelled ice presence, we extracted three ice phenology metrics: ice-on date, ice-off date, and total number of ice days (TID), and we analyzed their variabilities across ice seasons and across the Cascade Range. Both ice-on date and ice-off date distributions exhibited high inter- and intra-season temporal variability. All median TID fell between 100 and 150 days. Our research quantifies the variability of a large sampling of small alpine lakes in a climate-sensitive region and demonstrates the efficacy of extracting ice phenology metrics from daily ice presence probabilities based on remote-sensing data.

Glacies

2 September 2026

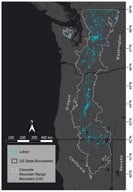
Study-area domain (white boundary). Lake polygons (light blue) are those that remained after filtering.

Highly Accessed Articles

News & Conferences

Latest Issues

Open for Submission

Journal Sections

XFacebookLinkedIn
Glacies - ISSN 2813-8740