


Abstract
Microplastic contamination of soils is influenced by both land use and anthropogenic inputs, yet the extent to which polymer composition reflects potential sources remains poorly understood. In this study, microplastics were quantified in soils under contrasting land uses within a representative continental catchment using a mass-based pyrolysis–GC-MS approach. Potential input materials, including sewage sludges and composts, were also analyzed to assess possible source signatures. Microplastics were detected in all soil samples, with concentrations ranging from 2 to 99.5 mg kg−1. Clear differences were observed among land-use categories, with urban soils exhibiting the highest contamination levels and greatest variability, whereas cropland, grassland and forest soils displayed lower but heterogeneous concentrations. Polymer composition was dominated by PE, PP and PVC, indicating that a limited number of polymers account for most of the microplastic mass in soils. Principal component analysis revealed a clear separation between soils and input materials, reflecting distinct polymer signatures. Among the investigated inputs, the compost derived from wastewater-treatment residues exhibited particularly high PE concentrations, whereas sewage sludges were characterized by elevated PVC and N66 contents. These results suggest that soil microplastic composition reflects both land use and anthropogenic inputs, although local environmental conditions contribute substantially to the observed variability.
1. Introduction
Microplastics are persistent pollutants that do not readily degrade and are now detected across multiple environmental systems, highlighting their widespread distribution and long-term environmental relevance [1]. While marine environments have historically received the greatest attention, there is increasing recognition that terrestrial ecosystems play a central role in the generation, transport, and accumulation of microplastics. In particular, soils are now considered major reservoirs of microplastics, accumulating particles from multiple sources over time and acting as both sinks and potential secondary sources [2].
Microplastic contamination of soils arises from diverse pathways. Agricultural practices constitute a major input route, notably through the application of sewage sludge and compost, which concentrate microplastics during wastewater treatment processes and subsequently release them into soils when reused as fertilizers. These inputs can significantly contribute to the accumulation of microplastics in agricultural systems and influence soil properties and ecosystem functioning [3,4]. In parallel, atmospheric transport and deposition have been increasingly recognized as important but still poorly constrained sources of microplastics to soils. Recent studies demonstrate that airborne particles can be transported over long distances and deposited in remote environments, where they accumulate over time. In forest ecosystems, microplastics are primarily derived from atmospheric deposition and litterfall, highlighting the importance of diffuse inputs and canopy interception processes [5]. The relative contribution of these pathways varies depending on land use and anthropogenic pressure. Agricultural soils are mainly influenced by amendment practices, while forest and grassland soils may act as sinks for airborne microplastics. Urban and technogenic soils, in contrast, are impacted by localized sources such as traffic emissions, infrastructure degradation, and surface runoff. Overall, microplastic contamination in soils reflects the integration of multiple interconnected sources and environmental processes [6,7]. Despite growing interest, the quantification of microplastics in soils remains challenging. Conventional techniques based on visual identification or spectroscopic methods are limited by matrix complexity, detection thresholds, and lack of standardization, which hampers comparison between studies [8].
Although many studies have reported the occurrence of microplastics in soils, most have relied on particle counting and morphological characterization, which makes it difficult to compare different environmental compartments. Furthermore, few studies have quantitatively compared the polymer-specific signatures of soils and potential input materials within the same territory. Quantitative polymer analysis using Py-GC-MS provides an opportunity to investigate whether the composition of soil microplastics reflects land use and anthropogenic inputs beyond simple concentration differences. Thermo-analytical approaches such as Py–GC–MS provide an alternative strategy, enabling the mass-based quantification of polymers in complex environmental matrices. This approach allows improved assessment of contamination levels and polymer composition, helping to better understand microplastic distribution and sources [9].
In this context, the present study aims to investigate the distribution of microplastics in soils under contrasting land uses and to evaluate the contribution of anthropogenic inputs, including sewage sludges and composts, to soil microplastic contamination. We hypothesized that soil microplastic composition reflects both land use and the polymer signatures of major anthropogenic inputs. To test this hypothesis, we compared the composition of microplastics in soils representing different land-use categories with that of potential input materials using a mass-based Py-GC-MS approach. Input materials were analyzed not as independent environmental compartments but as potential sources of microplastics to soils. Their inclusion aimed to determine whether the polymer signatures observed in soils were consistent with those found in sewage sludges and composts.
This study was conducted within the Clain River catchment (western France), which was selected as a representative territorial unit encompassing contrasted land uses and anthropogenic pressures. The catchment includes the city of Poitiers and its surrounding urbanized areas, together with extensive agricultural and semi-natural landscapes.
The upper part of the catchment is predominantly rural and characterized by mixed farming systems, including livestock production and arable crops. The intermediate section is largely dominated by cropland, whereas the central part encompasses the Poitiers metropolitan area (c.a. 200,000 inhabitants), including residential, commercial and industrial activities. Downstream sections drain towards the Vienne River basin. This spatial organization creates a marked gradient of urbanization and land-use intensity, providing an appropriate framework for investigating microplastic distribution across contrasting terrestrial environments.
Owing to its combination of agricultural, urban and semi-natural landscapes, the Clain catchment provides a relevant model system for exploring relationships between land use, anthropogenic inputs and soil microplastic composition.
2. Materials and Methods
2.1. Material Preparation
To limit potential contamination by microplastics during laboratory handling, all solutions used for sample preparation were systematically pre-filtered. All manipulations were conducted using plastic-free equipment under a laminar flow hood, and glassware and filters were thoroughly cleaned and calcinated (for 5 h at 525 °C) prior to use. Thus, ultra-pure (UP) water—used for blank and sample preparation—and sodium chloride saturated solution (360 g/L) were previously filtered through 47 mm diameter, 0.7 µm pore size Whatman GF/F glass fiber filters (Whatman, Maidstone, UK).
2.2. Microplastics
The investigated polymers were selected based on their prevalence in the European market and consequently on their high likelihood of occurrence in environmental compartments. This selection covers a broad range of polymer families commonly used in packaging, construction materials, textiles, consumer goods, and industrial applications, which are recognized as major sources of microplastic contamination. The targeted polymers included polyethylene (PE), polypropylene (PP), polyvinyl chloride (PVC), polyethylene terephthalate (PET), MDI-polyurethane (PU), polystyrene (PS), nylon-6 (N-6), nylon-6,6 (N-66), acrylonitrile–butadiene–styrene copolymer (ABS), polycarbonate (PC), polymethyl methacrylate (PMMA), and styrene–butadiene rubber (SBR). Only small microplastics (1 mm–20 µm) were quantified using a mass-based approach. Large microplastics (5 mm–1 mm) were not observed in the studied samples.
2.3. Study Area
The study was conducted within the Clain River catchment (3209 km2) located in western France (Nouvelle-Aquitaine region). The catchment extends mainly across the Vienne department, with smaller areas located in the Charente and Deux-Sèvres departments. The region is characterized by a temperate oceanic climate with relatively wet winters and warm, dry summers.
Land use is dominated by agricultural areas, which account for more than 80% of the catchment and include arable crops, grasslands and livestock farming systems. Forests and semi-natural environments represent approximately 11–14% of the area, whereas urbanized zones account for about 5%, mainly concentrated around the city of Poitiers. This spatial organization creates a marked gradient of anthropogenic influence ranging from agricultural and semi-natural environments to highly urbanized areas.
The catchment is located within the Poitou Threshold, a sedimentary corridor connecting the Paris and Aquitaine basins. Soils are predominantly derived from limestone, clay-rich and alluvial formations and include calcareous agricultural soils (“groies”), clay-siliceous soils (“brandes”), clay-rich soils and alluvial soils associated with river valleys. This diversity of soil types, combined with contrasting land uses, provides a suitable framework for investigating relationships between land use, anthropogenic inputs and soil microplastic composition.
2.3.1. Soils
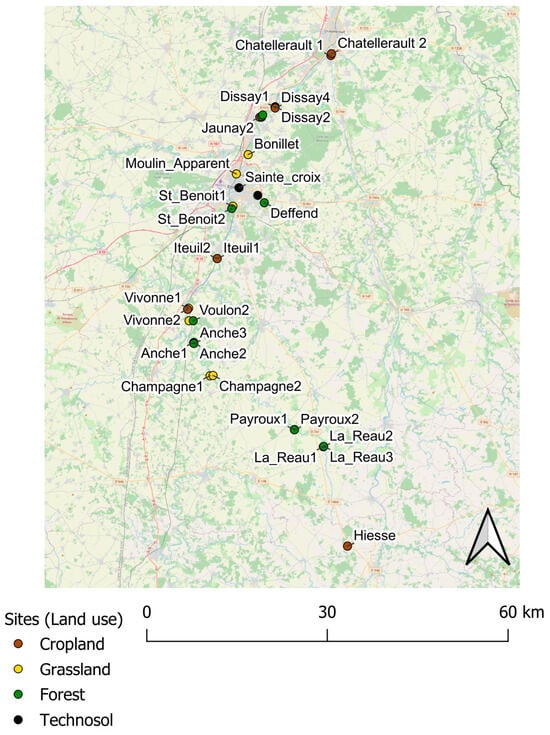
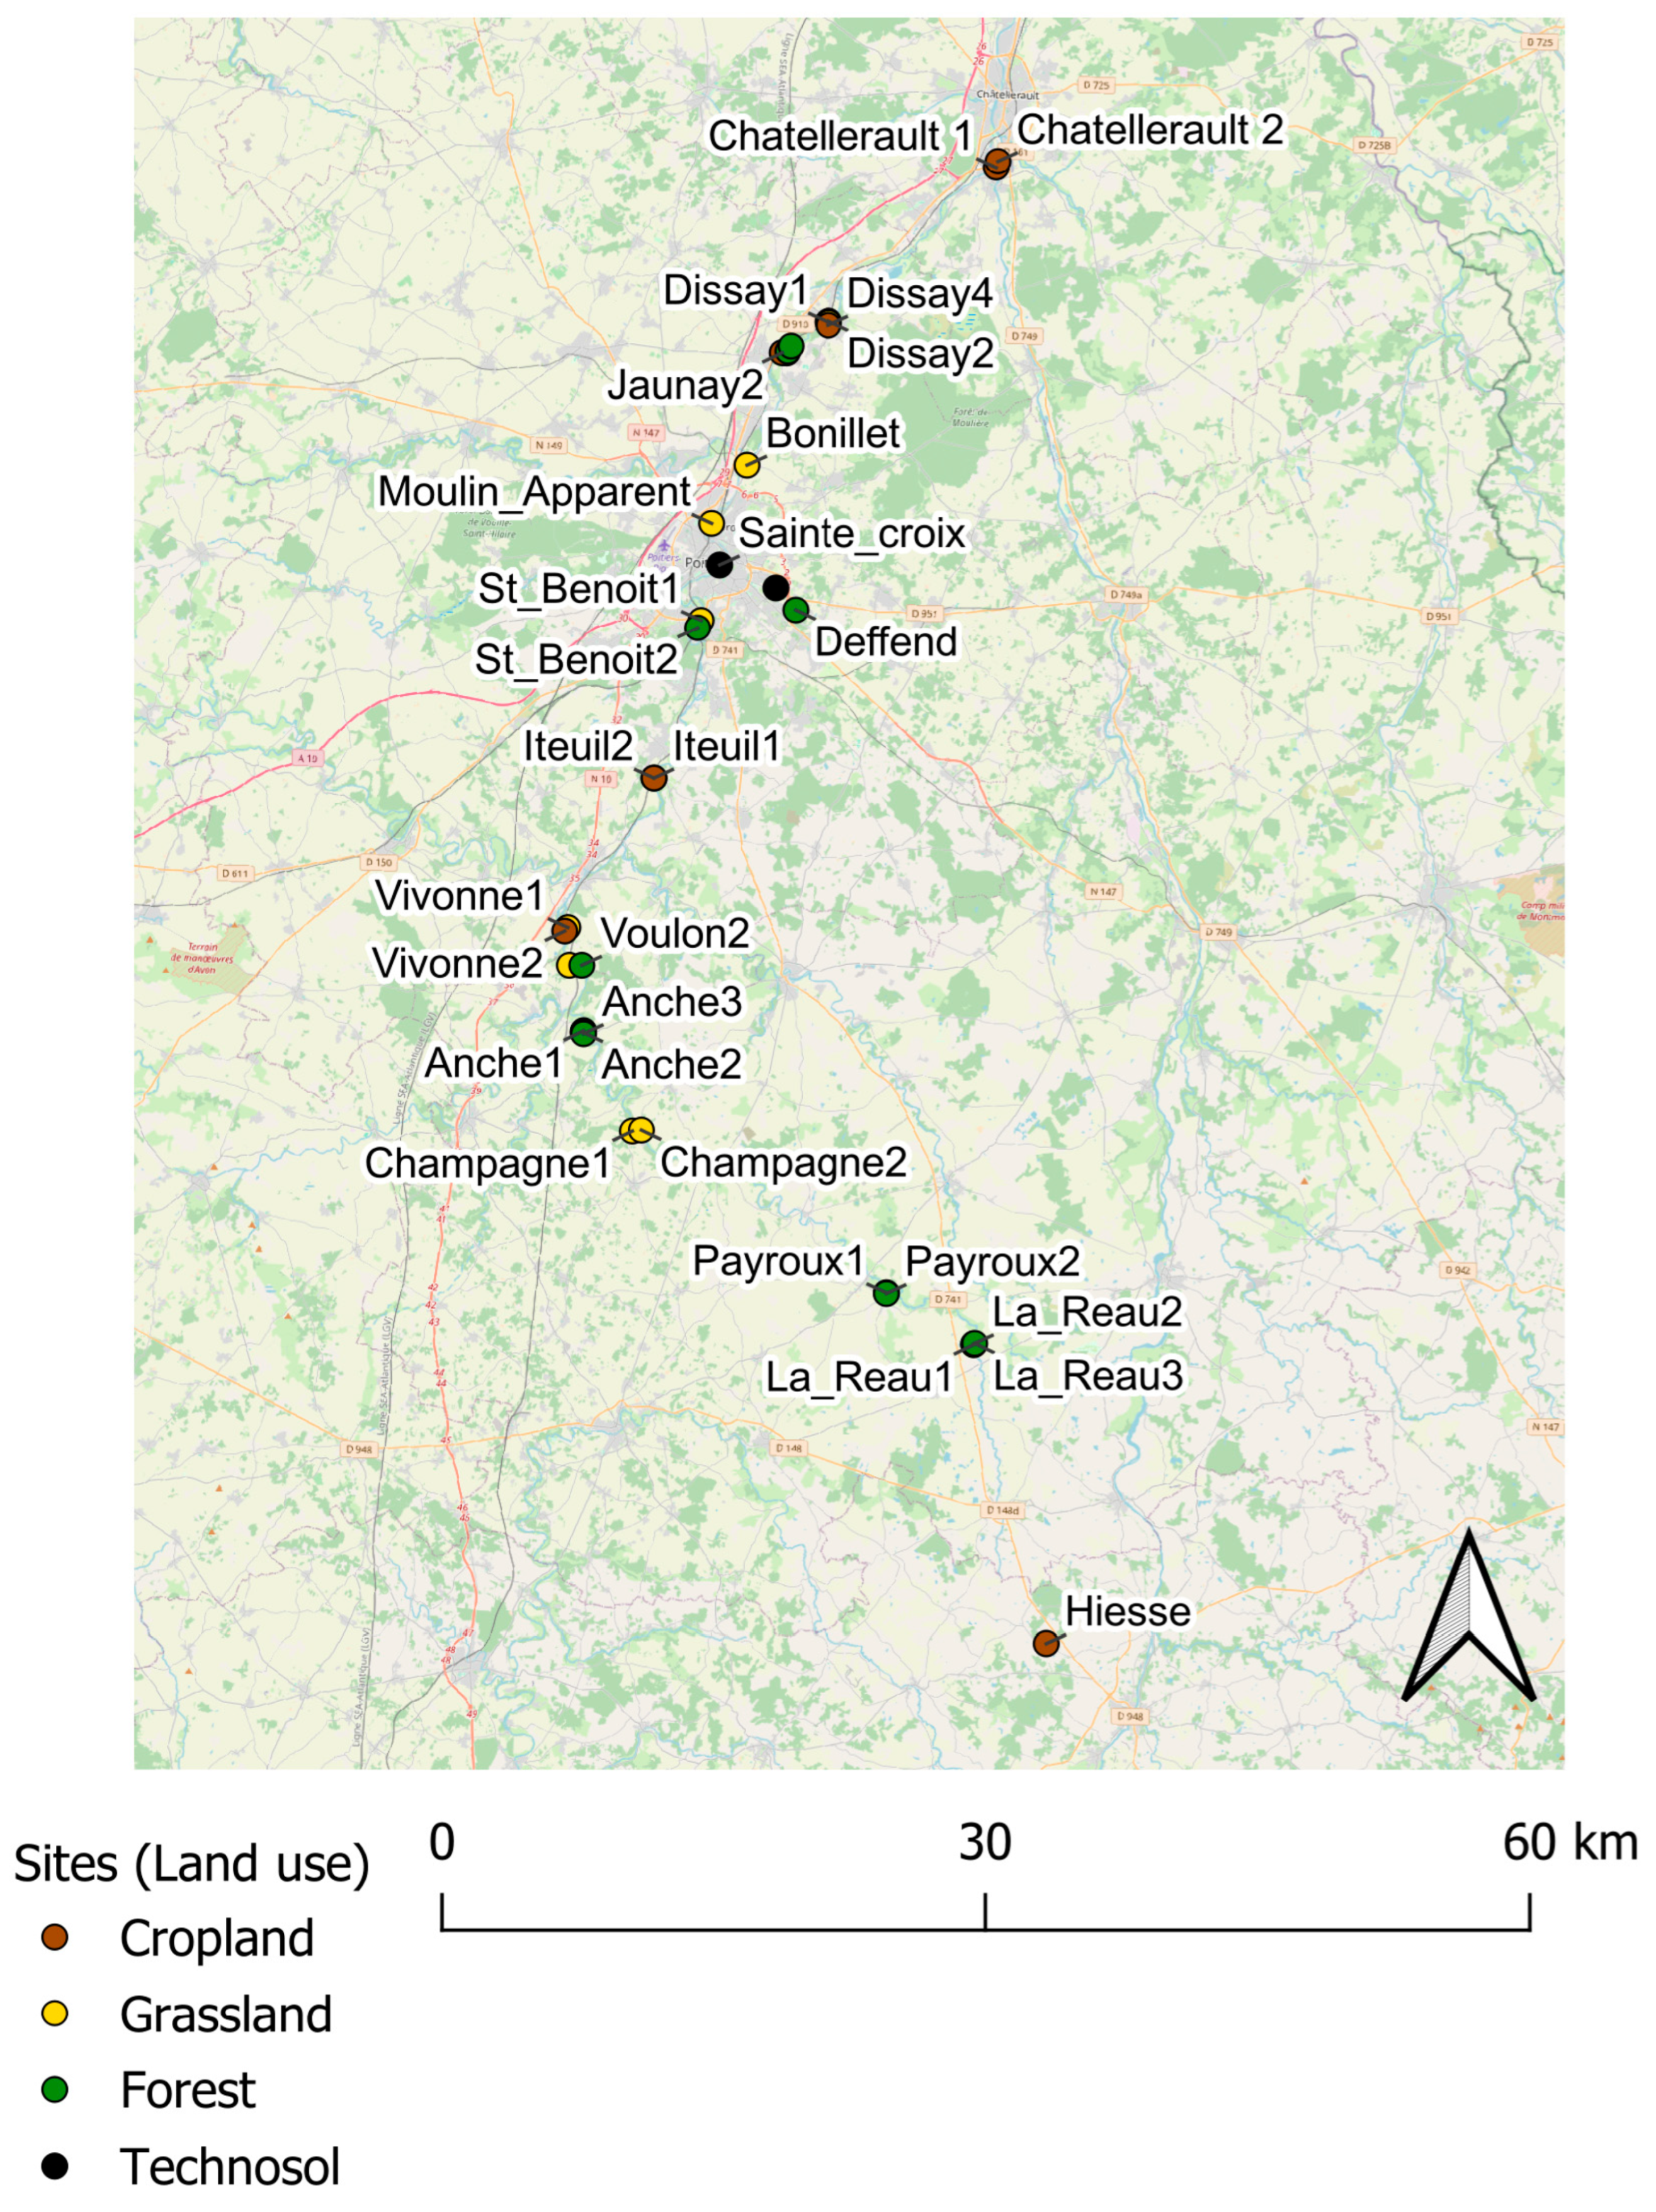
Soil samples (Figure 1; Table 1) were collected in the Clain River catchment, using a stainless-steel auger from the surface horizon (0–20 cm). Urban soils were represented by two sites. One site was located near a stormwater retention basin (Champlain), whereas the other was situated in the city center (Sainte-Croix). These sites were selected to represent contrasting urban environments potentially subjected to different microplastic inputs.
Figure 1.
Location of the sampling sites within the study area. Sampling sites are identified according to land-use category. Geographic coordinates are provided in Table 1, and a scale bar has been added for spatial reference.
Table 1.
Location, physicochemical and granulometric properties of the studied soils.
Ten subsamples were collected along the plot diagonals and at the center of the sampling area, then pooled to form a composite sample of approximately 10 kg. Samples were stored in metal containers covered with aluminum foil and stored at 5 °C until further processing. The pH was measured in water (1:5, w/v). Granulometry was realized according to NF X 31-107 [10]. Organic matter content was obtained using calcination according to XP P94-047 [11].
2.3.2. Composts
Two compost samples from urban composting platforms and one domestic compost were investigated (Table 2). The Millas composting platform (Saint-Georges-les-Baillargeaux) produces compost from sewage sludge originating from the Poitiers-La Folie wastewater treatment plant (WWTP) (40% weight), co-composted with green waste (60%). The final product complies with the NF U 44-095 [12] and is primarily redistributed for local agricultural use. The Cissé platform processes separately collected green waste. The resulting product is a 100% plant-based compost complying with the NF U 44-051 [13] standard. In contrast to the sludge-derived compost produced at the Millas facility, its use is not subject to specific restrictions, and it is primarily distributed for local agricultural applications as well as for soil amendment by municipalities and private users within the Haut-Poitou area. The domestic compost was produced from garden residues and household biowaste. Approximately 10 kg of each compost was collected using a stainless-steel shovel and stored in metal containers before analysis.
Table 2.
Characteristics of the investigated composts and sewage sludges.
2.3.3. Sewage Sludges
Sewage sludge samples (Table 2) were collected from two municipal WWTPs located near Poitiers. The Poitiers-La Folie WWTP has a treatment capacity of approximately 152,500 population equivalents and constitutes the source of sewage sludge used at the Milas composting facility. The Saint-Georges-les-Baillargeaux WWTP treats approximately 23,000 population equivalents. Both facilities primarily receive domestic wastewater and use conventional activated-sludge treatment processes. Approximately 10 kg of sludge was collected after mechanical dewatering at the WWTP using metal containers and stored at 5 °C until analysis.
2.3.4. Field and Procedural Blanks
A field blank and a procedural blank were collected to assess and control for potential contamination that could arise during field sampling, transport, and handling, as well as during analytical pretreatment. The field blank consisted of a glass jar containing 1 L of ultra-pure water previously filtered through 0.7 µm pore size Whatman GF/F glass fiber filter (Whatman, Maidstone, UK), which was opened at the sampling sites and subjected to the same environmental exposure and handling as the samples. The procedural blank was conducted the same way during each step of the pretreatment process. After filtration at 1.2 µm, drying at 60 °C, and grinding, the blanks were analyzed by Py-GC-MS following the same conditions as for environmental samples.
2.4. Pretreatment
Soil and solid waste (compost and sewage sludge) pretreatment followed the protocol developed and validated by Lemée et al. [14]. Briefly, 10 kg of sample was freeze-dried and sieved (<1 mm). A 10 g aliquot was dispersed in ultra-pure water previously filtered through a 0.7 µm pore size glass fiber filter, wet-sieved (20 µm) to eliminate small mineral particles, submitted to density separation using saturated NaCl solution (0.36 mg/mL), and treated with 30% H2O2 to remove natural organic matter (OM). The recovered fraction was filtered, dried, cryomilled and prepared for Py-GC-MS analysis.
2.5. Quantification
Microplastics in the 1 mm–20 µm size range were quantified by Py-GC-MS following the validated procedure described by Lemée et al. [14]. Quantification was based on polymer-specific pyrolysis markers and a multi-ion approach (one quantification ion and two confirmation ions per polymer). Calibration was performed using a certified polymer mixture and an analytical internal standard. The target polymers were PMMA, N66, PP, PC, PET, PS, PE, PVC and SBR. Field and procedural blanks were systematically included throughout sampling and sample preparation. Samples associated with contaminated field blanks were discarded, and procedural blank values were subtracted when required. Method performance was previously validated according to NF T 90-210 [15] using eight-point calibration curves, internal-standard normalization, and predefined maximum acceptable deviation (MAD) criteria. Recovery experiments performed during method validation highlighted recovery rates ranging from 22 to 39% for N6 submitted to the complete extraction procedure and up to 97% for PE using a simplified protocol. Detailed instrumental conditions, calibration procedures, validation parameters, recovery experiments, limits of quantification and quality-control measures are provided in [14].
2.6. Principal Component Analysis
Principal component analysis (PCA) was conducted on polymer concentrations (PMMA, N66, PP, PC, SBR, PET, PS, PE, and PVC) in order to explore patterns in microplastic composition. Variables were centered and scaled to unit variance. PCA was performed using the prcomp function in R with scaling enabled. The interpretation of clustering patterns and the identification of the main gradients structuring the dataset were facilitated by the use of sample scores and variable loadings.
2.7. Boxplot
To complement the principal component analysis (PCA) multivariate analysis, a univariate approach was applied using boxplots for each polymer. These boxplots were constructed based on the concentrations of the individual polymers (PMMA, N66, PP, PC, SBR, PET, PS, PE and PVC), allowing the distribution of each variable to be examined across the various sample groups. Two datasets were analyzed separately: soil samples (forest, grassland, cropland, and urban soil) and input materials (urban compost, domestic compost, and sludge).
For each polymer, the distributions were visualized using boxplots representing the median, the interquartile range (IQR), the range of observed values, and potential outliers.
Comparisons were performed between land-use categories for the soil dataset and between origin categories for the input dataset. This approach was designed to identify polymers displaying significant variability between groups, detect asymmetrical distributions or the presence of extreme values, and provide a mechanistic interpretation of the patterns observed in the PCA. Examining each polymer individually allows us to better understand the contribution of specific variables to the overall multivariate structure. Polymers showing high inter-group variability, contrasting distributions across categories or frequent outliers are considered major contributors to the differentiation observed in the PCA. Conversely, polymers exhibiting low variability (e.g., consistently low or near-zero values) are considered non-discriminant and play a limited role in structuring the dataset.
3. Results
3.1. Microplastic Concentrations in Soils
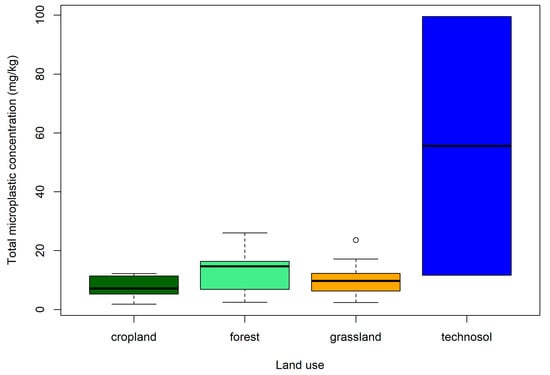
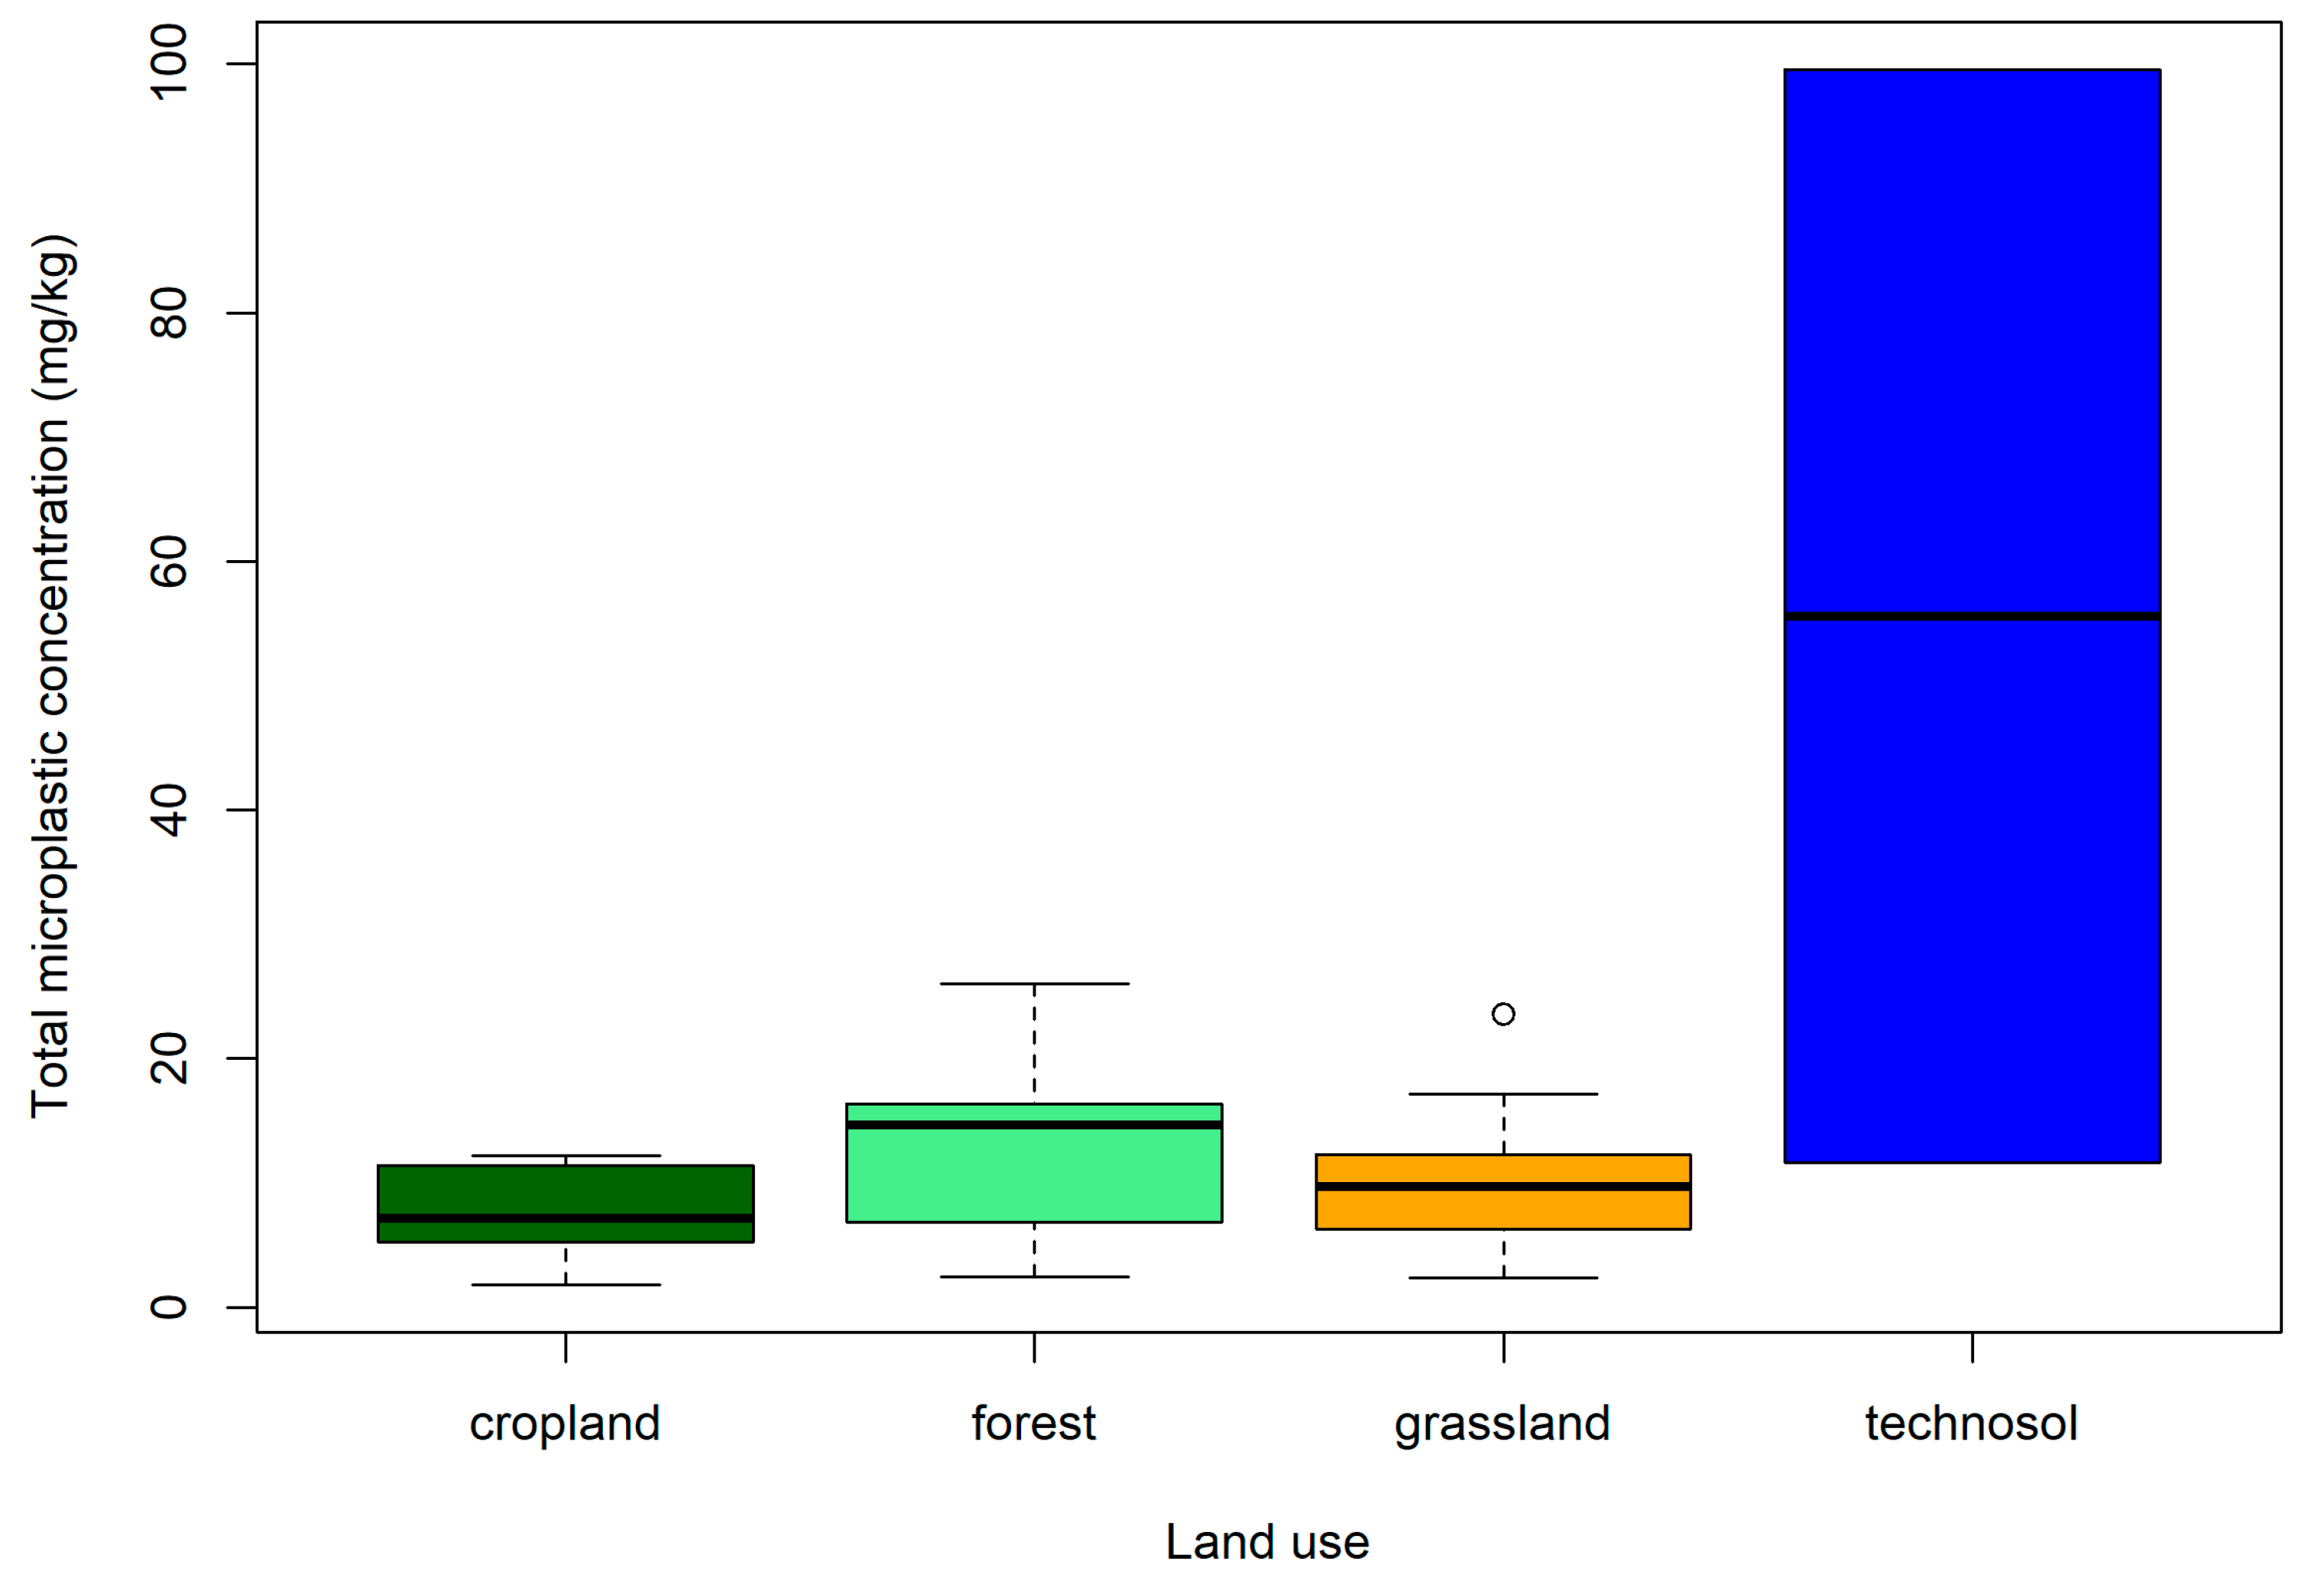
Microplastics were detected in all soil samples, with total concentrations ranging from 2 to 99.5 mg/kg, depending on the land use and the site characteristics. Figure 2 shows a clear distinction between land-use categories, with urban soils exhibiting the highest contamination levels, up to 99.5 mg/kg. Forest, grassland, and cropland soils showed lower, though still variable concentrations (Table 3).
Figure 2.
Boxplots of total microplastic concentrations (mg/kg) in soils according to land use (cropland, grassland, forest, and urban soils). Boxes represent the interquartile range (IQR), central lines indicate medians, and whiskers extend to the range of observed values, with outliers plotted as individual points. Urban soils show the highest concentrations and the greatest variability, whereas cropland soils display lower and more homogeneous values.
Table 3.
Microplastics (mg/kg) quantified in the soil samples.
Forest soils exhibited relatively high concentrations, with median values generally above 15 mg/kg and considerable variability among samples. Grassland soils exhibited intermediate median concentrations and relatively high variability, with concentrations ranging from approximately 2 to 24 mg/kg. In contrast, cropland soils showed lower concentrations and a narrower distribution, indicating a more homogeneous microplastic contamination pattern. Overall, clear differences in both concentration levels and variability were observed among land-use categories.
3.2. Polymer Composition in Soils
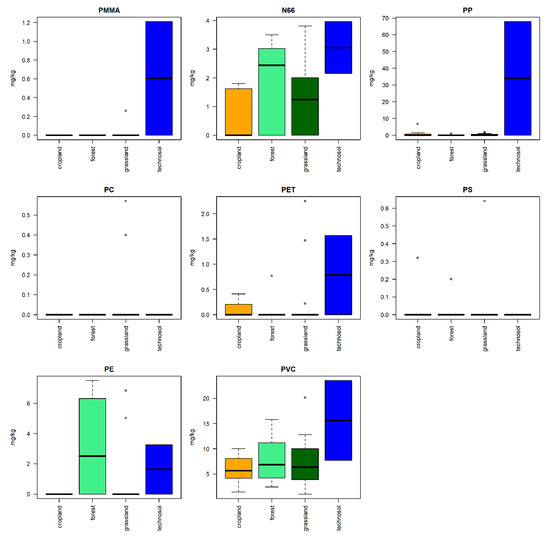
The distribution of individual polymers across land-use categories varied depending on the polymer considered (Figure 3; Table 3). PC and PS exhibited consistently low concentrations across all land-use categories, with limited variability and little differentiation between land-use categories. In contrast, polymers such as PP, PE and PVC showed broader concentration ranges and higher variability among samples. These polymers also showed more pronounced differences in median concentrations and dispersion between land-use categories.
Figure 3.
Boxplots of polymer-specific microplastic concentrations (mg/kg) in soils according to land use (cropland, grassland, forest, and urban soils). For each polymer, boxes represent the interquartile range (IQR), central lines indicate medians, and whiskers extend to the range of observed values, with outliers shown as individual points. Polymers such as PP, PE, and PVC exhibit greater variability among land-use categories, particularly in urban soils, whereas PC, PS, and SBR show consistently low concentrations across all categories.
Differences between land-use categories are also reflected in the variability of polymer concentrations. Forest soils exhibited moderate variability across most polymers, whereas grassland soils showed greater dispersion and more frequent outlier values. Cropland soils tended to display narrower distributions, suggesting a more homogeneous microplastic composition. The behavior of urban soils varied depending on the polymer considered. Although their distributions often overlapped with those of other soil categories, elevated concentrations and wider ranges were observed for several polymers.
3.3. PCA
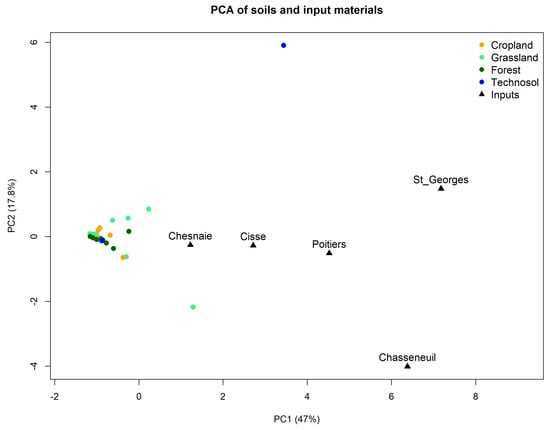
Principal component analysis (PCA) was performed to explore the multivariate structure of polymer composition across all samples, including soils and input materials (Figure 4). The first two principal components explained a substantial proportion of the total variance (PC1: 51.6%; PC2: 20.0%), together accounting for 71.6% of the variability of the dataset.
Figure 4.
Principal component analysis (PCA) of polymer-specific microplastic concentrations (mg/kg) in soils and input materials. Each point represents a sample, colored according to land use or input origin, with soils shown as circles and input materials (composts and sludge) as triangles. The percentage of variance explained by each principal component is indicated on the axes. The ordination highlights distinct clustering patterns between soils and input materials, reflecting differences in microplastic composition.
The PCA reveals a clear separation between input materials and soil samples along PC1. Input materials displayed higher PC1 scores than soils, indicating generally higher concentrations of microplastics. The urban compost from Saint-Georges and the sludge from Chasseneuil occupied the most extreme positions on this axis, reflecting their elevated concentrations of several polymers.
Soil samples formed a relatively cohesive cluster compared with inputs. Cropland samples appeared relatively homogeneous, whereas forest and grassland soils showed greater dispersion along both axes.
Separation along PC2 further differentiated samples according to their polymer composition. Most soils remained clustered around the center of the axis, whereas the two urban soils exhibited contrasting positions. The Sainte-Croix urban soil was located within the main soil cluster, while the Champlain urban soil showed a strong positive PC2 score and was clearly separated from the remaining soil samples.
The distribution of samples in the PCA was consistent with the variability observed for individual polymers in Figure 3. The largest differences among samples were associated with polymers displaying broad concentration ranges, such as PP, PE and PVC, whereas PC and PS generally occurred at low concentrations and exhibited limited variability.
To further explore variability within the soil dataset independently of input materials, a PCA restricted to soil samples was performed and is provided in the Supplementary Materials (Figure S1). Similar patterns were observed, with substantial overlap among land-use categories and only a few samples displaying distinct polymer signatures.
3.4. Relationship Between Soil Physicochemical Properties and Microplastic Concentrations
Relationships between total microplastic concentrations and soil physicochemical properties were assessed using Spearman rank correlations (Table S1). No significant relationships were observed for organic matter, clay content, fine or coarse silt fractions, the clay+silt fraction, or bulk density. In contrast, soil pH showed a weak but significant negative correlation with total microplastic concentrations (ρ = −0.385; p = 0.025).
3.5. Polymer Distribution in Composts and Sludge
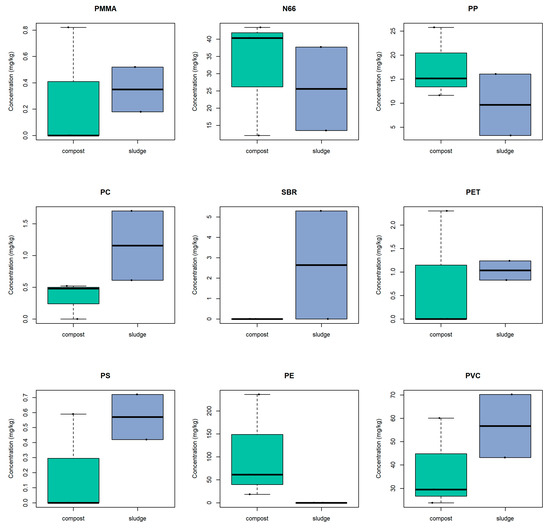
To better understand the separation observed in the PCA, the microplastic composition of the input materials was examined. Microplastics were detected in all input materials, although their concentrations and polymer compositions varied between composts and sewage sludges (Table 4; Figure 5). Overall, PE, N66, PP and PVC were the most abundant polymers, whereas PMMA, PC, PET and PS occurred at lower concentrations.
Table 4.
Microplastics (mg/kg) quantified in the input samples.
Figure 5.
Boxplots of polymer-specific microplastic concentrations (mg/kg) in input materials (urban compost, domestic compost, and wastewater treatment sludge (STEU)). Boxes represent the interquartile range (IQR), central lines indicate medians, and whiskers show the range of observed values, with outliers plotted as individual points. Differences in concentration and variability between input types highlight their distinct contributions to microplastic composition.
Among composts, marked differences were observed according to feedstock composition. The Saint-Georges compost, produced from composted sewage sludge originating from the Poitiers wastewater treatment plant, exhibited the highest concentrations for several polymers and was particularly enriched in PE, reaching 236 mg kg−1. Elevated concentrations of N66 were also detected. The green-waste-dominated compost from Cissé displayed lower overall concentrations than Saint-Georges, although relatively high concentrations of N66 and PP were detected. In contrast, the domestic compost from Chesnaie showed lower concentrations for most polymers but relatively high PVC concentrations.
The two sewage sludges exhibited polymer profiles that differed from those of the composts. Both sludge samples contained elevated concentrations of PVC and N66. However, the sludge from the Chasseneuil wastewater treatment plant (23,000 population equivalent) showed higher concentrations of PVC and N66 than the sludge from the larger Poitiers facility (152,500 population equivalent). In contrast, SBR was detected only in the Poitiers sludge.
Consistent with the patterns observed in soils, only a subset of polymers displayed substantial variability among input materials. The largest concentrations differences were observed for PE, PP, PVC and N66 whereas PMMA, PC, PET and PS generally occurred at lower concentrations and showed more limited variability.
Overall, the observed differences among composts and sewage sludges support the hypothesis that the nature of the source material strongly influences microplastic composition.
4. Discussion
Microplastics were detected in all investigated soils, confirming their widespread occurrence across terrestrial environments. Although all land-use categories contained measurable amounts of microplastics, substantial differences were observed in both concentration and polymer composition. The results further revealed marked contrasts between soils and anthropogenic inputs, as well as considerable variability among sites belonging to the same land-use category. Together, these findings highlight the complex interplay between land use, source characteristics and local environmental conditions in shaping microplastic contamination patterns.
4.1. Influence of Land Use on Microplastic Accumulation
The observed differences in total microplastic concentrations among land-use categories highlight the strong influence of land use on microplastic accumulation. This trend is consistent with previous studies showing that microplastic abundance in soils is strongly controlled by land use and anthropogenic activities, with higher levels typically observed in urban and intensively managed environments [16]. The highest concentrations recorded in urban soils, particularly in the Champlain site, suggest a strong influence of anthropogenic inputs on microplastic contamination. Urban environments are exposed to multiple potential microplastic sources and may act as zones of accumulation due to runoff concentration and reduced dispersion. The contrasting behavior of the two urban soils suggests that local urban features may be more important than the broad technosol classification itself. In particular, the distinct polymer profile observed at Champlain may be related to its proximity to a stormwater retention basin, whereas Sainte-Croix exhibited characteristics closer to those of the other soil categories. These observations further highlight the importance of local environmental conditions in being consistent with observed soil microplastic patterns.
Although OM and soil texture may influence microplastic retention, Spearman correlation analyses performed on the soil dataset only did not reveal any significant relationships between total microplastic concentration and the measured soil properties, including OM and texture-related variables (clay and silt contents). Therefore, the observed variability is likely to be driven by the combined effects of local sources, environmental conditions and soil properties, rather than by any single parameter alone.
In contrast, lower and more homogeneous concentrations observed in cropland soils suggest more diffuse and continuous sources of contamination. Agricultural soils are particularly impacted by inputs such as sewage sludge, compost, and irrigation, which are recognized as major pathways of microplastic transfer to soils [17].
Forest soils, despite being less directly impacted by anthropogenic activities, displayed relatively elevated microplastic concentrations compared to other natural systems. This observation suggests that atmospheric deposition plays a significant role in microplastic input to remote or semi-natural environments, as previously reported in several studies. This interpretation is supported by studies demonstrating that forest soils primarily receive microplastics through atmospheric deposition and litterfall, leading to their accumulation over time [5]. The persistence of microplastics in forest soils may also be enhanced by limited soil disturbance. Grassland soils exhibited a broader range of concentrations, reflecting higher variability between sites. This dispersion likely results from a combination of factors, including variable management practices, soil characteristics, and site-specific environmental conditions.
Overall, these patterns suggest that land use influences microplastic accumulation through differences in anthropogenic inputs and local environmental conditions. While urban-associated environments such as urban soils tend to exhibit elevated concentrations, substantial variability within land-use categories indicates that local factors also contribute to the observed distribution of microplastics in soils.
4.2. Role of Polymer Composition in Soil Differentiation
The analysis of polymer-specific distributions highlights that microplastic composition varies according to the polymer considered and that only a subset of polymers exhibited substantial variability among land-use categories (Figure 3 and Figure 4). In particular PP, PE, and PVC displayed the highest variability across soil samples and showed clear differences between land-use categories. These polymers are frequently reported as dominant components of soil microplastic contamination, reflecting their widespread use and occurrence in terrestrial environments [18].
The variability observed for PE, PP and PVC was consistent with the differentiation between samples observed in the PCA (Figure 4). In contrast, PC, PS, and SBR generally occurred at low concentrations and exhibited limited variability across all land-use categories (Figure 3). Their distributions remained relatively uniform among land-use categories compared with those of the dominant polymers. Interestingly, PP was among the most frequently detected polymers in the study area, whereas PS occurred at comparatively low concentrations. This observation is noteworthy because PS is one of the most extensively studied polymers in microplastic ecotoxicology, while PP remains comparatively less investigated despite its widespread occurrence in environmental samples [19].
Differences observed between land-use categories also reflect variations in the relative abundance of dominant polymers. Forest and urban soil tended to exhibit higher concentrations and wider ranges for several polymers, whereas cropland soils generally narrower distributions. Grassland soils showed greater dispersion, reflecting higher variability in polymer composition between sites.
Together, these observations indicate that differences among land-use categories are associated not only with variations in total microplastic concentrations (Figure 1) but also with changes in the relative abundance of individual polymers.
4.3. Influence of Soil Physicochemical Properties
Among the investigated soil properties, only pH showed a significant association with total microplastic concentrations, although the strength of the relationship remained moderate. Texture-related variables (clay, silt, and clay + silt contents), organic matter content and bulk density did not explain the observed variability. These results suggest that anthropogenic inputs and land-use history may exert a stronger influence on soil microplastic contamination patterns than the measured soil physicochemical properties.
4.4. Influence of Input Materials on Microplastic Composition
The composition of input materials plays a key role in shaping the microplastic patterns observed in soils. The inclusion of composts and sewage sludges aimed to assess whether the polymer signatures observed in soils were consistent with those of major anthropogenic inputs present within the catchment.
The clear separation between input materials and soil samples in the PCA (Figure 3) reflects strong differences in polymer composition, highlighting the importance of source characteristics.
Among the input materials, the Saint-Georges compost exhibited the most distinct profile, with particularly high concentrations (Table 4). This pronounced enrichment is consistent with its extreme position along PC1 in the PCA (Figure 3) and suggests that composted sewage sludge-derived materials may contribute to the transfer of microplastics to soils. Notably, this compost is produced from sewage sludge originating from the Poitiers-La Folie WWTP, establishing a potential source association between the wastewater treatment pathway and the compost applied to agricultural land. The Cissé compost, derived exclusively from green waste, displayed a different polymer profile and lower overall concentrations. In contrast, the domestic compost from Chesnaie exhibited lower concentrations and reduced variability across most polymers (Figure 5), suggesting a more homogeneous microplastic composition than wastewater-derived materials. These differences among composts are consistent with their contrasting feedstocks and production pathways. Whereas the Saint-Georges compost originates from sewage sludge co-composted with organic amendments, the Cissé compost is produced exclusively from green waste and the Chesnaie compost from household biowaste and garden residues. Together, these results indicate that the nature of the feedstock strongly influences both microplastic abundance and polymer composition in organic amendments.
Wastewater treatment plants are recognized as major sinks for microplastics, with a large proportion of particles being retained in sewage sludge during treatment processes [20]. Consequently, the agricultural application of sludge and sludge-derived composts constitutes a significant pathway for the transfer of microplastics to terrestrial environments [3,21]. Differences between sewage sludges further illustrate the variability of wastewater-derived inputs. Variation in microplastic composition among between treatment plants has been previously linked to differences in influent characteristics and treatment processes [22]. In the present study, both sludges contained elevated concentrations of PVC and N66, although the Chasseneuil sludge exhibited higher concentrations of these polymers than the Poitiers sludge. In contrast, SBR was detected only in the Poitiers sludge. These observations highlight the diversity of polymer signatures associated with wastewater-treatment residues.
Although the investigated sewage sludges and composts displayed distinct polymer signatures and represent recognized pathways for microplastic transfer to soils, information on amendment histories was not available for the investigated sites. Consequently, direct attribution of soil polymer signatures to specific organic inputs remains speculative.
Overall, the observed differences among composts and sewage sludges show that organic amendments have unique, polymer-specific microplastic signatures. These signatures are consistent with the separation observed in the PCA and highlight the influence of feedstock origin and treatment pathways on microplastic composition. While compost and sewage sludge are recognized pathways for microplastic input into soil, the absence of site-specific amendment histories prevents the direct attribution of soil polymer signatures to particular input materials.
4.5. Site-Specific Variability and Heterogeneity of Soils
In addition to lands use and input characteristics, the results highlight the importance of site-specific variability in controlling microplastic distribution in soils. While general trends can be identified between soil categories, significant differences are observed within the same land use type, indicating that local conditions play a key role in shaping microplastic distributions (Figure 3 and Figure 4). This spatial heterogeneity in microplastic distribution has been widely reported and is attributed to the uneven distribution of sources, soil properties, and environmental processes [23]. Previous studies have also highlighted the highly heterogeneous nature of microplastic contamination in soils, even within similar land-use categories [2].
This variability was particularly evident in grassland soils, which displayed a wider range of concentrations and greater dispersion compared to other land-use categories. The observed variability between sites may also reflect differences in local environment conditions, management history and soil physicochemical characteristics (Table 1). Organic matter content and texture varied considerably among sites, with clay content ranging from less than 150 to more than 600 g/kg. Although such properties may influence microplastic retention and mobility, no significant relationship between microplastic concentrations and OM content was identified in the present study. Therefore, the observed heterogeneity likely results from the combined influence of multiple factors rather than from a single controlling soil property.
Urban soils further illustrate the importance of site-specific effects. Although grouped within the same category, the Sainte-Croix and Champlain samples exhibited markedly different behaviors. While Sainte-Croix aligned with the general soil cluster, Champlain showed a distinct profile, with elevated concentrations of several polymers. This contrast highlights the influence of local environmental conditions on microplastic accumulation. In particular, the location of the Champlain site adjacent to a stormwater retention basin may contribute to the observed pattern, as such infrastructures can act as hotspots for the accumulation and redistribution of microplastics transported by urban runoff. These observations suggest that local sources and hydrological processes may exert a stronger influence on microplastic composition than land-use classification alone.
Our results suggest that differences among soils cannot be fully explained by their physicochemical properties. Only a weak relationship was observed with soil pH, and there was no significant association between total microplastic concentrations and organic matter content, texture-related variables or bulk density. Instead, comparing sewage sludge and compost signatures indicates that anthropogenic inputs and land use history may be stronger drivers of soil microplastic composition. This underlines the importance of quantitative, polymer-specific approaches for investigating microplastic pathways in terrestrial systems.
5. Conclusions
This study demonstrates that soil contamination is not random. Soil microplastic composition reflects both land use and the characteristics of anthropogenic inputs, although local environmental conditions may strongly modulate these patterns.
Urban soils exhibited the highest concentrations and the greatest variability, highlighting the influence of direct anthropogenic inputs and site-specific factors. In contrast, cropland, grassland, and forest soils generally displayed lower contamination levels, although substantial variability was observed within each land-use category.
Variations in polymer composition, particularly for dominant polymers such as PP, PE, PVC, and N66, played a major role in differentiating both soils and input materials. The PCA further revealed a clear separation between soils and organic inputs, indicating that composts and sewage sludges possess distinct microplastic signatures compared with soils. Differences among input materials were strongly dependent on feedstock origin, reflecting the influence of waste sources and treatment pathways.
The results also emphasize the importance of local conditions in shaping microplastic distributions. The marked contrast observed between the two urban soils, particularly the distinct behavior of the Champlain site located near a stormwater retention basin, illustrates how local sources and environmental processes may influence microplastic accumulation beyond broad land-use classifications.
Soil physicochemical properties are often considered important factors influencing microplastic retention. However, the present study found no significant relationship between total microplastic concentrations and the following: organic matter content, clay content, silt fractions, clay and silt content, or bulk density. Only a weak negative relationship was observed with soil pH. These results suggest that measured soil properties only partially explain the observed variability and that anthropogenic inputs, land use history, and local environmental conditions may be stronger drivers of soil microplastic distribution.
Overall, these findings underscore the collective impact of land use, source characteristics, and site-specific environmental conditions on microplastic contamination. Comparing polymer-specific signatures obtained by Py-GC-MS suggests that anthropogenic inputs may influence soil microplastic composition more than the soil physicochemical properties investigated in this study. This emphasizes the complexity of microplastic dynamics in terrestrial ecosystems.
The absence of detailed information concerning historical management practices and amendment applications prevents direct attribution of soil microplastics to specific sources. Future research should focus on quantifying the contributions of various input pathways, such as organic amendments, atmospheric deposition, and urban runoff, to the presence of microplastics in soil. Additionally, the long-term fate of microplastics in soil should be evaluated. Particular attention should be given to their persistence, transformation processes, vertical transport, and potential impacts on soil functions, ecosystem health, and the delivery of soil ecosystem services. Additionally, mounting evidence indicates that microplastics may interact with co-occurring contaminants, potentially altering their transport, bioavailability, and ecological effects. This underscores the necessity of integrated assessments of multiple stressors in terrestrial environments [24].
Supplementary Materials
The following supporting information can be downloaded at: https://www.mdpi.com/article/10.3390/microplastics5040197/s1, Figure S1: Principal component analysis (PCA) of polymer-specific microplastic concentrations (mg kg−1) in soil samples. Samples are colored according to land-use category. The percentage of variance explained by each principal component is indicated on the corresponding axis; Table S1: Relationships between total microplastic concentrations and soil physicochemical properties assessed using Spearman rank correlation analysis. Correlation coefficients (ρ) and associated p-values are reported for organic matter content, pH, clay content, silt content and bulk density.
Author Contributions
Validation, A.P.; formal analysis, L.L.; investigation, L.M., J.L., and E.A.; writing—original draft preparation, L.L.; writing—review and editing, J.L.; visualization, L.L. and E.A.; project administration, L.L.; funding acquisition, L.L. and E.A. All authors have read and agreed to the published version of the manuscript.
Funding
This research was funded by the French Agency for Environment and Energy Management (ADEME), grant number 2272D0106, and by the French Office for Biodiversity (OFB), grant number OFB.22.1119.
Data Availability Statement
Data will be available on request.
Conflicts of Interest
The authors declare no conflicts of interest.
Abbreviations
The following abbreviations are used in this manuscript:
| ABS | Acrylonitrile–butadiene–styrene |
| IQR | Interquartile range |
| N-6 | Nylon 6 |
| N-66 | Nylon 6,6 |
| OM | Organic matter |
| PC | Polycarbonate |
| PCA | Principal component analysis |
| PE | Polyethylene |
| PET | Polyethylene terephthalate |
| PMMA | Polymethyl methacrylate |
| PP | Polypropylene |
| PS | Polystyrene |
| PU | Polyurethane |
| PVC | Polyvinyl chloride |
| Py-GC-MS | Pyrolysis coupled with gas chromatography and mass spectrometry |
| SBR | Styrene–butadiene rubber |
| UP | Ultra-pure |
| WWTP | Wastewater treatment plant |
References
- Li, W.; Zu, B.; Yang, Q.; Guo, J.; Li, J. Sources, distribution, and environmental effects of microplastics: A systematic review. RSC Adv. 2023, 13, 15566–15574. [Google Scholar] [CrossRef] [Scilit] [PubMed]
- Büks, F.; Kaupenjohann, M. Global concentrations of microplastics in soils—A review. Soil 2020, 6, 649–662. [Google Scholar] [CrossRef] [Scilit]
- Arab, M.; Yu, J.; Nayebi, B. Microplastics in sludges and soils: A comprehensive review on distribution, characteristics, and effects. ChemEngineering 2024, 8, 86. [Google Scholar] [CrossRef] [Scilit]
- Hechmi, S.; Bhat, M.A.; Kallel, A.; Khiari, O.; Louati, Z.; Khelil, M.N.; Zoghlami, R.I.; Cherni, Y.; Melki, S.; Trabelsi, I.; et al. Soil contamination with microplastics (MPs) from treated wastewater and sewage sludge: Risks and sustainable mitigation strategies. Discov. Environ. 2024, 2, 95. [Google Scholar] [CrossRef] [Scilit]
- Weber, C.J.; Bigalke, M. Forest soils accumulate microplastics through atmospheric deposition. Commun. Earth Environ. 2025, 6, 702. [Google Scholar] [CrossRef] [Scilit]
- Chang, K.; Ma, Y.; Han, Y. Research progress on source analysis, ecological effects, and separation technology of soil microplastics. Microplastics 2025, 4, 39. [Google Scholar] [CrossRef] [Scilit]
- Mohasin, M.; Habib, K.; Rao, P.S.; Ahmad, M.; Siddiqui, S. Microplastics in agricultural soils: Sources, impacts, and mitigation strategies. Environ. Monit. Assess. 2025, 197, 684. [Google Scholar] [CrossRef] [Scilit] [PubMed]
- Gündoğdu, S.; Akça, M.O.; Gursoy, M.; Yılmaz, M.; Zhang, X.; Rodríguez-Seijo, A.; Bibi, A.; Di Gioia, M.L.; Velimirovic, M. Microplastics in soil: A comprehensive review of analytical techniques. Front. Soil Sci. 2025, 5, 1614075. [Google Scholar] [CrossRef] [Scilit]
- Peel, R.H.; Lloyd, C.E.M.; Roberts, S.J.; Naafs, B.D.A.; Bull, I.D. Quantification of microplastic targets in environmental matrices using pyrolysis-gas chromatography-mass spectrometry. Environ. Sci. Adv. 2025, 4, 159–171. [Google Scholar] [CrossRef] [Scilit]
- NF X31-107; Soil Quality—Determination of Particle-Size Distribution of Soil Particles—Pipette Method. AFNOR: Saint-Denis, France, 2003.
- XP P94-047; Soils: Investigation and testing—Determination of the organic matter content of a material—Ignition method. AFNOR: Saint-Denis, France, 1998.
- NF U 44-095; Organic Soil Improvers—Composts Containing Substances Essential to Agriculture, Originating from Water Treatment. AFNOR: Saint-Denis, France, 2002.
- NF U 44-051; Organic Soil Improvers—Designations, Specifications and Marking. AFNOR: Saint-Denis, France, 2006.
- Lemée, L.; Puydupin, A.; Aubertheau, E.; Froger, E.; Mondamert, L.; Labanowski, J. Advancing microplastic analysis: Pyrolysis-GC–MS method development and validation for small polymer particles in complex environmental matrices. J. Hazard. Mater. Adv. 2026, 22, 101228. [Google Scholar] [CrossRef] [Scilit]
- NF T 90-210; Water Quality—Protocol for the Initial Evaluation of the Performance Characteristics of a Method in a Laboratory. AFNOR: Saint-Denis, France, 2018.
- Hu, J.; Zhang, L.; Zhang, W.; Irfan, M.; Yu, C.; Zhang, Y.; Li, C.; Zhang, L. Significant influence of land use types and anthropogenic activities on the distribution of microplastics in soil: A case from a typical mining-agricultural city. J. Hazard. Mater. 2024, 477, 135253. [Google Scholar] [CrossRef] [Scilit] [PubMed]
- Chia, R.W.; Lee, J.Y.; Cha, J.; Çelen-Erdem, İ. A comparative study of soil microplastic pollution sources: A review. Environ. Pollut. Bioavailab. 2023, 35, 2280526. [Google Scholar] [CrossRef] [Scilit]
- Garbounis, G.; Karasali, H.; Komilis, D. Origin, occurrence and threats of microplastics in agricultural soils: A comprehensive review. Sustainability 2026, 18, 1524. [Google Scholar] [CrossRef] [Scilit]
- Gomes, T.; Bour, A.; Coutris, C.; Almeida, A.C.; Brate, I.L.; Wolf, R.; Bank, M.S.; Lusher, A.L. Ecotoxicological Impacts of Micro- and Nanoplastics in Terrestrial and Aquatic Environments. In Microplastic in the Environment: Pattern and Process. Environmental Contamination Remediation and Management; Bank, M.S., Ed.; Springer: Cham, Switzerland, 2022. [Google Scholar] [CrossRef] [Scilit]
- Iyare, P.; Ouki, S.; Bond, T. Microplastics removal in wastewater treatment plants: A critical review. Environ. Sci. Water Res. Technol. 2020, 6, 2664–2675. [Google Scholar] [CrossRef] [Scilit]
- Hatinoğlu, M.D.; Sanin, F.D. Sewage sludge as a source of microplastics in the environment: A review of occurrence and fate during sludge treatment. J. Environ. Manag. 2021, 295, 113028. [Google Scholar] [CrossRef] [Scilit] [PubMed]
- Di Bella, G.; Corsino, S.F.; De Marines, F.; Lopresti, F.; La Carrubba, V.; Torregrossa, M.; Viviani, G. Occurrence of microplastics in waste sludge of wastewater treatment plants: Comparison between membrane bioreactor (MBR) and conventional activated sludge (CAS) technologies. Membranes 2022, 12, 371. [Google Scholar] [CrossRef] [Scilit] [PubMed]
- Arévalo-Hernández, J.J.; Severo, E.M.; de Brito, A.D.B.; Tassinari, D.; Silva, M.L.N. Assessment of soil microplastics and their relation to soil and terrain attributes under different land uses. AgriEngineering 2025, 7, 281. [Google Scholar] [CrossRef] [Scilit]
- Wu, L.; Zhou, X.; Lai, C.; Ma, M.; Qin, L.; Wang, W. Microplastics–Pollutant Interactions in Environmental Systems: Mechanisms, Ecological Effects, and Implications for Sustainable Management. Molecules 2026, 31, 1852. [Google Scholar] [CrossRef] [Scilit] [PubMed]

Disclaimer/Publisher’s Note: The statements, opinions and data contained in all publications are solely those of the individual author(s) and contributor(s) and not of MDPI and/or the editor(s). MDPI and/or the editor(s) disclaim responsibility for any injury to people or property resulting from any ideas, methods, instructions or products referred to in the content. |
© 2026 by the authors. Licensee MDPI, Basel, Switzerland. This article is an open access article distributed under the terms and conditions of the Creative Commons Attribution (CC BY) license.