Next Issue
Volume 3, June
Previous Issue
Volume 2, December


Earth, Volume 3, Issue 1 (March 2022) – 29 articles

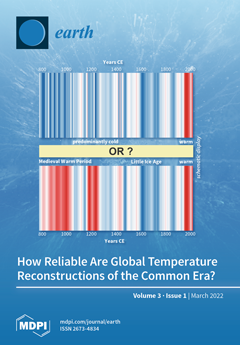
Cover Story (view full-size image): The global climate has been warming consistently during the industrial era. In order to better understand its underlying processes, modern climate change has to be placed in a longer-term pre-industrial temperature context covering past millennia. A large number of local case studies have documented significant pre-industrial temperature fluctuations. Published hemispheric and global temperature composites for the last 2000 years, however, differ greatly, in some segments by more than 0.5 °C. While some reconstructions show negligible pre-industrial climate variability (“hockey sticks”), others suggest significant temperature fluctuations. We discuss possible sources of error and highlight three criteria that need to be considered to increase the quality and stability of future compilation attempts. View this paper
  • Issues are regarded as officially published after their release is announced to the table of contents alert mailing list.
  • You may sign up for e-mail alerts to receive table of contents of newly released issues.
  • PDF is the official format for papers published in both, html and pdf forms. To view the papers in pdf format, click on the "PDF Full-text" link, and use the free Adobe Reader to open them.
Order results
Result details
Select all
Export citation of selected articles as:
14 pages, 5177 KiB  
Article
Uncertainties and Perspectives on Forest Height Estimates by Sentinel-1 Interferometry
by Samuele De Petris, Filippo Sarvia and Enrico Borgogno-Mondino
Earth 2022, 3(1), 479-492; https://doi.org/10.3390/earth3010029 - 18 Mar 2022
Cited by 1 | Viewed by 2213
Abstract
Forest height is a key parameter in forestry. SAR interferometry (InSAR) techniques have been extensively adopted to retrieve digital elevation models (DEM) to give a representation of the continuous variation of the Earth’s topography, including forests. Unfortunately, InSAR has been proven to fail [...] Read more.
Forest height is a key parameter in forestry. SAR interferometry (InSAR) techniques have been extensively adopted to retrieve digital elevation models (DEM) to give a representation of the continuous variation of the Earth’s topography, including forests. Unfortunately, InSAR has been proven to fail over vegetation due to low coherence values; therefore, all phase unwrapping algorithms tend to avoid these areas, making InSAR-derived DEM over vegetation unreliable. In this work, a sensitivity analysis was performed with the aim of properly initializing the relevant operational parameters (baseline and multilooking factor) to maximize the theoretical accuracy of the height difference between the forest and reference point. Some scenarios were proposed to test the resulting “optimal values”, as estimated at the previous step. A simple model was additionally proposed and calibrated, aimed at predicting the optimal baseline value (and therefore image pair selection) for height uncertainty minimization. All our analyses were conducted using free available data from the Copernicus Sentinel-1 mission to support the operational transfer into the forest sector. Finally, the potential uncertainty affecting resulting height measures was quantified, showing that a value lower than 5 m can be expected once all user-dependent parameters (i.e., baseline, multilooking factor, temporal baseline) are properly tuned. Full article
Show Figures

Figure 1

19 pages, 6488 KiB  
Review
Permafrost Landscape Research in the Northeast of Eurasia
by Alexander N. Fedorov
Earth 2022, 3(1), 460-478; https://doi.org/10.3390/earth3010028 - 18 Mar 2022
Cited by 6 | Viewed by 2697
Abstract
The results of permafrost landscape studies on northeastern Eurasia are presented in this review. The assessment of permafrost vulnerability to disturbances and global warming was the basis for the development of these studies. The permafrost landscape, considering the morphological features of the landscape [...] Read more.
The results of permafrost landscape studies on northeastern Eurasia are presented in this review. The assessment of permafrost vulnerability to disturbances and global warming was the basis for the development of these studies. The permafrost landscape, considering the morphological features of the landscape and the permafrost together, is a timely object of study. The theoretical developments of Soviet physical geographers and landscape scientists are the basis for permafrost landscape studies. Over the past four decades, numerous permafrost landscape studies have been carried out on northeastern Eurasia (and Russia). Considering the results of these studies is the main objective of this article. The analysis of the problems of permafrost landscape identification, classification, and mapping and the study of their dynamics and evolution after disturbances and long-term development were carried out. Permafrost landscape studies employ the research methods of landscape science and geocryology. Environmental protection and adaptation of socioeconomic conditions to modern climate warming will determine the prospects for studying permafrost landscapes. Full article
Show Figures

Figure 1

12 pages, 1756 KiB  
Article
Arsenic in Groundwater Sources from Selected Communities Surrounding Taal Volcano, Philippines: An Exploratory Study
by Geminn Louis C. Apostol, Sary Valenzuela and Xerxes Seposo
Earth 2022, 3(1), 448-459; https://doi.org/10.3390/earth3010027 - 15 Mar 2022
Cited by 4 | Viewed by 7514
Abstract
Arsenic (As) is a highly toxic, carcinogenic trace metal that can potentially contaminate groundwater sources in volcanic regions. This study provides the first comparative documentation of As concentrations in groundwater in a volcano-sedimentary region in the Philippines. Matched, repeated As measurements and physico-chemical [...] Read more.
Arsenic (As) is a highly toxic, carcinogenic trace metal that can potentially contaminate groundwater sources in volcanic regions. This study provides the first comparative documentation of As concentrations in groundwater in a volcano-sedimentary region in the Philippines. Matched, repeated As measurements and physico-chemical analyses were performed in 26 individual wells from 11 municipalities and city in Batangas province from July 2020 to November 2021. Using the electrothermal atomic absorption spectrometric method, analysis of the wells revealed that in 2020, 23 out of 26 (88.46%) had As levels above the WHO limit of >10 ppb while 20 out of 26 wells (76.92%) had persistently high As levels a year later. Using a Wilcoxon signed-rank test, levels of As were found to be statistically elevated compared to the national safe limit of 10 pbb in the 26 matched sampling sites in both 2020 (p-value < 0.001) and 2021 (p-value = 0.013). Additionally, a two-paired Wilcoxon signed-rank test revealed that As levels were statistically higher in 2020 than in 2021 (p-value = 0.003), suggesting that As levels may be higher in years when there is more volcanic activity; however, this remains to be further elucidated with suitable longitudinal data, as this study is still in its preliminary stages. The data was also analyzed using a bivariable regression, which showed no evidence of a significant relationship between As levels and distance from the danger zone (Taal volcano crater); however, results showed an inverse but statistically insignificant relationship between As levels and elevation. Due to the toxic profile and persistence of As in groundwater in Batangas Province, continuous groundwater As monitoring, timely public health risk communication, and the provision of alternative water sources to affected populations are recommended. Full article
Show Figures

Figure 1

15 pages, 1446 KiB  
Review
Current Trends and Issues in Applications of Remote Sensing in Coastal and Marine Conservation
by Egidijus Jurkus, Ramūnas Povilanskas, Artūras Razinkovas-Baziukas and Julius Taminskas
Earth 2022, 3(1), 433-447; https://doi.org/10.3390/earth3010026 - 11 Mar 2022
Cited by 4 | Viewed by 2908
Abstract
The background of this feature article is a necessity to systematize a vast array of issues pertinent to the latest applications of remote sensing in coastal and marine conservation. Hence the purpose of this study: stocktaking of cutting-edge research articles in this field [...] Read more.
The background of this feature article is a necessity to systematize a vast array of issues pertinent to the latest applications of remote sensing in coastal and marine conservation. Hence the purpose of this study: stocktaking of cutting-edge research articles in this field and eliciting the essential trends and issues shaping the knowledge and future research and technical development perspectives in coastal and marine nature conservation, which is pivotal for meeting the United Nations Sustainable Development Goals till 2030. A hierarchical cluster analysis was undertaken with the KH Coder 3.0 tool to elicit topical co-occurrence networks for thematic words in academic papers from 2015 to 2021 on the topic quarried from Scholar Google. The article’s main findings are the elicited four main trending themes in applications of remote sensing in coastal and marine conservation: (1) Remote Sensing-Based Classification and Modelling; (2) Conservation of Tropical Coastal and Marine Habitats; (3) Mapping of Habitats and Species Distribution; (4) Ecosystem and Biodiversity Conservation and Resource Management. The main conclusion of the article is that habitat vulnerability is a key factor to take into consideration for the future hybrid applications of remote sensing and “citizen science” inputs. Full article
(This article belongs to the Special Issue Applications of Remote Sensing for Resources Conservation)
Show Figures

Figure 1

24 pages, 6580 KiB  
Article
Characterizing Meteorological Droughts in Nepal: A Comparative Analysis of Standardized Precipitation Index and Rainfall Anomaly Index
by Anil Aryal, Manisha Maharjan, Rocky Talchabhadel and Bhesh Raj Thapa
Earth 2022, 3(1), 409-432; https://doi.org/10.3390/earth3010025 - 4 Mar 2022
Cited by 11 | Viewed by 5871
Abstract
Drought is an environmental disaster related to the extremes (on a drier side) in hydrometeorology. The precipitation amount modulates drought in Nepalese river basins. It is vital for efficient water resources management to quantify and understand drought. This paper aims to characterize the [...] Read more.
Drought is an environmental disaster related to the extremes (on a drier side) in hydrometeorology. The precipitation amount modulates drought in Nepalese river basins. It is vital for efficient water resources management to quantify and understand drought. This paper aims to characterize the droughts in Nepal based on standard precipitation index (SPI) and rainfall anomaly index (RAI) using daily precipitation data and assess their impacts on annual crop yields. We used 41 years (1975–2015) of daily precipitation data to compute monthly means and then the drought indices, namely, SPI and RAI, at 123 stations across Nepal. Results showed that the northwest and eastern regions experienced drought compared to other regions, although the severity and duration were shorter. For stations 101 and 308, we found extreme drought events after 2005 for SPI-1, SPI-3, and SPI-6. However, for SPI-6, extreme drought was also observed in 1989 and 1994 at both stations. The year 1992 was one of the severest drought years for the western and northwest regions, where the severity crossed more than −2.0 for all SPI months. Similar to SPI, RAI also revealed a similar degree of drought in the country. RAI showed that the eastern region depicted a higher degree of severity of drought compared to other areas beyond 2004. The lesser severity is also seen in the far west part beyond 2005. The results showed that SPI and RAI could equally be used to analyze drought severity. More frequent drought incidents have been observed after 2010 at all the considered precipitation stations. With the increase in the drought severity, the crop yield (such as paddy, maize, barley, millet, and wheat) has been directly impacted. These results might be significant for planning water resource and irrigation water management systems. Full article
Show Figures

Figure 1

8 pages, 2326 KiB  
Review
How Reliable Are Global Temperature Reconstructions of the Common Era?
by Sebastian Lüning and Philipp Lengsfeld
Earth 2022, 3(1), 401-408; https://doi.org/10.3390/earth3010024 - 3 Mar 2022
Cited by 1 | Viewed by 7171
Abstract
Global mean annual temperature has increased by more than 1 °C during the past 150 years, as documented by thermometer measurements. Such observational data are, unfortunately, not available for the pre-industrial period of the Common Era (CE), for which the climate development is [...] Read more.
Global mean annual temperature has increased by more than 1 °C during the past 150 years, as documented by thermometer measurements. Such observational data are, unfortunately, not available for the pre-industrial period of the Common Era (CE), for which the climate development is reconstructed using various types of palaeoclimatological proxies. In this analysis, we compared seven prominent hemispheric and global temperature reconstructions for the past 2000 years (T2k) which differed from each other in some segments by more than 0.5 °C. Whilst some T2k show negligible pre-industrial climate variability (“hockey sticks”), others suggest significant temperature fluctuations. We discuss possible sources of error and highlight three criteria that need to be considered to increase the quality and stability of future T2k reconstructions. Temperature proxy series are to be thoroughly validated with regards to (1) reproducibility, (2) seasonal stability, and (3) areal representativeness. The T2k represents key calibration data for climate models. The models need to first reproduce the reconstructed pre-industrial climate history before being validated and cleared for climate projections of the future. Precise attribution of modern warming to anthropogenic and natural causes will not be possible until T2k composites stabilize and are truly representative for a well-defined region and season. The discrepancies between the different T2k reconstructions directly translate into a major challenge with regards to the political interpretation of the climate change risk profile. As a rule of thumb, the larger/smaller the pre-industrial temperature changes, the higher/lower the natural contribution to the current warm period (CWP) will likely be, thus, reducing/increasing the CO2 climate sensitivity and the expected warming until 2100. Full article
Show Figures

Figure 1

18 pages, 7016 KiB  
Article
A Multi-Data Geospatial Approach for Understanding Flood Risk in the Coastal Plains of Tamil Nadu, India
by Sekar Leo George, Komali Kantamaneni, Rasme Allat V, Kumar Arun Prasad, Sulochana Shekhar, Sigamani Panneer, Louis Rice and Karuppusamy Balasubramani
Earth 2022, 3(1), 383-400; https://doi.org/10.3390/earth3010023 - 1 Mar 2022
Cited by 11 | Viewed by 5166
Abstract
The coastal plains of Tamil Nadu, India, are prone to floods, the most common disaster experienced in this region almost every year. This research aims to identify flood risks in the coastal plain region of Tamil Nadu, delineated through a watershed approach with [...] Read more.
The coastal plains of Tamil Nadu, India, are prone to floods, the most common disaster experienced in this region almost every year. This research aims to identify flood risks in the coastal plain region of Tamil Nadu, delineated through a watershed approach with 5020 micro-administrative units covering an area of about 26,000 sq. km. A comprehensive flood risk assessment covering hazard, vulnerability, and exposure parameters was carried out using multiple datasets derived from field surveys, satellite data, and secondary data sources. The flood hazard layer was prepared on a probability scale (0–1) with the help of Sentinel-1 Synthetic Aperture Radar data coupled with GIS-based water rise modelling using Shuttle Radar Topography Mission Digital Elevation Model (SRTM-DEM) and reports of the District Disaster Management Plans of 13 coastal districts. In addition, the National Resources Conservation Service-Curve Number (NRCS-CN) method was adopted to estimate surface runoff potential for identifying low probability flood-prone regions. The vulnerability and exposure of the population to flood hazards were determined using census and household data-based indicators. The different categories of built-up areas were delineated and intersected with the flood hazard layer to estimate elements at flood risk. An exhaustive field survey was conducted at 514 locations of the study area, targeting deprived communities of all major settlements to validate the flood hazard layer and understand the public perceptions. The amalgamation of results shows that very high flood risk prevails in the northern parts of coastal Tamil Nadu, especially the stretch between Chennai and Cuddalore. In addition, to provide baseline datasets for the first time at micro-administrative units for the entire coastal plains of Tamil Nadu, the study offers a pragmatic methodology for determining location-specific flood risks for policy interventions. Full article
Show Figures

Figure 1

20 pages, 5267 KiB  
Article
Monitoring Subaquatic Vegetation Using Sentinel-2 Imagery in Gallocanta Lake (Aragón, Spain)
by Juan Soria, Miriam Ruiz and Samuel Morales
Earth 2022, 3(1), 363-382; https://doi.org/10.3390/earth3010022 - 23 Feb 2022
Cited by 4 | Viewed by 2087
Abstract
Remote sensing allows the study of aquatic vegetation cover in shallow lakes from the different spectral responses of the water as the vegetation grows from the bottom toward the surface. In the case of Gallocanta Lake, its seasonality and shallow depth (less than [...] Read more.
Remote sensing allows the study of aquatic vegetation cover in shallow lakes from the different spectral responses of the water as the vegetation grows from the bottom toward the surface. In the case of Gallocanta Lake, its seasonality and shallow depth (less than 2 m) allow us to appreciate the variations in the aquatic vegetation with the apparent color. Six common vegetation indices were tested, and the one with the best response was the so-called NDI45, which uses the normalized ratio between the far red (705 nm) and red (665 nm) bands. Our aims are to show the variations in the surface area covered by vegetation at the bottom of the lagoon, its growth and disappearance when drying occurs, and recolonization in a flooding period. The degree of cover reaches 90% at the most favorable times of the year, generally in summer and coinciding with flooding of the lake. The studied period shows how this method can be used for lacustrine habitat detection and highlights the need for field vegetation inventories in future works, which will allow the spectral measurements to be related to the species present. Full article
(This article belongs to the Special Issue Applications of Remote Sensing for Resources Conservation)
Show Figures

Graphical abstract

18 pages, 1625 KiB  
Article
Implications of Climate Change on Outdoor Recreation: The Case of National Parks in Israel
by Sharon Teitler Regev and Ruslana Rachel Palatnik
Earth 2022, 3(1), 345-362; https://doi.org/10.3390/earth3010021 - 21 Feb 2022
Cited by 1 | Viewed by 3826
Abstract
Changing weather driven by climate change may influence tourists’ decisions about “when and where to go for vacation.” Indeed, the results of climate change have altered the attractiveness of a variety of destinations and locations, therefore changing the profitability of tourism-based businesses. The [...] Read more.
Changing weather driven by climate change may influence tourists’ decisions about “when and where to go for vacation.” Indeed, the results of climate change have altered the attractiveness of a variety of destinations and locations, therefore changing the profitability of tourism-based businesses. The aim of the study was to evaluate the potential impact of climate change on visits to outdoor recreation sites. Specifically, the research assessed the impact of weather, as well as economic and other characteristics, on the number of domestic and international tourists visiting national parks located in different climate zones within a single country—Israel. This research was based on a unique database of actual daily visits by international and domestic tourists to national parks in Israel during a six-year period (2012–2017). Each national park has different accessibility characteristics and offers different attractions. The climate data included daily maximum temperature, rain, extreme weather, as well as temperature indices measuring heat and cold. The results of the econometric analysis showed that weather-related parameters have a statistically significant effect on national park visits among both domestic and international tourists, while the magnitude of the effect varies by park and visitors’ place of origin. Full article
Show Figures

Figure 1

21 pages, 7582 KiB  
Article
How Can the Morphometric Characteristics and Failure Conditions of a Historic Gully Caused by Intense Rainfall Be Reconstructed?
by Claire Rault, Yannick Thiery, Bertrand Aunay, Bastien Colas, Kahina Reboul and Thomas J. B. Dewez
Earth 2022, 3(1), 324-344; https://doi.org/10.3390/earth3010020 - 19 Feb 2022
Cited by 1 | Viewed by 2085
Abstract
In January 1980, during exceptional cyclonic rainfall, an atypical landslide, called déboulé, rapidly generated the permanent 700 m-long gully of the Ravine de l’Eglise on an inhabited plateau in Reunion Island (Indian Ocean). Retrieving the initial conditions that led to this historical [...] Read more.
In January 1980, during exceptional cyclonic rainfall, an atypical landslide, called déboulé, rapidly generated the permanent 700 m-long gully of the Ravine de l’Eglise on an inhabited plateau in Reunion Island (Indian Ocean). Retrieving the initial conditions that led to this historical process is both challenging and necessary for understanding the mechanism of gully incision and providing pointers for improving risk mitigation in relation to this phenomenon. In this study, we reconstruct the pre- and post-failure topographies using SFM (structure from motion) applied on archive aerial photographs. Based on the comparison of these digital elevation models, we estimate the volume of material eroded to be ca. 0.63 Mm3. Groundwater level increase, part of the triggering mechanism, is hindcast in the catchment of the gully using a lumped hydrological model. This model shows that in only a fortnight the groundwater level probably rose by 36 m, which could have caused a progressive increase in pore pressure and triggered formation of the gully by retrogressive landslides. We test this hypothesis by considering the pre-failure topography and the hindcast groundwater level in a deterministic model based on limit equilibrium equations to explore ground stability. The evolution of ground stability with a rise in the water table shows that the gully may have extended in a headward direction by retrogressive landslides. This is the first quantitative reconstruction of an exceptional historical event affecting the territory of Reunion Island. The methods used to investigate the Ravine de L’Eglise incision thus offer new complementary insights and challenges for understanding the mechanism and the temporality of gully formation. Full article
(This article belongs to the Special Issue Innovative Approaches for Modeling and Monitoring of Gully Erosion)
Show Figures

Figure 1

11 pages, 741 KiB  
Article
Characterizing Sustained Use of Cleaner Cooking Fuel in Rural Poor Households of South India
by Praveen Kumar, Maritha Du and Mingyue Ma
Earth 2022, 3(1), 313-323; https://doi.org/10.3390/earth3010019 - 19 Feb 2022
Cited by 4 | Viewed by 2080
Abstract
Approximately 40% of the global population (primarily rural poor) rely on traditional cookstoves, with pernicious social, economic, and health outcomes. The Government of India launched its massive Prime Ministers’ Ujjwala scheme in 2016 to promote liquefied petroleum gas (LPG), a cleaner cooking system, [...] Read more.
Approximately 40% of the global population (primarily rural poor) rely on traditional cookstoves, with pernicious social, economic, and health outcomes. The Government of India launched its massive Prime Ministers’ Ujjwala scheme in 2016 to promote liquefied petroleum gas (LPG), a cleaner cooking system, in poor communities. While there has been a surge in adoption, consistent use of LPG has been tepid. We examined the trend of use of LPG for 18 months in 58 poor households of South India. In place of soliciting survey questions on stove usage, we deployed stove use monitoring technologies to accurately measure the use of LPG and traditional stoves. We also analyzed factors characterizing LPG use. None of the households used LPG for more than 55% of their cooking time. LPG refill transportation, perception of faster cooking, and caste were significant predictors of LPG use. The findings highlight that social workers must engage with these communities to improve their awareness and shape their perceptions of cleaner cooking. Full article
Show Figures

Figure 1

26 pages, 1310 KiB  
Review
Invasion of the Giant Hogweed and the Sosnowsky’s Hogweed as a Multidisciplinary Problem with Unknown Future—A Review
by Emilia Grzędzicka
Earth 2022, 3(1), 287-312; https://doi.org/10.3390/earth3010018 - 18 Feb 2022
Cited by 13 | Viewed by 5511
Abstract
Caucasian hogweeds are plants introduced to Europe from the Caucasus area. This review concerns the two most common ones—the giant hogweed Heracleum mantegazzianum and the Sosnowsky’s hogweed Heracleum sosnowskyi. The first of them was imported as garden decorations from the 19th century, [...] Read more.
Caucasian hogweeds are plants introduced to Europe from the Caucasus area. This review concerns the two most common ones—the giant hogweed Heracleum mantegazzianum and the Sosnowsky’s hogweed Heracleum sosnowskyi. The first of them was imported as garden decorations from the 19th century, mainly to Western Europe, while the second one was introduced from the mid–20th century to agricultural areas in Eastern Europe. Nowadays, these two species create one of the most problematic invasions in the world. This review aimed to synthesize research on those invaders based on 277 articles selected from the “Scopus” database. Most of the articles concerned their extensive distribution, at least on a continental scale and the rapid dispersal. The reviewed research showed that the complex physicochemical properties of hogweeds tissues and secretions significantly affected insects, aphids, ants, nematodes, fungi, soil microorganisms, plant communities, birds, and many other components of the ecosystems. This knowledge turned out to be disproportionately small to the scale of the problem. The review also showed what ecological traits of hogweeds were responsible for their wide and various role in the environment. Thus far, no effective method to eradicate Caucasian hogweeds has been found. This could be a growing mistake, given that they are probably during the rapid evolutionary changes within the range of their invasion. Full article
Show Figures

Figure 1

28 pages, 12503 KiB  
Article
Timescape: A Novel Spatiotemporal Modeling Tool
by Marco Ciolfi, Francesca Chiocchini, Rocco Pace, Giuseppe Russo and Marco Lauteri
Earth 2022, 3(1), 259-286; https://doi.org/10.3390/earth3010017 - 17 Feb 2022
Cited by 1 | Viewed by 2866
Abstract
We developed a novel approach in the field of spatiotemporal modeling, based on the spatialisation of time, the Timescape algorithm. It is especially aimed at sparsely distributed datasets in ecological research, whose spatial and temporal variability is strongly entangled. The algorithm is based [...] Read more.
We developed a novel approach in the field of spatiotemporal modeling, based on the spatialisation of time, the Timescape algorithm. It is especially aimed at sparsely distributed datasets in ecological research, whose spatial and temporal variability is strongly entangled. The algorithm is based on the definition of a spatiotemporal distance that incorporates a causality constraint and that is capable of accommodating the seasonal behavior of the modeled variable as well. The actual modeling is conducted exploiting any established spatial interpolation technique, substituting the ordinary spatial distance with our Timescape distance, thus sorting, from the same input set of observations, those causally related to each estimated value at a given site and time. The notion of causality is expressed topologically and it has to be tuned for each particular case. The Timescape algorithm originates from the field of stable isotopes spatial modeling (isoscapes), but in principle it can be used to model any real scalar random field distribution. Full article
Show Figures

Figure 1

14 pages, 1369 KiB  
Review
Rethinking Rehabilitation of Salt-Affected Land: New Perspectives from Australian Experience
by John E. Leake, Victor Squires and Sergey Shabala
Earth 2022, 3(1), 245-258; https://doi.org/10.3390/earth3010016 - 11 Feb 2022
Cited by 5 | Viewed by 2812
Abstract
Soil salinity is a major threat to the sustainability of agricultural production systems and has defeated civilisations whenever the cost of remediation exceeded the benefits. Among the reasons for this is the complexity of the plant-water-soil nexus and that the causes of salinity [...] Read more.
Soil salinity is a major threat to the sustainability of agricultural production systems and has defeated civilisations whenever the cost of remediation exceeded the benefits. Among the reasons for this is the complexity of the plant-water-soil nexus and that the causes of salinity are often separated from the damage in time and space. There have been many activities to address salinity, and while good progress has occurred in commercially attractive irrigation areas, many apparently successful techniques, such as intercropping obligate halophytes with conventional crops, processing halophyte meals for human consumption and new uses for saline waters, have not been taken up, although the benefit in ecological terms is understood. There are limited payments available for some ecosystem services, but these are not yet a very recognised market for land users, whose agency is essential for long term success and addressing this requires institutional evolution. We conclude, from Australian experience, that a more concerted effort, perhaps initiated by a philanthropist, is needed to show merchants and agencies how a range of payments for ecosystem services can be turned into true markets in an aggregate way so the ‘knowledge of what can be done can be transformed into benefit’. Full article
Show Figures

Figure 1

17 pages, 4569 KiB  
Article
The Theoretical Approach to the Modelling of Gully Erosion in Cohesive Soil
by Aleksey Sidorchuk
Earth 2022, 3(1), 228-244; https://doi.org/10.3390/earth3010015 - 9 Feb 2022
Viewed by 2044
Abstract
The stochastic gully erosion model (STOGEM) is based on a combination of deterministic mechanics and a stochastic description of the erosion control factors. The main proposition in the model is that the depth of the active surface layer of eroded cohesive soil is [...] Read more.
The stochastic gully erosion model (STOGEM) is based on a combination of deterministic mechanics and a stochastic description of the erosion control factors. The main proposition in the model is that the depth of the active surface layer of eroded cohesive soil is equal to one particle diameter, and the deposition of eroded particles is negligible. The erosion rate at the gully bed is calculated directly from the equation of the balance between driving and resistance forces acting on soil particles in flowing water using the probability density functions of stochastic variables: flow velocity, soil aggregate size and cohesion. Probability density functions of cohesion in the model vary through time and space during the erosion event due to the changes in soil composition—armoring and loosening. This theory is still far from achieving practical application, but opens up a new way for better understanding the experimental results of gully erosion and shows the direction for future investigations. Full article
(This article belongs to the Special Issue Innovative Approaches for Modeling and Monitoring of Gully Erosion)
Show Figures

Figure 1

24 pages, 10044 KiB  
Article
Capitalization and Capital Return in Boreal Carbon Forestry
by Petri P. Kärenlampi
Earth 2022, 3(1), 204-227; https://doi.org/10.3390/earth3010014 - 7 Feb 2022
Cited by 1 | Viewed by 1900
Abstract
In this paper, an attempt is made to determine an intangible capitalization premium based on an expected further value increment of forest stands. Such premium cannot be determined through exponential interpolation. Firstly, any discount rate depending on maturity proposes clearcuttings soon after thinning [...] Read more.
In this paper, an attempt is made to determine an intangible capitalization premium based on an expected further value increment of forest stands. Such premium cannot be determined through exponential interpolation. Firstly, any discount rate depending on maturity proposes clearcuttings soon after thinning as a computational artifact. Secondly, exponential interpolation with a constant discount rate violates an internal consistency criterion as the rotation age increases. Omitting the intangible capitalization premium, the carbon stock of boreal forest can be increased in a variety of ways (albeit at the expense of a capital return rate deficiency). A small excess volume can be economically gained by increasing sapling density. Greater excess volume is best achieved by restricting thinnings. A large excess volume is best achieved by omitting thinnings. Regardless of the technique used, enhanced carbon storage requires financial compensation in terms of a carbon rent. With the present European emission prices, there is no financial difficulty in establishing such a carbon rent arrangement. Full article
Show Figures

Figure 1

32 pages, 3804 KiB  
Article
Air Quality in Lombardy, Italy: An Overview of the Environmental Monitoring System of ARPA Lombardia
by Paolo Maranzano
Earth 2022, 3(1), 172-203; https://doi.org/10.3390/earth3010013 - 7 Feb 2022
Cited by 16 | Viewed by 4521
Abstract
In this paper, we describe the structure and the features of the air quality and meteorological monitoring system adopted in the Lombardy region in Northern Italy. We are interested in describing which data the Regional Agency for Environmental Protection (ARPA Lombardia) must collect, [...] Read more.
In this paper, we describe the structure and the features of the air quality and meteorological monitoring system adopted in the Lombardy region in Northern Italy. We are interested in describing which data the Regional Agency for Environmental Protection (ARPA Lombardia) must collect, how this process takes place and how they are disseminated to the public for institutional communication and research purposes. ARPA monitors the atmospheric conditions through a dense ground monitoring network composed mainly by permanent stations, but also by mobile samplers. We describe in a detailed fashion the structure of the network: how many stations the network consists of, their locations, which pollutants and weather events are monitored and with what frequency. Our main objective is to present to an international audience the case study of ARPA Lombardia and the main available public data, explicitly stating the sources of information and how to find them, and encouraging international researchers to deal with the subject. In spite of the significant and extensive efforts made to counteract the phenomenon of air pollution, the air quality recorded in the region is very poor, and the local authorities are struggling to comply with international regulations on the concentration of pollutants in the air, making Lombardy a relevant international case. In addition, we present in a synthetic and descriptive way, without any modeling ambition, some data observed in the last years in Lombardy regarding meteorology and the main pollutants (oxides and particulate matters). The empirical descriptive results have been obtained by analyzing sample data provided by ARPA Lombardia through the same sources described in the sections dedicated to the Agency. From the graphical analysis, it is noticeable that at aggregate (regional) level, the concentrations are affected by significant decreasing trends, but at a rather contained speed. This is particularly true for the concentrations of oxides (NO2 and NOX) in urban and industrial areas. However, particulate matters and ozone show a high persistence in the average concentrations, interrupted only by the alternation of climatic seasons. The data also show that the meteorology of the region does not seem favorable for the improvement of air quality, as the region is characterized by low precipitation, and wind almost everywhere is not very intense. This situation could be induced by the unfavorable geography of the area, which prevents adequate air recycling and facilitates the stagnation of pollutants. We suggest that any public policy intervention aimed at improving the air quality situation in the region should take into account this empirical evidence in the impact assessment phase. Full article
Show Figures

Figure 1

15 pages, 1783 KiB  
Review
The Use of Weather Radar Data: Possibilities, Challenges and Advanced Applications
by Maria Silvia Binetti, Claudia Campanale, Carmine Massarelli and Vito Felice Uricchio
Earth 2022, 3(1), 157-171; https://doi.org/10.3390/earth3010012 - 3 Feb 2022
Cited by 8 | Viewed by 7020
Abstract
The climate in recent decades has aroused interest in the scientific community, prompting us to analyse the mechanisms that regulate it, to understand the climate change responsible for an increase in extreme phenomena. Consequently, the increase in hydrogeological instability in the Italian territory [...] Read more.
The climate in recent decades has aroused interest in the scientific community, prompting us to analyse the mechanisms that regulate it, to understand the climate change responsible for an increase in extreme phenomena. Consequently, the increase in hydrogeological instability in the Italian territory has led to an in-depth study of atmospheric parameters to understand the variations of the atmospheric system. One tool capable of detecting such variations is the weather radar. The weather radar data available in the area provided by the National Radar Network of the Department of Civil Protection allow the evaluation of variations on a national scale for hydro-meteorological-climatic monitoring as well as the disasters that have occurred. Using open-source programming software, the servers can be queried and data retrieved from a source to perform processing for specific purposes through data extraction techniques. Full article
Show Figures

Figure 1

21 pages, 3579 KiB  
Review
A Multi-Scale Blueprint for Building the Decision Context to Implement Climate Change Adaptation on National Wildlife Refuges in the United States
by Dawn Robin Magness, Ella Wagener, Emily Yurcich, Ryan Mollnow, Diane Granfors and Jennifer L. Wilkening
Earth 2022, 3(1), 136-156; https://doi.org/10.3390/earth3010011 - 3 Feb 2022
Cited by 5 | Viewed by 4026
Abstract
Climate change and ecological transformation are causing natural resource management to be applied to nonstationary systems. Managers can respond to dynamic ecosystems by resisting, accepting, or directing ecological change. Management response is constrained by a decision context, defined as an interconnected social system [...] Read more.
Climate change and ecological transformation are causing natural resource management to be applied to nonstationary systems. Managers can respond to dynamic ecosystems by resisting, accepting, or directing ecological change. Management response is constrained by a decision context, defined as an interconnected social system of values, rules, and knowledge that affects how problems can be addressed. We provide a multi-scale blueprint for creating a decision context that increases capacity for implementing climate adaptation, including novel approaches in the National Wildlife Refuge System, a continental conservation network administered by the U.S. Fish and Wildlife Service. We use the Tetlin National Wildlife Refuge in Alaska as case study to illustrate blueprint concepts and to provide “proof-of-concept” for application. The blueprint builds on ideas and practices from scenario planning, adaptive management, and adaptive pathway planning, which are approaches that promote action in the face of uncertainty. Management considerations focus on stewarding biodiversity in a changing climate by addressing what futures are possible, what interventions can be used to shape future conditions, and how to coordinate a regional conservation strategy. The blueprint focus on decision context promotes a longer-term social process of engagement that is complementary to, but larger than, any one decision process. Full article
(This article belongs to the Special Issue Climate System Uncertainty and Biodiversity Conservation)
Show Figures

Figure 1

9 pages, 717 KiB  
Review
Cyanobacterial Blooms: Current Knowledge and New Perspectives
by Cristiana Moreira, Vitor Vasconcelos and Agostinho Antunes
Earth 2022, 3(1), 127-135; https://doi.org/10.3390/earth3010010 - 3 Feb 2022
Cited by 14 | Viewed by 3413
Abstract
Cyanobacteria are ancient prokaryotes responsible for bloom formation in many freshwater resources worldwide. These dense agglomerations are a result of the rise of nutrient input (N and P) or temperature. The toxin content and illness associated with contact impair human health with repercussions [...] Read more.
Cyanobacteria are ancient prokaryotes responsible for bloom formation in many freshwater resources worldwide. These dense agglomerations are a result of the rise of nutrient input (N and P) or temperature. The toxin content and illness associated with contact impair human health with repercussions in water quality. Produced by a wide variety of cyanobacteria species, CyanoBlooms are in need of a literature review to achieve a global scenario of its current impacts on freshwater resources aiming at changing behaviors towards CyanoBlooms globally and by making communities more resilient to this recurrent problem. With a global distribution, recent data highlight the impacts of climate change on CyanoBlooms occurrence, namely through the rise of temperature and nutrient input from storms and heavy rainfall. With current worldwide regulations based on the enumeration of the nutrient input of freshwater ecosystems, the increase in field monitoring regarding CyanoBlooms occurrence is demanded since evaluation of this parameter may conceal these massive agglomerations resulting in human health episodes and cyanotoxin outbreaks. Full article
Show Figures

Figure 1

2 pages, 153 KiB  
Editorial
Acknowledgment to Reviewers of Earth in 2021
by Earth Editorial Office
Earth 2022, 3(1), 125-126; https://doi.org/10.3390/earth3010009 - 30 Jan 2022
Viewed by 1492
Abstract
Rigorous peer-reviews are the basis of high-quality academic publishing [...] Full article
10 pages, 557 KiB  
Communication
Monitoring and Evaluation: The Foundation for Lake and Reservoir Management
by Jeffrey A. Thornton, William R. Harding, Thomas M. Slawski and Hebin Lin
Earth 2022, 3(1), 115-124; https://doi.org/10.3390/earth3010008 - 27 Jan 2022
Cited by 3 | Viewed by 2395
Abstract
In this paper, we review the evolution of environmental monitoring, from its earliest days of exploration and increasing understanding of ecosystems and environment through the development of models and similar tools, to the current application of monitoring to assess project achievements. We note [...] Read more.
In this paper, we review the evolution of environmental monitoring, from its earliest days of exploration and increasing understanding of ecosystems and environment through the development of models and similar tools, to the current application of monitoring to assess project achievements. We note that information gathered through environmental monitoring is critical in evaluating the applicability of models and the accuracy of remotely-sensed information, and supporting the role of citizen science in the acquisition of environmental data. As monitoring increasingly is applied to project management, we identify the nexus between environmental and project management as needing to have purpose; observing that the purpose of monitoring evolves over time. This evolution is supported by the evaluation or assessment of the data—environmental and management related—over time, making monitoring and evaluation foundational for sound environmental management, restoration, protection, conservation, and understanding of ecosystem values. Full article
Show Figures

Figure 1

22 pages, 1143 KiB  
Review
Incorporating Climate Uncertainty into Conservation Planning for Wildlife Managers
by Jennifer L. Wilkening, Dawn Robin Magness, Anita Harrington, Kurt Johnson, Scott Covington and Jennie Ruth Hoffman
Earth 2022, 3(1), 93-114; https://doi.org/10.3390/earth3010007 - 17 Jan 2022
Cited by 3 | Viewed by 5170
Abstract
The U.S. Fish and Wildlife Service (USFWS) is one of the oldest conservation organizations in the United States and is the only federal agency solely charged with conserving fish, wildlife, plants and their habitats. The agency leads numerous conservation initiatives, such as protecting [...] Read more.
The U.S. Fish and Wildlife Service (USFWS) is one of the oldest conservation organizations in the United States and is the only federal agency solely charged with conserving fish, wildlife, plants and their habitats. The agency leads numerous conservation initiatives, such as protecting and recovering endangered species, managing almost 600 wildlife refuges throughout all states and territories, enforcing federal wildlife laws, and regulating international wildlife trade. In the past, these activities have not accounted for climate change. The accelerating biodiversity crisis, in combination with climate uncertainty, adds to the existing complexity associated with responding to multiple anthropogenic stressors. Here we describe current practice and thinking related to climate uncertainty and management of USFWS resources. We focus on three agency domains which represent various conservation planning responsibilities: evaluating species to be listed as threatened or endangered, Habitat Conservation Plans for listed species, and land management techniques on wildlife refuges. Integrating climate considerations into agency planning documents is complex and we highlight effective current applications and suggest future improvements. Additionally, we identify outstanding research needs or management applications, and updates to existing policy that will aid in developing improved conservation strategies. Our synthesis contributes to ongoing efforts to incorporate climate uncertainty into conservation planning, natural resource management, and related policy revisions. Full article
(This article belongs to the Special Issue Climate System Uncertainty and Biodiversity Conservation)
Show Figures

Figure 1

17 pages, 3420 KiB  
Article
Assessment of Differential Forest Growth Following Disturbance in Minnesota, USA
by David C. Wilson, Ram K. Deo and Jennifer Corcoran
Earth 2022, 3(1), 76-92; https://doi.org/10.3390/earth3010006 - 16 Jan 2022
Viewed by 2399
Abstract
We used LiDAR metrics and satellite imagery to examine regeneration on forested sites disturbed via harvest or natural means over a 44-year period. We tested the effectiveness of older low-density LiDAR elevation data in producing information related to existing levels of above ground [...] Read more.
We used LiDAR metrics and satellite imagery to examine regeneration on forested sites disturbed via harvest or natural means over a 44-year period. We tested the effectiveness of older low-density LiDAR elevation data in producing information related to existing levels of above ground biomass (AGB). To accomplish this, we paired the elevation data with a time series of wetness and greenness indices derived from Landsat satellite imagery to model changes in AGB for sites experiencing different agents of change. Current AGB was determined from high-density LiDAR acquired in northern Minnesota, USA. We then compared high-density LiDAR-based AGB and estimates modeled using Landsat and low-density LiDAR indices for 10,068 sites. Clear differences were found in standing AGB and accumulation rates between sites disturbed by different agents of change. Biomass accumulation following disturbance appears to decrease rapidly following an initial spike as stands 1asZX respond to newly opened growing space. Harvested sites experienced a roughly six-fold increase in the rate of biomass accumulation compared to sites subjected to stand replacing fire or insect and disease, and a 20% increase in productivity when compared to sites subjected to wind mediated canopy loss. Over time, this resulted in clear differences in standing AGB. Full article
Show Figures

Figure 1

4 pages, 1246 KiB  
Communication
Reusing Grey Water to Lower Temperatures in the Mediterranean Basin Cities
by Giuseppe Maggiotto
Earth 2022, 3(1), 72-75; https://doi.org/10.3390/earth3010005 - 10 Jan 2022
Cited by 1 | Viewed by 2145
Abstract
The Mediterranean region is a hot spot for climate change, and cities of this area will be exposed to both increasing temperatures and decreasing precipitations. Green Infrastructures (GIs) can lower urban temperatures through evapotranspiration with an adequate soil moisture content. Grey water reuse [...] Read more.
The Mediterranean region is a hot spot for climate change, and cities of this area will be exposed to both increasing temperatures and decreasing precipitations. Green Infrastructures (GIs) can lower urban temperatures through evapotranspiration with an adequate soil moisture content. Grey water reuse can both guarantee the right soil moisture content and reduce freshwater exploitation. In order to test the effectiveness of soil moisture on reducing air temperature, two modelling simulations ran with the microclimate CFD-based model ENVI-met 4.0. The chosen day was a registered heat wave (7 July 2019) in Lecce, a city of south Italy, which was selected as case study for the Mediterranean area. The results demonstrated the effectiveness of soil moisture on evapotranspiration in reducing air temperature. From a circular economy perspective, the supply of grey water for urban GIs represents a strategic adaptation strategy to the expected effects of climate change on the Mediterranean basin. Full article
Show Figures

Figure 1

27 pages, 2873 KiB  
Review
Does Climate Change Affect the Yield of the Top Three Cereals and Food Security in the World?
by Dhurba Neupane, Pramila Adhikari, Dwarika Bhattarai, Birendra Rana, Zeeshan Ahmed, Umanath Sharma and Debraj Adhikari
Earth 2022, 3(1), 45-71; https://doi.org/10.3390/earth3010004 - 7 Jan 2022
Cited by 39 | Viewed by 7249
Abstract
Climate prediction models suggest that agricultural productivity will be significantly affected in the future. The expected rise in average global temperature due to the higher release of greenhouse gases (GHGs) into the atmosphere and increased depletion of water resources with enhanced climate variability [...] Read more.
Climate prediction models suggest that agricultural productivity will be significantly affected in the future. The expected rise in average global temperature due to the higher release of greenhouse gases (GHGs) into the atmosphere and increased depletion of water resources with enhanced climate variability will be a serious threat to world food security. Moreover, there is an increase in the frequency and severity of long-lasting drought events over 1/3rd of the global landmass and five times increase in water demand deficits during the 21st century. The top three cereals, wheat (Triticum aestivum), maize (Zea mays), and rice (Oryza sativa), are the major and staple food crops of most people across the world. To meet the food demand of the ever-increasing population, which is expected to increase by over 9 billion by 2050, there is a dire need to increase cereal production by approximately 70%. However, we have observed a dramatic decrease in area of fertile and arable land to grow these crops. This trend is likely to increase in the future. Therefore, this review article provides an extensive review on recent and future projected area and production, the growth requirements and greenhouse gas emissions and global warming potential of the top three cereal crops, the effects of climate change on their yields, and the morphological, physiological, biochemical, and hormonal responses of plants to drought. We also discuss the potential strategies to tackle the effects of climate change and increase yields. These strategies include integrated conventional and modern molecular techniques and genomic approach, the implementation of agronomic best management (ABM) practices, and growing climate resilient cereal crops, such as millets. Millets are less resource-intensive crops and release a lower amount of greenhouse gases compared to other cereals. Therefore, millets can be the potential next-generation crops for research to explore the climate-resilient traits and use the information for the improvement of major cereals. Full article
Show Figures

Figure 1

14 pages, 3995 KiB  
Article
Building Performance Simulations and Architects against Climate Change and Energy Resource Scarcity
by Maria-Mar Fernandez-Antolin, José Manuel del Río and Roberto Alonso González-Lezcano
Earth 2022, 3(1), 31-44; https://doi.org/10.3390/earth3010003 - 6 Jan 2022
Cited by 2 | Viewed by 2374
Abstract
In Europe, 40% of the total energy is consumed by buildings; in this sense, building performance simulation tools (BPSTs) play a key role; however, the use of these tools by architects is deficient. Therefore, this study aims to detect the architects’ perception on [...] Read more.
In Europe, 40% of the total energy is consumed by buildings; in this sense, building performance simulation tools (BPSTs) play a key role; however, the use of these tools by architects is deficient. Therefore, this study aims to detect the architects’ perception on BPSTs. To this end, an online survey was conducted to determine the selection criteria of these BPSTs and non-users, to investigate the reasons for not using the tools. The outcomes showed that there was a wide gap between architects and the management of simulation programs in Spain, mainly due to the lack of training. BPSTs are described as a kind of intellect amplifiers, as they are perceived as powerful allies between professors and students of architecture and between architects and architectural design; therefore, through BPSTs, sustainability is taken very much into consideration to make buildings more energy efficient. Therefore, it is primarily concluded that further and higher education must undergo significant improvement to use simulations as part of the architectural design. Full article
Show Figures

Figure 1

13 pages, 1711 KiB  
Article
Dhaka Sitting on a Plastic Bomb: Issues and Concerns around Waste Governance, Water Quality, and Public Health
by Md Nadiruzzaman, Hosna Jahan Shewly and Afsana Afrin Esha
Earth 2022, 3(1), 18-30; https://doi.org/10.3390/earth3010002 - 6 Jan 2022
Cited by 8 | Viewed by 5609
Abstract
Plastic, an offer of modernity, has become one of the essential parts of our everyday life. However, it is presenting a massive threat in altered forms, to our health and environment. Plastic does not only pollute the surface environment, freshwater, and marine ecosystems, [...] Read more.
Plastic, an offer of modernity, has become one of the essential parts of our everyday life. However, it is presenting a massive threat in altered forms, to our health and environment. Plastic does not only pollute the surface environment, freshwater, and marine ecosystems, but toxic elements released from plastics also percolate down the surface and contaminate groundwater, which we often use as ‘safe’ drinking water. This probable future risk is deeply rooted in the entire governance infrastructure of plastic waste which could potentially lead to contamination of groundwater. Thus, a state-sponsored ‘safe drinking water’ initiative could contrarily produce a ‘risk society’. A recent study finds 81% of tap water samples collected worldwide contained plastic pollutants, which means that annually we may be ingesting between 3000 and 4000 microparticles of plastic from tap water. Based on review, ethnographic observations and interviews, and lived experience in a plastic-wrapped city (Dhaka), this paper sheds light on the complex interface of plastic, water, and public health, on the relevance of Beck’s ‘risk society’ to understand this complexity, and on replicating the idea of ‘risk society’ in the case of Bangladesh. Through understanding the plastic–groundwater–waste management nexus, this paper highlights and advocates for a new strategy of plastic governance in modern states. Full article
Show Figures

Figure 1

17 pages, 2125 KiB  
Review
Hydro-Meteorological Incident and Disaster Response in Sri Lanka. Case Study: 2016 May Rain Events
by Hiran I. Tillekaratne, Induka Werellagama, Chandrasekara M. Madduma-Bandara, Thalakumbure W. M. T. W. Bandara and Amila Abeynayaka
Earth 2022, 3(1), 1-17; https://doi.org/10.3390/earth3010001 - 24 Dec 2021
Cited by 2 | Viewed by 3193
Abstract
This paper investigates hydro-meteorological hazards faced by Sri Lanka, a lower-middle-income island country in Asia. It provides a case study of a major hydro-meteorological disaster incident that resulted in one of the largest landslides in the history of the country, the Post-Disaster Needs [...] Read more.
This paper investigates hydro-meteorological hazards faced by Sri Lanka, a lower-middle-income island country in Asia. It provides a case study of a major hydro-meteorological disaster incident that resulted in one of the largest landslides in the history of the country, the Post-Disaster Needs Assessment (PDNA) process, and the national disaster response. Rainfall and flood inundation data are provided for the whole country. The fact that data are held by several government agencies (namely Department of Meteorology, Department of Irrigation, and NBRO), somewhat coordinated by the Disaster Management Center (DMC) is shown. The need for more streamlined coordination of hydro-met data with online access of data for researchers is emphasized. The flood disaster situation and disaster declaration of the Western Province (which contributes nearly 40% of the GDP) is looked at, and evidence is presented to recommend a smaller governance unit for future disaster declarations, in order to bring aid to the places where it is needed and leaving other areas of the province to carry on with the normal economic activity. An example of the use of climate change scenarios in rainfall prediction is provided from a developed island nation (New Zealand). The need for Sri Lanka to increase its spending for hydro-met services (both infrastructure and skills) is highlighted (the global norm being 0.02 of GDP), as the return on such investment is tenfold. Full article
Show Figures

Figure 1

Previous Issue
Next Issue
Back to TopTop