
Arsenic in Groundwater Sources from Selected Communities Surrounding Taal Volcano, Philippines: An Exploratory Study


Abstract
:1. Introduction
2. Materials and Methods
2.1. Study Area
2.2. Profile of Sample Wells
2.3. Water Sampling Method
2.4. Statistical Analyses
3. Results and Discussion
3.1. Levels of As and Other Relevant Physico-Chemical Parameters
3.2. Exploratory Analyses
3.3. Limitations
4. Conclusions
Author Contributions
Funding
Institutional Review Board Statement
Informed Consent Statement
Data Availability Statement
Conflicts of Interest
References
- IARC Working Group on the Evaluation of Carcinogenic Risks to Humans. Arsenic and arsenic compounds. In Arsenic, Metals, Fibres and Dusts; International Agency for Research on Cancer: Lyon, France, 2012. [Google Scholar]
- Smedley, P.L.; Kinniburgh, D.G. Arsenic in groundwater and the environment. In Essentials of Medical Geology; Springer: Dordrecht, The Netherlands, 2013; pp. 279–310. [Google Scholar]
- Duker, A.A.; Carranza, E.; Hale, M. Arsenic geochemistry and health. Environ. Int. 2005, 31, 631–641. [Google Scholar] [CrossRef]
- Petrusevski, B.; Sharma, S.; Schippers, J.C.; Shordt, K. Arsenic in Drinking Water; IRC International Water and Sanitation Centre: Delft, The Netherlands, 2007; Volume 17, pp. 36–44. [Google Scholar]
- World Health Organization. Guidelines for Drinking-Water Quality; WHO: Geneva, Switzerland, 2006.
- López, D.L.; Bundschuh, J.; Birkle, P.; Armienta, M.A.; Cumbal, L.; Sracek, O.; Cornejo, L.; Ormachea, M. Arsenic in volcanic geothermal fluids of Latin America. Sci. Total Environ. 2012, 429, 57–75. [Google Scholar] [CrossRef] [PubMed]
- Hossain, M.F. Arsenic contamination in Bangladesh—An overview. Agric. Ecosyst. Environ. 2006, 113, 1–16. [Google Scholar] [CrossRef]
- Nordstrom, D.K. Worldwide occurrences of arsenic in ground water. Science 2002, 296, 2143–2145. [Google Scholar] [CrossRef]
- Khan, M.A.; Ho, Y. Arsenic in drinking water: A review on toxicological effects, mechanism of accumulation and remediation. Asian J. Chem. 2011, 23, 1889–1901. [Google Scholar]
- Kleinendorst, T.; Petrusevski, B.; Ramos, E.; Muijtjens, R. DRR Team Central Luzon Mission Report; DRR Team: Manila, Philippines, 2015; Available online: https://www.drrteam-dsswater.nl/wp-content/uploads/2015/06/DRR-Central-Luzon-mission-report-V5-final.pdf (accessed on 5 September 2021).
- Sy, S.M.T.; Salud-Gnilo, C.M.; Nogas-Perez, E.J. Speckled pigmentation and palmoplantar keratoses leading to the mass detection of chronic arsenic poisoning. Acta Med. Philipp. 2017, 51, 146–149. [Google Scholar] [CrossRef]
- Camaclang, M.L.A.; Cubillan, E.L.A.; Yap-Silva, C. Arsenicosis presenting with cutaneous squamous cell carcinoma: A case report. Acta Med. Philipp. 2019, 53, 171–176. [Google Scholar] [CrossRef]
- Ang-tangtatco, J.A.; Alabado, K.L.; Visitacion, L. Squamous cell carcinoma secondary to arsenic keratoses in a father and son. J. Philipp. Dermatol. Soc. 2017, 26, 69–73. [Google Scholar]
- Mester, T.; Szabó, G.; Sajtos, Z.; Baranyai, E.; Szabó, G.; Balla, D. Environmental Hazards of an Unrecultivated Liquid Waste Disposal Site on Soil and Groundwater. Water 2022, 14, 226. [Google Scholar] [CrossRef]
- Hughes, M.F.; Beck, B.D.; Chen, Y.; Lewis, A.S.; Thomas, D.J. Arsenic Exposure and Toxicology: A historical perspective. Toxicol. Sci. 2011, 123, 305–332. [Google Scholar] [CrossRef] [PubMed] [Green Version]
- Angelone, M.; Cremisini, C.; Piscopo, V.; Proposito, M.; Spaziani, F. Influence of hydrostratigraphy and structural setting on the arsenic occurrence in groundwater of the Cimino-Vico volcanic area (central Italy). Hydrogeol. J. 2009, 17, 901–914. [Google Scholar] [CrossRef]
- Aiuppa, A.; Avino, R.; Brusca, L.; Caliro, S.; Chiodini, G.; D’Alessandro, W.; Favara, R.; Federico CGinevra, W.; Inguaggiato, S.; Longo, M.; et al. Mineral control of arsenic content in thermal waters from volcano-hosted hydrothermal systems: Insights from island of Ischia and Phlegrean Fields (Campanian Volcanic Province, Italy). Chem. Geol. 2006, 229, 313–330. [Google Scholar] [CrossRef]
- Ghoreyshinia, S.K.; Shakeri, A.; Mehrabi, B.; Tassi, F.; Mehr, M.R.; Deshaee, A. Hydrogeochemistry, circulation path and arsenic distribution in Tahlab aquifer, East of Taftan Volcano, SE Iran. Appl. Geochem. 2020, 119, 104629. [Google Scholar] [CrossRef]
- Banning, A.; Cardona, A.; Rüde, T.R. Uranium and arsenic dynamics in volcano-sedimentary basins–An exemplary study in North-Central Mexico. Appl. Geochem. 2012, 27, 2160–2172. [Google Scholar] [CrossRef]
- Jing, F.; Chauhan, A.; PSingh, R.; Dash, P. Changes in atmospheric, meteorological, and ocean parameters associated with the 12 January 2020 Taal volcanic eruption. Remote Sens. 2020, 12, 1026. [Google Scholar] [CrossRef] [Green Version]
- Philippine Statistics Authority. 2021 Calabarzon Regional Social and Economic Trends. Available online: http://rsso04a.psa.gov.ph/sites/default/files/2021%20Regional%20Social%20and%20Economic%20Trends%20CALABARZON.pdf (accessed on 2 January 2022).
- Hernández, P.A.; Melián, G.V.; Somoza, L.; Arpa, M.C.; Pérez, N.M.; Bariso, E.; Sumino, H.; Padron, E.; Varekamp, J.C.; Albert-Beltran, J.; et al. The acid crater lake of Taal Volcano, Philippines: Hydrogeochemical and hydroacoustic data related to the 2010–11 volcanic unrest. Geol. Soc. Lond. Spec. Publ. 2017, 437, 131–152. [Google Scholar] [CrossRef] [Green Version]
- Yamaya, Y.; Alanis PK, B.; Takeuchi, A.; Cordon, J.M.; Mogi, T.; Hashimoto, T.; Sasai, Y.; Nagao, T. A large hydrothermal reservoir beneath Taal Volcano (Philippines) revealed by magnetotelluric resistivity survey: 2D resistivity modeling. Bull. Volcanol. 2013, 75, 1–13. [Google Scholar] [CrossRef]
- Alanis, P.K.; Yamaya, Y.; Takeuchi, A.; Sasai, Y.; Okada, Y.; Nagao, T. A large hydrothermal reservoir beneath Taal Volcano (Philippines) revealed by magnetotelluric observations and its implications to the volcanic activity. Proc. Jpn. Acad. Ser. B 2013, 89, 383–389. [Google Scholar] [CrossRef] [Green Version]
- Cardenas, M.B.; Lagmay, A.A.; Andrews, B.; Rodolfo, R.S.; Cabria, H.B.; Zamora, P.B.; Lapus, M.R. Intense groundwater circulation and heat flow near a volcanic lake: Taal Volcano, Philippines. In AGU Fall Meeting Abstracts; American Geophysical Union: Washington, DC, USA, 2011; Volume 2011, p. H31G-1262. [Google Scholar]
- Delmelle, P.; Kusakabe, M.; Bernard, A.; Fischer, T.; De Brouwer, S.; Del Mundo, E. Geochemical and isotopic evidence for seawater contamination of the hydrothermal system of Taal Volcano, Luzon, the Philippines. Bull. Volcanol. 1998, 59, 562–576. [Google Scholar] [CrossRef]
- Canlas, Alen Clyde A. “MGB IV Conducts Groundwater Resource Assessment and Mapping in Cuenca, Tanauan, and Lipa, Batangas”. DENR: Mines and Geosciences Bureau. Available online: https://region4a.mgb.gov.ph/7295-2/ (accessed on 26 February 2022).
- Sopsop, G.O.; Abucay, E.R.; Silvestre, P.R.; Custodio, H.M.; Manikham, D.T. Spatio-temporal pattern of landscape change due to urbanization: A case of Batangas City. J. Nat. Stud. 2016, 15, 11–22. [Google Scholar]
- Tabios, G.; David, C. Competing uses of water: Cases of Angat reservoir, Laguna Lake and groundwater systems of Batangas City and Cebu City. Win. Water War 2004, 105–131. [Google Scholar]
- Agence France-Presse. Phivolcs: Prohibit Entry into 7-Km Taal Danger Zone Despite Decreased Volcanic Activity. PhilStar Global. Available online: https://www.philstar.com/headlines/2020/01/27/1988195/phivolcs-prohibit-entry-7-km-taal-danger-zone-despite-decreased-volcanic-activity (accessed on 24 February 2022).
- Gabriel Pabico Lalu. Evacuations Underway in Batangas Towns Near Taal Volcano. Inquirer.Net. Available online: https://newsinfo.inquirer.net/1454348/evacuations-underway-in-batangas-towns-near-taal-volcano (accessed on 7 February 2022).
- OCHA Philippines. Reference Map: Taal Vocano Danger Zones. Available online: https://reliefweb.int/sites/reliefweb.int/files/resources/map_280.pdf (accessed on 24 February 2022).
- OCHA Services. DSWD DROMIC Report #31 on the Taal Volcano Eruption as of 29 January 2020, 6PM. ReliefWeb.int. Available online: https://reliefweb.int/report/philippines/dswd-dromic-report-31-taal-volcano-eruption-29-january-2020-6pm (accessed on 24 February 2022).
- Goulden, P.D.; Brooksbank, P. Automated atomic absorption determination of arsenic, antimony, and selenium in natural waters. Anal. Chem. 1974, 46, 1431–1436. [Google Scholar] [CrossRef] [PubMed]
- DENR Administrative Order No. 2016-08, p.7, 2016 § 6.1. 2016. Available online: https://pab.emb.gov.ph/wp-content/uploads/2017/07/DAO-2016-08-WQG-and-GES.pdf (accessed on 31 January 2022).
- Mudzielwana, R.; Gitari, M.W.; Ndungu, P. Uptake of as (V) from Groundwater Using Fe-Mn Oxides Modified Kaolin Clay: Physicochemical Characterization and Absorption Data Modeling. Water 2019, 11, 1245. [Google Scholar] [CrossRef] [Green Version]
- Soria, J.L.; Siringan, F.; Rodolfo, K.S. Compaction rates and paleo-sea levels along the delta complex north of Manila Bay, Luzon Island, Philippines. Sci. Diliman 2005, 17, 39–45. [Google Scholar]
- Smith, R.; Knight, R.; Fendorf, S. Overpumping leads to California groundwater arsenic threat. Nat. Commun. 2018, 9, 2089. [Google Scholar] [CrossRef] [PubMed] [Green Version]
- IFRC. Philippines: Taal Volcano Eruption—Final Report (n° MDRPH043). ReliefWeb.Int. Available online: https://reliefweb.int/report/philippines/philippines-taal-volcano-eruption-final-report-n-mdrph043 (accessed on 24 February 2022).
- PHIVOLCS. (n.d.). Earthquake Information. Department of Science and Technology: PHIVOLCS. Available online: https://www.phivolcs.dost.gov.ph/index.php/earthquake/earthquake-information3 (accessed on 24 February 2022).
- Aiuppa, A.; D’Alessandro, W.; Federico, C.; Palumbo, B.; Valenza, M. The aquatic geochemistry of arsenic in volcanic groundwaters from southern Italy. Appl. Geochem. 2003, 18, 1283–1296. [Google Scholar] [CrossRef]
- Saunders, J.A.; Lee, M.K.; Uddin, A.; Mohammad, S.; Wilkin, R.T.; Fayek, M.; Korte, N.E. Natural arsenic contamination of Holocene alluvial aquifers by linked tectonic, weathering, and microbial processes. Geochem. Geophys. Geosystems 2005, 6. [Google Scholar] [CrossRef]
- Gomez-Gonzalez, M.A.; Villalobos, M.; Marco, J.F.; Garcia-Guinea, J.; Bolea, E.; Laborda, F.; Garrido, F. Iron oxide-clay composite vectors on long-distance transport of arsenic and toxic metals in mining-affected areas. Chemosphere 2018, 197, 759–767. [Google Scholar] [CrossRef] [PubMed] [Green Version]
- Jung, M.C.; Thornton, I.; Chon, H.T. Arsenic, Sb and Bi contamination of soils, plants, waters and sediments in the vicinity of the Dalsung Cu–W mine in Korea. Sci. Total Environ. 2002, 295, 81–89. [Google Scholar] [CrossRef]
- Hajalilou, B.; Mosaferi, M.; Khaleghi, F.; Jadidi, S.; Vosugh, B.; Fatehifar, E. Effects of abandoned arsenic mine on water resources pollution in north west of Iran. Health Promot. Perspect. 2011, 1, 62. [Google Scholar]
- Fujii, R.; Swain, W.C. Areal Distribution of Selected Trace Elements, Salinity, and Major Ions in Shallow Groundwater, Tulare Basin, Southern San Joaquin Valley, California; USGS Water-Resources Investigation, (Report No. 95-4048); USGS: Washington, DC, USA, 1995.
- Wang, L.; Huang, J. Chronic arsenism from drinking water in some areas of Xinjiang, China. In Arsenic in the Environment, Part II: Human Health and Ecosystem Effects; Nriagu, J.O., Ed.; John Wiley: New York, NY, USA, 1994; pp. 159–172. [Google Scholar]
- Hassan, M.M.; Atkins, P.J.; Dunn, C.E. Patterns of Groundwater Arsenic Concentrations: What Level of Arsenic Exists in Different Aquifers? Orient. Geogr. 2006, 50, 1–17. [Google Scholar]
- Haugen, E.A.; Jurgens, B.C.; Arroyo-Lopez, J.A.; Bennett, G.L. Groundwater development leads to decreasing arsenic concentrations in the San Joaquin Valley, California. Sci. Total Environ. 2021, 771, e145223. [Google Scholar] [CrossRef] [PubMed]


| Code | Location of Sampled Well * | Dist. from Mt. Taal (In km) | Est. Elevation (In m) | Type of Source | Used for Drinking? | 2020 As Levels (In ppb) ** | 2021 As Levels (In ppb) ** |
|---|---|---|---|---|---|---|---|
| A | Banyaga, Agoncillo | 5 | 38.4 | Waterworks | Yes | 4.7 | 1.2 |
| B | Bilibinwang Agoncillo | 5 | 60.7 | Deep well | Yes | 1.2 | 0.27 |
| C | Buso-buso, Laurel | 6 | 113.3 | Shallow well | No | 14 | 8.4 |
| D | Bugaan East, Laurel | 7 | 11.5 | Shallow well | No | 11 | 2.6 |
| E | San Sebastian, Balete | 7 | 23.9 | Deep well | No | 77 | 20 |
| F | San Sebastian, Balete | 8 | 23.9 | Waterworks | Yes | 20 | 46 |
| G | Looc, Balete | 10 | 34.9 | Waterworks | Yes | 27 | 16 |
| H | Sampaloc, Talisay | 10 | 38.5 | Prot. spring | No | 3.2 | 2.2 |
| I | Abelo, San Nicolas | 10 | 21.3 | Waterworks | Yes | 39 | 28 |
| J | Poblacion, San Nicolas | 10 | 17.9 | Deep well | No | 27 | 28 |
| K | Abelo, San Nicolas | 10 | 21.3 | Deep well | No | 44 | 33 |
| L | Balukbaluk, Sn Nicolas | 10 | 23.5 | Waterworks | Yes | 21 | 20 |
| M | Balete, San Nicolas | 11 | 23.8 | Waterworks | Yes | 16 | 13 |
| N | Kinalaglagan, MnK | 10 | 53.2 | Shallow well | No | 16 | 13 |
| O | Lumang Lipa, MnK | 11 | 160 | Deep well | Yes | 13 | 10 |
| P | Poblacion W, Alitagtag | 14 | 178.8 | Deep well | No | 16 | 11 |
| Q | Burol, Sta. Teresita | 13 | 84 | Waterworks | Yes | 21 | 15 |
| R | Cahilan, Lemery | 14 | 36.9 | Deep well | Yes | 12 | 12 |
| S | Sinisian, Lemery | 18 | 16.7 | Deep well | No | 12 | 16 |
| T | Butong, Taal | 18 | 10.6 | Deep well | Yes | 12 | 12 |
| U | Butong, Taal | 18 | 10.6 | Deep well | No | 43 | 44 |
| V | Bolbok, Taal | 27 | 122.5 | Waterworks | Yes | 14 | 11 |
| W | Ambulong, Tanauan | 12 | 8.6 | Deep well | No | 28 | 14 |
| X | Sulpoc, Tanauan | 16 | 267 | Deep well | Yes | 18 | 11 |
| Y | Pagaspas, Tanauan | 19 | 140.4 | Deep well | Yes | 15 | 15 |
| Z | Balete, Tanuan | 12 | 137.1 | Deep well | No | 10 | 6.6 |
| 2020 | 2021 | |
|---|---|---|
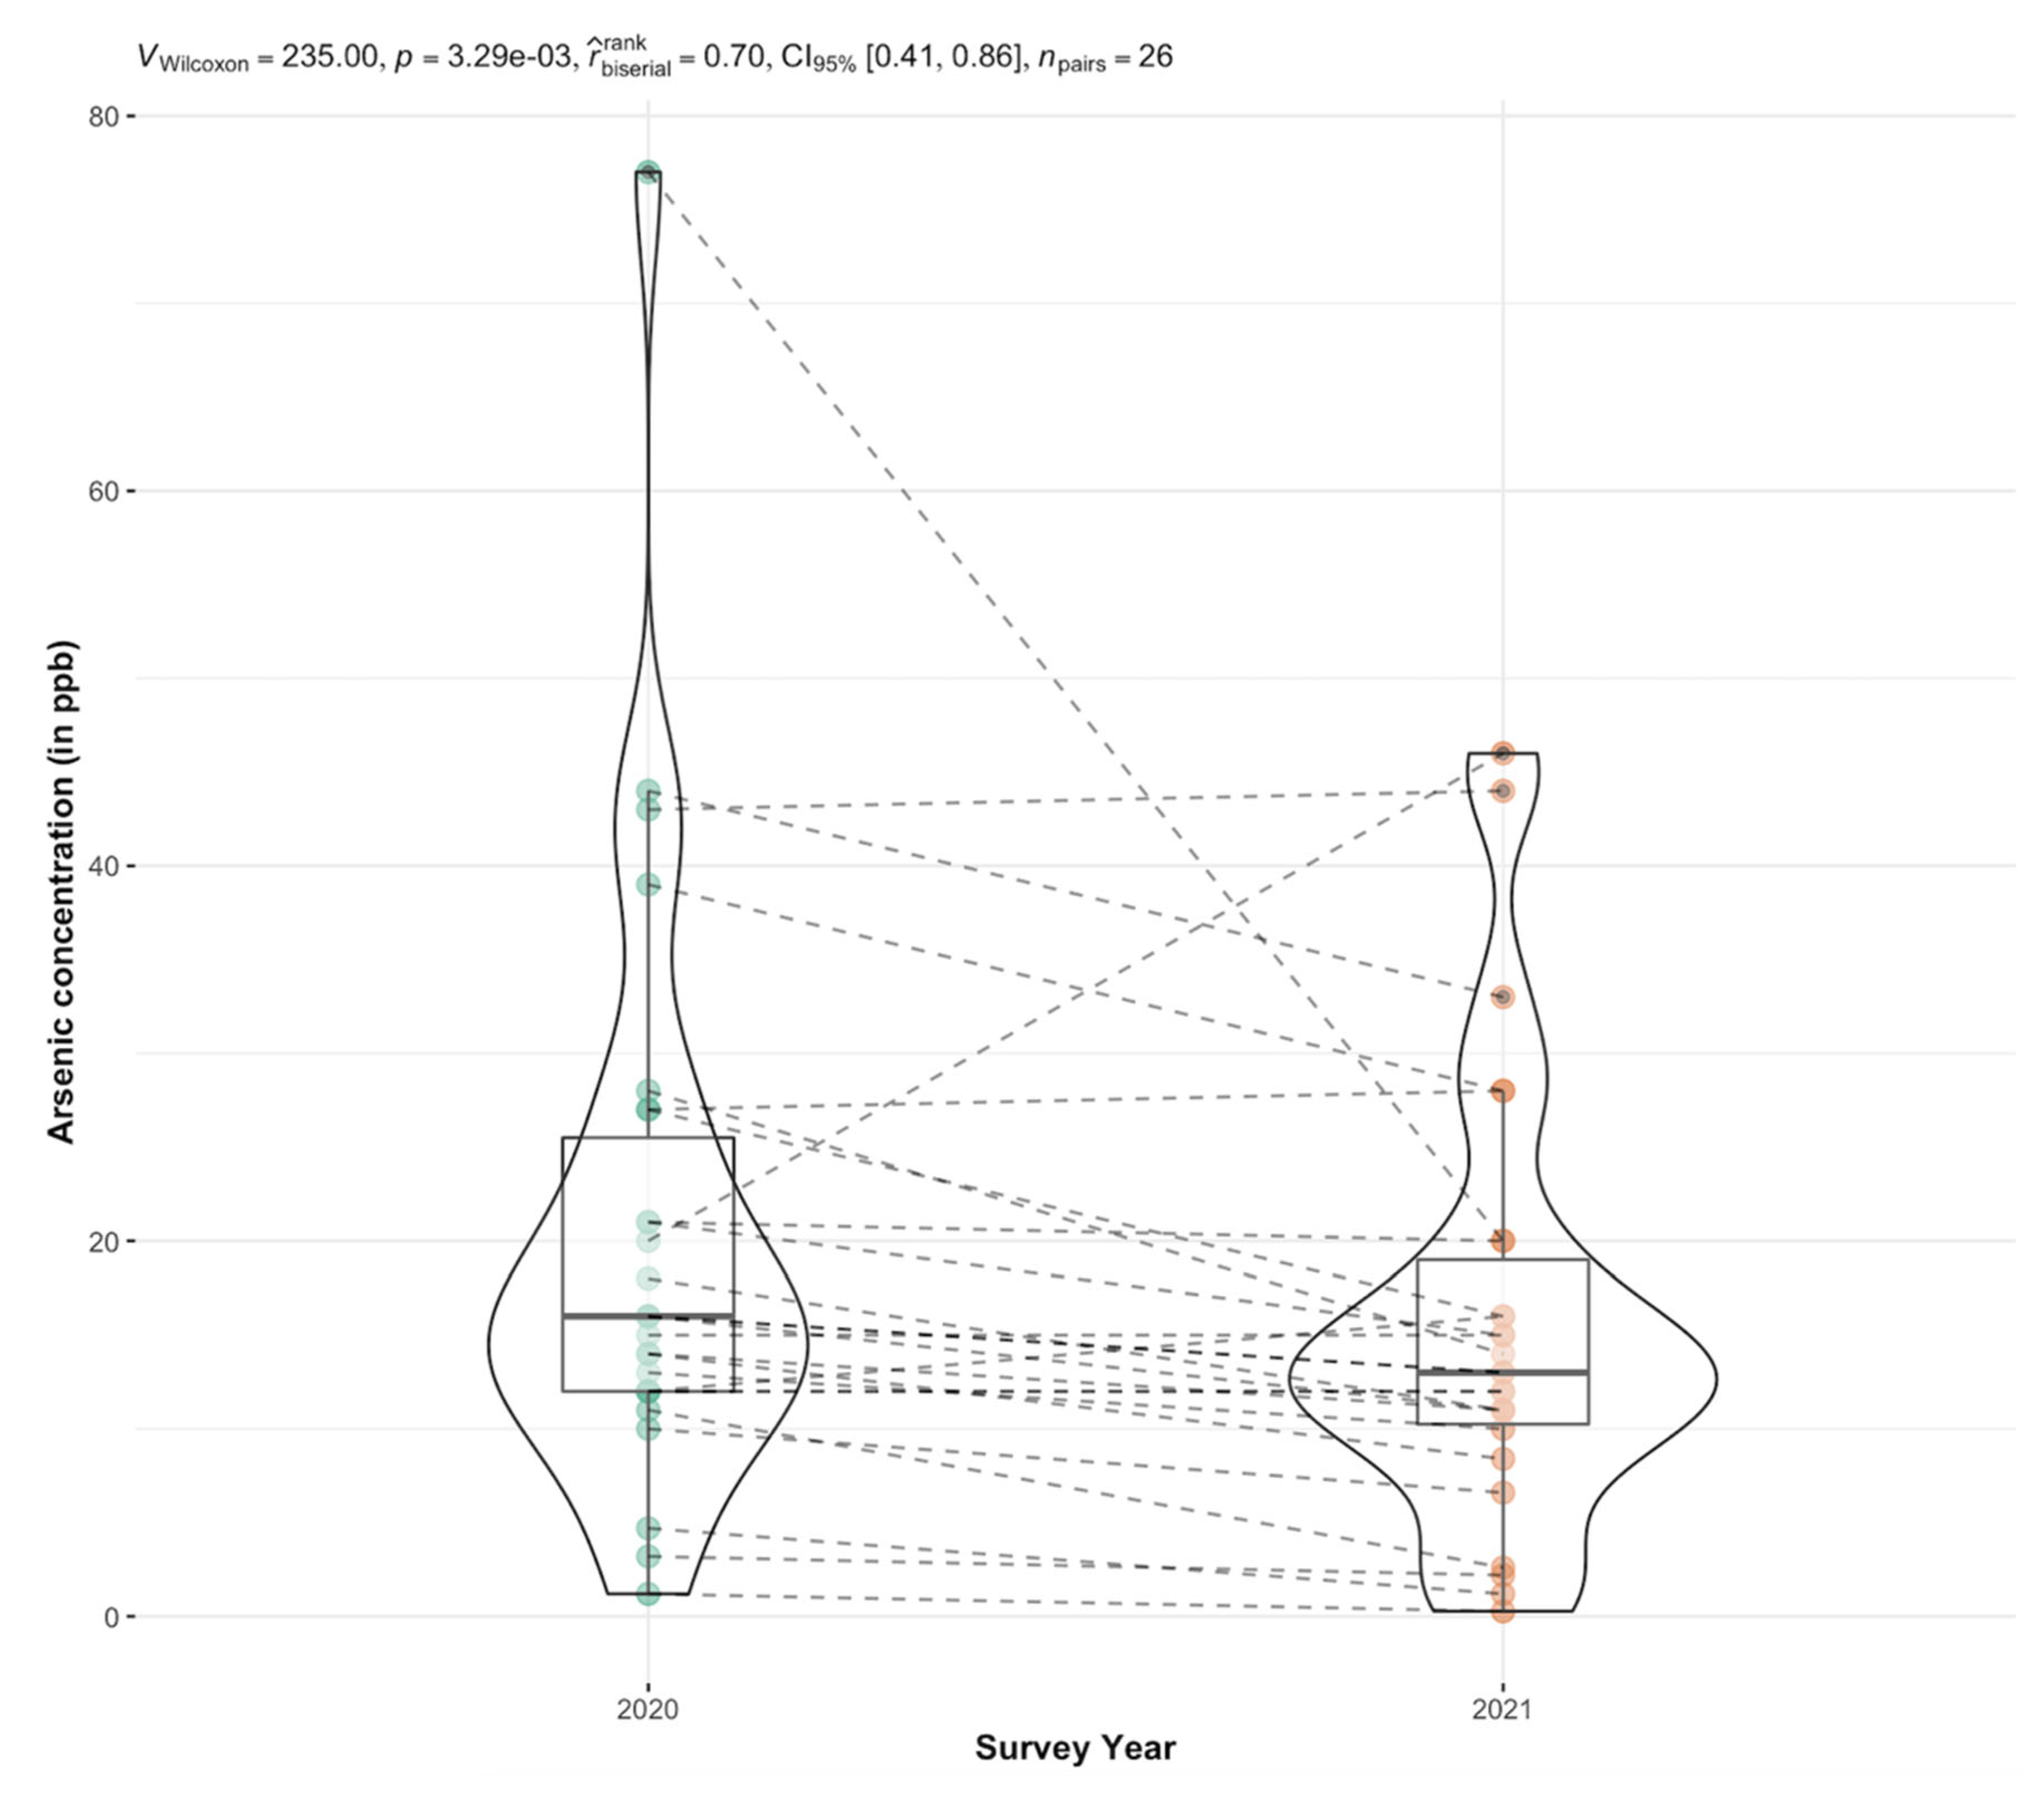
| Median | 16 | 13 |
| Interquartile range (IQR) | 13.5 | 9.75 |
| One-sample Wilcoxon signed rank test | p < 0.001 * | p = 0.013 * |
| Paired, two-sample Wilcoxon signed rank test | p = 0.003 * | |
| Sampling Year | Adjusted Covariates | Estimate * (95% CI) | p-Value |
|---|---|---|---|
| 2020 | distance | 1.020 (0.959, 1.085) | 0.537 |
| elevation | 0.998 (0.993, 1.003) | 0.500 | |
| 2021 | distance | 1.066 (0.984, 1.154) | 0.128 |
| elevation | 0.998 (0.991, 1.004) | 0.584 |
Publisher’s Note: MDPI stays neutral with regard to jurisdictional claims in published maps and institutional affiliations. |
© 2022 by the authors. Licensee MDPI, Basel, Switzerland. This article is an open access article distributed under the terms and conditions of the Creative Commons Attribution (CC BY) license (https://creativecommons.org/licenses/by/4.0/).
Share and Cite
Apostol, G.L.C.; Valenzuela, S.; Seposo, X. Arsenic in Groundwater Sources from Selected Communities Surrounding Taal Volcano, Philippines: An Exploratory Study. Earth 2022, 3, 448-459. https://doi.org/10.3390/earth3010027
Apostol GLC, Valenzuela S, Seposo X. Arsenic in Groundwater Sources from Selected Communities Surrounding Taal Volcano, Philippines: An Exploratory Study. Earth. 2022; 3(1):448-459. https://doi.org/10.3390/earth3010027
Chicago/Turabian StyleApostol, Geminn Louis C., Sary Valenzuela, and Xerxes Seposo. 2022. "Arsenic in Groundwater Sources from Selected Communities Surrounding Taal Volcano, Philippines: An Exploratory Study" Earth 3, no. 1: 448-459. https://doi.org/10.3390/earth3010027
APA StyleApostol, G. L. C., Valenzuela, S., & Seposo, X. (2022). Arsenic in Groundwater Sources from Selected Communities Surrounding Taal Volcano, Philippines: An Exploratory Study. Earth, 3(1), 448-459. https://doi.org/10.3390/earth3010027