Article

A Multi-Data Geospatial Approach for Understanding Flood Risk in the Coastal Plains of Tamil Nadu, India

1
Department of Geography, Central University of Tamil Nadu, Thiruvarur 610005, India
2
Faculty of Science and Technology, University of Central Lancashire, Preston PR1 2HE, UK
3
Department of Social Work, School of Social Sciences and Humanities and Centre for Happiness, Central University of Tamil Nadu, Thiruvarur 610005, India
4
Centre for Architecture and Built Environment Research, University of the West of England, Bristol BS16 1QY, UK
*
Authors to whom correspondence should be addressed.
Earth 2022, 3(1), 383-400; https://doi.org/10.3390/earth3010023
Submission received: 24 January 2022 / Revised: 21 February 2022 / Accepted: 24 February 2022 / Published: 1 March 2022

Abstract

:
The coastal plains of Tamil Nadu, India, are prone to floods, the most common disaster experienced in this region almost every year. This research aims to identify flood risks in the coastal plain region of Tamil Nadu, delineated through a watershed approach with 5020 micro-administrative units covering an area of about 26,000 sq. km. A comprehensive flood risk assessment covering hazard, vulnerability, and exposure parameters was carried out using multiple datasets derived from field surveys, satellite data, and secondary data sources. The flood hazard layer was prepared on a probability scale (0–1) with the help of Sentinel-1 Synthetic Aperture Radar data coupled with GIS-based water rise modelling using Shuttle Radar Topography Mission Digital Elevation Model (SRTM-DEM) and reports of the District Disaster Management Plans of 13 coastal districts. In addition, the National Resources Conservation Service-Curve Number (NRCS-CN) method was adopted to estimate surface runoff potential for identifying low probability flood-prone regions. The vulnerability and exposure of the population to flood hazards were determined using census and household data-based indicators. The different categories of built-up areas were delineated and intersected with the flood hazard layer to estimate elements at flood risk. An exhaustive field survey was conducted at 514 locations of the study area, targeting deprived communities of all major settlements to validate the flood hazard layer and understand the public perceptions. The amalgamation of results shows that very high flood risk prevails in the northern parts of coastal Tamil Nadu, especially the stretch between Chennai and Cuddalore. In addition, to provide baseline datasets for the first time at micro-administrative units for the entire coastal plains of Tamil Nadu, the study offers a pragmatic methodology for determining location-specific flood risks for policy interventions.

1. Introduction

Coastal areas are prone to extreme weather events and associated floods. Flooding is one of the most common natural disasters, affecting lives and the environment considerably in coastal areas [1]. Since different geomorphological systems interact in coastal areas, the management of floods is highly complex and challenging [2,3]. In addition, it has been estimated that about 23 percent of the world’s population lives within both 100 km distance and 100 m altitude of the coastline [4]. Thus, the number of exposed elements in coastal regions is high, and they are highly susceptible to flood hazards [5]. According to the Centre for Research on the Epidemiology of Disasters (CRED) database, flood is the most common natural disaster. Its annual global number of events, deaths and economic losses is very high. Statistically, India ranked top in the total number of flood events and placed in the third position, after China and the United States of America, for losses due to flood disaster during 1990–2020, suffering an estimated economic loss of about USD 84.8 billion (https://public.emdat.be/data, accessed on 26 May 2021).
On average, four major flood events occur annually in India, with a human loss of about 250 persons per event. Due to their topographic situation, India’s eastern coastal regions are preferred for human habitation and economic activities, but these are also highly prone to seasonal floods [6]. The coastal regions of Tamil Nadu and Puducherry are flat, with many rivers and wetlands that receive copious rain during the northeast monsoon’s short period, which leads to flooding of dense human habitations [7]. Many studies have been undertaken for flood risk assessment in this region. However, most studies have been based on the physical modelling of notable flood events, without fuller consideration of exposure and vulnerability parameters. Furthermore, the choice of micro-administrative units for flood risk assessment in the coastal parts of Tamil Nadu is scarce, but should be considered, as they are essential for policy interventions. Although global and regional flood risk assessments are based on hydrological models for floods [8], the scope of downscaling the results at micro-administrative units is not yet achievable. Thus, identifying flood hazard using multiple datasets and synthesising hazard layers with the exposure elements at micro-administrative units is vital for the effective mitigation and management of flood risks in coastal Tamil Nadu.
The availability of microwave earth observation data and Geographical Information Systems (GIS)-based modelling approaches now offers a better environment for flood hazard mapping and, eventually, mitigation and management of flood-prone areas [9]. The public availability of Sentinel-1 microwave images for extracting flood inundation has made it possible to harness satellite technology for detailed flood hazard mapping [10]. Unlike optical satellite datasets, microwave signals can penetrate clouds and provide valuable datasets to identify flood inundation at various levels/scales and applications [11,12,13,14]. Due to its cloud penetration capability during the rainy seasons, it can also be used to understand the probability and magnitude of flooding (depth, velocity, and intensity) by combining it with multi-temporal datasets, digital elevation models (DEM), and other collateral datasets [15,16,17].
Rainfall and surface runoff are critical factors of hydrological modelling. Therefore, understanding the runoff coefficient using empirical equations would greatly assist flood hazard mapping and understanding the areas of flood risks [18]. The National Resources Conservation Service–Curve Number (NRCS-CN) is widely used to evaluate floodwater retarding projects due to its simplicity, predictability, stability, and applicability for ungauged watersheds [19]. Comparing surface runoff potential and vulnerabilities of the population would form a sound basis for characterising the flood-prone regions [20]. Vulnerability is an essential component of flood risk analysis, and, as such, it has to be thoroughly investigated [21]. Although satellite and runoff-based assessments are necessary for accurate delineation of flood-prone regions, the integration of vulnerability of the exposed population and humanitarian approach is essential for flood management [22]. A vulnerability has multiple dimensions (physical, psychological, social, economic, and environmental) and increases the susceptibility of the exposed elements to the impact of flood hazards [23,24]. Due to its complex nature, an accurate vulnerability assessment is always a challenging task and can be indirectly assessed through census-based or sample-based indicators. As household survey reports offer reliable datasets, they can be used to generate vulnerability indicators. In addition, field surveys and interactions with the exposed population are also to be conducted for sensible results. Field surveys can better estimate the direct impacts and economic loss caused by floods and can be compared with the vulnerability indicators [25,26]. By synthesising all these facts, we undertook a comprehensive systematic analysis of flood risks in the coastal plains of Tamil Nadu to generate first-hand baseline datasets and to demonstrate the integrative methods for flood risk assessment which would help in all phases of flood disaster management and long-term planning strategies.

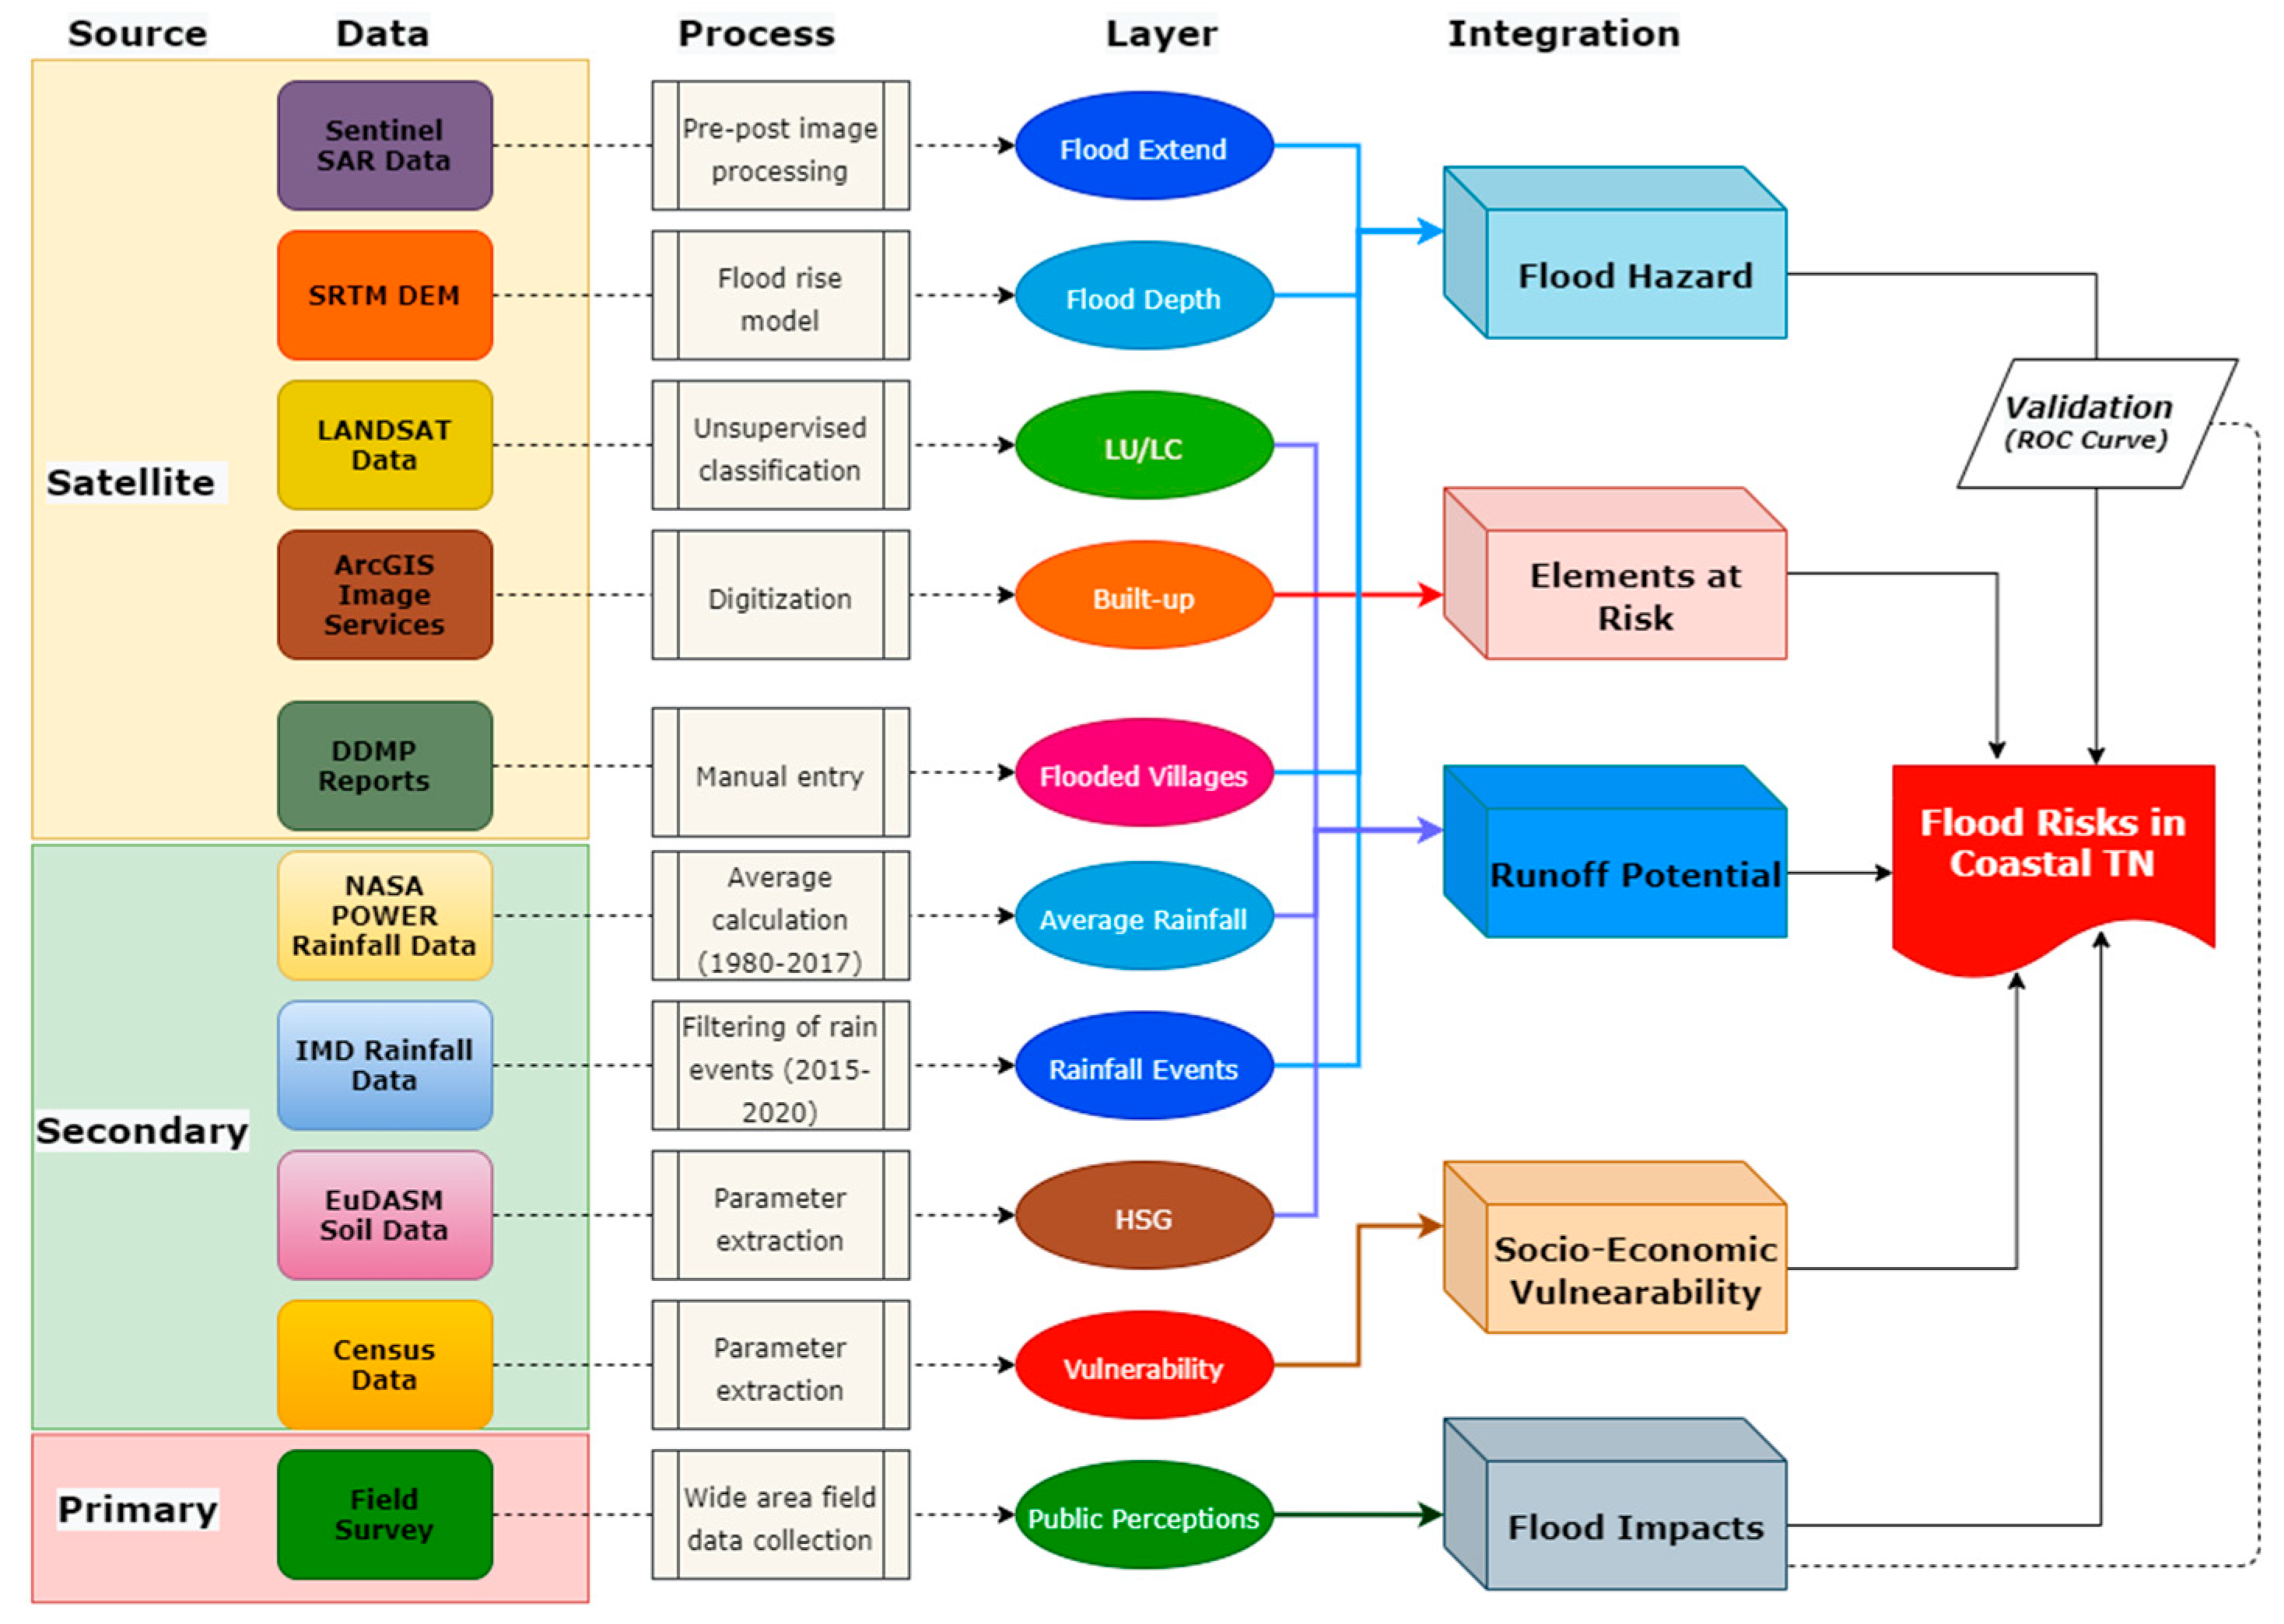
2. Materials and Methods
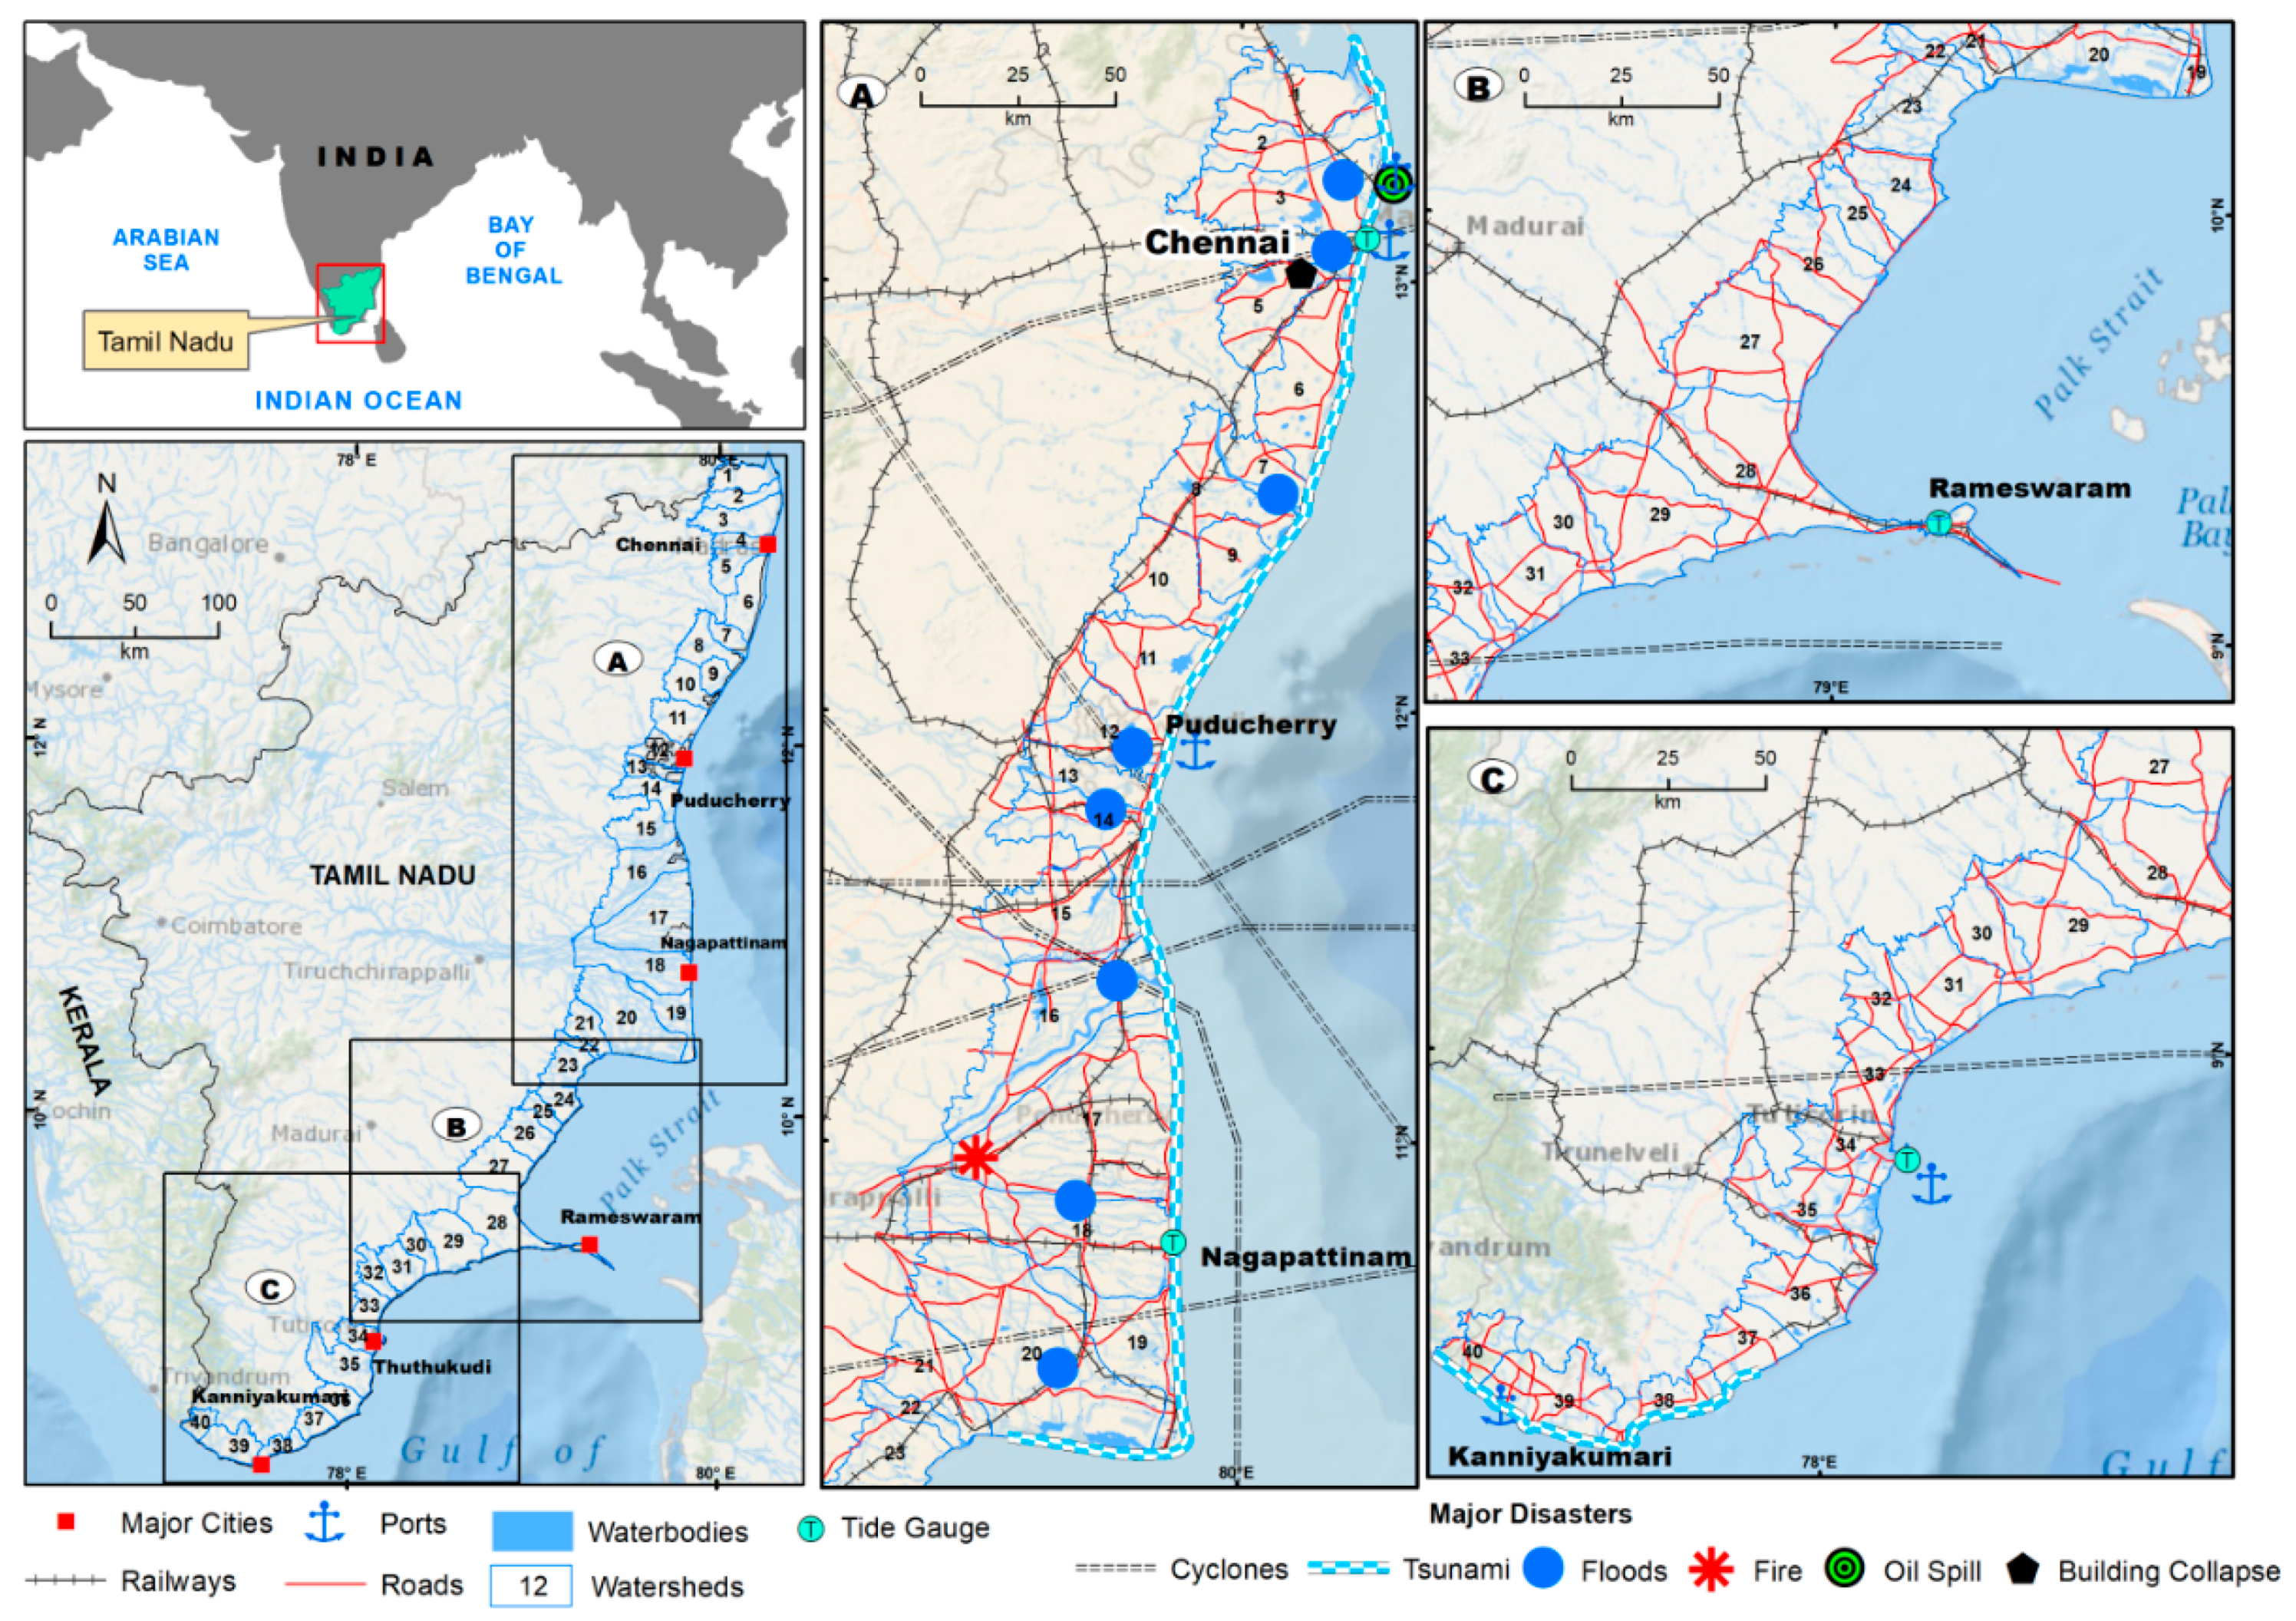
2.1. Study Area

Tamil Nadu is the southernmost state of India, having a coastline 1076 km long that stretches along the Bay of Bengal, the Arabian Sea and the Indian Ocean; it constitutes about 15% of the total coastal length of India. For the present study, we used the micro-watershed boundaries for demarcating the coastal plain regions of Tamil Nadu. All the coastal watersheds were considered to delineate coastal plains; the larger coastal watersheds were trimmed with 40 m contours above mean sea level [27]. The delineated study area extends between the latitude 8°4′39.183″ N and 13°32′56.875″ N, and longitude of 77°6′8.831″ E and 80°20′54.37″ E, covering an area of about 26,000 sq. km. The study area includes 5020 villages/wards (micro-administrative units of India) from 75 taluks of 13 districts in Tamil Nadu state and Union Territory of Puducherry (Figure 1). The coastline that extends from Thiruvallur to Kanyakumari districts is highly vulnerable to frequent tropical cyclones, floods, and storm surge events. The slope of the study area is very gentle to flat and covered by dominant sediments of the Quaternary-Recent age. The riverine landforms of the major rivers are prominent with fine clay to loam soils. The average annual temperature and rainfall are 27 °C and 990 mm, respectively. The coastal region is mainly dependent on monsoon rains from October to December, and during this period, seasonal and cloudburst floods are common. The study area contains one-third of the state population, with an average population density of 2000 persons/sq. km. Most of the people living in this region are economically deprived and socially marginalised. About 52 percent of the coastal plains of Tamil Nadu are used for agriculture, particularly for paddy cultivation. The physical and socio-economic setting of the study area makes it most vulnerable to seasonal flooding of cloudburst, monsoonal, and cyclonic causes. In recent decades, the coastal plains of Tamil Nadu have witnessed widespread inundation and floods; for example, the floods in the years 2005 and 2015 were devastating.

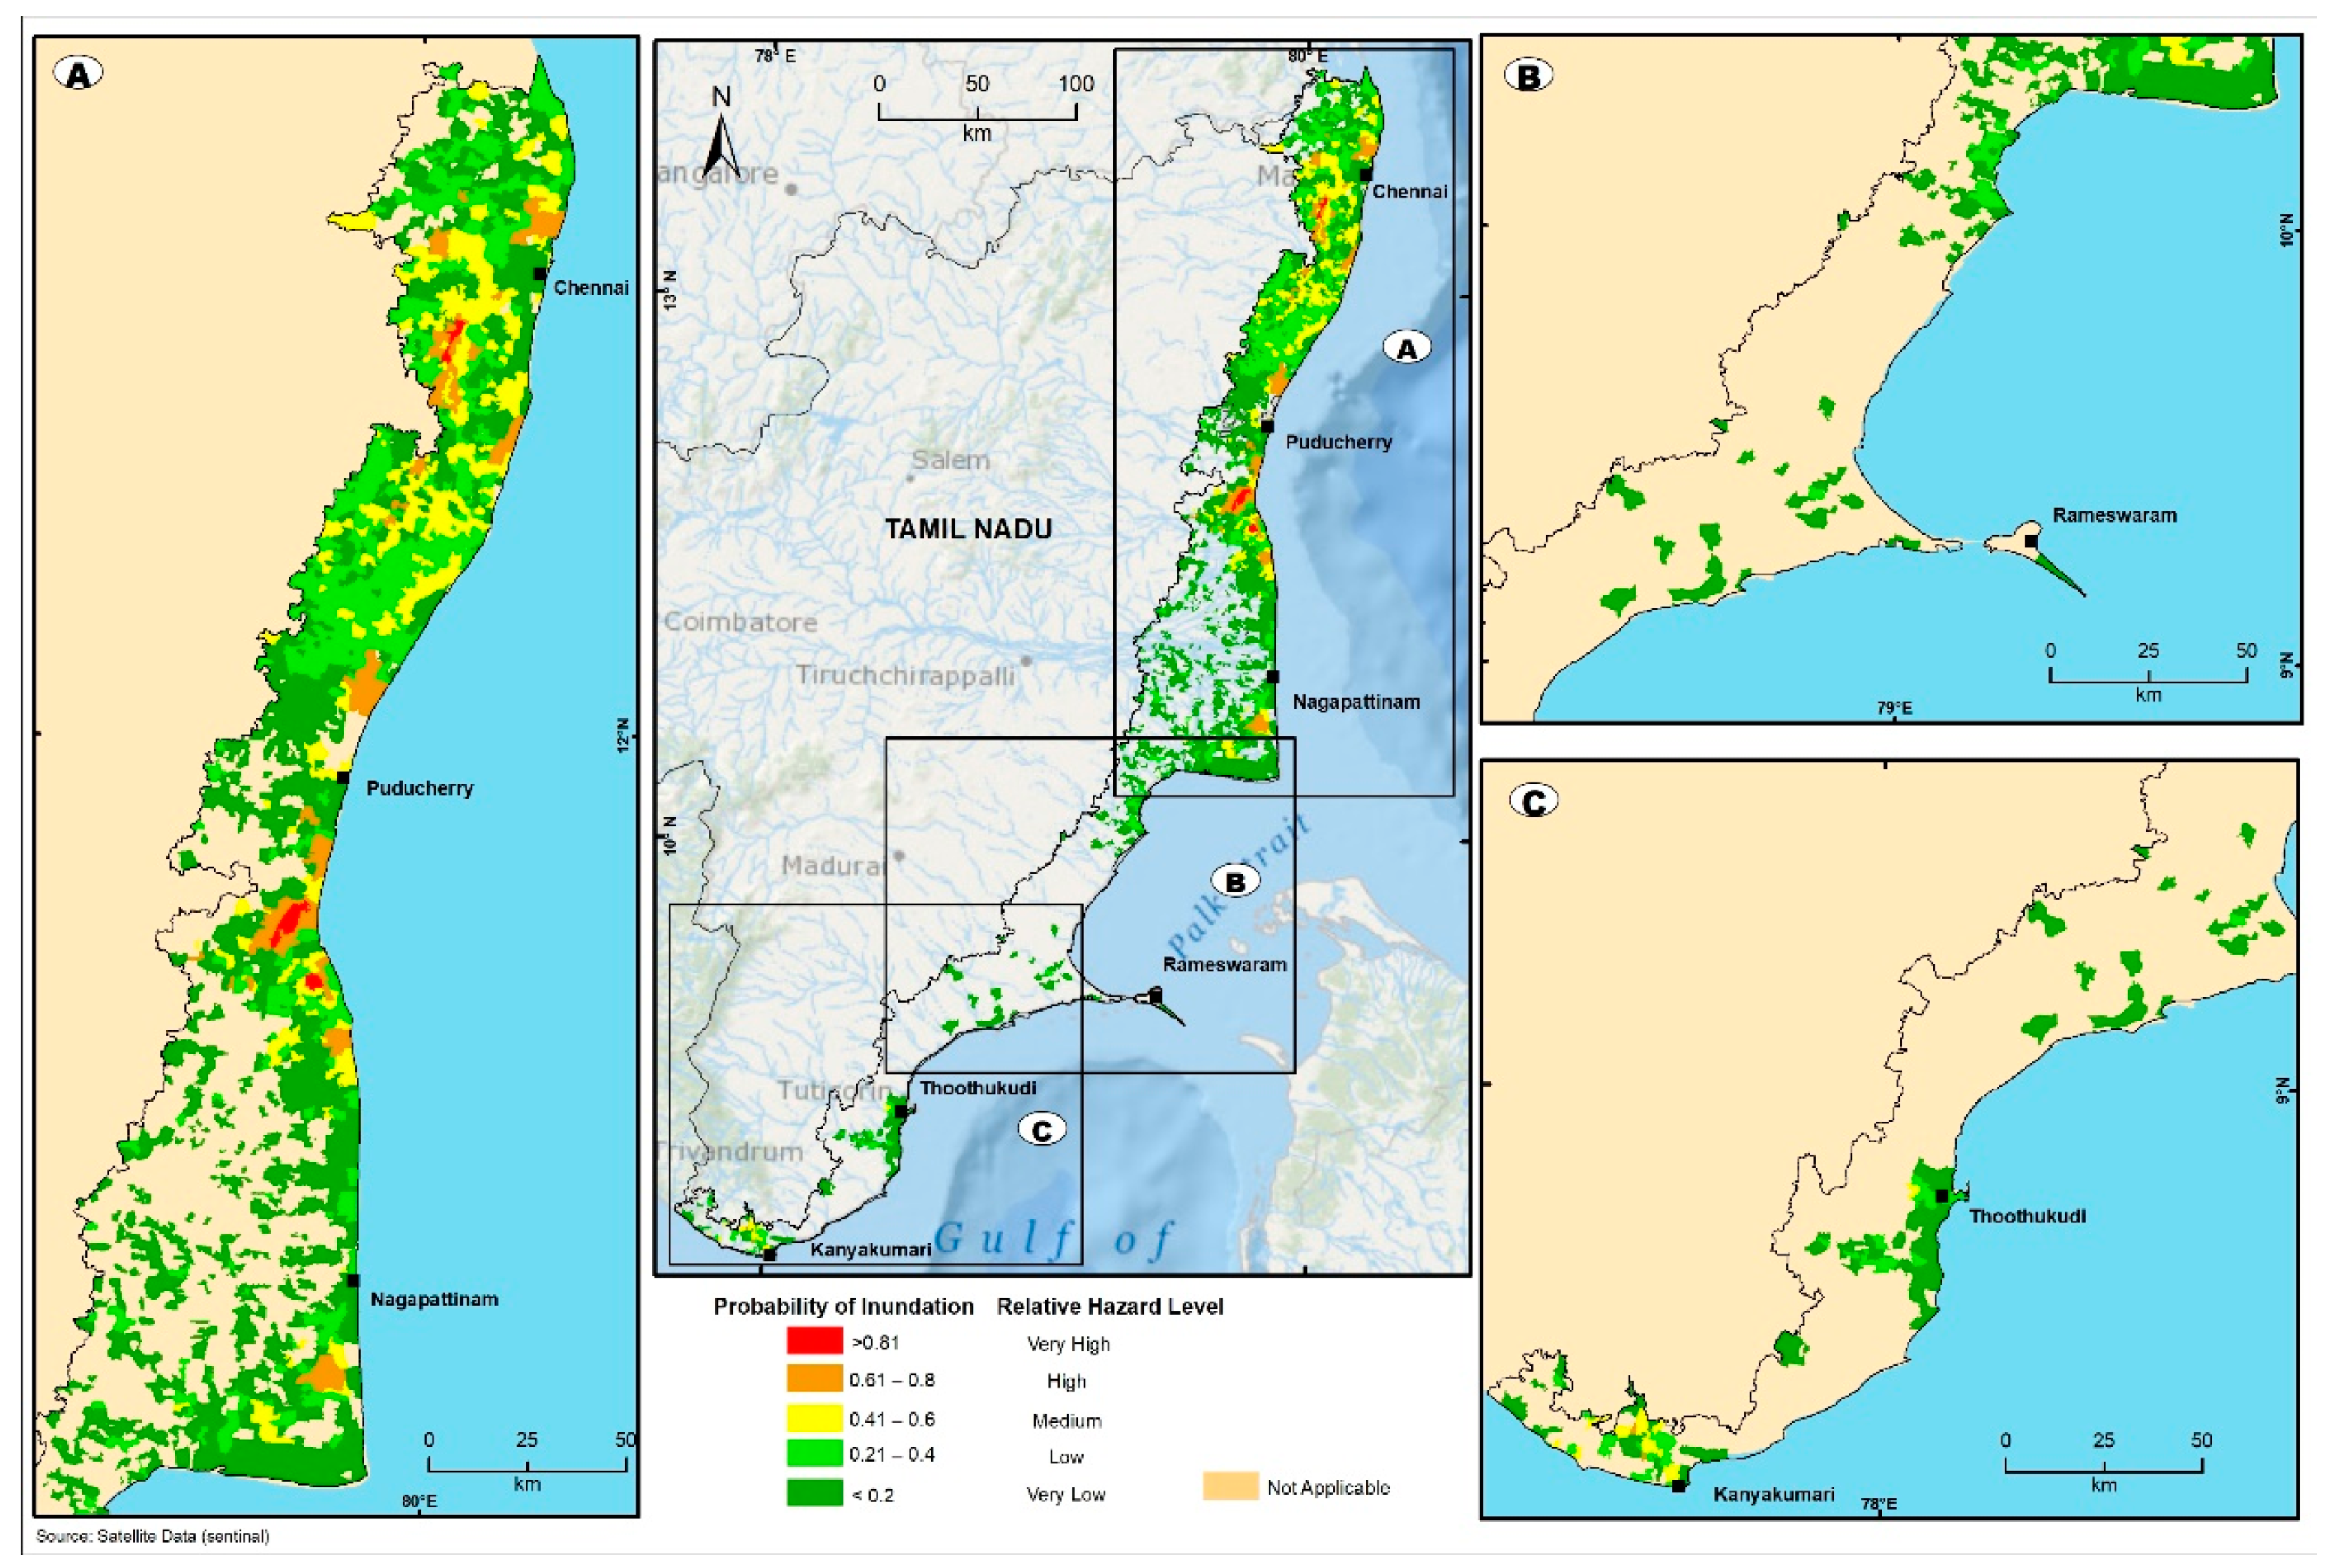
2.2. Flood Hazard Mapping

The methodology adopted for this study is illustrated in Figure 2. There are different methods adopted worldwide to generate flood hazard maps, and most of them approximate rainfall–runoff transformation processes. Modelling rainfall–runoff processes is a challenging task for a wider area. However, identifying flood inundation after a major rainfall event is highly possible with the help of satellite images. In this study, the flood-prone areas are extracted from Sentinel-1 Synthetic Aperture Radar (SAR) based on major rainfall events in the coastal plains of Tamil Nadu. The Sentinel-1 constellation consists of currently two satellites (Sentinel-1 A and Sentinel-1 B) with a Synthetic Aperture Radar instrument operating on-board at C-band of 5.5 GHz frequency. It provides data at a resolution of 10 m with a 12-day repeat cycle [28]. In this study, we used all available VH (Vertical–Horizontal) polarised SAR data in the default Interferometric Wide-Swath (IW) mode, and Ground Range Detected High Resolution (GRDH) format acquired for pre-flood and post-flood periods as mentioned in Table 1. The daily rainfall data collected from the State Water Resources Data Centre and Indian Meteorological Department (IMD) reports for 2015–2021 were used to determine the flood periods. The daily rainfall data is classified into heavy (64.5–115.5 mm), very heavy (115.6–204.4 mm), and extremely heavy (above 204.4 mm) classes, and based on the lag period after these rainfall events, the dates for post-flood satellite datasets were determined (Supplementary Table S1). The pre-processing of the Sentinel-1 data and the calculation of temporal median image for each of the seasons were done in the Google Earth Engine (GEE) platform. SRTM (Shuttle Radar Topography Mission) DEM data were used for terrain filtering to eliminate areas of radar shadow and areas of unlikely flooding using the slope information. The change detection and thresholding (CDAT) methodologies were adopted, where the difference in sigma nought values between the pre-flood and post-flood datasets were calculated [29,30]. Following that, a threshold filter is determined based on the global threshold to extract the potentially flooded zone in the study area. The script used for extraction of flood inundation is provided in Supplementary File S1. The extracted flood inundation layers for multiple rainfall events were overlaid, and the cumulative flood inundation layer was prepared with the frequency of flood events.
All the river courses and tanks/lakes of the study area were extracted using LANDSAT 8 images. The extracted waterbody layer was overlaid with SRTM DEM, and flood rise scenarios were modelled with varying depth levels (1 to 5 feet) in Global Mapper software. The list of flood-prone villages in the study area was collected from the District Disaster Management Plan (DDMP) reports of 13 coastal districts of Tamil Nadu and prepared as a layer. All the layers derived from the satellite-based flood inundation mapping, DEM-based modelling and the DDMP reporting villages were aggregated at a micro-administrative unit (i.e., village and ward), and the flood probability layer was generated. The micro-administrative units were determined with flood hazard probability on a 0–1 scale, where 0 denotes very low, and 1 is very high. The micro-administrative units identified with (1) high coverage and frequency in cumulative flood inundation layer, (2) high coverage of inundation resulting from a 1-foot rise of water level in DEM-based modelling, and (3) high flood impacts in DDMP reports are considered to be units subject to very high flood hazard, with a high probability (1.0), while units that fall only on either the cumulative flood inundation layer or the flood rise model layer with significantly less geographical coverage are considered to be units subject to very low flood hazard (0.0). The units that are not identified on the basis of these layers correspond to villages/wards that have been unaffected in the recent past.

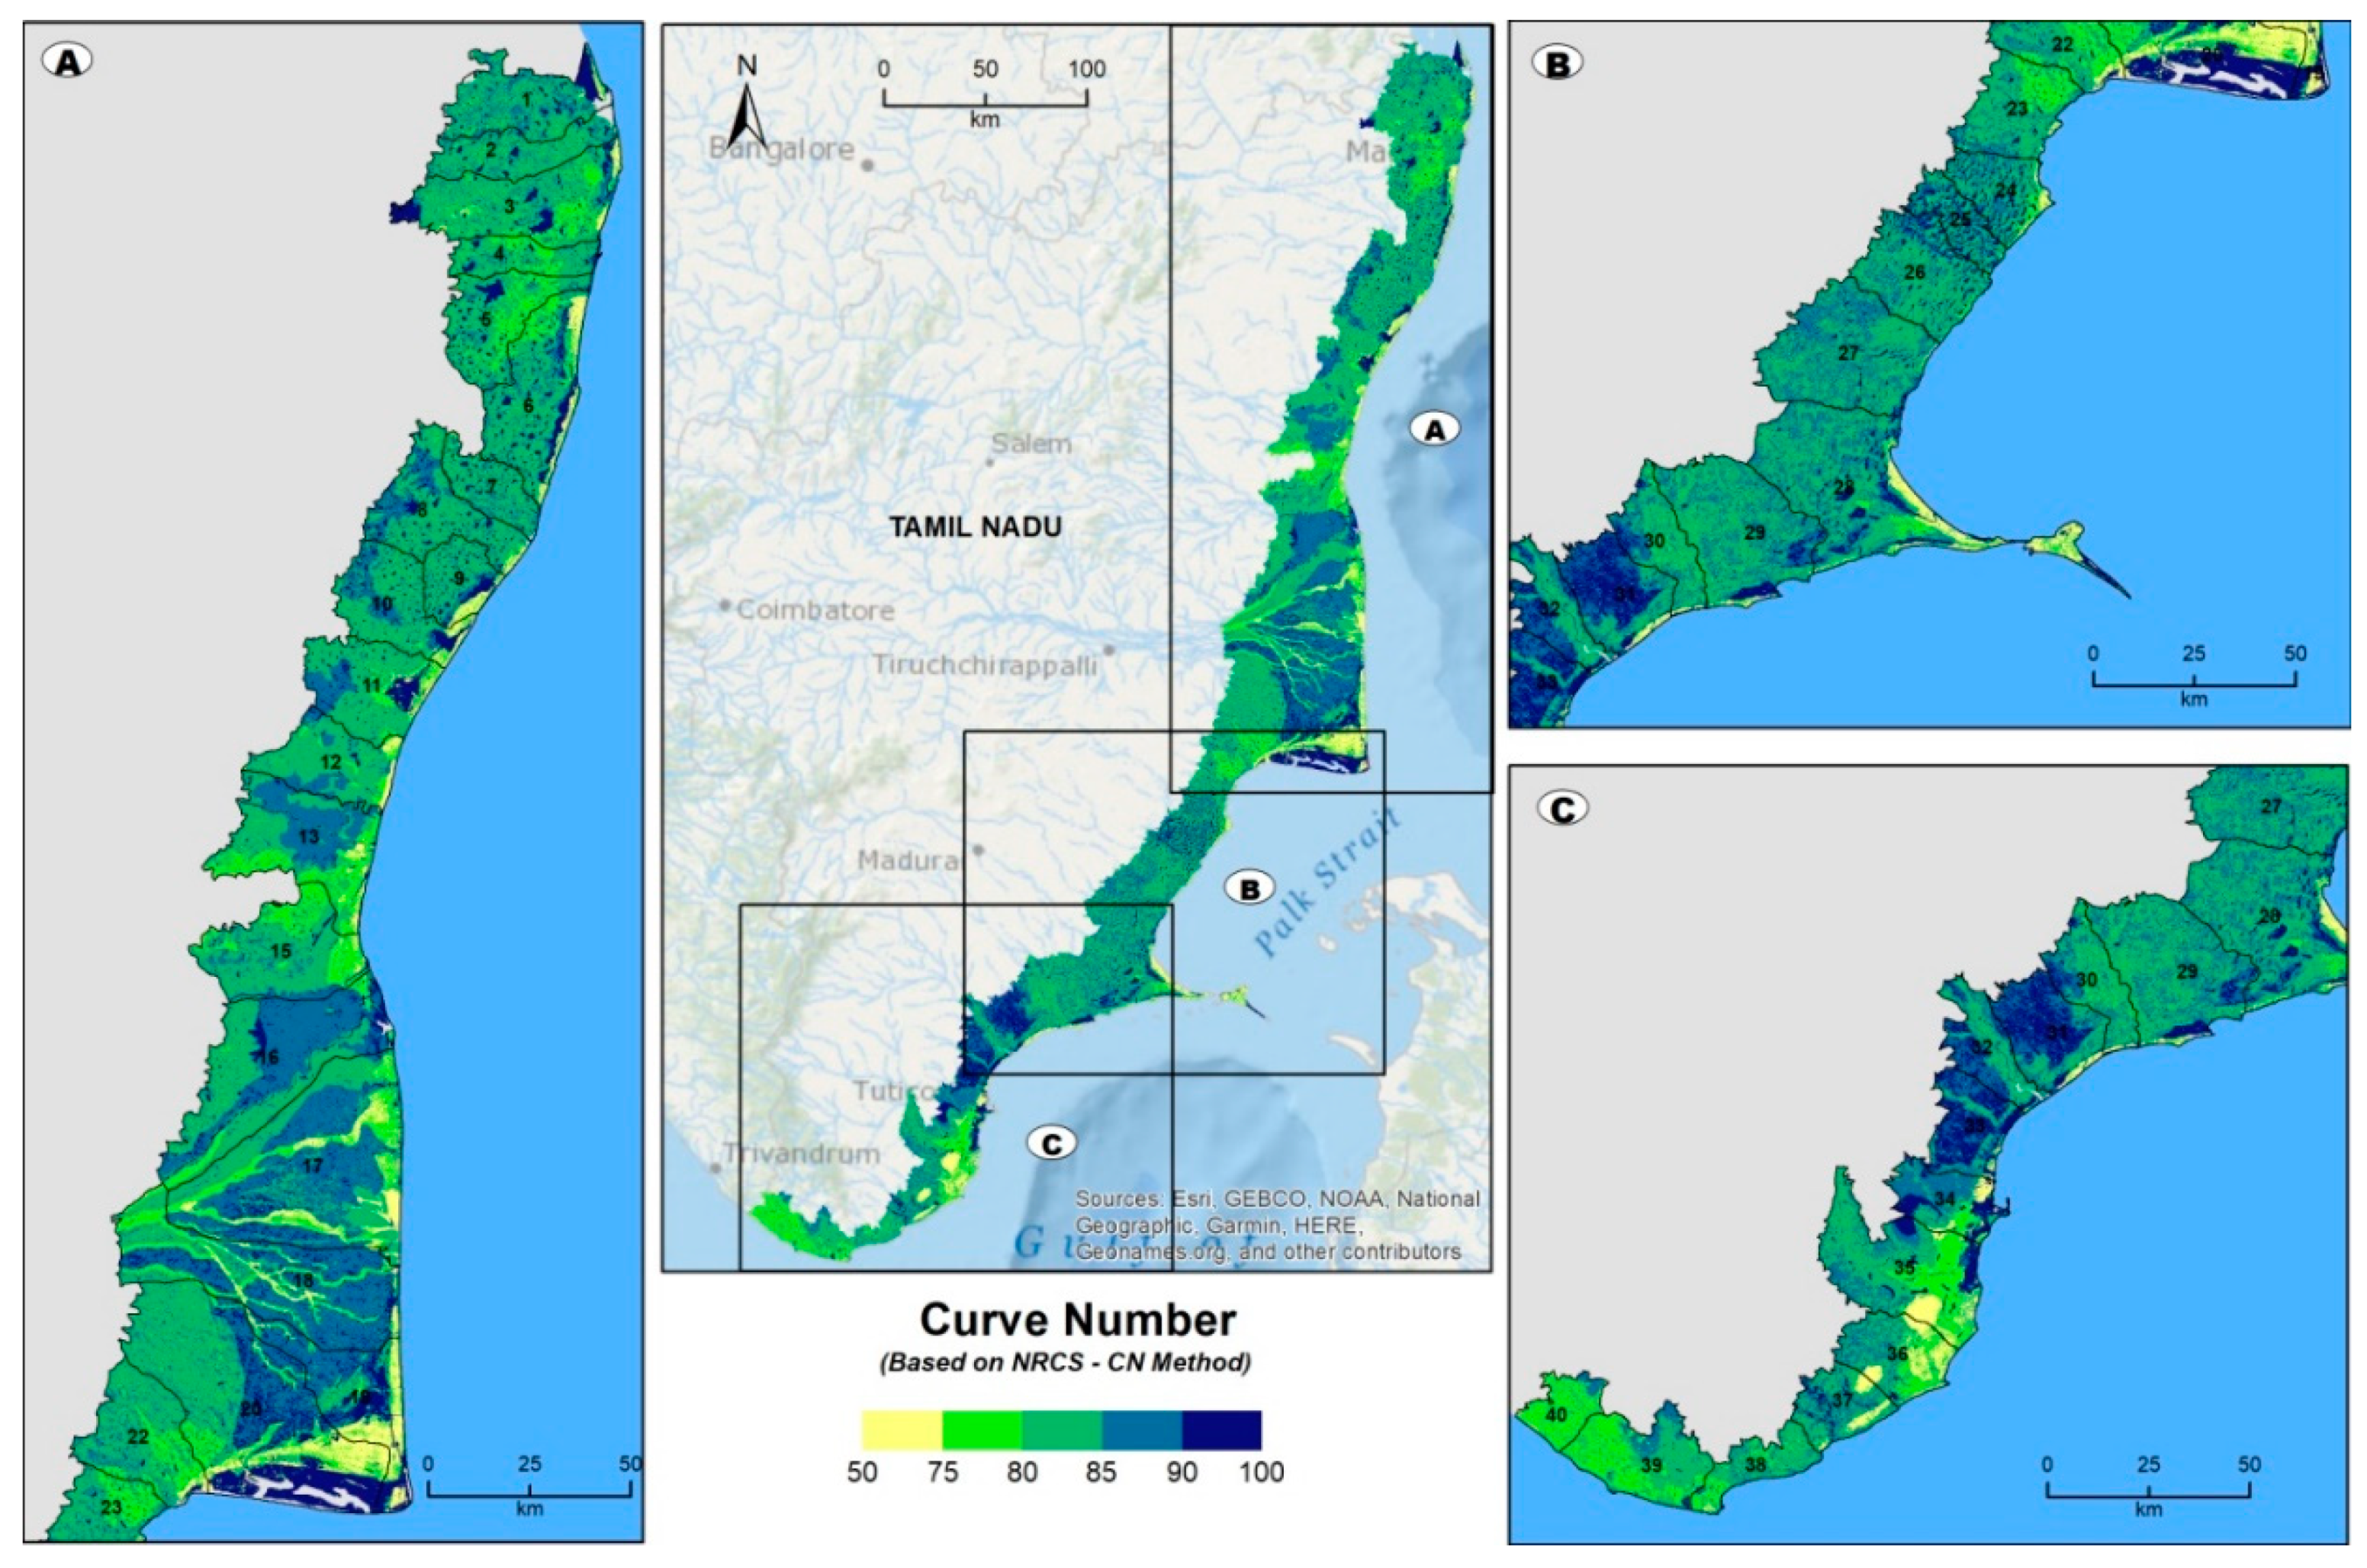
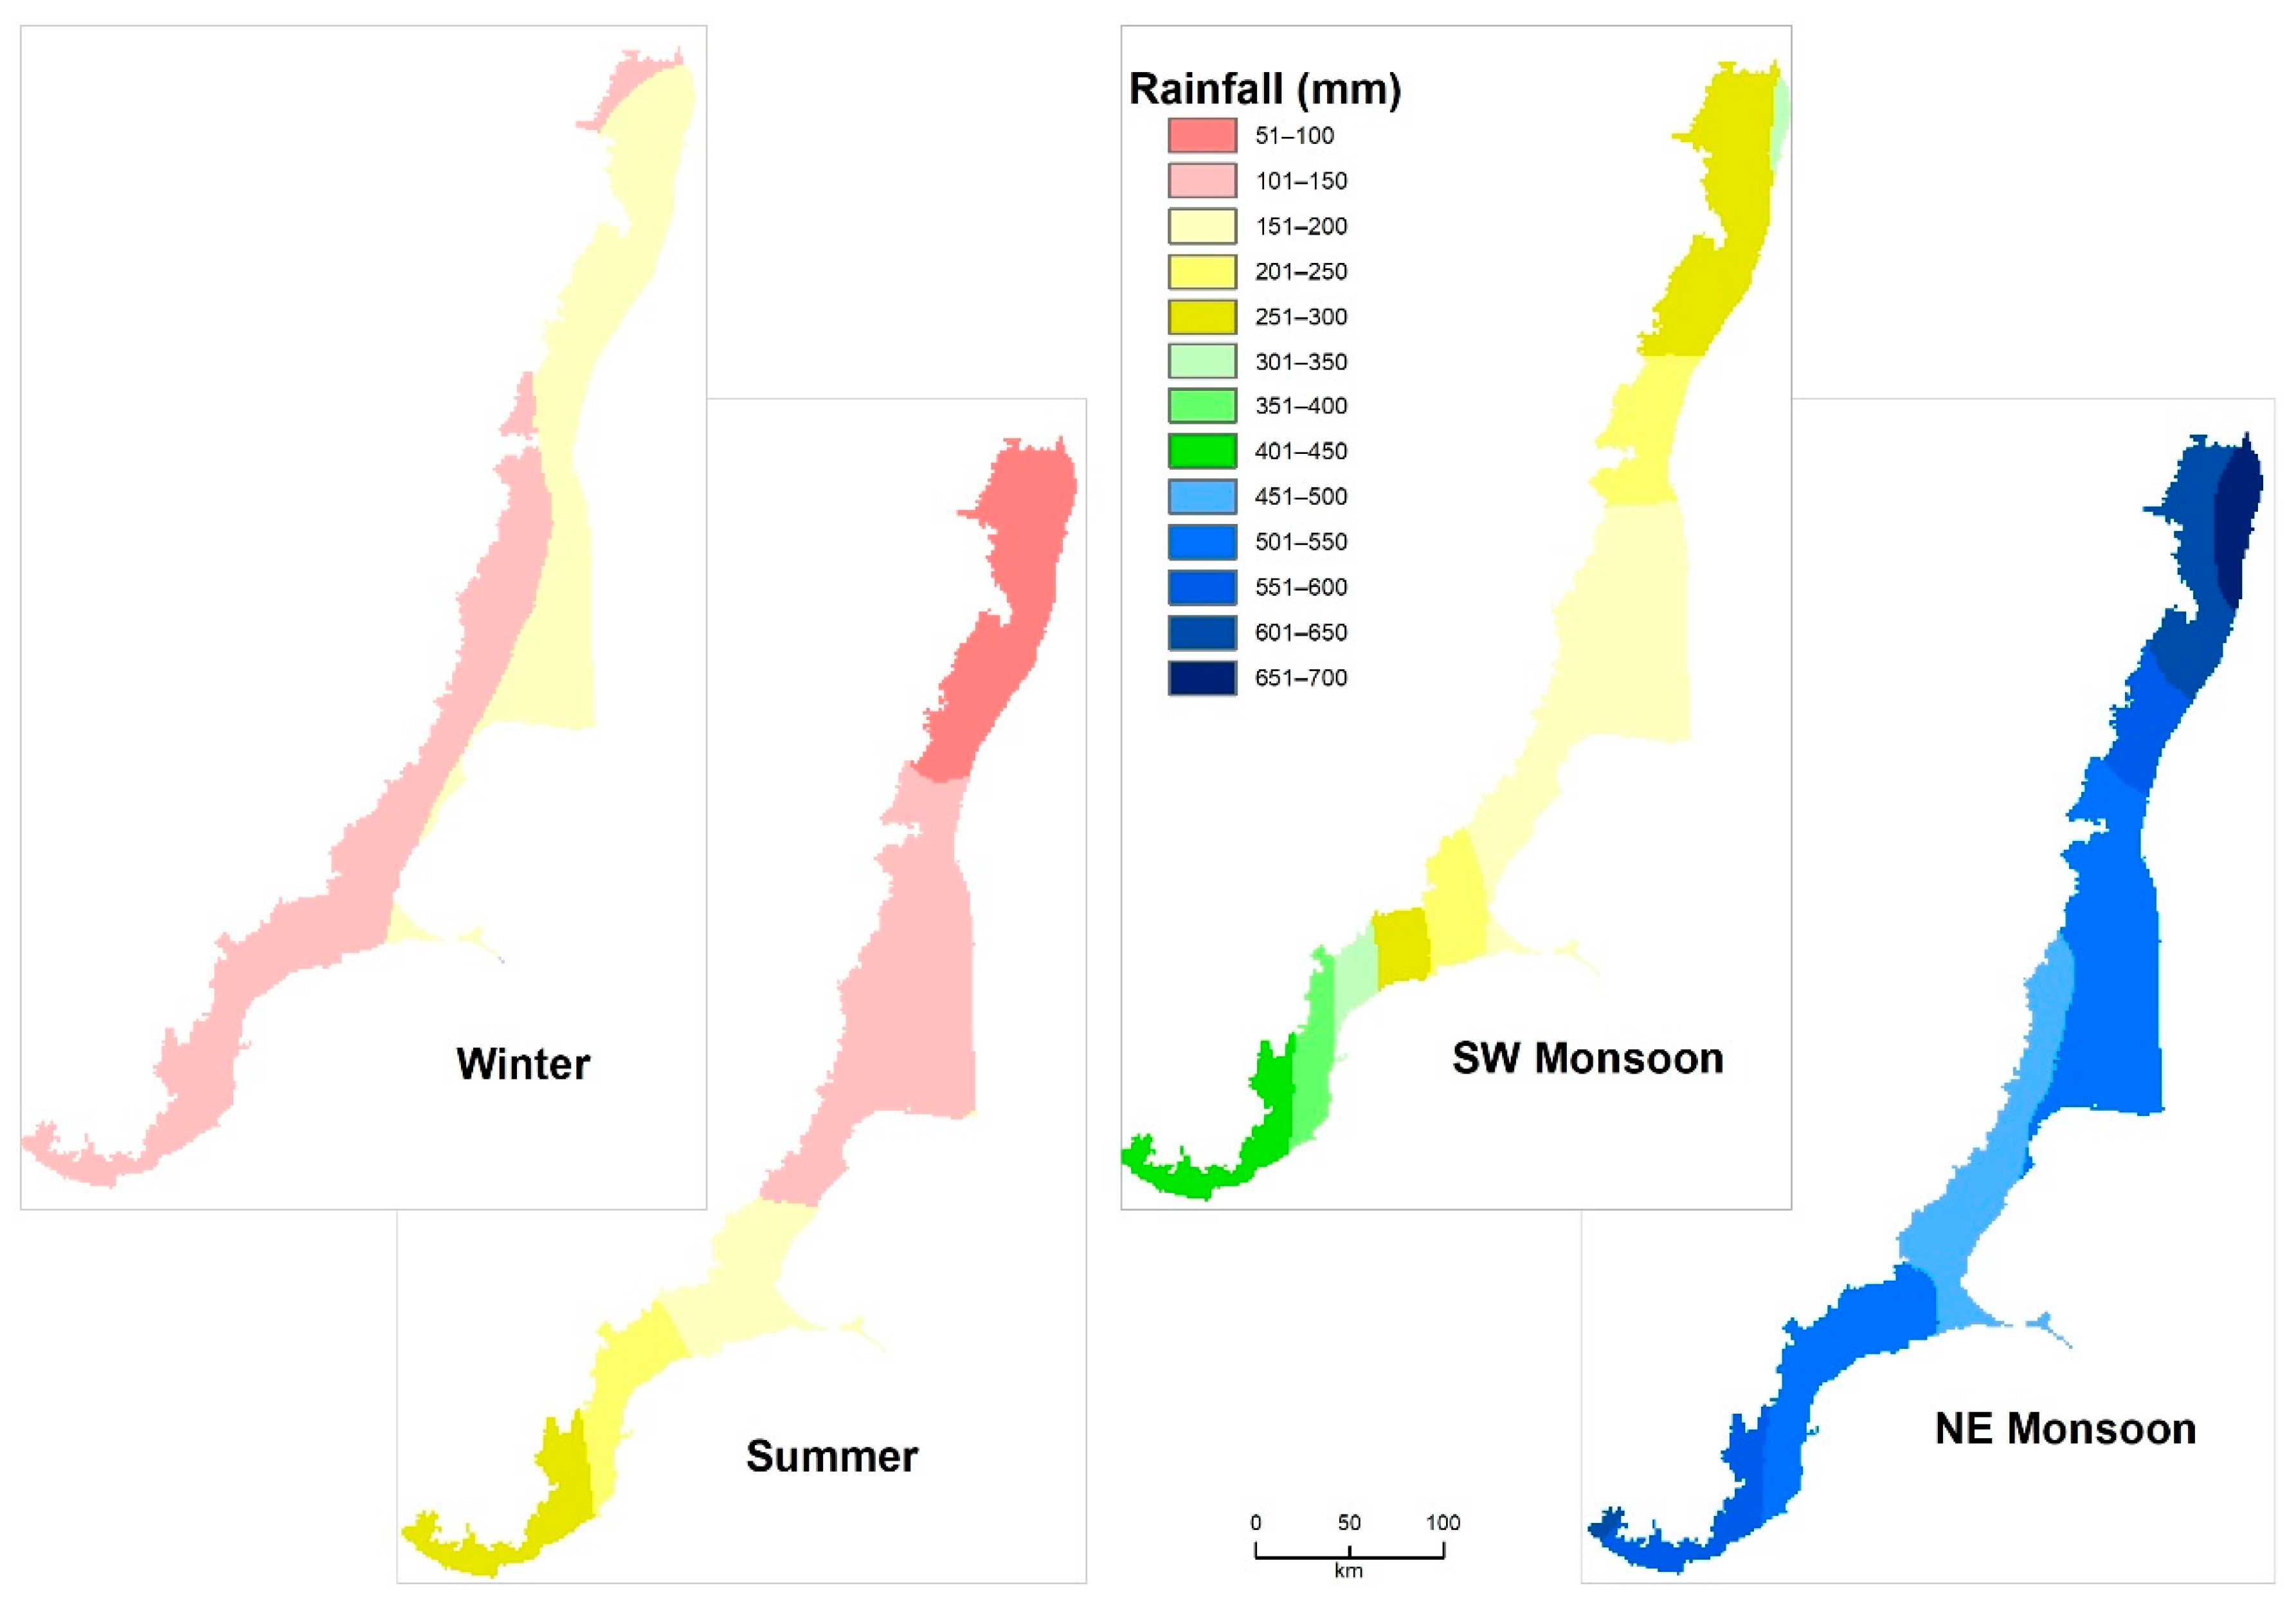
2.3. Surface Runoff Potential

Rainfall and surface runoff are vital hydrological parameters for evaluating flood risks [31,32]. The long-term monthly rainfall data (1980–2017) were extracted through the NASA-POWER (Prediction of Worldwide renewable Energy Resources) (https://power.larc.nasa.gov/, accessed on 31 May 2021) and averaged to identify the regions that receive more seasonal rainfall in the study area. Numerous hydrologic methods are used to estimate surface runoff, and these models vary from simple to complex and differ in structures and data requirements [33]. The NRCS-CN method proved to be effective for estimating surface runoff and associated flood risks where runoff/peak discharge flow records are not available [34]. The NRCS-CN method is straightforward in computation, as it requires minimal data inputs, such as hydrological soil group (HSG), land use/land cover (LU/LC) and antecedent moisture conditions (AMC) [35]. In this study, an LU/LC map was prepared using LANDSAT 8 images, and soil data of the National Bureau of Soil Survey and Land Use Planning (NBSS-LUP) obtained through the European Digital Archive of Soil Maps (EuDASM) were used to prepare HSG layer for NRCS-CN method. The GIS overlay technique was used to intersect the soil map and LU/LC map and generate the surface runoff potentials (Curve Numbers) for the different land-use-soil groups.

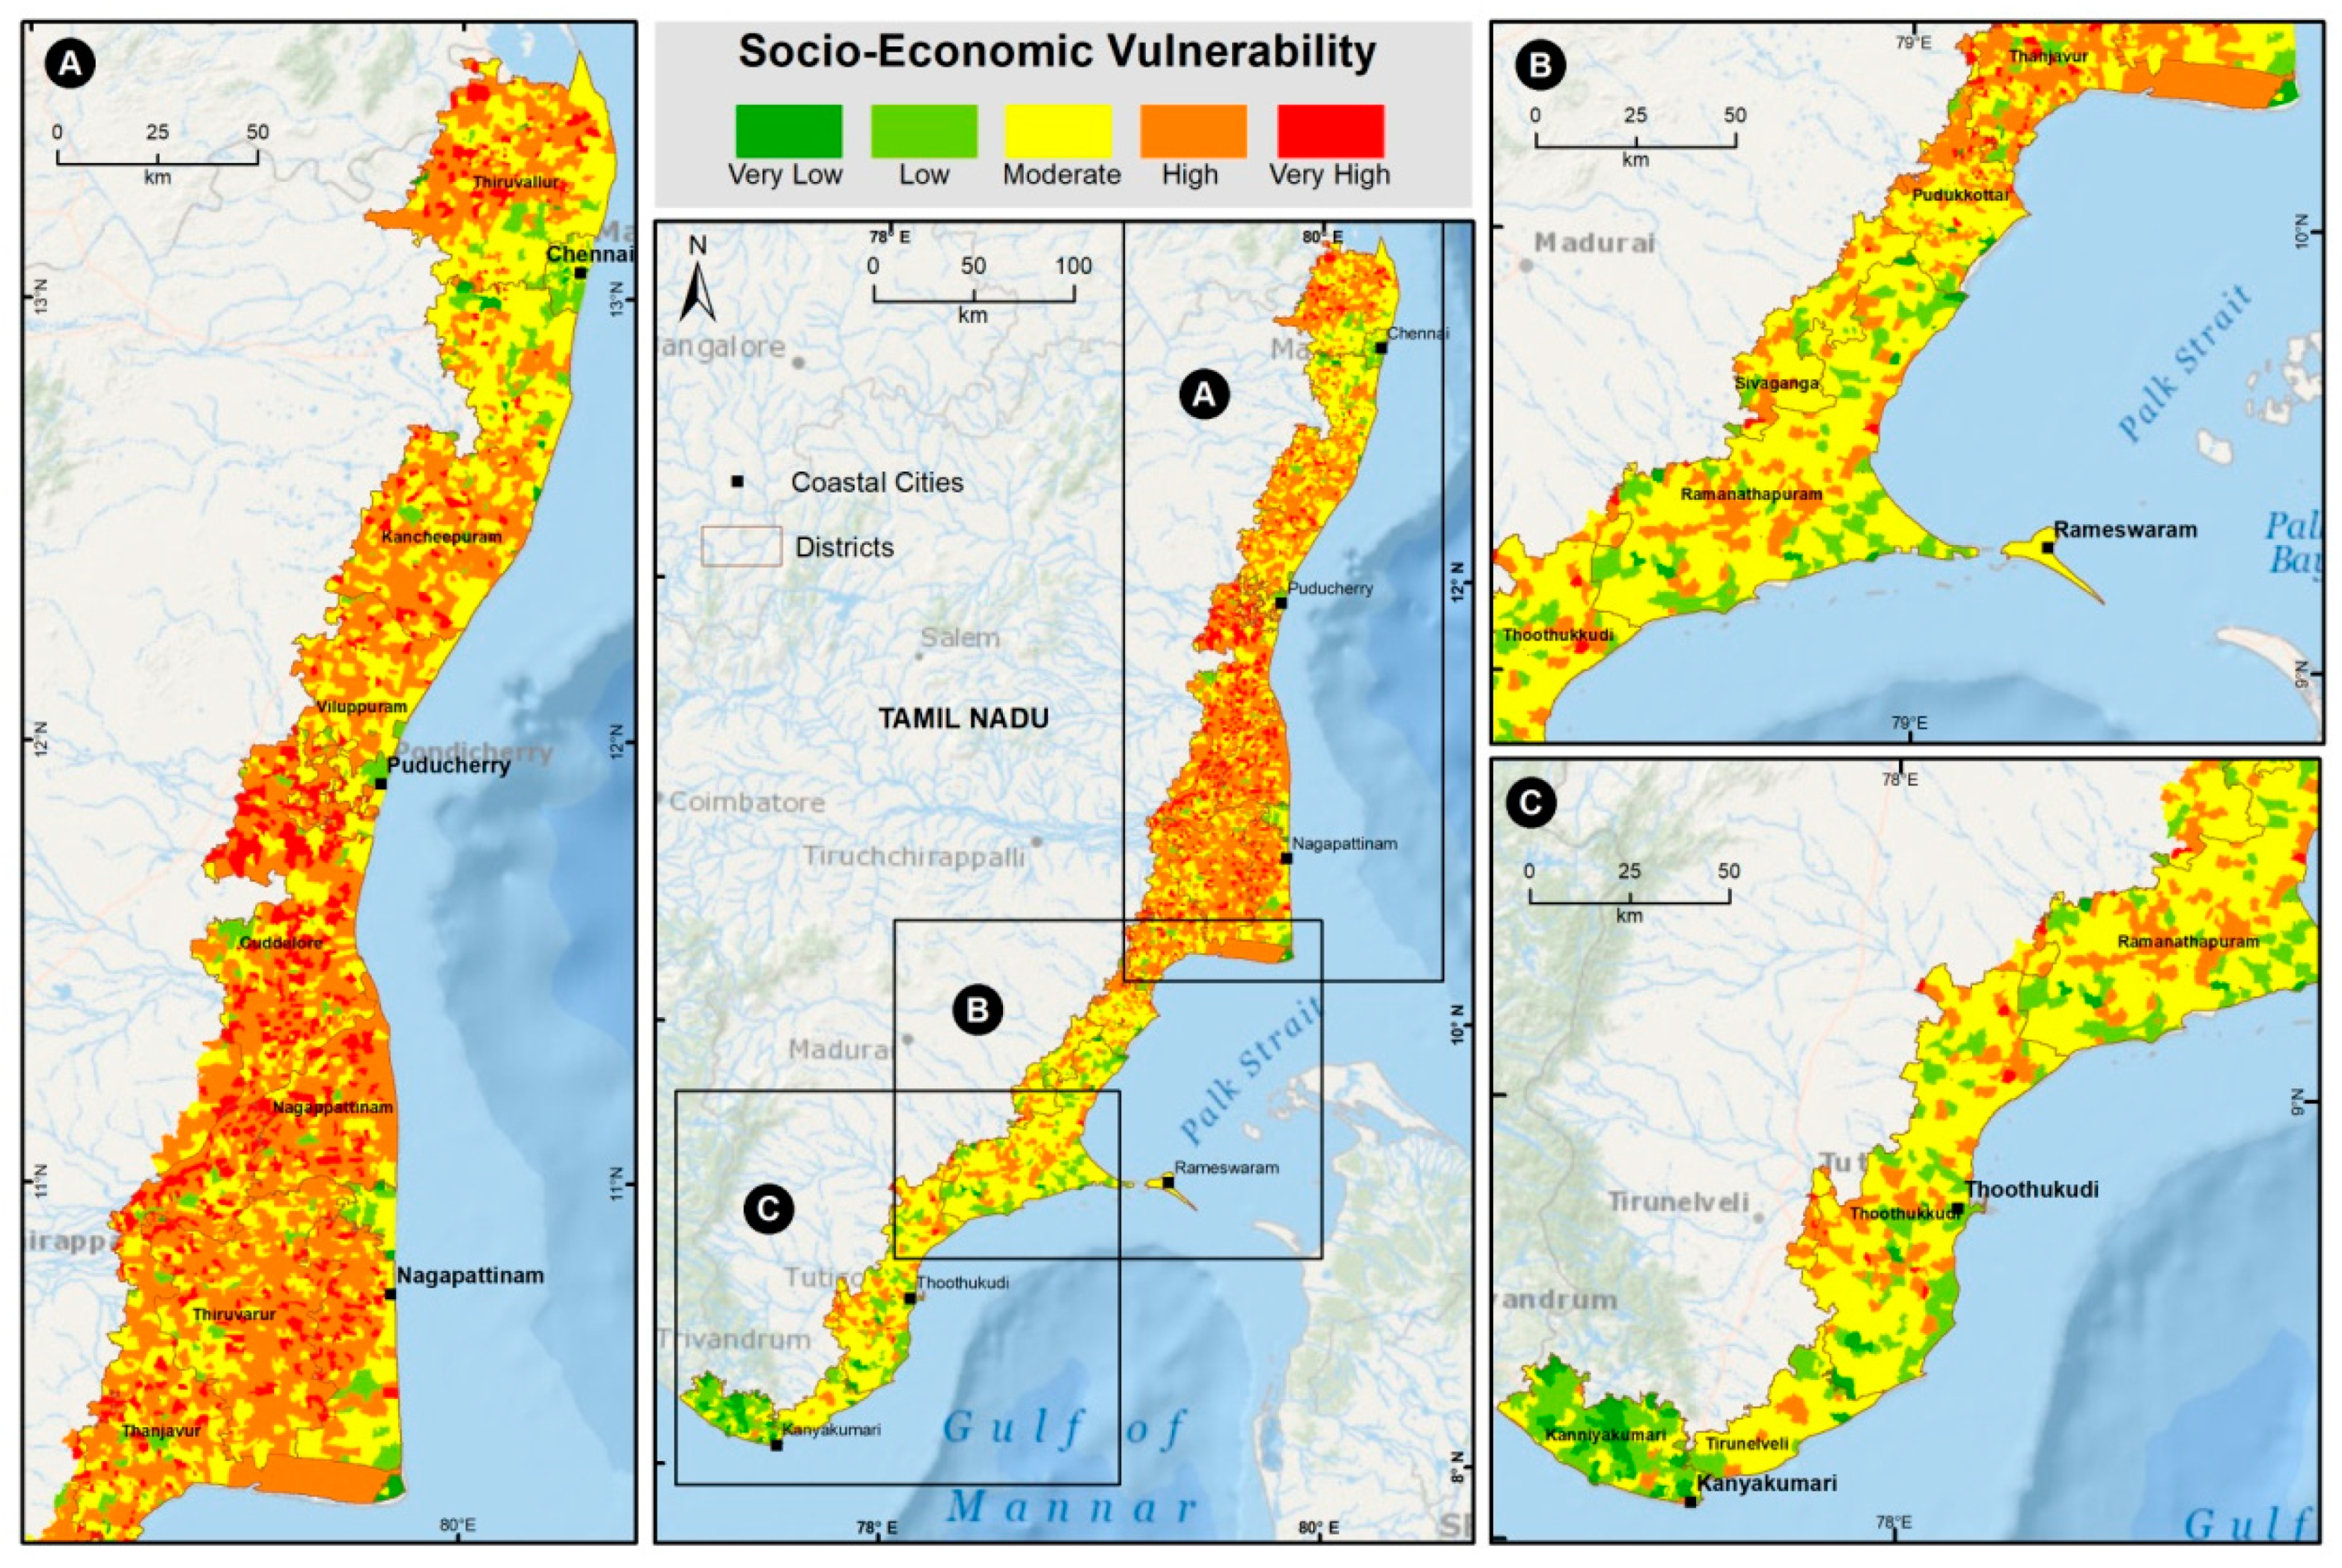
2.4. Vulnerability Assessment
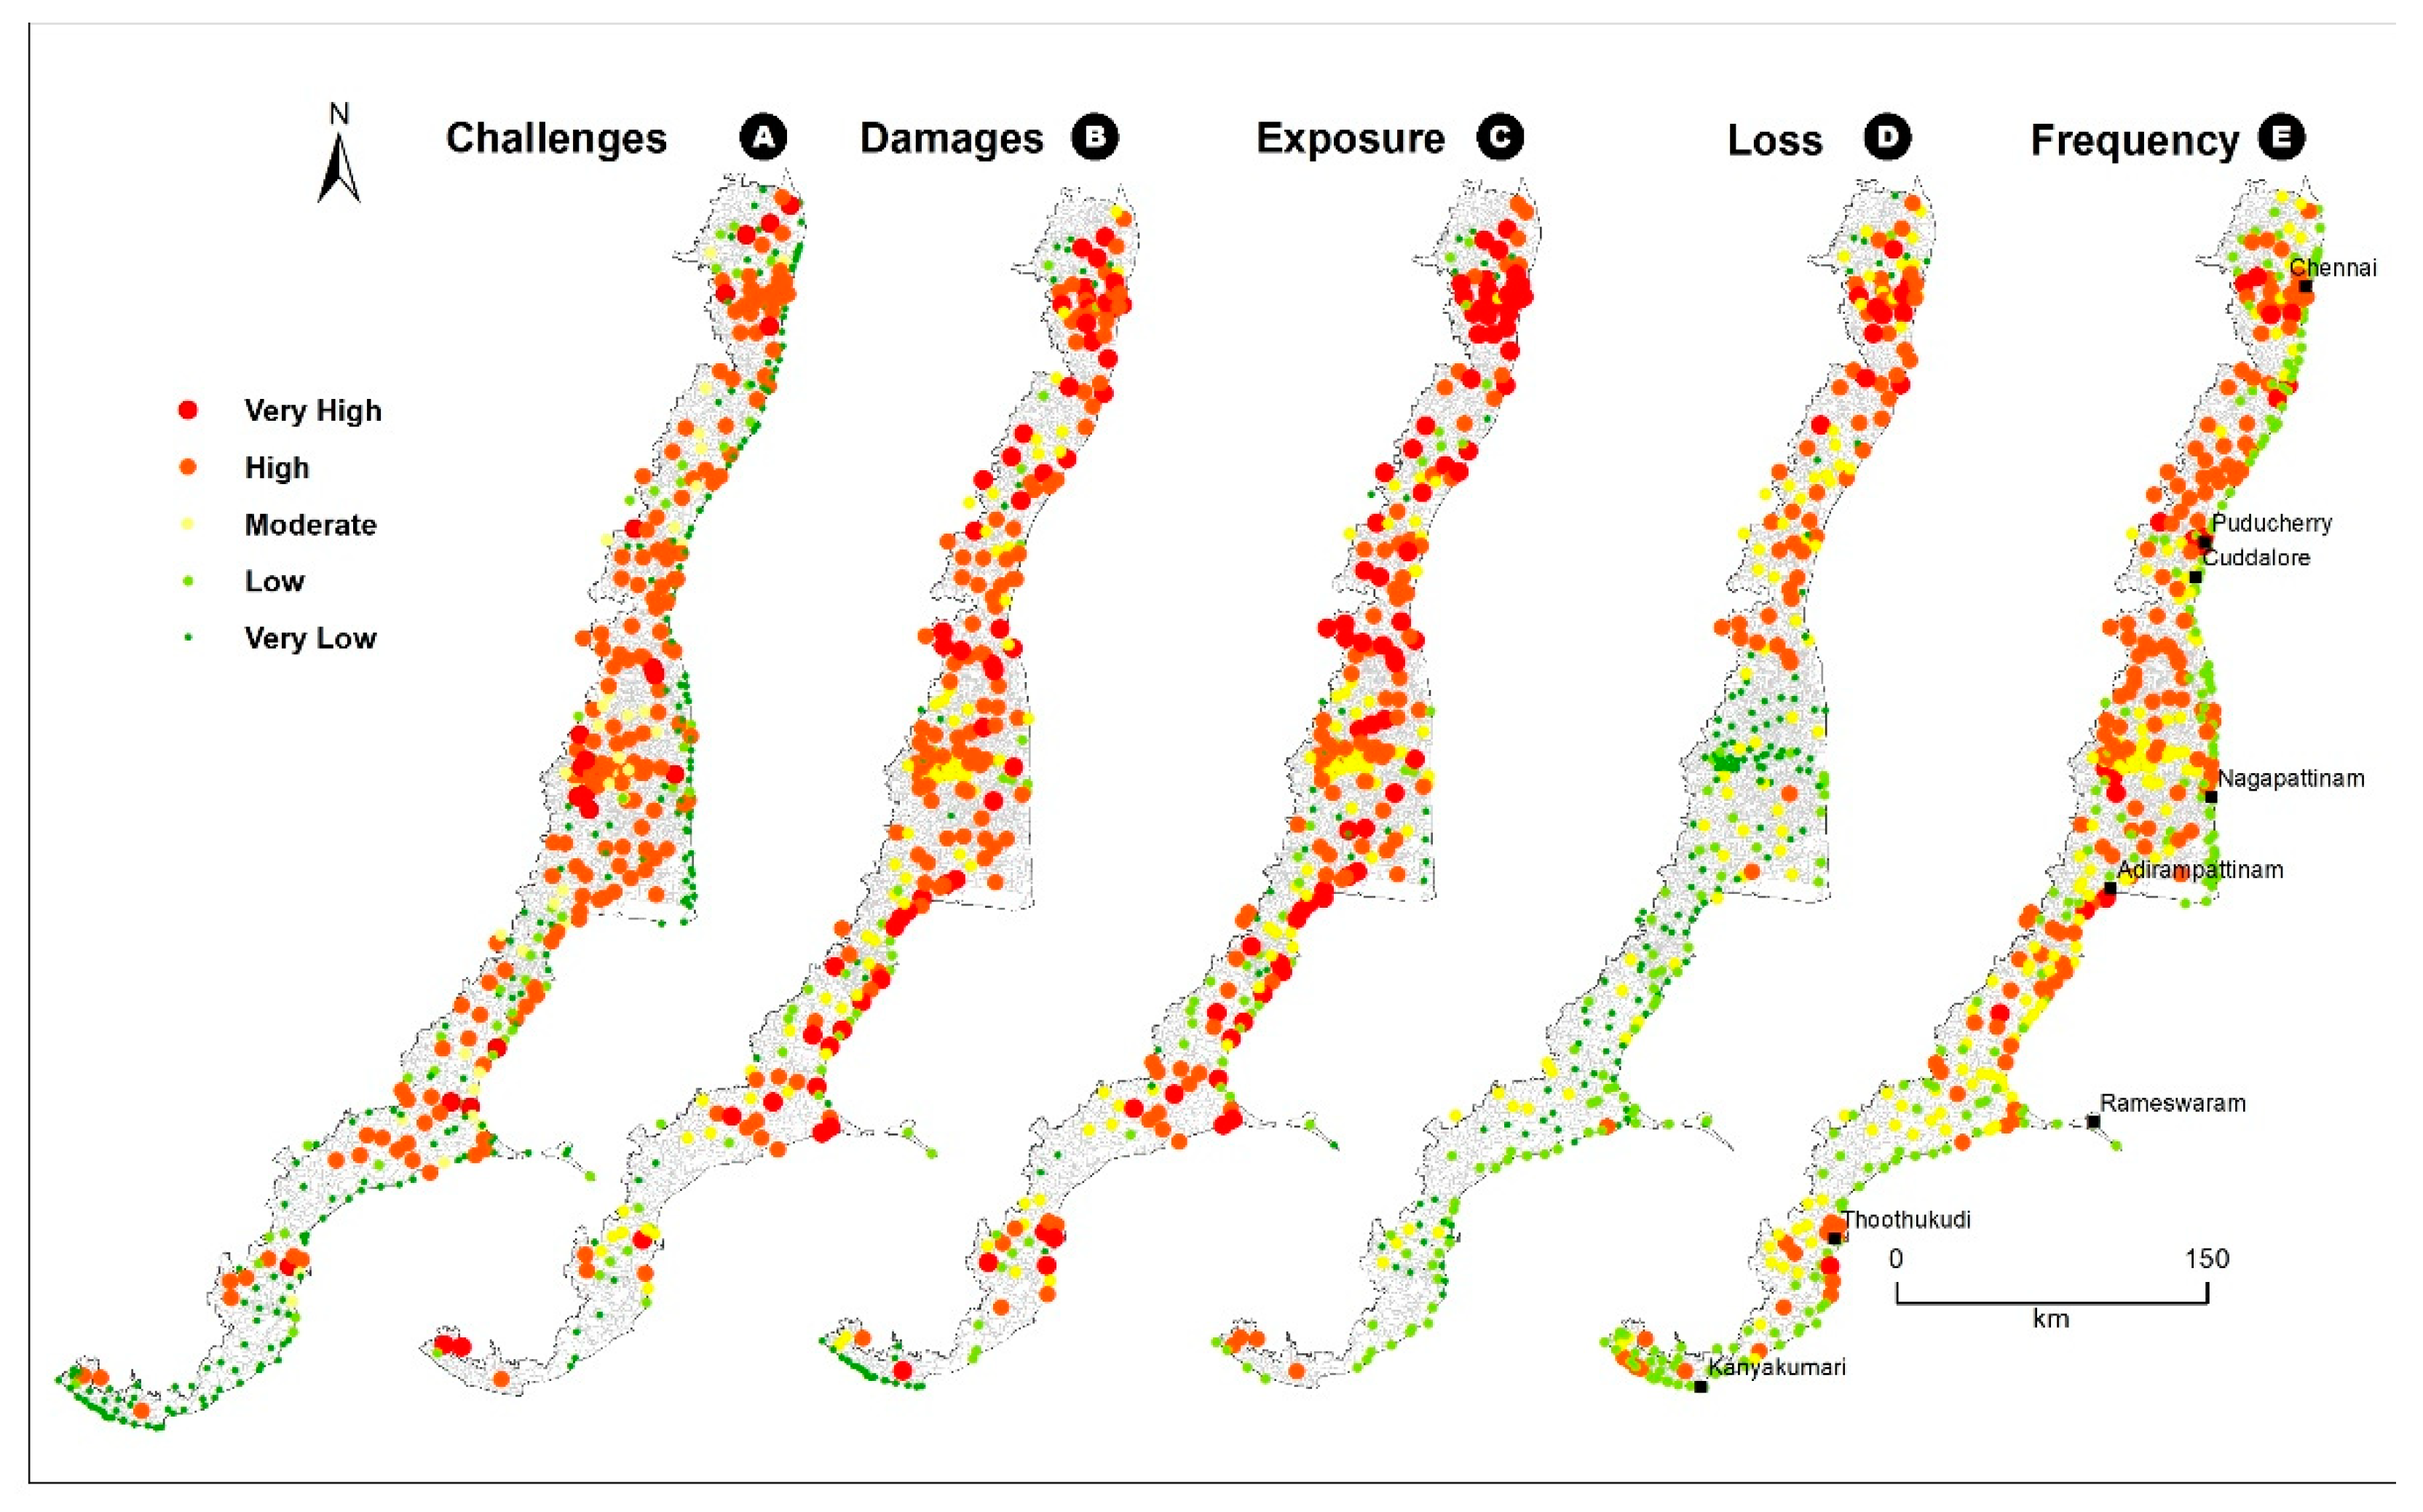
Vulnerability is a multi-dimensional subject, and attainment of composite vulnerability that combines all major physio-socio-economic-environmental indicators at micro-level units is a difficult task [36]. Therefore, the relative degrees of socio-economic characteristics in 5020 villages/wards were examined using 2011 census data. The relevant direct and indirect indicators that impact the socio-economic vulnerability of coastal regions were retrieved after a comprehensive examination of the District Census Hand Book (DCHB) and Primary Census Abstract (PCA) of Census of India. The indicators used in the study are presented in Table 2. The values of exposure-related indicators and capacity-related indicators were rescaled and ranked relatively on a scale of 1–5 based on the histogram distribution of each indicator. The ranked values were summed up, and the composite vulnerability layer was prepared. The micro-administrative units of the study area are classified into five classes of vulnerability ranging from very low to very high. The method for deriving the composite vulnerability is detailed in our previous study [27].

2.5. Field Survey

Community-based interviews are essential for identifying and contextualising the disaster impacts and challenges [37]. The people in flood-prone areas, incredibly deprived communities, are exposed to personal danger, depending upon the intensity of the flood concerning time and area. Instead of conducting wealthier population surveys, group surveys of deprived communities would afford better perceptions about flood risks and impacts. Thus, field surveys in locations of deprived communities were carried out throughout the entire coastal plains area of Tamil Nadu, covering villages at a radial distance of every 5 to 10 km and all major towns. A total of 514 locations were visited during December 2020–January 2021 throughout coastal Tamil Nadu. The locations of gathering information in each selected village/town were decided based on built-up structures (mainly the poorer, informal structures), socio-economic conditions of the locality (mainly the dominant social and occupational group), and susceptibility to floods (mainly the low-lying regions). We divided our team into three groups, with three persons in each group. Each group conducted the questionnaire survey using pre-determined, close-ended questions to record responses from older-age individuals (>50) to maintain uniformity. The group discussion lasted for 10 to 20 min at each location. The group settings helped to ascertain the real-time struggles faced by deprived communities due to local floods. The major questions considered for group interactions were flood frequency, flood exposure, flood impacts, flood challenges, the average time to recover, government assistance, and average economic loss. All collective responses were scaled between 1 and 5 and categorised into five classes from very low to very high for mapping and analysis.

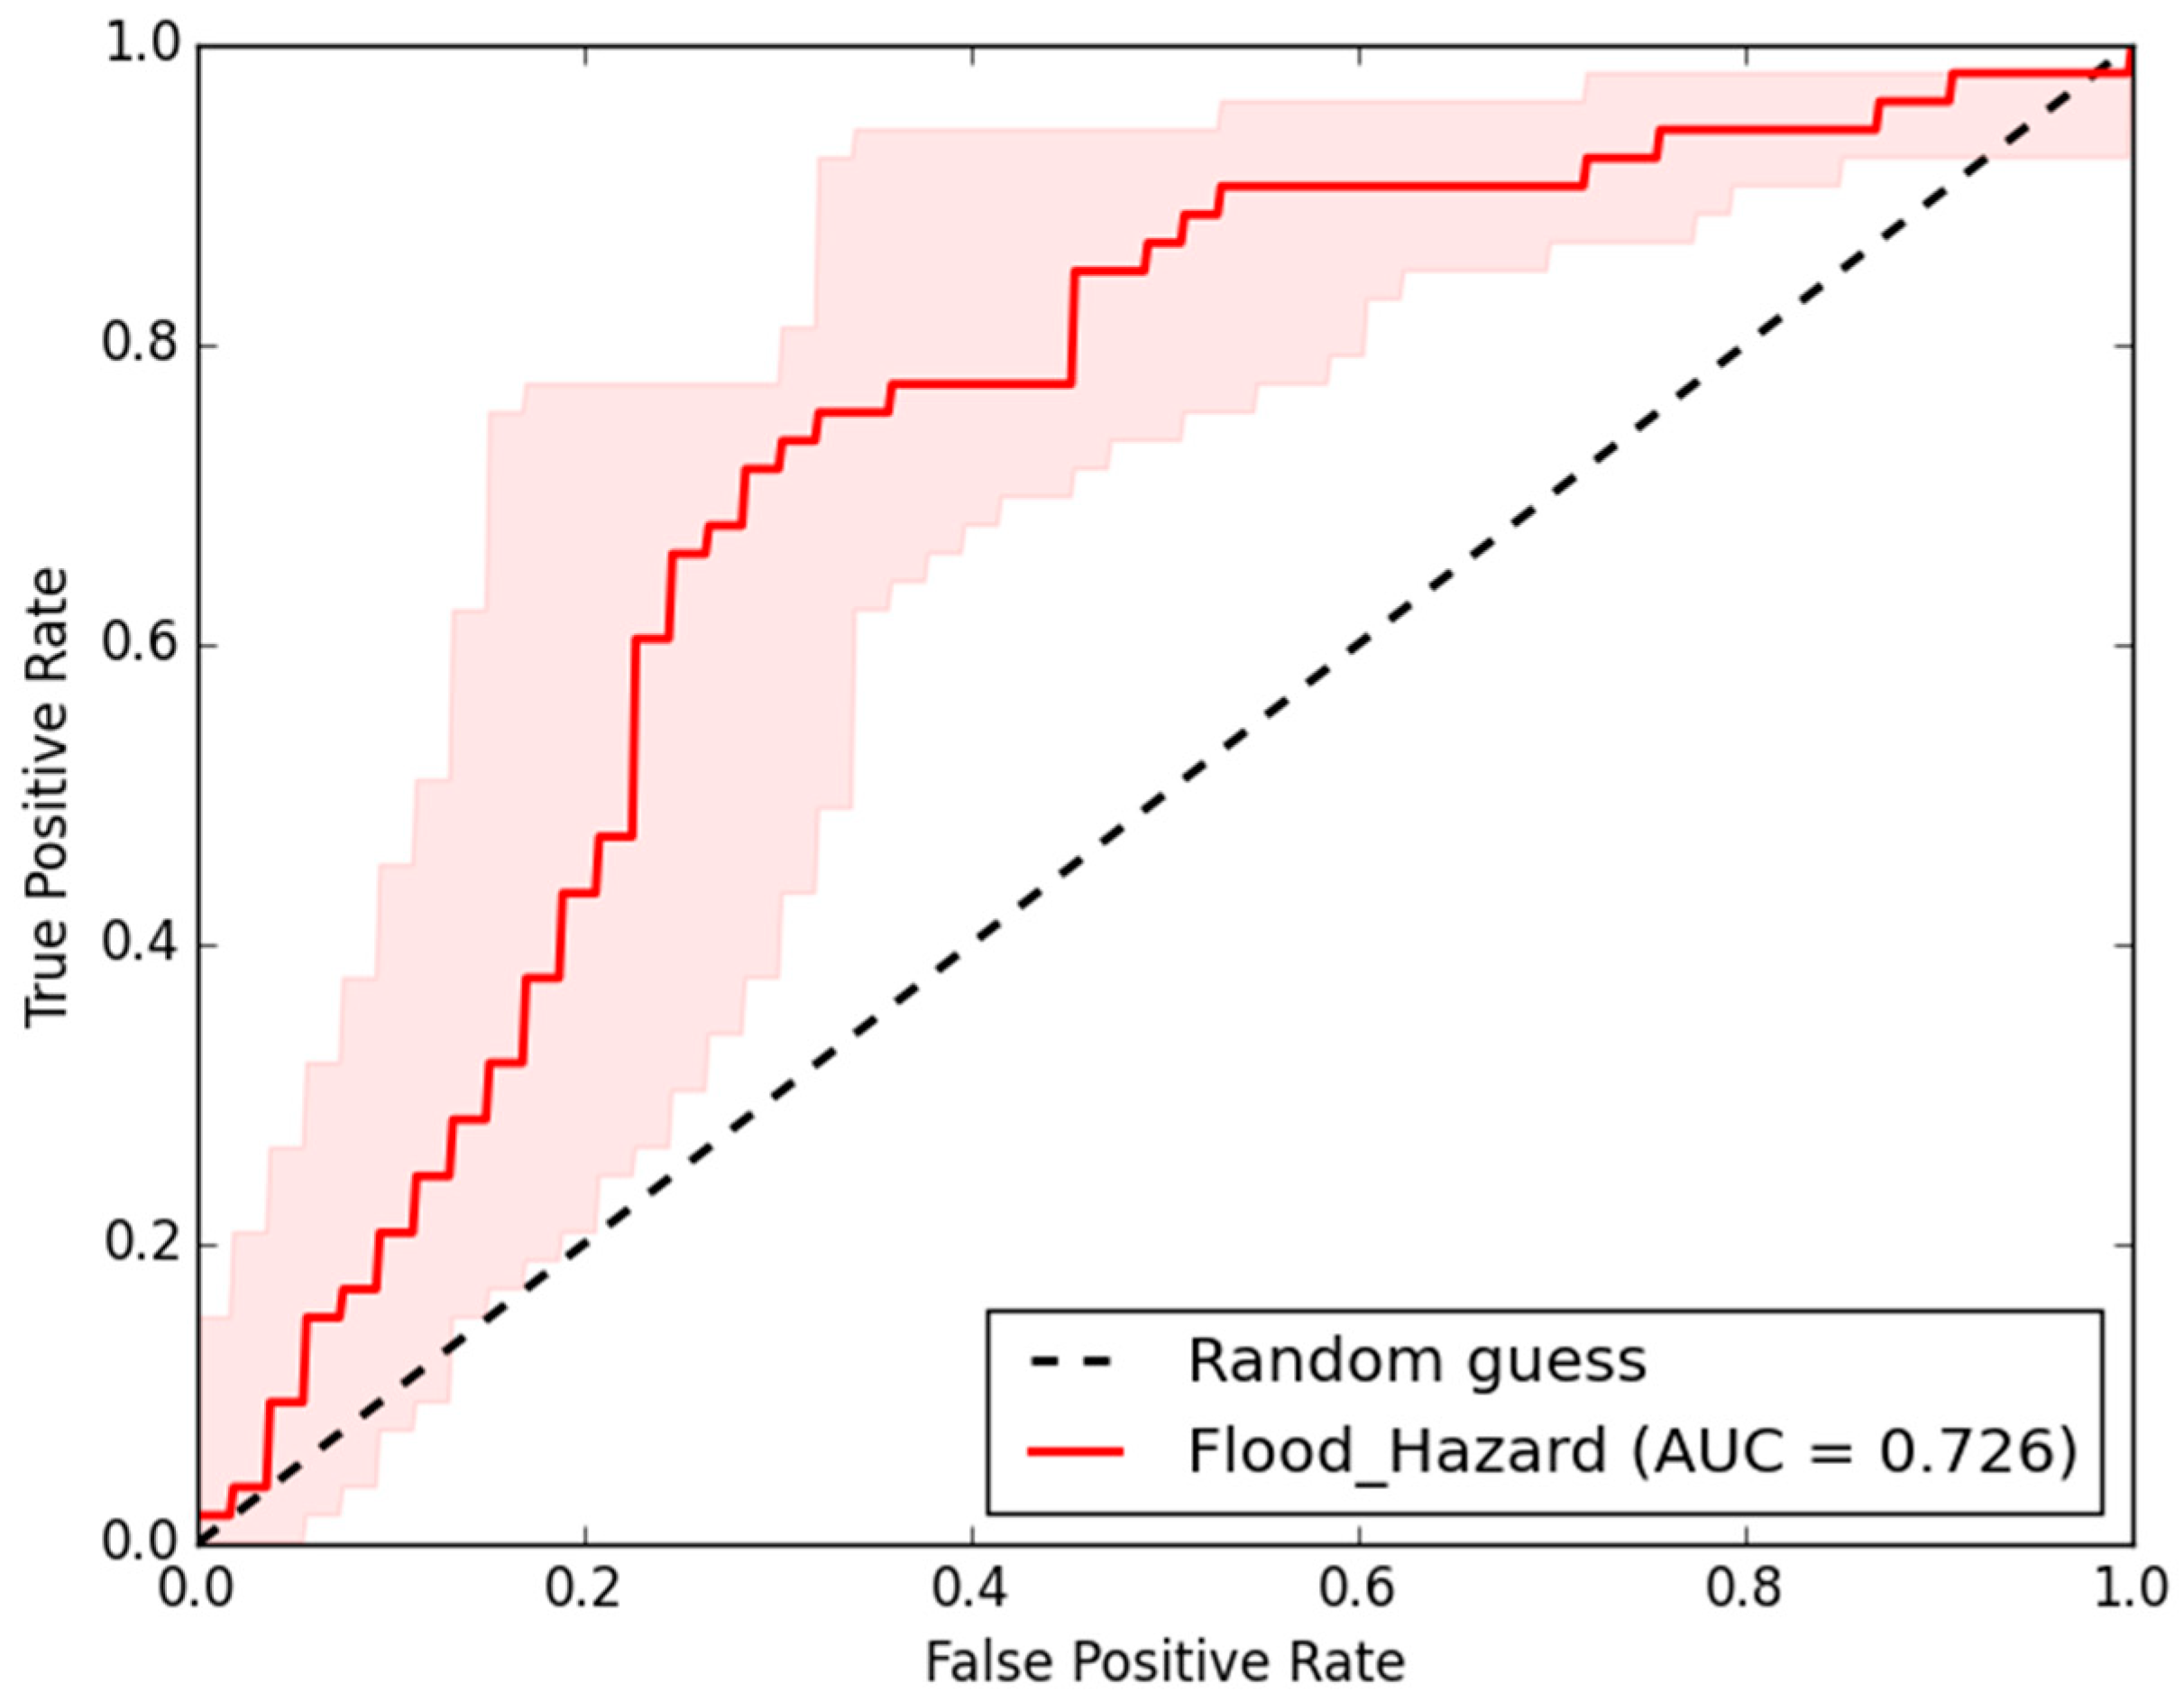
2.6. Validation of Flood Hazard

The receiver operating characteristic (ROC) curve method was used to evaluate the accuracy of the flood hazard layer. It is a graphical representation of the equilibrium between the true positive rate (TPR) against the false positive rate (FPR) of two parameters [38]. It is now widely used in flood hazard analysis to validate the accuracy of flood hazard maps [39]. If the ROC curve index value, which is the area under the ROC curve (AUC), is equal to one, the model is fully fit, while if this number is equal to 0.5, it shows that the model is inadequate. Many studies have demonstrated that values greater than 0.7 can be considered appropriate and acceptable [40].
This study collected responses from the field survey on flood impacts (with a ~50-year return period) were compared and correlated with the flood hazard layer using Spatial Data Modeller (SDM) tool extension in ArcGIS software. ArcSDM is a very efficient tool for adding categorical maps to produce a predictive map of where something of interest is likely to occur (https://www.ige.unicamp.br/sdm/ArcSDM10/, accessed on 18 February 2022). All the surveyed points were superimposed onto the flood hazard map with values of 1 and 0, where 1 was assigned to the points located in the high–very high flood hazard units. After randomly placing the set of numbers, 1 and 0, together with the displacement of the location of cut-points from 1 to 19, a Cartesian chart with a positive rate and the negative rate was plotted (Figure 3). The AUC value of the flood hazard layer was 0.726, representing an acceptable level and confirming that the flood hazard layer prepared in the study was not a random guess.

2.7. Assessment of Built-Up Elements at Flood Risk

Accurate quantification of elements at flood risk is essential for risk management [41]. Mapping risk elements for vast geographical areas, like the coastal plains of Tamil Nadu, is time-consuming and tedious [42]. At the same time, the maps of high-resolution built-up density can be used as a proxy to quantify the exposure to flood risk [43]. In this study, the built-up distribution of the coastal plains of Tamil Nadu was mapped from high-resolution ArcGIS and Google Earth images. The built-up distributions were classified into 30 categories based on the type of built-ups, density, floor, and planning aspects (Supplementary File S2). The different classes of built-up distributions were compared with the flood hazard layer, and a matrix was formed, where very dense buildings in the high flood-prone region were given the highest rank (5) and sparser buildings in the low flood-prone region were given the lowest rank (1). The ranks were then normalised by built-up area and rescaled into a 0–1 scale to understand the elements at flood risk.

3. Results

3.1. Hazard Analysis

The general purpose of flood hazard mapping is to determine the area and the probability of inundation during abnormal rainfall and weather events. In the study, the probability of flood is determined on a scale of 0–1, and the distribution is represented in Figure 4. Of 5020 villages/wards, 1464 reported the varying probability of flood hazard. We divided the entire coast of Tamil Nadu into three distinct zones: southern, central and northern coastal plains. The southern zone comprising Kanniyakumari, Thoothukudi, and Thirunelveli districts come under low to very low flood probability, except for some parts of the Kanniyakumari district and the surrounding regions of Thoothukudi city, where the flood probability is moderate. The central zone is marked by low flood hazards, mainly due to low seasonal rainfall and the presence of numerous flood management tanks. The northern zone has a very high probability of flood hazard, especially in most of the villages/wards of Chennai, Kancheepuram, Thiruvallur and Cuddalore districts. The coastal villages in Nagapattinam district also exhibit a moderate to high probability of flood hazard. Thus, the entire stretch between Thiruvallur and Nagapattinam districts is at a higher risk of flood hazard.

3.2. Surface Runoff Potential

The surface runoff potential was assessed based on their Curve Number, where a higher value (>90) denotes potential risks of flooding during heavy rainfall events (Figure 5). The surface runoff potential was derived from the NRCS-CN method which complements the interpretation of flood hazards in the coastal plains of Tamil Nadu. It also helps to identify the villages that have low probability for flood hazard but highly susceptible for major flood events [44].
A very low runoff potential is noted wherever beaches and sand bars are present. Such a low potential is predominately noticed in the southern coastal regions, especially in the Teri sands of Thoothukudi and Thirunelveli districts. In contrast, the Cauvery deltaic system and northern areas of Thoothukudi observe high runoff potentials due to fine clayey soils. Rainfall is the primary input for estimating the amount of surface runoff. From the long-term seasonal distribution of rainfall, presented in Figure 6, it can be observed that during the northeast monsoon season (October–December), the seasonal rainfall is comparatively high (more than 600 mm) in Chennai and its adjoining regions. As the proportion of impervious surfaces in Chennai and its suburban region is high, any heavy rain in this region will lead to peak discharge of surface runoff and cause flooding. The Cauvery deltaic region also receives more than 500 mm of seasonal rainfall, and with higher surface runoff potential, this region also falls at high risk of floods.

3.3. Vulnerability Assessment

The vulnerability is assessed using indirect census-based indicators and categorised into very low to very high, presented in Figure 7. Exposure-related indicators, such as population and household density, female-child population ratio, poor population, and primary workers, and capacity-related indicators, such as literacy rate, sanitation facilities, communication facilities and health care facilities, are very relevant to vulnerability assessments and are widely considered. The composite index of these indicators shows the level of vulnerability at a relative scale and can be used to understand socio-economic aspects of flood vulnerability. In general, vulnerability is very high in the northern parts and is most commonly noticed in Thiruvallur, Villupuram, Cuddalore and Cauvery delta regions. Indicators such as household density, the density of vulnerable populations (women and children) and socially weaker sections significantly contribute to very high vulnerability in a stretch between Pondicherry and Nagapattinam. The southern coastline of Tamil Nadu is relatively less vulnerable, and the low level of vulnerability is noticed in most of the villages of Ramanathapuram, Thoothukudi, Thirunelveli, and Kanniyakumari districts.

3.4. Perceptions of Deprived Communities

The extensive field survey of the area revealed that the flood risks in the coastal plains are highly localised, owing to variations in the topography, LU/LC, and socio-economic conditions. The field survey revealed that residents in low-lying areas of large cities experience an extremely high level of flood threats. Flood challenges like shortage of food and water, transportation cutoff, dysfunction of economy, crop loss, disease outbreak, and sanitation issues are very high in parts of the Chennai and Cauvery delta regions (Figure 8A). The damage caused to people, their buildings, properties, and livestock due to seasonal floods is very high in the surroundings of Chennai and Cuddalore. Kanniyakumari and Thirunelveli districts experience relatively lower levels of flood damage when compared to other coastal districts in Tamil Nadu (Figure 8B). Except for the dryer regions of Ramanathapuram, Thoothukudi and Tirunelveli districts, most of the deprived communities in coastal Tamil Nadu perceived high risk of flood exposure. The Chennai metropolitan area and its sub-urban regions are densely populated, and hence the exposure to flood damage is very high in this region (Figure 8C). People along the northern stretch of the Tamil Nadu coast have reported the loss of lives, livestock, and infrastructure due to floods. The reporting of major loss due to lives lost/disabled, complete/partial building damage, crop/livestock/poultry, property/vehicles, and vegetation/wetland loss is frequently noticed in the Cauvery delta–Cuddalore region (Figure 8D). About 40 percent of deprived communities, located mainly in the rural villages, reported that they had lost assets worth fewer than INR 10,000 through a major flood event. In contrast, the communities located in the major coastal cities reported their losses above INR 10,000. Strikingly, about 20 percent of communities reported no economic loss instead reported only disturbances (Figure 9A). Except for a few localities, most of the community perceived that the flood frequency is moderate to low (Figure 8E).
The government, NGOs, and independent volunteers play an active role in flood recovery and compensating flood induced losses (Figure 9B). About 2/3 of deprived communities reported receiving assistance mainly from government sources (~40 percent). The survey identified that only 10 percent of communities reported more than six months of flood recovery time, especially those who lost assets more than INR 100,000 in value. More than half of the respondents reported that they had recovered from flood impacts within a week (Figure 9C). This shows that even deprived communities have adapted to overcome typical seasonal flooding in the study area.

3.5. Assessment of Built-Up Elements at Flood Risk

The total built-up area in the coastal plains of Tamil Nadu is 2510.6 sq. km, and quantification of elements at risk for this wider built-up region is a challenging task. In this study, we have developed a matrix for built-up classifications and intersected with the flood hazard layer for indirect assessment of built-up elements at flood risk on a scale of 0 (very low) to 1 (very high). Table 3 summarises the built-up risk index with relative risk levels and their share of the total built-up area in the coastal plains of Tamil Nadu. About 10 percent of the total built-up area is exposed to high to very high flood risk. The spatial distribution of built-up elements at flood risk is presented in Figure 10. The larger zones of built-up elements at flood risk are presented as inset maps for better visualisations and comparisons (Figure 10A–G). Zone A, representing Chennai, and Zone B, representing the Puducherry and Cuddalore regions, are observed to have very high elements exposed to flood risk. Zone C, representing the Cauvery delta region, is observed to be subject to moderate to low risk. The other notable regions exposed to flood risk are Thoothukudi and Kayalpattinam.

4. Discussion

Due to its physiographic structure, drainage system, and seasonal rainfall character, floods are frequent in India’s eastern coastal plains [45]. The coastal plains of India are prone to flood events, and thousands of people are affected each year, a few hundred lives are lost, thousands are displaced, and many hectares of crops are devastated [46]. Being the most populous part of Tamil Nadu, the coastal plains of Tamil Nadu are considered to be one of the most vulnerable regions in southern India [47]. Flood hazard mapping based on image processing, GIS modelling and DDMP reports, potential runoff assessment based on the NRCS-CN method, seasonal rainfall analysis, indicator-based vulnerability assessment, and wider area field survey reflects that the northern coastal plains of Tamil Nadu stretching from Nagapattinam to Chennai are prone to flood hazard. In recent years, with changing climate conditions, floods have increased in many villages in this region. Cyclonic origin rainfall events are common in this region, resulting in frequent flooding. This region’s topography, land use, and vulnerability levels are highly favourable for severe flood risk. For example, about two weeks of continuous rainfall in 2005 caused major flood disasters in the low-lying areas of the Chennai–Cuddalore delta region [48]. In the first week of December 2015, unprecedented rains, the worst in the last 100 years, wreaked havoc in the Chennai–Cuddalore region. The flood disaster in the Chennai region in 2015 is considered the worst disaster of the century, impacting around 2 million people and costing around 400 lives [49]. Improper urban planning, inappropriate change in land use, encroachment on wetlands, improper drainage design, and structures are considered to be the causes. After Chennai, Cuddalore was the most flood-affected region in 2015, with around 60,000 hectares of agricultural land inundation. Recently, the cyclones Nivar and Burevi and continuous low depressions of 2021 brought heavy rainfall to Chennai–Cuddalore and the delta region, causing misery to low-lying communities. In contrast to the Chennai metropolitan region, the Villupuram–Cuddalore–Cauvery delta region is modestly covered by agricultural land use and even inundation of water less than one foot for a few days led to floods and associated crop loss. This is evidenced by the surface runoff potential layer and flood loss reported by the deprived communities.
Many studies have been attempted on floods and associated hazards of coastal regions of Tamil Nadu. Most of these studies have focused on the physical flood modelling of a selected portion, considering only a few controlling factors. In this study, we attempted to comprehensively assess the flood risk for the entire stretch of the coastal plain of Tamil Nadu [48,50,51,52,53,54,55,56,57,58]. Unlike other previous attempts, this study considered all the major dimensions of flood risks on a relative scale and presented the results at micro-administrative units. The study used datasets from multiple sources to generate flood hazard layers. Though a few attempts have been made to map the flood hazard using dense time-series multispectral data [59,60], the literature shows that C-band VH polarisation SAR data can effectively identify and quantify the partially submerged land use classes during a flood event [61]. Additionally, the Change Detection and Thresholding (CDAT) method has been proven to be successful for quantifying flood extent using pre- and post-flood SAR VH polarisation data [29,30].
In general, poor communities (mainly SC/ST communities) in the coastal areas are frequently affected by floods [62]; their socio-economic conditions affect their livelihoods severely [63]. Considering this, indirect vulnerability parameters were generated to study the socio-economic conditions of the exposed population. The results show that most of the villages in the northern coastal region are subject to high to very high socio-economic vulnerability. This region has a high population density with a high proportion of primary workers, women and children, and SC/ST communities [27]. Despite the widespread flood occurrences in northern coastal plains and high socio-economic vulnerability, the local communities have learned to adapt relatively well to the impact of floods [64]. This tendency is noticed in group interactions where most of the people in this region perceived low to moderate flood exposure and challenges. However, where suitable precautionary measures are not in place, localised extreme rainfall events continue to create havoc in this region. The assessment of surface runoff potential demonstrates the favourable nature of the soil and LU/LC for flooding.
Since built-up areas are an indicator for economic/human activities and associated losses, the detailed built-up mapping with different categories was compared with the flood hazard layer. The results clearly show that the northern coastal plains extending from Thiruvallur to Nagapattinam districts are subject to very high exposure of economic elements to flood hazards. The heavily urbanised settlements in Chennai and Puducherry regions fall under the very high flood risk category. The settlements in ten villages of Cuddalore district, namely Pinnattur, Tillaividangan, Kundiyamallur, Sirupalaiyur, Tirttanagari, Tanur, Adinarayanapuram, Alappakkam, Puvanikuppam, Kambalimedu that are located near Kadilam river and Thenpennai river are also categorised under very high flood risk. Thus, this study’s baseline database and outcomes will substantially assist local to state-level administrators in framing suitable planning measures to mitigate the effects of flood hazards and attain more sustainable development in the coastal plains of Tamil Nadu.
While several challenges were encountered during the data collection and analysis, the study’s significant limitations are the non-availability of recent census data, absence of a uniform flood database at village/ward level, and limited field survey locations.

5. Conclusions and Scope for Future Research

The physiography of the coastal plains of Tamil Nadu are susceptible to coastal floods, but the level of susceptibility varies significantly due to the interplay of risk factors. In this context, this study comprehensively assessed the flood risks in the coastal plains of Tamil Nadu at the levels of the micro-administrative unit. Unlike previous studies, we used data from multiple sources, such as field surveys, satellite data, and secondary data sources, to assess the study area’s flood risks. The study revealed that flooding is a spatially continuous phenomenon in the northern coastal plains of Tamil Nadu, but it is more localised in the southern coastal plains. The hazard analysis shows that the most flood-prone villages/wards are in the Chennai–Cuddalore region. The surface runoff potential and vulnerability parameters indicate that the Cauvery delta region is also susceptible to flood risks. The high proportion of denser settlements and the predominance of primary activities further exacerbate the hazard situation in the delta region. Thus, the entire northern coastal plains of Tamil Nadu form a severe flood risk region. The field survey in these regions revealed that flooding causes severe damage to their crops and frequently lead to economic loss.
The results of this micro-level study help to synthesise different dimensions of flood disaster risks and implement location-based risk reduction measures. The information generated through this study can be used as baseline data to identify the micro-administrative units in which suitable structural and non-structural measures can be taken up. The villages for which high to very high flood hazards were reported in the Chennai–Cuddalore–Cauvery delta regions should be prioritised with respect to undertaking flood mitigation measures and effective disaster preparedness strategies. The systematic assessment of hazard and vulnerability aspects of flood risk and delineation of built-up regions at flood risk could help planners and emergency managers devise better disaster management strategies.
Any policies for flood risk management should be considered aspects to effectively improve the livelihoods of deprived communities. The field data collected through this study help to understand the perceptions of deprived communities in coastal Tamil Nadu. Therefore, the study’s outcomes can be used to conduct further research to formulate policies accordingly. The study results can also be used to devise early warning systems and establish evacuation/aid assistance zones in most flood hazard villages. The methodology proposed in this study can be extended to all flood-prone regions of the country for effective flood risk management.

Supplementary Materials

The following supporting information can be downloaded at: https://www.mdpi.com/article/10.3390/earth3010023/s1, Table S1: Major rainfall events in the different regions of coastal pains of Tamil Nadu; File S1: Goggle Earth Engine Script for extracting flood from Sentinel-1 images; File S2: Classifications code of built-ups.

Author Contributions

Conceptualisation: K.B., K.A.P., S.P., K.K. and R.A.V.; Methodology: S.L.G., K.B., K.K., S.P. and S.S.; Software: S.L.G., K.B. and K.A.P.; Validation: K.B., S.P., K.K. and S.S.; Formal analysis: K.B., S.L.G. and R.A.V.; Investigation: K.B., S.L.G. and R.A.V.; Resources: K.B.; Data curation: S.L.G. and K.B.; Writing—original draft preparation: K.B., K.A.P., R.A.V. and S.L.G.; Writing—review and editing: K.B., K.A.P., S.L.G., L.R., S.P., S.S. and K.K.; Visualisation: K.B., S.L.G., L.R. and R.A.V.; Supervision: K.B.; Project administration: S.L.G. and K.B.; Funding acquisition: K.B. All authors have read and agreed to the published version of the manuscript.

Funding

This research received external funding. The study was supported by the Indian Council of Social Science Research (Grant No. 02/163/2019–2020/MN/RP) for the field surveys.

Institutional Review Board Statement

Not Applicable.

Informed Consent Statement

Informed consent was obtained from all subjects involved in the study.

Data Availability Statement

Due to the authors’ organisation’s policy and procedures, the data/database will not currently be available to the public. Once the project restriction period has ended (2 years), it will be available as open source.

Acknowledgments

The authors would like to thank Balasundareshwaran, A., Annaidasan, K., Kannan, R., Nethaji, S., Arumugam, S., Abarna, R. and Shebo for their assistance in the primary survey and preparation of the built-up database. The authors acknowledge ESA for Sentinel data and Google Earth Engine for free computational resources.

Conflicts of Interest

The authors declare no conflict of interest.

References

  1. Tsakiris, G. Flood risk assessment: Concepts, modelling, applications. Nat. Hazards Earth Syst. Sci. 2014, 14, 1361–1369. [Google Scholar] [CrossRef] [Green Version]
  2. Balica, S.F.; Wright, N.G.; van der Meulen, F. A flood vulnerability index for coastal cities and its use in assessing climate change impacts. Nat. Hazards 2012, 64, 73–105. [Google Scholar] [CrossRef] [Green Version]
  3. Khan, A.; Chatterjee, S. Coastal Risk Assessment: A Comprehensive Framework for the Bay of Bengal; Springer: Cham, Switzerland, 2018; ISBN 9783319699929. [Google Scholar]
  4. Small, C.; Nicholls, R.J. A global analysis of human settlement in coastal zones. J. Coast. Res. 2003, 19, 584–599. [Google Scholar]
  5. Suriya, S.; Mudgal, B.V.; Nelliyat, P. Flood damage assessment of an urban area in Chennai, India, part I: Methodology. Nat. Hazards 2012, 62, 149–167. [Google Scholar] [CrossRef]
  6. Dhar, O.N.; Nandargi, S. Hydrometeorological aspects of floods in India. Nat. Hazards 2003, 28, 1–33. [Google Scholar] [CrossRef]
  7. Singh, Y.T.; Das, R.R.; Kumar, D.S.V.; Krishnan, P.; Ramachandran, P.; Ramachandran, R. Rapid assessment of coastal biodiversity post-2015 chennai flood, India. EnvironmentAsia 2019, 12, 91–103. [Google Scholar] [CrossRef]
  8. Winsemius, H.C.; Van Beek, L.P.H.; Jongman, B.; Ward, P.J.; Bouwman, A. A framework for global river flood risk assessments. Hydrol. Earth Syst. Sci. 2013, 17, 1871–1892. [Google Scholar] [CrossRef] [Green Version]
  9. Ahmed, C.F.; Kranthi, N. Flood vulnerability assessment using geospatial techniques: Chennai, India. Indian J. Sci. Technol. 2018, 11, 1–13. [Google Scholar] [CrossRef] [Green Version]
  10. Uddin, K.; Matin, M.A.; Meyer, F.J. Operational flood mapping using multi-temporal Sentinel-1 SAR images: A case study from Bangladesh. Remote Sens. 2019, 11, 1581. [Google Scholar] [CrossRef] [Green Version]
  11. Joshi, P.M. Urban flood mapping by geospatial technique a case study of surat city. IOSR J. Eng. 2012, 2, 43–51. [Google Scholar] [CrossRef]
  12. Singh, A.K.; Sharma, A.K. GIS and a remote sensing based approach for urban flood-plain mapping for the Tapi catchment, India. IAHS-AISH Publ. 2009, 331, 389–394. [Google Scholar]
  13. Patel, D.; Dholakia, M. Identifying probable submergence area of surat city using digital elevation model and geographical information system. World Appl. Sci. J. 2010, 9, 461–466. [Google Scholar]
  14. Zope, P.E.; Eldho, T.I.; Jothiprakash, V. Impacts of urbanisation on flooding of a coastal urban catchment: A case study of Mumbai City, India. Nat. Hazards 2015, 75, 887–908. [Google Scholar] [CrossRef]
  15. Demirkesen, A.C.; Evrendilek, F.; Berberoglu, S.; Kilic, S. Coastal flood risk analysis using landsat-7 ETM+ imagery and SRTM DEM: A case study of Izmir, Turkey. Environ. Monit. Assess. 2007, 131, 293–300. [Google Scholar] [CrossRef]
  16. Van de Sande, B.; Lansen, J.; Hoyng, C. Sensitivity of coastal flood risk assessments to digital elevation models. Water 2012, 4, 568–579. [Google Scholar] [CrossRef]
  17. Ehrlich, D.; Melchiorri, M.; Florczyk, A.J.; Pesaresi, M.; Kemper, T.; Corbane, C.; Freire, S.; Schiavina, M.; Siragusa, A. Remote sensing derived built-up area and population density to quantify global exposure to five natural hazards over time. Remote Sens. 2018, 10, 1378. [Google Scholar] [CrossRef] [Green Version]
  18. Jariwala, R.C.; Samtani, B.K. The estimation of flood and its control by section modification in Mithi and Kankara tributaries at Surat. Int. J. Eng. Res. Appl. 2012, 2, 862–867. [Google Scholar]
  19. Padhee, S.K.; Nikam, B.R.; Dutta, S.; Aggarwal, S.P. Using satellite-based soil moisture to detect and monitor spatiotemporal traces of agricultural drought over Bundelkhand region of India. GISci. Remote Sens. 2017, 54, 144–166. [Google Scholar] [CrossRef]
  20. Kvočka, D.; Falconer, R.A.; Bray, M. Flood hazard assessment for extreme flood events. Nat. Hazards 2016, 84, 1569–1599. [Google Scholar] [CrossRef] [Green Version]
  21. Papathoma-Köhle, M.; Schlögl, M.; Fuchs, S. Vulnerability indicators for natural hazards: An innovative selection and weighting approach. Sci. Rep. 2019, 9, 15026. [Google Scholar] [CrossRef]
  22. Singh, S.R.; Eghdami, M.R.; Singh, S. The concept of social vulnerability: A review from disasters perspectives. Int. J. Interdiscip. Multidiscip. Stud. 2014, 1, 71–82. [Google Scholar]
  23. UNISDR. 2009 UNISDR Terminology on Disaster Risk Reduction; UNISDR: Geneva, Switzerland, 2009. [Google Scholar]
  24. De Brito, M.M.; Evers, M.; Delos Santos Almoradie, A. Participatory flood vulnerability assessment: A multi-criteria approach. Hydrol. Earth Syst. Sci. 2018, 22, 373–390. [Google Scholar] [CrossRef] [Green Version]
  25. Bahinipati, C.S.; Rajasekar, U.; Acharya, A.; Patel, M. Flood-induced loss and damage to textile industry in Surat City, India. Environ. Urban ASIA 2017, 8, 170–187. [Google Scholar] [CrossRef]
  26. Xia, J.; Falconer, R.A.; Lin, B.; Tan, G. Numerical assessment of flood hazard risk to people and vehicles in flash floods. Environ. Model. Softw. 2011, 26, 987–998. [Google Scholar] [CrossRef]
  27. Karuppusamy, B.; Leo George, S.; Anusuya, K.; Venkatesh, R.; Thilagaraj, P.; Gnanappazham, L.; Kumaraswamy, K.; Balasundareshwaran, A.H.; Balabaskaran Nina, P. Revealing the socio-economic vulnerability and multi-hazard risks at micro-administrative units in the coastal plains of Tamil Nadu, India. Geomat. Nat. Hazards Risk 2021, 12, 605–630. [Google Scholar] [CrossRef]
  28. Prasad, K.A.; Ottinger, M.; Wei, C.; Leinenkugel, P. Assessment of coastal aquaculture for India from Sentinel-1 SAR time series. Remote Sens. 2019, 11, 357. [Google Scholar] [CrossRef] [Green Version]
  29. Long, S.; Fatoyinbo, T.E.; Policelli, F. Flood extent mapping for Namibia using change detection and thresholding with SAR. Environ. Res. Lett. 2014, 9, 035002. [Google Scholar] [CrossRef]
  30. Clement, M.A.; Kilsby, C.G.; Moore, P. Multi-temporal synthetic aperture radar flood mapping using change detection. J. Flood Risk Manag. 2018, 11, 152–168. [Google Scholar] [CrossRef]
  31. Brocca, L.; Liersch, S.; Melone, F.; Moramarco, T.; Volk, M. Application of a model-based rainfall-runoff database as efficient tool for flood risk management. Hydrol. Earth Syst. Sci. 2013, 17, 3159–3169. [Google Scholar] [CrossRef] [Green Version]
  32. Elfeki, A.; Masoud, M.; Niyazi, B. Integrated rainfall–runoff and flood inundation modeling for flash flood risk assessment under data scarcity in arid regions: Wadi Fatimah basin case study, Saudi Arabia. Nat. Hazards 2017, 85, 87–109. [Google Scholar] [CrossRef]
  33. Verma, S.; Verma, R.K.; Mishra, S.K.; Singh, A.; Jayaraj, G.K. A revisit of NRCS-CN inspired models coupled with RS and GIS for runoff estimation. Hydrol. Sci. J. 2017, 62, 1891–1930. [Google Scholar] [CrossRef]
  34. Balasubramani, K. Physical resources assessment in a semi-arid watershed: An integrated methodology for sustainable land use planning. ISPRS J. Photogramm. Remote Sens. 2018, 142, 358–379. [Google Scholar] [CrossRef]
  35. Balasubramani, K.; Gomathi, M.; Bhaskaran, G.; Kumaraswamy, K. GIS-based spatial multi-criteria approach for characterization and prioritization of micro-watersheds: A case study of semi-arid watershed, South India. Appl. Geomat. 2019, 11, 289–307. [Google Scholar] [CrossRef]
  36. Cutter, S.L.; Mitchell, J.T.; Scott, M.S. Revealing the vulnerability of people and places: A case study of Georgetown County, South Carolina. Hazards Vulnerabil. Environ. Justice 2012, 90, 83–114. [Google Scholar] [CrossRef]
  37. Mohapatra, R. Community Based Planning in Post-Disaster Reconstruction: A Case Study of Tsunami Affected Fishing Communities in Tamil Nadu Coast of India. Ph.D. Thesis, University of Waterloo, Waterloo, ON, Canada, 2009. [Google Scholar]
  38. Unal, I. Defining an optimal cut-point value in ROC analysis: An alternative approach. Comput. Math. Methods Med. 2017, 2017, 3762651. [Google Scholar] [CrossRef] [PubMed]
  39. Avand, M.; Moradi, H.R.; Lasboyee, M.R. Spatial prediction of future flood risk: An approach to the effects of climate change. Geoscience 2021, 11, 25. [Google Scholar] [CrossRef]
  40. Sepehri, M.; Malekinezhad, H.; Hosseini, S.Z.; Ildoromi, A.R. Assessment of flood hazard mapping in urban areas using entropy weighting method: A case study in Hamadan city, Iran. Acta Geophys. 2019, 67, 1435–1449. [Google Scholar] [CrossRef]
  41. Ehrlich, D.; Kemper, T.; Pesaresi, M.; Corbane, C. Built-up area and population density: Two Essential Societal Variables to address climate hazard impact. Environ. Sci. Policy 2018, 90, 73–82. [Google Scholar] [CrossRef] [PubMed]
  42. Dobson, J.E.; Bright, E.A.; Coleman, P.R.; Durfee, R.C.; Worley, B.A. Landscan: A global piopulation database for estimating populations at risk. Photogramm. Eng. Remote Sens. 2000, 66, 849–857. [Google Scholar]
  43. Hallegatte, S.; Green, C.; Nicholls, R.J.; Corfee-Morlot, J. Future flood losses in major coastal cities. Nat. Clim. Chang. 2013, 3, 802–806. [Google Scholar] [CrossRef]
  44. Merz, B.; Elmer, F.; Thieken, A.H. Significance of “high probability/low damage” versus “low probability/high damage” flood events. Nat. Hazards Earth Syst. Sci. 2009, 9, 1033–1046. [Google Scholar] [CrossRef]
  45. Merz, B.; Kreibich, H.; Schwarze, R.; Thieken, A. Review article “assessment of economic flood damage”. Nat. Hazards Earth Syst. Sci. 2010, 10, 1697–1724. [Google Scholar] [CrossRef]
  46. De, U.S.; Dube, R.K.; Prakasa Rao, G.S. Extreme weather events over india in the last 100 years. J. Indian Geophys. Union 2005, 9, 173–187. [Google Scholar]
  47. Sudha Rani, N.N.V.; Satyanarayana, A.N.V.; Bhaskaran, P.K. Coastal vulnerability assessment studies over India: A review. Nat. Hazards 2015, 77, 405–428. [Google Scholar] [CrossRef]
  48. Mahendra, R.S.; Mohanty, P.C.; Bisoyi, H.; Kumar, T.S.; Nayak, S. Assessment and management of coastal multi-hazard vulnerability along the Cuddalore-Villupuram, east coast of India using geospatial techniques. Ocean Coast. Manag. 2011, 54, 302–311. [Google Scholar] [CrossRef]
  49. Ramasamy, S.M.; Vijay, A.; Dhinesh, S. Geo-anthropogenic aberrations and Chennai floods: 2015, India. Nat. Hazards 2018, 92, 443–477. [Google Scholar] [CrossRef]
  50. Anandan, C.; Sasidhar, P. Changes in coastal morphology at Kalpakkam, East Coast, India due to 26 december 2004 Sumatra tsunami. Geomat. Nat. Hazards Risk 2011, 2, 183–192. [Google Scholar] [CrossRef]
  51. Sheik Mujabar, P.; Chandrasekar, N. Coastal erosion hazard and vulnerability assessment for southern coastal Tamil Nadu of India by using remote sensing and GIS. Nat. Hazards 2013, 69, 1295–1314. [Google Scholar] [CrossRef]
  52. Mani Murali, R.; Ankita, M.; Amrita, S.; Vethamony, P. Coastal vulnerability assessment of Puducherry coast, India, using the analytical hierarchical process. Nat. Hazards Earth Syst. Sci. 2013, 13, 3291–3311. [Google Scholar] [CrossRef] [Green Version]
  53. Muthusankar, G.; Lakshumanan, C.; Pradeep-Kishore, V.; Eswaramoorthi, S.; Jonathan, M.P. Classifying inundation limits in SE coast of India: Application of GIS. Nat. Hazards 2013, 65, 2401–2409. [Google Scholar] [CrossRef]
  54. Gopinath, G.; Løvholt, F.; Kaiser, G.; Harbitz, C.B.; Srinivasa Raju, K.; Ramalingam, M. Bhoop singh impact of the 2004 Indian Ocean tsunami along the Tamil Nadu coastline: Field survey review and numerical simulations. Nat. Hazards 2014, 72, 743–769. [Google Scholar] [CrossRef]
  55. Kaliraj, S.; Chandrasekar, N.; Magesh, N.S. Evaluation of coastal erosion and accretion processes along the southwest coast of Kanyakumari, Tamil Nadu using geospatial techniques. Arab. J. Geosci. 2015, 8, 239–253. [Google Scholar] [CrossRef]
  56. Parthasarathy, A.; Natesan, U. Coastal vulnerability assessment: A case study on erosion and coastal change along Tuticorin, Gulf of Mannar. Nat. Hazards 2015, 75, 1713–1729. [Google Scholar] [CrossRef]
  57. Priya Rajan, S.M.; Nellayaputhenpeedika, M.; Tiwari, S.P.; Vengadasalam, R. Mapping and analysis of the physical vulnerability of coastal Tamil Nadu. Hum. Ecol. Risk Assess. 2020, 26, 1879–1895. [Google Scholar] [CrossRef]
  58. Thirumurugan, P.; Krishnaveni, M. Flood hazard mapping using geospatial techniques and satellite images—A case study of coastal district of Tamil Nadu. Environ. Monit. Assess. 2019, 191, 193. [Google Scholar] [CrossRef] [PubMed]
  59. Huang, C.; Chen, Y.; Wu, J. Mapping spatio-temporal flood inundation dynamics at large riverbasin scale using time-series flow data and MODIS imagery. Int. J. Appl. Earth Obs. Geoinf. 2014, 26, 350–362. [Google Scholar] [CrossRef]
  60. Mohammadi, A.; Costelloe, J.F.; Ryu, D. Application of time series of remotely sensed normalised difference water, vegetation and moisture indices in characterising flood dynamics of large-scale arid zone floodplains. Remote Sens. Environ. 2017, 190, 70–82. [Google Scholar] [CrossRef]
  61. Manavalan, R.; Rao, Y.S.; Mohan, B.K. Comparative flood area analysis of C-band VH, VV, and L-band HH polarisations SAR data. Int. J. Remote Sens. 2017, 38, 4645–4654. [Google Scholar] [CrossRef]
  62. Adelekan, I.O. Vulnerability of poor urban coastal communities to flooding in Lagos, Nigeria. Environ. Urban. 2010, 22, 433–450. [Google Scholar] [CrossRef] [Green Version]
  63. Brouwer, R.; Akter, S.; Brander, L.; Haque, E. Socioeconomic vulnerability and adaptation to environmental risk: A case study of climate change and flooding in Bangladesh. Risk Anal. 2007, 27, 313–326. [Google Scholar] [CrossRef] [PubMed] [Green Version]
  64. Svetlana, D.; Radovan, D.; Ján, D. The Economic impact of floods and their importance in different regions of the world with emphasis on Europe. Procedia Econ. Financ. 2015, 34, 649–655. [Google Scholar] [CrossRef] [Green Version]
Figure 1. Location of the study area with micro-watersheds and major disaster events. The inset figures (AC) represent the northern, central, and southern coastal plains of Tamil Nadu, respectively.
Earth 03 00023 g001
Figure 2. Schematic representation of the methodology adopted in the study.
Earth 03 00023 g002
Figure 3. ROC curve for validating flood hazard layer.
Earth 03 00023 g003
Figure 4. Flood hazard in the coastal plains of Tamil Nadu. The level of flood hazard in the northern, central, and southern parts of the study area are represented in inset figures (AC), respectively.
Earth 03 00023 g004
Figure 5. Surface runoff potential in the coastal plains of Tamil Nadu. The higher values of curve number denote more surface runoff potential. The spatial distributions of curve number in the northern, central, and southern parts of the study area are represented in inset figures (AC), respectively.
Earth 03 00023 g005
Figure 6. Average seasonal rainfall (1980–2017) in the coastal plains of Tamil Nadu.
Earth 03 00023 g006
Figure 7. Spatial distribution of composite socio-economic vulnerability in the coastal plains of Tamil Nadu (modified from Balasubramani et al., 2021). The distributions of socio-economic vulnerability in the northern, central, and southern parts of the coastal plains of Tamil Nadu are represented in inset figures (AC), respectively.
Earth 03 00023 g007
Figure 8. Spatial distribution of perceptions on (A) flood challenges, (B) flood damage, (C) flood exposure, (D) flood loss, and (E) flood frequency.
Earth 03 00023 g008
Figure 9. Public perceptions about (A) average economic loss, (B) source of assistance for recovery, and (C) average period taken for early recovery from the flood impacts.
Earth 03 00023 g009
Figure 10. Spatial distribution of built-up area flood risk assessment. The inset figures depict (A) Chennai region, (B) Cuddalore region (C) Nagapattinam region (D) Manamelkudi region (E) Ramanathapuram region (F) Thoothukudi region (G) Kanyakumari region.
Earth 03 00023 g010
Table 1. Window periods for Sentinel-1 median images extraction before and after the major floods.
YearBefore FloodAfter Flood
201510 October 2015 to 23 October 201510 November 2015 to 15 December 2015
201810 October 2018 to 23 October 201801 November 2018 to 18 December 2018
202010 November 2020 to 23 November 202024 November 2020 to 10 December 2020
2020–202110 November 2020 to 23 November 202006 January 2021 to 17 January 2021
20211 May 2021 to 20 May 2021 27 May 2021 to 02 June 2021
20211 October 2021 to 20 October 202116 November 2021 to 26 November 2021
Table 2. Indicators extracted from Census of India datasets for vulnerability assessment at micro-administrative units.
CategoriesSub-Categories
Population DensityTotal Population
Household densityTotal Households
Female Population RatioTotal Female Population
Child Population RatioTotal Child Population (0–6 Years)
Literacy RateTotal Literacy Population
Socially Weaker PopulationScheduled Castes Population Scheduled Tribes Population
Primary WorkersMain Cultivators
Main Agricultural Labours
Marginal Cultivators
Marginal Agricultural Labours
Sanitation FacilitiesTap Water Treated
Community Toilet Complex Community Waste Disposal System
Communication Facilities
Access to Essential Healthcare Facilities
Telephone
Mobile Phone Coverage
Public Bus Service
Community Health Center
Primary Health Center
Health Sub-Centre
Maternity and Child Welfare Center
Hospital Allopathic (including district/taluk headquarter hospitals)
Hospital Alternative Medicine
Dispensary and Family Welfare Center
Table 3. Built-up risk index with relative risk levels and their share to the total built-up area in coastal plains of Tamil Nadu.
Risk IndexRelative Risk LevelBuilt-Up Area (sq. km)% Share to Total Built-Up Area
>0.61Very high107.174.26
0.51–0.6High106.734.25
0.31–0.5Moderate245.59.77
0.21–0.3Low222.638.86
<0.2Very Low167.266.66
Publisher’s Note: MDPI stays neutral with regard to jurisdictional claims in published maps and institutional affiliations.

