


Abstract
This study presents a mathematics-based simulation model for designing, analyzing, and optimizing offshore green hydrogen stations powered by solar photovoltaic systems, applicable to any location worldwide. Developed in Python, the model integrates environmental, physical, and technological parameters to simulate and forecast hydrogen production via water electrolysis using alkaline (ALK) or proton exchange membrane (PEM) electrolyzers, combined with an adiabatic compressor that enhances energy storage and facilitates integration into smart grids. The five-phase modular methodology includes timeframe definition; estimation of solar electricity generation based on solar trajectory and the geographic orientation of photovoltaic panels; performance modeling of electrolyzers and compressors; and the integration of all components into a cohesive system. A case study demonstrates the model’s real-world applicability. Results from the Gulf of Cadiz case study show a substantial increase in solar energy capture in offshore environments due to reduced atmospheric pollution and sea-surface reflection. The reflected component is modeled as a function of sea-surface flatness. This reflection increases the daily average solar irradiance received by the photovoltaic panels by 8.44%. Under the modeled 2026 conditions and equivalent irradiance levels, the ALK electrolyzer produces 3.347% more hydrogen than the PEM electrolyzer. In addition, a 20% increase in electrolyzer efficiency raises hydrogen production by 32.35%, whereas the same increase in compressor efficiency improves production by 0.758%. These impacts directly correlate with proportional reductions in the photovoltaic panel surface area, driven by increased electricity generation capacity, which translates into smaller infrastructure needs. The model enables quantitative evaluation of trade-offs among solar irradiance, component performance, and system design. It supports cost reduction through optimized sizing and improved integration. This approach contributes to lowering the Levelized Cost of Electricity (LCOE) and promoting the viability of marine-based green hydrogen deployment.
1. Introduction
Renewable energy sources, derived from virtually inexhaustible or naturally regenerating resources [1,2], include solar, wind, hydroelectric, geothermal, biomass, tidal, and wave energy [3,4]. Their global deployment has expanded rapidly in recent decades [5], driven by climate change concerns and the need to reduce greenhouse gas emissions [6,7]. By the end of 2023, installed renewable capacity reached 3.86 TW, representing a 127.55% increase since 2014 [8]. Beyond offering environmental benefits over fossil fuels [9,10], renewables also strengthen energy security by reducing dependence on imported and volatile resources [11].
Photovoltaic (1.42 TW) and wind energy (1.01 TW) dominate global installed capacity [8]. Offshore wind has shown particularly strong growth, with a cumulative increase of 760.80% over the last decade [8], highlighting the strategic relevance of ocean-based energy systems. Although marine energy potential is estimated to be between 45,000 and 130,000 TWh annually, only 508 MW of capacity is currently exploited [12]. Floating solar technology is emerging as a solution to land scarcity and rising energy demand, especially in coastal regions [13,14,15]. Compared to land-based systems, floating photovoltaics offer efficiency gains of 11–13% due to water-induced cooling, while also preserving land use [13,14,15].
Hydrogen has become a key energy carrier in the transition to low-carbon systems [16]. Renewable-powered water electrolysis is considered a promising green hydrogen production technology [16,17], although hydrogen can also be produced through alternative pathways [18]. Once produced, hydrogen can be stored underground [19] or supplied for industrial applications that support the decarbonization of sectors currently dependent on fossil fuels [20]. Its high energy density and versatility also make it suitable for hard-to-decarbonize sectors [21]. However, hydrogen deployment remains affected by production costs, infrastructure barriers, refueling configurations, and market-related factors [17,22,23]. The renewable electricity required for hydrogen production can be supplied by wind or solar energy systems [16,17]. When renewable generation is located offshore, additional technical and logistical challenges must be considered because these installations operate under harsh marine conditions and face corrosion, demanding structural requirements, and greater operation and maintenance complexity [13,24].
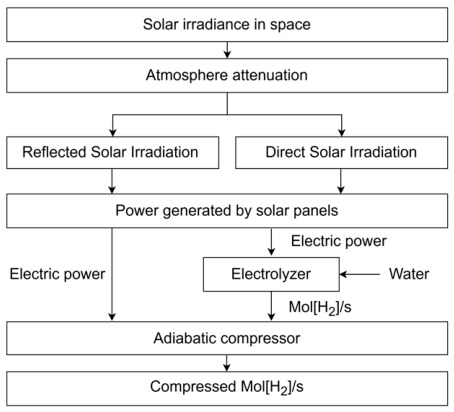
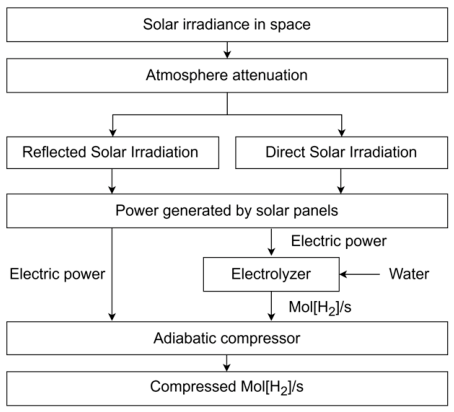
Within this context, the present study proposes a mathematics-based model, conceived as a globally applicable framework, to analyze the integration of floating solar systems with green hydrogen production stations [25,26]. As shown schematically in Figure 1, the model evaluates how solar irradiance, atmospheric attenuation, marine-surface reflection, component efficiencies, electrolyzer type (ALK or PEM), and compression conditions influence hydrogen output and photovoltaic surface-area requirements. The model aims to optimize system efficiency and reduce structural complexity and costs.
Figure 1.
Block diagram of a green hydrogen production station powered by solar energy.
2. Materials and Methods
The study presents a mathematics-based model to simulate and assess the performance of an offshore solar-powered green hydrogen production station [27]. The framework is designed to be globally applicable and adaptable to different locations, environmental conditions, and technological configurations. The model is implemented in Python 3.12 and incorporates temporal discretization to represent average daily hours, and average yearly days variations in solar radiation and system behavior.
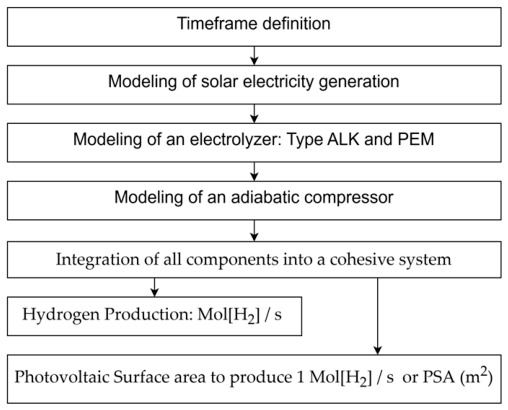
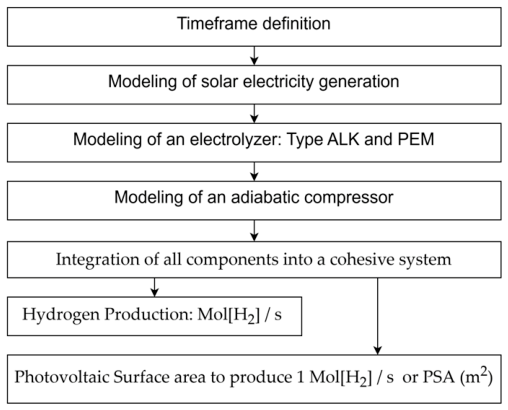
The methodology follows a structured five-phase approach (Figure 2). First, a temporal framework is defined. Second, solar power generation is modeled by estimating the sun’s position relative to the photovoltaic panels and calculating the total perpendicular irradiance received on their surface (). This irradiance results from the combination of direct solar radiation () and the component reflected by the marine surface () due to the sea surface’s flatness and reflectivity, while accounting for atmospheric attenuation. Third, hydrogen production is modeled for two electrolyzer technologies (ALK and PEM), considering their efficiency, heating value selection, and operating pressure. Fourth, an adiabatic compressor model estimates the additional energy required for hydrogen storage at the desired pressure.
Figure 2.
High-level flow diagram used for the development and simulation of the proposed mathematics-based technical model for a green hydrogen production station powered by solar energy.
Finally, all subsystems are integrated into a unified energy balance. This allows the model to determine either the hydrogen production achievable for a given photovoltaic area or the surface area required to meet a specific production target and storage pressure. Water consumption associated with electrolysis is also estimated. Overall, the framework enables multivariable parametric analysis and supports system sizing and performance optimization under varying environmental and technological conditions.
3. Results
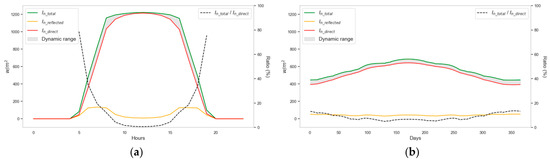
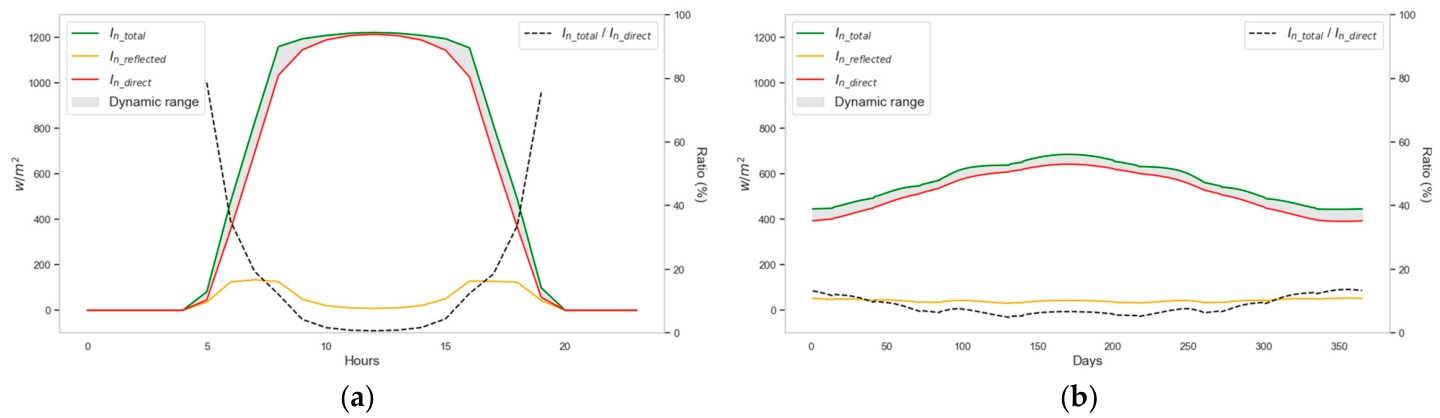
The mathematics-based technical model [27] was applied to a case study involving a solar-powered green hydrogen production station planned for installation in the Gulf of Cádiz (Spain) considering the solar estimation for 2026. This coastal location was selected due to its direct access to the open sea, its protected bay environment suitable for prototype testing, and its environmental relevance. Simulation results (Figure 3) indicate that the reflection of solar radiation on the marine surface produces a measurable amplification of the irradiance received perpendicularly by the photovoltaic panels. In the analyzed case, this reflective contribution leads to an average increase of 20.0% in received irradiance when evaluated on an hourly basis and 8.44% when averaged over the days of the year.
Figure 3.
: Solar irradiance, expressed in (), averaged over (a) the hours of the day, (b) over the days of the year.
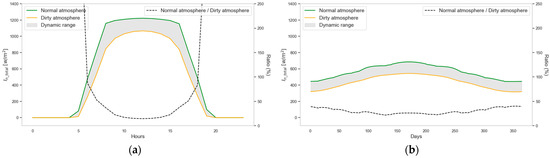
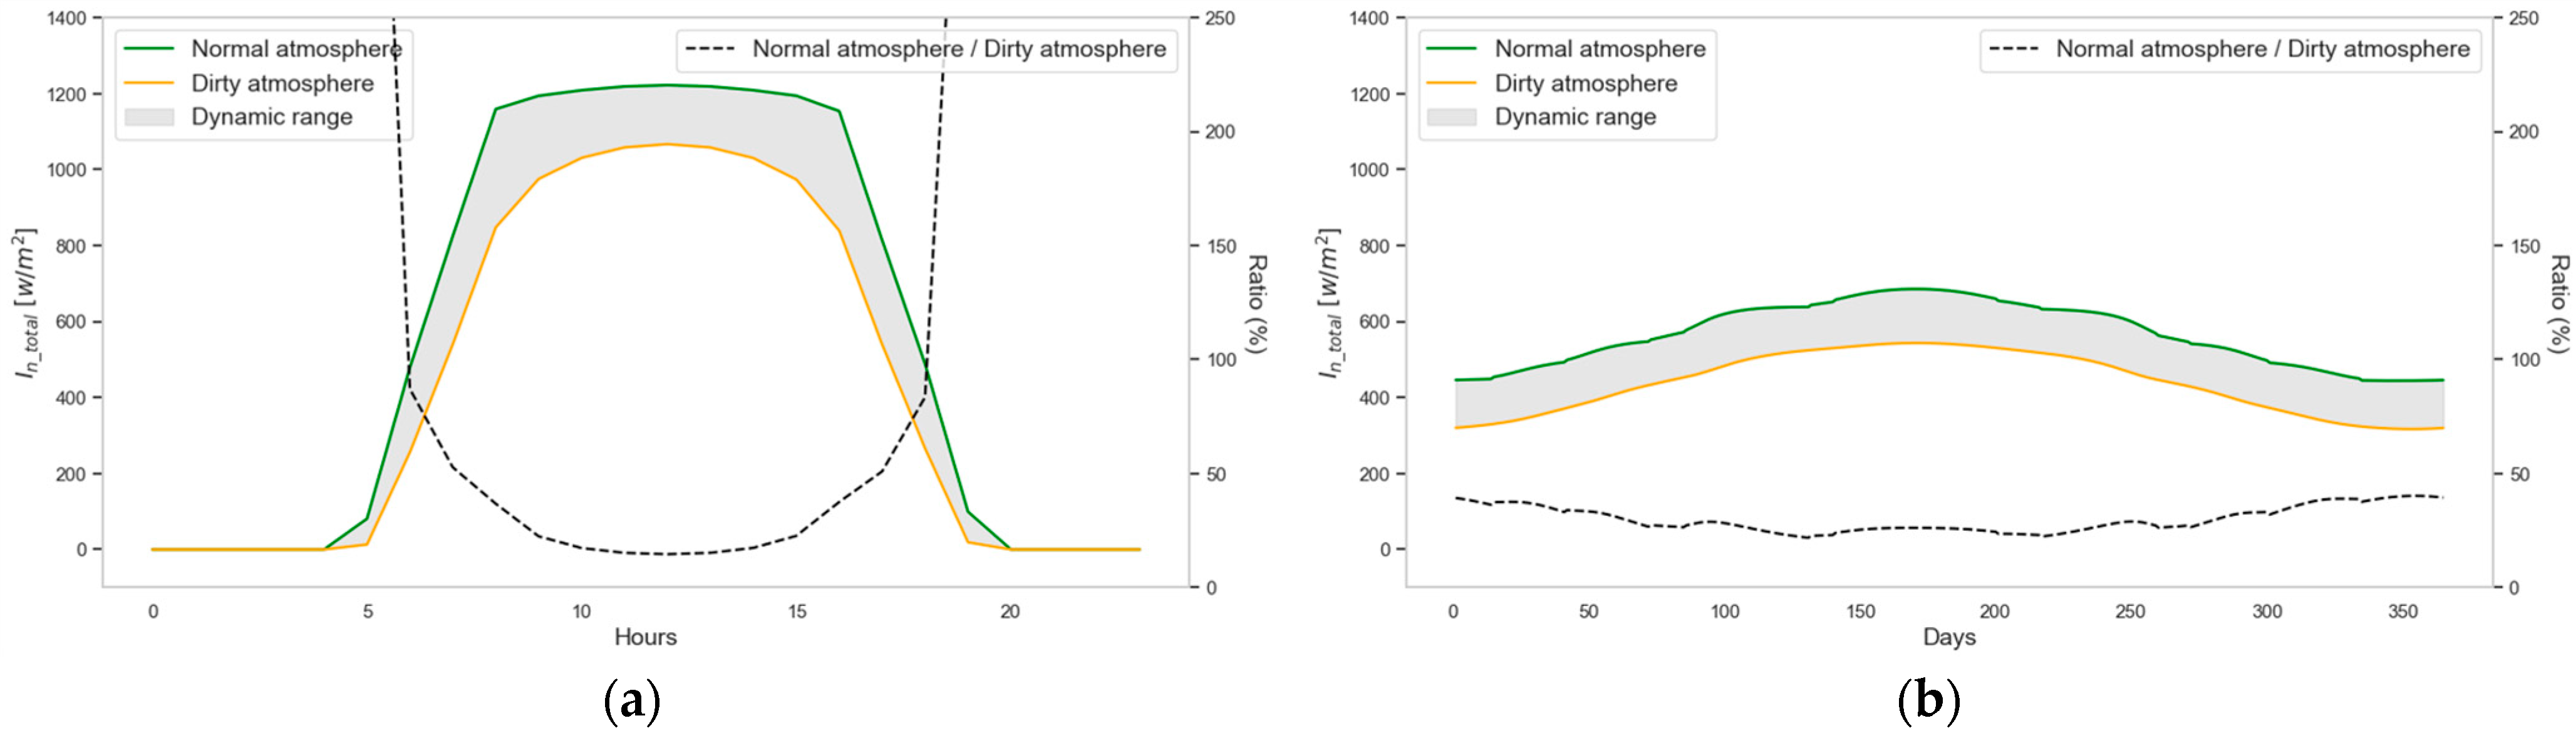
These gains directly enhance hydrogen production capacity or, alternatively, reduce the photovoltaic surface area required to achieve a given production target. Atmospheric attenuation was also quantified (Figure 4). Under degraded atmospheric quality conditions, average attenuation values of 32.29% (hourly basis) and 22.92% (daily basis) were estimated. However, simulations were conducted assuming standard atmospheric quality, consistent with offshore installation conditions.
Figure 4.
Contribution of air quality levels to , expressed in , due to the atmospheric attenuation, (a) expressed in hours per day, (b) expressed in days per year.
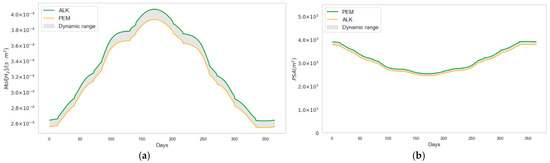
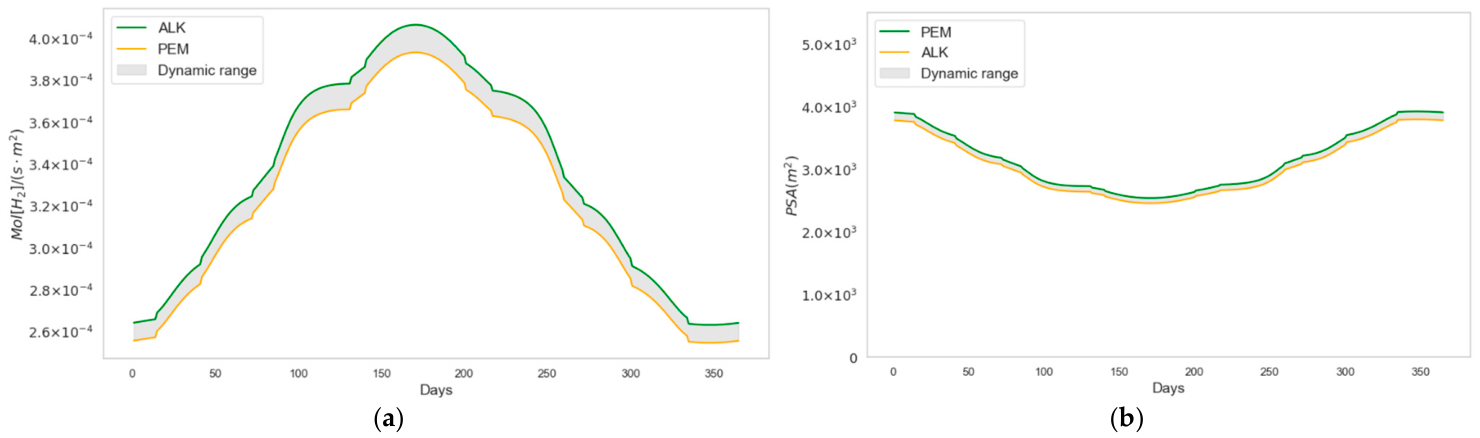
Regarding electrolyzer technologies, the results show that, for the year 2026 and under equivalent irradiance conditions, the ALK electrolyzer exhibits slightly higher efficiency than the PEM alternative. This difference translates into an estimated 3.347% increase in hydrogen production capacity () and an associated 3.239% reduction in required photovoltaic surface area to produce 1 mol of hydrogen per second (PSA ()) when using ALK technology (Figure 5a and Figure 5b, respectively). The performance gap is expected to narrow over time as technological efficiencies converge.
Figure 5.
Contribution of electrolyzer type to system performance and PSA: (a) shown in days–year; (b) photovoltaic surface area () to produce 1 shown in days–year.
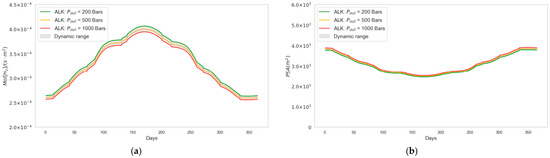
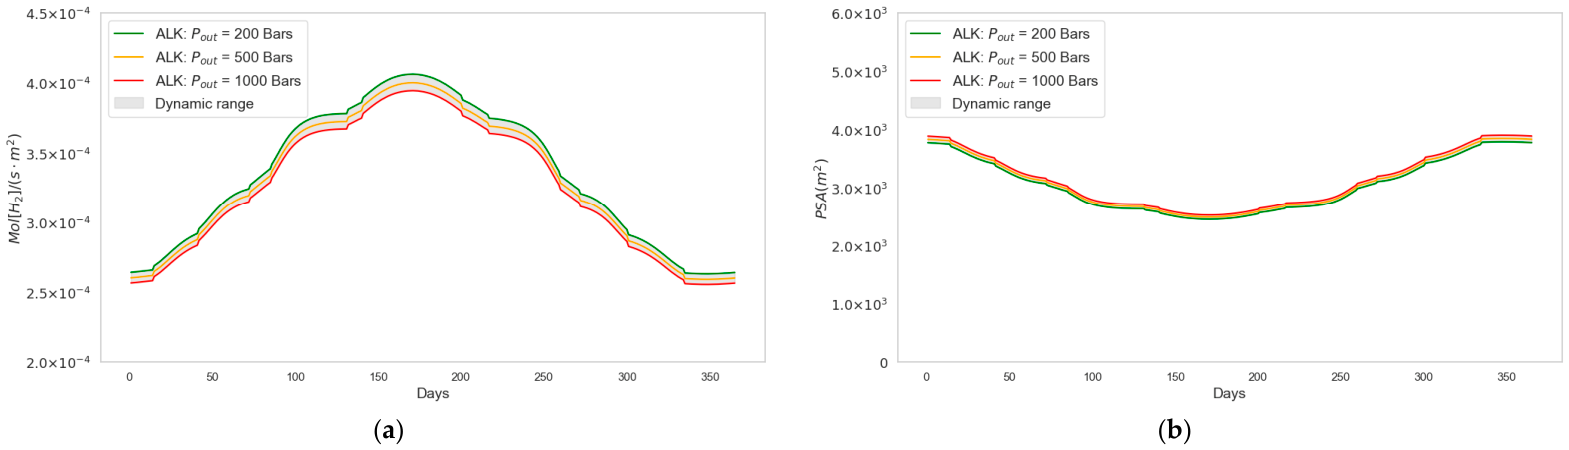
Compression parameters were found to have a measurable but comparatively smaller impact. Reducing hydrogen output pressure from 1000 bar to 200 bar results in an estimated 2.89% increase in hydrogen production capacity () or a 2.89% reduction in PSA (Figure 6a and Figure 6b, respectively).
Figure 6.
Contribution of hydrogen output pressure to system performance and PSA: (a) shown in days–year; (b) photovoltaic surface area () to produce 1 shown in days–year.
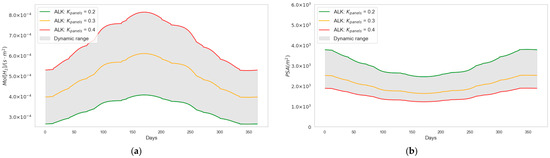
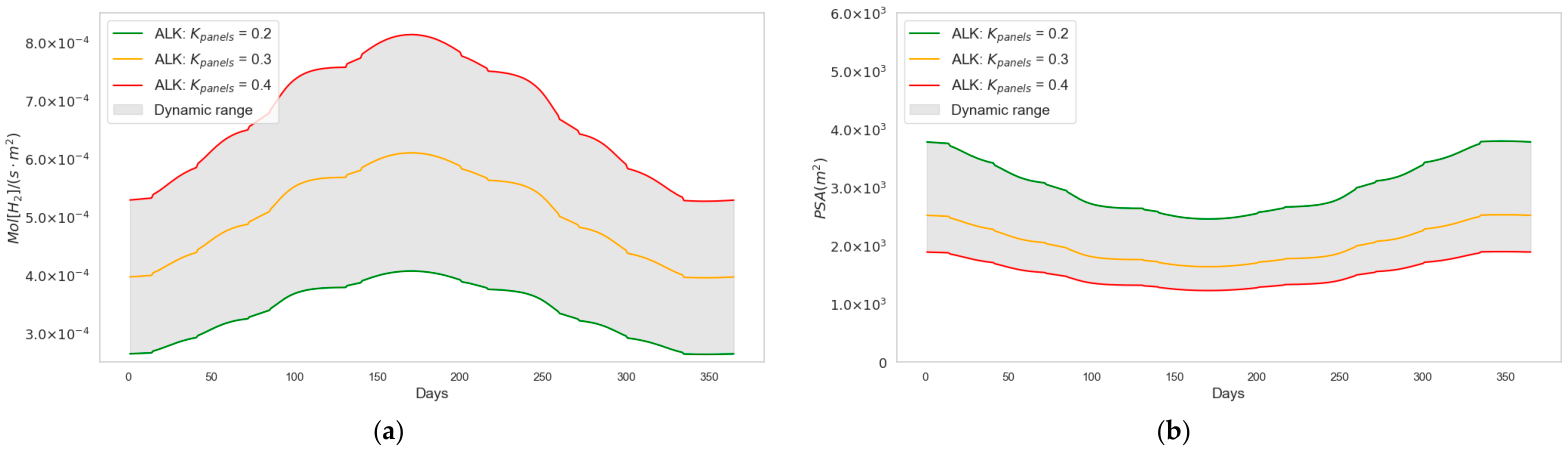
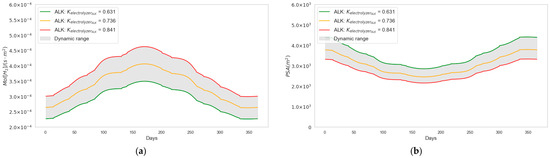
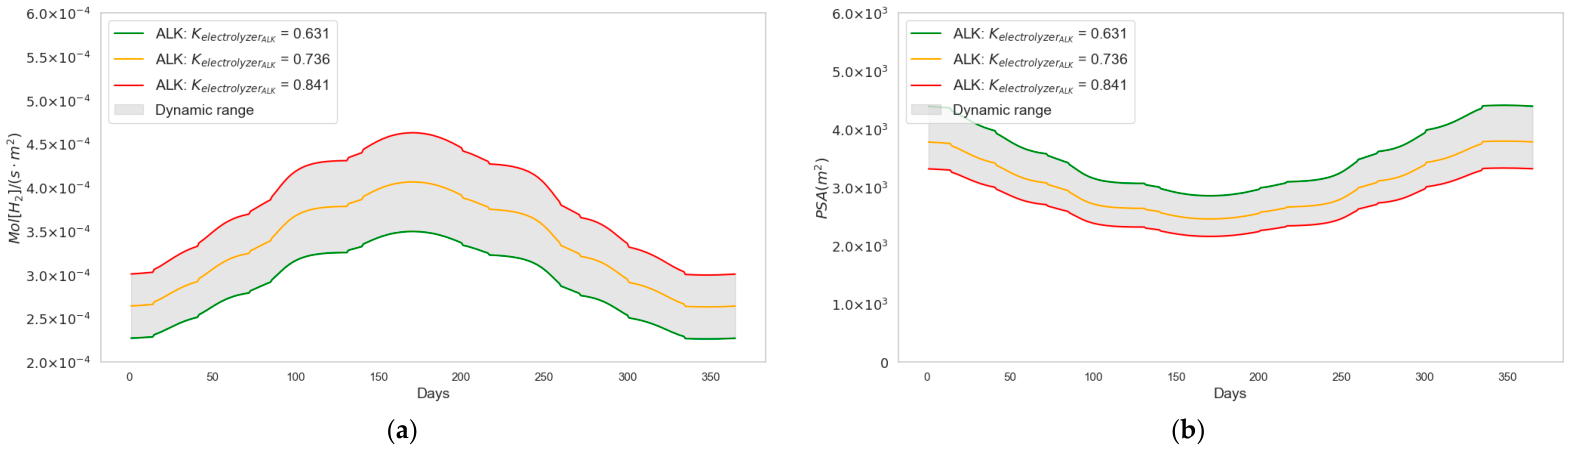
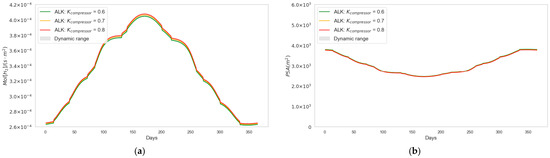
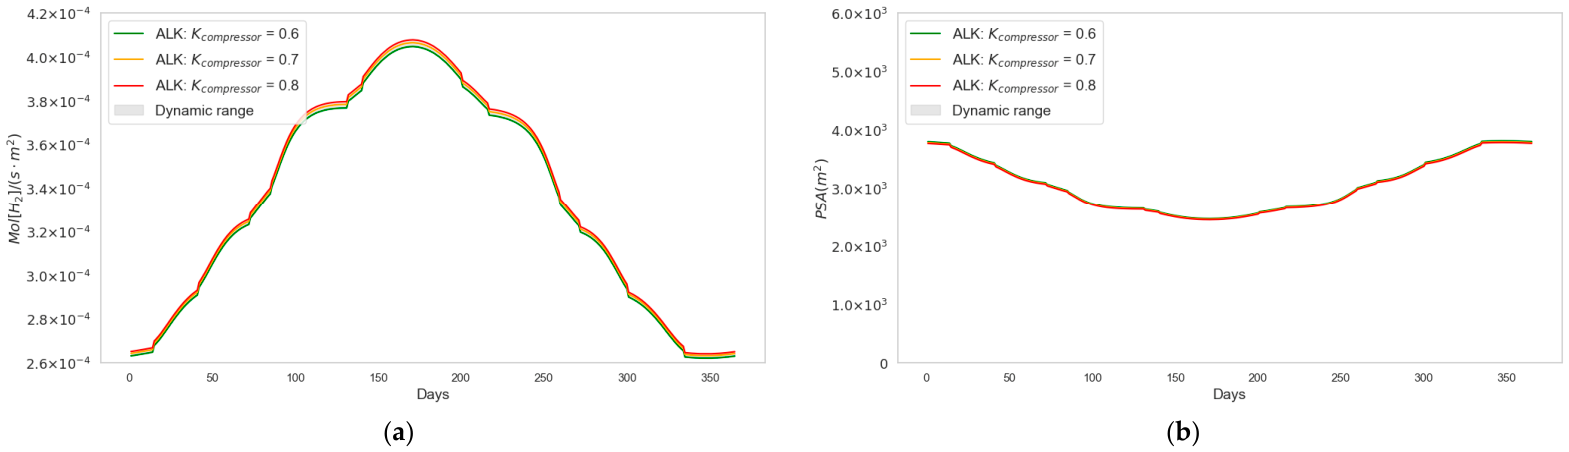
Component efficiencies have a cumulative effect along the entire production chain. Doubling the photovoltaic panel conversion efficiency (Figure 7) either doubles hydrogen production capacity (Figure 7a) or halves the required PSA (Figure 7b). Similarly, a 20% increase in electrolyzer efficiency leads to a 32.35% increase in hydrogen output (Figure 8a) or an equivalent reduction in PSA (Figure 8b), while improvements in compressor efficiency (Figure 9) produce smaller but still positive effects (0.758%).
Figure 7.
Contribution of photovoltaic efficiency to system performance and PSA: (a) shown in days–year; (b) photovoltaic surface area () to produce 1 shown in days–year.
Figure 8.
Contribution of electrolyzer efficiency to system performance and PSA: (a) shown in days–year; (b) photovoltaic surface area () to produce 1 shown in days–year.
Figure 9.
Contribution of adiabatic compressor efficiency to system performance and PSA: (a) shown in days–year; (b) photovoltaic surface area () to produce 1 shown in days–year.
The previous results depend entirely on the geographical location where the mathematical model is evaluated, owing to the influence of solar irradiance, and on the year in which the analysis is conducted, given the evolving efficiency of ALK and PEM electrolyzers [27].
4. Conclusions
The mathematics–based model was applied to a case study in the Gulf of Cádiz (Spain) to evaluate the performance of a solar–powered offshore green hydrogen station for 2026. The simulations show that solar radiation () reflected by the marine surface significantly increases the perpendicular irradiance received by the photovoltaic panels, producing an average gain of 8.44% on a daily basis. This amplification can either enhance hydrogen production capacity or reduce the photovoltaic surface area () required to achieve a specified production target. Atmospheric attenuation was also quantified, with estimated average reductions of 22.92% (daily) under degraded air quality conditions, although the analyzed offshore case assumed standard atmospheric quality.
Regarding electrolyzer technologies, results for the year 2026 indicate that the ALK configuration provides slightly higher efficiency than PEM under equivalent irradiance conditions. This translates into a 3.347% increase in hydrogen production capacity and a 3.239% reduction in required photovoltaic surface area when using ALK technology. In contrast, reducing storage pressure from 1000 bar to 200 bar yields a more moderate improvement of approximately 2.89% in production or surface reduction.
The study further demonstrates the cumulative impact of component efficiencies along the production chain. Improvements in photovoltaic, electrolyzer, and compressor efficiencies directly increase hydrogen output or proportionally decrease the required photovoltaic area. Additionally, panel misalignment relative to the solar trajectory reduces irradiance, with azimuth deviations having a greater negative effect than inclination offsets. Together, these results confirm the model’s capability to quantify how environmental, technological, and operational variables determine offshore green hydrogen station performance.
Author Contributions
Conceptualization, A.G.-R., P.F.-A. and D.V.; methodology, A.G.-R., P.F.-A., A.d.B. and D.V.; software, A.G.-R.; validation, A.G.-R., P.F.-A., A.d.B. and D.V.; formal analysis, A.G.-R.; investigation A.G.-R., P.F.-A. and D.V.; resources, A.G.-R., P.F.-A. and A.d.B.; data curation, A.G.-R.; writing—original draft preparation, A.G.-R., P.F.-A. and D.V.; writing—review and editing, A.G.-R., P.F.-A., A.d.B. and D.V.; supervision, P.F.-A. and D.V. All authors have read and agreed to the published version of the manuscript.
Funding
This research received no external funding.
Institutional Review Board Statement
Not applicable.
Informed Consent Statement
Not applicable.
Data Availability Statement
The original contributions presented in the study are included in the article; further inquiries can be directed to the corresponding authors.
Conflicts of Interest
The authors declare no conflicts of interest.
Abbreviations
The following abbreviations are used in this manuscript:
| ALK | Alkaline electrolyzers |
| H2 | Hydrogen |
| Intotal | Total Normal Irradiation Received on the Panels |
| In_direct | Normal and Direct Solar Irradiation Received on the Panels |
| In_reflected | Normal and Reflected Solar Irradiation Received on the Panels |
| Kpanels | Conversion Efficiency Coefficient of the Panels |
| Kelectrolyzer | Electrolyzer efficiency constant |
| KCompressor | Compressor efficiency constant |
| LCOE | Levelized Cost of Electricity |
| m | Meters |
| m2 | Squared meters |
| Mol | Mol |
| MW | Megawatts |
| PEM | Proton exchange membrane |
| PSA | Photovoltaic panel surface area (m2) to produce 1 mol of hydrogen per second. Equivalent to |
| s | Seconds |
| TW | Terawatts |
| TWh | Terawatts–hour |
| W | Watts |
References
- Armaroli, N.; Balzani, V. The Future of Energy Supply: Challenges and Opportunities. Angew. Chem. Int. Ed. 2007, 46, 52–66. [Google Scholar] [CrossRef] [Scilit] [PubMed]
- Shaner, M.R.; Atwater, H.A.; Lewis, N.S.; Mcfarland, E.W. A Comparative Technoeconomic Analysis of Renewable Hydrogen Production Using Solar Energy. Energy Environ. Sci. 2016, 9, 2354. [Google Scholar] [CrossRef] [Scilit]
- Martin, S.S.; Chebak, A. Concept of Educational Renewable Energy Laboratory Integrating Wind, Solar and Biodiesel Energies. Int. J. Hydrogen Energy 2016, 41, 21036–21046. [Google Scholar] [CrossRef] [Scilit]
- Mohtasham, J. Review Article-Renewable Energies. Energy Proc. 2015, 74, 1289–1297. [Google Scholar] [CrossRef] [Scilit]
- Kumar, C.R.; Majid, M.A. Renewable Energy for Sustainable Development in India: Current Status, Future Prospects, Challenges, Employment, and Investment Opportunities. Energy Sustain. Soc. 2020, 10, 33. [Google Scholar] [CrossRef] [Scilit]
- Ridzuan, N.H.A.M.; Marwan, N.F.; Khalid, N.; Ali, M.H.; Tseng, M.L. Effects of Agriculture, Renewable Energy, and Economic Growth on Carbon Dioxide Emissions: Evidence of the Environmental Kuznets Curve. Resour. Conserv. Recycl. 2020, 160, 104879. [Google Scholar] [CrossRef] [Scilit]
- Arrow, K.; Bolin, B.; Costanza, R.; Dasgupta, P.; Folke, C.; Holling, C.S.; Jansson, B.O.; Levin, S.; Mäler, K.G.; Perrings, C.; et al. Economic Growth, Carrying Capacity, and the Environment. Ecol. Econ. 1995, 15, 91–95. [Google Scholar] [CrossRef] [Scilit]
- IRENA. Renewable Energy Statistics; IRENA: Masdar City, United Arab Emirates, 2024. [Google Scholar]
- Shuba, E.S.; Kifle, D. Microalgae to Biofuels: ‘Promising’ Alternative and Renewable Energy, review. Renew. Sustain. Energy Rev. 2018, 81, 743–755. [Google Scholar] [CrossRef] [Scilit]
- Dincer, I.; Acar, C. A Review on Clean Energy Solutions for Better Sustainability. Int. J. Energy Res. 2015, 39, 585–606. [Google Scholar] [CrossRef] [Scilit]
- Johansson, B. Security Aspects of Future Renewable Energy Systems—A Short Overview. Energy 2013, 61, 598–605. [Google Scholar] [CrossRef] [Scilit]
- IRENA. Fostering a Blue Economy: Offshore Renewable Energy; IRENA: Masdar City, United Arab Emirates, 2020. [Google Scholar]
- Liu, G.; Guo, J.; Peng, H.; Ping, H.; Ma, Q. Review of Recent Offshore Floating Photovoltaic Systems. J. Mar. Sci. Eng. 2024, 12, 1942. [Google Scholar] [CrossRef] [Scilit]
- Sahu, A.; Yadav, N.; Sudhakar, K. Floating Photovoltaic Power Plant: A Review. Renew. Sustain. Energy Rev. 2016, 66, 815–824. [Google Scholar] [CrossRef] [Scilit]
- Djalab, A.; Djalab, Z.; El Hammoumi, A.; Tina, G.M.; Motahhir, S.; Laouid, A.A. A Comprehensive Review of Floating Photovoltaic Systems: Tech Advances, Marine Environmental Influences on Offshore PV Systems, and Economic Feasibility Analysis. Sol. Energy 2024, 277, 112711. [Google Scholar] [CrossRef] [Scilit]
- Zhou, Y.; Li, R.; Lv, Z.; Liu, J.; Zhou, H.; Xu, C. Green Hydrogen: A Promising Way to the Carbon-Free Society. Chin. J. Chem. Eng. 2022, 43, 2–13. [Google Scholar] [CrossRef] [Scilit]
- Fernández-Arias, P.; Antón-Sancho, Á.; Lampropoulos, G.; Vergara, D. On Green Hydrogen Generation Technologies: A Bibliometric Review. Appl. Sci. 2024, 14, 2524. [Google Scholar] [CrossRef] [Scilit]
- Leila, M.; Khan, Q.; Yasser, A.; Abubakar, M.A.; Wang, L.; Alajmei, S.; Shafiq, M.U. Hydrogen Production from Coalbed Methane Using Catalytic and Non-Catalytic Conversion Pathways. Energies 2026, 19, 2607. [Google Scholar] [CrossRef] [Scilit]
- Lou, Y.; Wang, L.; Shafiq, M.U.; Wang, H.; Magsar, O.; Meng, X. Modeling fidelity upon competitive adsorption for underground hydrogen storage in depleted shale reservoirs: A minireview. Adv. Geo-Energy Res. 2026, 19, 242–249. [Google Scholar] [CrossRef] [Scilit]
- Vergara, D.; Fernández-Arias, P.; Lampropoulos, G.; Antón-Sancho, Á. Hydrogen Revolution in Europe: Bibliometric Review of Industrial Hydrogen Applications for a Sustainable Future. Energies 2024, 17, 3658. [Google Scholar] [CrossRef] [Scilit]
- Fernández-Arias, P.; Antón-Sancho, Á.; Lampropoulos, G.; Vergara, D. Emerging Trends and Challenges in Pink Hydrogen Research. Energies 2024, 17, 2291. [Google Scholar] [CrossRef] [Scilit]
- Reddi, K.; Elgowainy, A.; Rustagi, N.; Gupta, E. Impact of Hydrogen Refueling Configurations and Market Parameters on the Refueling Cost of Hydrogen. Int. J. Hydrogen Energy 2017, 42, 21855–21865. [Google Scholar] [CrossRef] [Scilit]
- Raman, R.; Nair, V.K.; Prakash, V.; Patwardhan, A.; Nedungadi, P. Green-Hydrogen Research: What Have We Achieved, and Where Are We Going? Bibliometrics Analysis. Energy Rep. 2022, 8, 9242–9260. [Google Scholar] [CrossRef] [Scilit]
- Costa, Á.M.; Orosa, J.A.; Vergara, D.; Fernández-Arias, P. New Tendencies in Wind Energy Operation and Maintenance. Appl. Sci. 2021, 11, 1386. [Google Scholar] [CrossRef] [Scilit]
- Alias, N.D.; Go, Y.I. Decommissioning Platforms to Offshore Solar System: Road to Green Hydrogen Production from Seawater. Renew. Energy Focus 2023, 46, 136–155. [Google Scholar] [CrossRef] [Scilit]
- Cui, R.; Yang, M. How do power fluctuations and spatially random disturbances affect PEM water electrolyzer performances in marine environments? Energy Convers. Manag. 2026, 364, 121742. [Google Scholar] [CrossRef] [Scilit]
- García-Ruiz, Á.; Fernández-Arias, P.; Vergara, D. Mathematics-Driven Analysis of Offshore Green Hydrogen Stations. Algorithms 2025, 18, 237. [Google Scholar] [CrossRef] [Scilit]
Disclaimer/Publisher’s Note: The statements, opinions and data contained in all publications are solely those of the individual author(s) and contributor(s) and not of MDPI and/or the editor(s). MDPI and/or the editor(s) disclaim responsibility for any injury to people or property resulting from any ideas, methods, instructions or products referred to in the content. |
© 2026 by the authors. Licensee MDPI, Basel, Switzerland. This article is an open access article distributed under the terms and conditions of the Creative Commons Attribution (CC BY) license.