


Abstract
This paper presents the design, calibration, and preliminary validation of a low-cost UAV–SDR system for spatial assessment of TETRA base station emissions. The proposed platform enables georeferenced electromagnetic field (EMF) measurements and 2D/3D mapping of signal distribution. The measurement results show good agreement with theoretical propagation models, confirming system reliability. In parallel, a fixed-site measurement campaign was conducted to analyze the temporal behavior of TETRA signals and their relation to broadband EMF levels. The results highlight distinct temporal patterns, with TETRA activity remaining stable or increasing during night-time, unlike the general EMF trend. This study demonstrates the feasibility of combining UAV-based and fixed-site approaches for comprehensive EMF assessment.
Keywords:
TETRA; SDR; UAV; electromagnetic field (EMF); spectrum analysis; RF monitoring; channel power; spatial mapping 1. Introduction
Terrestrial Trunked Radio (TETRA) is a digital communication standard widely used by police forces, emergency services, and other critical organizations to ensure secure, reliable, and efficient communication in mission-critical situations.
Low-cost software-defined radio (SDR) systems have been developed to monitor TETRA downlink channels in real time, using platforms like ADALM-PLUTO plus GPS and Raspberry Pi, achieving 5.12 MHz bandwidth, −100 to −30 dBm dynamic range, and ~€320 hardware cost [1,2]. These allow for amplitude–time–frequency–location (2D) logging, outdoor mobile operation up to 120 km/h, and comparison-calibrated accuracy against lab spectrum analyzers [1].
With the recent advancements in Unmanned Aerial Vehicles (UAVs), new opportunities have emerged for agile electromagnetic field measurements [3,4]. By integrating SDR platforms with UAVs, it becomes possible to perform aerial TETRA signal monitoring and generate 3D electromagnetic field maps around base stations. This approach enables rapid, cost-effective, three-dimensional assessment of TETRA base station emissions, enabling emission site troubleshooting, operational antenna characterization and visualization of interest coverage maps. Therefore, based on this gap, the main objectives of this paper lie in the design, pre-calibration, and preliminary testing of such a system, capable of performing georeferenced, 3D spatial measurements of TETRA base station emissions using a UAV–SDR integrated platform.
In addition, this study includes the analysis of a fixed-point measurement campaign carried out using conventional spectrum monitoring equipment. Rather than performing a direct comparison with UAV-based measurements, this component focuses on examining the temporal behavior of TETRA signals at a single location. The collected data is analyzed alongside readings from a broadband EMF monitor to determine whether the variation in TETRA signal levels follows the overall trend of the electromagnetic field at that site. This approach provides insight into the contribution of TETRA emissions to the total EMF exposure [5,6] and supports a better understanding of their temporal dynamics in a fixed measurement scenario.
2. UAV-Mounted SDR Measurement System
The proposed system combines a custom-built UAV, an SDR sensing payload and an onboard processing unit to enable synchronized radio frequency (RF) and telemetry measurements during autonomous flight operations.
The aerial platform consists of a bespoke quadrotor configuration designed to ensure mechanical stability and minimize vibration-induced measurement errors. The frame was constructed using aluminum arms and FR4 composite plates, providing structural rigidity and electrical insulation. Propulsion is achieved using four brushless motors (DJI 2212 class, DJI, Shenzhen, China) controlled by 30 A electronic speed controllers and 10-inch propellers. The system is powered by a four-cell lithium-polymer battery (4000 mAh), enabling a stable hover flight time of approximately 8 min. Increasing the battery capacity will lead to increased flight time. Flight control is performed using a Pixhawk 2.4.8 controller (Holybro, Shenzhen, China) running ArduCopter firmware version 4.x, integrated with an M8N GPS module (Holybro, Shenzhen, China) for precise positioning. Autonomous missions are executed using waypoint-based trajectories defined in Mission Planner, with velocity and ascent rates limited to 2 m/s to ensure platform stability and measurement consistency.
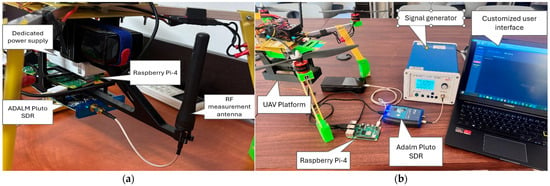
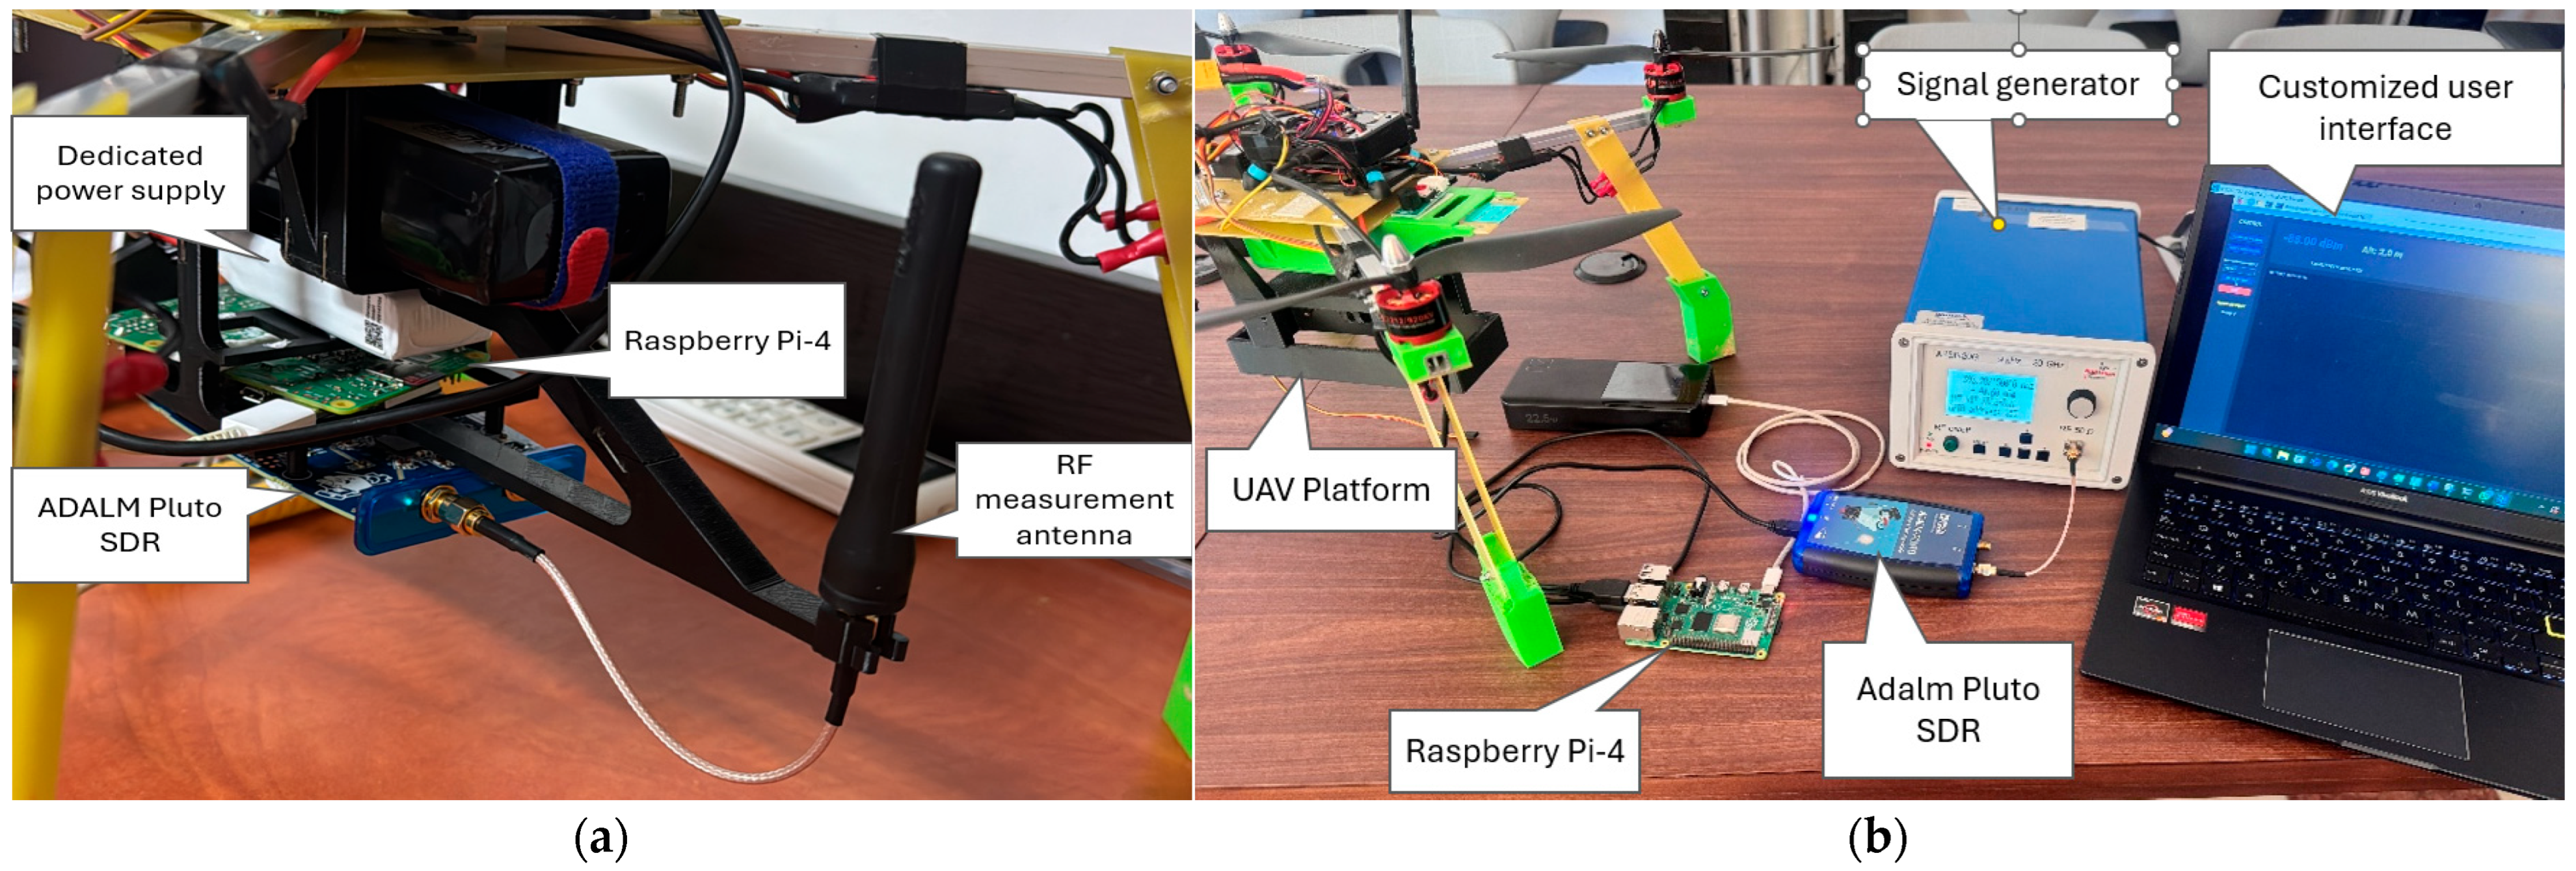
The RF measurement subassembly was designed as a UAV payload consisting of an ADALM Pluto SDR (Analog Devices, Inc., Wilmington, MA, USA) interfaced with a Raspberry Pi-4 (Raspberry Pi Ltd., Cambridge, United Kingdom) microcomputer. Signal reception is performed using a Hytera AN0405H11 (Hytera Communications Corp., Ltd., Shenzhen, China) omnidirectional antenna operating in the 380–430 MHz band, ensuring isotropic reception characteristics and eliminating orientation-dependent bias. To mitigate electromagnetic interference generated by the propulsion system, the payload is mounted beneath the UAV using a custom 3D-printed structure with a three-tier configuration, providing spatial separation between the SDR, processing unit, and power subsystem. The payload operates on an independent power supply consisting of a 1000 mAh battery and an LM2596 DC–DC (Texas Instruments, Dallas, TX, USA) converter, preventing electrical noise coupling with the flight control system. Figure 1a presents the RF measurement subassembly components mounted on the UAV platform.
Figure 1.
(a) RF measurement subassembly mounted on the UAV platform; (b) SDR calibration setup.
Signal acquisition and processing are implemented using the GNU Radio (version 3.10.x) framework. In the initial phase of deployment, the primary objective was to monitor a single TETRA channel (25 kHz bandwidth); so, the SDR was configured to operate at a sampling rate of 2 MSps with a fixed receiver gain of 30 dB. However, ADALM Pluto can also support real-time monitoring of the entire TETRA downlink spectrum (390–395 MHz) by using sample rates of up to 20 Msps. The baseband signal is filtered using a finite impulse response (FIR) low-pass filter to isolate the TETRA channel. The filtered signal is processed through magnitude-squared computation and a moving average of 100,000 samples to estimate signal power, which is subsequently converted to a logarithmic scale (dBm).
Telemetry data, including GPS coordinates and UAV attitude, are acquired from the flight controller via the MAVLink protocol at a rate of 2 Hz. RF measurements and telemetry data are temporally synchronized and stored in CSV format at 0.5 s intervals, forming a georeferenced dataset suitable for spatial analysis.
To ensure measurement accuracy, the SDR system (Adalm Pluto) was calibrated using a laboratory RF signal generator (AnaPico AG, Glattbrugg, Zürich, Switzerland). Due to observed non-linearities, an empirical calibration model was developed by mapping measured values to reference power levels across the operational range. Real-time correction is applied using linear interpolation, reducing measurement error to approximately 0.1–0.3 dB. Figure 1b presents the setup used for the SDR power measurement calibration. To prevent receiver saturation at high input levels as those that can be encountered near the emitting base stations, a 20 dB attenuator is incorporated, with digital compensation applied during processing.
Autonomous flight missions were configured to ensure repeatable spatial sampling, with predefined trajectories and a region-of-interest configuration maintaining antenna orientation towards the emission source. Data acquisition is performed continuously during flight and, after the drone return, the csv file containing the telemetry data is used to generate 2D/3D electromagnetic field mapping.
3. Fixed-Site Measurement System
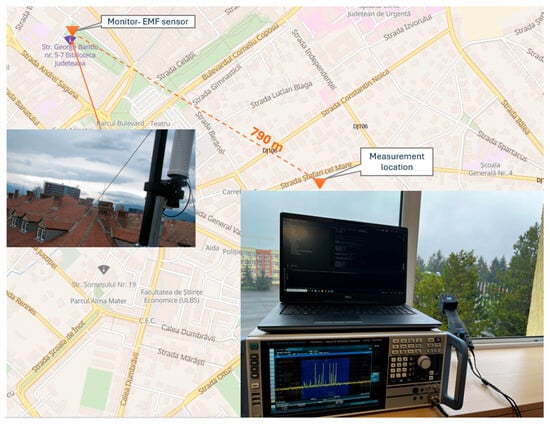
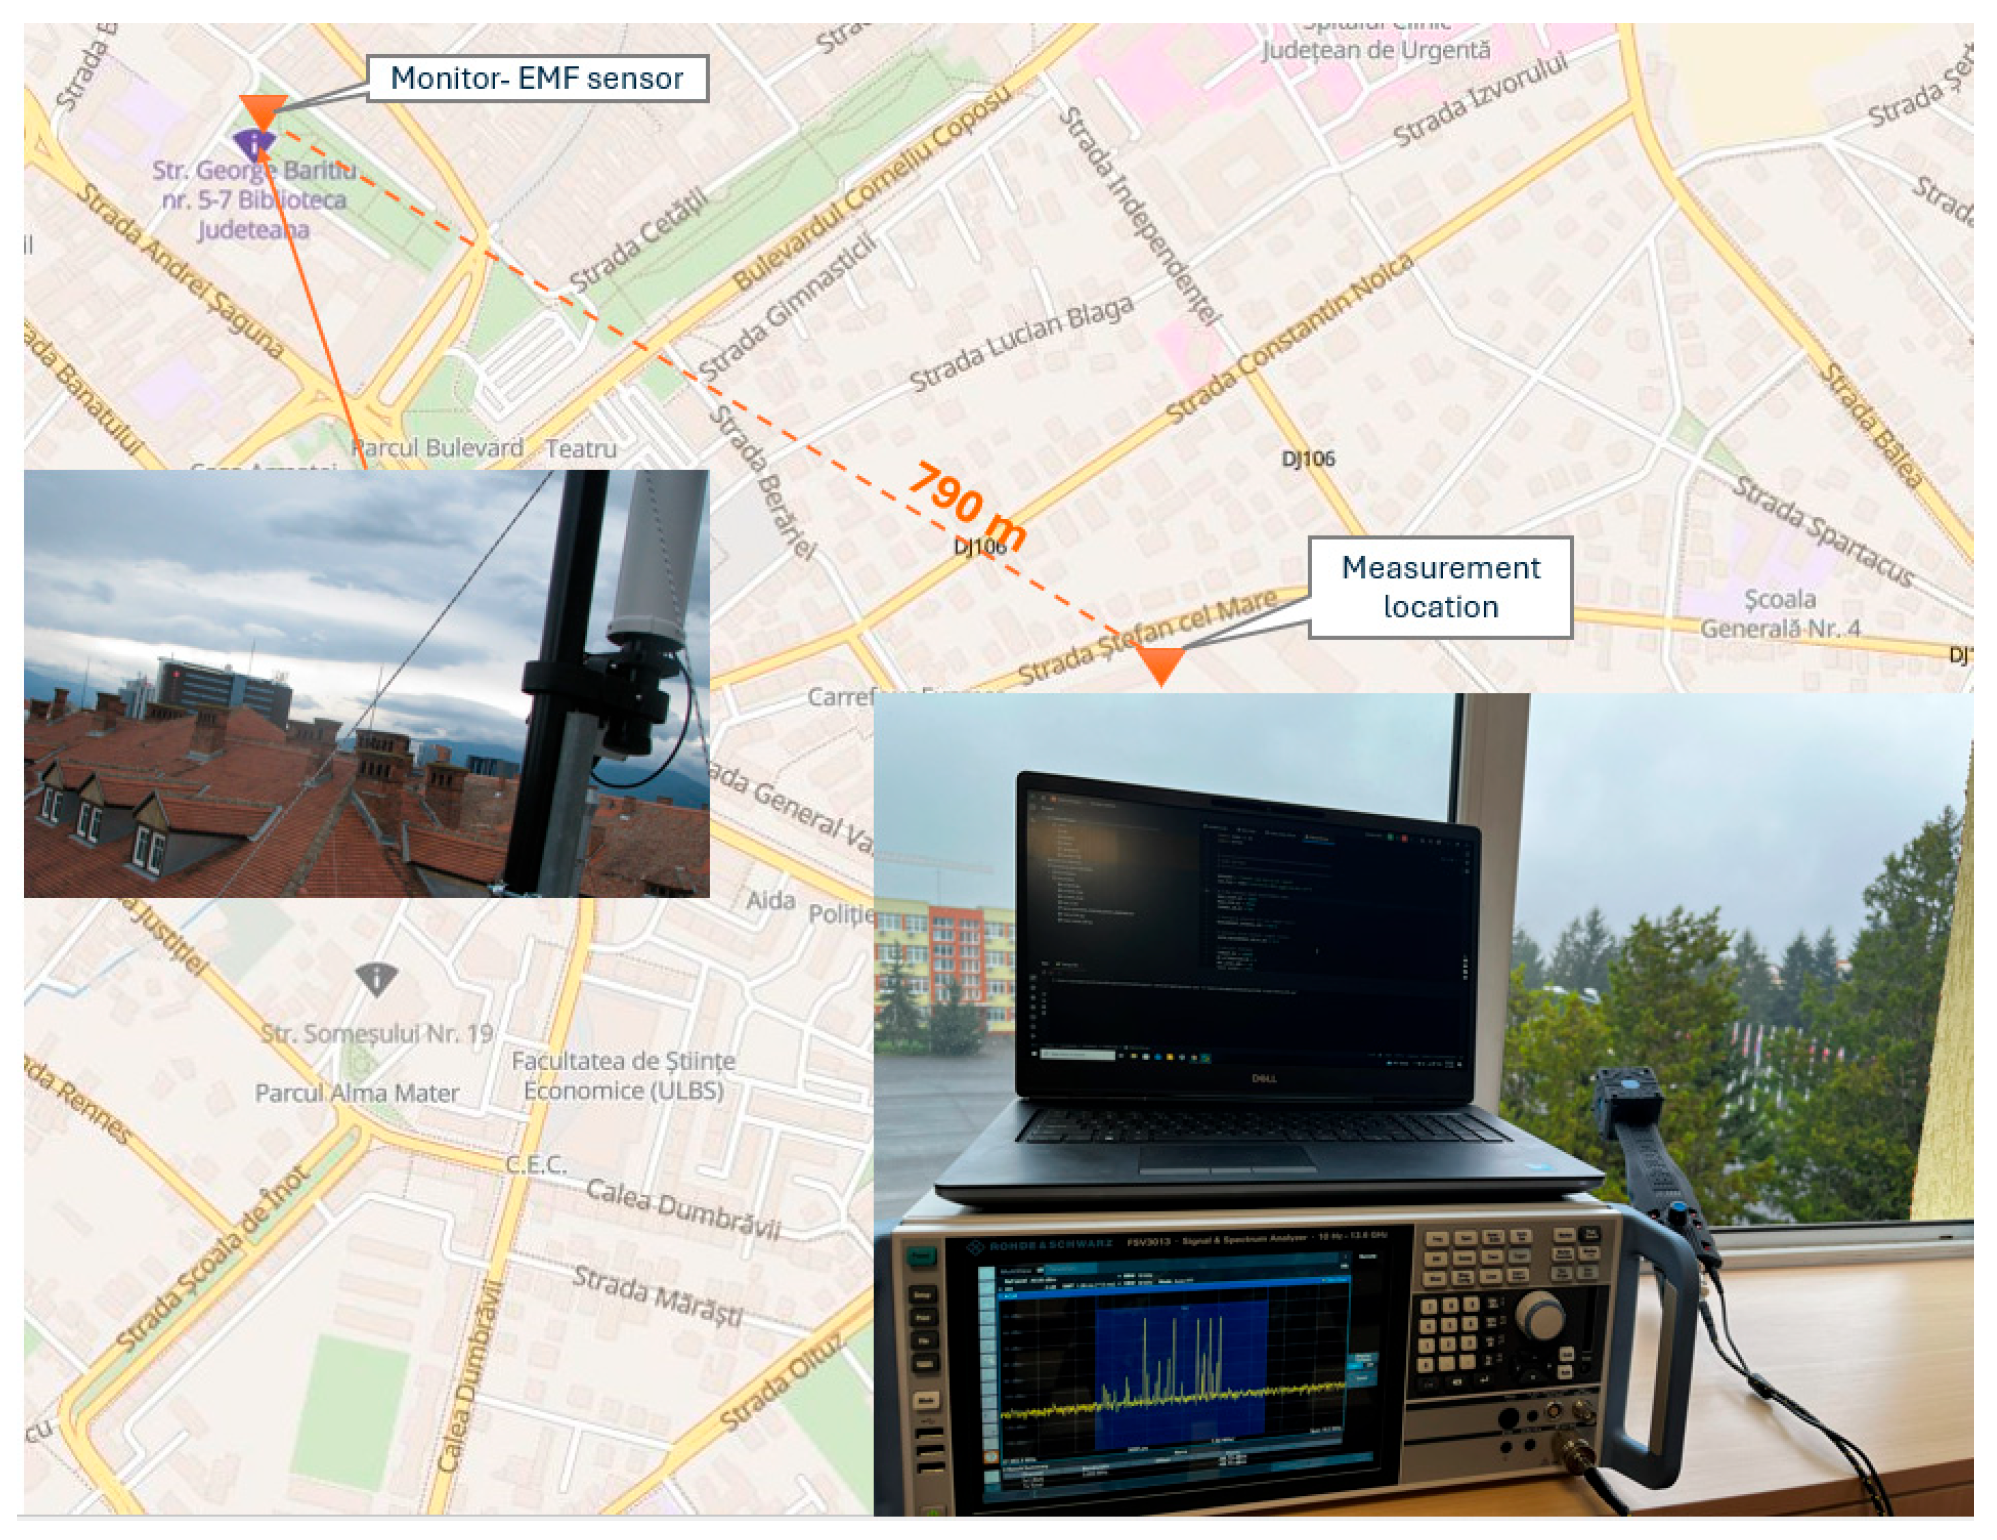
A fixed-site measurement campaign was conducted to analyze the temporal behavior of TETRA base station emissions and to provide a reference dataset for comparison with publicly available electromagnetic field (EMF) monitoring data. Measurements were performed in the city of Sibiu, Romania, over a continuous period starting from 1 April 2026 up to 9 April 2026 at the location illustrated in Figure 2, situated approximately 790 m from the Monitor EMF measurement location [7].
Figure 2.
Fixed-site measurement setup.
The measurement setup consisted of a FSV3013 spectrum analyzer (Rohde & Schwarz, Munich, Germany) connected to an IsoLOG 3D 9060 (Aaronia, Strickscheid, Germany) isotropic antenna. The antenna integrates three orthogonal dipole sensors and an internal preamplifier, ensuring isotropic reception independent of signal direction. The sensor switching rate was set to 5 (approximately 20 Hz), enabling broadband field measurement across the relevant frequency range.
The spectrum analyzer was remotely controlled using a custom Python (version 3,8,10) script via SCPI commands, enabling automated channel power (CP) measurements over the full 5 MHz TETRA downlink band. Data was recorded at 6 min intervals, capturing statistical parameters including average, maximum, minimum, median (p50), 95th percentile (p95), and standard deviation of channel power, together with measurement metadata.
The collected data was compared with values reported by the national EMF monitoring network [7], using the closest available sensor. Due to differences in measurement location, antenna characteristics, and processing methods, the comparison focuses on temporal trends rather than absolute power levels.
4. UAV-Based Spatial Mapping Result
Two Python-based processing tools were developed to transform the UAV-acquired CSV dataset into bi/tri dimensional (2/3D) representations of the electromagnetic field distribution. The raw dataset, containing synchronized GPS coordinates and calibrated power values, is first processed using a Pandas-based pipeline that removes invalid samples and optionally reduces data density for visualization efficiency.
For each measurement point, the horizontal distance to the base station is computed using the Haversine formula [8]:
where d [m] is the distance between the UAV and the base station, R = 6,371,000 m is the Earth radius, ϕ1 and ϕ2 are the latitudes (rad), and Δϕ, Δλ are the differences in latitude and longitude (rad).
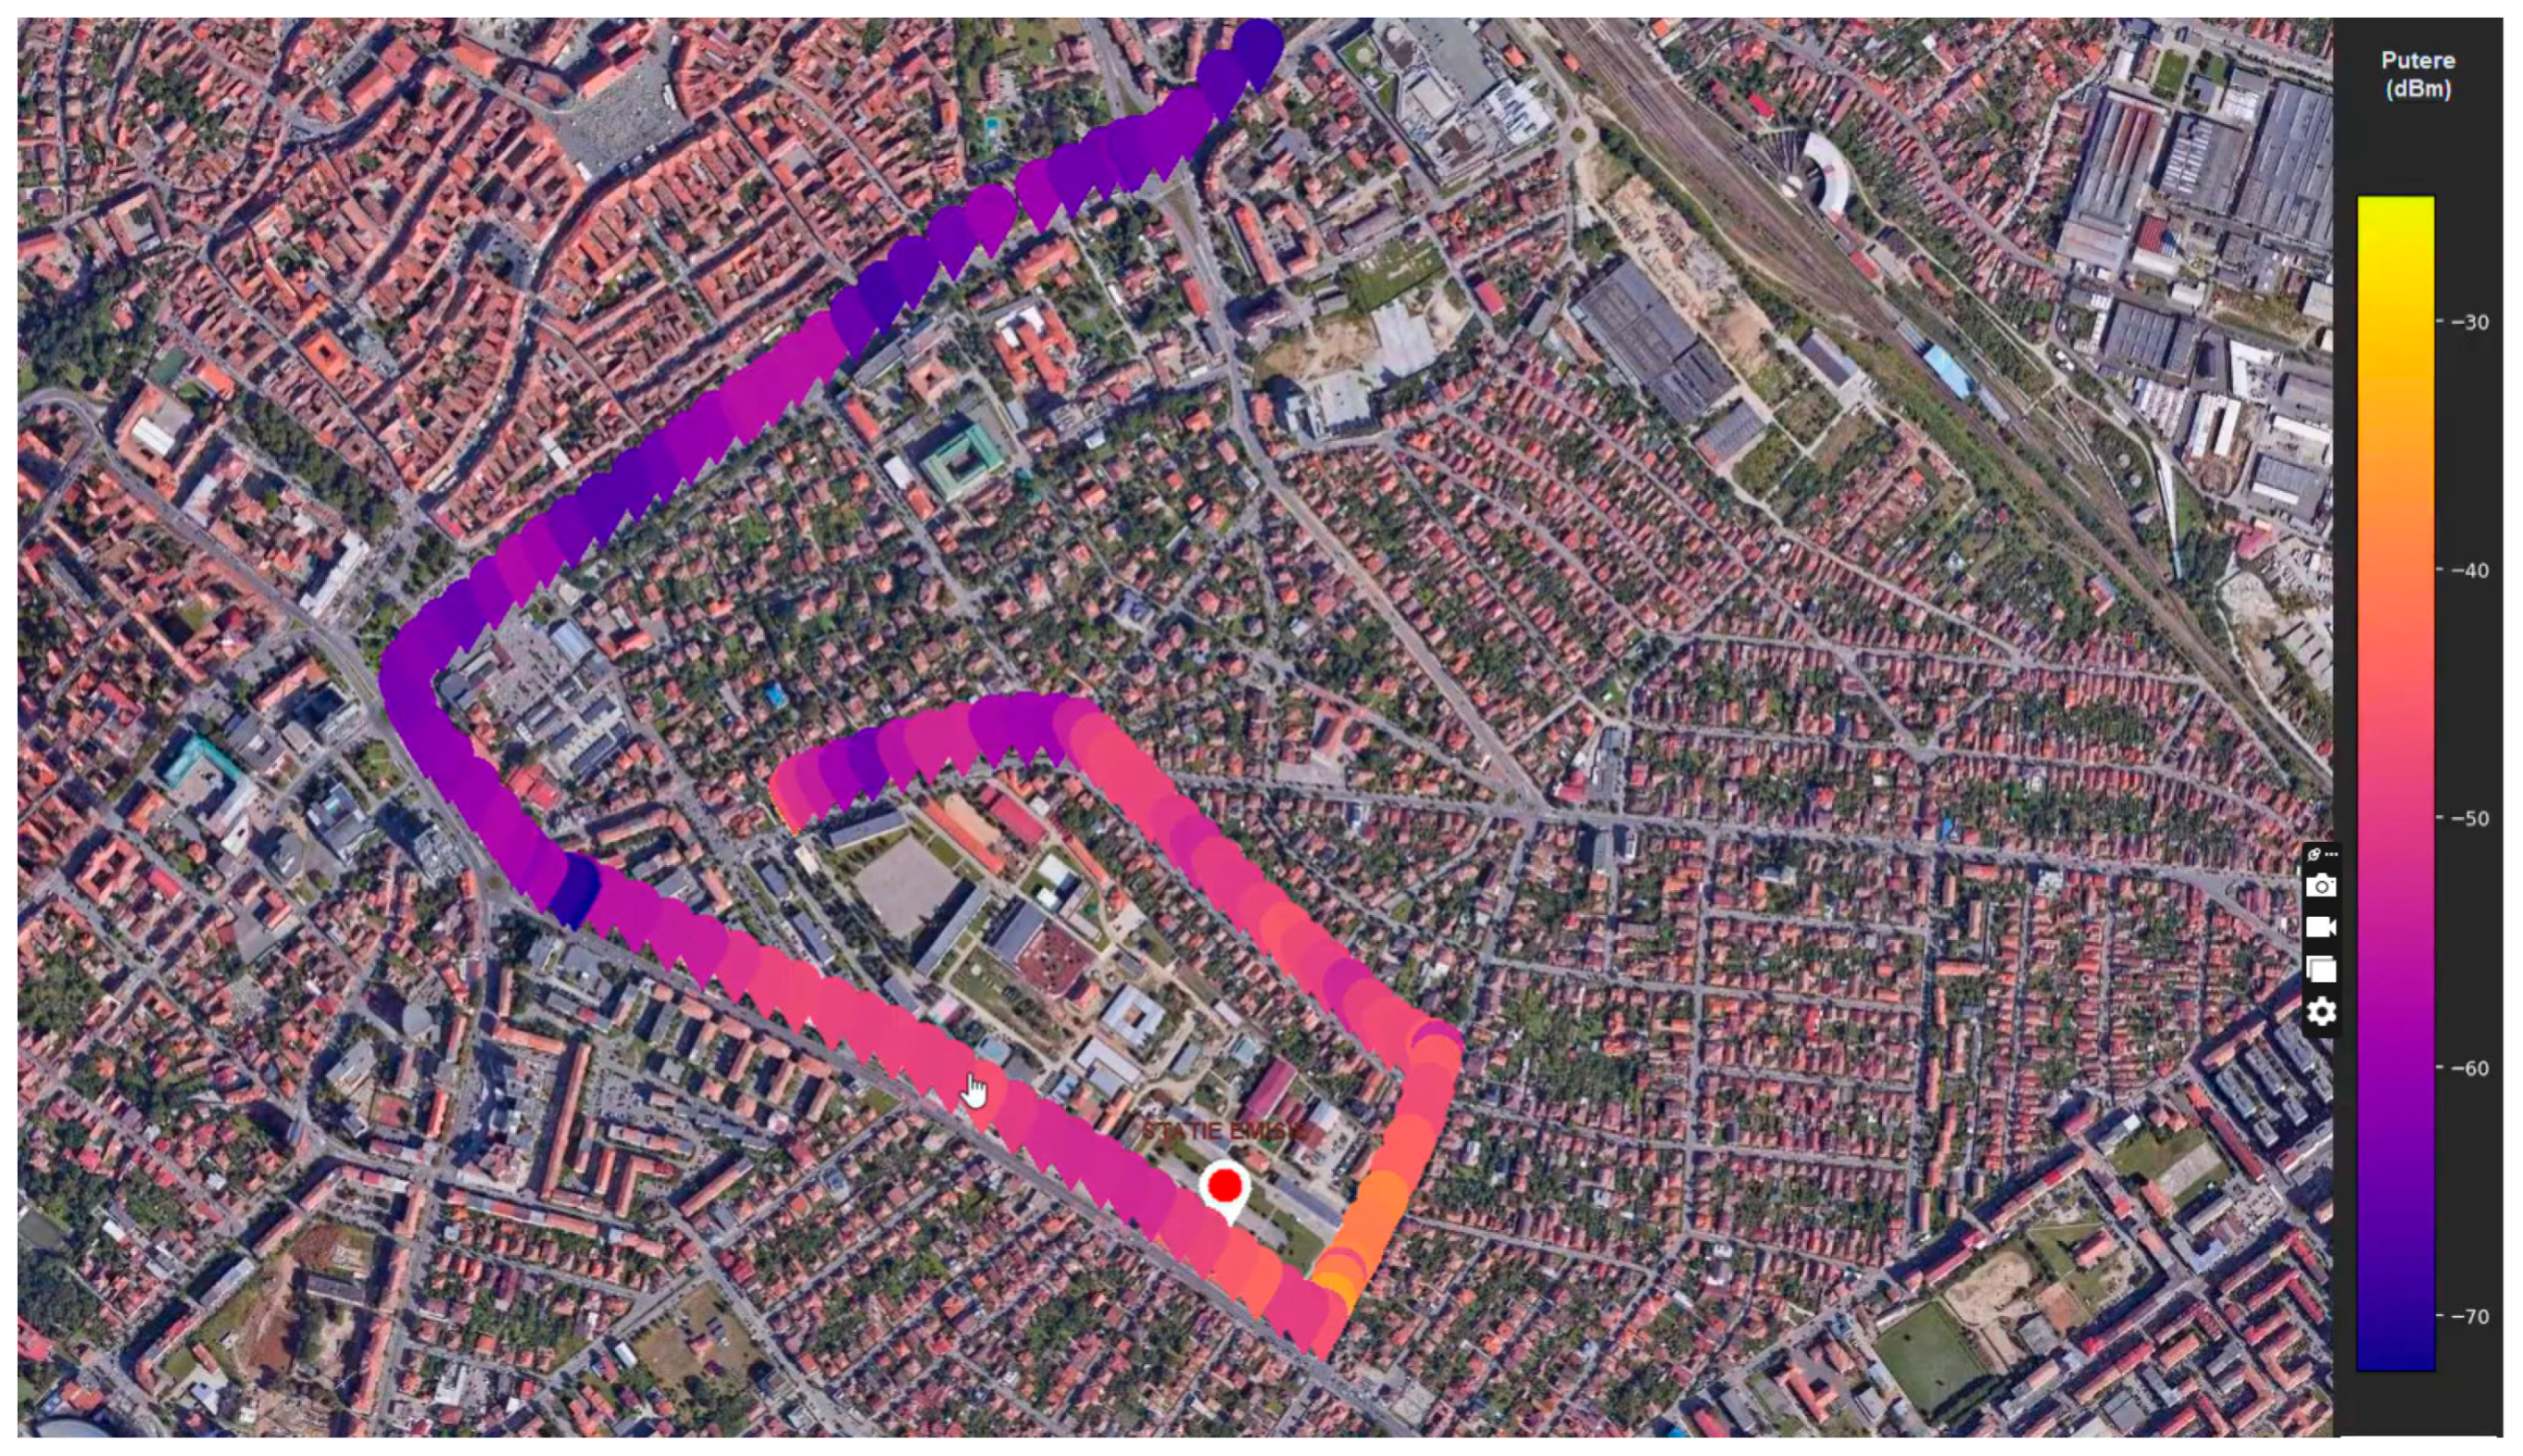
The measured power values are normalized and mapped to a continuous color scale, generating the 2D spatial distribution. For the 2D representation, a drive-test measurement type was performed by mounting the entire SDR measurement system inside a vehicle, with the results being presented in Figure 3.
Figure 3.
2D plot of measured TETRA channel power.
The results presented in Figure 3 reveal a clear decrease in received power with increasing distance, consistent with propagation theory, while local deviations indicate the influence of urban obstructions and multipath effects. The extrapolation of this type of results provides valuable support for authorities in the development of coverage maps for emergency communications and other critical systems operating on TETRA networks.
For three-dimensional (3D) reconstruction, the GPS coordinates are transformed into a local Cartesian reference system centered at the base station using:
where x [m] and y [m] represent the horizontal displacements along the East and North axes, respectively, [m] is the altitude above ground level, is the UAV altitude above mean sea level, and is the ground elevation at the base station location.
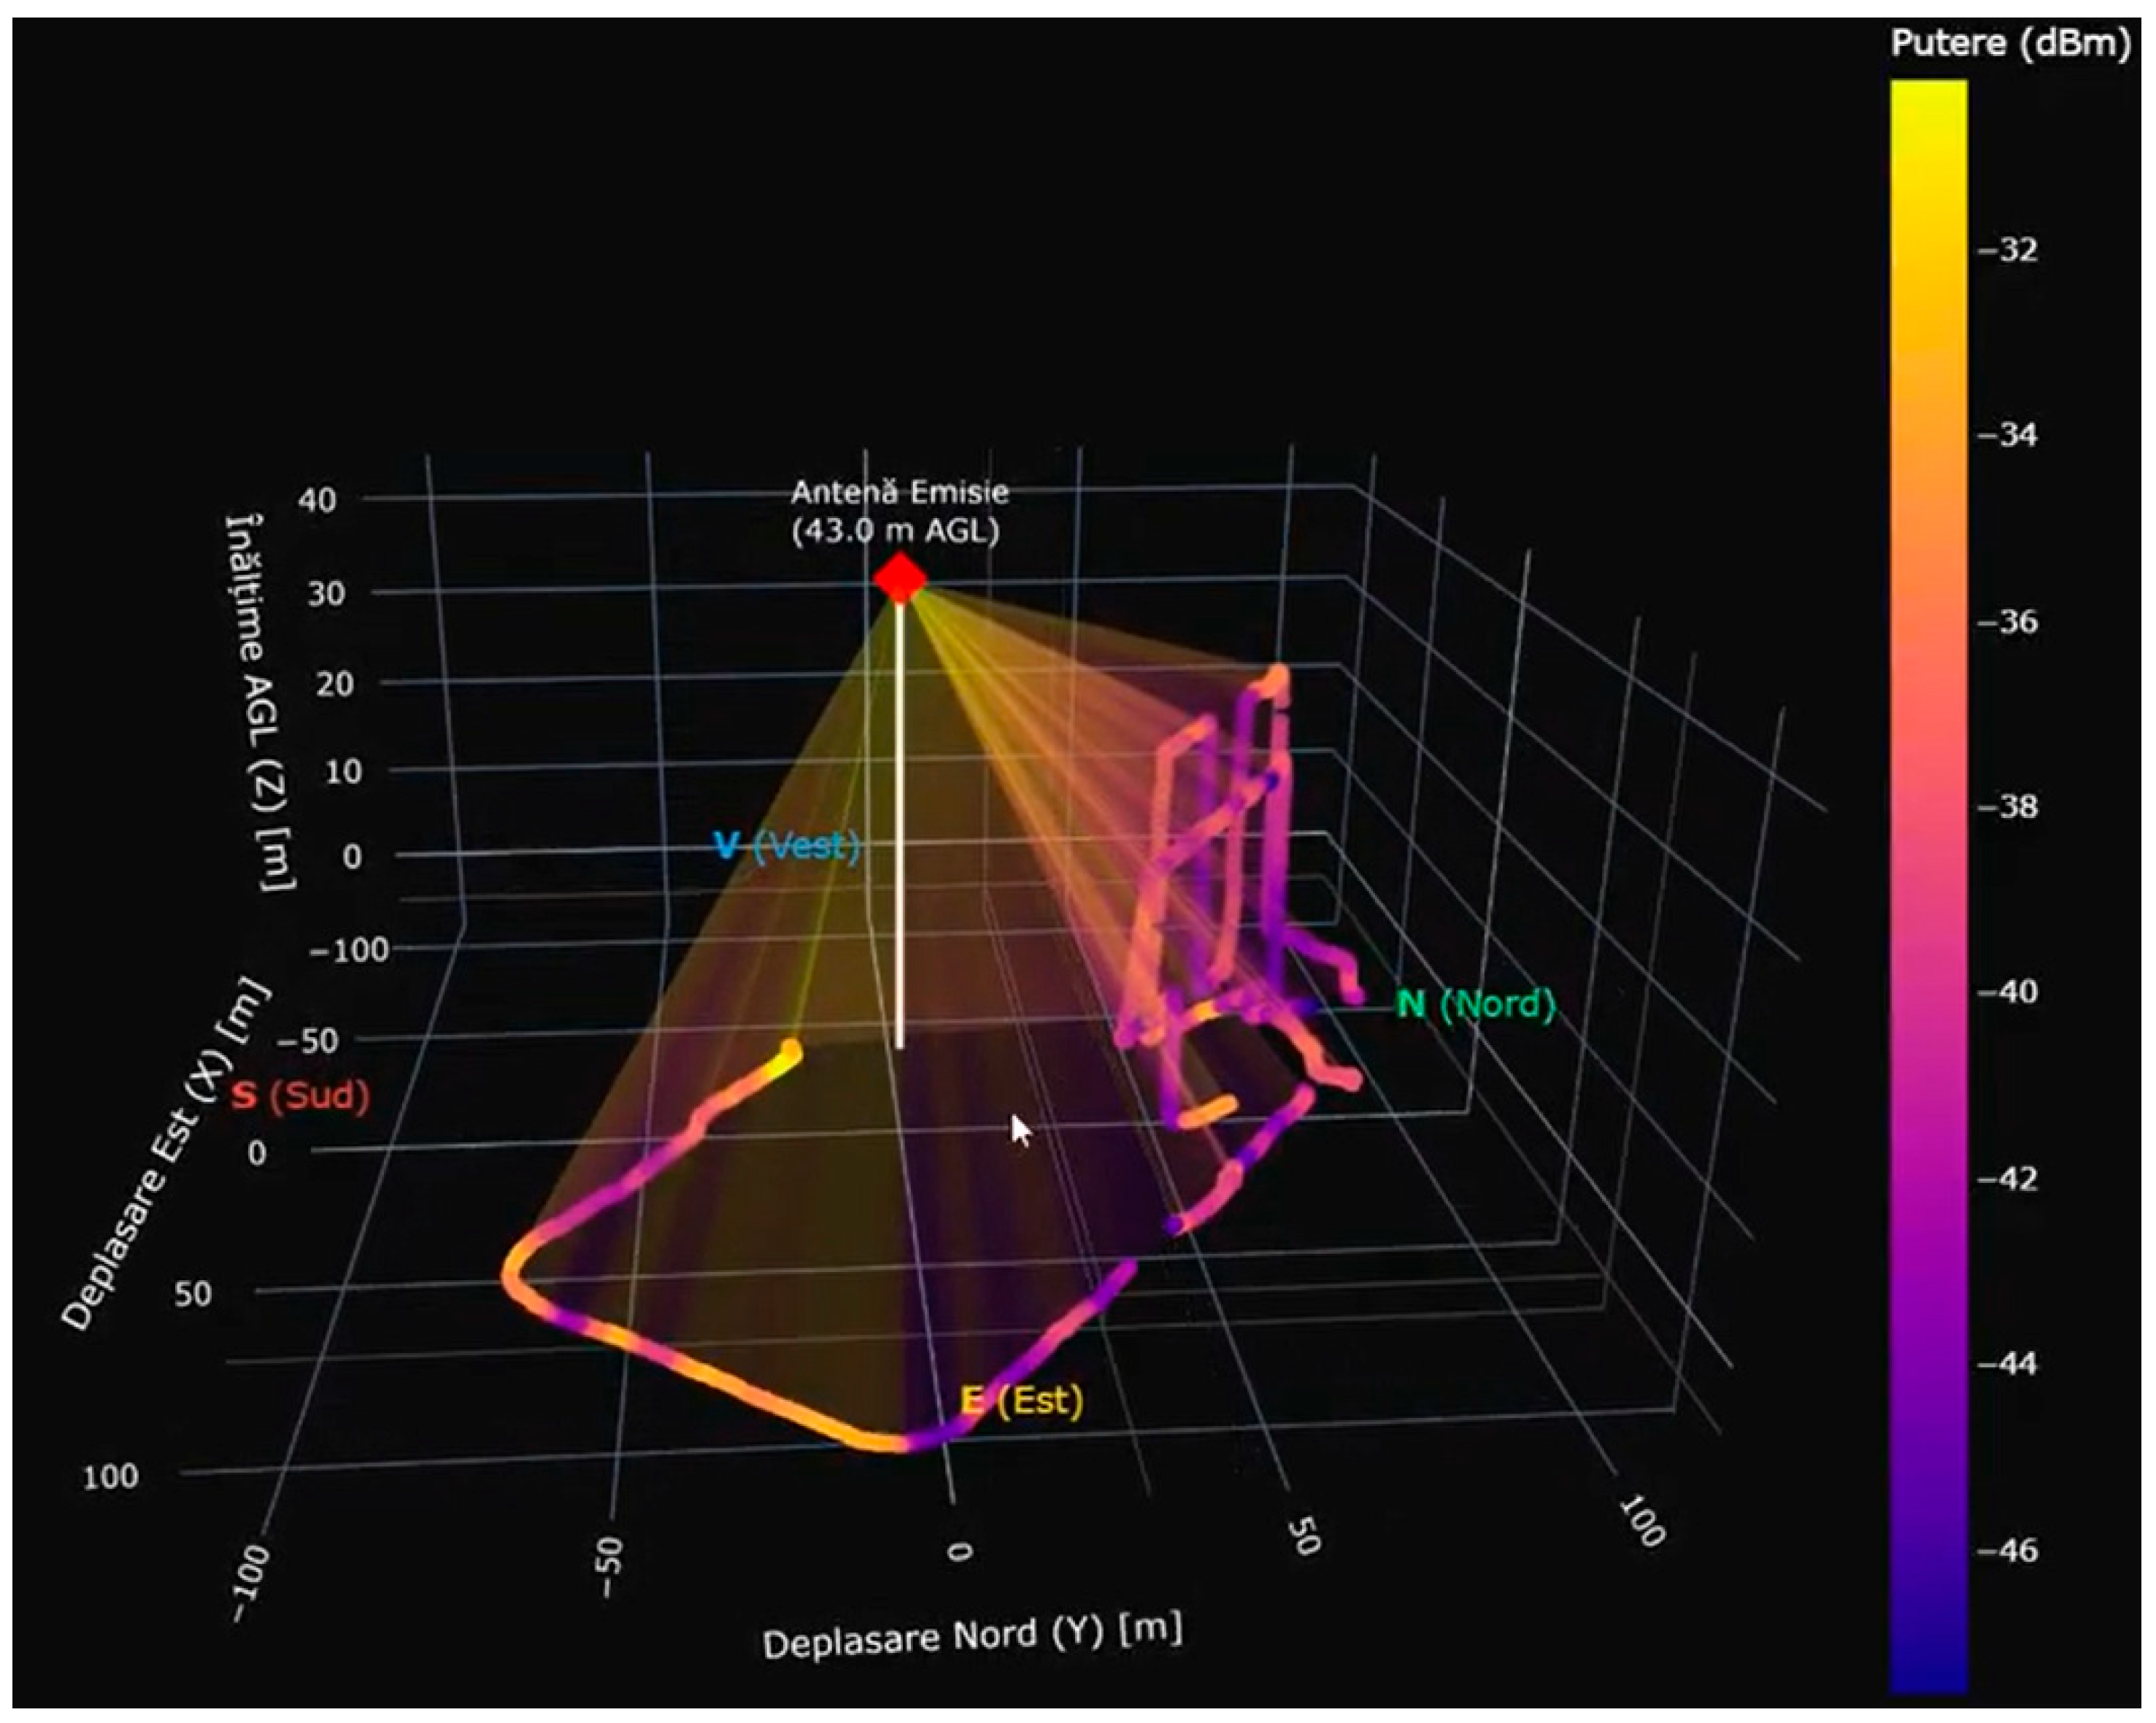
The resulting 3D representation (Figure 4) reveals the volumetric distribution of the electromagnetic field, with higher signal levels concentrate near the base station and along line-of-sight regions. Increased altitude generally corresponds to improved reception due to reduced obstruction, confirming the advantage of aerial measurements over conventional ground-based approaches.
Figure 4.
3D plot of measured TETRA antenna base station.
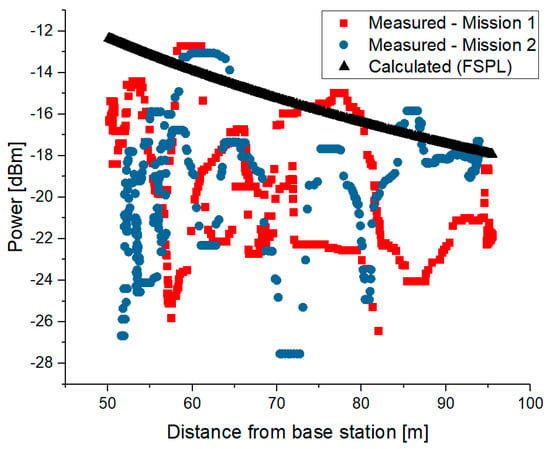
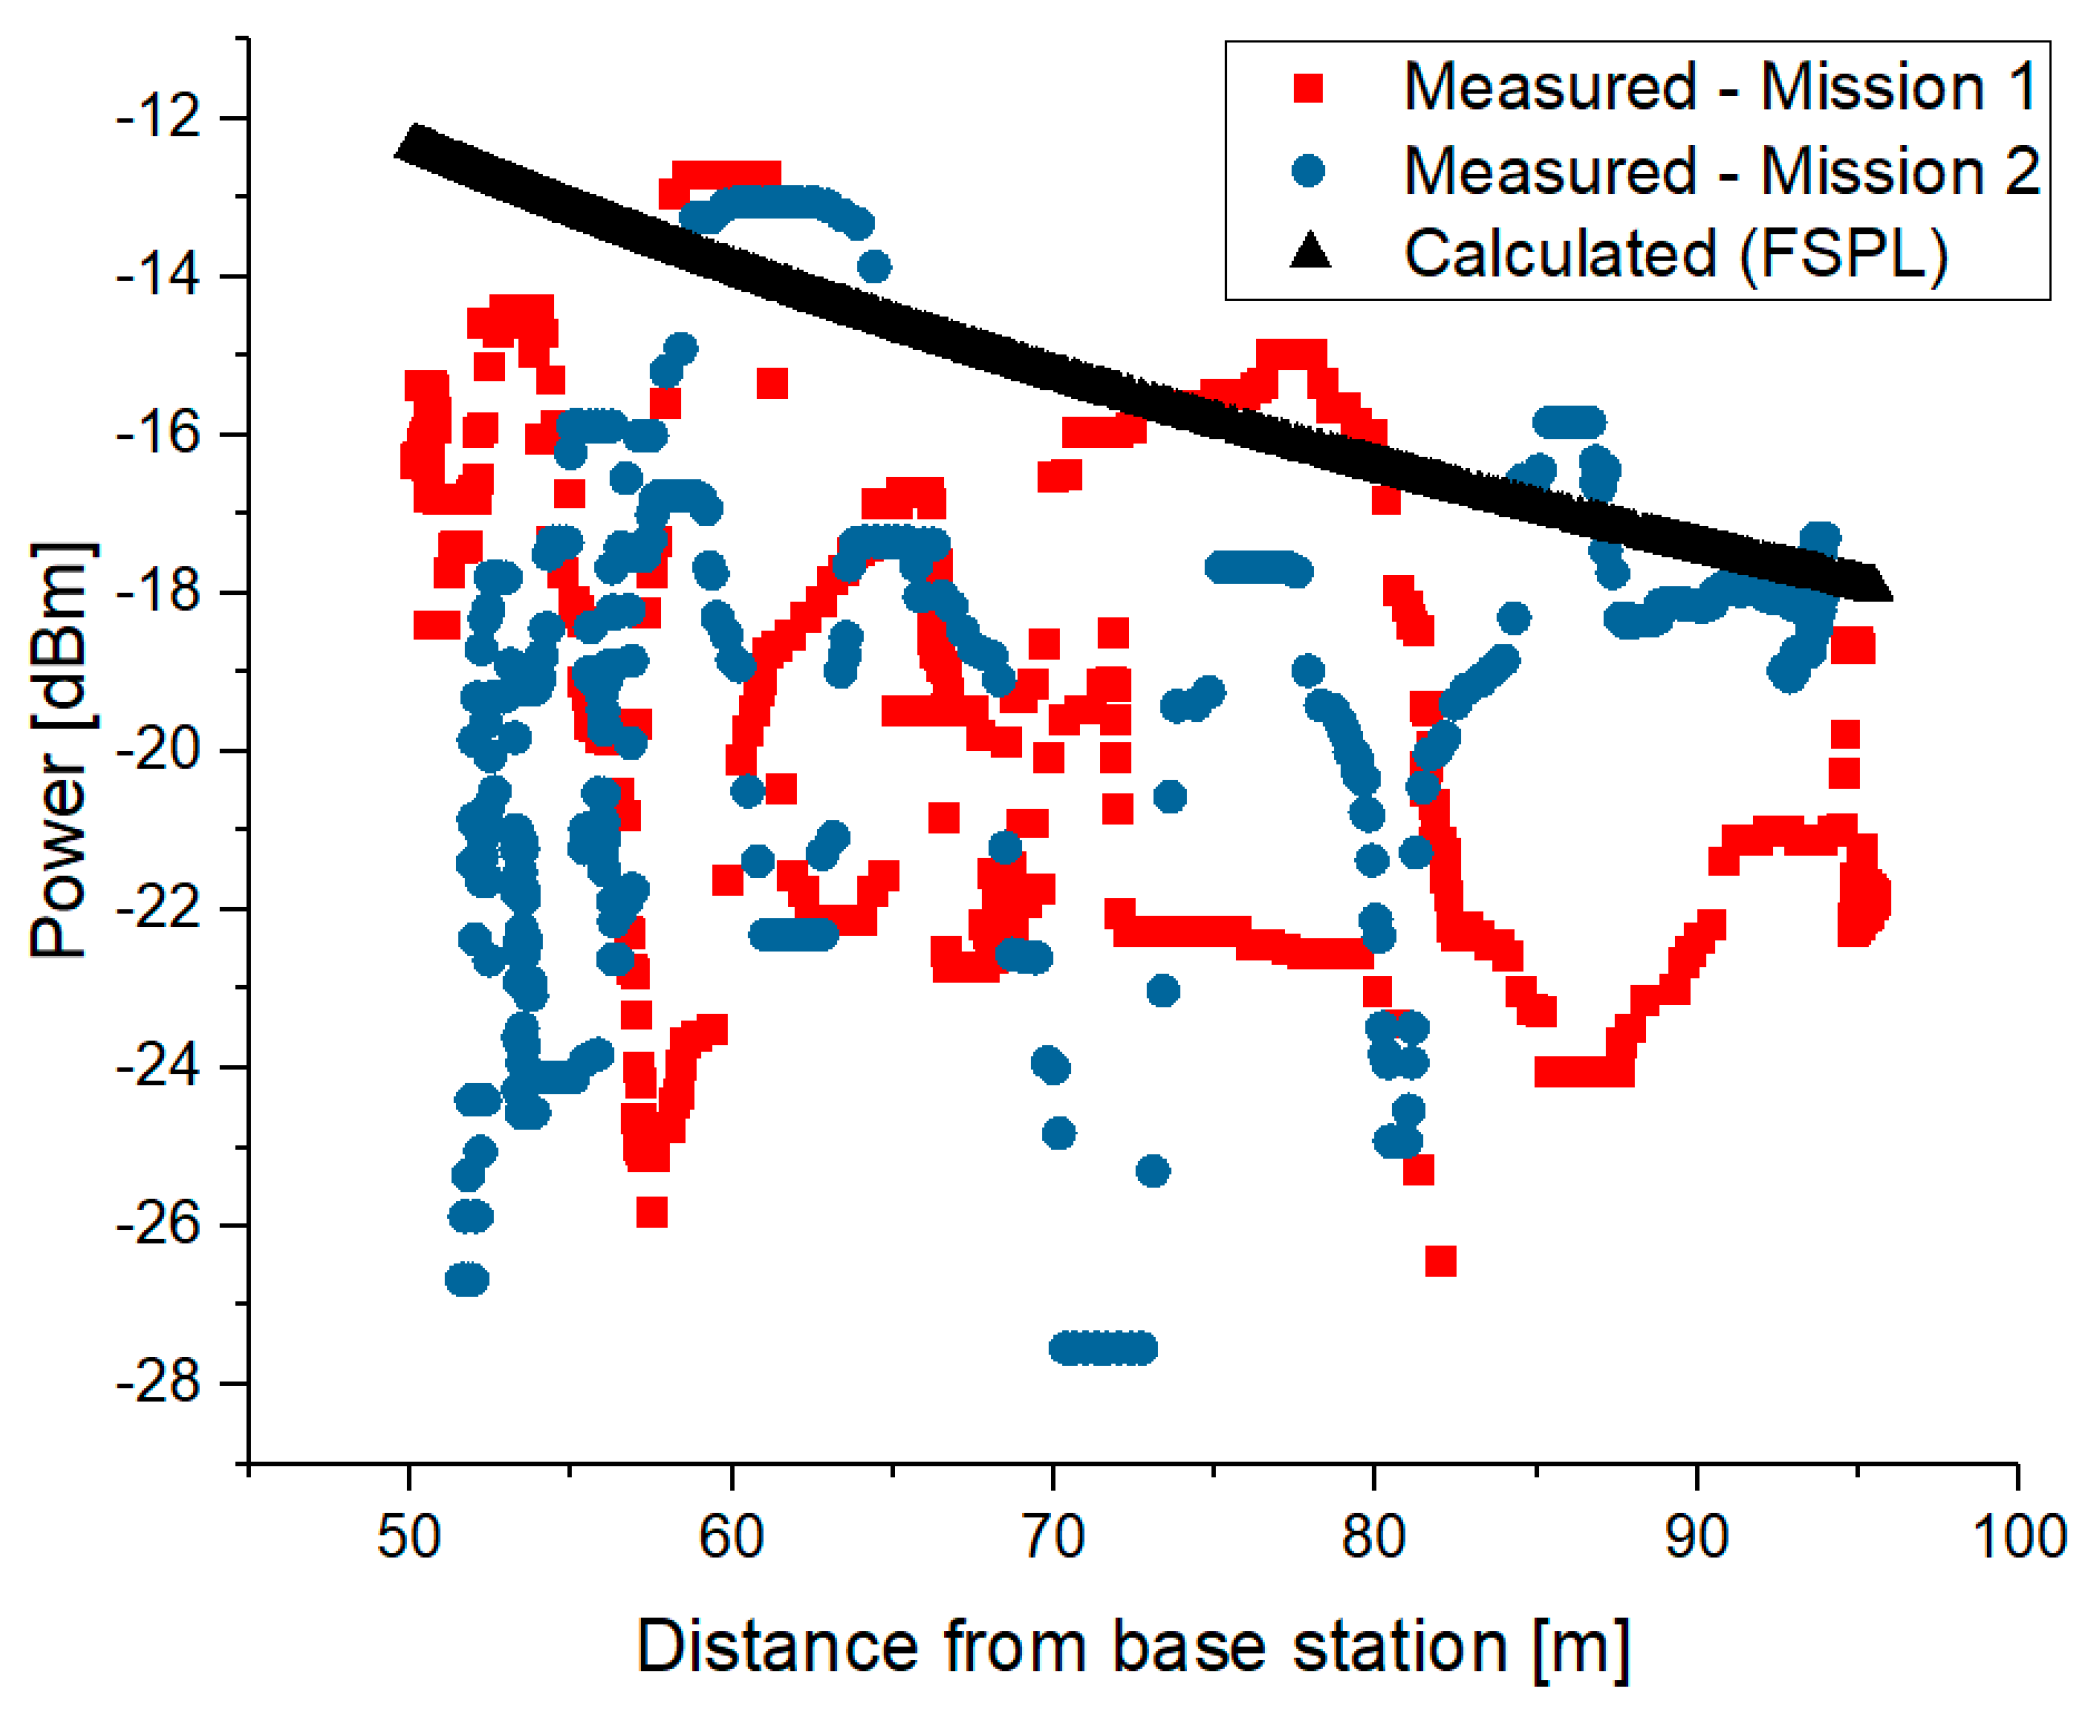
The measured results were compared to the Free Space Path Loss (FSPL) propagation model, with the results illustrated in Figure 5 showing good agreement between the measured data from both flight missions and the theoretical free-space path loss (FSPL) model. The overall trend confirms the expected logarithmic decrease in received power with increasing distance from the base station, validating the integrity of the measurement chain and calibration procedure. Despite this general agreement, noticeable fluctuations are present in both measurement datasets analyzed, particularly at shorter distances. These deviations can be attributed to local propagation phenomena such as multipath reflections, partial obstructions, and antenna pattern effects, which are not captured by the idealized FSPL model [9,10,11]. Deviations from the propagation model can also be attributed to the fact that the calculations were based on the theoretical base station emit power, without taking into account the antenna characteristics and cable and connector losses.
Figure 5.
Measured/calculated received power as a function of distance from a TETRA base station.
Overall, the results demonstrate that the UAV–SDR system provides consistent spatial characterization of TETRA emissions, capturing both distance-dependent attenuation and environmental propagation effects.
5. Fixed-Site Measurement Result
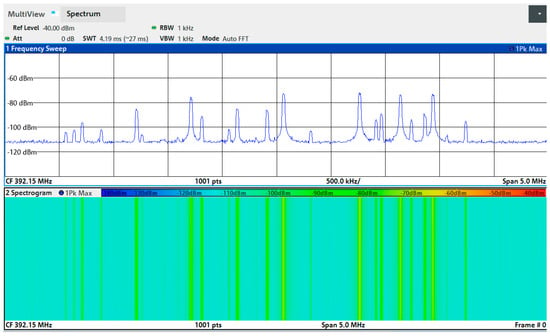
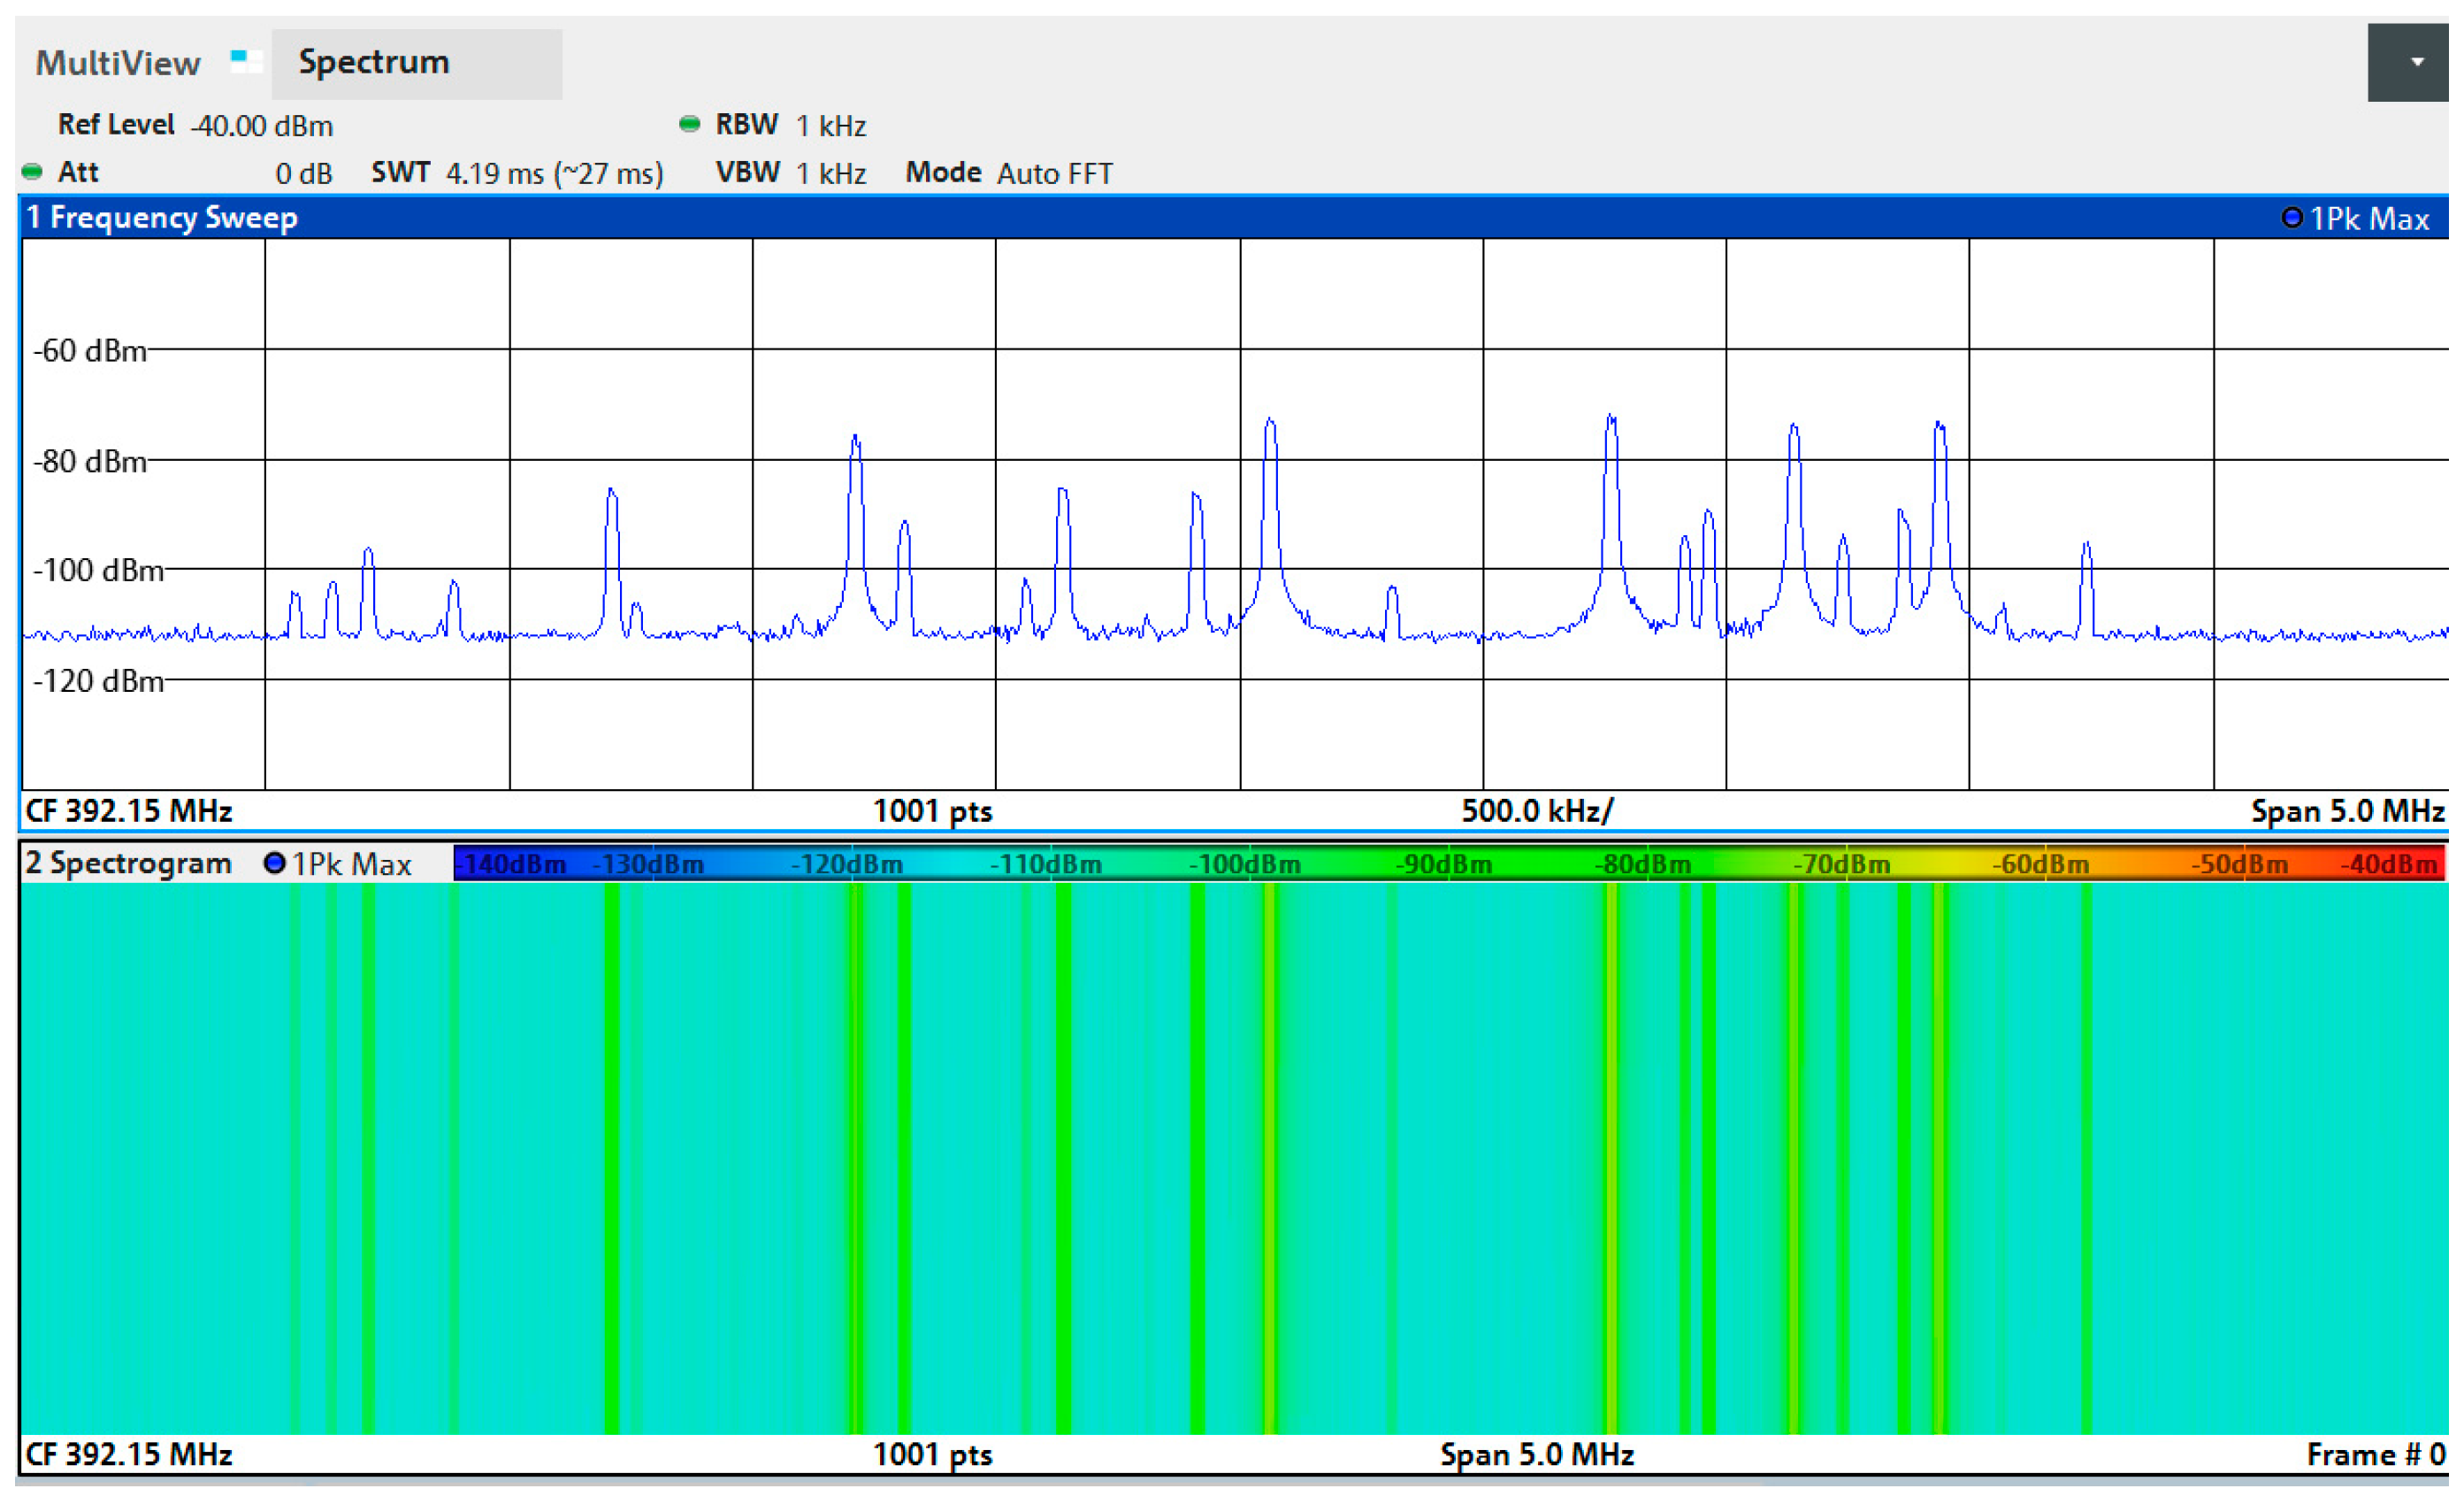
The fixed-site measurements highlight various temporal variation in TETRA downlink emissions over the monitoring period (1–9 April 2026). Figure 6 presents the complete TETRA downlink spectrum measured at the location of measurement, showing several 25 kHz channels with different amplitude levels, reflecting the simultaneous operation of multiple carriers within the band.
Figure 6.
TETRA downlink spectrum at the location of measurement.
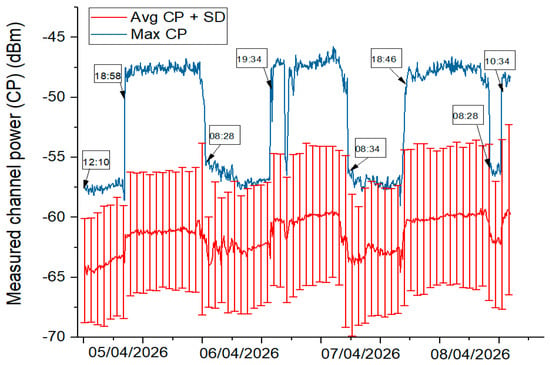
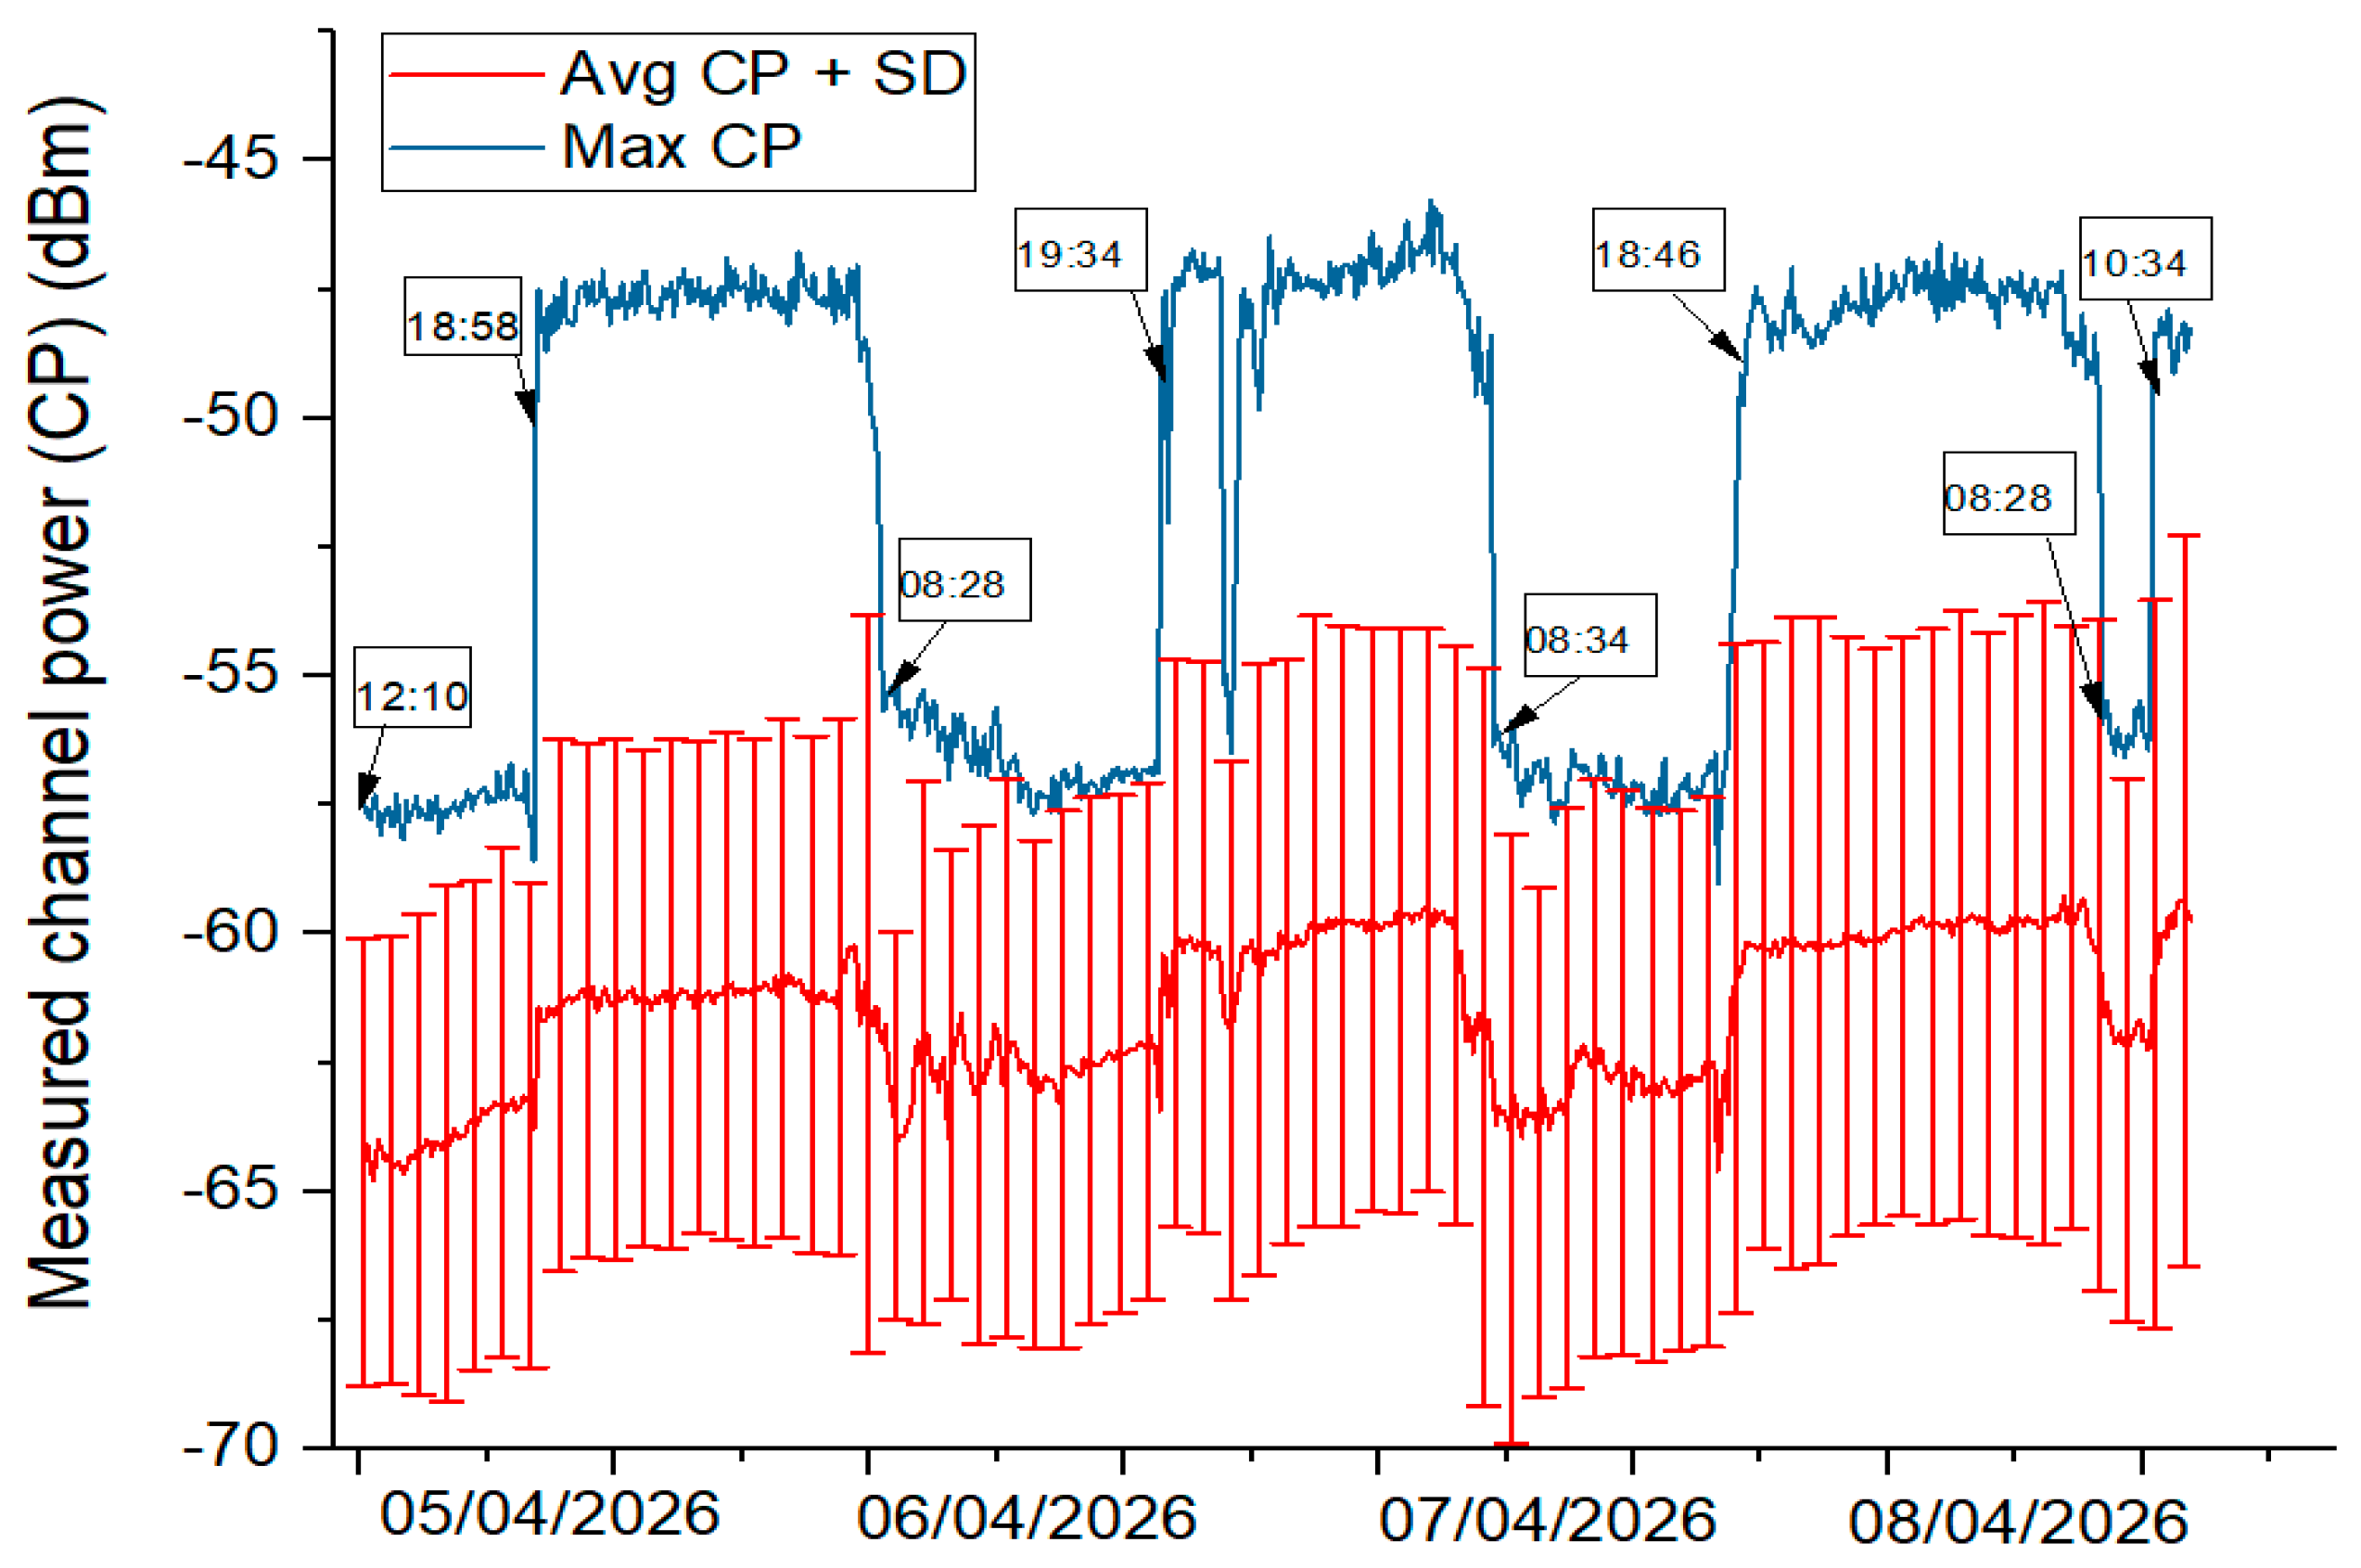
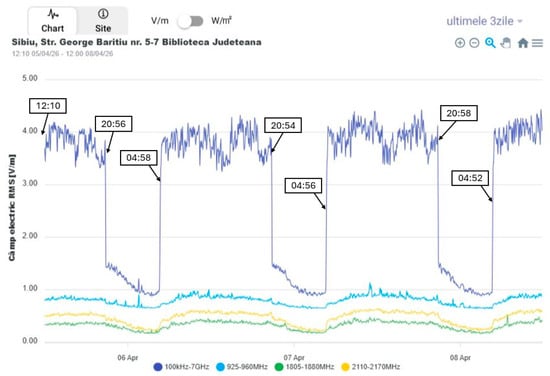
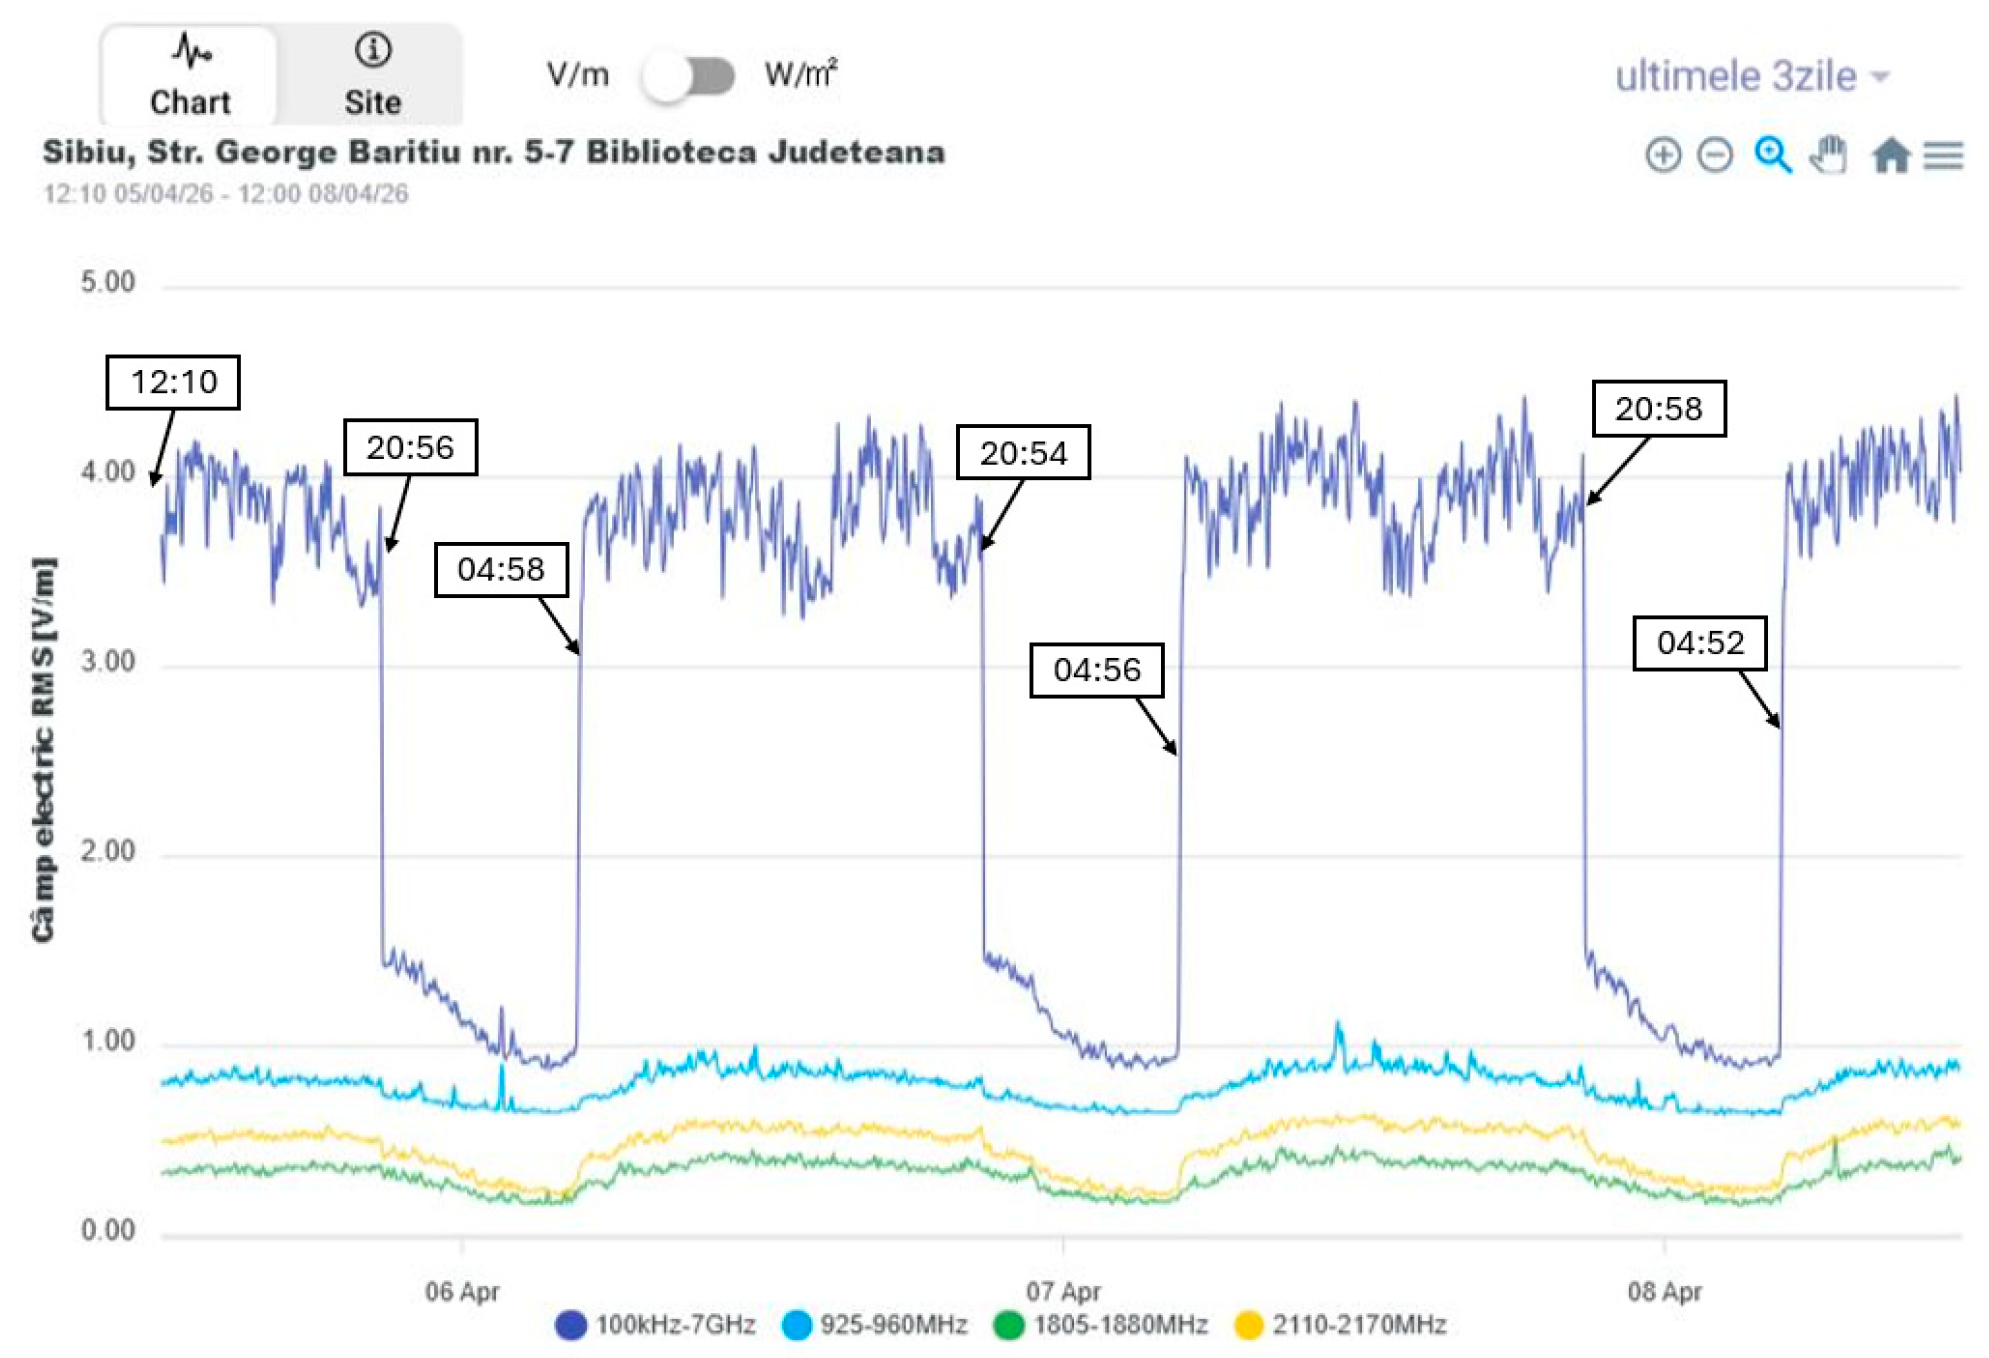
To highlight the temporal variability in the measured channel power, we compared the temporal evolution of the measured CP values with the general EMF field trend recorded by the closest Monitor EMF measurement site. The results of the comparison for a 3-day period (5–8 April 2026) is presented in Figure 7 and Figure 8.
Figure 7.
Measured CP for TETRA downlink band.
Figure 8.
Broadband electric field at the fixed site (Sibiu), 5–8 April 2026.
Figure 7 illustrates the temporal evolution of the measured channel power (CP) in the TETRA downlink band over the selected period. The maximum CP (blue trace) remains relatively stable, with clear step-like variations between daytime and night-time intervals, indicating changes in channel occupancy or traffic patterns. The average CP (red trace), together with its standard deviation, shows a similar behavior but with lower amplitude and higher dispersion, reflecting variability across the monitored channels. Notably, higher CP levels are consistently observed during night-time periods, while daytime values tend to decrease, suggesting a different usage profile compared to typical public communication networks.
Figure 8 shows the temporal evolution of the broadband electric field measured by the Monitor EMF system over the same period. In contrast to the TETRA-specific measurements, the total EMF exhibits higher values during daytime and a clear decrease during night-time intervals, mainly driven by reduced activity in public communication networks (e.g., cellular bands). This difference is plausible because the broadband monitor captures the combined contribution of many radio services, especially cellular systems whose traffic usually drops at night. By contrast, TETRA networks support mission-critical and dispatch communications, which can remain active or even relatively more constant during night-time operation.
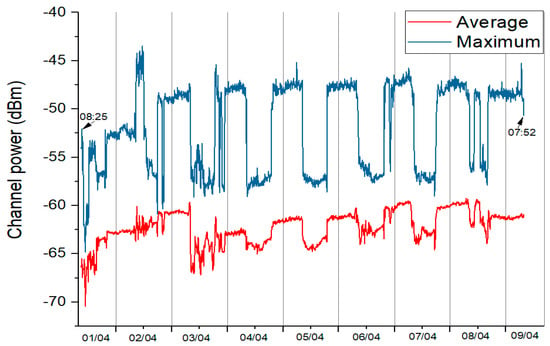
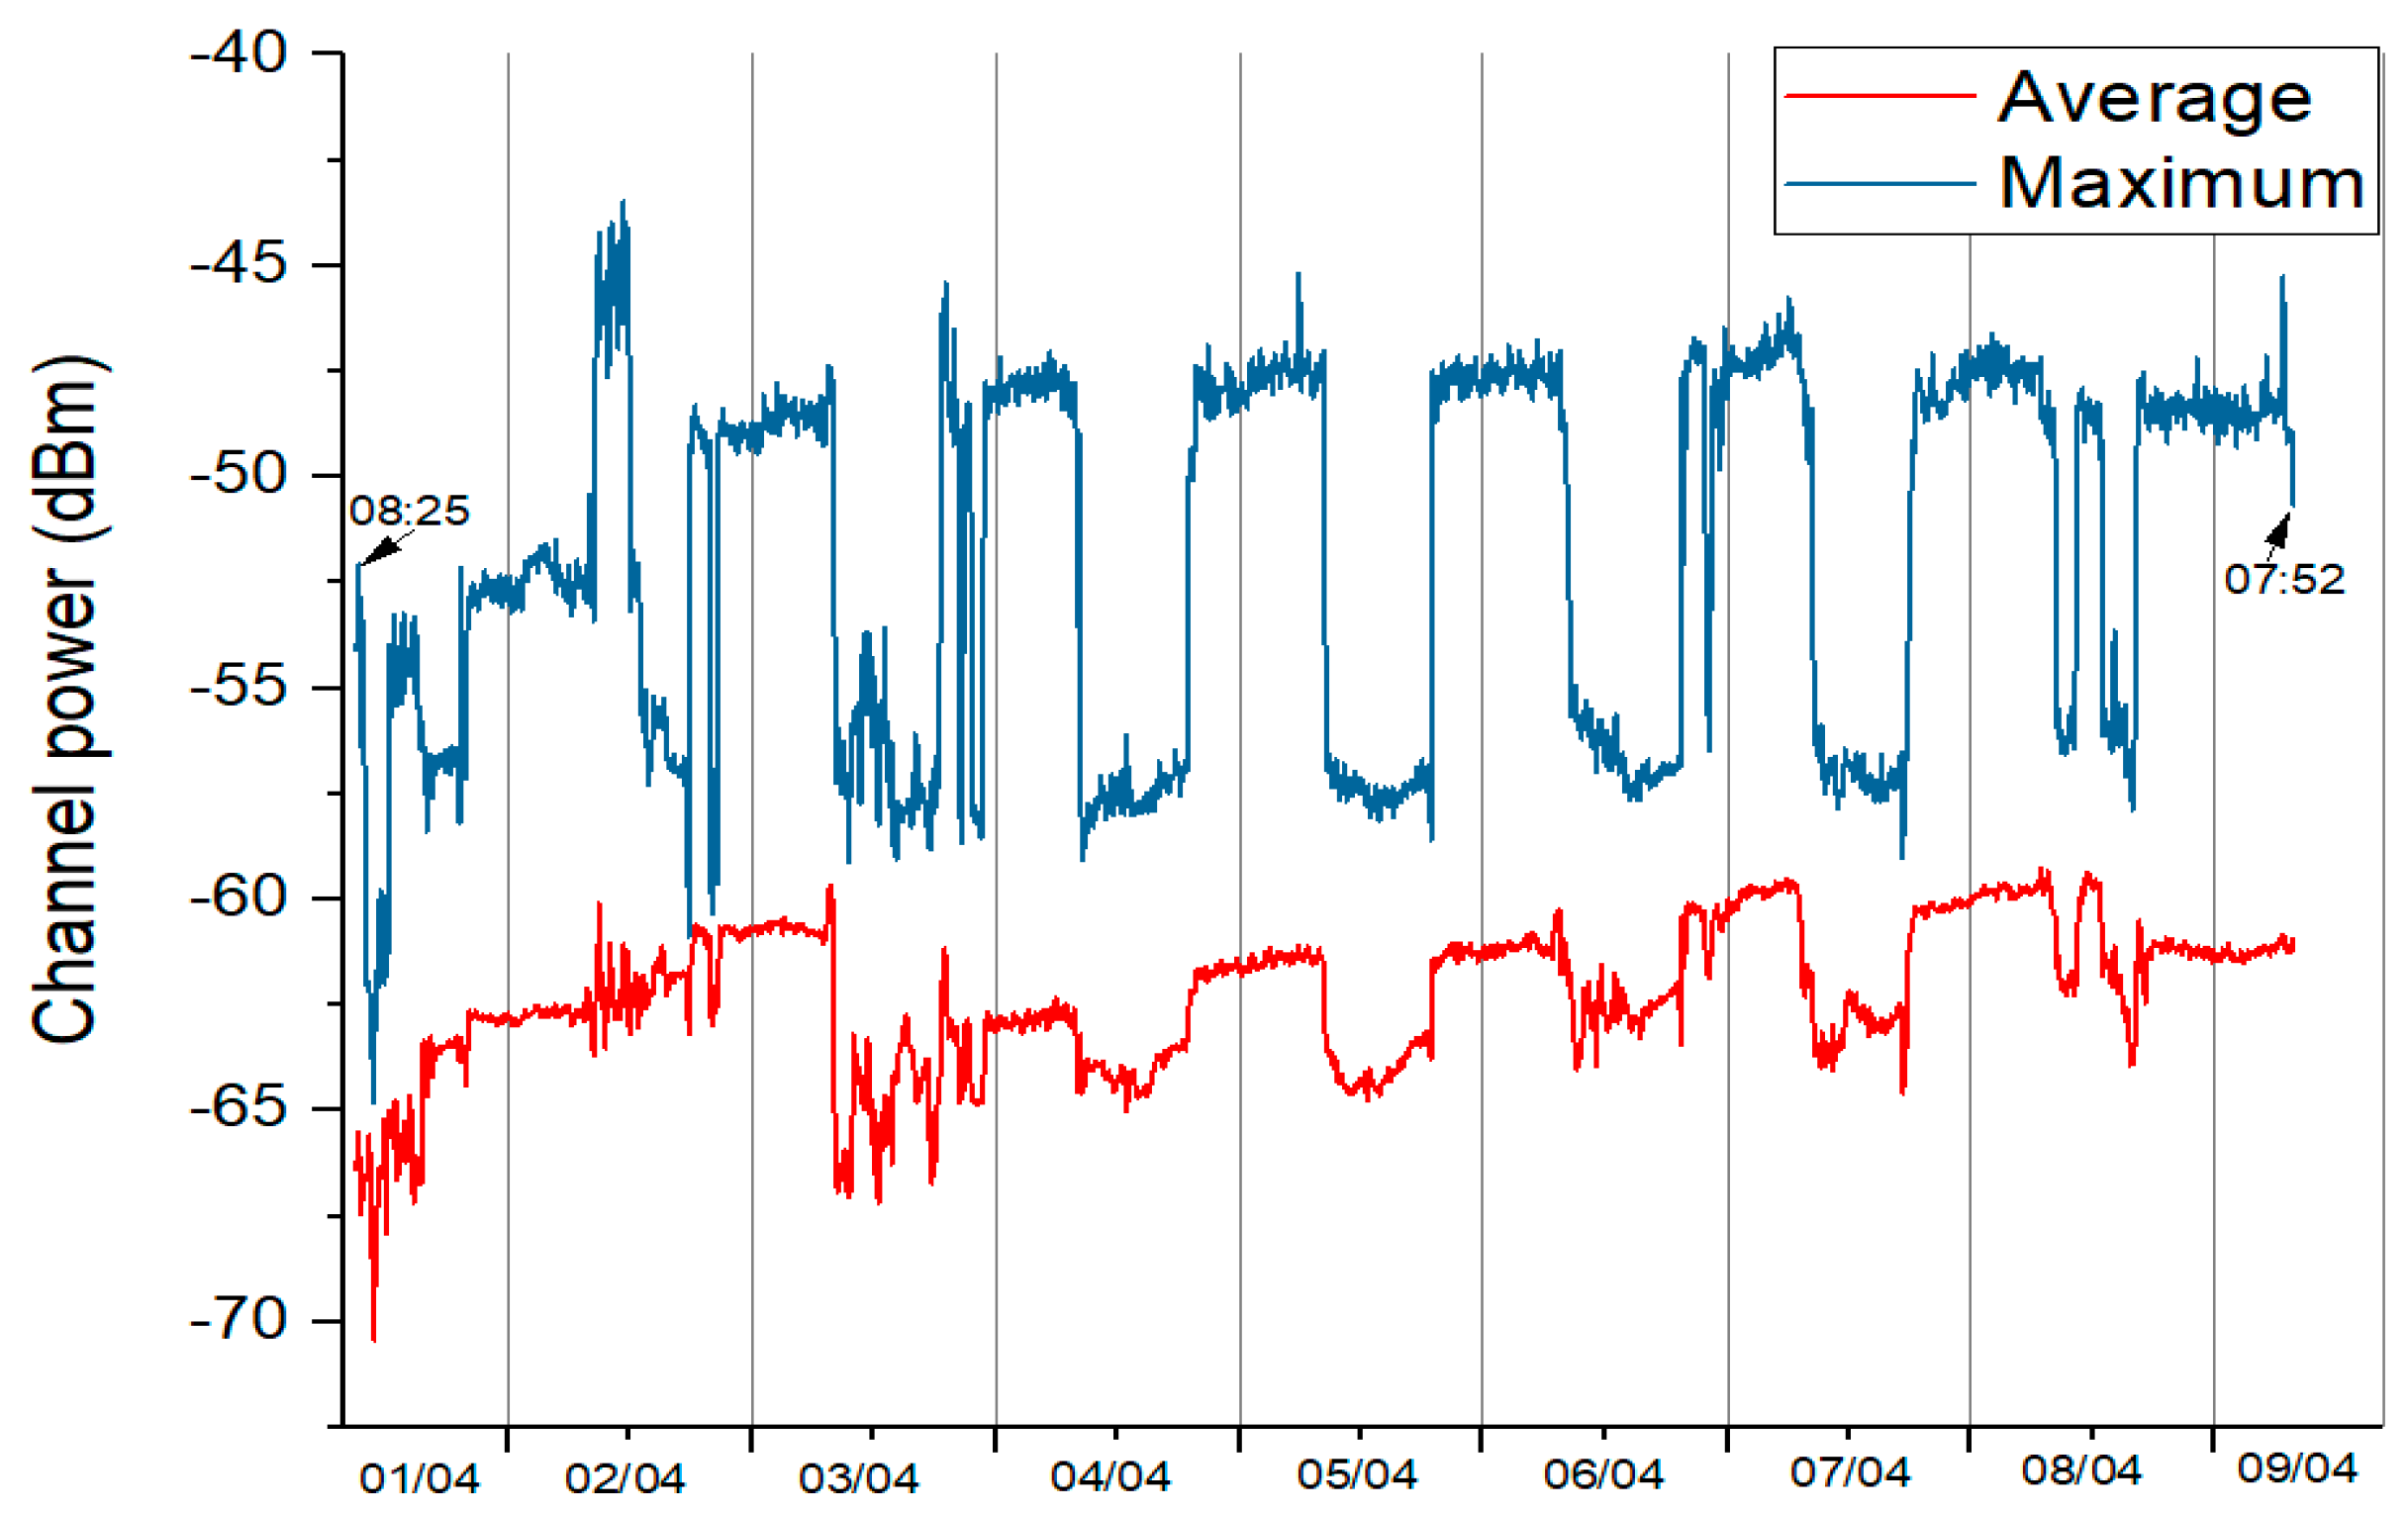
Figure 9 presents the evolution of the maximum and average channel power over the entire measurement period (1–9 April 2026). A clear daily pattern can be observed, with recurring step-like variations between higher night-time levels and lower daytime values. The maximum CP remains relatively stable across days, while the average CP shows gradual variations and increased dispersion. This consistent diurnal behavior further supports the observation that TETRA traffic follows a distinct usage pattern, with sustained or relatively higher activity during night-time compared to daytime periods.
Figure 9.
Temporal variability of TETRA measured CP at the fixed site (Sibiu), 1–9 April 2026.
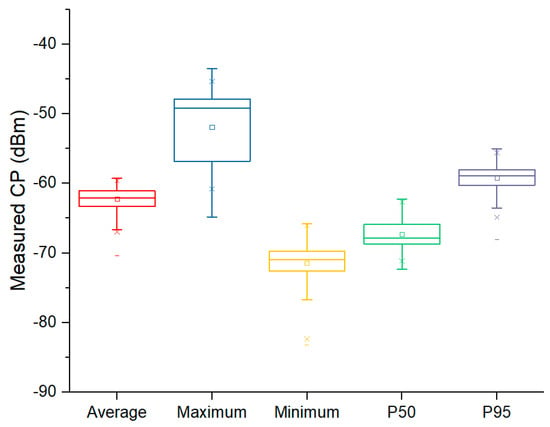
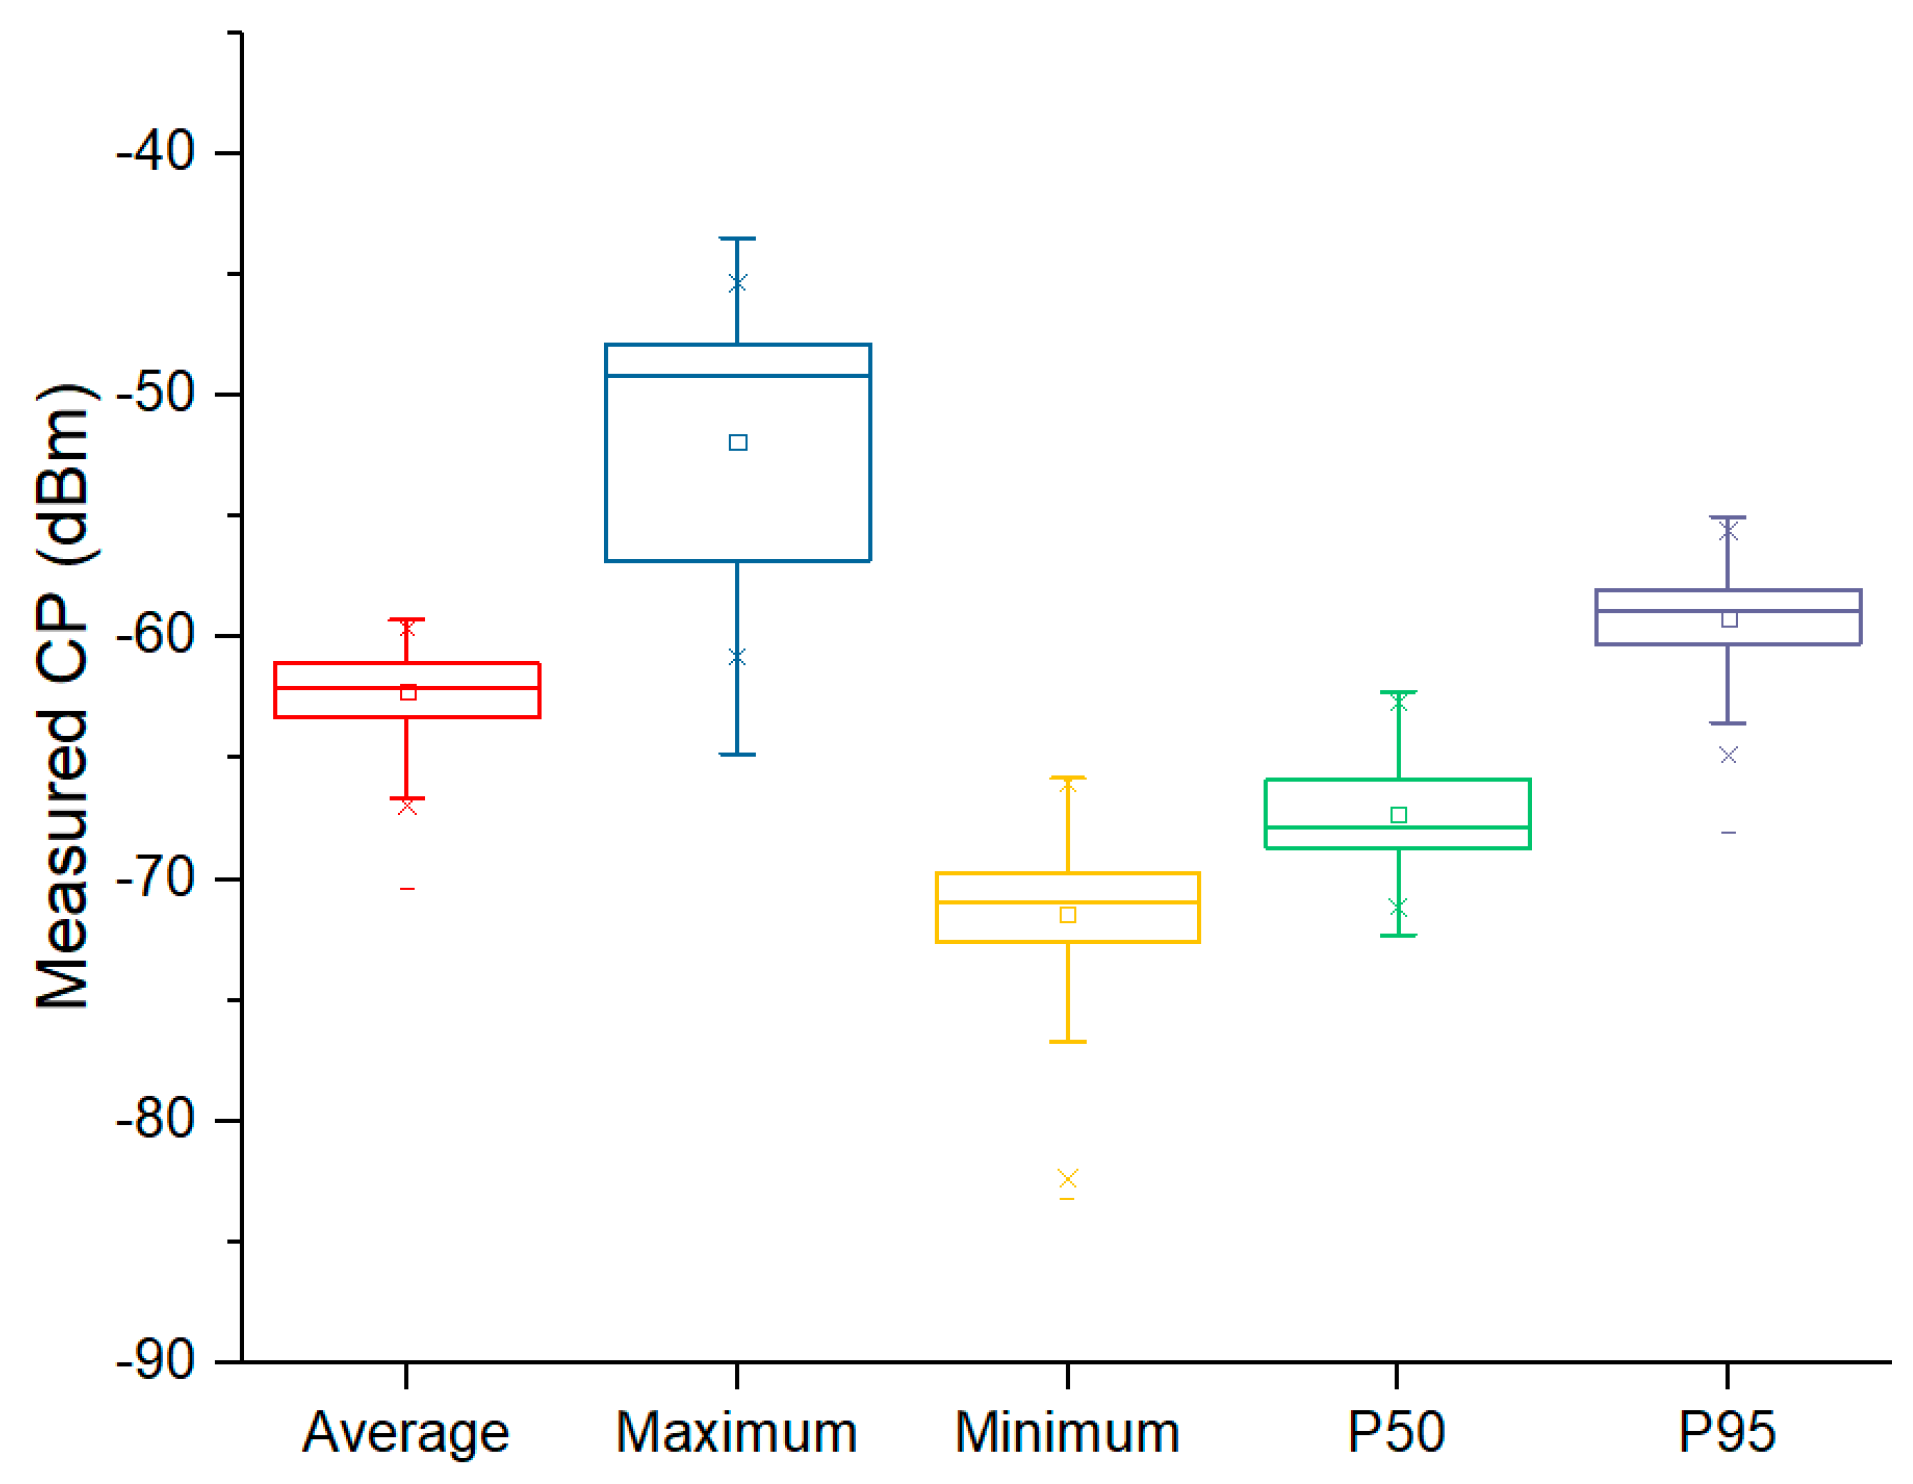
Figure 10 summarizes the statistical distribution of the measured CP over the entire observation period. The results indicate a relatively narrow spread for the average and median (p50) values, confirming stable signal levels at the measurement location. The maximum and p95 values are consistently higher, reflecting peak activity periods, while the minimum values capture low traffic intervals. The limited dispersion across all indicators further supports the conclusion that TETRA emissions remain temporally stable, with variations primarily driven by predictable usage patterns rather than abrupt fluctuations.
Figure 10.
Statistical distribution of TETRA measured CP at the fixed site (Sibiu), 1–9 April 2026.
6. Conclusions
This work demonstrated the feasibility of using a UAV–SDR platform for spatial characterization of TETRA base station emissions, providing reliable and calibrated measurements consistent with propagation theory. The system enables flexible and cost-effective EMF mapping, including in areas difficult to access with conventional methods.
The fixed-site analysis revealed that TETRA emissions exhibit stable temporal behavior with a clear diurnal pattern, which differs from the broadband EMF trend due to the distinct operational profile of mission-critical networks.
Overall, the combination of UAV-based spatial measurements and fixed-site temporal analysis provides a comprehensive framework for assessing TETRA emissions and their contribution to the electromagnetic environment.
Author Contributions
Conceptualization, A.S. and Ș.I.; methodology, A.S. and Ș.I.; software, Ș.I. and A.-M.V.; validation, A.S. and Ș.I.; formal analysis, A.S. and M.C.; investigation, A.S. and Ș.I., resources, Ș.I. and A.-M.V.; data curation, A.S. and M.C.; writing—original draft preparation, A.S.; writing—review and editing, Ș.I. and M.C.; visualization, A.-M.V.; supervision, A.S.; project administration A.S. and Ș.I. All authors have read and agreed to the published version of the manuscript.
Funding
This research received no external funding.
Institutional Review Board Statement
Not applicable.
Informed Consent Statement
Not applicable.
Data Availability Statement
The measurement data is available in the corresponding author private repository. Please contact the authors for the dataset.
Acknowledgments
During the preparation of this manuscript, the authors used ChatGPT (version GPT-5.5) and Consensus for language refinement and literature support. The authors have reviewed and edited the output and take full responsibility for the content of this publication.
Conflicts of Interest
The authors declare no conflicts of interest.
Abbreviations
The following abbreviations are used in this manuscript:
| TETRA | Terrestrial Trunked Radio |
| SDR | Software Defined Radio |
| UAV | Unmanned Aerial Vehicle |
| EMF | Electromagnetic Field |
| RF | Radio Frequency |
| CP | Channel Power |
| FSPL | Free Space Path Loss |
| GPS | Global Positioning System |
| CSVs | Comma-Separated Values |
| SCPI | Standard Commands for Programmable Instruments |
References
- Helbet, R.; Bechet, P.; Monda, V.; Miclaus, S.; Bouleanu, I. Low-Cost Sensor Based on SDR Platforms for TETRA Signals Monitoring. Sensors 2021, 21, 3160. [Google Scholar] [CrossRef] [Scilit] [PubMed]
- Helbet, R.; Monda, V.; Bechet, A.; Bechet, P. Low Cost System for Terrestrial Trunked Radio Signals Monitoring Based on Software Defined Radio Technology and Raspberry Pi 4. In Proceedings of the 2020 International Conference and Exposition on Electrical And Power Engineering (EPE), Iasi, Romania, 22–23 October 2020; pp. 438–441. [Google Scholar] [CrossRef] [Scilit]
- Kandregula, V.; Zaharis, Z.; Ahmed, Q.; Khan, F.; Loh, T.; Schreiber, J.; Serres, A.; Lazaridis, P. A Review of Unmanned Aerial Vehicle Based Antenna and Propagation Measurements. Sensors 2024, 24, 7395. [Google Scholar] [CrossRef] [Scilit] [PubMed]
- Chen, K.; Liu, K.; Chao, C. UAV-Based Environmental Magnetic Field Measurement Method Using a TMR Sensor. IEEE Sens. J. 2024, 24, 16972–16983. [Google Scholar] [CrossRef] [Scilit]
- Mavromatis, F.; Boursianis, A.; Samaras, T.; Koukourlis, C.; Sahalos, J. A Broadband Monitoring System for Electromagnetic-Radiation Assessment. IEEE Antennas Propag. Mag. 2009, 51, 71–79. [Google Scholar] [CrossRef] [Scilit]
- Manassas, A.; Apostolidis, C.; Iakovidis, S.; Babas, D.; Samaras, T. A study of the long term changes in the electromagnetic environment using data from continuous monitoring sensors in Greece. Sci. Rep. 2023, 13, 13784. [Google Scholar] [CrossRef] [Scilit] [PubMed]
- Available online: https://www.monitor-emf.ro/map (accessed on 3 April 2026).
- Saputra, K.; Nazaruddin, N.; Yunardi, D.; Andriyani, R. Implementation of Haversine Formula on Location Based Mobile Application in Syiah Kuala University. In Proceedings of the 2019 IEEE International Conference on Cybernetics and Computational Intelligence (CyberneticsCom), Banda Aceh, Indonesia, 22–24 August 2019; pp. 40–45. [Google Scholar] [CrossRef] [Scilit]
- Hamza, E.; Aziez, S.; Reja, A.; Sabry, A. Identifying some regularities of radio frequency propagation of a radar system by analyzing different environmental effects. East.-Eur. J. Enterp. Technol. 2022, 119, 61–67. [Google Scholar] [CrossRef] [Scilit]
- Faruk, N.; Popoola, S.I.; Surajudeen-Bakinde, N.T.; Oloyede, A.A.; Abdulkarim, A.; Olawoyin, L.A.; Ali, M.; Calafate, C.T.; Atayero, A.A. Path Loss Predictions in the VHF and UHF Bands Within Urban Environments: Experimental Investigation of Empirical, Heuristics and Geospatial Models. IEEE Access 2019, 7, 77293–77307. [Google Scholar] [CrossRef] [Scilit]
- Juang, R. Explainable Deep-Learning-Based Path Loss Prediction from Path Profiles in Urban Environments. Appl. Sci. 2021, 11, 6690. [Google Scholar] [CrossRef] [Scilit]
Disclaimer/Publisher’s Note: The statements, opinions and data contained in all publications are solely those of the individual author(s) and contributor(s) and not of MDPI and/or the editor(s). MDPI and/or the editor(s) disclaim responsibility for any injury to people or property resulting from any ideas, methods, instructions or products referred to in the content. |
© 2026 by the authors. Licensee MDPI, Basel, Switzerland. This article is an open access article distributed under the terms and conditions of the Creative Commons Attribution (CC BY) license.