


Abstract
Wildfires pose serious risks to ecosystems, air quality, and human health. Effective wildfire monitoring requires accurate detection and timely validation, but current approaches are often constrained by fragmented data sources, false alarms, and delays in field verification. This study presents WildfireGO, a multi-source wildfire detection and validation system that integrates crowdsourced observations, satellite hotspot data, and image-based classification in a geospatial monitoring environment. The system combines user-submitted images, Sentinel-2 imagery, and Moderate Resolution Imaging Spectroradiometer (MODIS) hotspot data processed through Google Earth Engine (GEE) to support wildfire detection and verification. Four classification models, namely Convolutional Neural Network (CNN), Random Forest (RF), K-Nearest Neighbors (KNN), and Gradient Boosting (GB), were evaluated using 10-fold cross-validation and an independent test dataset of 800 wildfire-related images. The CNN model produced the best result, with an accuracy of 97.5% on the independent test dataset. By combining image-based classification with crowdsourced reporting, the system helps screen user-submitted wildfire information and reduce false detections. Satellite-derived hotspot data provide spatial evidence for cross-checking reported events and improving spatial situational awareness for wildfire monitoring and response planning. WildfireGO supports near real-time data submission, automated processing, and interactive map-based visualization through a web-based interface. The findings indicate that combining crowdsourced reports, satellite observations, and image classification in a single geospatial system has the potential to support more reliable wildfire detection and provide practical support for environmental monitoring, disaster response, and spatial decision-making.
1. Introduction
Wildfires are among the most destructive natural hazards, affecting ecosystems, biodiversity, air quality, public health, and local economies [1,2,3]. Early and reliable detection is essential for reducing damage and supporting timely response. In recent years, wildfire monitoring has increasingly relied on remote sensing and data-driven approaches, particularly satellite-based hotspot detection and image analysis techniques [4,5,6,7]. Despite these advances, several limitations remain in operational settings, including delays in verification, limited spatial detail, and false alarms [8,9,10].
These challenges are especially relevant in Southeast Asia, where seasonal agricultural burning, forest degradation, and dry-season conditions contribute to recurring wildfire events. In Thailand, wildfires frequently occur during the dry season, particularly in mountainous and remote areas where monitoring infrastructure is limited. Under these conditions, improving the timeliness and reliability of wildfire detection remains an important practical need.
Most existing monitoring systems rely on satellite data, such as Moderate Resolution Imaging Spectroradiometer (MODIS) active-fire products, which are effective for detecting thermal anomalies over large areas [4,11]. However, satellite-based detection can be affected by revisit frequency, cloud cover, spatial resolution, and the lack of ground-level confirmation [12]. Other technologies, including unmanned aerial vehicles (UAVs) and CCTV-based systems, can provide more detailed observations, but their use is often constrained by cost, coverage, maintenance, and operational requirements [9,13]. In addition, image-based detection may be affected by environmental conditions such as sunlight, haze, cloud formations, smoke-like objects, and artificial lighting [8,14].
To address these limitations, this study proposes WildfireGO, a multi-source wildfire detection and validation system that combines crowdsourced images, geolocation data, satellite-derived hotspot information, and image classification techniques. Crowdsourcing and volunteered geographic information (VGI) can provide near real-time, ground-level observations that complement satellite-based monitoring [15,16,17]. In the proposed system, users submit images and location information through mobile devices, allowing local observations to be incorporated into the wildfire detection process. These reports are then cross-checked with satellite-derived hotspot information to improve the reliability of detected events.
The dataset used in this study consists of crowdsourced images collected under diverse real-world conditions, including variations in lighting, viewing angles, device types, and environmental backgrounds. Such variability makes classification more challenging but also improves the practical relevance of the study compared with experiments based only on controlled image datasets.
The proposed system uses multiple geospatial data sources, including Sentinel-2 imagery, MODIS hotspot data, digital elevation models, and derived indices such as the Normalized Difference Vegetation Index (NDVI) and Normalized Burn Ratio (NBR) [18]. For image classification, four algorithms are evaluated: Convolutional Neural Network (CNN), Random Forest (RF), K-Nearest Neighbors (KNN), and Gradient Boosting (GB). CNN-based methods have shown strong performance in wildfire and smoke detection [2,6,19], while conventional machine learning algorithms remain useful due to their computational efficiency and interpretability [1,20].
Recent developments in artificial intelligence, including YOLO-based object detection models, Vision Transformers (ViTs), multimodal learning approaches, AI-assisted environmental monitoring systems, and machine-learning-based wildfire susceptibility assessment, have demonstrated significant potential for wildfire detection and related hazard-monitoring applications [21,22,23].
Furthermore, advances in artificial intelligence have supported a wide range of applications in climate-change mitigation, environmental intelligence, smart-city management, and geospatial decision-support systems, highlighting their growing role in sustainable environmental management and disaster response [24,25,26,27,28,29,30].
WildfireGO was developed as a web-based geospatial system that supports data submission, image processing, classification, validation, and visualization. The platform allows users to report suspected wildfire events, processes submitted images using classification models, and displays validated information together with satellite-derived hotspot data on an interactive map. This design supports both automated analysis and human interpretation, which are important for practical wildfire monitoring and decision-making.
Unlike previous studies that mainly focus on single-source detection or model performance alone, this study emphasizes the integration of heterogeneous data sources in an operational workflow. By combining crowdsourced reports, AI-based image classification, and satellite-based validation, the proposed system addresses two common problems in wildfire monitoring: false detection and the lack of timely ground-level verification.
Unlike existing wildfire monitoring studies that primarily focus on image classification, satellite hotspot detection, or standalone visualization systems, WildfireGO integrates crowdsourced reporting, AI-based image screening, satellite-derived hotspot validation, and geospatial visualization within a single operational workflow. The novelty of the proposed system lies in its multi-source validation framework, which combines field-level observations and satellite-derived evidence to improve wildfire verification and reduce false detections in practical monitoring environments.
The main contributions of this study are summarized as follows:
- A multi-source wildfire validation framework is proposed, integrating crowdsourced observations, satellite-derived hotspot information, and AI-based image classification to improve wildfire detection reliability and reduce false alarms.
- A comparative evaluation of four image classification models, namely CNN, RF, KNN, and GB, is conducted using real-world crowdsourced wildfire images collected under diverse environmental conditions.
- WildfireGO, a web-based geospatial platform, is developed and implemented to support wildfire reporting, automated image analysis, spatial validation, interactive visualization, and decision support for operational wildfire monitoring.
2. Related Works
Research on wildfire detection has progressed with advances in computer vision, remote sensing, machine learning, and geospatial technologies. Existing studies can be grouped into several major approaches, including traditional machine learning, deep learning-based image classification, object detection and lightweight models, and methods for reducing false alarms and data limitations.
2.1. Traditional Machine Learning Approaches
Early wildfire detection studies commonly relied on handcrafted feature extraction combined with conventional machine learning algorithms. For example, techniques based on Radon Transform and Higher-Order Statistics (HOS), followed by Support Vector Machine (SVM) classification, have achieved promising results under controlled experimental conditions [1]. UAV-based approaches using color segmentation, such as the YCbCr color space, and hybrid models combining Backpropagation Neural Networks and SVM have also been applied to wildfire detection and risk assessment [2].
Although these methods can perform well in specific settings, their effectiveness depends heavily on manually designed features. This limits their ability to generalize to complex outdoor environments, where smoke, haze, sunlight, cloud formations, and background objects may vary considerably [14]. The limitation becomes more pronounced when dealing with crowdsourced images, which are often captured using different devices, viewing angles, lighting conditions, and image resolutions. For this reason, traditional machine learning algorithms, including RF, KNN, and GB, are included in this study as comparative models [20].
2.2. Deep Learning for Image Classification
Deep learning has been widely adopted to overcome the limitations of handcrafted features. CNNs are particularly effective for extracting spatial features from images and have been applied extensively in wildfire and smoke detection. Previous studies have reported strong classification performance using architectures such as ResNet50 and Xception, with reported accuracies often exceeding 98% under well-prepared datasets [3,4]. Modified CNN architectures have also been developed to classify different fire-related conditions, including flame, smoke, and burned areas [5].
Recent developments, such as EfficientNet and Vision Transformer (ViT), further improve feature representation and model scalability [15,16]. These models offer strong potential for wildfire image analysis, especially when large and diverse datasets are available. However, their performance may be affected when images are collected under uncontrolled conditions, such as crowdsourced reporting environments. User-submitted images often contain inconsistent quality, occlusions, irrelevant objects, and environmental interference. Therefore, evaluating image classification models using data collected under practical conditions remains important for assessing their suitability in operational wildfire monitoring systems.
2.3. Object Detection and Lightweight Models
In addition to image classification, object detection methods have been used to identify and localize fire or smoke regions within images. Some studies have adopted two-stage frameworks that combine classification with segmentation models, such as UNet and SegNet, for burned-area mapping and fire-related feature extraction [7]. In UAV-based wildfire monitoring, YOLO-based models have demonstrated good potential for real-time fire and smoke detection because of their ability to localize objects efficiently [8,17].
Lightweight models have also been developed to support deployment in resource-constrained environments, including mobile devices and embedded systems such as Jetson Nano [9]. Techniques such as model compression, image tessellation, and simplified network architectures have been used to reduce computational cost while maintaining acceptable detection performance [10]. These studies show the importance of balancing accuracy, processing speed, and deployment feasibility in wildfire monitoring applications [19]. However, many of these approaches focus mainly on model performance and less on how detection outputs can be integrated with geospatial information, user reports, and satellite-derived evidence for operational decision support.
2.4. Handling False Alarms and Data Limitations
False alarms remain one of the major challenges in wildfire detection. Environmental factors such as sunlight, haze, cloud formations, smoke-like objects, and artificial lighting can lead to incorrect classification or detection results. Some studies have attempted to reduce false alarms by adding more training classes to distinguish fire and smoke from visually similar conditions [11]. Others have used contextual modeling, attention mechanisms, and Graph Convolutional Networks (GCN) to improve model robustness under complex environmental conditions [12].
Data limitations also affect wildfire detection performance. Wildfire images are often difficult to collect due to safety concerns, geographical constraints, and the unpredictable nature of fire events. To address this issue, some researchers have used Generative Adversarial Networks (GANs) to generate synthetic wildfire images and expand training datasets [13]. More recent studies have explored multi-source approaches by combining image-based detection with satellite-derived hotspot data to improve reliability compared with single-source methods [20,21]. Nevertheless, the practical integration of these data sources into a usable monitoring platform remains less developed.
2.5. Research Gap and Contribution of This Study
Although previous studies have advanced wildfire detection through machine learning, deep learning, object detection, and remote sensing, several gaps remain. Many studies focus primarily on improving model accuracy using single-source datasets, while fewer studies address how detection results can be validated and used in an operational geospatial environment. In particular, the integration of crowdsourced ground-level observations with satellite-based hotspot information is still limited, especially in systems that support data submission, automated classification, spatial validation, and visualization within the same workflow.
Crowdsourced images also introduce practical challenges that are not fully represented in controlled datasets. These images may vary in lighting, angle, distance, resolution, background conditions, and device type. As a result, a model that performs well on curated datasets may not perform equally well when applied to user-generated data. This highlights the need to evaluate wildfire detection models using data collected under practical reporting conditions.
This study addresses these gaps by proposing WildfireGO, a web-based multi-source wildfire detection and validation system that combines crowdsourced observations, satellite hotspot data, and AI-based image classification. The study evaluates CNN, RF, KNN, and GB models using real-world user-submitted images and incorporates satellite-derived hotspot information to support spatial validation. By linking image classification, crowdsourced reporting, and geospatial visualization in a single operational workflow, the proposed system provides a practical approach for improving wildfire monitoring and decision support.
Table 1 compares previous wildfire monitoring approaches with the proposed WildfireGO system. Most existing studies focus on either image-based classification, UAV-based detection, or satellite-derived hotspot analysis. Although these approaches have contributed to wildfire detection, they generally rely on a single data source or emphasize model performance rather than operational integration. In contrast, WildfireGO combines crowdsourced observations, AI-based image classification, satellite-derived hotspot data, and web-based geospatial visualization in a single workflow. This integration enables user-submitted reports to be screened using image classification and further cross-checked with satellite-based evidence, providing a practical multi-source validation mechanism for wildfire monitoring.
Table 1.
Comparison of previous wildfire monitoring approaches and the proposed WildfireGO system.
3. Methodology
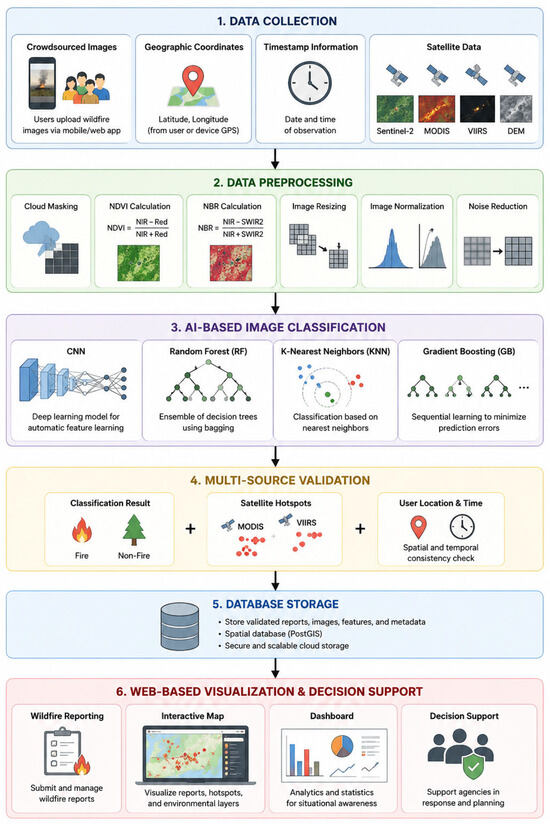
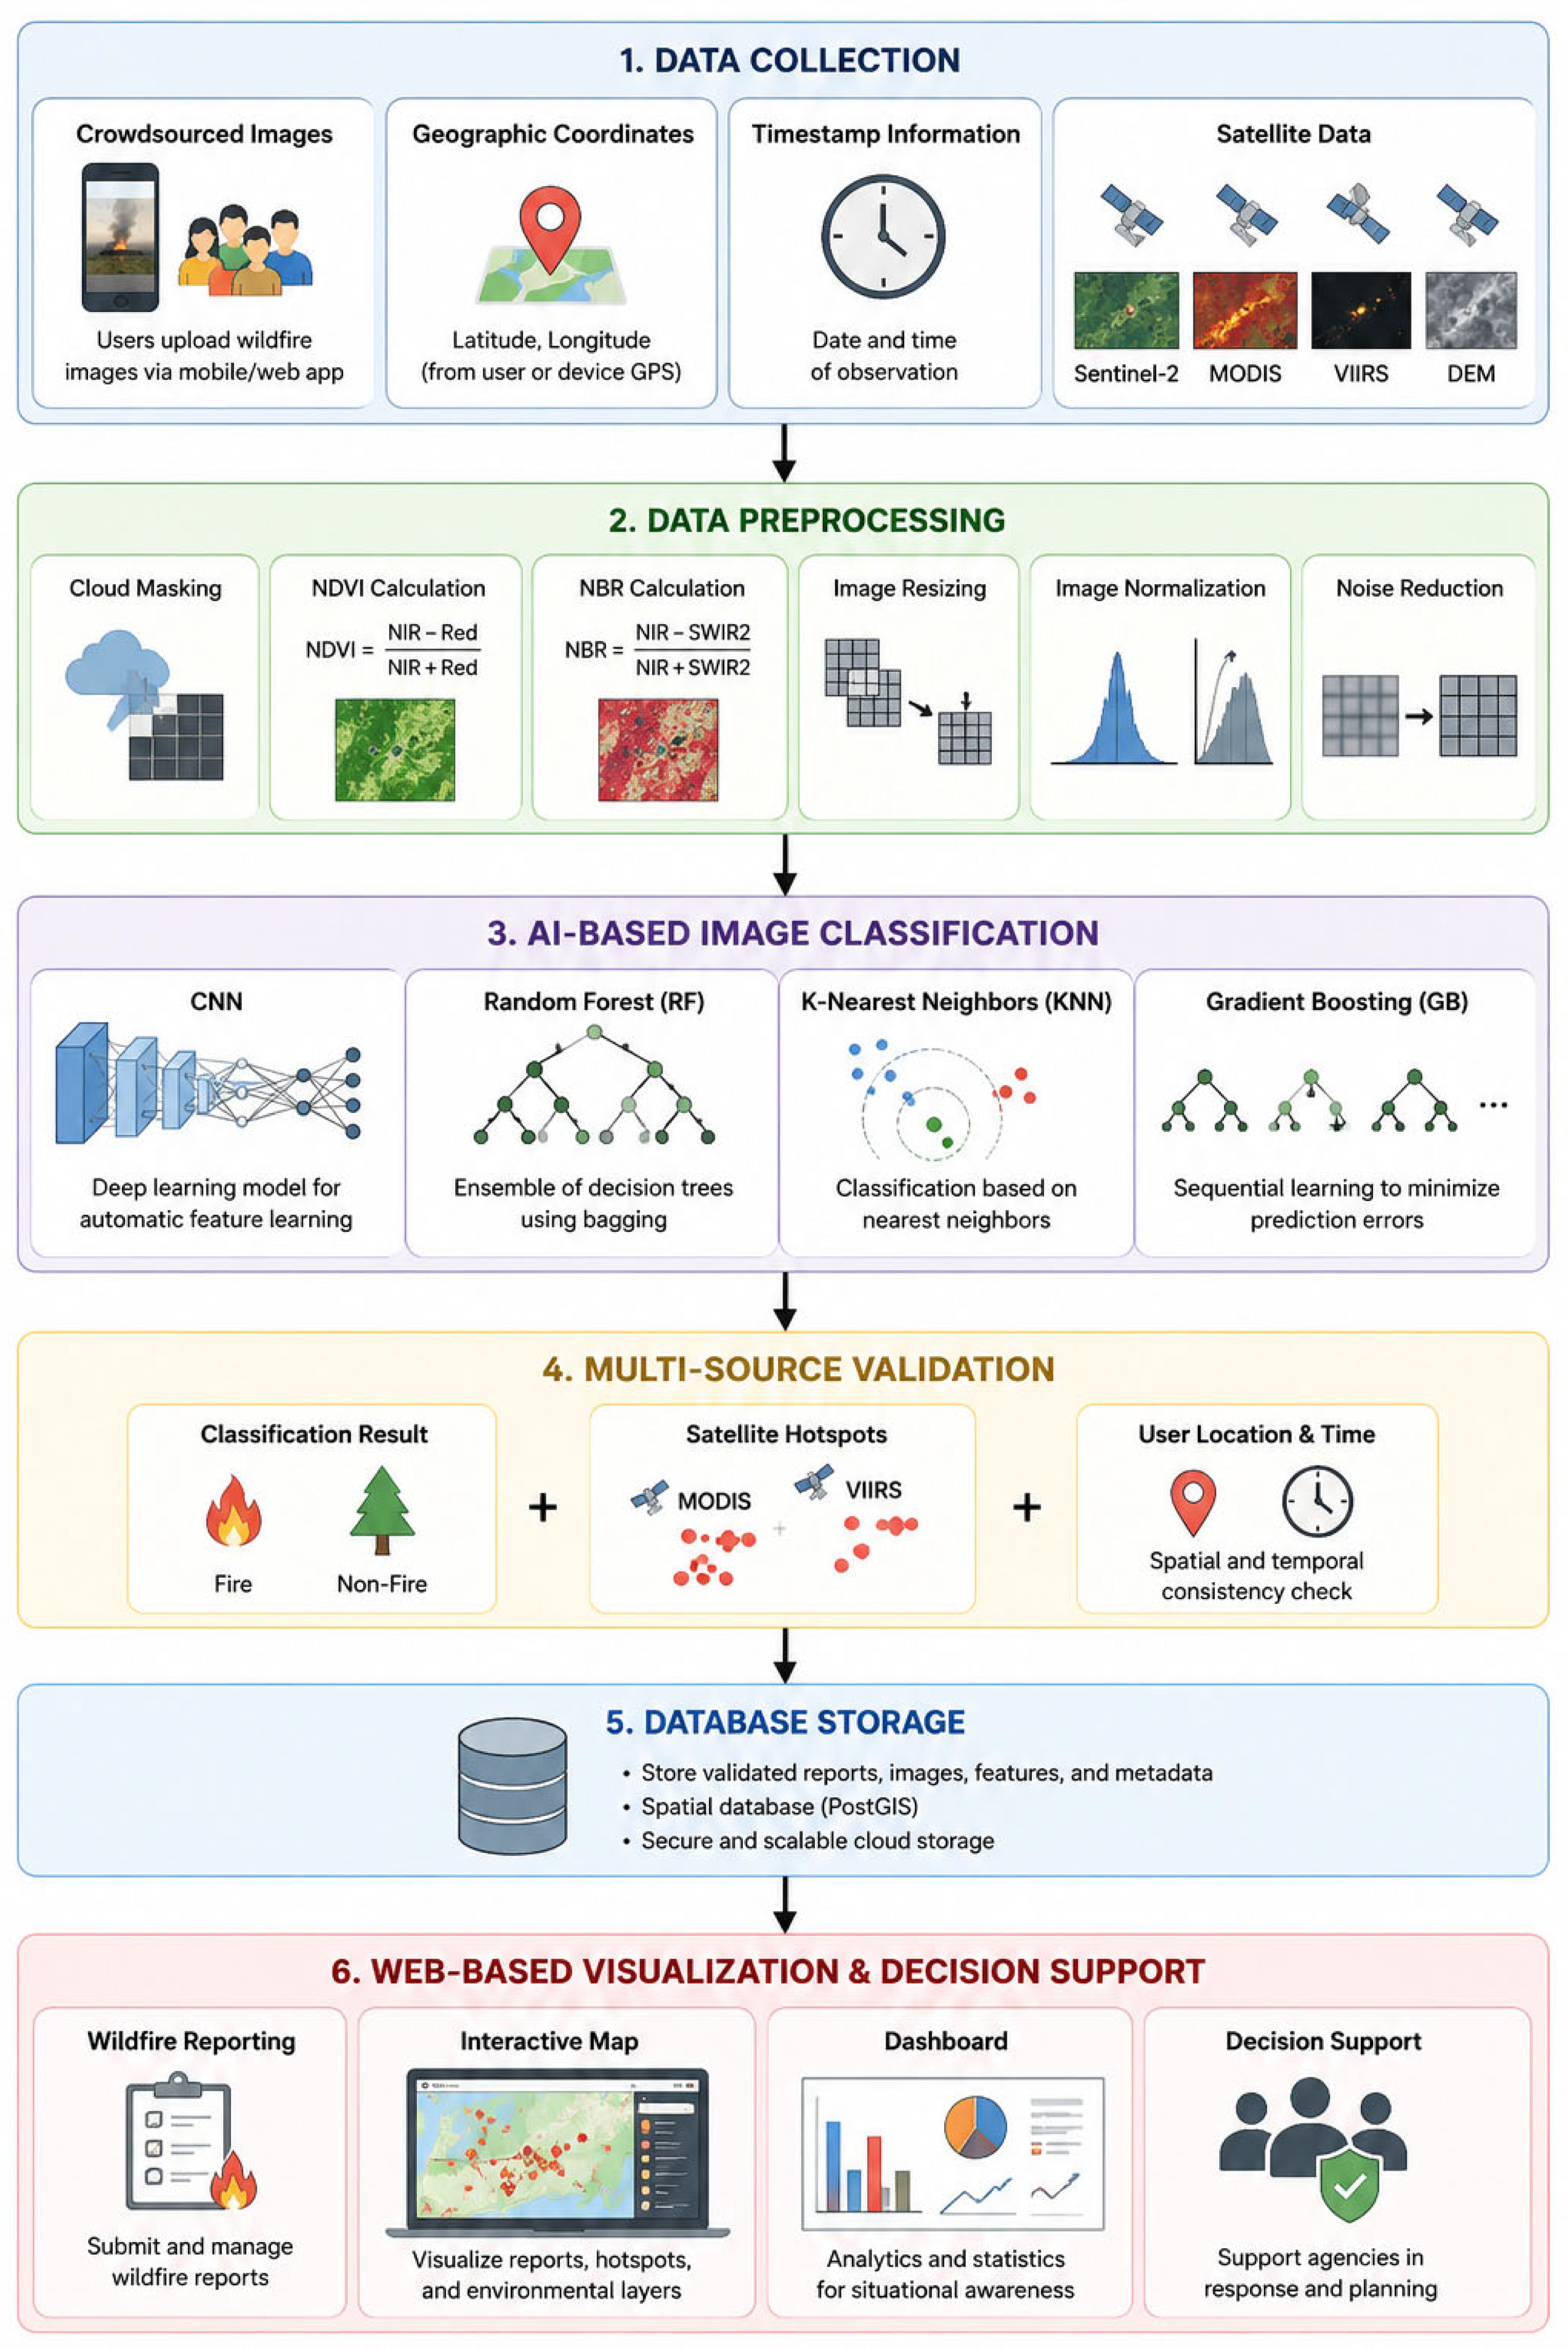
This section describes the methodology used to develop and evaluate the proposed WildfireGO wildfire detection and validation system. The study integrates multi-source geospatial data, crowdsourced observations, satellite-derived information, and artificial intelligence (AI)-based image classification to support wildfire monitoring and reduce false detections. The overall methodological workflow is illustrated in Figure 1, which summarizes the major processes, including data collection, preprocessing, AI-based image classification, multi-source validation, database integration, and web-based visualization. The following subsections provide detailed descriptions of the system architecture, data sources, preprocessing procedures, classification models, implementation framework, validation approach, and performance evaluation methods.
Figure 1.
Methodological workflow of the WildfireGO framework integrating crowdsourced observations, satellite-derived data, AI-based image classification, multi-source validation, and web-based geospatial decision support.
3.1. System Architecture
This study proposes WildfireGO, a web-based wildfire detection and validation system that combines AI-based image classification, geospatial analysis, satellite hotspot data, and crowdsourced reporting. The system was designed to address the limitations of single-source wildfire detection by linking satellite observations with user-generated data collected from the field.
The architecture consists of four main components: data acquisition, data processing and AI-based classification, database and backend management, and web-based visualization. Satellite data provide broad spatial coverage and environmental context, while crowdsourced reports provide local observations that can support timely verification. By combining these sources, the system supports wildfire reporting, image analysis, spatial validation, and map-based visualization in a single workflow.
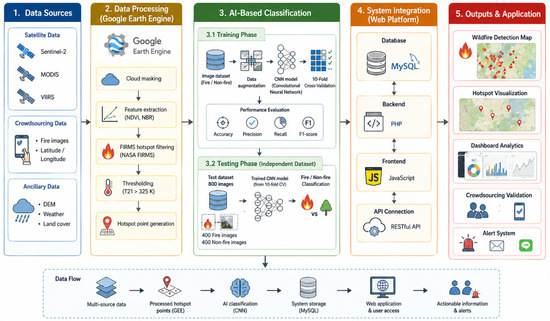
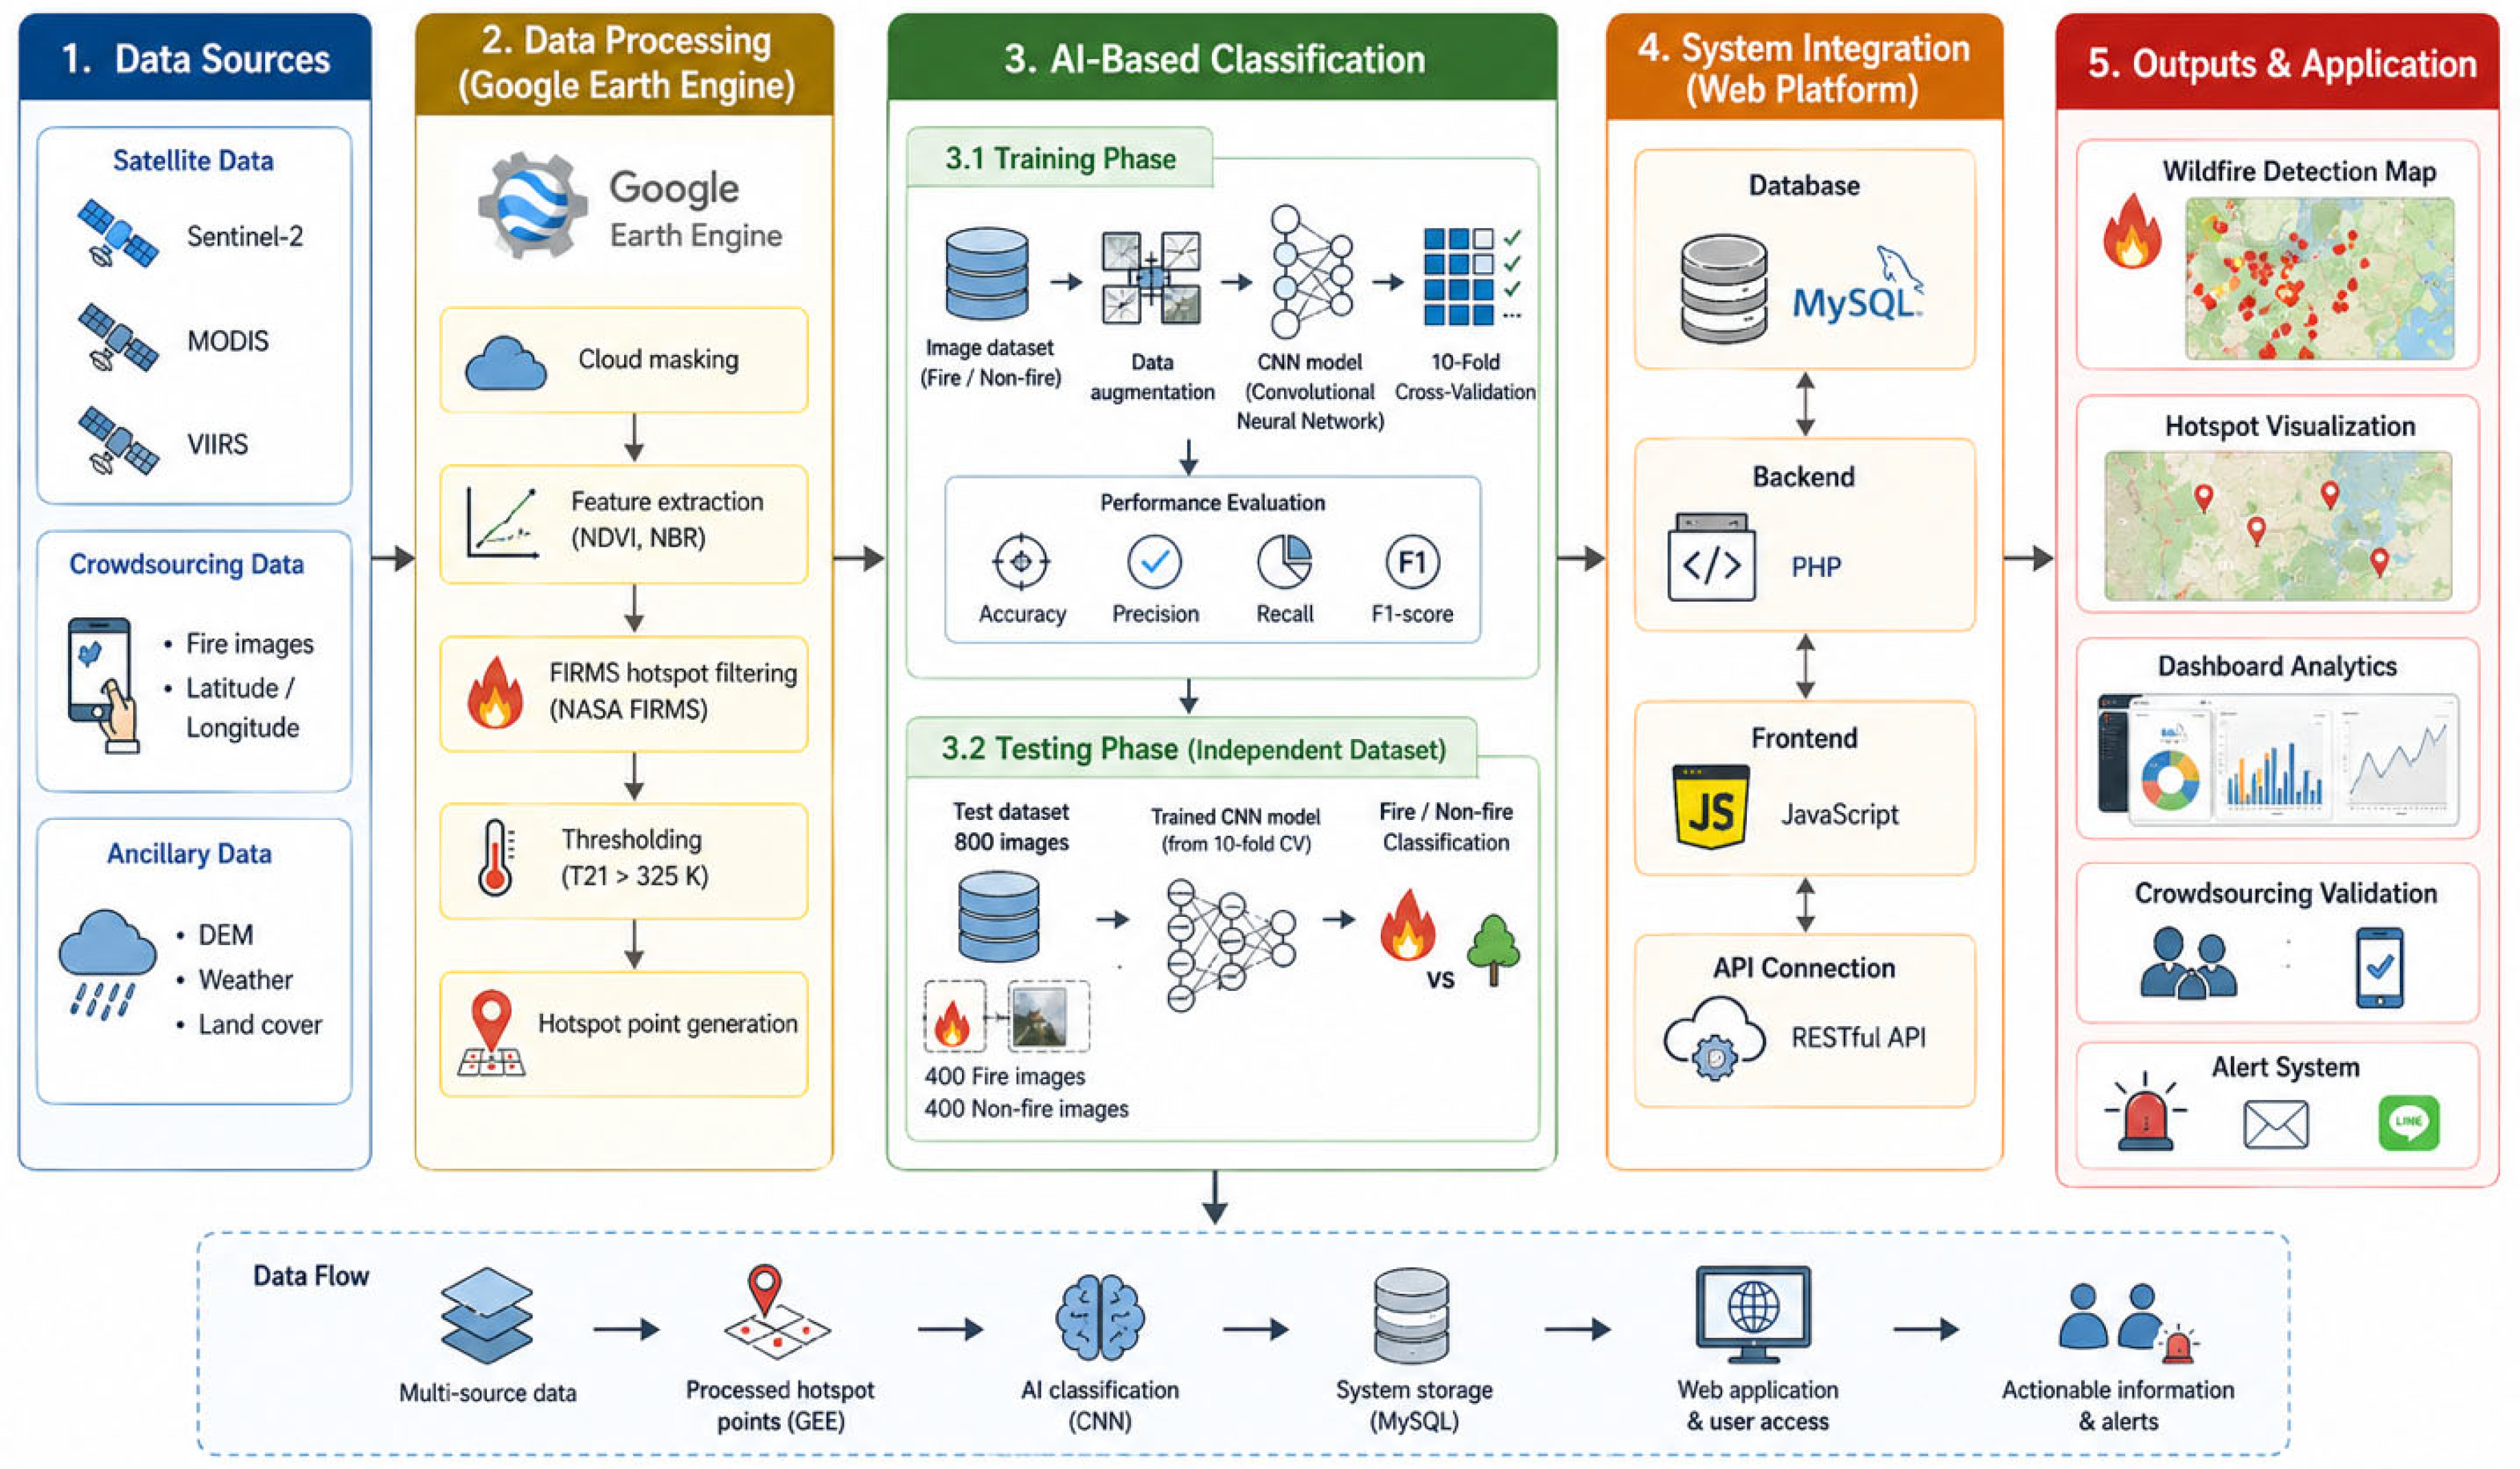
The overall system architecture is illustrated in Figure 2. The figure shows the flow of data from user submission and satellite data retrieval to image classification, database storage, validation, and visualization.
Figure 2.
Overview of the proposed WildfireGO system architecture integrating satellite data, crowdsourced data, AI-based classification, and geospatial analysis.
The WildfireGO platform was deployed using a client–server architecture. The frontend was developed using JavaScript and HTML to support interactive user operations, including wildfire reporting, map visualization, and dashboard analytics. The backend was implemented using PHP (The PHP Group, New York, NY, USA), which handles data processing, communication between system components, and integration with external geospatial services. A MySQL (Oracle Corporation, Austin, TX, USA) database was used to store wildfire reports, image metadata, classification results, hotspot information, and spatial attributes.
Satellite-derived hotspot data and environmental layers were processed using GEE (Google LLC, Mountain View, CA, USA). The platform retrieves and processes MODIS active-fire data, Sentinel-2 imagery, and digital elevation data through GEE workflows before exporting the results for integration into the web platform. User-submitted reports, including images, geographic coordinates, and timestamps, are transferred to the server through web-based APIs, where image classification and validation procedures are performed automatically.
The processing pipeline consists of five stages: (1) data acquisition from crowdsourced reports and satellite sources, (2) preprocessing and feature preparation, (3) AI-based image classification, (4) multi-source validation using hotspot information and spatial–temporal consistency checks, and (5) visualization through interactive maps and dashboard interfaces. This architecture enables near real-time wildfire monitoring and decision support.
This design allows wildfire-related information from different sources to be processed and displayed through an operational web platform for monitoring and decision support.
3.2. Data Sources and Collection
The proposed system uses both satellite-derived data and crowdsourced observations for wildfire detection and validation. Satellite data provide broad spatial coverage and environmental information, while crowdsourced reports provide local evidence from areas where wildfire events are observed.
Sentinel-2 imagery was used to derive vegetation- and burn-related indices, including the NDVI and the NBR. These indices were used to assess vegetation conditions and possible fire-affected areas. MODIS active-fire data obtained from the NASA Fire Information for Resource Management System (FIRMS) platform were used to identify thermal anomalies and hotspot locations. The MODIS active-fire product provides hotspot detection at a spatial resolution of approximately 1 km, making it suitable for large-scale wildfire monitoring and regional hotspot analysis. Although MODIS offers broad spatial coverage and long-term observation records, its detection capability may be affected by cloud cover, atmospheric conditions, satellite overpass timing, and spatial resolution limitations. Small or short-duration fire events may not always be detected. Therefore, satellite-derived hotspot information was integrated with crowdsourced observations and image-based classification to improve wildfire validation and monitoring reliability. In addition, Digital Elevation Model (DEM) data were included to provide terrain information that may influence wildfire occurrence and accessibility.
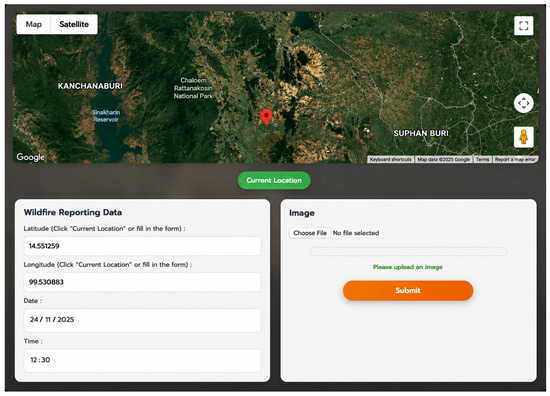
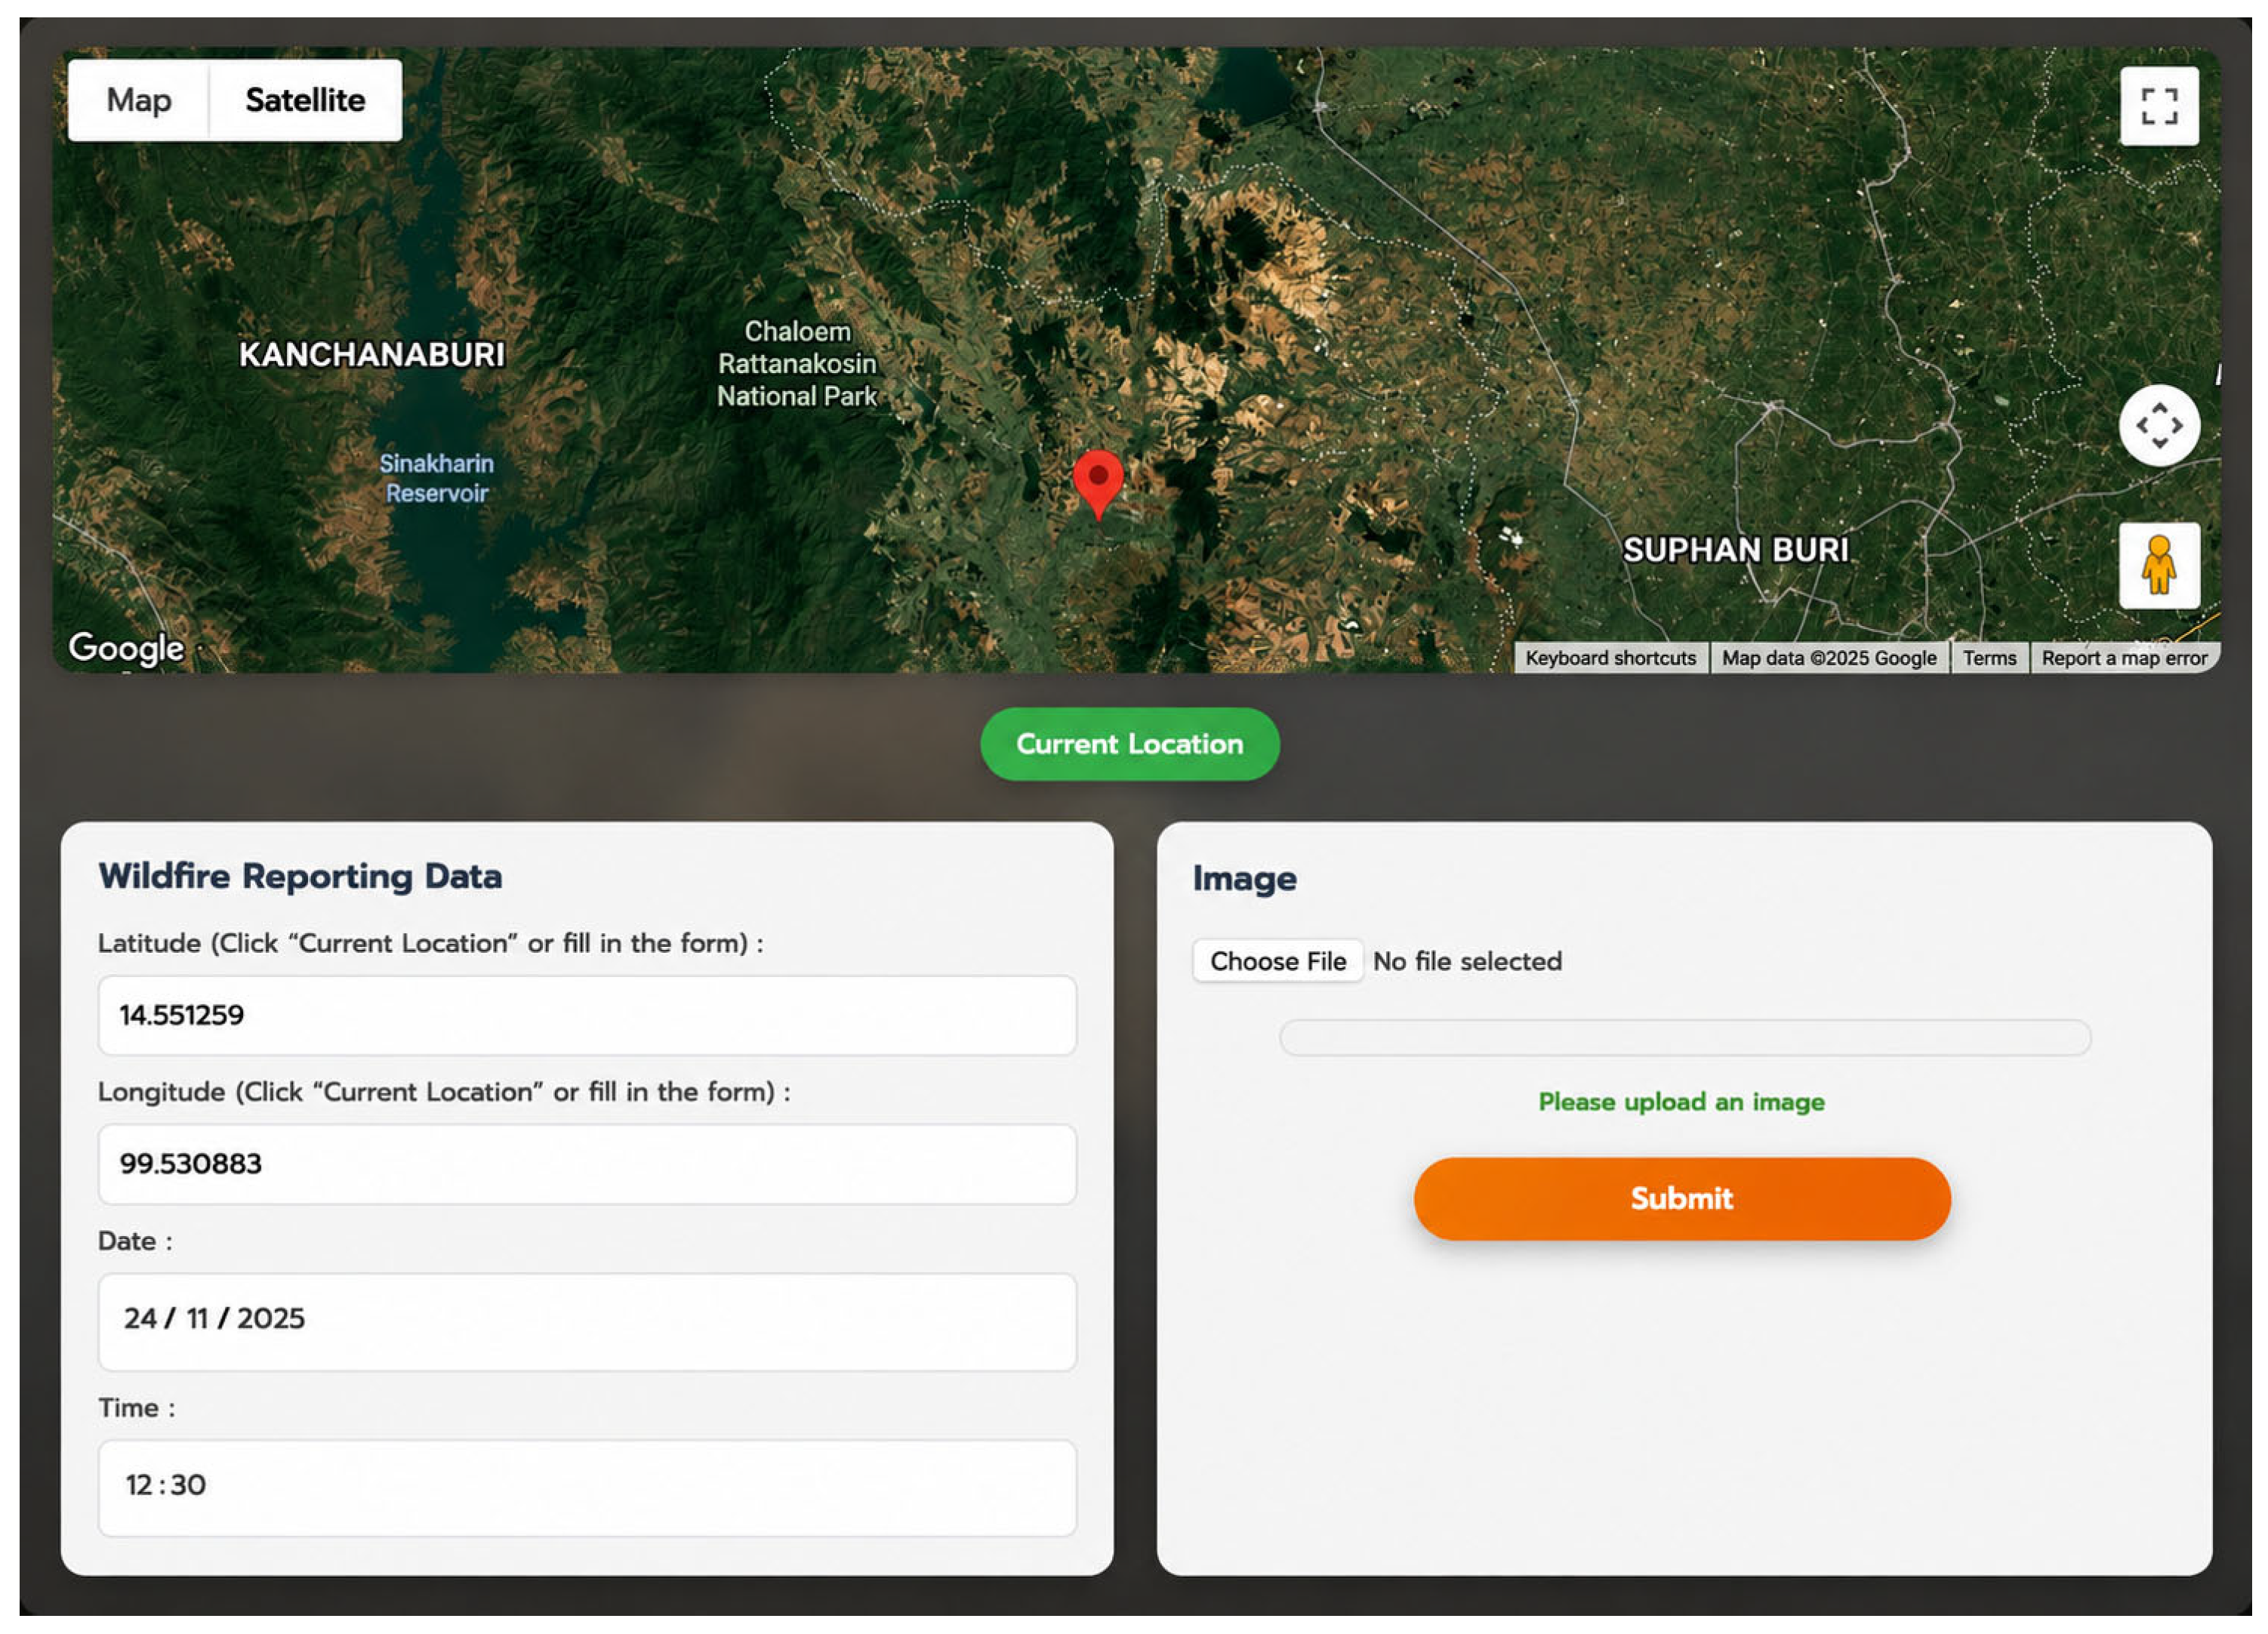
Crowdsourced data were collected through the WildfireGO web interface. Users could report suspected wildfire incidents by submitting an image, geographic coordinates, date, and time information. Geographic coordinates could be obtained automatically using the device location service through the Current Location function or entered manually when automatic positioning was unavailable. Each report was associated with spatial and temporal metadata to support subsequent validation and visualization processes.
To improve data quality, reports with missing images or incomplete metadata were not accepted by the system. Duplicate reports originating from the same location and timestamp were flagged for review. In addition, uploaded images were screened using the AI-based classification model before being stored in the database. Images classified as non-fire were rejected, reducing the likelihood of false or irrelevant reports entering the monitoring workflow. Although user identity verification was beyond the scope of this study, the combination of AI-based image screening and satellite hotspot validation provided an initial quality-control mechanism for reducing false, irrelevant, or potentially misleading submissions before they were incorporated into the monitoring workflow.
The submitted images formed the main dataset for the image classification task. These field-level observations complement satellite-based hotspot data by providing more detailed visual evidence and more timely information from local areas. By combining satellite products and user-submitted reports, the system improves the ability to cross-check wildfire events from different sources. This approach helps reduce reliance on a single data source and supports more reliable wildfire monitoring in areas where field verification is difficult.
3.3. Data Preprocessing
Before analysis, satellite data and crowdsourced images were preprocessed to improve data quality and ensure consistency across the workflow. For satellite data, cloud masking was applied to Sentinel-2 imagery to reduce atmospheric interference and improve the reliability of spectral information. Vegetation- and burn-related indices were then derived to support the interpretation of vegetation conditions and potential fire-affected areas.
The NDVI was selected because it is widely used to assess vegetation health, density, and vigor. Wildfire occurrence is closely related to vegetation conditions, as dry or degraded vegetation may increase fire susceptibility. NDVI therefore provides important information for identifying vegetation status surrounding reported wildfire locations and supports the interpretation of environmental conditions associated with wildfire events.
The NDVI was calculated to assess vegetation conditions using the near-infrared and red bands:
NDVI = (NIR − RED)/(NIR + RED)
Higher NDVI values generally indicate dense and healthy vegetation, whereas lower values may indicate sparse vegetation, degraded land, or burned areas. In addition, the NBR was calculated using the near-infrared and shortwave infrared bands:
NBR = (NIR − SWIR)/(NIR + SWIR)
NBR is commonly used to identify burned areas and assess fire-related changes in vegetation and surface conditions. In this study, NDVI and NBR were used together with MODIS hotspot data to support spatial interpretation and validation of reported wildfire events.
The NBR was included because it is specifically designed for wildfire and burned-area assessment. NBR is highly sensitive to changes in vegetation structure and moisture content caused by fire, making it effective for detecting burn scars and evaluating fire impacts. Previous wildfire studies have widely adopted NBR for post-fire assessment and burned-area mapping. In this study, NDVI and NBR were used together to provide complementary information on vegetation conditions and potential fire-affected areas, supporting the spatial validation process within the WildfireGO framework.
For crowdsourced images, preprocessing included resizing, normalization, and noise reduction. Image resizing was performed to standardize the input dimensions required by the classification models, while normalization was used to scale pixel values into a consistent range. A median filtering technique was applied for noise reduction because it effectively suppresses impulse noise while preserving edge information and fire-related visual characteristics. This step helps improve image consistency and supports more reliable image classification. The images were manually labeled into two classes: fire and non-fire. The annotation process was performed by a researcher with experience in wildfire image interpretation and environmental monitoring. To improve labeling consistency, ambiguous images were reviewed multiple times before being assigned to a class and included in the final dataset.
The image dataset was obtained from user submissions and therefore reflected practical reporting conditions, including differences in lighting, viewing angle, camera quality, distance from the fire source, and background complexity. The dataset included images containing visible flames, smoke, haze, vegetation backgrounds, cloud formations, sunlight effects, and other visually challenging conditions that may resemble wildfire-related phenomena. Such variability increases classification difficulty but provides a more realistic evaluation of model performance under operational reporting environments. These variations make classification more challenging but are important for evaluating the system under realistic conditions. After preprocessing, the dataset was used to train and evaluate the AI-based classification models.
These preprocessing steps ensured that both satellite-derived data and crowdsourced images were suitable for subsequent classification, spatial validation, and integration into the WildfireGO platform.
3.4. AI-Based Classification Models
Four classification algorithms were implemented and compared in this study: CNN, RF, KNN, and GB. The CNN model was used as the main deep learning approach because it can automatically extract spatial and hierarchical features from image data. RF, KNN, and GB were included as conventional machine learning models to provide comparative baselines.
For the conventional machine learning models (RF, KNN, and GB), image embeddings extracted from the CNN feature extraction layers were used as input features. These embeddings capture high-level visual characteristics of wildfire-related images and provide compact numerical representations suitable for traditional machine learning algorithms. This approach enables a consistent comparison between CNN-based classification and conventional machine learning methods using the same underlying image representations.
The complete dataset consisted of 3998 labeled images collected through the WildfireGO platform. Of these, 3198 images (1598 fire and 1600 non-fire images) were used for model development and evaluated using 10-fold cross-validation, while an additional independent test dataset containing 800 images (400 fire and 400 non-fire images) was reserved exclusively for final performance evaluation.
The 10-fold cross-validation procedure was performed only on the 3198 images used for model development. The independent test dataset was completely excluded from both training and cross-validation processes and was used solely for final model evaluation. This separation ensured that model performance was assessed using previously unseen data, providing an unbiased evaluation of model generalization and reducing the risk of evaluation bias. The dataset was balanced across the fire and non-fire classes to minimize classification bias. The independent test dataset was prepared from image records that were not used during model development. Although event-level separation was not explicitly enforced, duplicate reports and repeated submissions from the same location and timestamp were screened during the data-quality control process.
All images were labeled into two classes: fire and non-fire. For model development, a balanced training and cross-validation dataset was prepared from user-submitted images. A 10-fold cross-validation strategy was applied to assess model stability and reduce the risk of overfitting. In this process, the dataset was divided into ten subsets. For each fold, nine subsets were used for training and the remaining subset was used for validation. This procedure was repeated ten times, and the average performance across all folds was reported.
To further evaluate model generalization, the reserved independent test dataset containing 800 images (400 fire and 400 non-fire images) was used for final evaluation. This dataset was completely separated from the model-development dataset and was not used during training or 10-fold cross-validation. The use of this unseen dataset provided an additional assessment of model performance under practical reporting conditions, particularly in distinguishing fire from non-fire images that may lead to false detections.
A MobileNetV2 architecture was adopted as the CNN model in this study due to its balance between classification performance and computational efficiency. MobileNetV2 employs depthwise separable convolutions and inverted residual blocks with linear bottlenecks, enabling efficient feature extraction while maintaining a relatively small number of parameters. The architecture consists of an initial convolution layer, 17 inverted residual bottleneck blocks, a global average pooling layer, and a final fully connected classification layer. A Softmax activation function was used in the output layer to classify images into fire and non-fire categories. All input images were resized to 224 × 224 pixels before being fed into the model.
The CNN was trained using the Adam optimizer with a learning rate of 0.001, a batch size of 32, and 50 training epochs. These hyperparameters were selected based on commonly adopted practices in deep learning image classification studies and preliminary experimental testing. A learning rate of 0.001 provided stable convergence during training, while a batch size of 32 offered a balance between computational efficiency and model performance. The number of training epochs was set to 50 to allow sufficient model learning while minimizing the risk of overfitting. A dropout layer was included to reduce overfitting.
This model design allows the CNN to learn visual patterns from low-level features, such as edges and color variations, to higher-level features associated with fire and smoke. The same preprocessing procedure was applied to RF, KNN, and GB to enable a consistent comparison between deep learning and conventional machine learning approaches.
MobileNetV2 was selected as the CNN backbone because of its lightweight architecture, computational efficiency, and suitability for web-based deployment environments. The objective of this study was to evaluate the feasibility of integrating AI-based image classification into an operational wildfire monitoring workflow rather than to identify the highest-performing deep learning architecture. Although more advanced models such as YOLO, ResNet, EfficientNet, and Vision Transformers (ViTs) have demonstrated strong performance in image analysis tasks, they generally require higher computational resources and were beyond the scope of the present study. Future research may investigate the integration and comparative evaluation of these architectures within the proposed WildfireGO framework.
3.5. System Implementation
The proposed platform is implemented using a web-based architecture that supports real-time data processing, geospatial analysis, and visualization. The backend system is developed using PHP, which manages server-side processing, data communication, and integration of system components. A MySQL database is employed to store structured data, including crowdsourced wildfire reports, image metadata, classification results, and geospatial attributes. The database design enables efficient storage and retrieval of large volumes of user-generated and satellite-derived data.
On the client side, the system is developed using JavaScript, which enables dynamic interaction, asynchronous data communication, and responsive user interfaces. JavaScript is also used to integrate geospatial visualization tools, allowing users to explore wildfire data through interactive maps and dashboards.
To support large-scale satellite data processing, GEE is incorporated into the system. The GEE workflow utilizes the NASA FIRMS MODIS Active Fire dataset to extract wildfire hotspot information over Thailand for the year 2025. Satellite data are filtered spatially and temporally within the national boundary, and the thermal anomaly band (T21) is used to represent fire intensity. A maximum value composite is generated to capture annual fire activity, and a threshold of T21 > 325 K is applied to identify significant hotspot pixels. This threshold was selected to emphasize strong thermal anomalies that are more likely to be associated with active fire events while reducing noise from lower-temperature surfaces and non-fire heat sources. Similar thermal anomaly thresholds have been adopted in wildfire and active-fire monitoring studies using MODIS thermal bands to distinguish potential fire hotspots from background temperature variations. The threshold was therefore used as a practical criterion for hotspot extraction and subsequent spatial validation within the WildfireGO framework. The resulting raster hotspot mask is converted into point features through a vectorization process, enabling hotspot locations to be represented as discrete spatial points.
The generated hotspot data are visualized alongside administrative boundaries to produce publication-ready maps, and the total number of hotspot points is calculated to quantify fire activity. The processed hotspot layers are exported and integrated into the web platform, where they are combined with AI-based image classification results and crowdsourced reports. While NDVI and NBR indices provide information on vegetation conditions and burn severity, hotspot detection offers spatial confirmation of fire occurrence. This integration forms a multi-source validation framework, which enhances detection accuracy and reduces false alarms by cross-validating wildfire events across different data sources.
The system is designed to be scalable and can be extended to other geographic regions, supporting practical deployment for wildfire monitoring and decision-making.
3.6. Performance Evaluation
The performance of the classification models is evaluated using standard metrics, including accuracy, precision, recall, and F1-score. Confusion matrices are also used to analyze classification results in detail by comparing predicted labels with actual labels. These metrics provide a comprehensive assessment of model performance, particularly in distinguishing between fire and non-fire images.
Accuracy measures the overall correctness of the classification model.
Precision indicates how many predicted fire cases are actually fire.
Recall measures the ability of the model to detect actual fire cases.
The F1-score balances precision and recall, providing a single performance metric.
Accuracy = (TP + TN)/(TP + TN + FP + FN)
Precision = TP/(TP + FP)
Recall = TP/(TP + FN)
F1 = 2 * (Precision * Recall)/(Precision + Recall)
3.7. Integrated Validation Approach
The proposed system applies a multi-source validation approach to improve the reliability of wildfire reports. The validation process combines three types of evidence: AI-based image classification, satellite-derived hotspot data, and crowdsourced observations. First, each user-submitted image is classified as either fire or non-fire using the trained classification model. The classification result is then linked with the geographic coordinates and timestamp provided in the user report.
Next, the reported location is compared with satellite-derived hotspot data obtained from MODIS. If a user report is located within or near a detected hotspot area during a relevant time period, the report is considered to have stronger spatial support. In contrast, reports classified as fire but located far from any satellite hotspot are flagged for further review. This step helps reduce false detections caused by visually similar conditions, such as haze, sunlight, clouds, smoke-like objects, or artificial lighting.
Spatial validation was performed by comparing the geographic location of user reports with MODIS hotspot detections, while temporal validation considered the consistency between report timestamps and available satellite observations. Reports supported by both image classification and satellite hotspot evidence were assigned higher confidence during the validation process. Reports were considered to have stronger validation support when wildfire-related image classification results were consistent with nearby satellite hotspot observations acquired within the corresponding reporting period.
Sentinel-2-derived NDVI and NBR layers were used to provide additional environmental context for interpreting vegetation conditions and potential fire-affected areas surrounding reported wildfire locations. These layers supported visual assessment and geospatial interpretation but were not used as direct classification inputs. Rather than applying fixed spatial or temporal thresholds, the current implementation used consistency-based validation between crowdsourced reports, image classification results, and available satellite observations to support wildfire verification.
Crowdsourced reports provide local observations that complement satellite-based detection, particularly in areas where satellite resolution, cloud cover, or revisit time may limit timely verification. By combining ground-level images with satellite hotspot evidence, the system avoids relying on a single data source and provides a more practical basis for wildfire validation.
This validation approach supports the classification of wildfire reports into different levels of confidence, based on the agreement between image classification results and satellite-derived hotspot information. As a result, the platform can assist users and responsible agencies in prioritizing reports that are more likely to represent actual wildfire events and in identifying reports that require additional verification.
4. Results and Discussion
This section presents the experimental results and discusses the performance of the proposed WildfireGO system. The evaluation includes image classification performance, independent testing, web-based wildfire reporting and validation, geospatial visualization, dashboard analytics, and satellite-derived hotspot analysis to assess the effectiveness of the proposed multi-source wildfire monitoring framework.
4.1. Classification Performance of AI Models
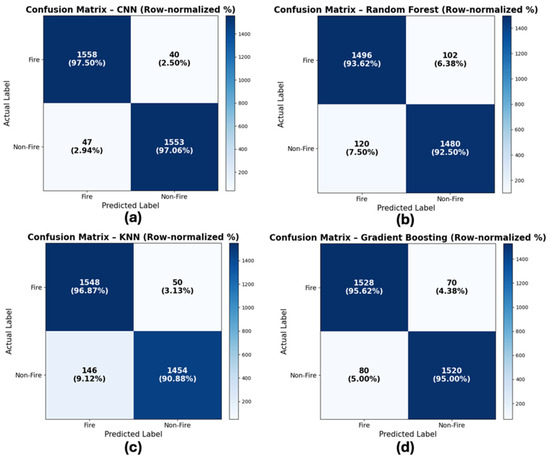
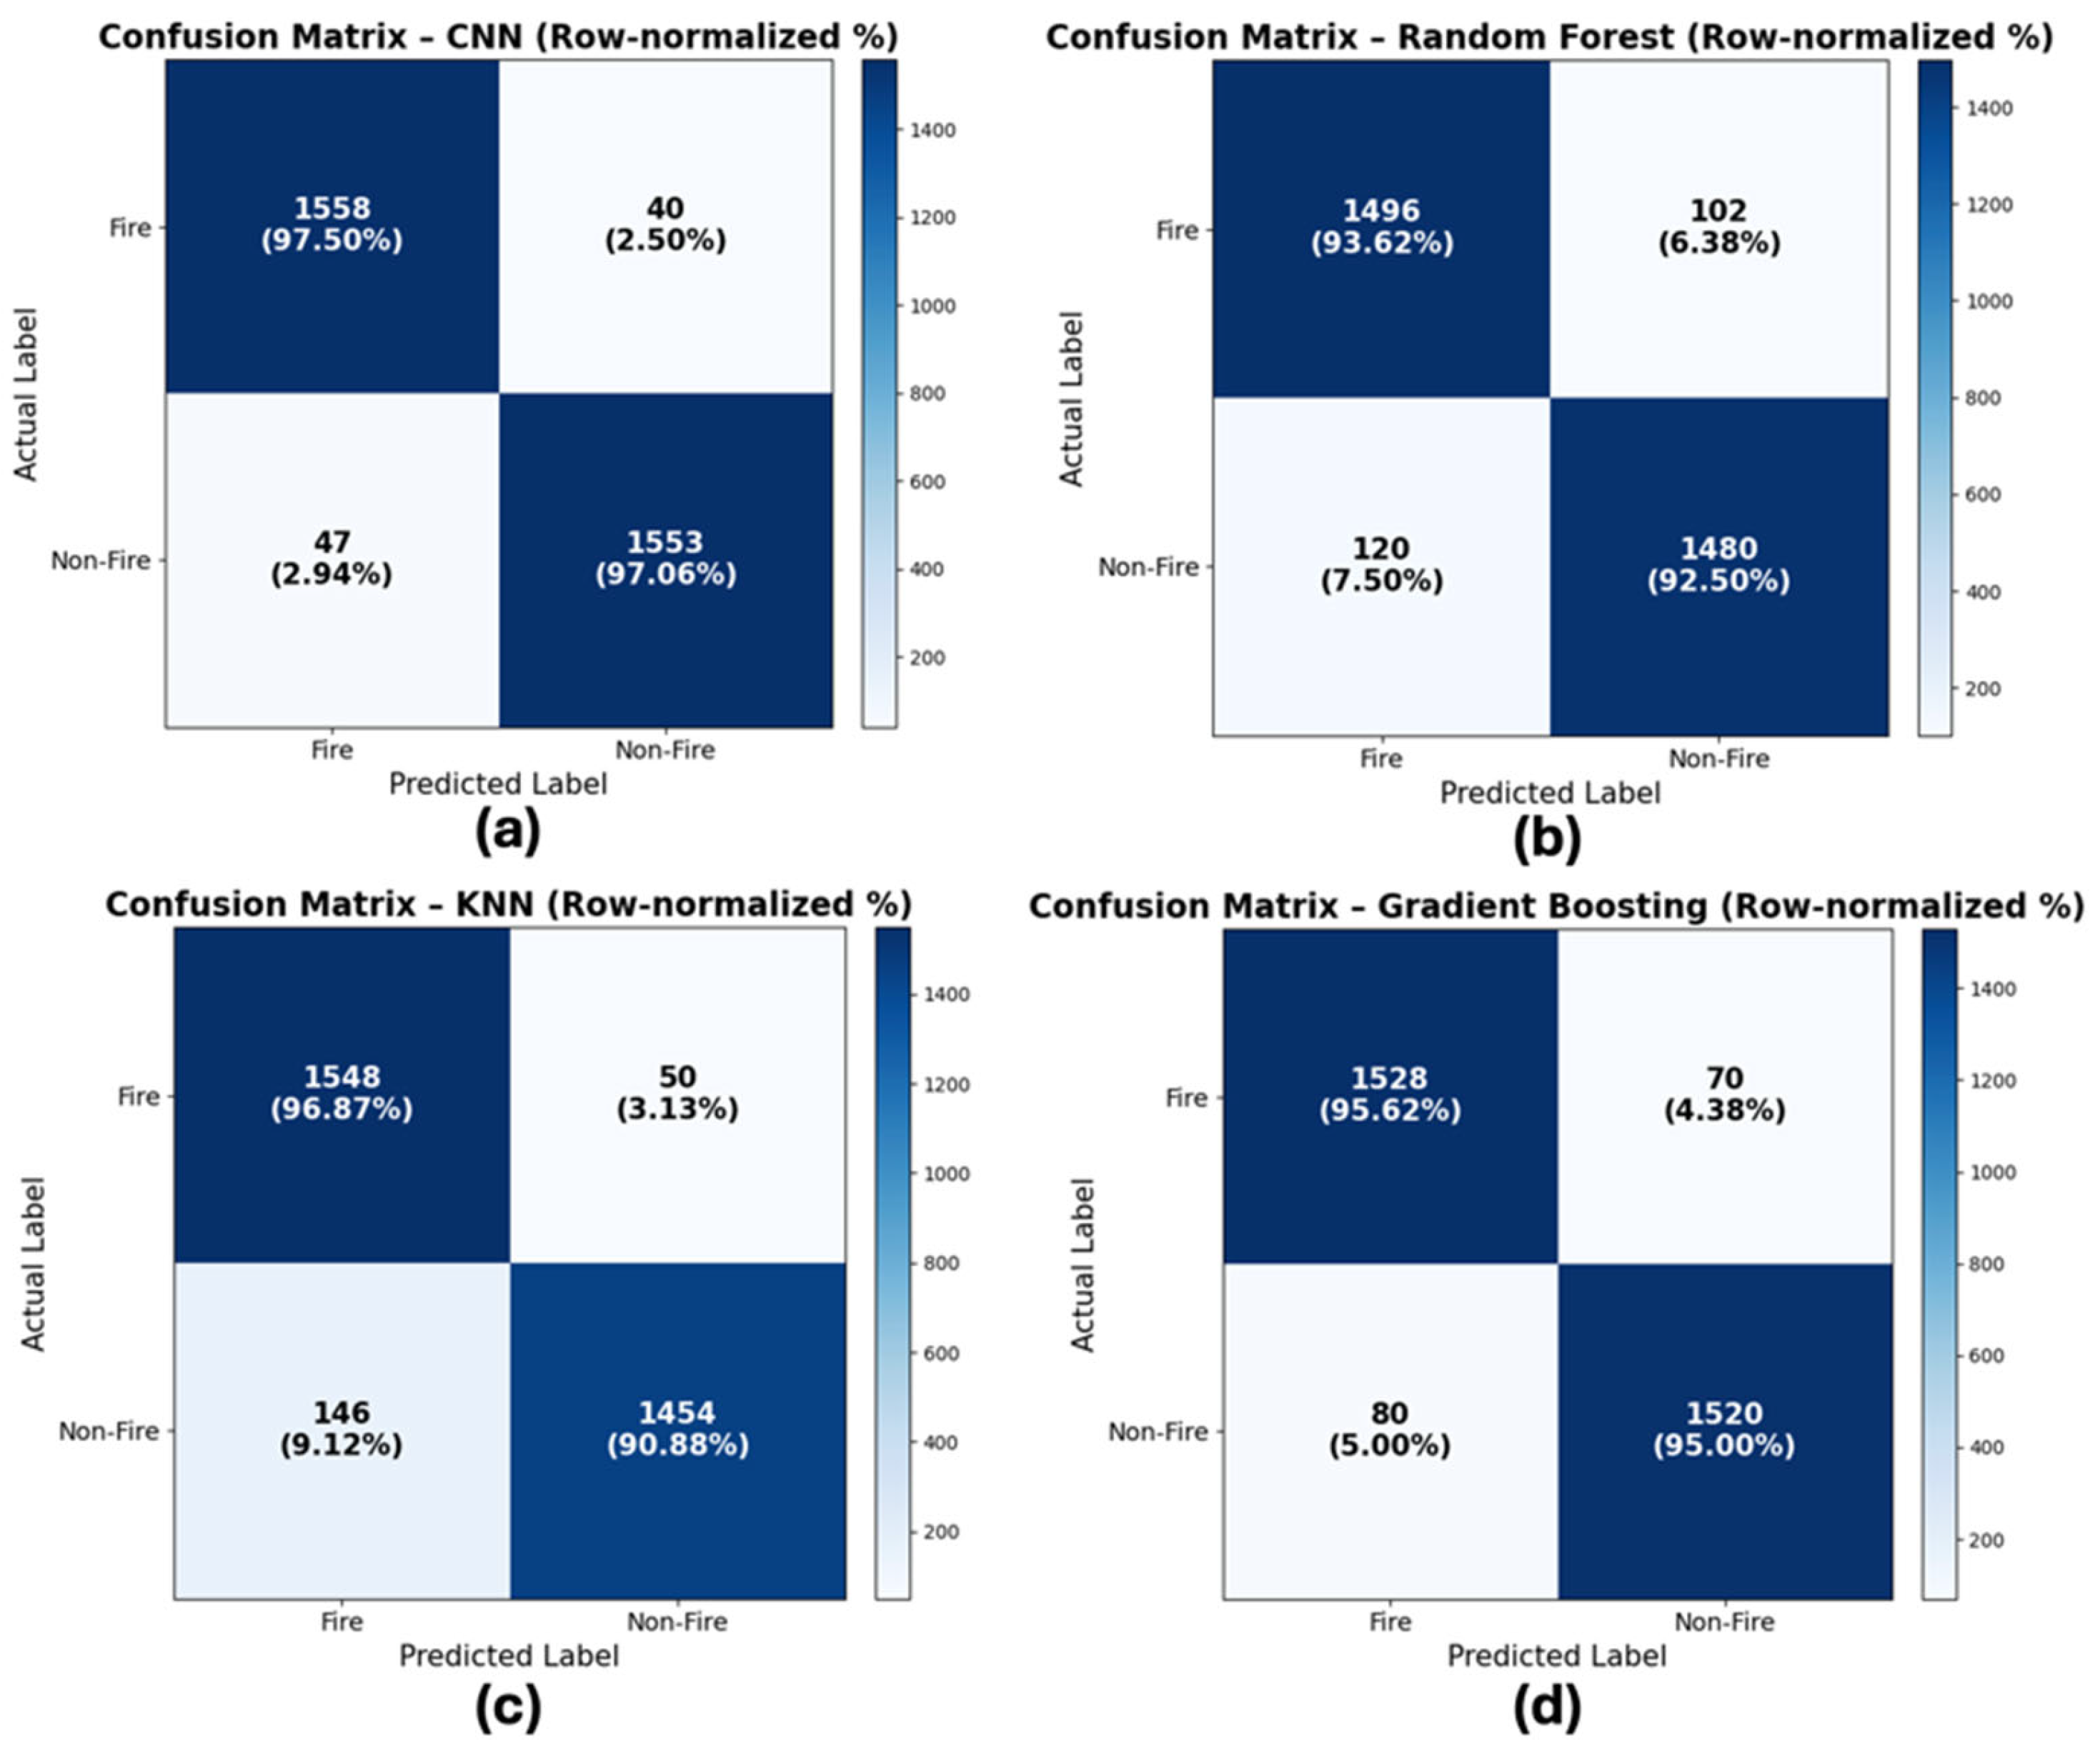
The performance of the wildfire image classification models was evaluated using confusion matrices obtained from 10-fold cross-validation. Four models were compared: CNN, RF, KNN, and GB. The row-normalized confusion matrices are shown in Figure 3.
Figure 3.
Row-normalized confusion matrices (%) of wildfire image classification models under 10-fold cross-validation: (a) CNN, (b) RF, (c) KNN, and (d) GB.
As shown in Figure 3a, the CNN model achieved the best overall classification result. It correctly classified 97.50% of fire images and 97.06% of non-fire images. The model misclassified 2.50% of fire images as non-fire and 2.94% of non-fire images as fire. These results show that CNN was effective in distinguishing fire-related visual patterns from non-fire conditions in crowdsourced images. This performance can be attributed to the ability of convolutional layers to extract spatial features from complex image backgrounds, such as smoke, haze, vegetation, sunlight, and other visually similar conditions.
The RF model, shown in Figure 3b, produced lower class-wise results than CNN. It correctly classified 93.62% of fire images and 92.50% of non-fire images. The higher misclassification rates suggest that feature-based machine learning methods may be less effective when images contain large variations in lighting, angle, distance, and background complexity. Although RF is computationally simpler than CNN, its performance in this study indicates limitations when applied to heterogeneous user-submitted images.
The KNN model showed acceptable performance for fire image classification but was less effective for non-fire images. This pattern suggests that KNN was more sensitive to visually ambiguous cases and may incorrectly classify some non-fire images as fire. In practical wildfire reporting systems, this behavior could increase false alarms, especially when non-fire images contain haze, sunlight, clouds, or smoke-like objects.
The GB model, presented in Figure 3d, provided more balanced results than RF and KNN. It correctly classified 95.62% of fire images and 95.00% of non-fire images. Although its performance was lower than CNN, GB showed stable classification behavior across both classes. This suggests that GB may be useful in cases where a less computationally demanding model is required, while CNN remains the preferred model when higher classification accuracy is needed.
Overall, the results indicate that CNN is the most suitable model for integration into the WildfireGO platform. Its higher class-wise accuracy and lower misclassification rates make it more appropriate for screening crowdsourced wildfire reports before further validation with satellite-derived hotspot data. The comparison also shows that traditional machine learning models can provide useful baselines, but they are less capable of handling the visual variability found in user-submitted wildfire images.
Table 2 summarizes the performance of the four classification models based on 10-fold cross-validation. The CNN model achieved the best overall result, with an accuracy of 97.50%, precision of 97.60%, recall of 97.50%, and F1-score of 97.55%. These results indicate that CNN was the most effective model for classifying crowdsourced wildfire images, particularly under conditions involving variations in lighting, background, viewing angle, and image quality.
Table 2.
Performance comparison of classification models based on 10-fold cross-validation.
Among the conventional machine learning models, KNN achieved the second-highest accuracy at 96.00%, followed by GB at 95.31% and RF at 93.06%. Although these models produced lower results than CNN, their performance remained relatively stable across the evaluation metrics. This suggests that traditional machine learning models can still serve as useful baseline approaches for wildfire image classification, while CNN provides better performance for deployment in the WildfireGO platform.
For practical implementation, the higher F1-score of CNN is important because wildfire monitoring systems must balance both false alarms and missed detections. A model with high precision can reduce incorrect fire alerts, while high recall helps ensure that actual wildfire cases are not overlooked. Therefore, CNN was selected as the primary classification model for integration with the platform’s crowdsourced reporting and satellite-based validation workflow.
4.2. Independent Test Evaluation
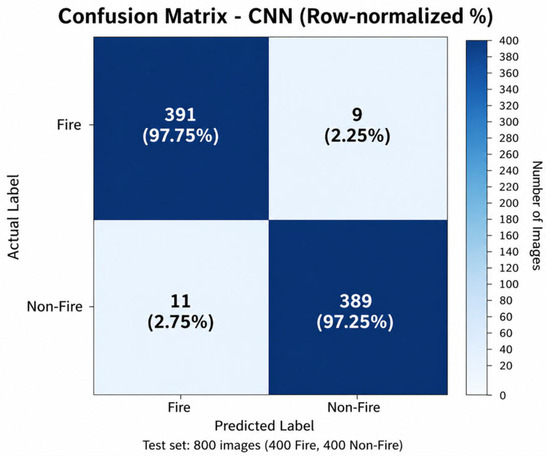
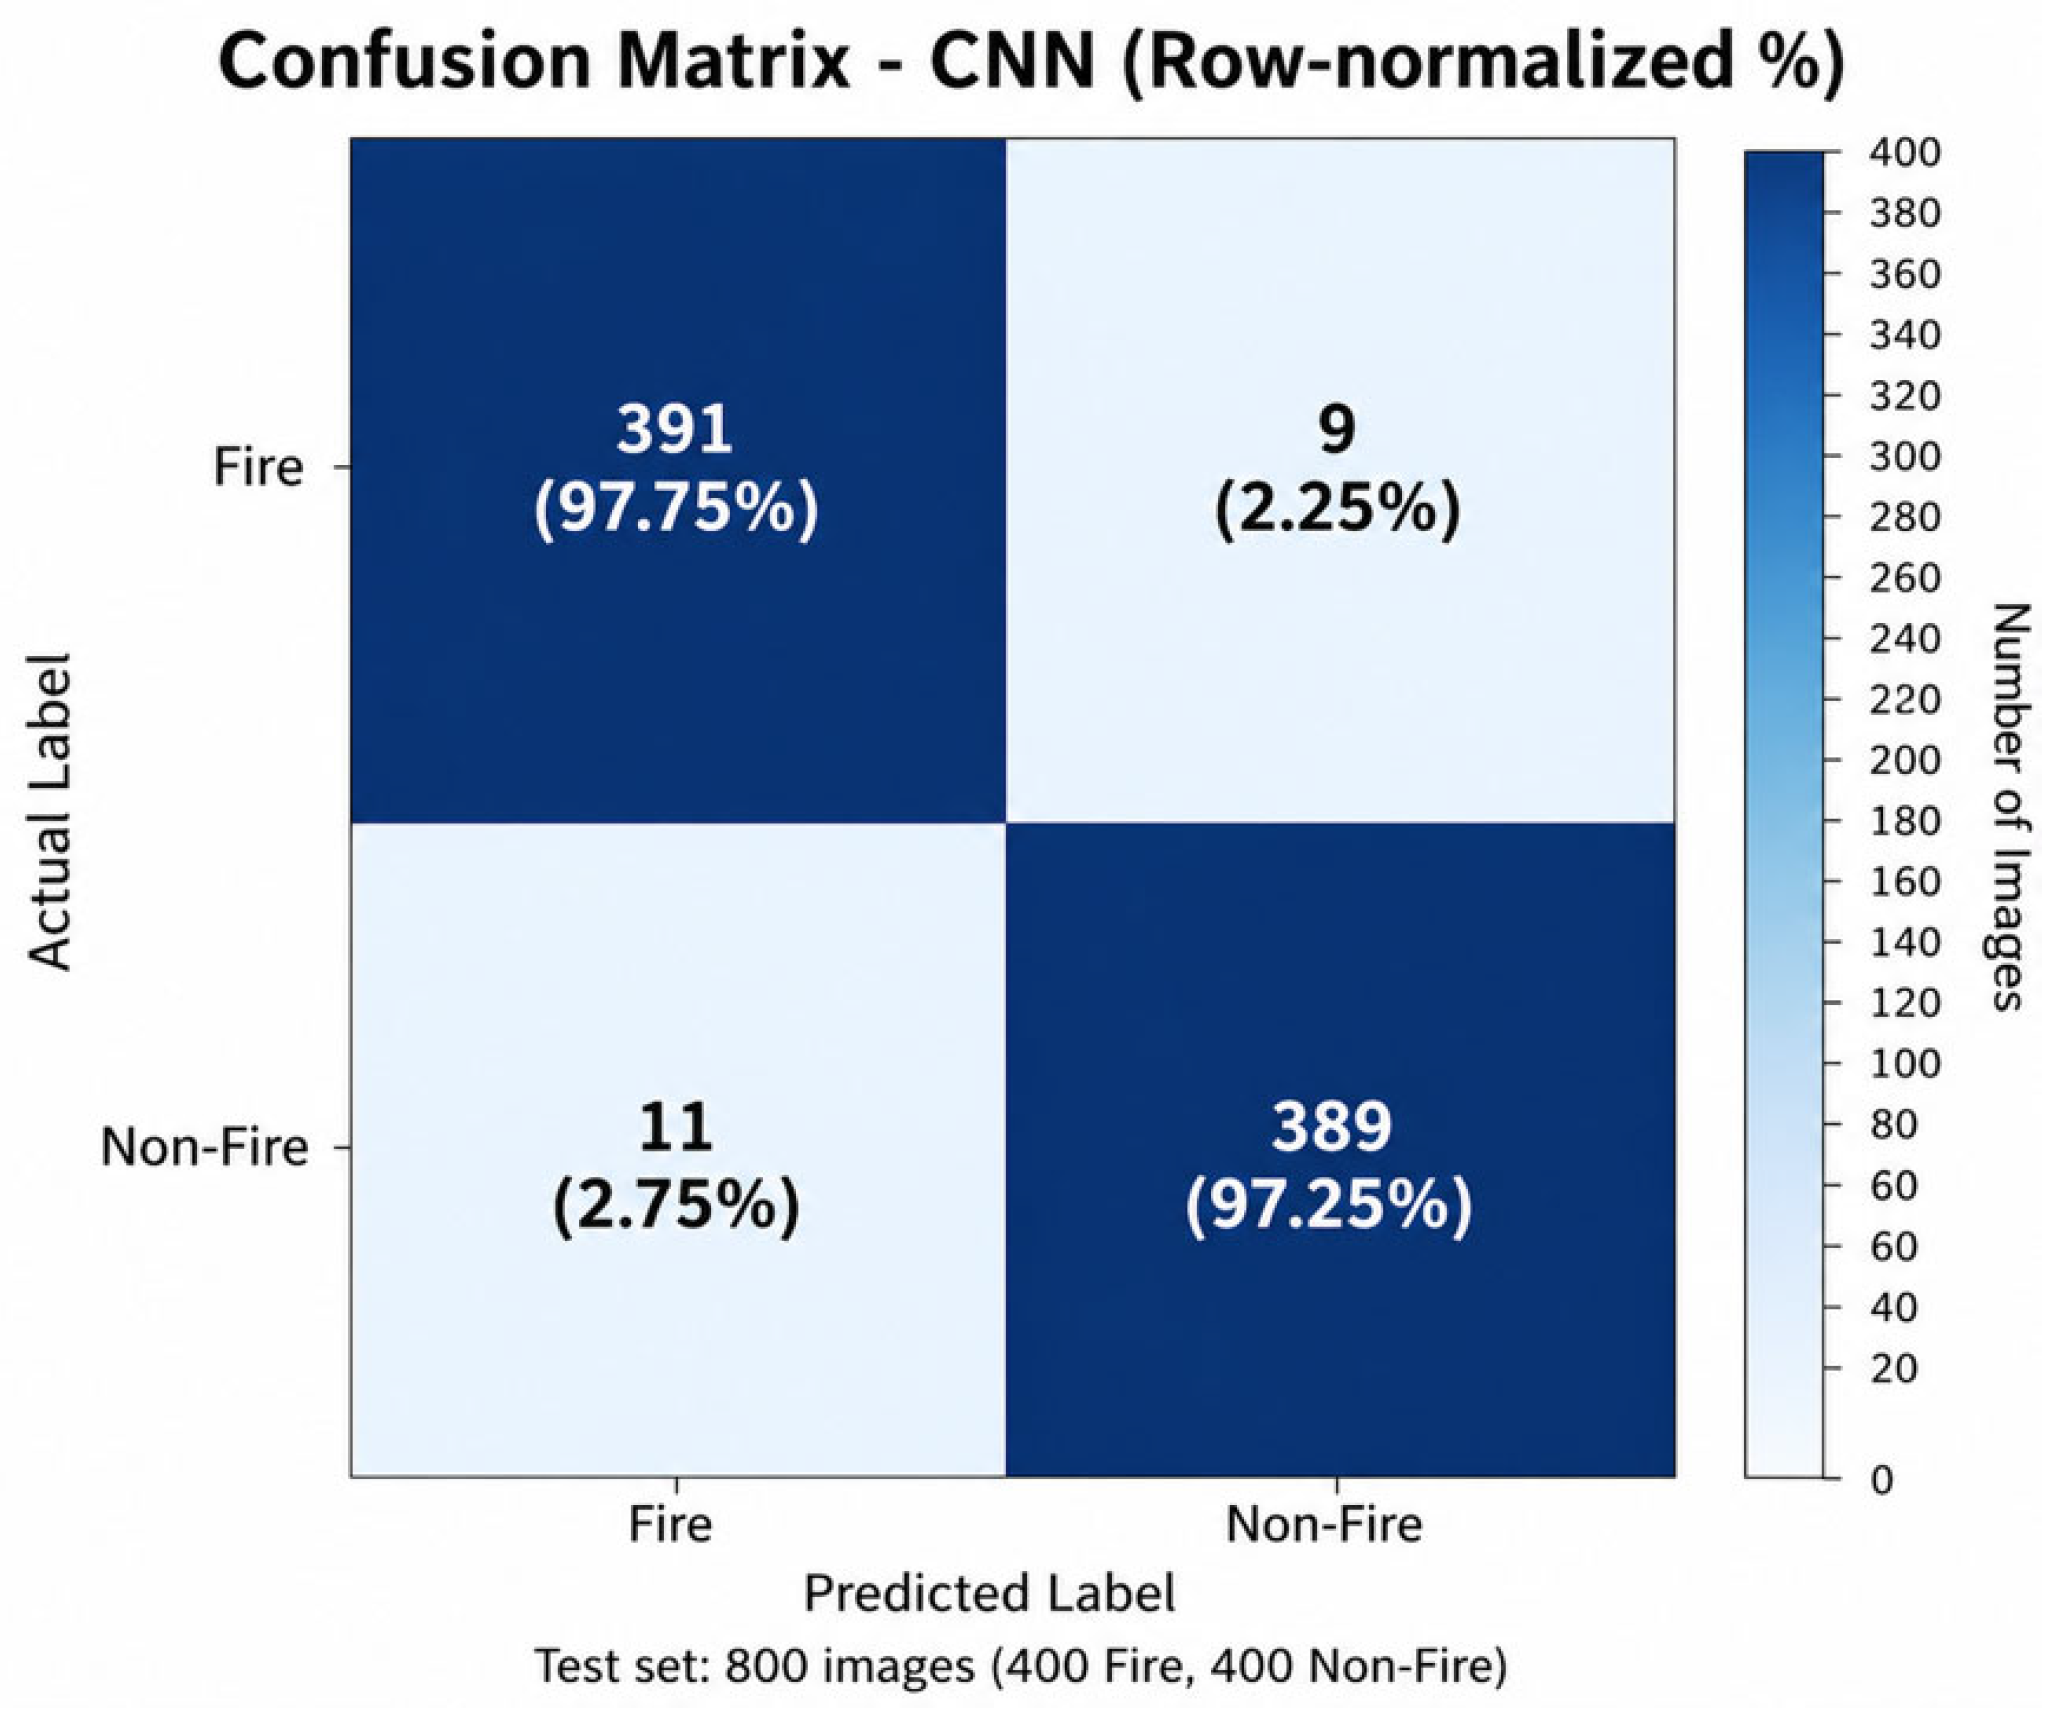
To further evaluate model generalization, an independent test dataset consisting of 800 unseen images was used. This dataset was separated from the training and cross-validation datasets and included 400 fire images and 400 non-fire images. The confusion matrix of the CNN model on the independent test dataset is shown in Figure 4.
Figure 4.
Row-normalized confusion matrix (%) of the CNN model on the independent test dataset consisting of 400 fire and 400 non-fire images.
The CNN model achieved an overall accuracy of 97.5% on the independent test dataset. Specifically, the model correctly classified 391 fire images and 389 non-fire images. Only 9 fire images were misclassified as non-fire, while 11 non-fire images were misclassified as fire. These results indicate that the model maintained high classification performance when applied to unseen images that were not used during model training.
The independent test results are consistent with the cross-validation results, suggesting that the CNN model can generalize well to new crowdsourced wildfire images. This is important for practical deployment because user-submitted images may vary in lighting conditions, viewing angles, image quality, distance from the fire source, and background complexity. The low number of false detections also supports the use of CNN as the primary image classification model in the WildfireGO platform.
In the proposed workflow, the CNN output is not used as the only source of evidence. Instead, image classification results are further cross-checked with satellite-derived hotspot data and geographic information from user reports. This multi-source validation process helps improve the reliability of wildfire reporting and supports more informed decision-making in wildfire monitoring.
4.3. Web-Based Wildfire Reporting and Validation System
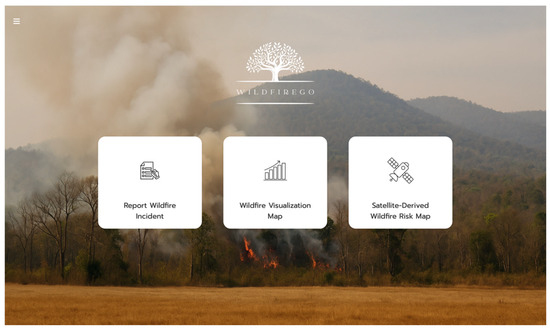
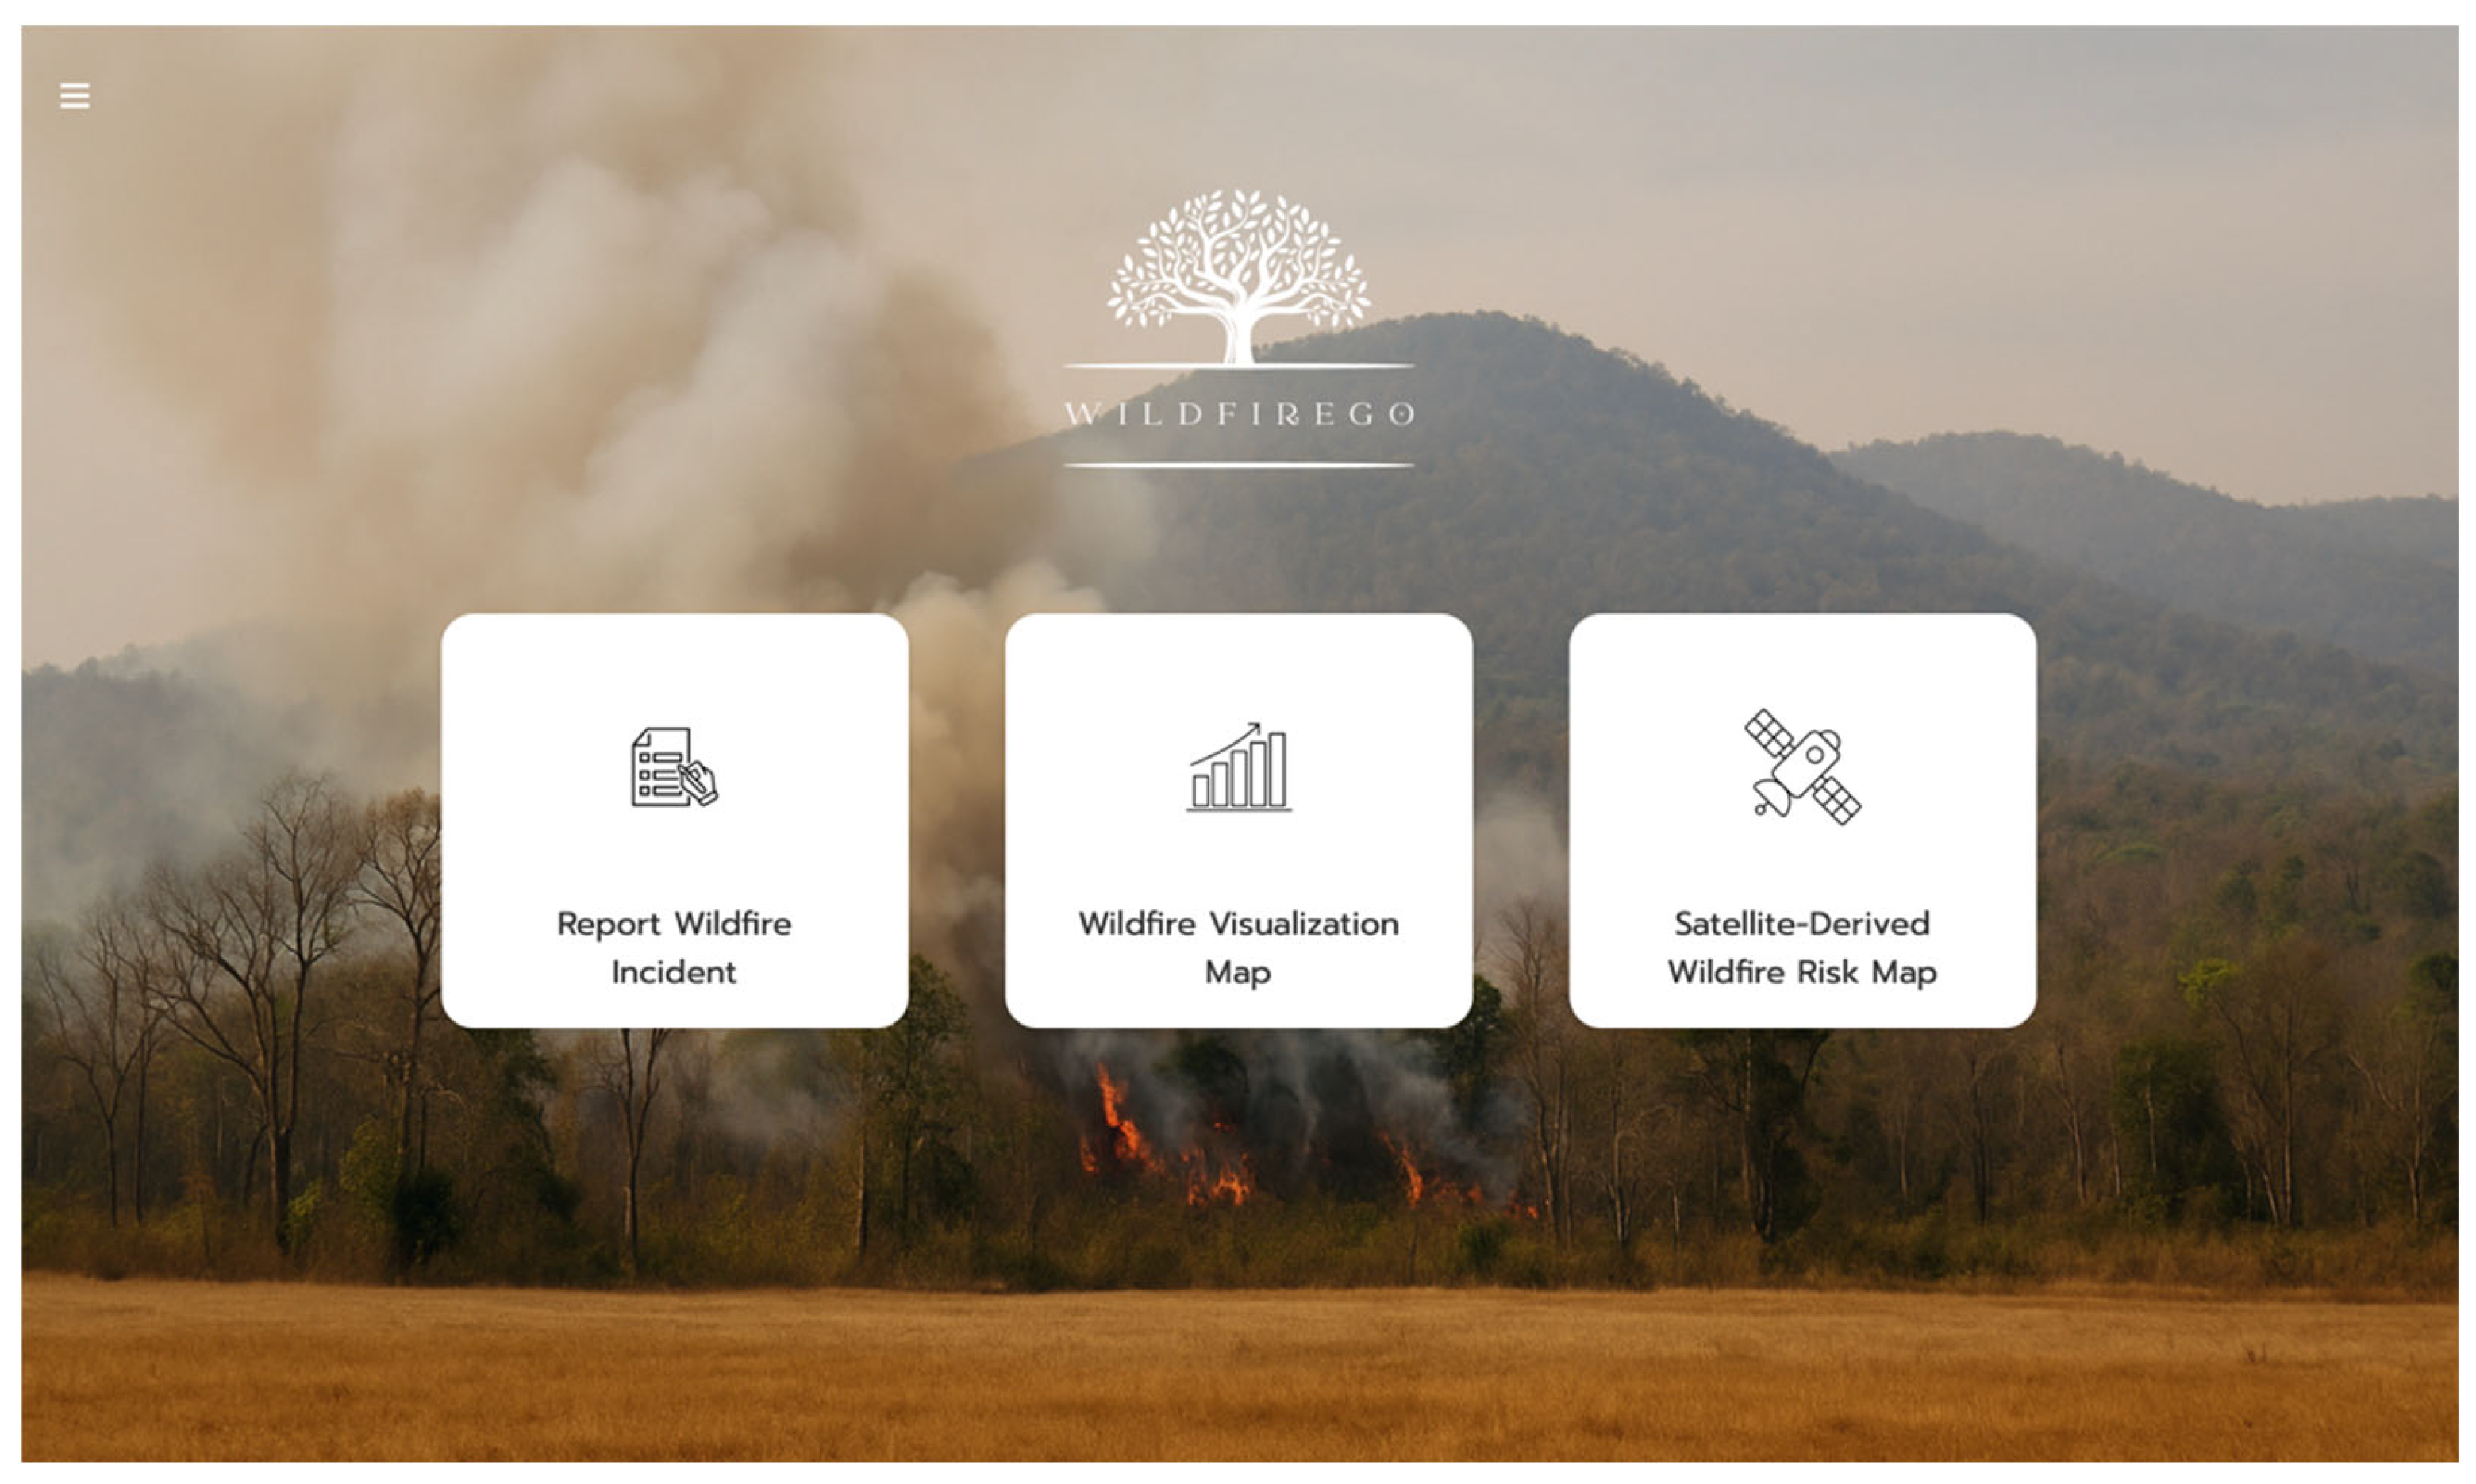
The WildfireGO platform provides an interactive web-based interface for wildfire reporting, validation, and visualization, as shown in Figure 5 and Figure 6. The system allows users to submit suspected wildfire incidents by entering geographic coordinates, date, time, and an image as supporting evidence. These inputs are then processed by the image classification module to determine whether the submitted image is likely to represent a wildfire event.
Figure 5.
User interface of the WildfireGO web application showing the main functional modules: wildfire reporting, wildfire visualization map, and satellite-derived wildfire hotspot mapping.
Figure 6.
Crowdsourcing-based wildfire reporting interface allowing users to submit geographic location, date, time, and wildfire images for validation.
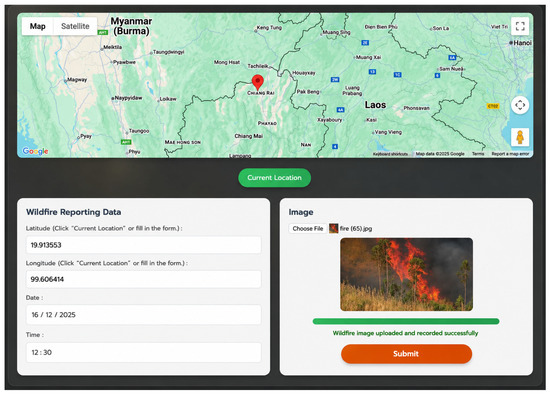
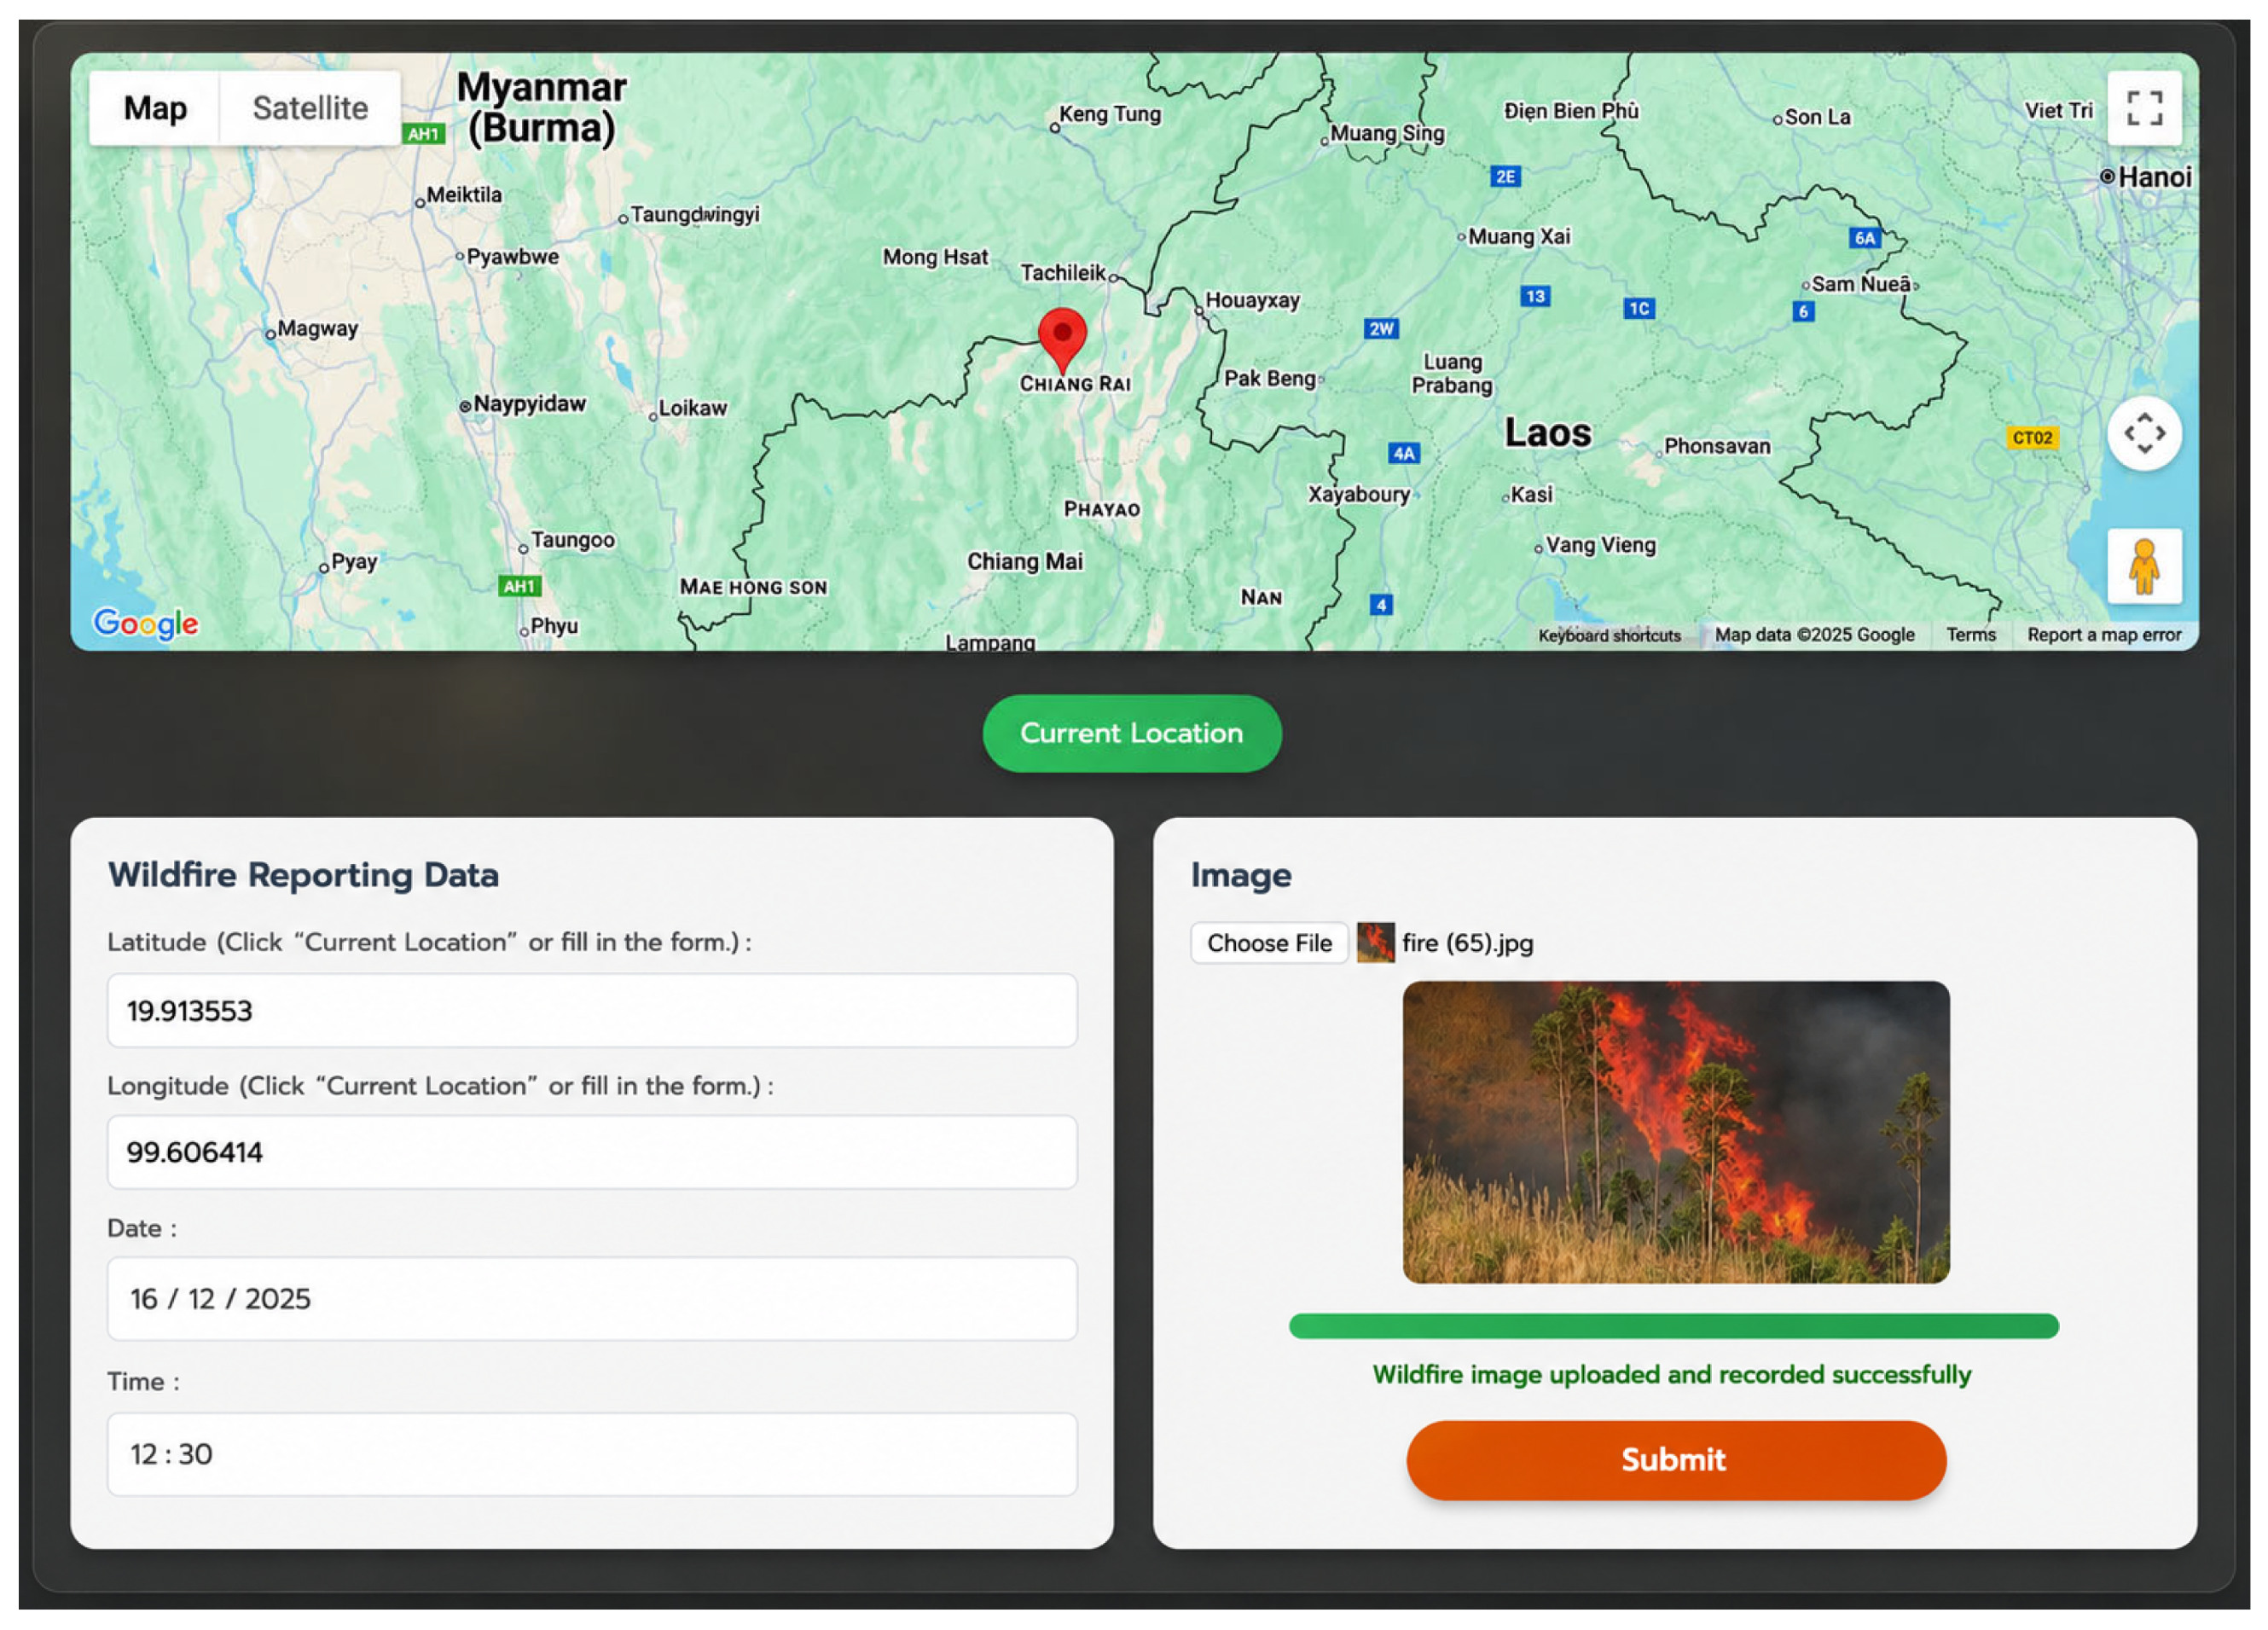
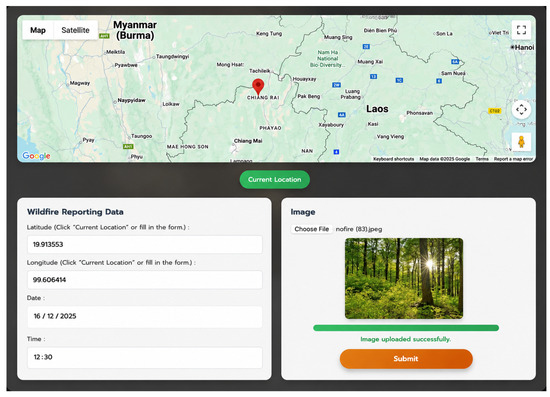
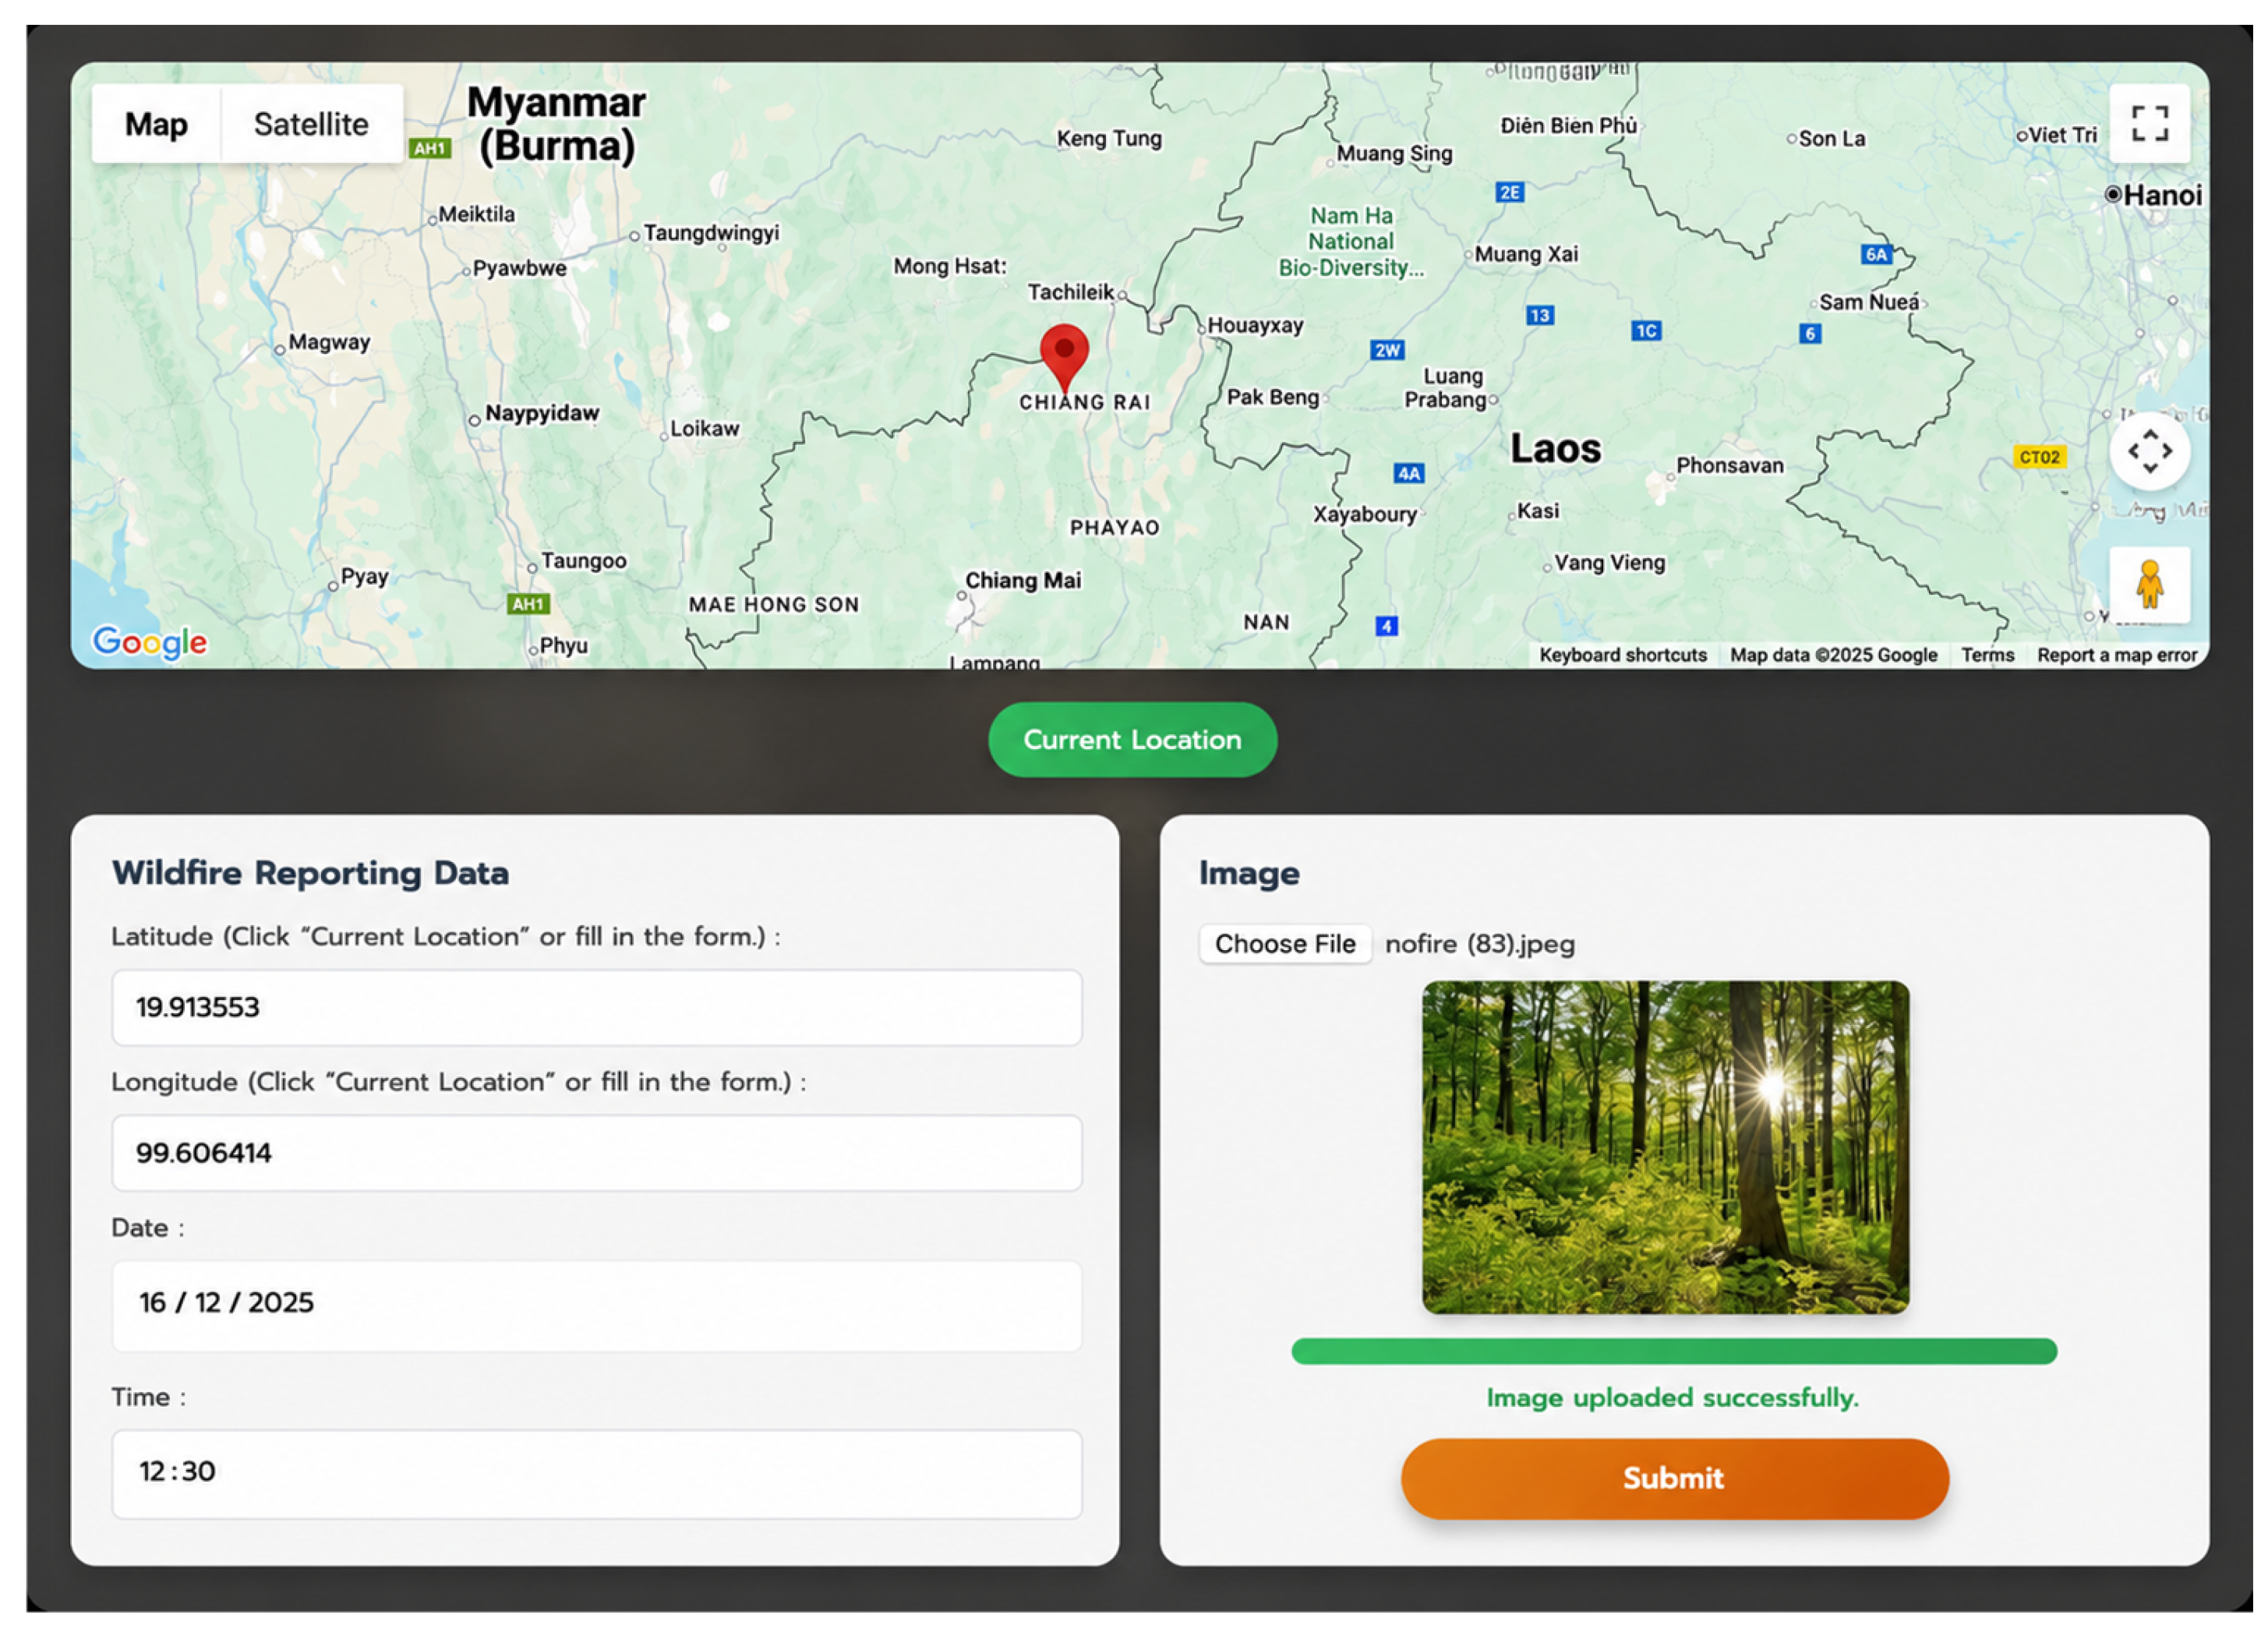
As illustrated in Figure 7, when a fire-related image is uploaded, the system classifies the image, stores the report, and provides confirmation feedback to the user. In contrast, Figure 8 shows an example in which a non-fire image is rejected during the validation process. This function helps screen user-submitted data before it is added to the wildfire database, reducing the number of irrelevant or incorrect reports that may enter the system.
Figure 7.
Example of a valid wildfire report successfully uploaded and verified by the system using the CNN classification model.
Figure 8.
Example of an invalid submission where a non-fire image is correctly rejected by the system during the validation process.
The platform also includes a Current Location function, which allows users to automatically obtain their geographic coordinates. This feature helps reduce manual input errors and improves usability, particularly when users report incidents from the field. In emergency or time-sensitive situations, automatic location capture can support faster and more accurate reporting.
Overall, the WildfireGO platform combines crowdsourced reporting with AI-based image screening and geospatial visualization. This design helps improve the quality of user-generated wildfire reports and supports practical monitoring by linking field observations, classification results, and spatial information within a single web-based system.
4.4. Wildfire Spatial Visualization and Monitoring
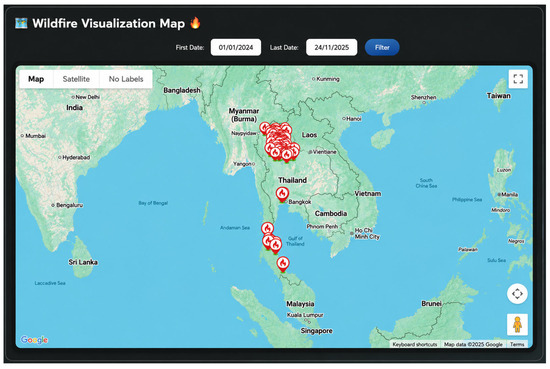
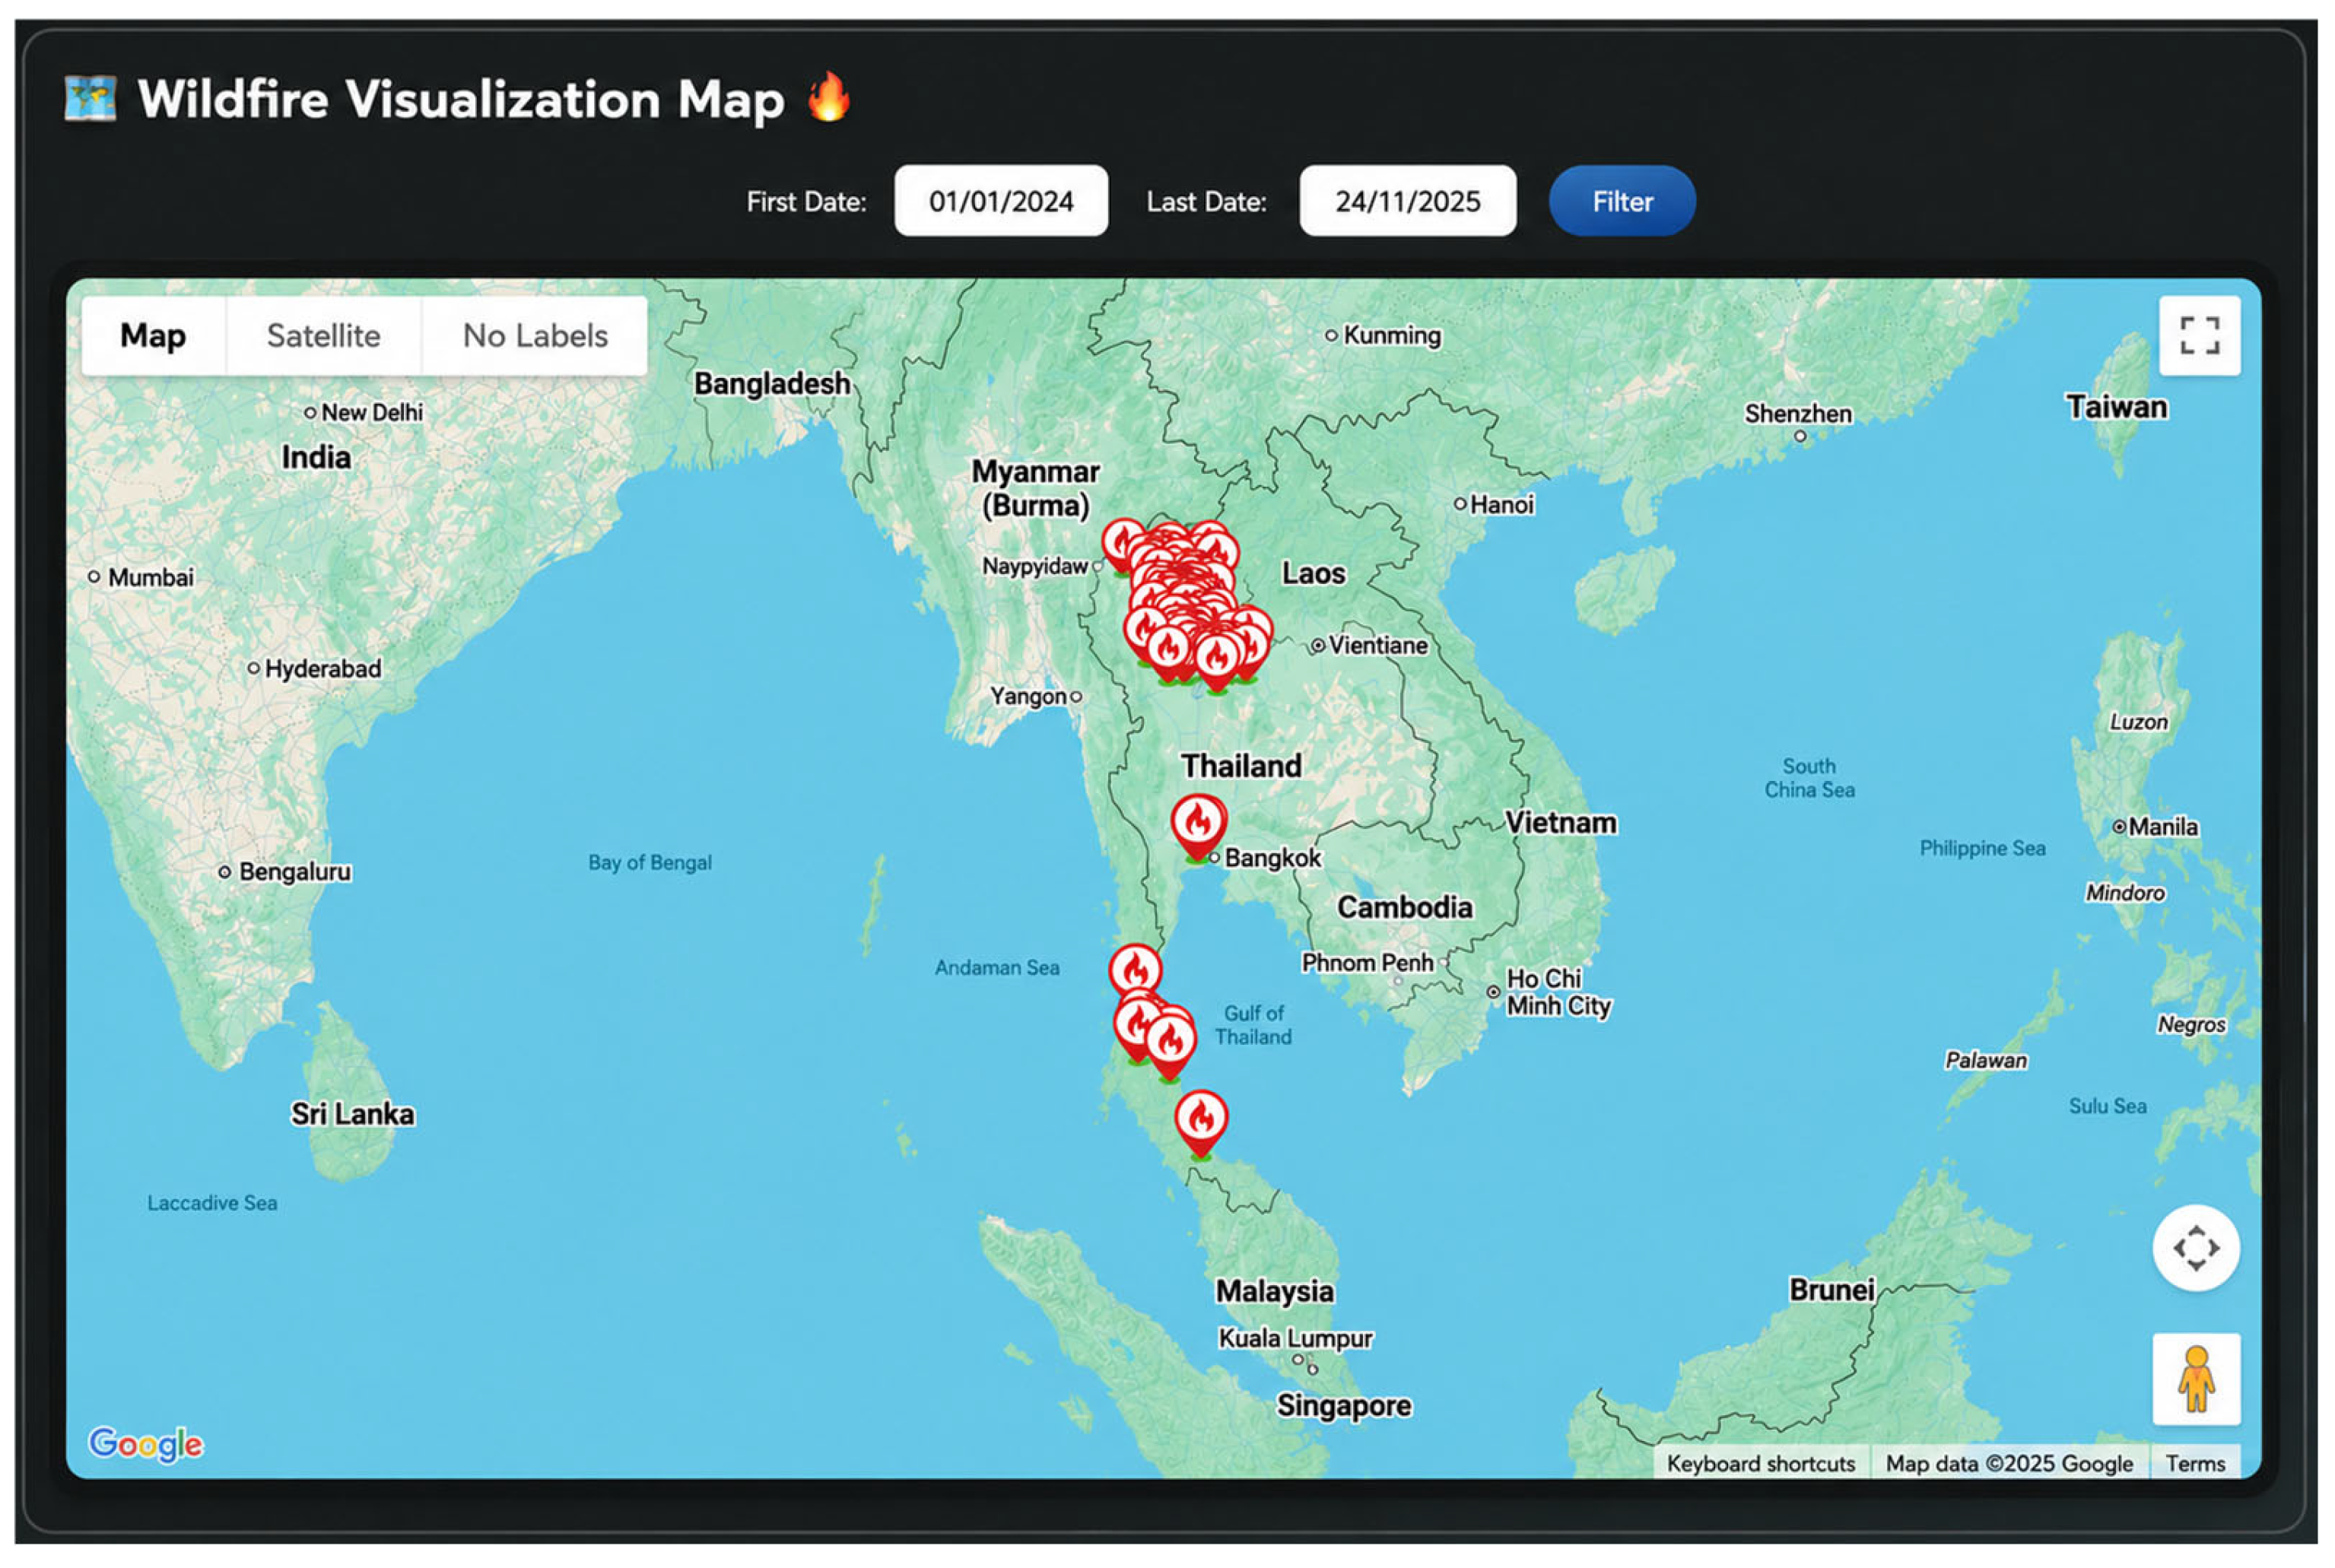
The spatial distribution of reported wildfire incidents was visualized through an interactive mapping interface, as shown in Figure 9. The platform displays validated crowdsourced reports together with satellite-derived hotspot information, allowing users to examine wildfire-related events in a geospatial context. This visualization helps users understand where wildfire reports are concentrated and how reported events relate to satellite-based observations.
Figure 9.
Interactive wildfire visualization map displaying the spatial distribution of validated wildfire reports across Thailand.
The mapped results show a concentration of wildfire reports in northern Thailand, which is consistent with recurring dry-season burning and wildfire activity in this region. The interface supports multiple map layers, including base maps and satellite imagery, enabling users to examine spatial patterns at different levels of detail. This function is useful for identifying areas with frequent wildfire activity and supporting situational awareness for monitoring and response planning.
The platform also includes temporal filtering, allowing users to explore wildfire reports within specific time periods. This feature supports both short-term monitoring of recent incidents and longer-term observation of spatial patterns. By combining validated reports, satellite-derived information, and interactive map functions, the system provides a practical tool for wildfire monitoring and geospatial decision support.
4.5. Dashboard Analytics and Temporal Patterns
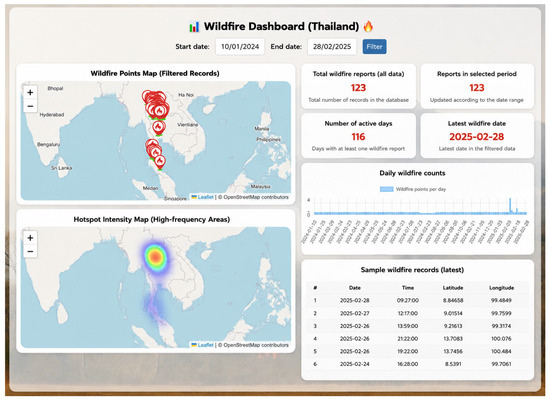
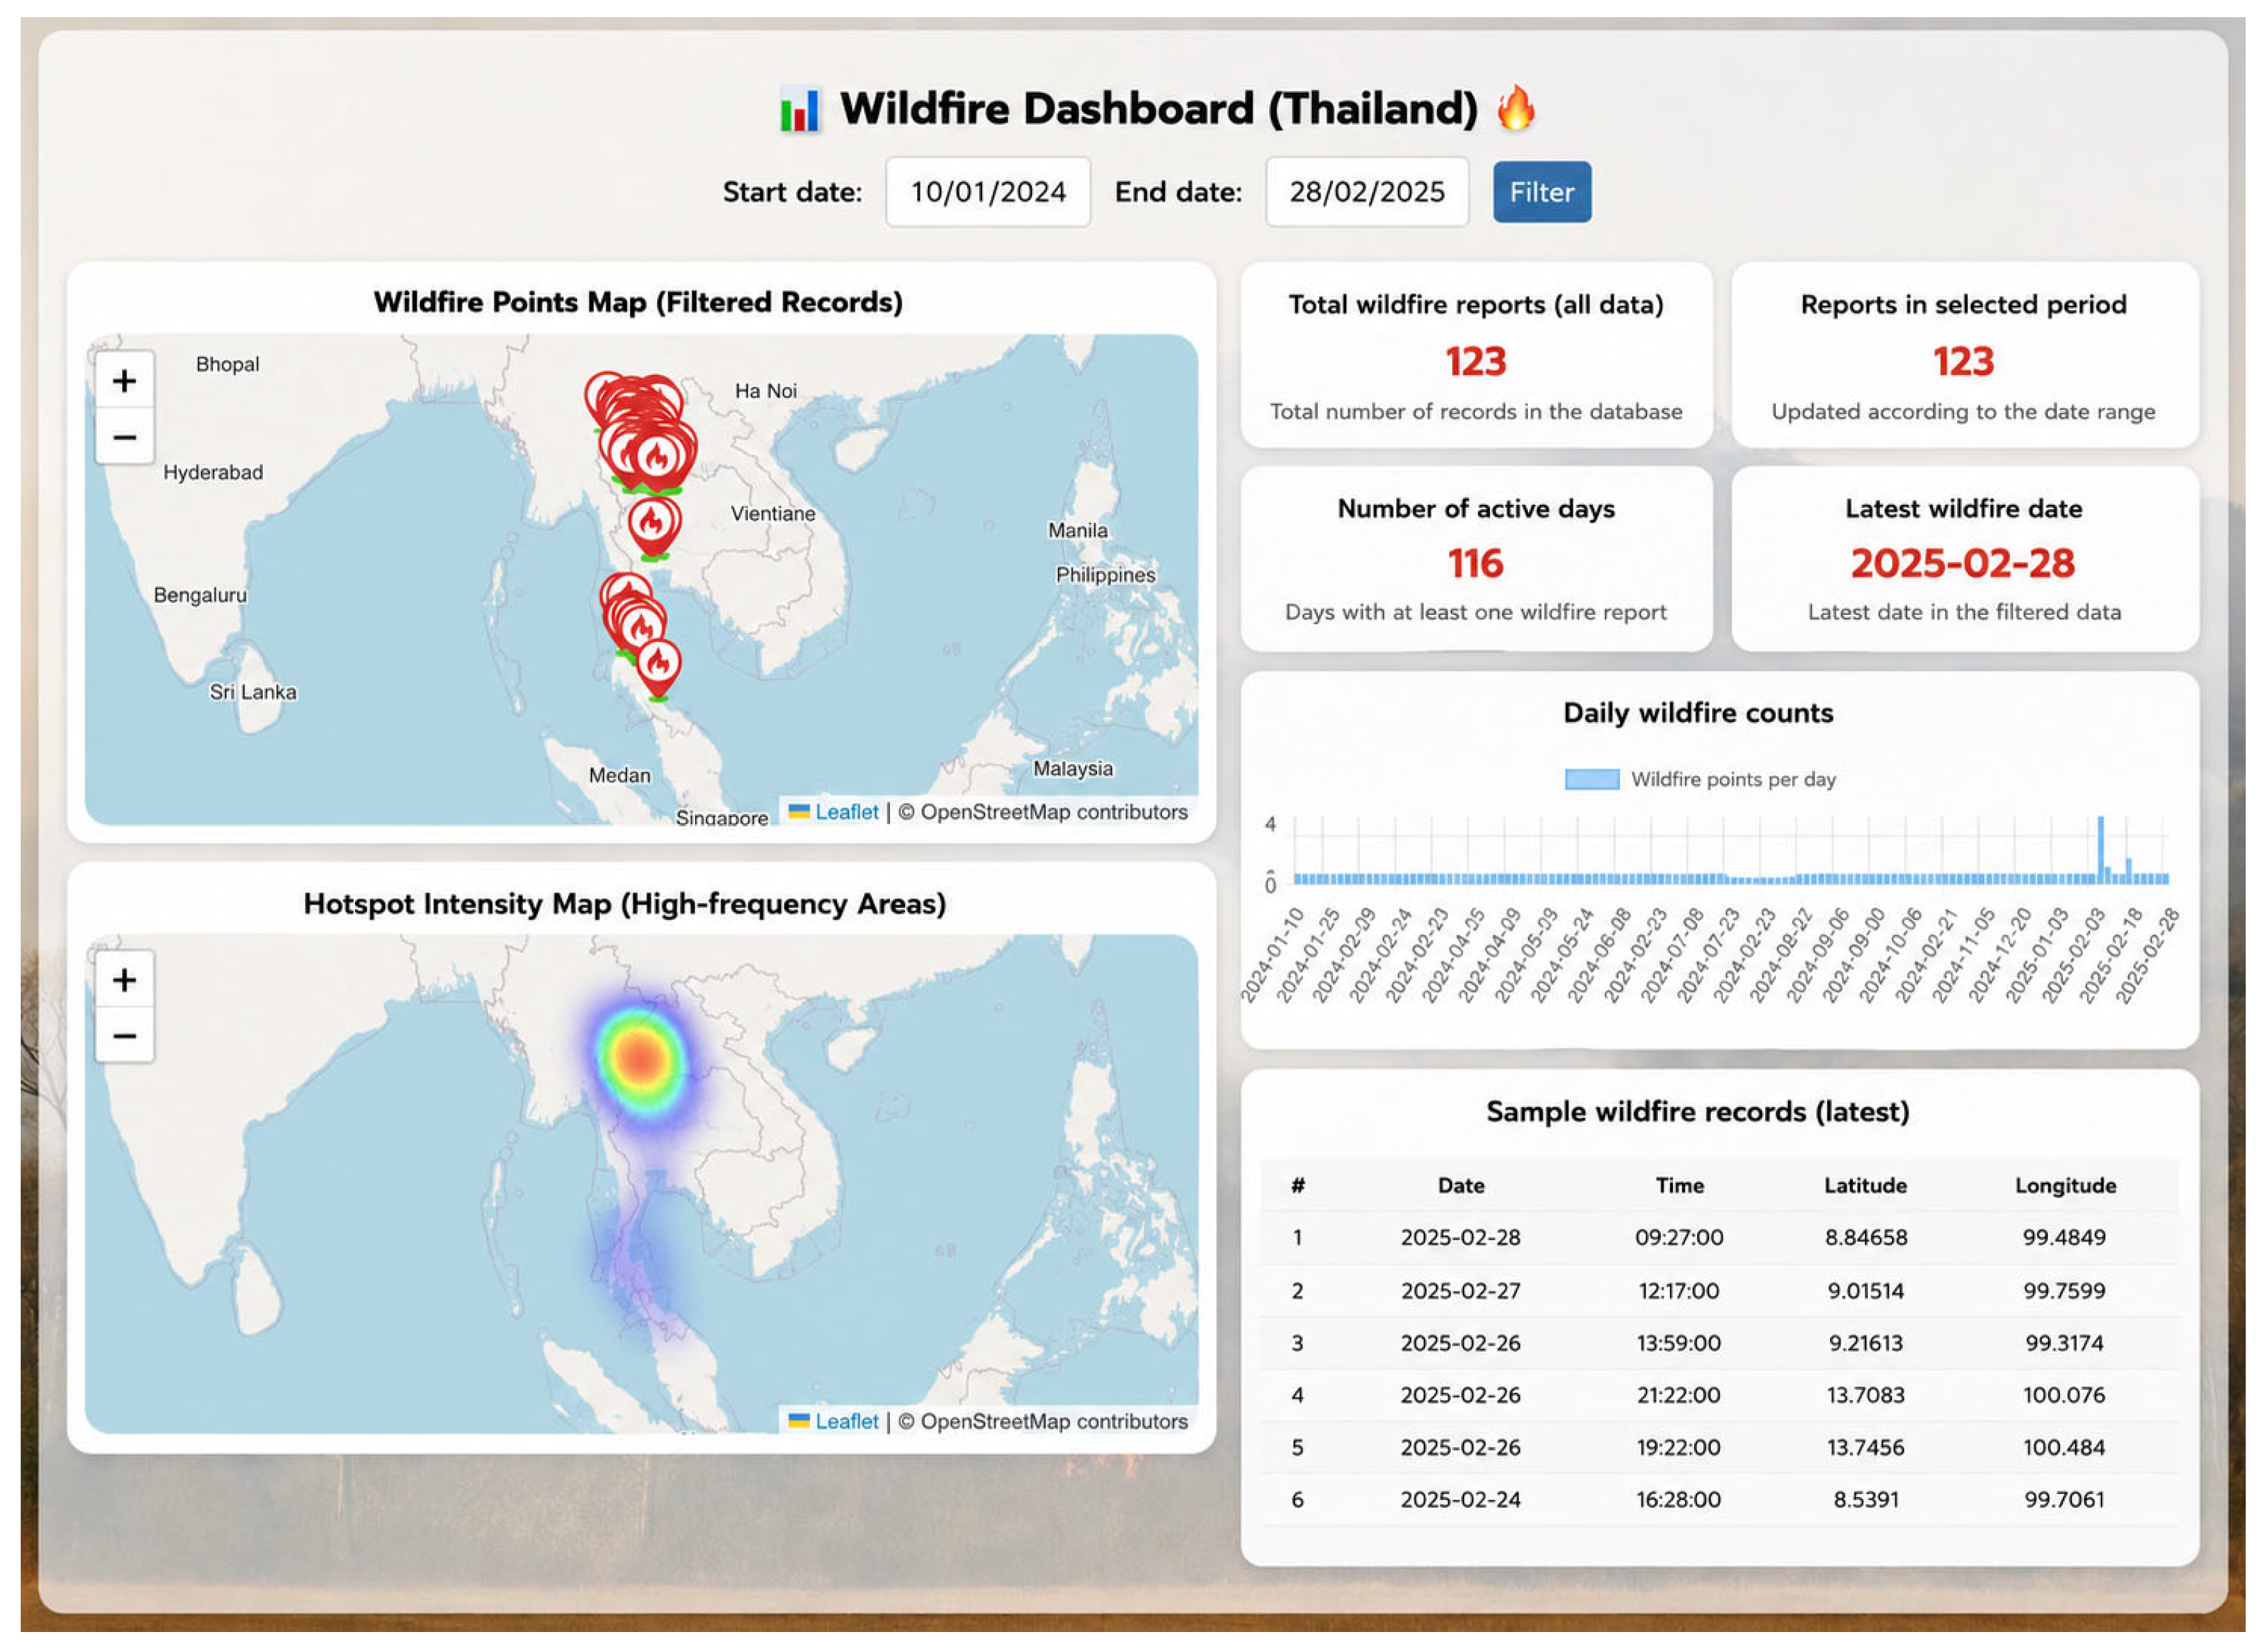
A dashboard analytics module was developed to provide an overview of wildfire activity and support temporal analysis, as shown in Figure 10. The dashboard presents key indicators, including the total number of wildfire reports, the number of active reporting days, daily wildfire counts, spatial distribution of wildfire points, and recent report records.
Figure 10.
Wildfire dashboard presenting spatial and temporal analytics, including wildfire point distribution, spatial density visualization, daily wildfire counts, and summary statistics.
The results show that wildfire reports were not evenly distributed over time. Several periods showed higher daily counts, suggesting temporal variation in wildfire occurrence. This pattern may be associated with seasonal conditions, agricultural burning, human activities, and land-use practices. The daily wildfire count graph allows users to observe changes in reported incidents over time and supports short-term monitoring of wildfire activity.
The spatial density visualization shows areas where wildfire reports are more concentrated. This information can help identify locations that require closer observation or further verification. In addition, the table of recent wildfire reports provides updated information on reported events, supporting situational awareness and follow-up actions.
Overall, the dashboard combines summary statistics, temporal charts, spatial visualization, and recent report information in a single interface. This function helps users, researchers, and responsible agencies examine wildfire patterns more efficiently and supports data-informed monitoring and decision-making.
4.6. Satellite-Based Hotspot Analysis Using Google Earth Engine
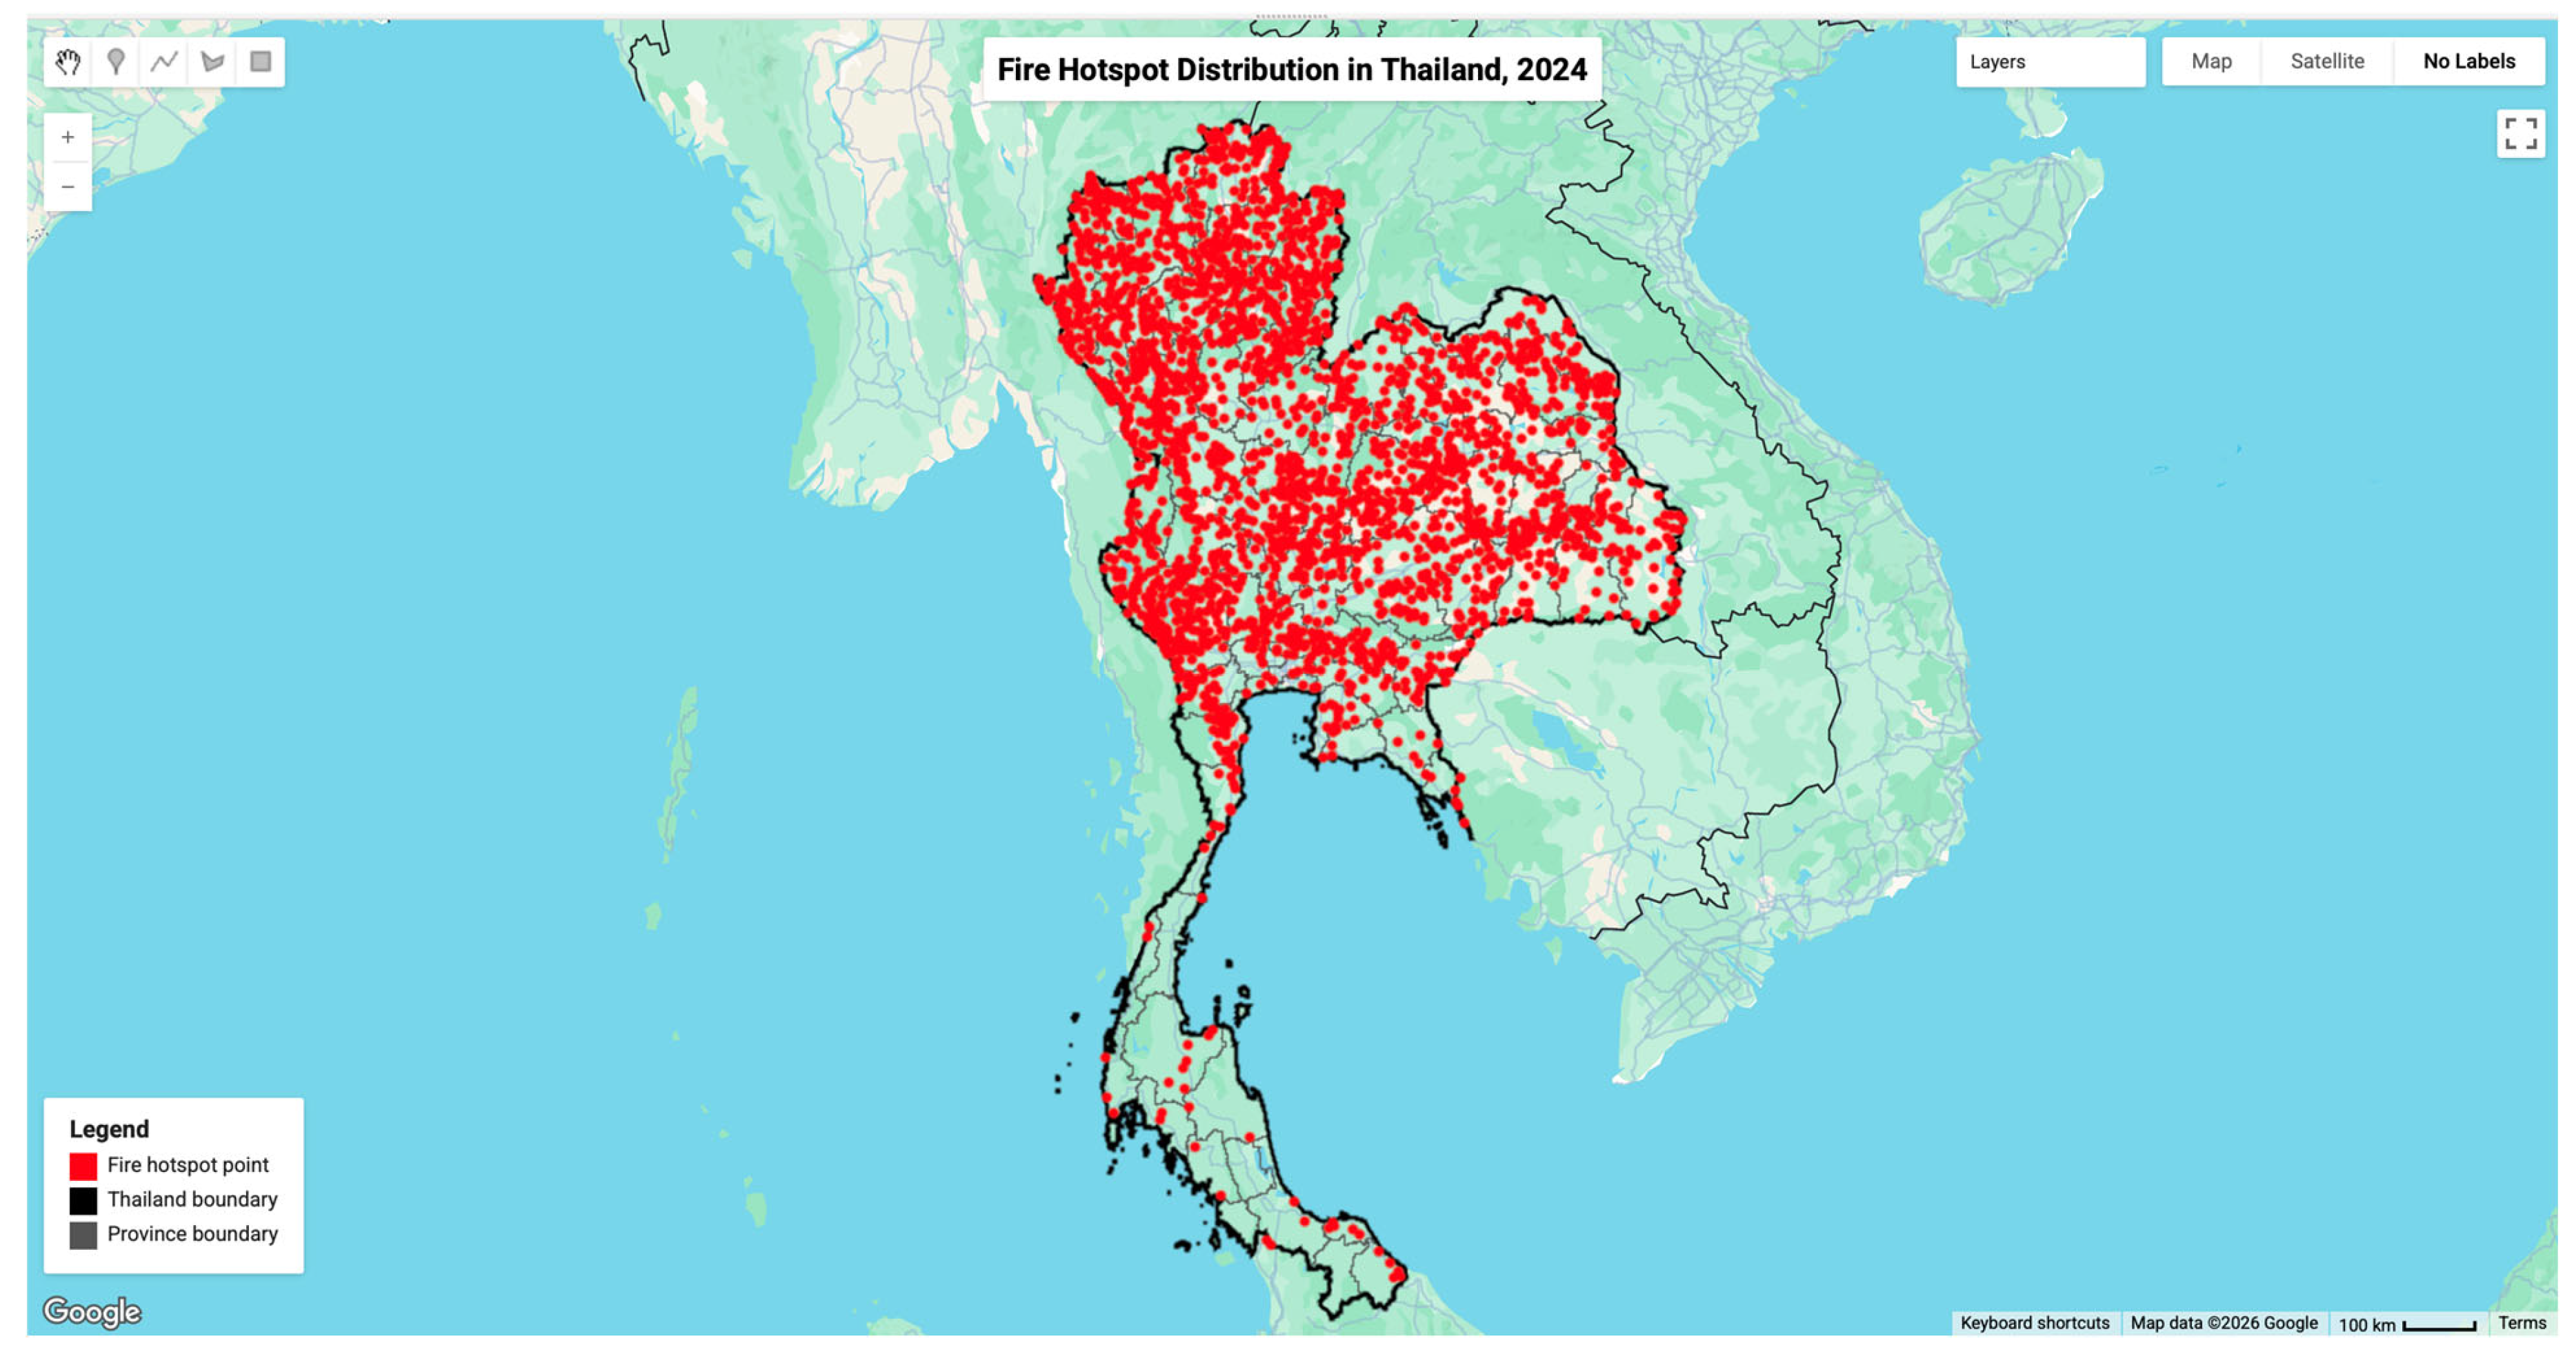
Satellite-derived hotspot data were processed using Google Earth Engine (GEE), as shown in Figure 11. The analysis used FIRMS MODIS active fire data to identify thermal anomaly locations across Thailand. The resulting hotspot distribution shows a concentration of fire-related activity in northern and northeastern Thailand, which corresponds to areas commonly affected by dry-season burning and wildfire events.
Figure 11.
Satellite-derived fire hotspot distribution in Thailand obtained from FIRMS MODIS data using Google Earth Engine.
The use of FIRMS MODIS data supports broad-scale monitoring of fire activity over large geographic areas. In this study, the thermal anomaly band T21 was used to represent fire intensity, and a threshold of T21 > 325 was applied to extract hotspot pixels. These pixels were then converted into point features to enable visualization and integration with the WildfireGO platform.
The satellite-derived hotspot layer provides spatial evidence that can be used to cross-check crowdsourced wildfire reports. Areas with concentrated satellite hotspots generally correspond to regions where wildfire reports were observed in the platform. This agreement suggests that satellite data can complement user-submitted observations by providing broader spatial context, while crowdsourced reports provide local information and visual evidence from the field.
Satellite-derived hotspot data were processed using the FIRMS MODIS active-fire product available through GEE. The combined use of satellite-derived hotspot data and crowdsourced reports strengthens the validation workflow of the system. Satellite data help identify regional fire activity, whereas user reports provide more detailed information at specific locations. By linking these data sources, WildfireGO supports a more practical approach to wildfire monitoring, particularly in areas where field verification is difficult or delayed.
4.7. Discussion
The results show that the WildfireGO system can support wildfire detection and validation by combining AI-based image classification, crowdsourced observations, and satellite-derived hotspot data. Among the four classification models evaluated in this study, CNN achieved the highest performance across the main evaluation metrics. This result is consistent with previous studies showing that convolutional neural networks are effective for extracting visual features associated with fire and smoke detection [1,10,11].
Compared with more advanced architectures, such as YOLO-based object detection models and transformer-based approaches [9,22,23], the CNN model used in this study offers a practical balance between classification performance and computational requirements. YOLO-based models are useful for object localization, while transformer-based models can capture more complex global features. However, these approaches generally require larger datasets and higher computational resources. In contrast, the CNN model achieved high classification performance using a moderate-sized image dataset and can be integrated into a web-based reporting system without excessive computational demand. This makes it suitable for the intended application, where rapid screening of user-submitted images is required.
The use of both 10-fold cross-validation and an independent test dataset strengthens the evaluation of the classification model. The cross-validation results provide evidence of model stability across different data partitions, while the independent test dataset evaluates performance on unseen images that were not used during training or validation. The consistency between these two evaluation settings suggests that the CNN model can generalize reasonably well to crowdsourced wildfire images collected under varying conditions.
A key contribution of this study is the integration of crowdsourced reporting with AI-based image screening. Crowdsourcing and volunteered geographic information (VGI) can provide timely local observations, but they may also contain inconsistent, incomplete, or irrelevant data [15]. To address this issue, WildfireGO uses image classification as an initial screening mechanism before user-submitted reports are stored and visualized. This process helps reduce incorrect submissions and improves the usability of crowdsourced wildfire information for monitoring purposes.
In addition to image-based screening, satellite-derived hotspot data processed through Google Earth Engine provide broader spatial context for wildfire validation. The hotspot distribution observed in this study is generally consistent with known fire-prone areas in Thailand and with previous studies using MODIS data for fire detection and burned-area analysis [18,20,21]. Satellite data are useful for monitoring fire activity over large areas, but they can be limited by revisit time, spatial resolution, and atmospheric conditions. Crowdsourced reports can complement these limitations by providing local visual evidence and more timely information from the field.
From a system perspective, WildfireGO demonstrates how AI, geospatial processing, crowdsourcing, and web technologies can be combined in an operational workflow. Unlike studies that focus mainly on improving model accuracy or analyzing a single data source, this study emphasizes the connection between data collection, image classification, satellite-based validation, and map-based visualization. This system-oriented approach is important for practical wildfire monitoring because detection results must be interpreted together with location, time, and supporting spatial evidence.
The platform also has potential for adaptation to other geographic regions. Since the workflow uses commonly available geospatial data sources and web technologies, it can be modified by changing the spatial boundary, satellite data filters, and local administrative layers. However, further testing would be required before deployment in other regions because wildfire characteristics, land-cover patterns, user participation, and reporting behavior may differ across locations.
Despite these strengths, several limitations should be noted. First, the performance of the CNN model may still be affected by variations in image quality, lighting conditions, viewing angle, distance from the fire source, and occlusions in crowdsourced images. Second, the use of crowdsourced reports may introduce spatial and temporal bias because data availability depends on user participation and accessibility. Third, the satellite-based validation relies on MODIS hotspot information, which may not detect all small or short-duration fire events due to spatial and temporal resolution constraints.
Additional limitations should also be acknowledged. Satellite-based validation may be affected by cloud cover, atmospheric conditions, and satellite revisit intervals, which can delay or obscure hotspot detection. The quality of crowdsourced images may vary considerably due to differences in camera devices, image resolution, lighting conditions, and user experience. Furthermore, crowdsourced reporting may be spatially biased toward areas with higher population density, internet accessibility, or active user participation, potentially resulting in underrepresentation of remote regions. The system may also have limited capability for detecting very small or early-stage wildfire events that are not clearly visible in user-submitted images or detectable by satellite sensors. In addition, although the platform was developed using real crowdsourced data and operational geospatial datasets, the evaluation focused primarily on image classification performance and system functionality rather than large-scale validation during active wildfire response operations. Further field-based assessments involving emergency management agencies and operational wildfire-monitoring organizations would be valuable for evaluating the practical effectiveness of the system under real-world conditions.
Future work should therefore explore the integration of additional data sources, such as meteorological data, land-cover information, high-resolution satellite imagery, and fire-risk indicators. More advanced models, including CNN–transformer hybrids or multimodal learning approaches, could also be evaluated to improve classification under complex environmental conditions. In addition, field-based validation and collaboration with responsible agencies would be useful for assessing the operational effectiveness of the system in wildfire response workflows.
Overall, the findings suggest that combining crowdsourced reports, AI-based image classification, and satellite-derived hotspot data has the potential to enhance wildfire monitoring and validation within a geospatial framework. WildfireGO provides a system-level approach for screening user-submitted wildfire reports, cross-checking them with satellite evidence, and visualizing the results in a geospatial environment. This approach supports more reliable wildfire monitoring and provides a basis for further development of decision-support tools for environmental management and disaster response.
The current implementation of WildfireGO was developed as a functional prototype to demonstrate the integration of crowdsourced reporting, AI-based image classification, satellite-derived hotspot analysis, and geospatial visualization. Although the system supports near-real-time data submission and processing, formal performance benchmarking, scalability testing, and stress testing under high user loads were beyond the scope of this study. Future work should evaluate system response time, concurrent user capacity, image-processing latency, satellite data update frequency, and operational reliability under large-scale deployment scenarios.
Although the proposed framework integrates crowdsourced observations, AI-based image classification, and satellite-derived hotspot information within a unified validation workflow, the present study did not perform a quantitative comparison between CNN-only, satellite-only, and multi-source validation strategies. Therefore, the results demonstrate the feasibility of the proposed integration framework rather than the relative superiority of one validation strategy over another. Future work should conduct comparative experiments to quantify the benefits of multi-source validation in terms of detection accuracy, false-alarm reduction, and operational reliability.
5. Conclusions
This study presented WildfireGO, a web-based multi-source wildfire detection and validation platform that integrates crowdsourced observations, AI-based image classification, and satellite-derived hotspot data within a unified geospatial framework. The system was developed to bridge the gap between satellite observations and ground-level wildfire reports by enabling users to submit wildfire evidence and validate reported events through automated image analysis.
The experimental results demonstrated that the CNN model achieved the highest classification performance among the evaluated methods, reaching approximately 97.5% accuracy in both 10-fold cross-validation and independent testing. The independent test results further confirmed the model’s ability to accurately classify previously unseen wildfire images collected through crowdsourcing. Although RF, KNN, and GB achieved lower performance, they provided useful baseline comparisons for evaluating the effectiveness of deep learning approaches.
A key contribution of this work is the integration of multiple data sources for wildfire monitoring and validation. Crowdsourced images provide local visual evidence, while MODIS hotspot data offer broader spatial context for cross-checking reported incidents. The developed platform combines data collection, automated image screening, geospatial visualization, and hotspot analysis within a single operational environment, supporting environmental monitoring and spatial decision-making.
Several limitations should be acknowledged. The quality and distribution of crowdsourced data depend on user participation and may introduce spatial and temporal biases. In addition, classification performance can be influenced by image quality, lighting conditions, and environmental backgrounds, while satellite-derived hotspot information may be affected by spatial resolution, revisit intervals, cloud cover, and atmospheric conditions. These factors may influence the completeness and reliability of wildfire validation in some situations.
Future research should focus on integrating additional data sources, including meteorological variables, land-cover information, high-resolution satellite imagery, and field verification records. The incorporation of advanced deep learning architectures, multimodal learning approaches, and real-time alert mechanisms may further improve wildfire detection and validation performance. Overall, the findings demonstrate that integrating crowdsourced observations, AI-based image classification, and satellite hotspot data provides a practical and scalable approach for supporting wildfire monitoring and validation within an operational geospatial framework.
Author Contributions
Conceptualization, S.P. (Supattra Puttinaovarat); methodology, S.P. (Supattra Puttinaovarat); software, A.S.; system development, A.S.; data curation, A.S., S.P. (Siwipa Pruitikanee), J.K. and J.S.; visualization, A.S.; investigation, S.P. (Siwipa Pruitikanee) and J.K.; validation, S.P. (Siwipa Pruitikanee), J.S., T.A. and N.I.; formal analysis, A.W.; resources, S.P. (Supattra Puttinaovarat); supervision, S.P. (Supattra Puttinaovarat); project administration, S.P. (Supattra Puttinaovarat); writing—original draft preparation, S.P. (Supattra Puttinaovarat); writing—review and editing, S.P. (Supattra Puttinaovarat), A.W., T.A. and N.I. All authors have read and agreed to the published version of the manuscript.
Funding
This research received no external funding.
Data Availability Statement
The data that support the findings of this study are available from the corresponding author upon reasonable request.
Acknowledgments
This work was financially supported by Prince of Songkla University, Surat Thani Campus. The authors used ChatGPT-5.5 Thinking by OpenAI solely to support language editing, improve readability, and refine the clarity of expression during the preparation of this manuscript. All AI-assisted content was carefully reviewed, verified, and revised by the authors to ensure accuracy, completeness, and originality. The scientific interpretations, data analyses, methodological decisions, and conclusions presented in this work are entirely the responsibility of the authors.
Conflicts of Interest
The authors declare no conflicts of interest.
References
- Harkat, H.; Nascimento, J.M.; Bernardino, A.; Ahmed, H.F.T. Fire image classification based on a handcrafted approach. Expert Syst. Appl. 2023, 212, 118594. [Google Scholar]
- Zheng, S.; Gao, P.; Zou, X.; Wang, W. Forest fire monitoring via unmanned aerial vehicle image processing based on a modified machine learning algorithm. Front. Plant Sci. 2022, 13, 954757. [Google Scholar] [PubMed]
- Davis, M.; Shekaramiz, M. Image classification of forest fires using machine and deep learning. In Proceedings of the Intermountain Engineering, Technology and Computing (IETC), Logan, UT, USA, 13–14 May 2024; pp. 270–275. [Google Scholar]
- Yandouzi, M.; Grari, M.; Idrissi, I.; Boukabous, M.; Moussaoui, O.; Azizi, M.; Elmiad, A.K. Forest fires detection using deep transfer learning. Int. J. Adv. Comput. Sci. Appl. 2022, 13, 268–275. [Google Scholar] [CrossRef] [Scilit]
- Tang, Y.; Feng, H.; Chen, J.; Chen, Y. ForestResNet: A deep learning algorithm for forest image classification. J. Phys. Conf. Ser. 2021, 2024, 012053. [Google Scholar]
- Sathishkumar, V.E.; Cho, J.; Subramanian, M.; Naren, O.S. Forest fire and smoke detection using deep learning-based learning without forgetting. Fire Ecol. 2023, 19, 9. [Google Scholar] [CrossRef] [Scilit]
- Singh, S.; Vazirani, V.; Singhania, S.; Suroth, V.S.; Soni, V.; Biwalkar, A.; Krishnan, D. Beyond boundaries: Unifying classification and segmentation in wildfire detection systems. Multimed. Tools Appl. 2025, 84, 22441–22473. [Google Scholar]
- Zhan, J.; Hu, Y.; Zhou, G.; Wang, Y.; Cai, W.; Li, L. A high-precision forest fire smoke detection approach based on ARGNet. Comput. Electron. Agric. 2022, 196, 106874. [Google Scholar] [CrossRef] [Scilit]
- He, H.; Zhang, Z.; Jia, Q.; Huang, L.; Cheng, Y.; Chen, B. Wildfire detection for transmission line based on improved lightweight YOLO. Energy Rep. 2023, 9, 512–520. [Google Scholar]
- Akagić, A.; Buza, E. LW-Fire: A lightweight wildfire image classification with a deep convolutional neural network. Appl. Sci. 2022, 12, 2646. [Google Scholar] [CrossRef] [Scilit]
- Roh, J.; Kim, Y.; Kong, M. Fire image classification based on convolutional neural network for smart fire detection. Int. J. Fire Sci. Eng. 2022, 36, 51–61. [Google Scholar] [CrossRef] [Scilit]
- Bai, Y.; Wang, D.; Li, Q.; Liu, T.; Ji, Y. Advanced multi-label fire scene image classification via BiFormer, domain-adversarial network and GCN. Fire 2024, 7, 322. [Google Scholar]
- Park, M.; Bak, J.; Park, S. Advanced wildfire detection using generative adversarial network-based augmented datasets and weakly supervised object localization. Int. J. Appl. Earth Obs. Geoinf. 2022, 114, 103052. [Google Scholar] [CrossRef] [Scilit]
- Khan, A.; Sohail, A.; Zahoora, U.; Qureshi, A.S. A survey of the recent architectures of deep convolutional neural networks. Artif. Intell. Rev. 2020, 53, 5455–5516. [Google Scholar] [CrossRef] [Scilit]
- Goodchild, M.F. Citizens as sensors: The world of volunteered geography. GeoJournal 2007, 69, 211–221. [Google Scholar] [CrossRef] [Scilit]
- Puttinaovarat, S.; Horkaew, P. A geospatial platform for crowdsourcing green space area management using GIS and deep learning classification. ISPRS Int. J. Geo-Inf. 2022, 11, 208. [Google Scholar] [CrossRef] [Scilit]
- Huang, X.; Wang, S.; Yang, D.; Hu, T.; Chen, M.; Zhang, M.; Hohl, A. Crowdsourcing geospatial data for earth and human observations: A review. J. Remote Sens. 2024, 4, 0105. [Google Scholar] [CrossRef] [Scilit]
- Lizundia-Loiola, J.; Otón, G.; Ramo, R.; Chuvieco, E. A spatio-temporal active-fire clustering approach for global burned area mapping at 250 m from MODIS data. Remote Sens. Environ. 2020, 236, 111493. [Google Scholar]
- Li, Z.; Liu, F.; Yang, W.; Peng, S.; Zhou, J. A survey of convolutional neural networks: Analysis, applications, and prospects. IEEE Trans. Neural Netw. Learn. Syst. 2021, 33, 6999–7019. [Google Scholar] [CrossRef] [Scilit]
- Zhou, M.; Wang, J.; Garcia, L.C.; Chen, X.; da Silva, A.M.; Wang, Z.; Miller, S.D. Enhancement of nighttime fire detection and combustion efficiency characterization using VIIRS instruments. IEEE Trans. Geosci. Remote Sens. 2023, 61, 1–20. [Google Scholar]
- Coskuner, K.A. Assessing the performance of MODIS and VIIRS active fire products in wildfire monitoring. iForest 2022, 15, 85–92. [Google Scholar] [CrossRef] [Scilit]
- Shi, P.; Lu, J.; Wang, Q.; Zhang, Y.; Kuang, L.; Kan, X. An efficient forest fire detection algorithm using improved YOLOv5. Forests 2023, 14, 2440. [Google Scholar] [CrossRef] [Scilit]
- Khan, S.; Naseer, M.; Hayat, M.; Zamir, S.W.; Khan, F.S.; Shah, M. Transformers in vision: A survey. ACM Comput. Surv. 2022, 54, 1–41. [Google Scholar] [CrossRef] [Scilit]
- Vinuesa, R.; Azizpour, H.; Leite, I.; Balaam, M.; Dignum, V.; Domisch, S.; Felländer, A.; Langhans, S.D.; Tegmark, M.; Fuso Nerini, F. The role of artificial intelligence in achieving the Sustainable Development Goals. Nat. Commun. 2020, 11, 233. [Google Scholar] [CrossRef] [Scilit] [PubMed]
- Amiri, Z.; Heidari, A.; Navimipour, N.J. Comprehensive survey of artificial intelligence techniques and strategies for climate change mitigation. Energy 2024, 308, 132827. [Google Scholar] [CrossRef] [Scilit]
- Heidari, A.; Navimipour, N.J.; Unal, M. Applications of ML/DL in the management of smart cities and societies based on new trends in information technologies: A systematic literature review. Sustain. Cities Soc. 2022, 85, 104089. [Google Scholar] [CrossRef] [Scilit]
- Kazanskiy, N.; Khabibullin, R.; Nikonorov, A.; Khonina, S. A comprehensive review of remote sensing and artificial intelligence integration: Advances, applications, and challenges. Sensors 2025, 25, 5965. [Google Scholar] [CrossRef] [Scilit] [PubMed]
- Ghali, R.; Akhloufi, M.A. Deep learning approaches for wildland fires using satellite remote sensing data: Detection, mapping, and prediction. Fire 2023, 6, 192. [Google Scholar] [CrossRef] [Scilit]
- Sarker, I.H. Smart city data science: Towards data-driven smart cities with open research issues. Internet Things 2022, 19, 100528. [Google Scholar] [CrossRef] [Scilit]
- Moayedi, H.; Khasmakhi, M.A.S.A. Wildfire susceptibility mapping using machine learning algorithms. Stoch. Environ. Res. Risk Assess. 2023, 37, 49–72. [Google Scholar]

Disclaimer/Publisher’s Note: The statements, opinions and data contained in all publications are solely those of the individual author(s) and contributor(s) and not of MDPI and/or the editor(s). MDPI and/or the editor(s) disclaim responsibility for any injury to people or property resulting from any ideas, methods, instructions or products referred to in the content. |
© 2026 by the authors. Published by MDPI on behalf of the International Institute of Knowledge Innovation and Invention. Licensee MDPI, Basel, Switzerland. This article is an open access article distributed under the terms and conditions of the Creative Commons Attribution (CC BY) license.