


Abstract
Economic dispatch in grid-connected microgrids is challenged by the variability of renewable generation, the uncertainty of demand, and the need to simultaneously satisfy technical and economic constraints under different operating conditions. This study proposes an integrated predictive economic dispatch strategy for power grids with interconnected microgrids, structured as a unified optimization framework. The approach integrates nodal electrical modeling, Optimal Power Flow (OPF)-based optimization, multi-scenario analysis, and post-optimization feasibility verification based on performance indicators within a single decision-support structure. The methodology is applied to a modified 14-node power grid interconnected with a microgrid, where simulations are conducted under three representative load scenarios (100%, 70%, and 40%) and two operational configurations (hybrid and renewable-only), enabling a comprehensive assessment of system behavior. Results show that the hybrid configuration consistently outperforms the renewable-only case, achieving loss reductions of up to 7.3 MW, increases in spinning reserve exceeding 50 MW, and a transition from net power import to export of approximately 50 MW under high demand. Additionally, the microgrid plays an active operational role, dynamically switching between import and export modes based on load levels and the generation mix. The proposed framework enables identification of operationally efficient and technically feasible configurations by incorporating bidirectional power exchange, electrical constraints, and reserve requirements. The main contribution lies in integrating technical, operational, and interaction variables within a single deterministic Optimal Power Flow (OPF)-based assessment scheme to support decision-making in interconnected microgrid-based power grids.
1. Introduction
The transition to low-carbon energy systems has driven the increasing penetration of renewable energy sources into electric power grids, transforming traditional generation, operation, and control models. While this process contributes to environmental sustainability, it also introduces operational challenges associated with the inherent variability of renewable generation and changes in demand. In this context, the integration of microgrids as active elements of the power grid redefines conventional operation and requires strategies that maintain reliability, stability, and economic efficiency [1].
The variability of renewable energy generation, together with changes in demand and grid operational constraints, directly affects economic dispatch decisions. Consequently, conventional deterministic approaches may be insufficient to represent the operational complexity of power grids, with interconnected microgrids, which has motivated the development of more adaptive models incorporating distributed energy resources, storage, and flexibility mechanisms [2,3,4]. However, the simultaneous integration of these variables into economic dispatch schemes remains an open challenge.
The state of the art shows significant progress in different dimensions of the problem, albeit in a fragmented way. On the one hand, several studies have examined the configuration and topology of microgrids, establishing technical criteria for integrating distributed energy resources, including reliability, efficiency, and operating costs [2]. These works contribute to the structural design of power grids with microgrids, but they do not fully address economic operation under different deterministic operating scenarios or the interaction between the microgrid and the main power grid.
In parallel, research on power grid stability has examined the impact of high penetration of inverter-based resources on system inertia and robustness. A study demonstrated that reducing synchronous generation increases the risk of frequency and voltage instability [5] and another study highlighted the need for new control approaches in low-inertia power grids [6]. However, these studies focus on dynamic aspects and do not comprehensively address the economic optimization of dispatch in interconnected power grids with microgrids. Furthermore, the literature on operational flexibility and demand management has highlighted the role of energy storage, smart grids, and demand response as key mechanisms for balancing generation and consumption in power grids with high renewable energy penetration [7,8]. Another study presented a detailed review of these mechanisms, emphasizing their relevance for improving power grid adaptability [9]. However, these approaches often remain at a conceptual level and are not translated into operational models that simultaneously integrate technical and economic constraints in dispatch.
In recent years, model-based predictive control has emerged as a relevant tool for energy management in complex power grids. A study highlighted its potential to improve decision-making [10] and another demonstrated improvements in operational coordination of interconnected microgrids using sliding-horizon optimization schemes [11]. Similarly, a study proposed robust and hierarchical approaches to address uncertainty in integrated energy power grids [12]. However, these developments have limitations in simultaneously integrating critical technical variables, such as bidirectional power flows, interconnection constraints, installed capacity, losses, and reliability, especially in scenarios that represent real-world operation of interconnected power grids.
More specifically, predictive-control-based economic dispatch approaches have been applied in various contexts. A study proposed a distributed predictive control scheme for isolated microgrids [13], while another presented similar strategies for multinodal DC microgrids [14]. Other authors presented different formulations of distributed predictive control for real-time and intra-hour dispatch [15]. The authors of another study formulated an economic predictive control scheme for grid-connected smart microgrids [16], and others incorporated climatic and market variables into predictive models for solar power grids with storage [17]. Similarly, other authors proposed continuous dispatch optimization based on forecast information [18], while others developed robust approaches to reduce the impact of prediction errors [19]. Other studies, such as those by [20,21,22], analyzed dispatch strategies in hybrid microgrids using techno-economic evaluations. In this regard, another study showed that the technical–economic evaluation of renewable generation integration should not be limited to the generation plant [23], but should also include power-flow analysis, electrical losses, investment requirements, transmission costs, and generation costs.
Despite these advances, these studies generally do not consider critical aspects of the interconnection between the microgrid and the power grid in an integrated manner, such as bidirectional energy transfer, operating reserve, generation limits, interconnection topology, and power grid constraints. This limitation reduces the models’ ability to represent coordinated grid–microgrid operation and restricts their applicability in interconnected power grids. Overall, the literature shows significant progress in stability, flexibility, and predictive control; however, a gap remains in the development of economic dispatch frameworks that simultaneously integrate technical, operational, and grid–microgrid interaction variables in power grids with interconnected microgrids [24]. This gap is reflected in the lack of approaches that jointly represent bidirectional power exchange, electrical constraints, operating reserves, losses, and generation configurations under varying deterministic operating conditions.
In this context, this article proposes a multi-scenario Optimal Power Flow (OPF)-based economic dispatch framework for microgrids interconnected with the main power grid, explicitly accounting for the technical variables of the power grid and their interactions across predefined operating scenarios. The approach considers representative load levels, models bidirectional power flows between the microgrid and the power grid, and incorporates electrical constraints related to voltage limits, line loadability, generation limits, spinning reserve, and power losses. Therefore, the framework is formulated as a deterministic, scenario-based OPF for assessing technically feasible and economically consistent dispatch solutions.
The contribution of this work lies in the formulation of an economic dispatch framework that integrates, within a single OPF-based structure, technical, operational, and interaction variables that have often been treated separately in the literature. In particular, the novelty of the study lies in the simultaneous consideration of bidirectional grid–microgrid power exchange, voltage and loadability constraints, spinning reserve, installed capacity, power losses, and hybrid versus renewable-only generation configurations. This integrated treatment enables a more comprehensive assessment of power grid operation with interconnected microgrids and supports dispatch decision-making under predefined deterministic operating scenarios.
2. Materials and Methods
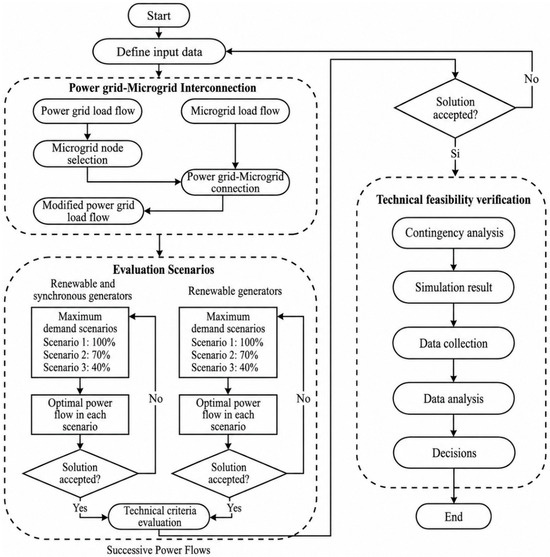
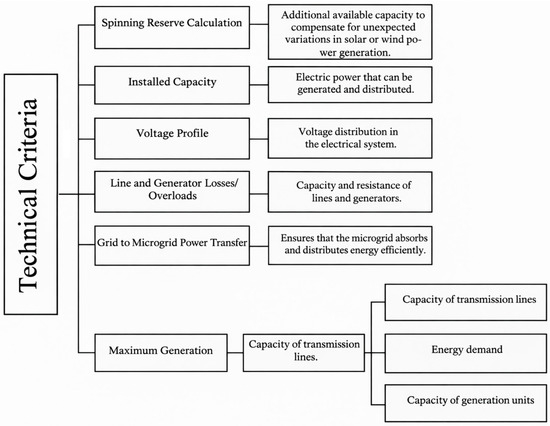
The development of the multi-scenario OPF-based economic dispatch framework follows a sequential procedure that integrates electrical modeling, optimization, deterministic scenario analysis, and post-optimization feasibility verification. The general methodology is illustrated in Figure 1, which presents the proposed algorithm for evaluating the operation of the power grid interconnected with a microgrid under predefined operating scenarios.
Figure 1.
Multi-Scenario OPF-Based Economic Dispatch Framework.
The study is conducted using simulation and power grid analysis tools. Power grid modeling and analysis are performed using specialized software for load flow and optimal power flow, specifically DIgSILENT PowerFactory, version 2023 SP4 [25]. The stages comprising the proposed framework strategy are described sequentially below.
It should be noted that the proposed sequential structure of the methodology does not align with a dynamic programming formulation. In this study, each load scenario is treated as an independent deterministic operating condition and is solved through an OPF-based optimization problem. Therefore, the framework does not include temporal state transitions, stage-wise cost functions, storage state-of-charge evolution, or receding-horizon decisions. Under this formulation, the optimal solution is the feasible OPF solution that minimizes the defined generation cost function while satisfying the imposed electrical and operational constraints.
2.1. Definition of Input Data
The input data definition stage corresponds to the starting point of the algorithm shown in Figure 1 and provides the basis for developing the multi-scenario OPF-based economic dispatch framework. This phase establishes the information required for the electrical modeling of the power grid and for the subsequent execution of load-flow and optimal power-flow models under predefined deterministic operating scenarios.
The input data include electrical, operational, and economic variables that describe the behavior of the power grid and the microgrid. As shown in Table 1, these variables comprise nodal voltages, generation and demand power, operational constraints, generator characteristics, cost curves, microgrid topology, and grid–microgrid power exchange. The table also specifies the corresponding units of measurement and the range of parameter variation considered in the simulations, including load levels of 100%, 70%, and 40%, as well as the two evaluated generation configurations: hybrid and renewable-only.
Table 1.
Description of the input data.
Based on this data, the electrical model is formulated using nodal analysis. For this purpose, a reference bus called “bus X” is considered, which establishes the relationship between the injected power and current at the node.
The voltages at the nodes of the power grid are calculated using [26]:
The term is the vector of injected currents, is the nodal admittance matrix, and is the vector of nodal voltages.
The complex power at each node is defined as [26]:
The terms , , , , and represent the complex power, injected current, active power, reactive power, and voltage at node , respectively.
The reactive power must satisfy operational constraints, expressed as [27]:
where the limits are defined by:
The term and are the reactive generation limits of the generator, and is the reactive power of the load at the node.
The reactive generation limits of the generator are determined based on its operational capability [27]:
where is the power factor angle, calculated as:
Additionally, to ensure stable power grid operation, a minimum generation power is defined as:
The term corresponds to the nominal capacity of the generator.
This criterion ensures that generators operate within an adequate loading range, avoiding unstable conditions and enabling an appropriate response to load variations within the predefined operating scenarios [28].
2.2. Power Grid Interconnection—Microgrid
Once the input data is defined, the interconnection stage between the main power grid and the microgrid begins, forming the basis technical and operational evaluation of the integrated power grid. First, the load flow of the main power grid and, independently, that of the microgrid are calculated. These studies are carried out using DIgSILENT PowerFactory software [25], which enables precise modeling of the power grid’s electrical variables and evaluation of its behavior in terms of voltages, power flows, and losses. This initial evaluation allows for the characterization of each subsystem grid in isolation and verification of compliance with operating limits. Subsequently, the power grid nodes to which the microgrid will be connected are selected. This process considers technical criteria such as network capacity, voltage levels, and operating conditions to ensure proper integration without compromising power grid stability.
Once the connection points are defined, the power grid-microgrid interconnection is performed, integrating both subsystem grids into a single electrical model within the simulation environment. Next, the load flow of the modified power grid is calculated using DIgSILENT PowerFactory 2023 SP4 [25], allowing for evaluation of the power grid’s overall behavior after the microgrid’s integration. This analysis includes verifying variables such as the node voltage profile, line power flows, the load capacity of the network elements, and the balance between generation and demand. If deviations from the established operating limits are identified, adjustments are made to the model parameters, such as load redistribution, generation modifications, or redefinitions of interconnection nodes. This stage, according to the flowchart, establishes the starting point for generating deterministic evaluation scenarios and applying the optimal power flow, ensuring that the integrated power grid is correctly configured, technically verified, and validated for subsequent analysis stages.
2.3. Evaluation Scenarios
Once the interconnection between the main power grid and the microgrid is established, the evaluation scenarios are defined and analyzed. This stage allows characterization of the integrated behavior of the power grid under predefined deterministic and other operating conditions and forms the basis for applying optimal power flow.
Three representative load scenarios, described in Table 2, are considered, corresponding to peak, medium, and low demand conditions. In each scenario, two operating configurations are evaluated: (i) operation with renewable and synchronous generators and (ii) operation exclusively with renewable sources.
Table 2.
Deterministic Operating Scenarios.
For each scenario, the optimal power flow is determined by evaluating key technical variables, including spinning reserve, installed capacity, power transfer from the power grid to the microgrid, maximum available generation, line load capacity, and power grid losses.
Within the context of the predefined deterministic scenarios, the economic dispatch problem is formulated as an objective function aimed at minimizing the total generation cost of the power grid [21]:
The term corresponds to the marginal generation cost of unit , is the generated power, and is the total number of generating units.
The optimization is performed subject to technical and operational constraints. First, the power generated by each unit must satisfy:
Additionally, the balance between generation and demand is ensured by:
These constraints ensure that the power grid operates under energy balance and within the capacity limits of the equipment, avoiding overload or instability conditions [29].
The problem is solved using Optimal Power Flow (OPF) techniques implemented in the DIgSILENT PowerFactory simulation environment, which allows the integration of electrical constraints such as voltage limits, power-flow limits, and network-component capacity limits. Each combination of load scenario and generation configuration was solved independently as a deterministic AC-OPF problem. Before executing the optimization, an AC load-flow calculation was performed for the corresponding operating condition, and its converged solution was used as the initial operating point of the OPF calculation.
To assess the numerical convergence behavior of the OPF formulation, the number of solver iterations required to reach convergence was recorded for each evaluated scenario and configuration. The iteration count was obtained directly from the internal iteration counter provided in the DIgSILENT PowerFactory calculation output after the successful completion of each OPF case. One iteration represents an internal numerical step in which the solver updates the optimization variables and the associated network operating state and subsequently reevaluates the objective function, the active- and reactive-power balance equations, and the imposed equality and inequality constraints.
Convergence was considered to have been achieved when the solver satisfied its configured numerical stopping criteria and obtained a feasible operating point that complied with the limits imposed on nodal voltages, generator active and reactive power, branch power flows, and network-component loadability. The same solver configuration, initialization procedure, and convergence criteria were applied to all evaluated cases.
The recorded values include only the internal iterations of the OPF solver and exclude the iterations associated with the preliminary AC load-flow calculation, manual modifications of the network model, repetitions of the complete methodological procedure, and external post-optimization feasibility-adjustment cycles. This information was used as a complementary indicator of numerical feasibility under the simulated deterministic operating conditions. However, the convergence results should not be interpreted as evidence of real-time applicability, since the framework was not implemented as a real-time model predictive control, receding-horizon, or online dispatch strategy.
Within this scope, the term “min” (best solution) refers to the OPF solution that minimizes the total generation cost for each predefined deterministic scenario while satisfying the system’s technical constraints. These constraints include active and reactive generation limits, power balance, voltage limits, power-flow limits, line and generator loadability, losses, and spinning reserve requirements. Therefore, optimality is interpreted internally with respect to the OPF formulation, input data, and constraints used in the study, rather than as a global comparison with all possible optimization techniques.
During the OPF execution, control conditions associated with active and reactive power dispatch of generators are considered, together with power grid technical constraints, including:
- Voltage limits at the nodes;
- Active and reactive power limits of generators;
- Power flow limits (line loading).
These constraints ensure a secure operation of the power grid under the evaluated conditions [30].
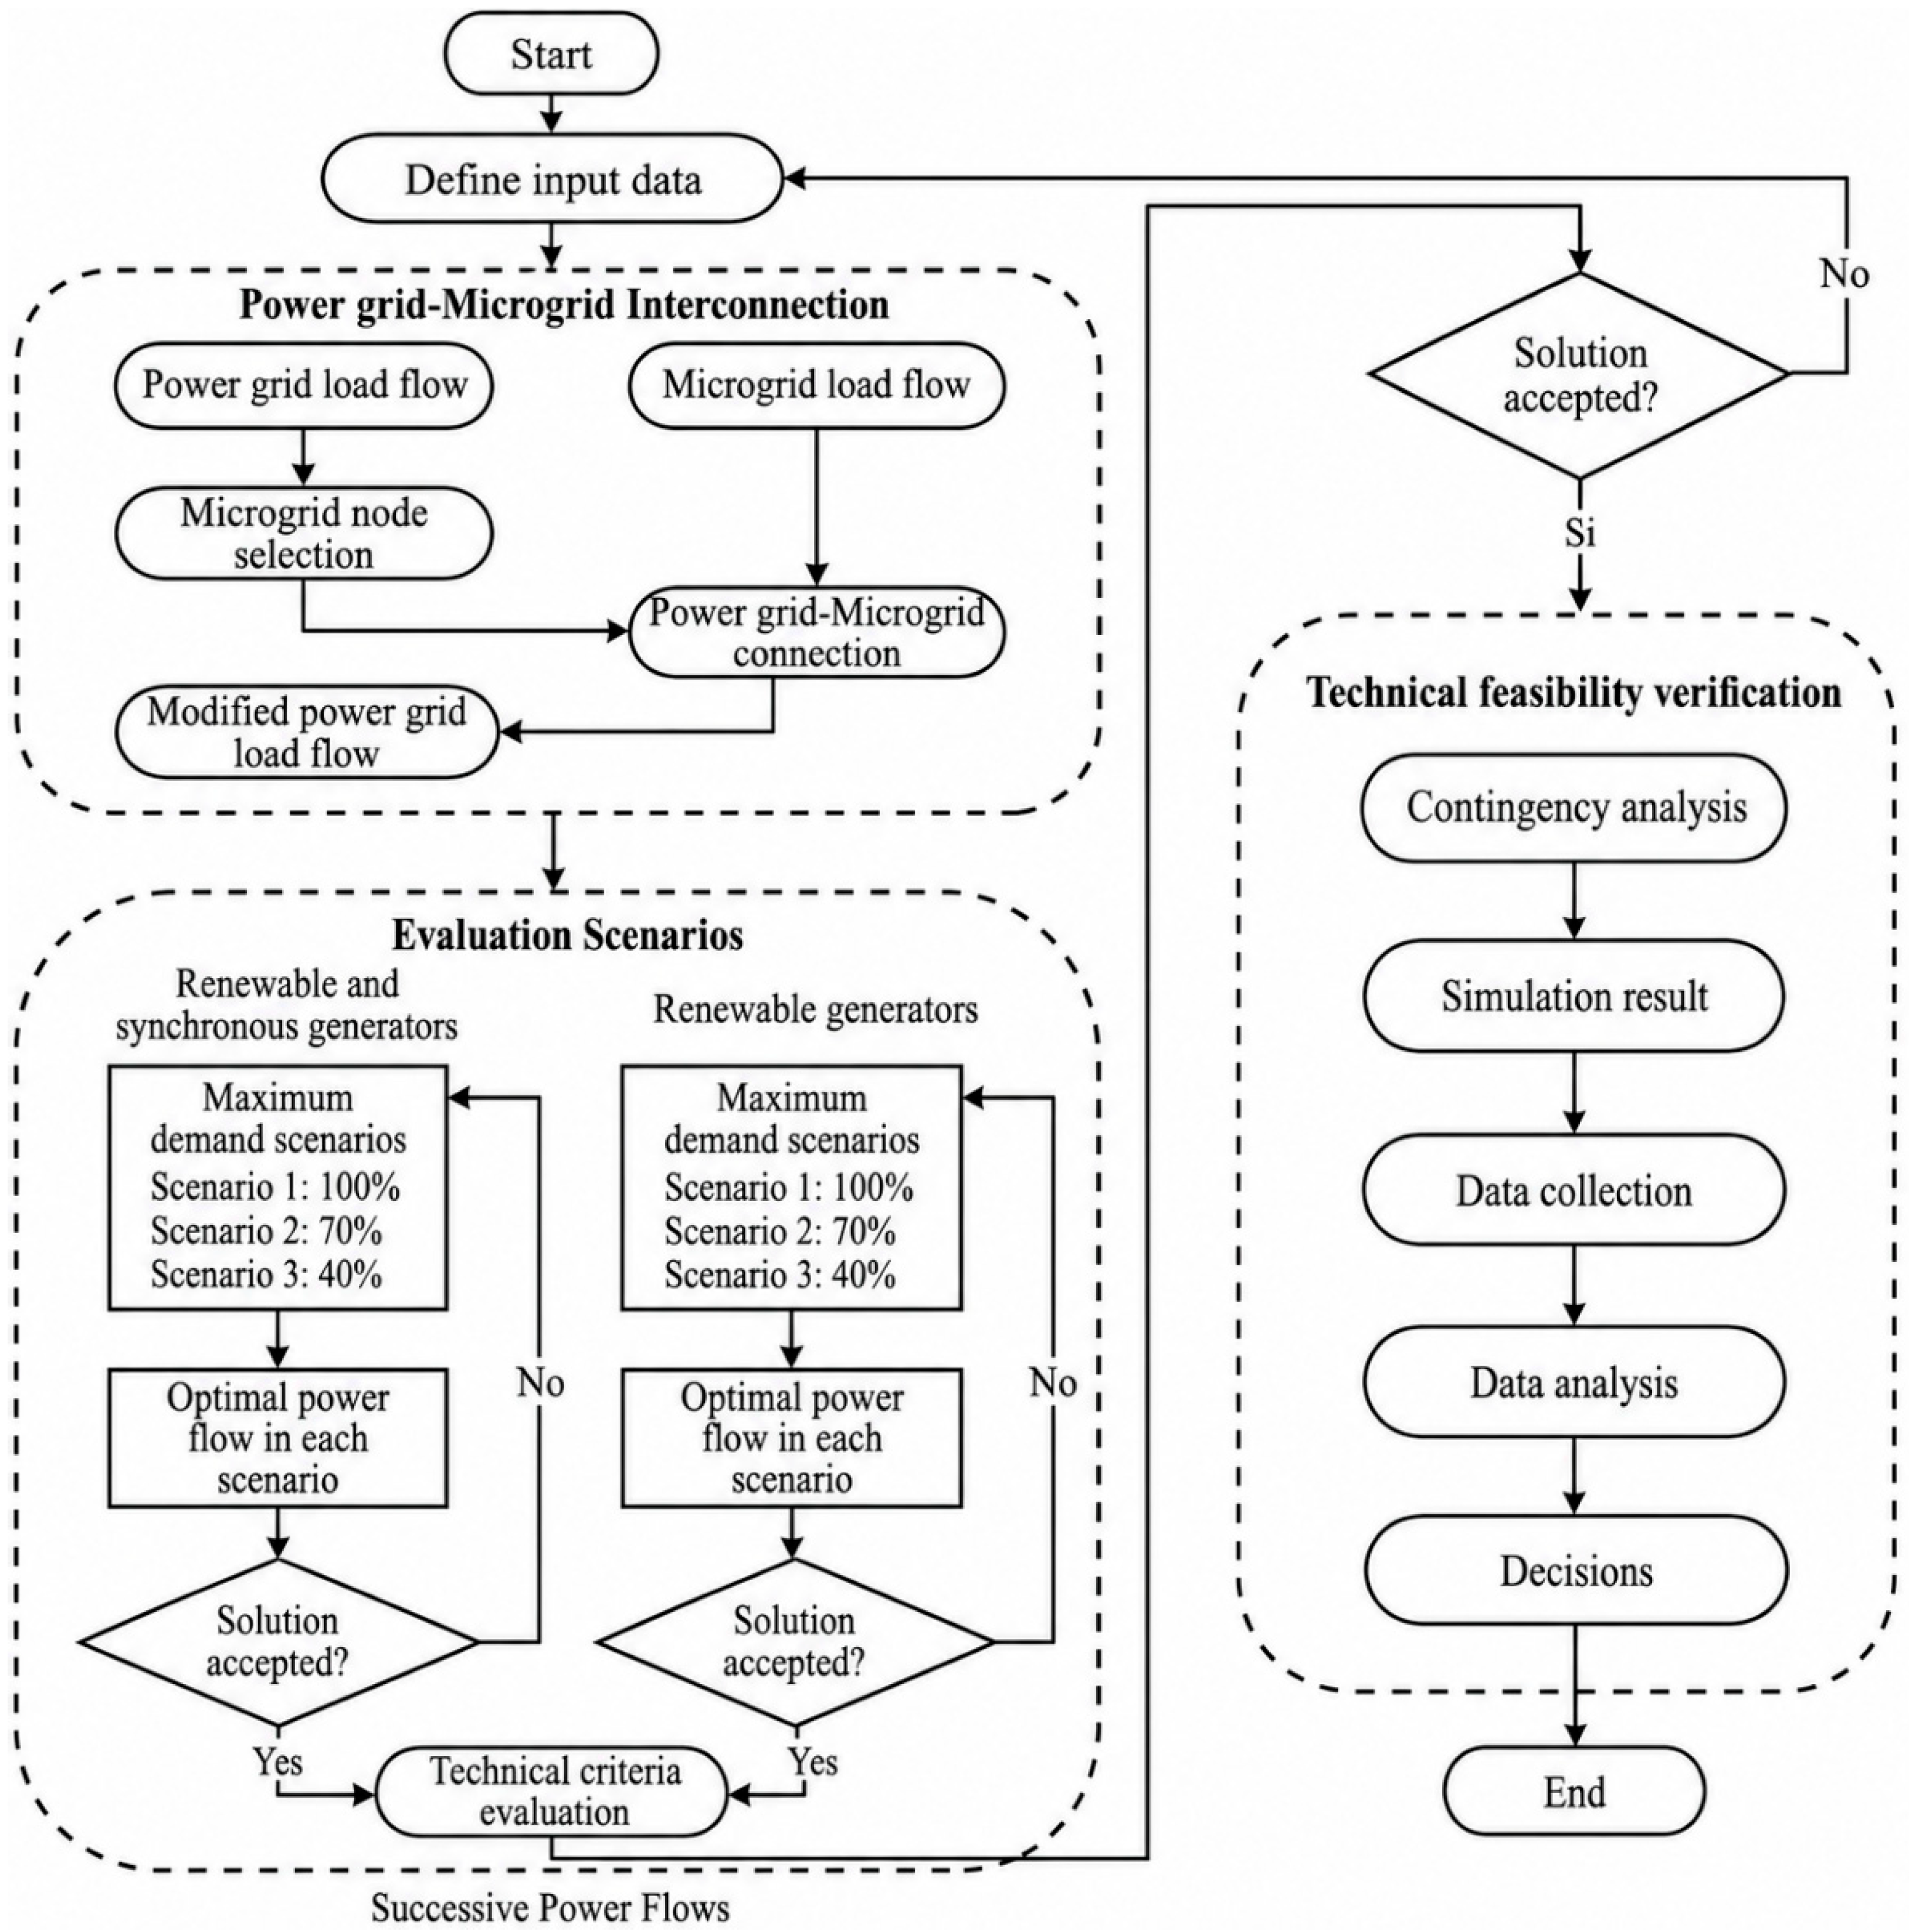
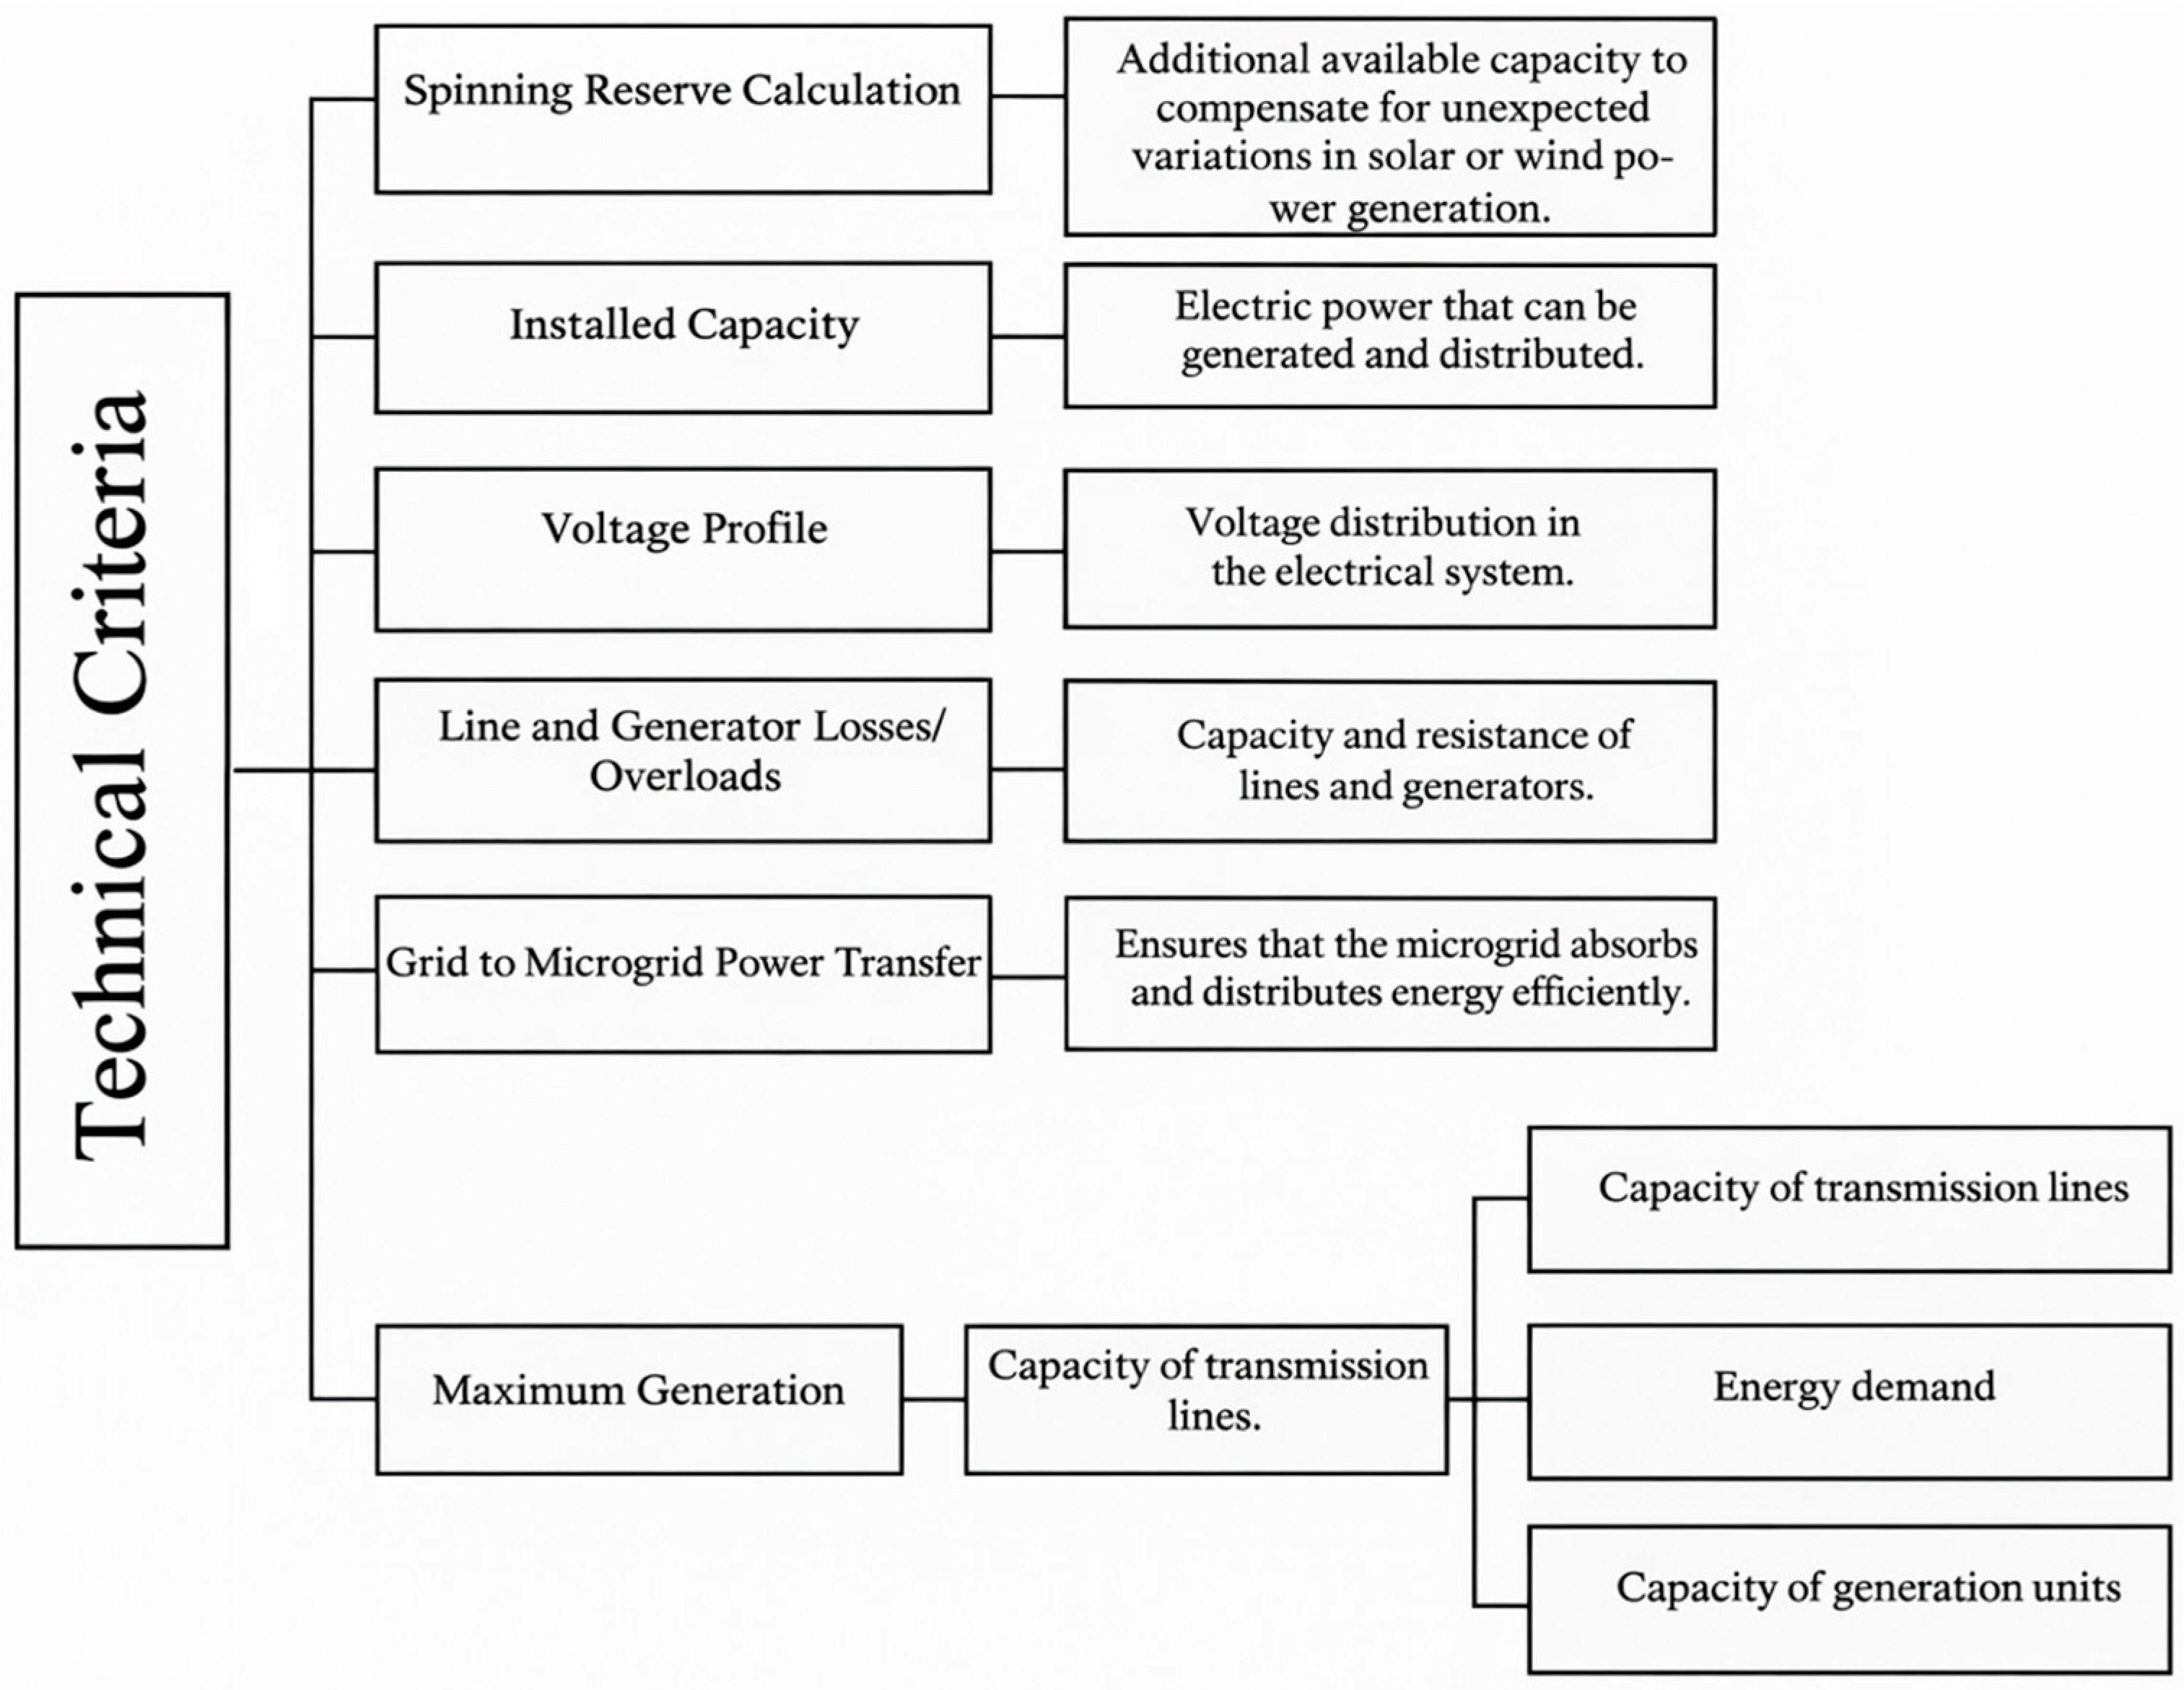
The power grid performance is evaluated based on the technical criteria presented in Figure 2.
Figure 2.
Evaluation Criteria for the Multi-Scenario OPF-Based Framework.
These criteria include:
- Calculation of spinning reserve, as additional capacity to compensate for variations in renewable generation;
- Installed capacity, associated with the energy that can be generated and distributed;
- Voltage profile, which allows for analysis of voltage distribution in the power grid;
- Line and generator losses and overloads, related to the capacity and resistance of the components;
- Energy transfer from the grid to the microgrid, ensuring efficient exchange;
- Maximum available generation, determined by the capacity of the generation units and the power grid demand.
The integration of these criteria enables a comprehensive evaluation of the power grid’s operation, especially in the presence of intermittent renewable sources.
In this context, spinning reserve is incorporated as a key element to mitigate the variability of solar and wind generation, ensuring power grid stability and continuity of electricity supply. This resource allows for compensating for deviations between generation and demand, helping to maintain operating conditions within established limits [31].
Spinning reserve is defined as the additional generation capacity available in the power grid that can be activated immediately to compensate for imbalances between generation and demand, particularly in the face of unexpected variations in renewable energy sources or operational contingencies [32].
2.4. Technical Feasibility Verification
The technical feasibility verification stage aims to verify that the multi-scenario OPF-based economic dispatch framework meets the technical, operational, and economic performance criteria defined for the simulated scenarios. In this study, this stage corresponds to a post-optimization verification process within the simulation environment. This stage is activated only when the solution obtained through optimal power flow is preliminarily accepted.
The acceptability of the solutions obtained through optimal power flow was verified based on the following criteria: (i) voltages within ±5%, (ii) line and generator load capacity below 100%, (iii) balance between generation and demand, (iv) technically acceptable losses, and (v) existence of sufficient spinning reserve. If the solution is not accepted in the previous stage, the algorithm returns to the optimal power flow calculation and scenario evaluation phases, adjusting variables such as generation allocation, operational constraints, and load conditions. This iterative process continues until a solution that meets the defined technical criteria is obtained, at which point the validation stage is enabled.
Once the solution is accepted, the technical feasibility verification process unfolds sequentially through five substages: contingency analysis, simulation results, data collection, data analysis, and decision-making.
First, a contingency analysis is performed to evaluate the power grid’s response to operational disturbances, including variations in renewable generation, changes in demand, or failures of network elements. This analysis identifies critical operating conditions, assesses the framework’s technical response under adverse scenarios, and verifies that the power grid remains stable and secure.
Next, the simulation results stage is executed, in which the electrical and operational variables of the power grid are obtained from the integrated power grid (microgrid–power grid) load flow using simulation tools such as DIgSILENT PowerFactory. These results allow for verification of compliance with technical constraints, including voltage levels, power flows, losses, and the operating limits of the power grid elements.
Subsequently, data collection is conducted to consolidate the results for each evaluation scenario. This information includes variables such as nodal voltages, line currents, power grid losses, power transfer, installed capacity, and operating reserve, and forms the basis for subsequent analysis.
In the next phase, data analysis is performed to evaluate power grid performance using verification indicators. In this context, the percentage of nodes with voltage problems [33] and the load percentage of the most heavily loaded network segment is used to quantify compliance with the power grid’s technical constraints [34]. The combined analysis of these indicators enables the identification of voltage regulation and overload issues, providing a comprehensive evaluation of the power grid’s operational status.
Finally, the decision-making stage is carried out, in which the solution’s final acceptability is determined. If the indicators meet the established limits and the technical, operational, and economic constraints are satisfied, the solution is considered technically feasible, and the process concludes.
The technical result reported in the operational decision was adopted from the combined evaluation of the physical quantities modeled and verified in the OPF-based assessment. These quantities include nodal voltage compliance within the admissible range of 0.95–1.05 p.u., element loadability below 100%, active and reactive power balance, power losses, available spinning reserve, and the sign and magnitude of the grid–microgrid power exchange. Thus, a configuration was classified as recommended when it satisfied voltage and loadability limits while presenting lower losses, higher reserve, and stable or favorable power exchange. In contrast, configurations with higher dependence on the main grid, lower operating margins, or import requirements were classified as conditional, backup-required, or requiring external coordination. Since the study is based on a modified IEEE 14-node test system and not on a real distribution feeder with regulatory customer categories, consumer reliability classes were not explicitly assigned; instead, reliability-related behavior was assessed indirectly through voltage compliance, loadability margins, reserve availability, and dependence on the main grid.
Otherwise, the algorithm follows an alternative path and returns to previous stages of the process, specifically to the formulation of the economic dispatch or the definition of scenarios. This return allows for adjusting model parameters, redefining operating conditions, or modifying generation allocation, establishing an iterative scheme of continuous improvement until a viable solution is reached.
It should be noted that this verification is based on simulation results and comparison with technical trends reported in the literature. Therefore, it does not replace validation against measured operating data from a real microgrid, which is considered a future extension of the study.
3. Results
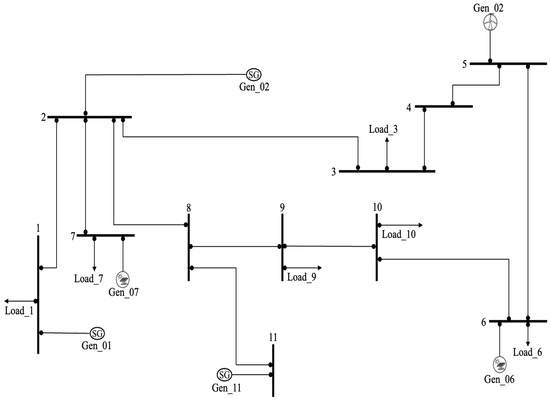
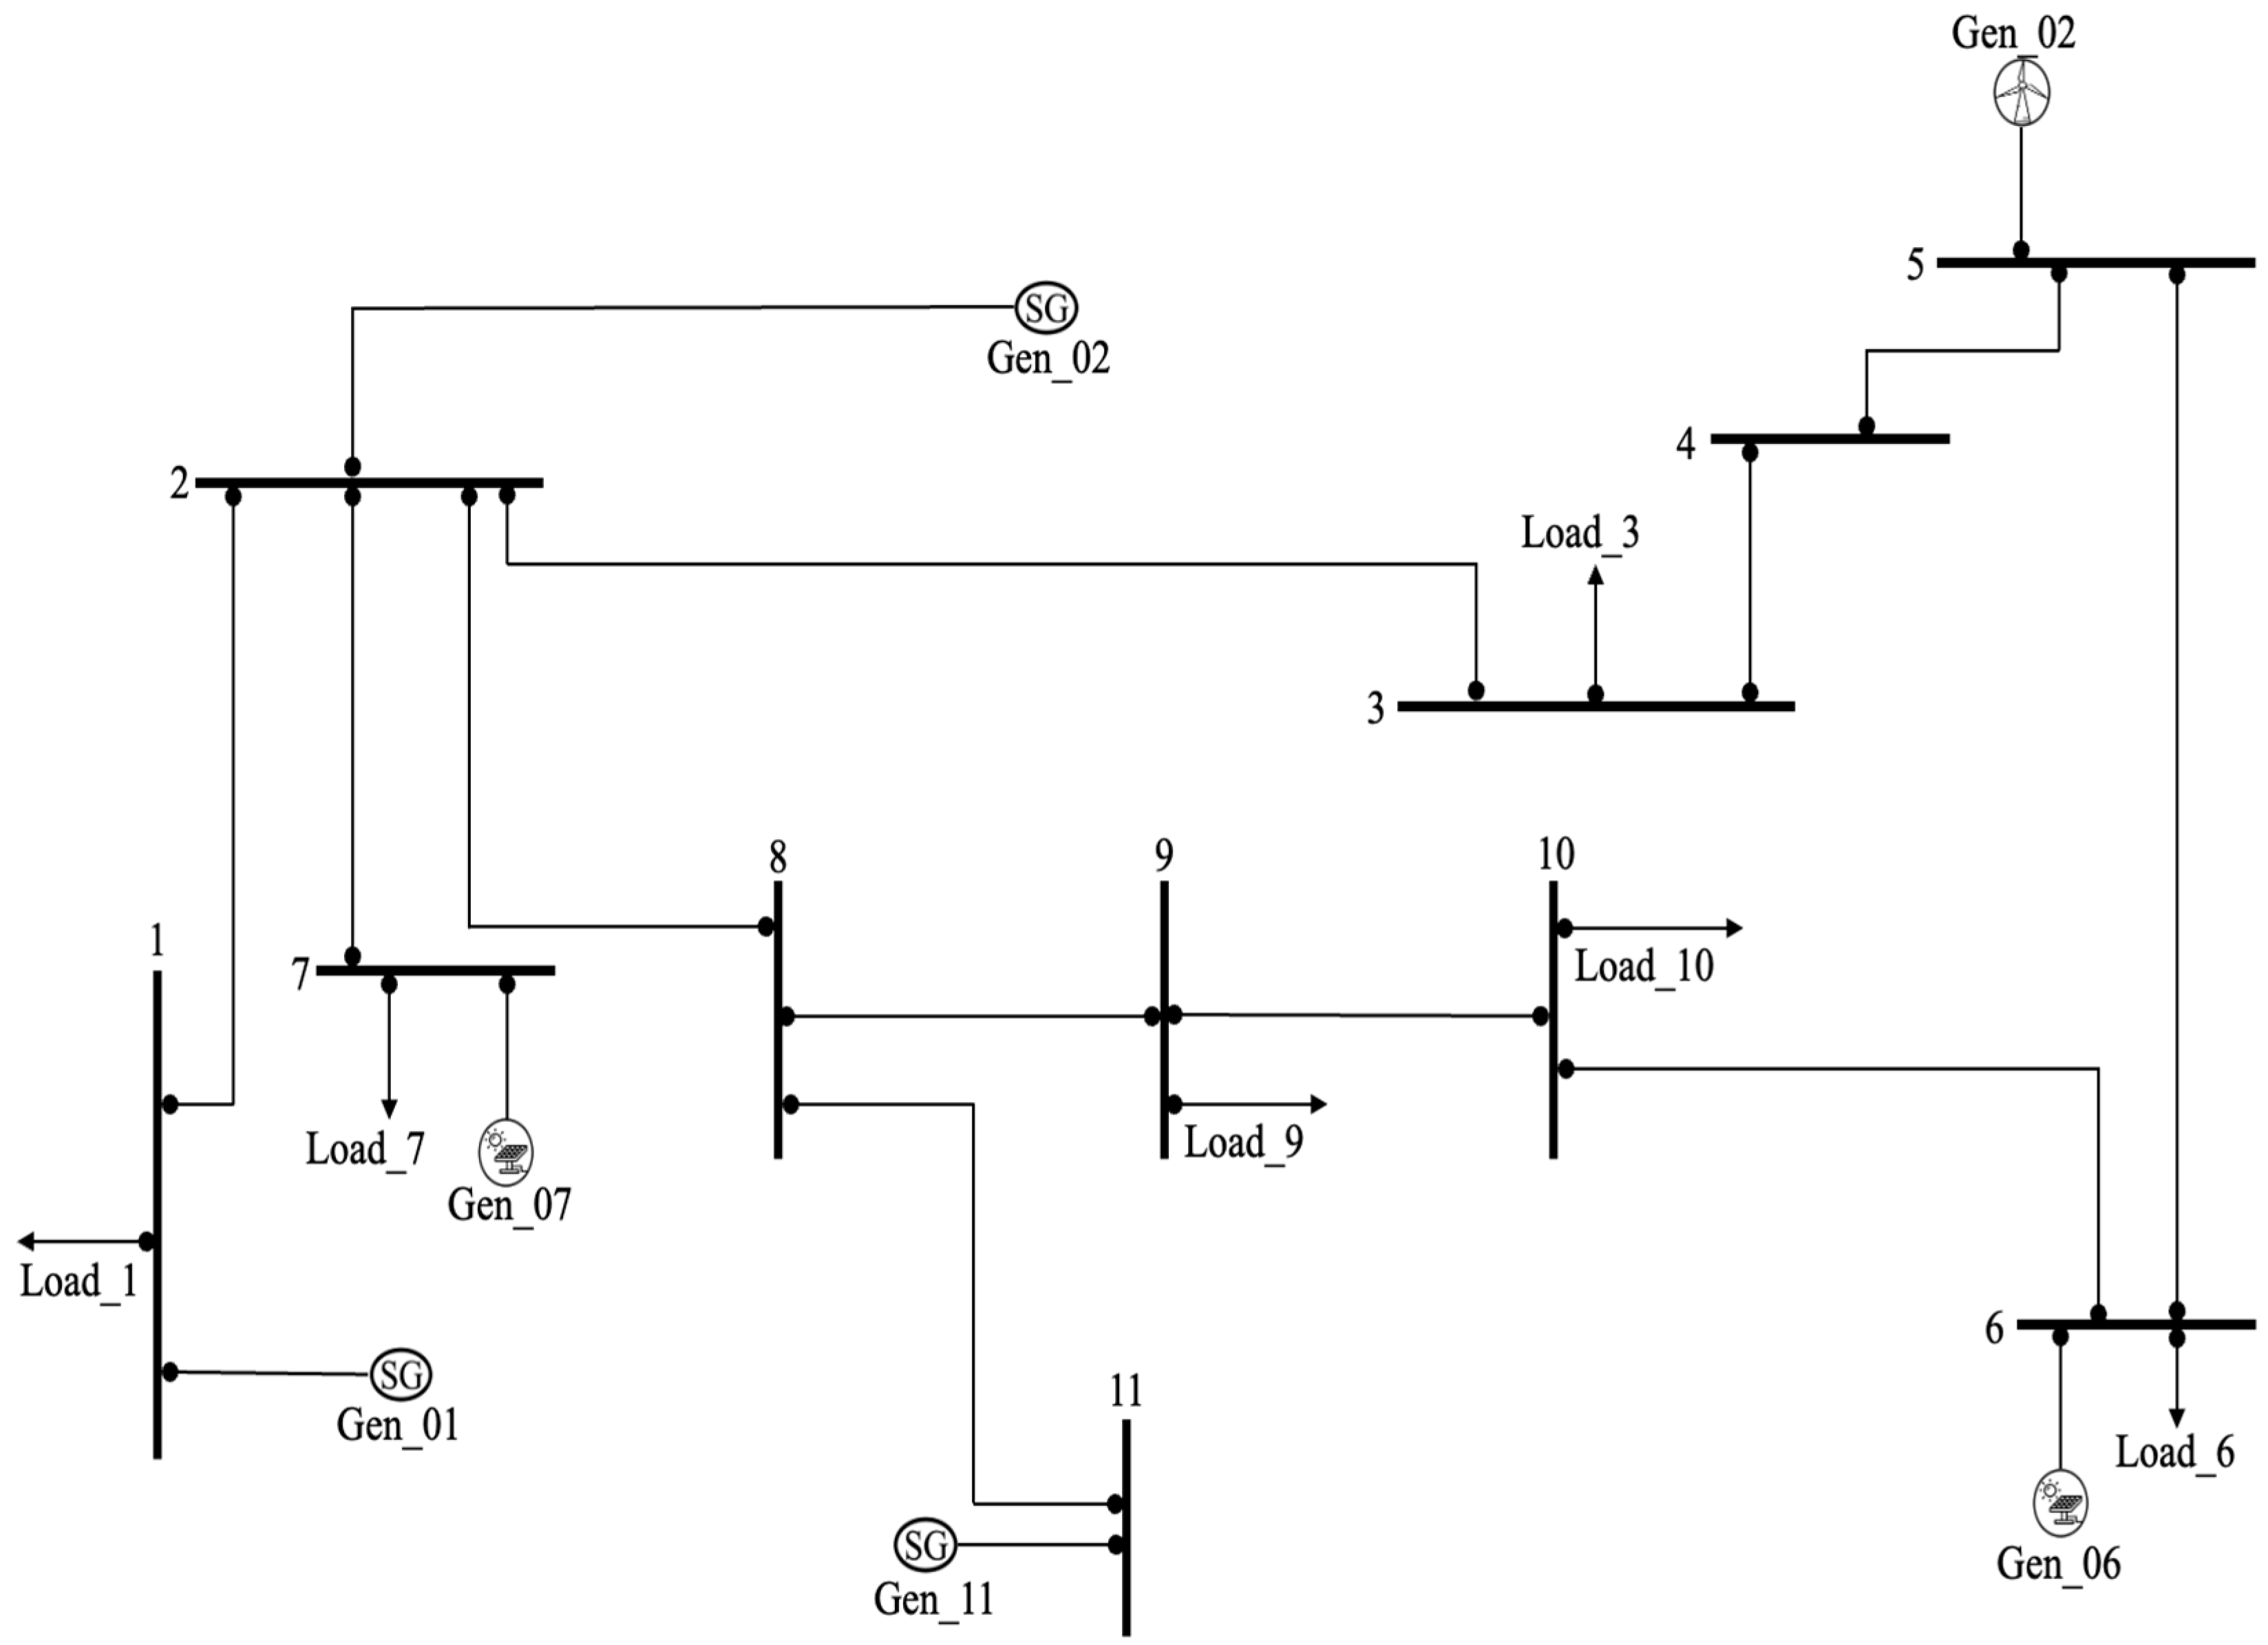
The multi-scenario OPF-based economic dispatch framework for microgrids interconnected with the power grid was evaluated on the modified 14-node IEEE test power grid, in which a microgrid was integrated by connecting it to several nodes. Figure 3 shows the configuration of the microgrid used in the study, comprising 11 nodes, 11 lines, and 6 loads, arranged in a radial structure.
Figure 3.
Microgrid power grid.
The microgrid operates with a nominal voltage of 33 kV at all nodes. Its configuration incorporates synchronous and renewable generation, enabling analysis of the interaction between firm and variable sources within deterministic, scenario-based economic dispatch.
Table 3 presents the nodal voltage values of the microgrid. The voltages remain between 0.99 and 1.00 p.u., indicating an adequate voltage profile with no significant deviations from the nominal value.
Table 3.
Voltage at the microgrid nodes.
Table 4 summarizes the operating characteristics of the microgrid lines. Load capacities range from 1.31% to 8.92%, indicating no congestion and sufficient power transfer capacity. Line 08–09 exhibits the highest relative load capacity, without exceeding operational limits.
Table 4.
Microgrid Line Characteristics.
Table 5 presents the load characteristics. Demand is heterogeneously distributed; node 1 has the highest consumption. Power factors range from 0.71 to 0.95, which determine power-flow conditions and the grid’s reactive power requirements.
Table 5.
Load Characteristics.
Table 6 summarizes the technical parameters of the microgrid generators and their connection nodes. Synchronous generation is located at nodes 1, 2, and 11, while renewable generation is located at nodes 5, 6, and 7. This distribution enables evaluation of the differentiated contributions of firm and variable generation to the operation of the power grid.
Table 6.
Parameters and location of the microgrid generators.
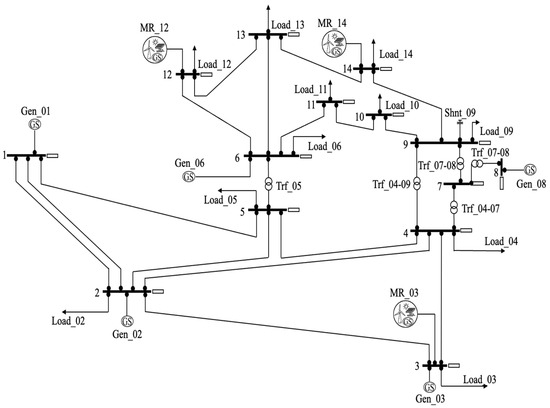
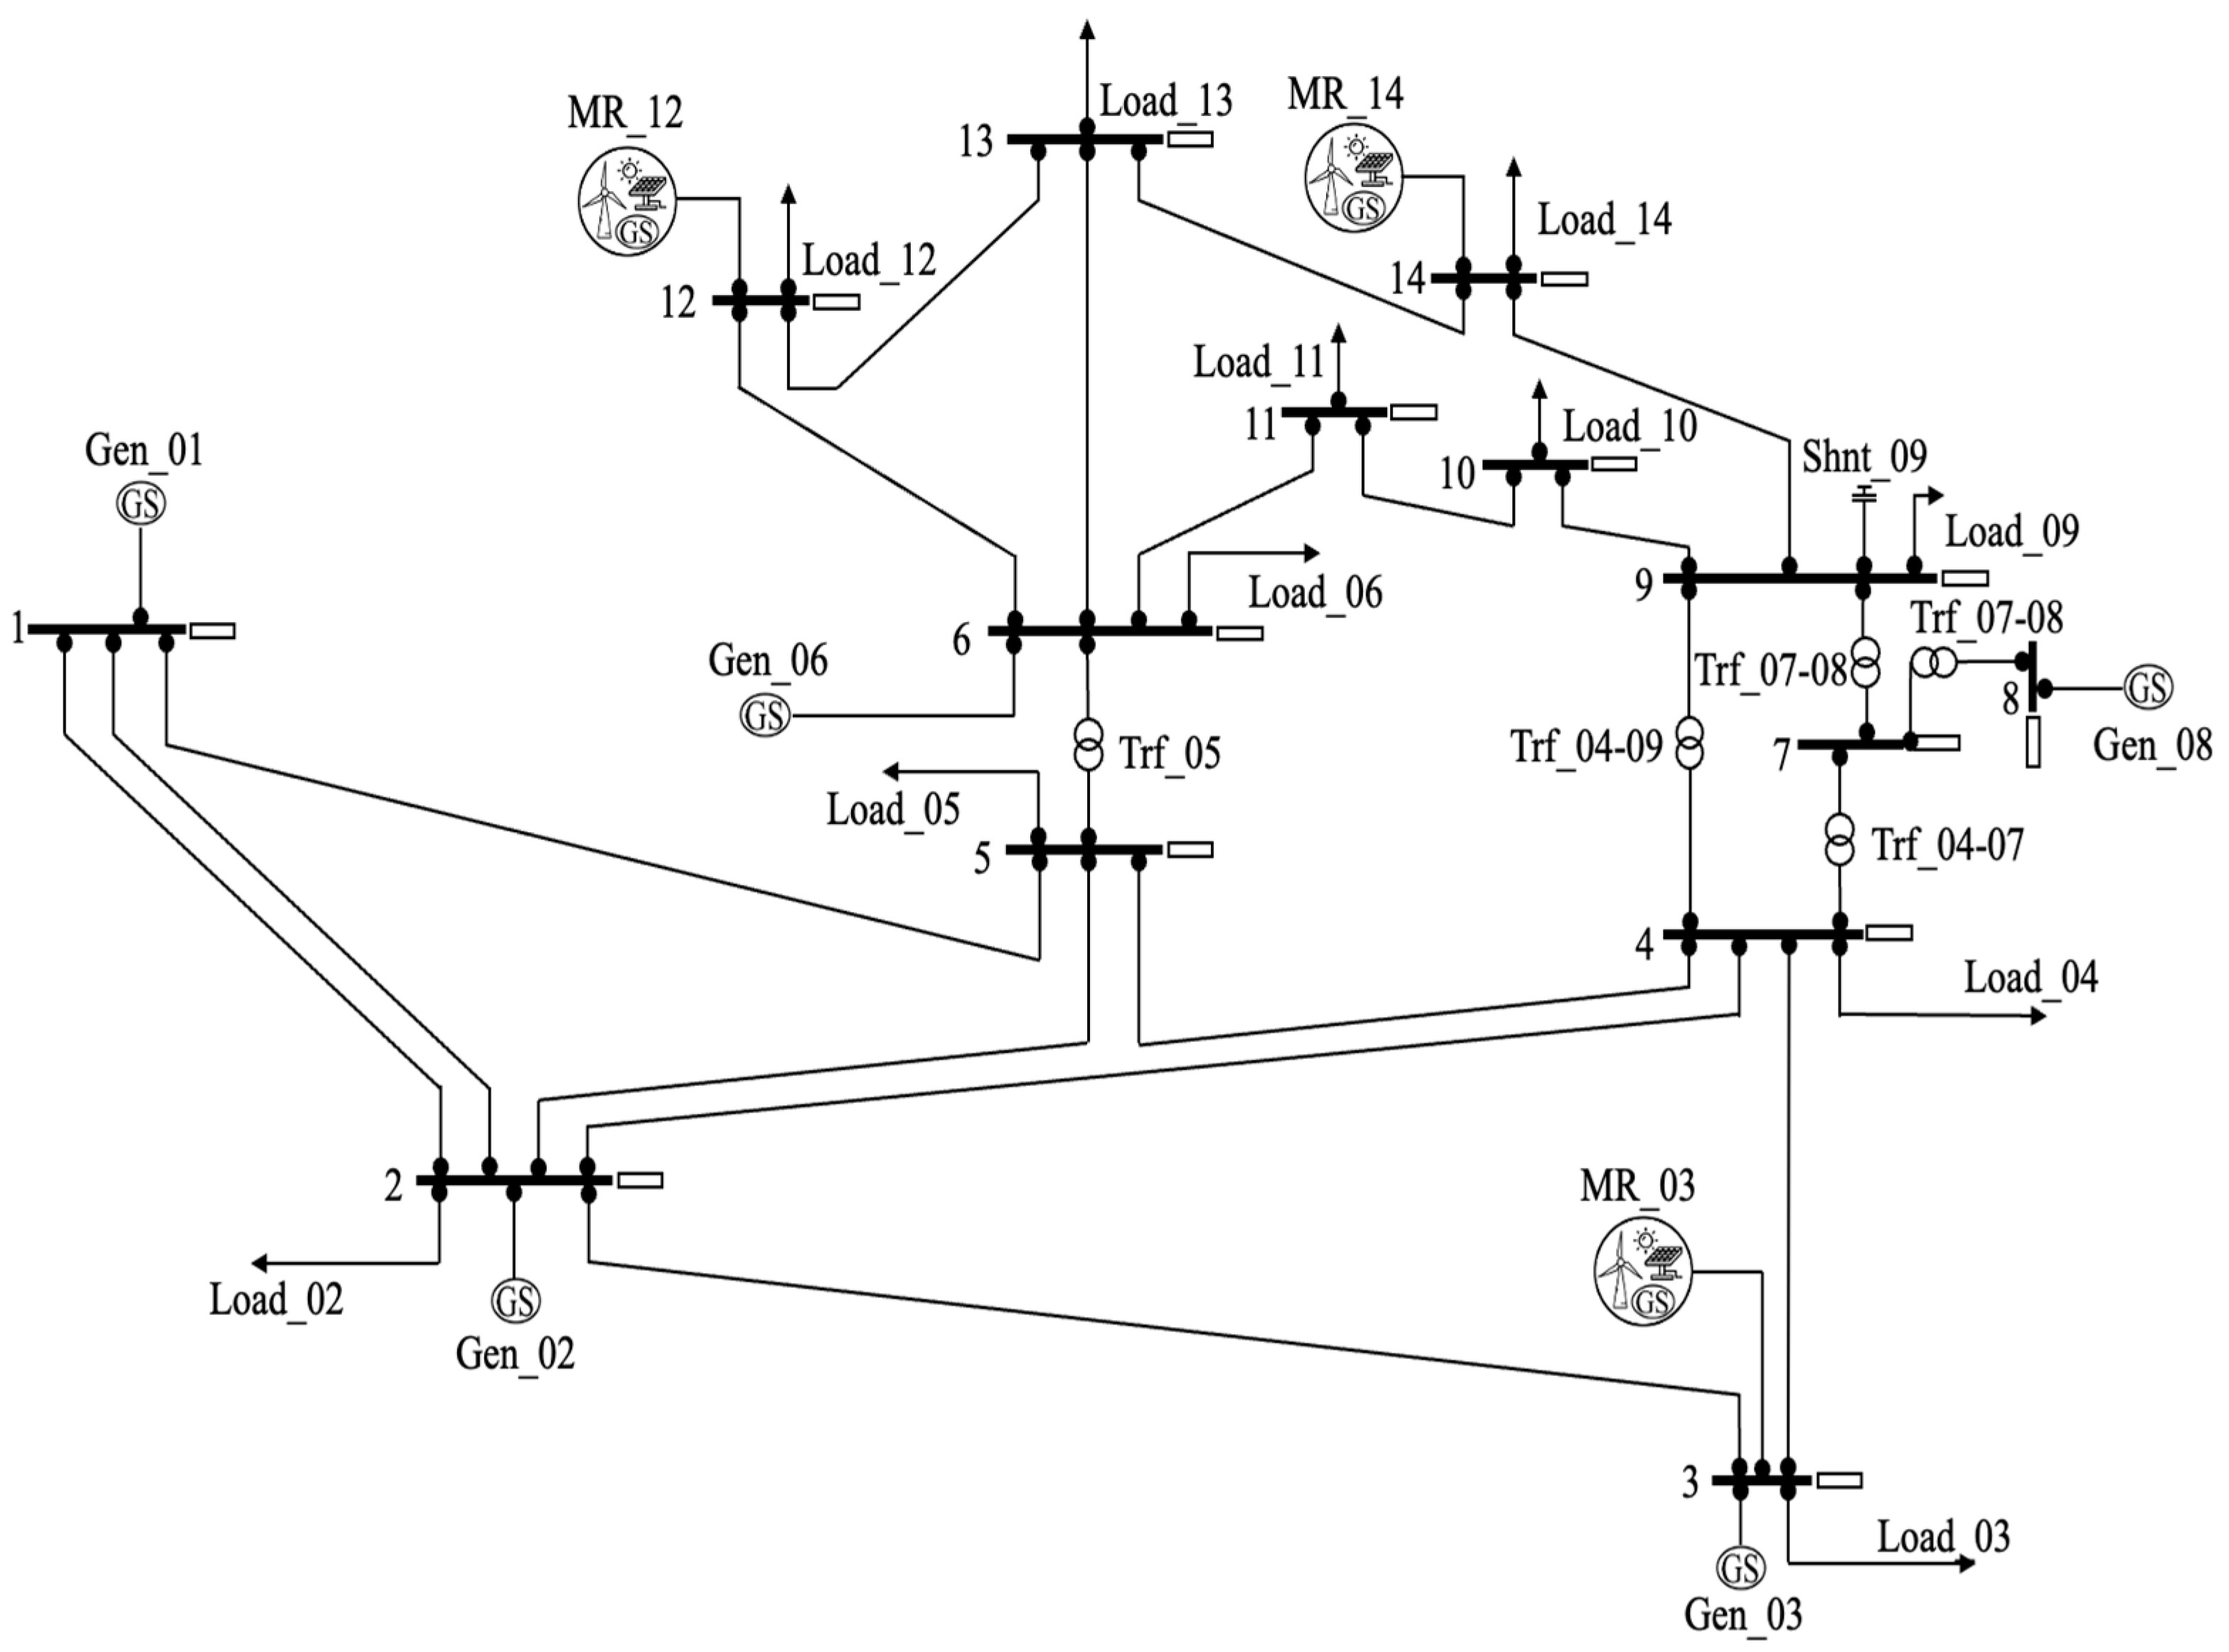
Figure 4 shows the single-line diagram of the 14-node IEEE power grid used as the main network.
Figure 4.
IEEE 14-node single-line diagram.
The IEEE 14-node power grid consists of 14 nodes, 16 lines, 11 loads, 5 generators, and 5 transformers [35]. It is modeled using per-unit values at 60 Hz and a base power of 100 MVA, enabling normalization of electrical variables and facilitating comparison between operating scenarios.
To evaluate the OPF-based economic dispatch framework, the microgrid was connected to nodes 3, 12, and 14, which were selected for their lowest short-circuit power levels, i.e., lower electrical rigidity. Table 7 summarizes these values.
Table 7.
Microgrid connection nodes in the IEEE 14 power grid.
Nodes 12 and 14 exhibit the lowest voltage withstand capacity, followed by node 3. Therefore, interconnection at these points allows for a more sensitive evaluation of the microgrid’s impact on voltage stability, power flows, and OPF-based dispatch performance under demanding conditions.
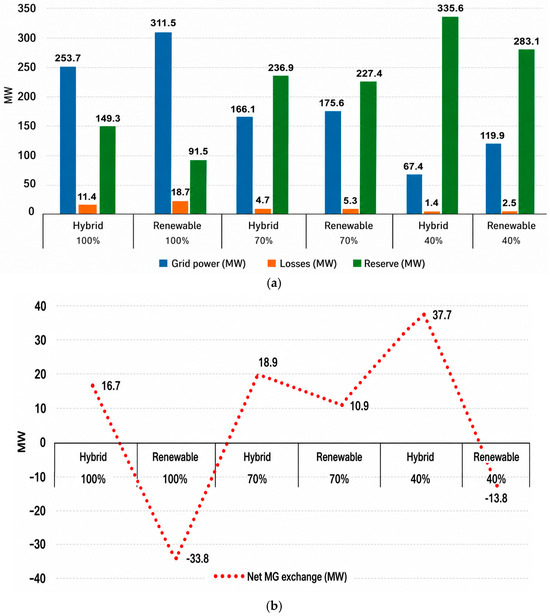
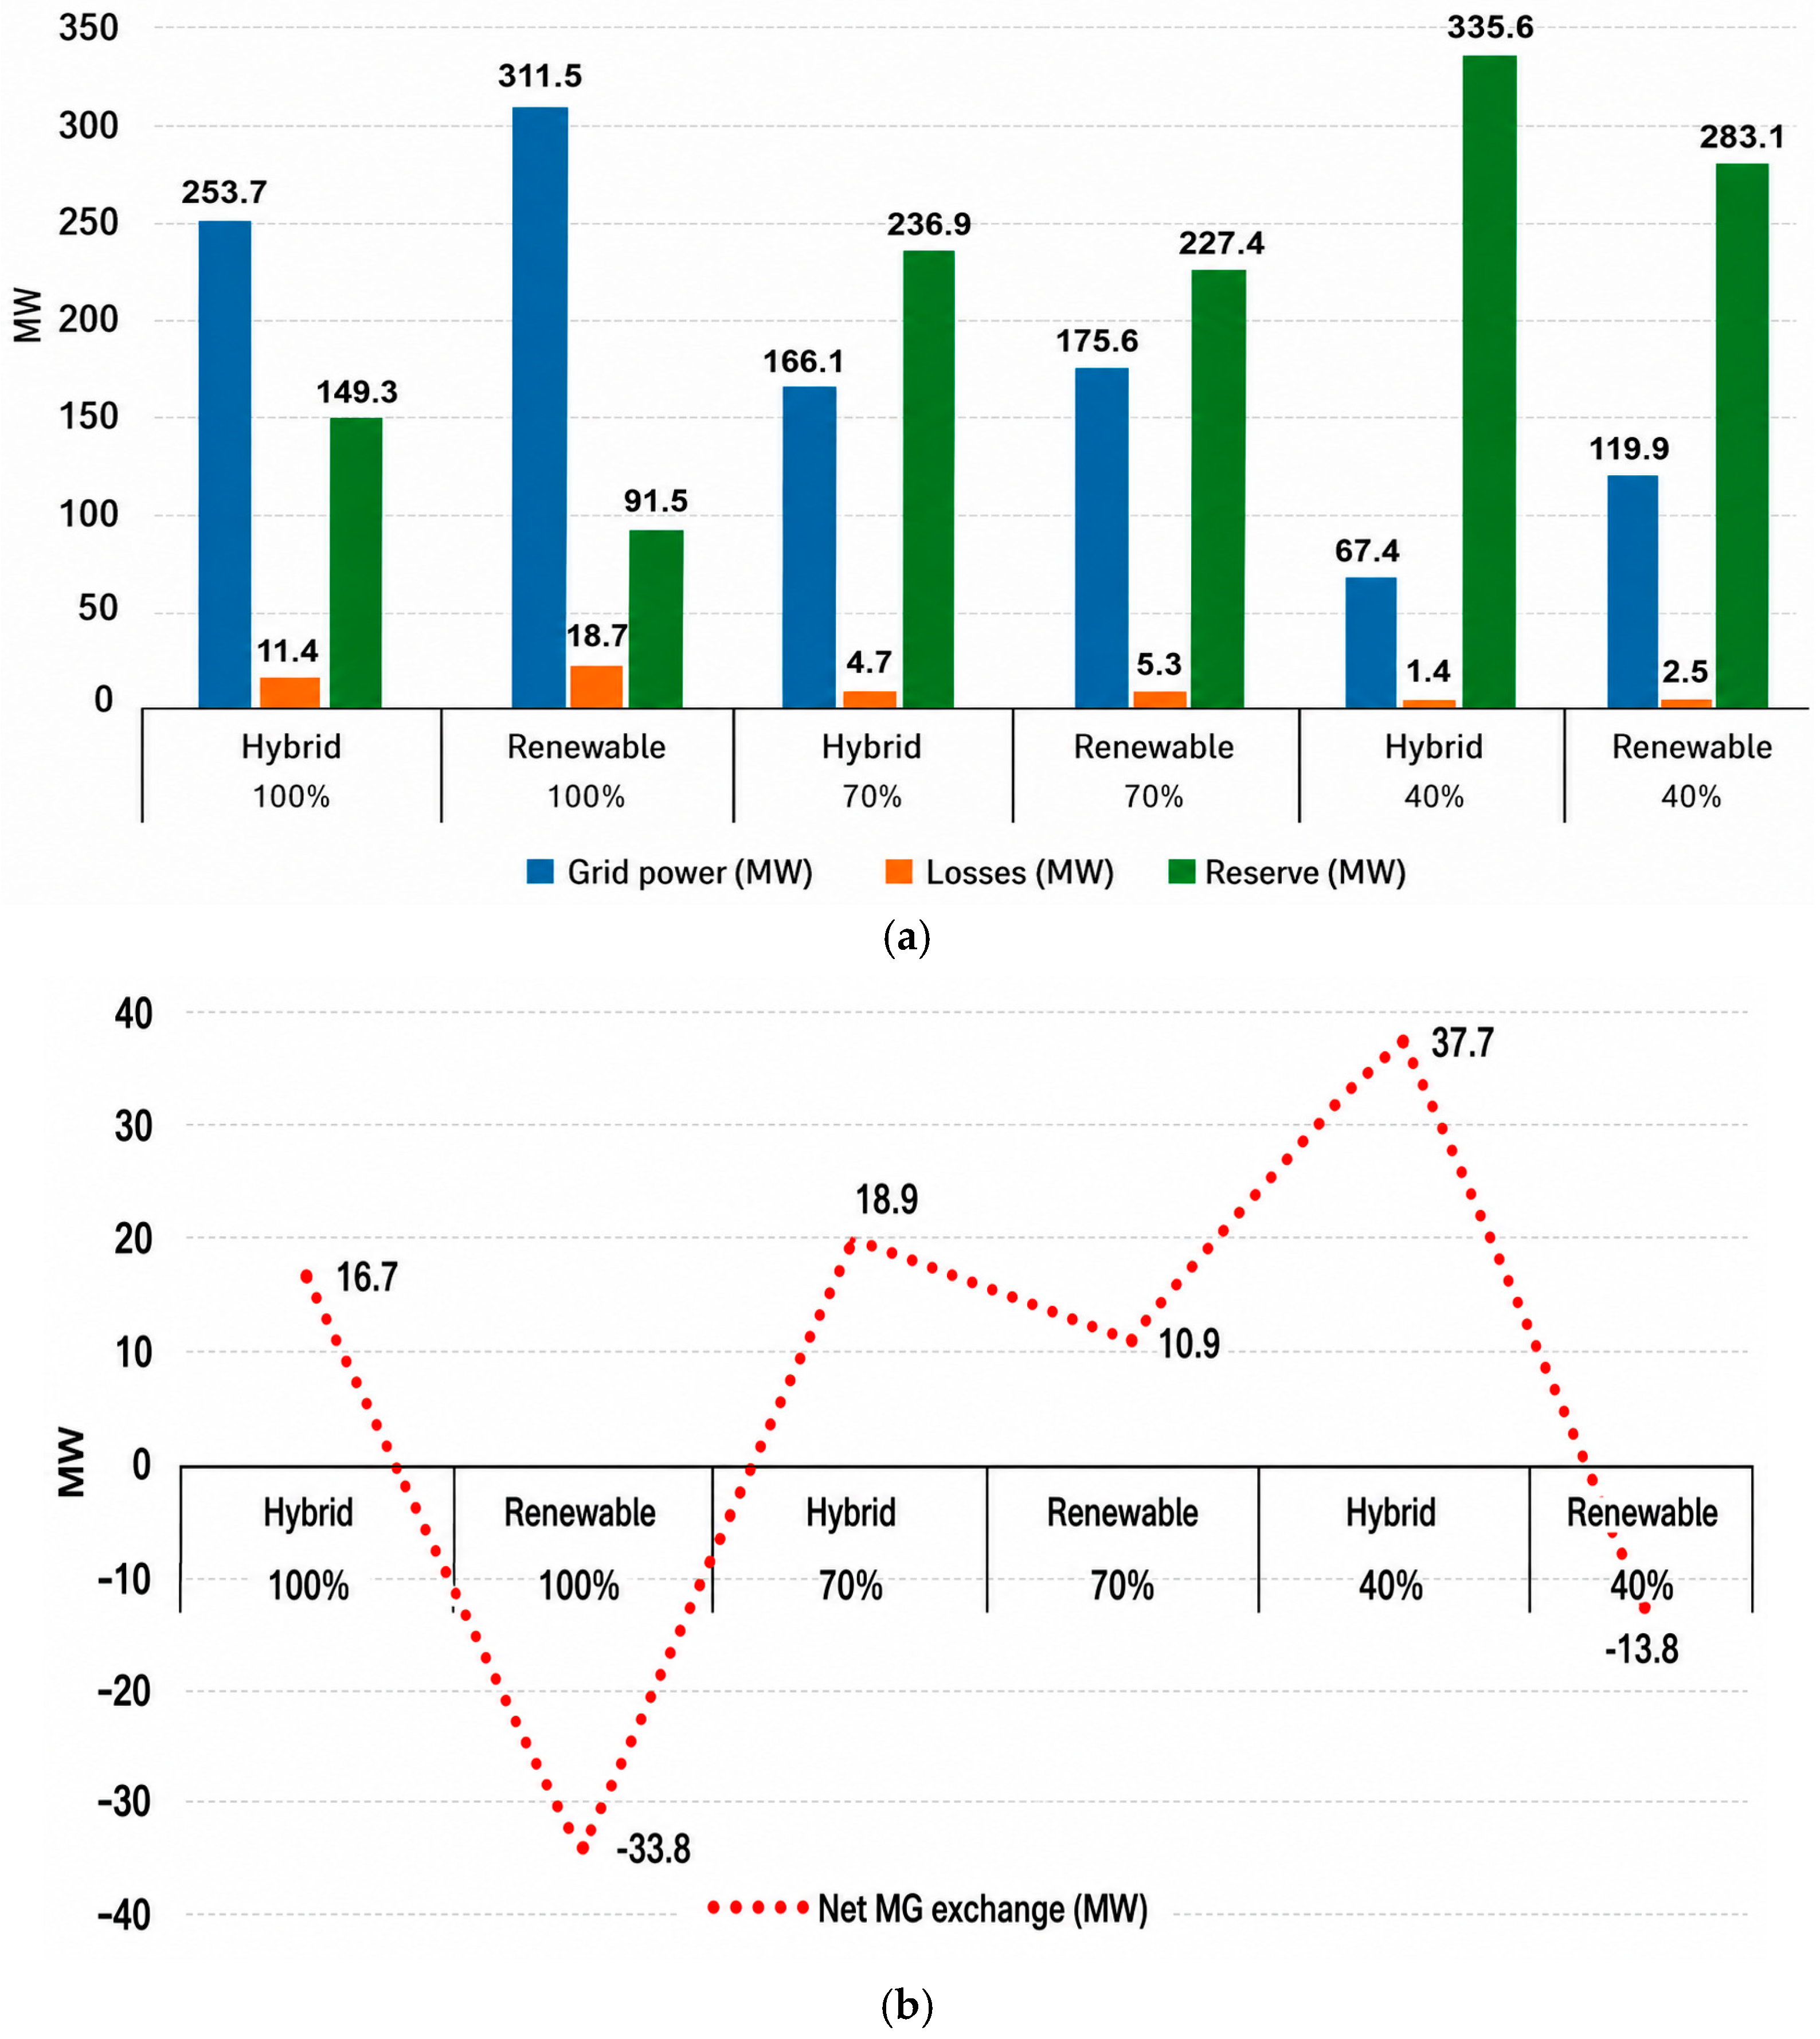
Figure 5 presents the overall power grid indicators for the three load scenarios considered and the two operating configurations evaluated: hybrid and exclusively renewable. In the net exchange of the microgrids, a positive sign indicates exports to the power grid, and a negative sign indicates imports from it.
Figure 5.
Global power grid indicators: (a) grid power, losses, and spinning reserve; and (b) power transferred at grid connection points.
Figure 5 shows that the hybrid configuration achieves better technical performance than the renewable-only configuration across the three evaluated load levels. This behavior is mainly associated with the presence of synchronous generation, which provides firm power and contributes to operating reserve. At high load, losses are reduced by 7.3 MW compared to the renewable-only configuration, while spinning reserve increases by 57.8 MW. Similarly, net exchange changes from imports of 33.8 MW to an export of 16.7 MW, representing a net difference of 50.5 MW.
At medium load, the difference between the configurations is smaller, although the hybrid configuration still presents lower losses and higher reserve. In this case, losses decrease by 0.6 MW, and reserve increases by 9.6 MW. Both configurations allow power export to the grid; however, the hybrid configuration provides a higher export level.
Under low load, the hybrid configuration also presents lower losses and higher reserve than the renewable-only configuration. It exports 37.7 MW, while the renewable-only configuration requires an import of 13.8 MW. This result confirms that the availability of synchronous generation improves the operational autonomy of the microgrids under the evaluated deterministic scenarios.
Therefore, Figure 5 should be interpreted as a comparative assessment of how the imposed generation mix affects grid power, losses, spinning reserve, and net microgrid exchange. The contribution of the OPF-based framework lies not in the isolated production of these improvements, but in the integrated quantification and technical verification of their operational effects under common constraints and load conditions.
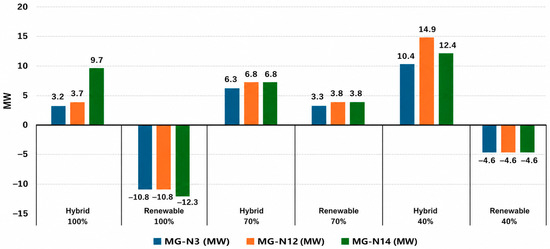
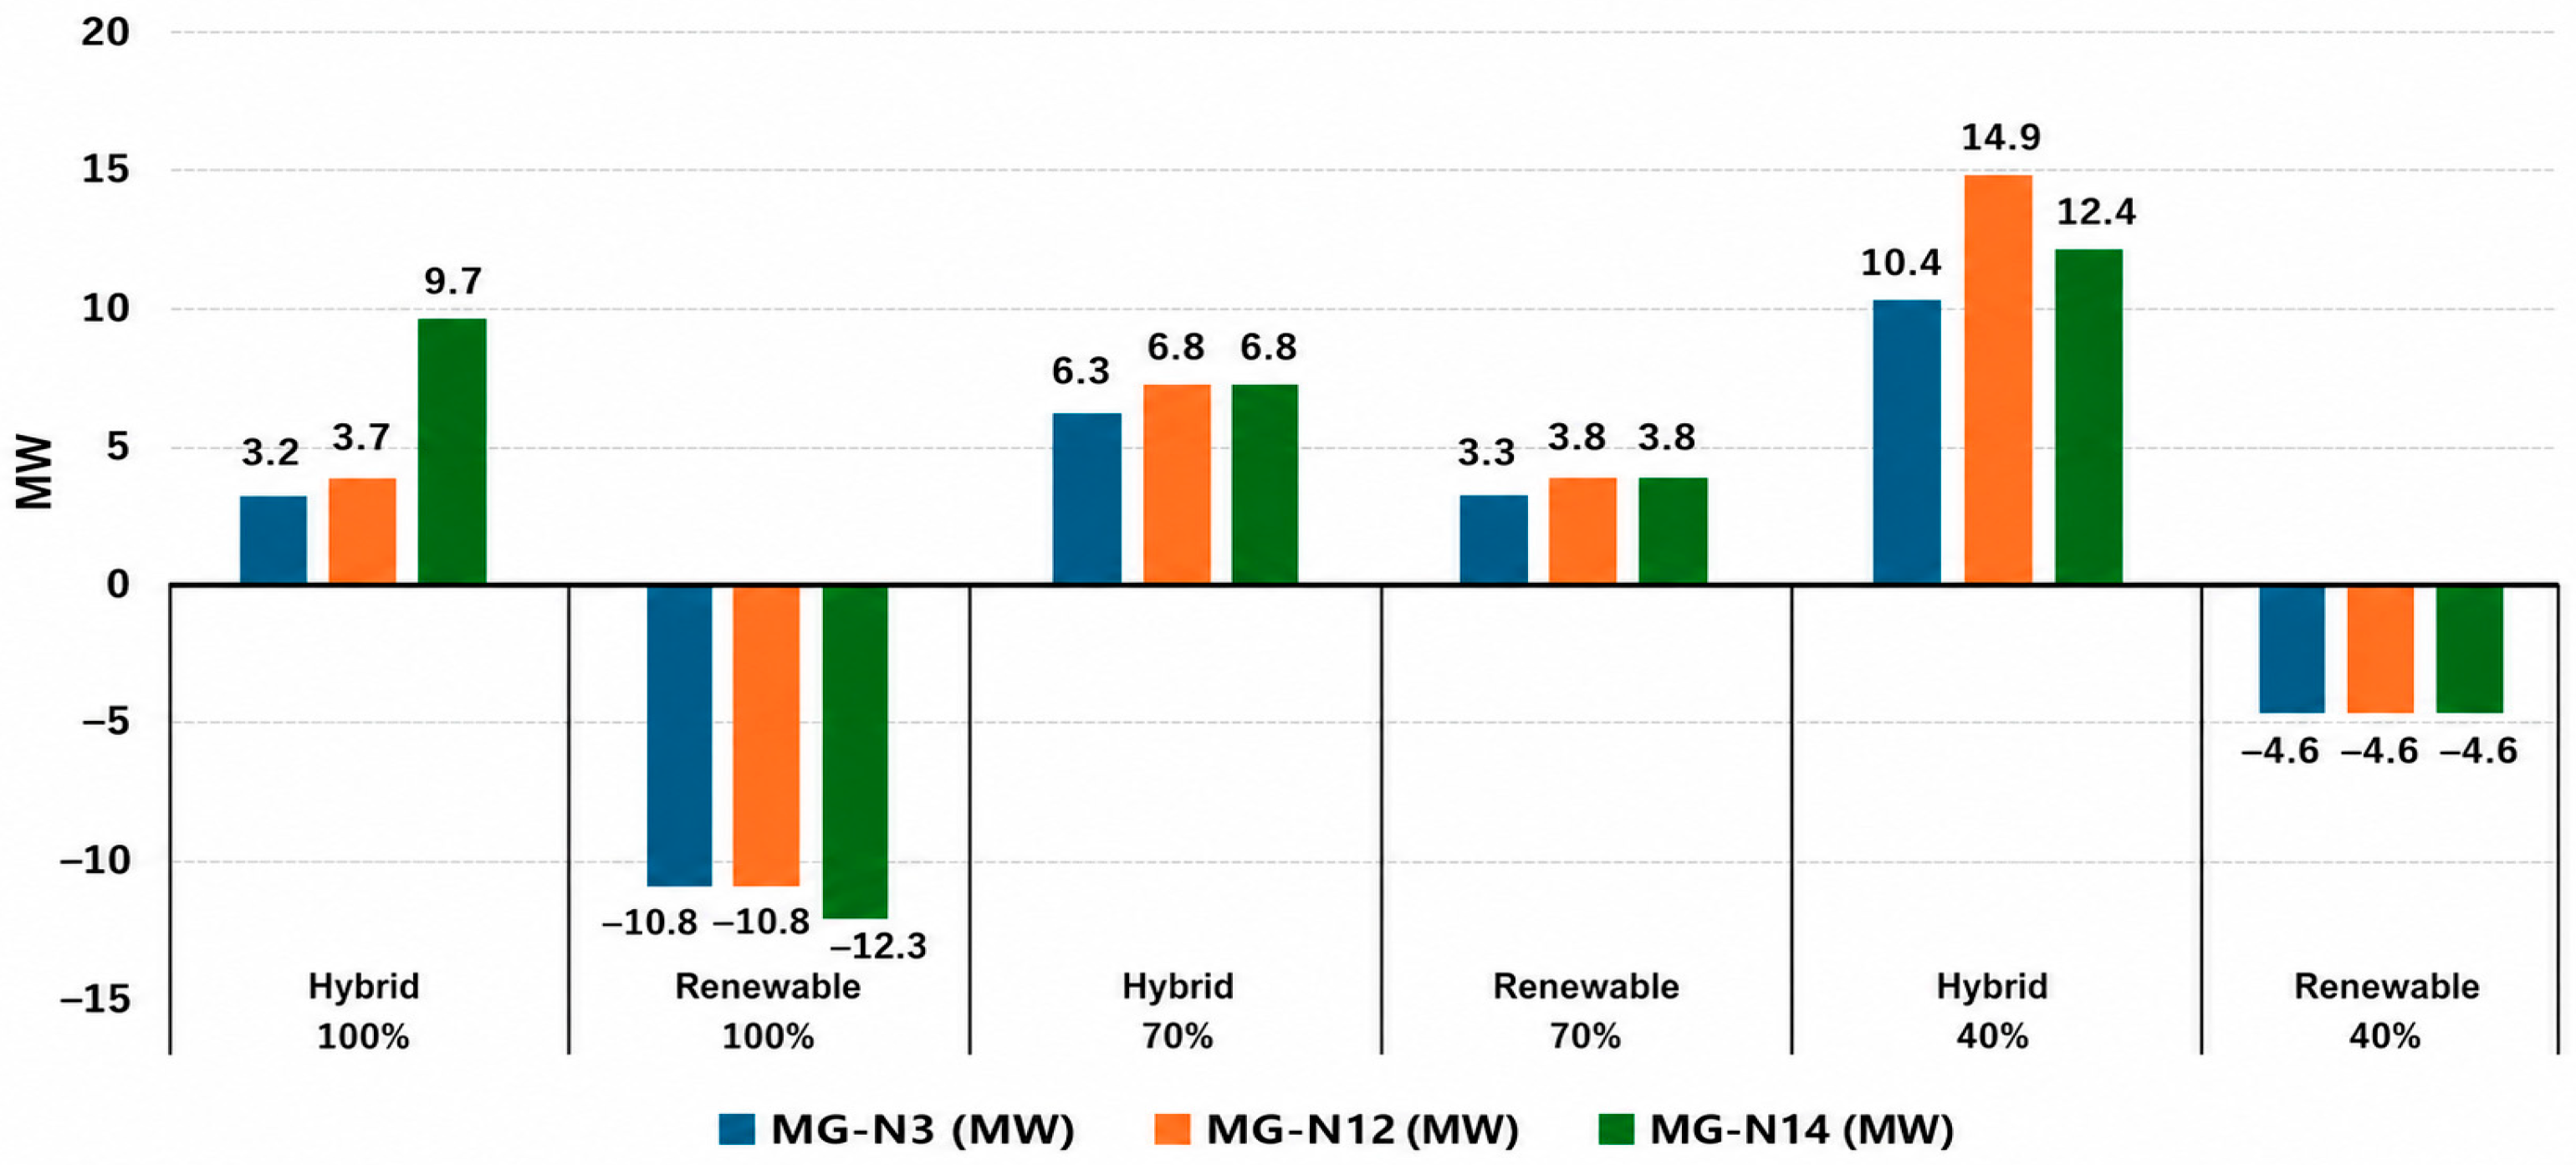
Figure 6 shows the power exchange between each microgrid and the power grid. Positive values represent power exports to the grid, while negative values indicate power imports.
Figure 6.
Microgrid-grid power exchange.
Figure 6 shows that, under high load, the microgrids in hybrid configuration export 3.2 MW, 3.7 MW, and 9.7 MW, respectively. In contrast, under the renewable configuration, they import between 10.8 MW and 12.3 MW each. Under medium load, all three microgrids export power in both configurations, although the hybrid configuration increases the individual contribution by approximately 2.5 MW per node. Under low load, the hybrid configuration shows the highest contributions, between 10.4 MW and 14.9 MW, while in the renewable configuration, the three microgrids import 4.6 MW each, indicating a loss of self-sufficiency.
These results show that the microgrid does not operate as a passive load, but as an active agent whose export or import status depends on the load level and the technological composition of its resources.
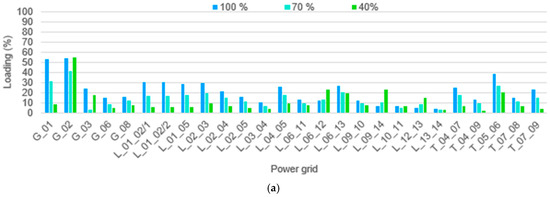
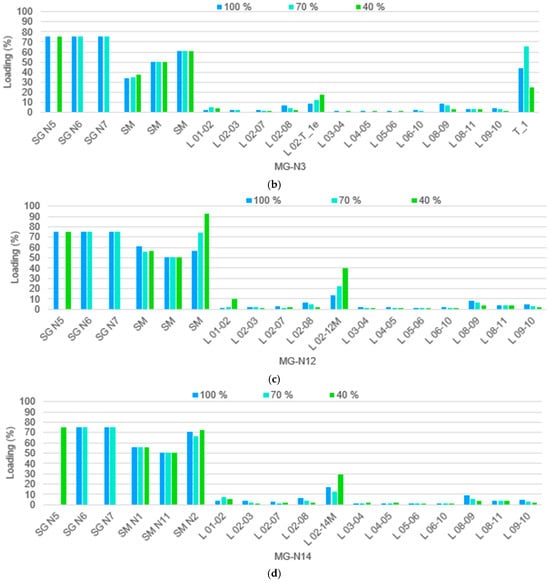
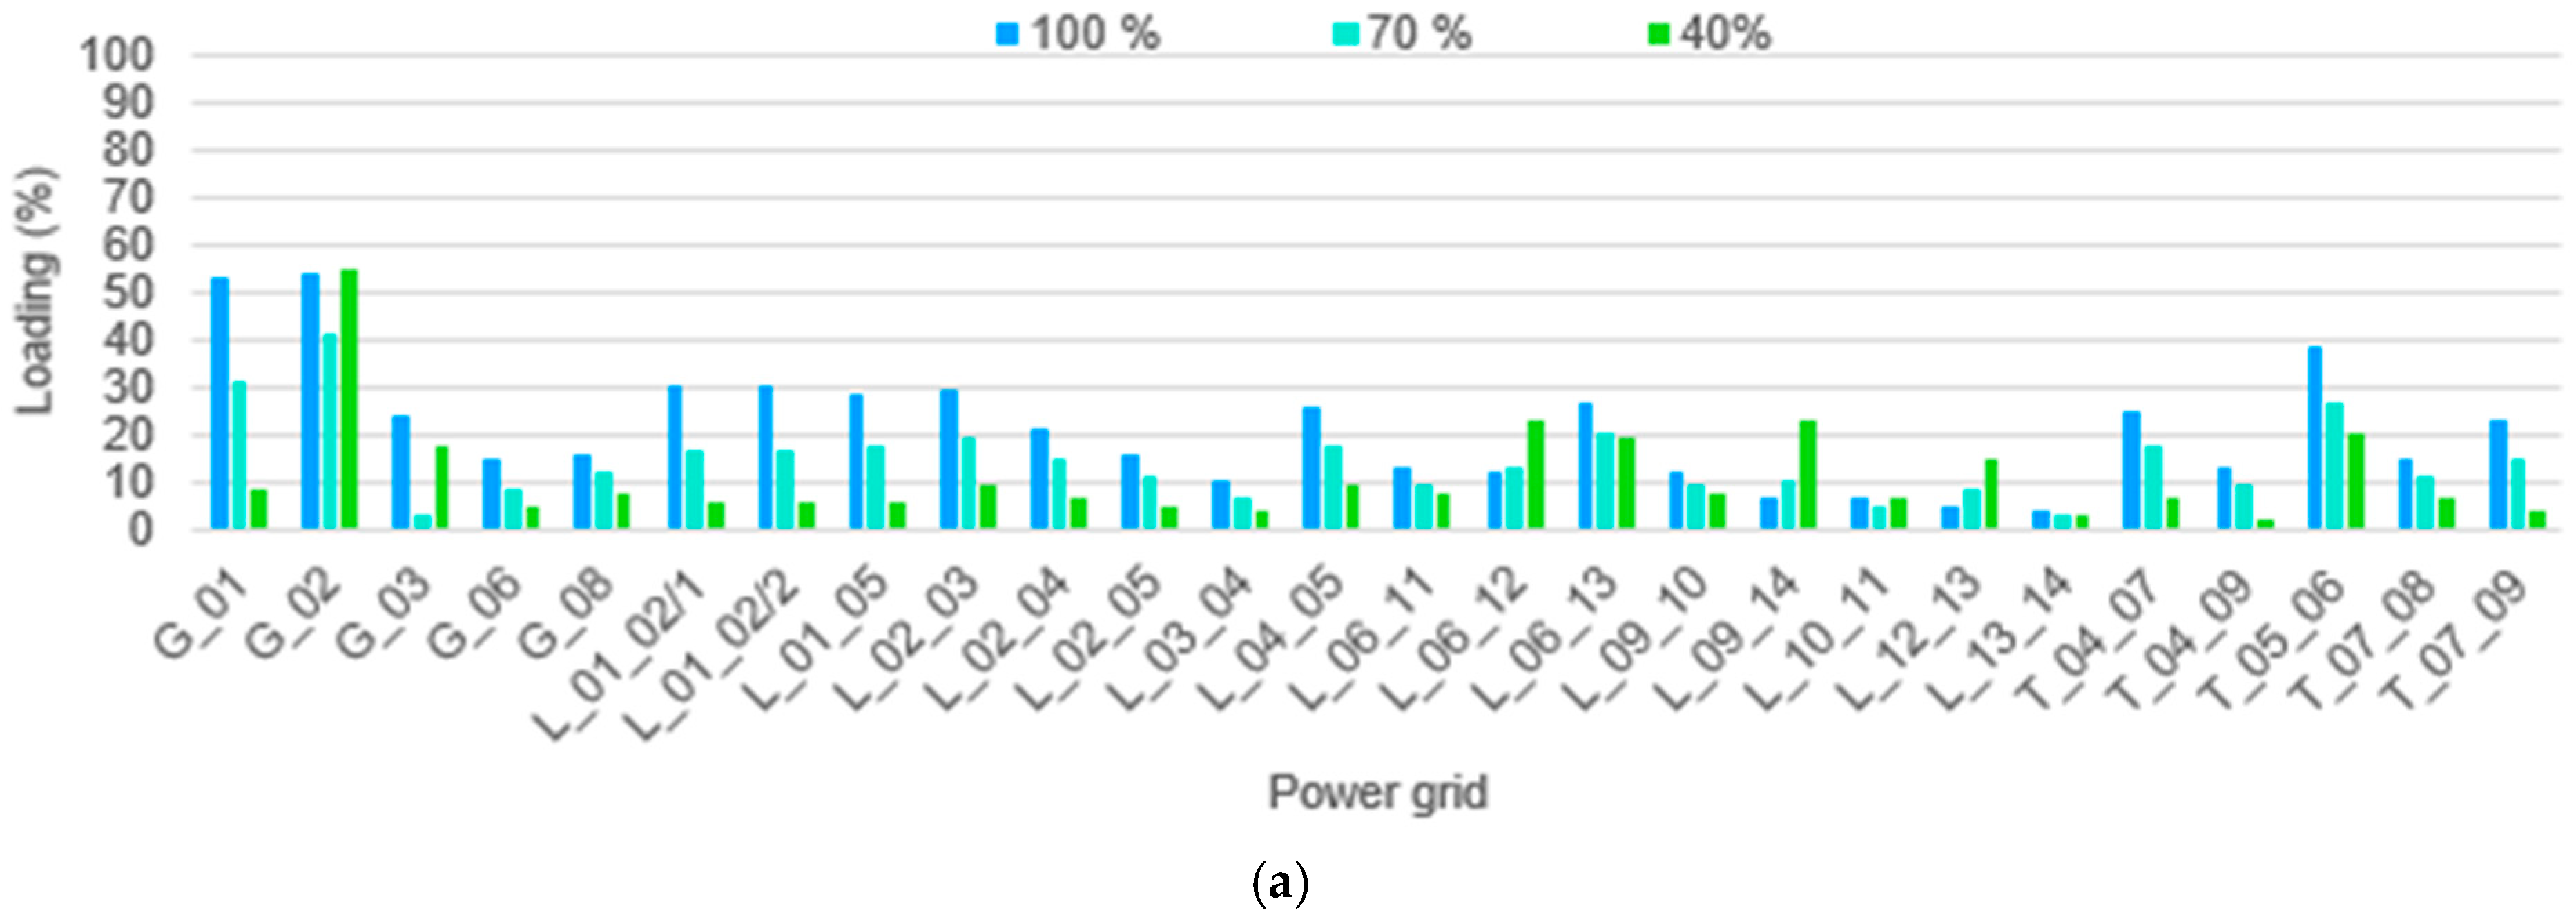
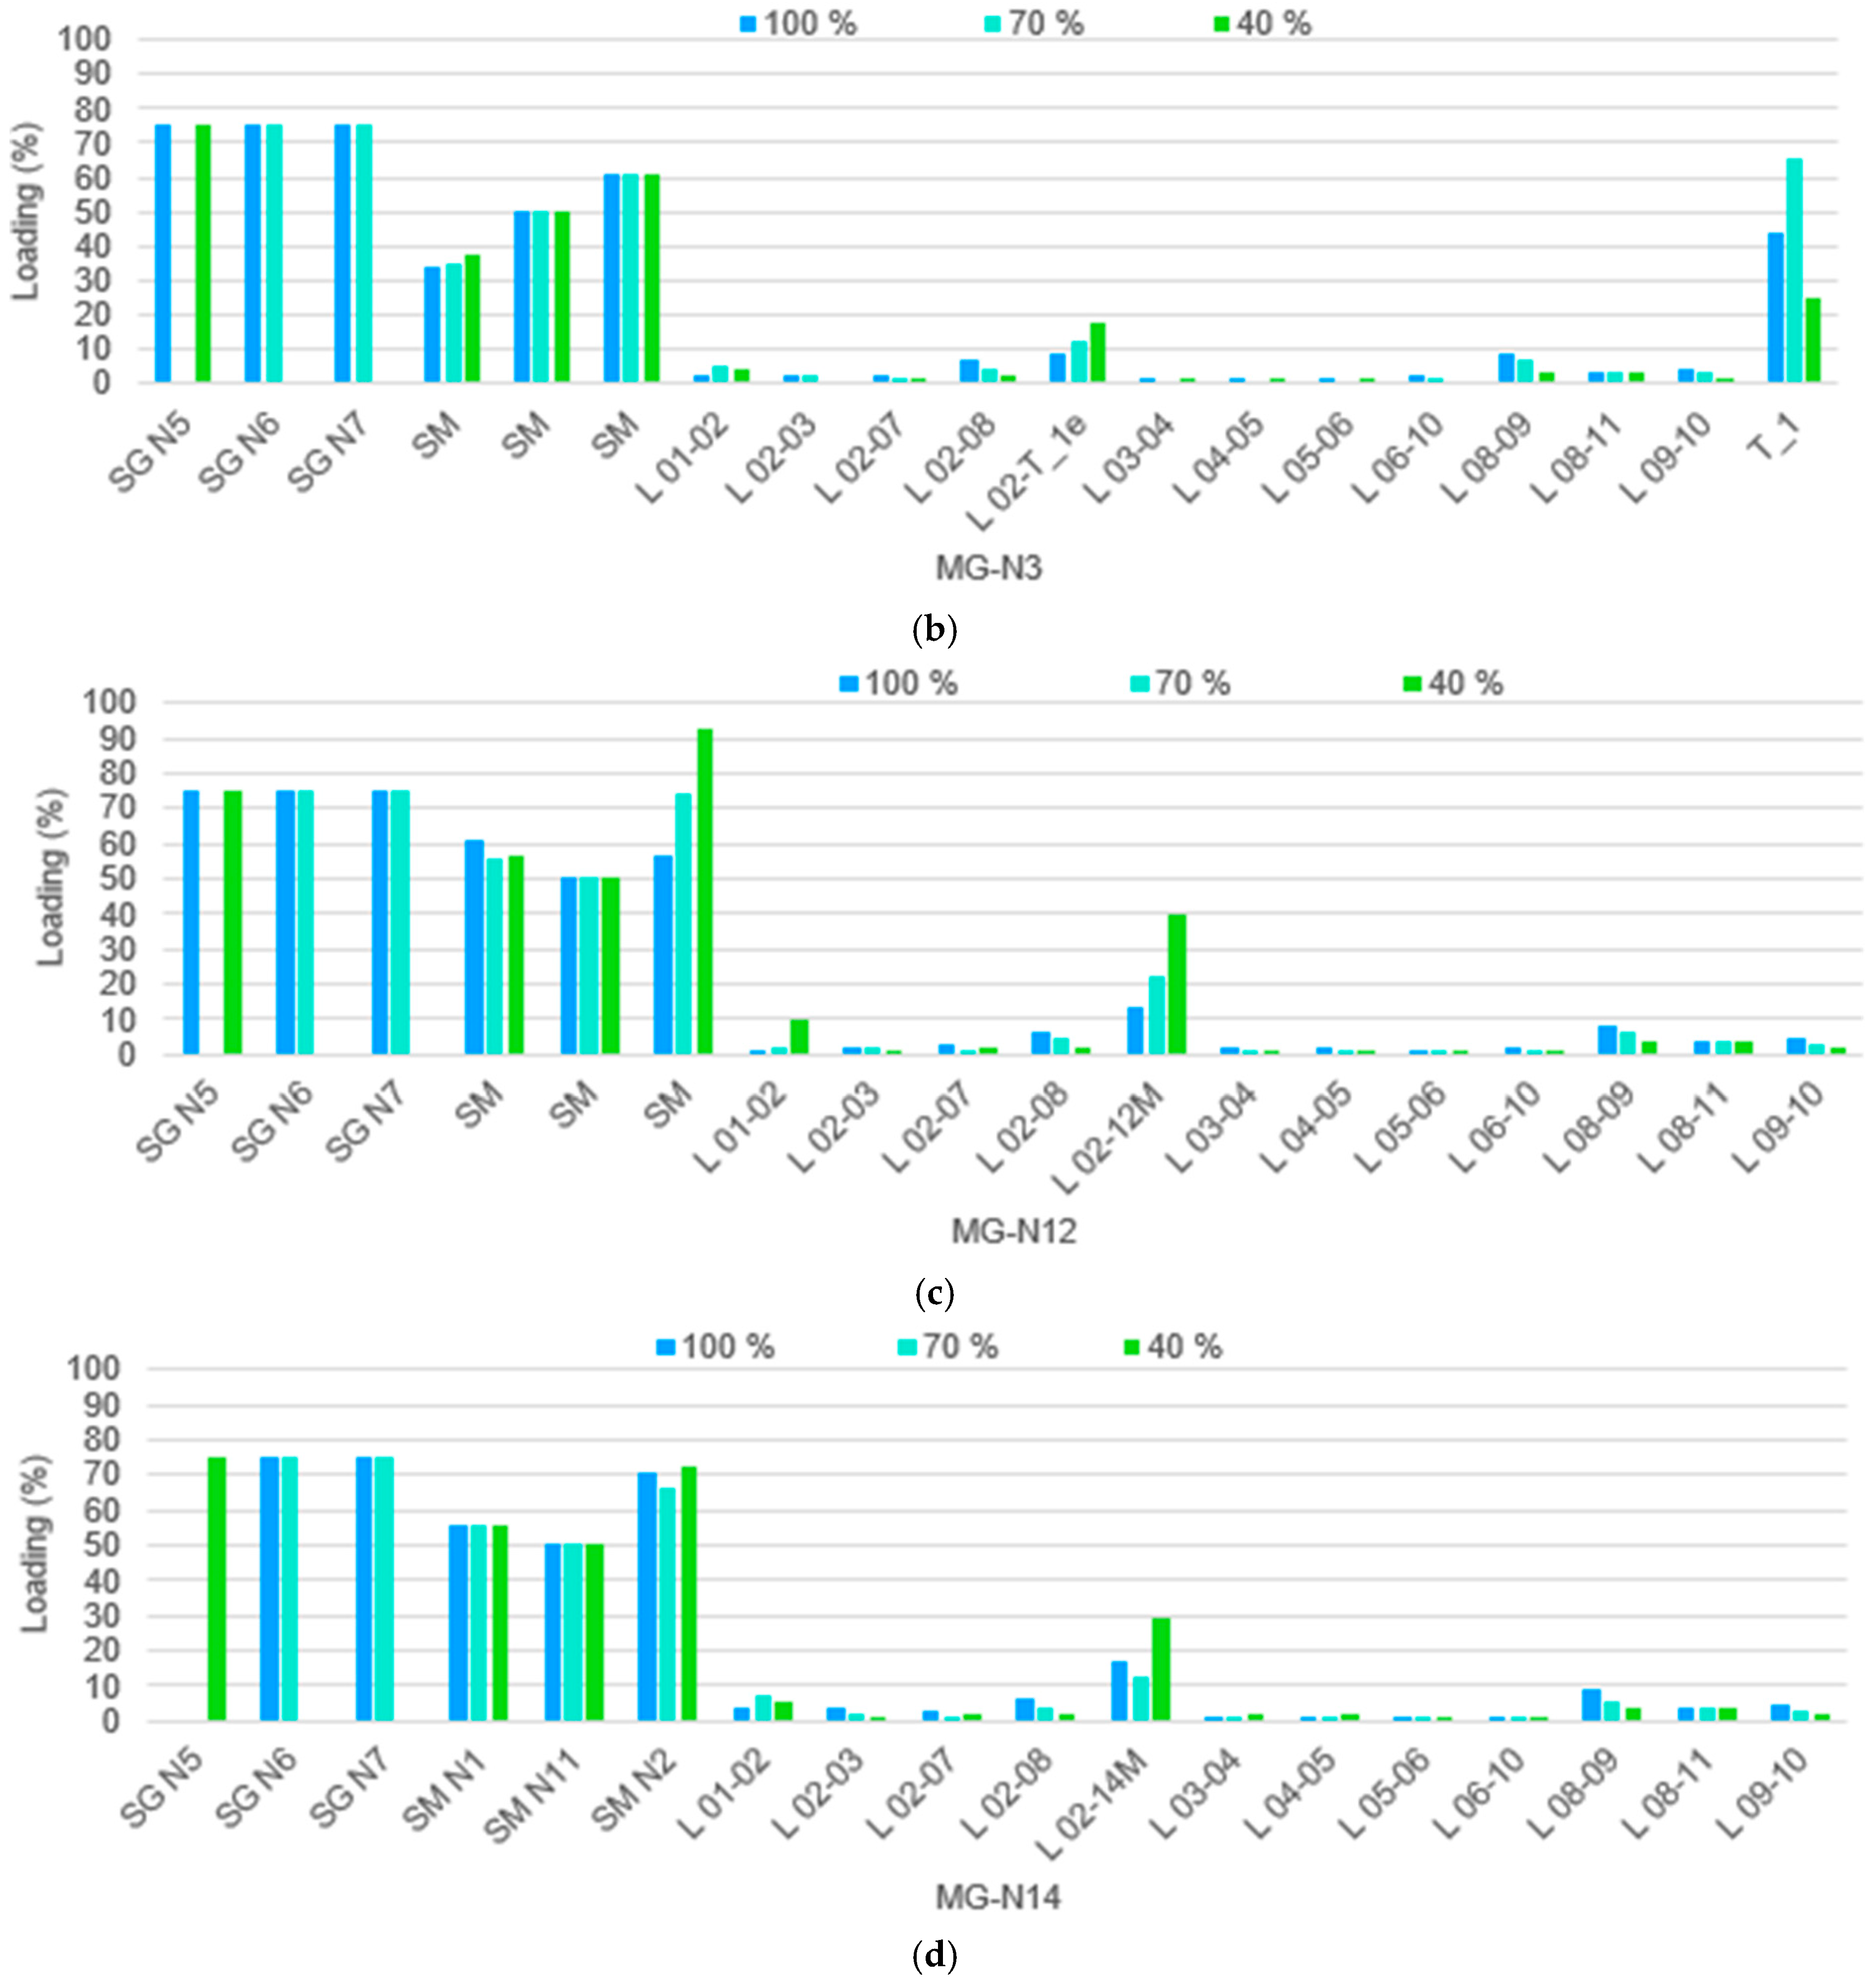
As part of the technical feasibility verification stage, compliance with technical constraints and the load capacity of power grid elements were evaluated in both the main network and the microgrids. Figure 7 shows the loading levels of the lines, generators, machines, and transformers in both subsystems.
Figure 7.
Loadability of the elements: (a) power grid, (b) microgrid connected to node 3, (c) microgrid connected to node 12, and (d) microgrid connected to node 14.
The term SG represents a synchronous generator, L represents transmission lines, SM represents a synchronous motor, and T represents a transformer.
The analysis of Figure 7 shows that the main power grid operates under low to moderate loadability levels across the evaluated scenarios. In particular, the generators reach maximum values near 55%, while the lines and transformers generally remain below 30%. This behavior demonstrates operation with sufficient margins to absorb load variations, and predefined contingency conditions in the deterministic OPF analysis indicate that, under the base operating scenarios, the main power grid operates with available loading margins.
In microgrids, the synchronous generators maintain loadability levels close to 75% in the 100% and 70% demand scenarios, reflecting their role as firm generation and operational support sources. In contrast, the 40% load scenario shows a redistribution of generation due to the lower availability of renewable resources, which increases the loading on some equipment.
The most critical case occurs in the microgrid connected to node 12, where one of the synchronous generators reaches approximately 92.6% loading under the 40% scenario, indicating an operating condition close to the nominal limit. Although more demanding conditions arise under low demand and limited availability of renewable generation, the established technical limits are not exceeded in the base scenarios.
Therefore, given nodal voltages within the admissible range of 0.95–1.05 p.u. and element loadability below 100%, the OPF solutions obtained are considered technically acceptable across all analyzed base scenarios. Table 8 summarizes the acceptability verification, while Table 9 presents the operational decisions derived from the technical analysis.
Table 8.
Acceptability Verification.
Table 9.
Operational decisions derived from physical feasibility indicators.
Table 9 demonstrates the correlation between the power grid’s technical performance and the operational decisions adopted. It shows that the hybrid configuration is consistently recommended in all analyzed scenarios. This is due to its ability to reduce losses, increase operating reserves, and maintain stable power-exchange conditions. Consequently, greater operating margins and flexibility are achieved.
In contrast, the renewable configuration, while technically feasible according to the acceptability verification, presents operational limitations. These limitations are mainly associated with its dependence on the power grid, generation variability, and the need for external support. As a result, more restrictive decisions are adopted, such as conditional operation, backup requirements, and external coordination. These conditions are more pronounced in high-demand (100%) and low-load (40%) scenarios, where reliability and energy-balance demand increase.
To assess the numerical behavior of the OPF solution, the number of internal solver iterations required for convergence was recorded for each evaluated scenario and configuration. Table 10 summarizes the iteration counts obtained for the six evaluated cases.
Table 10.
Internal OPF solver iterations for each evaluated scenario and configuration.
Table 10 shows that all evaluated scenarios converged within a narrow range of 9–13 OPF iterations. The 100% load scenarios required 12 iterations for the hybrid configuration and 9 for the renewable configuration, indicating stable numerical behavior even under the highest-demand condition. The highest number of iterations was observed in the 70% hybrid and 40% renewable scenarios, both with 13 iterations.
This behavior is technically consistent because OPF convergence depends not only on the demand level but also on the active constraints, generation configuration, reactive power limits, grid–microgrid power exchange conditions, and the solver’s initial operating point. Scenarios with greater redistribution of generation or higher dependence on grid–microgrid exchange may require additional iterations, even when the total demand is lower than in the peak-load case.
Therefore, the results indicate the numerical feasibility of the OPF-based assessment within the DIgSILENT PowerFactory simulation environment. However, these iteration values should be interpreted as evidence of convergence under the simulated deterministic conditions, rather than as a complete demonstration of real-time applicability. Since the proposed framework is not implemented as a real-time MPC, receding-horizon, or online dispatch strategy, execution time, hardware characteristics, solver settings, forecast update intervals, and scalability for larger systems were not evaluated in this study. These aspects are identified as future work for assessing real-time or near-real-time applicability of the proposed framework.
4. Discussion
The results obtained show that the hybrid configuration achieves better technical performance than the exclusively renewable configuration across all load scenarios. This behavior is reflected in lower losses, higher spinning reserve, and improved net power exchange. In the high-load scenario, the hybrid configuration reduces losses from 18.72 MW to 11.42 MW, increases the spinning reserve from 91.48 MW to 149.30 MW, and changes the operating condition from a net import of 33.78 MW into a net export of 16.69 MW. This result is mainly associated with the availability of synchronous generation in the hybrid configuration, which provides firm power and additional operating reserve. Therefore, the improvement should be interpreted as the combined effect of the imposed generation mix and the OPF-based dispatch assessment, rather than as the isolated effect of the proposed framework.
These results are consistent with those reported in the literature on power grids with high renewable energy penetration. Other authors indicated that the reduction in synchronous generation affects the inertia and resilience of the power grid, increasing its vulnerability [5,6]. Although the present study does not address dynamic phenomena, the economic dispatch results indicate that synchronous generation plays a structural role in power grid operation by providing firm power, increasing available reserves, and reducing dependence on the main grid.
Additionally, the results support the analysis of the role of operational flexibility in economic dispatch. As discussed in the literature [7,8,9], flexibility resources, such as energy storage and demand response, are fundamental for managing the variability of renewable energy sources. In this study, these resources are not optimized individually; therefore, their roles are discussed only as contextual elements in the literature. The evaluated scenarios show that the system can maintain favorable operating conditions, particularly regarding power exports and reduced external dependence, under medium- and low-load conditions when synchronous generation is available.
A key aspect of the analysis is the power exchange behavior between the microgrid and the power grid. The results show that the microgrid acts as an active element of the power grid, capable of modifying its operating condition between export and import depending on the load level and generation configuration. This result confirms the need to explicitly model bidirectional power flows, as identified in the introduction as a limitation of various existing approaches. In particular, studies based on predictive [13,15,16,19] have demonstrated the effectiveness of these methods in decision-making under uncertainty. However, the present work does not implement predictive control, uncertainty propagation, stochastic optimization, or a receding-horizon structure. Its contribution is limited to a deterministic multi-scenario OPF-based assessment that explicitly incorporates bidirectional energy transfer, electrical constraints, losses, installed capacity, and operating reserve.
This limitation becomes evident when comparing the behavior of both configurations. While the hybrid configuration maintains export conditions in all scenarios, the renewable configuration loses self-sufficiency under both high- and low-load conditions, requiring imports from the power grid. Consequently, the results show that the explicit inclusion of bidirectional exchange improves the representation of the power grid and directly influences dispatch decision-making and performance evaluation.
Another relevant element of the analysis is the simultaneous verification of technical constraints. Unlike approaches that prioritize cost minimization exclusively, this study bases the solution’s acceptability on joint compliance with limits on nodal voltage, element loadability, losses, and spinning reserve availability. This verification confirms the internal technical feasibility of the OPF solutions under the simulated scenarios. However, this process should be interpreted as a post-optimization technical feasibility verification within the simulation environment, rather than as experimental validation or validation against field measurements.
To further support the reliability of the obtained results, the main performance indicators were interpreted in relative terms and contrasted with trends reported in previous studies on hybrid microgrids, renewable energy integration, and technical–economic dispatch assessment. In the present study, the hybrid configuration reduces active power losses by approximately 39.0% in the high-load scenario, from 18.72 MW to 11.42 MW, while the spinning reserve increases by approximately 63.2%, from 91.48 MW to 149.30 MW. In addition, the net microgrid exchange shifts from an import of 33.78 MW to an export of 16.69 MW. These relative results are consistent with studies indicating that hybrid configurations with firm generation support can improve operating margins, reduce dependence on the main grid, and increase the technical feasibility of systems with variable renewable generation.
The results differ from those of studies focused on techno-economic evaluations of hybrid microgrids [20,21,22] by explicitly incorporating the interaction between the microgrid and the power grid, selecting nodes with low electrical rigidity, and verifying OPF solutions under technical constraints. This enables evaluation of power grid performance under predefined deterministic operating conditions. However, the comparison with previous works is made in relative terms because the reviewed studies differ in network topology, installed capacity, load level, dispatch formulation, and generation mix. Therefore, the agreement with the literature should be understood as technical consistency with previously reported trends, rather than as a direct one-to-one validation.
Taken together, the results support the findings of [20,21,22], who emphasized the need to develop more adaptive and integrated dispatch models. In this study, this need is addressed through a multi-scenario OPF-based framework that simultaneously incorporates load scenarios, bidirectional power exchange, electrical constraints, losses, operating reserve, and the coexistence of firm and variable generation.
Therefore, the main contribution of this work is to integrate these variables into a single deterministic OPF-based framework for the joint assessment of key power grid indicators, including losses, spinning reserve, net power exchange, and compliance with technical constraints. The results should be interpreted within the scope of the modified IEEE 14-node test system, the interconnected microgrid, and the predefined deterministic scenarios evaluated in this study.
5. Conclusions
The results show that the predictive economic dispatch strategy provides a coherent structure for integrating technical, operational, and interaction variables between the microgrid and the power grid into a single optimization scheme. The explicit incorporation of electrical constraints, multiple operating scenarios, and bidirectional power flows ensures solutions that are simultaneously feasible from both technical and economic perspectives, thus supporting their applicability under real-world conditions.
The analysis confirms that modeling bidirectional power exchange is relevant for representing the operational interaction between the microgrid and the power grid. The results show that the microgrid can operate either as an importing or exporting subsystem, depending on the load level and generation configuration. Furthermore, the improved performance observed in the hybrid configuration is mainly attributable to the availability of synchronous generation, which provides firm power and additional operating reserve. Therefore, this result should be interpreted as the combined effect of the imposed generation mix and the OPF-based assessment, rather than as the isolated effect of a predictive control strategy.
The main contribution of this work is the formulation of a unified OPF-based assessment scheme that integrates technical, operational, and interaction variables, which have often been addressed separately in the literature. In particular, the combined consideration of electrical constraints, operating reserve, losses, and power-sharing mechanisms enables a more complete representation of the power grid under predefined deterministic operating conditions.
Additionally, the simultaneous verification of technical constraints during the optimization process supports the OPF solutions’ internal technical feasibility, surpassing approaches that evaluate these constraints in isolation. This verification should be understood as a post-optimization technical feasibility assessment within the simulation environment, rather than as experimental validation or validation against measured operating data. In this regard, the proposed framework is useful for evaluating operating conditions, comparing generation configurations, and interpreting power grid performance indicators in interconnected microgrid studies.
The findings should be interpreted within the specific scope of the modified IEEE 14-node test system, the interconnected microgrid, and the three analyzed deterministic load scenarios. Therefore, the results do not constitute a general validation of a predictive dispatch strategy under all possible operating conditions.
Future work should extend the proposed multi-scenario OPF-based framework toward a formal predictive dispatch formulation. This extension should incorporate renewable generation and demand forecasting, uncertainty propagation, stochastic or robust optimization, and receding-horizon implementation. In addition, future studies should evaluate N−1 security-constrained OPF, tighter operating margins, stressed operating conditions, additional test systems, and measured data from real microgrid operation. Computational performance should also be assessed through execution time, solver settings, hardware-dependent behavior, and scalability analysis. These developments would provide a more rigorous basis for evaluating the methodology’s applicability under time-dependent operating conditions, forecast errors, variable renewable generation profiles, and near-real-time microgrid operation.
Author Contributions
Conceptualization, methodology, software, validation, formal analysis, investigation, resources, and data curation K.C.-J., V.S.S. and J.E.C.-B.; writing—original draft preparation, writing—review and editing, visualization, and supervision, K.C.-J., V.S.S., J.E.C.-B., Z.G.S. and F.E.H. All authors have read and agreed to the published version of the manuscript.
Funding
This research received no external funding.
Data Availability Statement
All data required for the research was included in the paper. Additional data can be obtained by contacting the corresponding author.
Acknowledgments
The authors acknowledge the Doctoral Program in “Ingeniería Energética” and the Center for Research in Energy Engineering (CIIE) at Universidad de la Costa; Universidad Nacional de Colombia Sede Medellín; and the Vicent Mut Postdoctoral Program (PD-060-2023) at the Universidad de las Islas Baleares, together with the Conselleria de Educación y Universidades of the Balearic Islands and the European Social Fund Plus (ESF+), for their contributions to the aca-demic and methodological guidance of this study, as well as to the review of and feedback on its results.
Conflicts of Interest
The authors declare no conflicts of interest.
References
- Dawn, S.; Ramakrishna, A.; Ramesh, M.; Das, S.S.; Rao, K.D.; Islam, M.M.; Selim Ustun, T. Integration of Renewable Energy in Microgrids and Smart Grids in Deregulated Power Systems: A Comparative Exploration. Adv. Energy Sustain. Res. 2024, 5, 2400088. [Google Scholar] [CrossRef] [Scilit]
- Cabana-Jiménez, K.; Candelo-Becerra, J.E.; Sousa Santos, V. Comprehensive analysis of microgrids configurations and topologies. Sustainability 2022, 14, 1056. [Google Scholar] [CrossRef] [Scilit]
- Lotfi, H.; Khodaei, A. Hybrid AC/DC Microgrid Planning. Energy 2017, 118, 37–46. [Google Scholar] [CrossRef] [Scilit]
- Rahmani-Andebili, M. Stochastic, Adaptive, and Dynamic Control of Energy Storage Systems Integrated with Renewable Energy Sources for Power Loss Minimization. Renew. Energy 2017, 113, 1462–1471. [Google Scholar] [CrossRef] [Scilit]
- Moore, P.; Alimi, O.A.; Abu-Siada, A. A Review of System Strength and Inertia in Renewable-Energy-Dominated Grids: Challenges, Sustainability, and Solutions. Challenges 2025, 16, 12. [Google Scholar] [CrossRef] [Scilit]
- Milano, F.; Dorfler, F.; Hug, G.; Hill, D.J.; Verbic, G. Foundations and Challenges of Low-Inertia Systems (Invited Paper). In Proceedings of the 2018 Power Systems Computation Conference (PSCC); IEEE: Piscataway, NJ, USA, 2018. [Google Scholar]
- Khaleel, M.; Hesri, A.; Ibra, A.A.; Nassar, Y.F.; El-Khozondar, H.J.; Ahmed, A.A.; Alsharif, A.H.; Imbayah, I. Emerging Issues and Challenges in Integrating of Solar and Wind. Int. J. Electr. Eng. Sustain. 2024, 2, 1–11. [Google Scholar] [CrossRef] [Scilit]
- Lund, P.D.; Lindgren, J.; Mikkola, J.; Salpakari, J. Review of Energy System Flexibility Measures to Enable High Levels of Variable Renewable Electricity. Renew. Sustain. Energy Rev. 2015, 45, 785–807. [Google Scholar] [CrossRef] [Scilit]
- Mousa, H.H.H.; Mahmoud, K.; Lehtonen, M. Recent Developments of Demand-side Management towards Flexible DER-rich Power Systems: A Systematic Review. IET Gener. Transm. Distrib. 2024, 18, 2259–2300. [Google Scholar] [CrossRef] [Scilit]
- Joshal, K.S.; Gupta, N. Microgrids with Model Predictive Control: A Critical Review. Energies 2023, 16, 4851. [Google Scholar] [CrossRef] [Scilit]
- Lim, S.; Lee, J.; Lee, S. Model Predictive Control-Based Energy Management System for Cooperative Optimization of Grid-Connected Microgrids. Energies 2025, 18, 1696. [Google Scholar]
- Zhao, Z.; Xu, J.; Lei, Y.; Liu, C.; Shi, X.; Lai, L.L. Robust Dynamic Dispatch Strategy for Multi-Uncertainties Integrated Energy Microgrids Based on Enhanced Hierarchical Model Predictive Control. Appl. Energy 2025, 381, 125141. [Google Scholar] [CrossRef] [Scilit]
- Navas, A.; Gomez, J.S.; Llanos, J.; Rute, E.; Saez, D.; Sumner, M. Distributed Predictive Control Strategy for Frequency Restoration of Microgrids Considering Optimal Dispatch. IEEE Trans. Smart Grid 2021, 12, 2748–2759. [Google Scholar] [CrossRef] [Scilit]
- Navas-Fonseca, A.; Burgos-Mellado, C.; Espina, E.; Rute, E.; Gomez, J.S.; Saez, D.; Sumner, M. Distributed Predictive Secondary Control for Voltage Restoration and Economic Dispatch of Generation for DC Microgrids. In Proceedings of the 2021 IEEE Fourth International Conference on DC Microgrids (ICDCM); IEEE: Piscataway, NJ, USA, 2021. [Google Scholar]
- Velasquez, M.A.; Quijano, N.; Cadena, A.I.; Shahidehpour, M. Distributed Stochastic Economic Dispatch via Model Predictive Control and Data-Driven Scenario Generation. Int. J. Electr. Power Energy Syst. 2021, 129, 106796. [Google Scholar] [CrossRef] [Scilit]
- Nassourou, M.; Blesa, J.; Puig, V. Optimal Energy Dispatch in a Smart Micro-Grid System Using Economic Model Predictive Control. Proc. Inst. Mech. Eng. Part I J. Syst. Control Eng. 2020, 234, 96–106. [Google Scholar] [CrossRef] [Scilit]
- Mohammadzadeh, N.; Truong-Ba, H.; Cholette, M.E.; Steinberg, T.A.; Manzolini, G. Model-Predictive Control for Dispatch Planning of Concentrating Solar Power Plants under Real-Time Spot Electricity Prices. Sol. Energy 2022, 248, 230–250. [Google Scholar]
- Du, Y.; Pei, W.; Chen, N.; Ge, X.; Xiao, H. Real-Time Microgrid Economic Dispatch Based on Model Predictive Control Strategy. J. Mod. Power Syst. Clean Energy 2017, 5, 787–796. [Google Scholar] [CrossRef] [Scilit]
- Yu, Y.; Li, J.; Chen, D. Optimal Dispatching Method for Integrated Energy System Based on Robust Economic Model Predictive Control Considering Source–Load Power Interval Prediction. Glob. Energy Interconnect. 2022, 5, 564–578. [Google Scholar] [CrossRef] [Scilit]
- Romero-Quete, D.; Garcia, J.R. An Affine Arithmetic-Model Predictive Control Approach for Optimal Economic Dispatch of Combined Heat and Power Microgrids. Appl. Energy 2019, 242, 1436–1447. [Google Scholar] [CrossRef] [Scilit]
- Shezan, S.A.; Ishraque, M.F.; Muyeen, S.M.; Abu-Siada, A.; Saidur, R.; Ali, M.M.; Rashid, M.M. Selection of the Best Dispatch Strategy Considering Techno-Economic and System Stability Analysis with Optimal Sizing. Energy Strat. Rev. 2022, 43, 100923. [Google Scholar] [CrossRef] [Scilit]
- Chaurasia, R.; Gairola, S.; Pal, Y. Technical, Economic, and Environmental Performance Comparison Analysis of a Hybrid Renewable Energy System Based on Power Dispatch Strategies. Sustain. Energy Technol. Assess. 2022, 53, 102787. [Google Scholar] [CrossRef] [Scilit]
- Yero Gómez, D.E.; García Sánchez, Z.; Romero Romero, O. Technical–Economic Evaluation of the Connection of Biomass Power Plants to the Cuban Electricity Power System. Smart Grids Sustain. Energy 2025, 10, 19. [Google Scholar] [CrossRef] [Scilit]
- Zeng, L.; Xu, J.; Liu, Y.; Li, C.; Wu, M.; Wen, M.; Xiao, H. Stochastic Economic Dispatch Strategy Based on Quantile Regression. Int. J. Electr. Power Energy Syst. 2022, 134, 107363. [Google Scholar] [CrossRef] [Scilit]
- DIgSILENT GmbH. PowerFactory, Version 2023 SP4 (64-bit); DIgSILENT GmbH: Gomaringen, Germany, 2023; Available online: https://www.digsilent.de/en/powerfactory.html (accessed on 4 February 2025).
- Saadat, H. Power System Analysis, 3rd ed.; Psa Pub: Burbank, CA, USA, 2011; ISBN 9780984543809. [Google Scholar]
- Katigbak, J.; Kang, D.; Song, H. Analysis of Overvoltage Reactive Power Margin for Future Power Systems with Renewable Energy Generation. Energy Rep. 2023, 9, 962–970. [Google Scholar] [CrossRef] [Scilit]
- Liu, Y.; Yao, L.; Liao, S.; Xu, J.; Cheng, F. A Static Voltage Stability Enhancement Method for Power Systems with a High Proportion of Voltage Source Converters. IEEE Trans. Power Syst. 2025, 40, 4019–4032. [Google Scholar] [CrossRef] [Scilit]
- Pan, X.; Chen, M.; Zhao, T.; Low, S.H. DeepOPF: A Feasibility-Optimized Deep Neural Network Approach for AC Optimal Power Flow Problems. IEEE Syst. J. 2023, 17, 673–683. [Google Scholar]
- Yalman, Y.; Çelik, Ö.; Tan, A.; Bayındır, K.Ç. Optimum Power Flow by Using Interior Point Optimization Method. Researcher 2022, 2, 131–138. Available online: https://dergipark.org.tr/en/pub/researcher/article/1222156 (accessed on 14 May 2026).
- Yuan, B.; Zhou, J.; Lu, G.; Liu, D.; Xia, P.; Wu, C. Coordinated Dispatch of Power Generation and Spinning Reserve in Power Systems with High Renewable Penetration. Processes 2024, 12, 2779. [Google Scholar] [CrossRef] [Scilit]
- Zhu, J.; Jordan, G.; Ihara, S. The Market for Spinning Reserve and Its Impacts on Energy Prices. In Proceedings of the 2000 IEEE Power Engineering Society Winter Meeting. Conference Proceedings (Cat. No.00CH37077); IEEE: Piscataway, NJ, USA, 2002. [Google Scholar]
- Aniceto, B.C.M.; Gomes, F.A.; Santos, P.V.; Nielson, R.; Reis, M.R.C.; Galvao, N.K.M.; Alves, A.J.; Silva, L.F.A.; Calixto, W.P.; Vilela, W.A.; et al. Calculation and Analysis of Voltage Violation Problem on Electricity Distribution Networks. In Proceedings of the 2017 18th International Scientific Conference on Electric Power Engineering (EPE); IEEE: Piscataway, NJ, USA, 2017. [Google Scholar]
- Chen, K.; Wu, W.; Zhang, B.; Djokic, S.; Harrison, G.P. A Method to Evaluate Total Supply Capability of Distribution Systems Considering Network Reconfiguration and Daily Load Curves. IEEE Trans. Power Syst. 2016, 31, 2096–2104. [Google Scholar]
- Hiwarkar, D.C.S.; Halmare, A.M.; Belsare, A.A.; Mohriya, N.B.; Milmile, R. Load Flow Analysis on IEEE 14 Bus System. Int. J. Res. Appl. Sci. Eng. Technol. 2022, 10, 1572–1574. [Google Scholar] [CrossRef] [Scilit]

Disclaimer/Publisher’s Note: The statements, opinions and data contained in all publications are solely those of the individual author(s) and contributor(s) and not of MDPI and/or the editor(s). MDPI and/or the editor(s) disclaim responsibility for any injury to people or property resulting from any ideas, methods, instructions or products referred to in the content. |
© 2026 by the authors. Published by MDPI on behalf of the International Institute of Knowledge Innovation and Invention. Licensee MDPI, Basel, Switzerland. This article is an open access article distributed under the terms and conditions of the Creative Commons Attribution (CC BY) license.