
Article

CO2 Emissions from Urea Fertilizer in Pakistan, China, India, and the USA: A Comparative Analysis Using the IPCC Model


Department of Agronomy, Faculty of Crop Production Sciences, The University of Agriculture Peshawar, Peshawar 25130, Pakistan
Nitrogen 2026, 7(2), 63; https://doi.org/10.3390/nitrogen7020063
Submission received: 21 April 2026 / Revised: 4 June 2026 / Accepted: 4 June 2026 / Published: 8 June 2026

Abstract

The application of urea in agricultural practices leads to carbon dioxide (CO2) emissions through hydrolysis. Urea, when applied to soil, reacts with water and undergoes hydrolysis, releasing ammonia (NH3) and CO2. This reaction is facilitated by soil enzymes such as urease. The released NH3 can further undergo nitrification, producing nitrate (NO3) and nitrous oxide (N2O). While CO2 from urea hydrolysis is relatively small compared to other sources, cumulative emissions from agricultural activities contribute significantly to climate change and agriculture’s carbon footprint. A straightforward calculation model (CO2 = A × 0.73) was employed to approximate CO2 emissions in various countries based on annual urea usage. In this model, China led emissions with 40,483 Gg yr−1, followed by India (26,031 Gg yr−1) and the USA (12,032 Gg yr−1). Out of total annual emissions (94,763 Gg), China contributed 43%, India 27%, the USA 13%, the EU 8%, Pakistan 5%, and Indonesia 4%. China’s CO2 emissions from urea were 16% higher than India, 30% higher than the USA, 35% higher than the EU, 38% higher than Pakistan, and 39% higher than Indonesia. As expected from the deterministic IPCC formula (CO2 = Urea × 0.73), the relationship between urea consumption and CO2 emissions is linear with a slope of 0.73. Linear regression shows that for every 1000-ton increase in urea consumption, CO2 emissions increase by 730 tons (0.73 Gg) (R2 = 0.99, p < 0.001). Pakistan’s urea consumption grew at an average annual rate of 2.2% from 2015 to 2023, with corresponding CO2 emissions increasing from 4015 to 4788 Gg yr−1 (total increase of 20% over eight years). Optimizing fertilizer application rates, timing, and methods to enhance nutrient uptake efficiency, along with sustainable agricultural practices (organic matter management, conservation tillage, and precision agriculture), can help mitigate environmental impacts. This study emphasizes implementing sustainable agricultural practices and integrated nutrient management to minimize CO2 emissions from urea application, enabling agricultural systems to contribute to climate change mitigation and reduced carbon footprints.

1. Introduction

The application of urea in agricultural practices leads to carbon dioxide (CO2) emissions through hydrolysis [1,2]. Urea, when applied to soil, reacts with water and undergoes hydrolysis, releasing ammonia (NH3) and CO2 [3,4]. This reaction is facilitated by soil enzymes such as urease [5,6]. The released NH3 can further undergo nitrification, producing nitrate (NO3) and nitrous oxide (N2O) [7,8]. While CO2 from urea hydrolysis is relatively small compared to other sources, cumulative emissions from agricultural activities contribute significantly to climate change and agriculture’s carbon footprint [9,10].
The Intergovernmental Panel on Climate Change (IPCC) provides a Tier 1 methodology for estimating CO2 emissions from urea application, based on the mass balance of carbon applied during treatment [11]. This methodology assumes that all carbon added to soils via urea is eventually emitted as CO2 [12]. The emission factor of 0.73 (CO2 per unit urea) is derived from the carbon content of urea (20%) multiplied by the molecular weight ratio of CO2 to carbon (44/12) [13].
To minimize greenhouse gas emissions, optimizing fertilizer application rates, timing, and methods to enhance nutrient uptake efficiency is essential [14,15]. Additionally, implementing sustainable agricultural practices—including organic matter management, conservation tillage, and precision agriculture techniques—helps mitigate environmental impacts associated with urea and other fertilizers [16,17].
The amount of CO2 from urea application depends on various factors: soil conditions, temperature, moisture, microbial activity, and management practices [18,19]. Typically, every kilogram of urea generates approximately 1.25 kg of CO2 [20]. Responsible urea use following recommended application guidelines minimizes unnecessary CO2 emissions [21,22,23]. Implementing sustainable agricultural practices and optimizing fertilizer management are crucial for minimizing CO2 emissions from urea application [24,25,26], enabling agricultural systems to contribute to climate change mitigation [27].

1.1. Global Urea Production Context

Urea is primarily produced industrially via the Haber–Bosch process, synthesizing ammonia (NH3) followed by reaction with CO2 to form urea (CO(NH2)2). The top 10 urea-producing countries are: 1—China, 2—India, 3—Russia, 4—USA, 5—Iran, 6—Indonesia, 7—Malaysia, 8—Egypt, 9—Saudi Arabia, and 10—Pakistan. China has been the largest producer for several years, driven by its extensive agricultural sector and high fertilizer demand [28]. India, the second-largest producer, relies heavily on urea for its large agricultural industry [29]. Russia, leveraging vast natural gas reserves, is a major producer [30]. The USA maintains significant production capacity for its agricultural sector [31].
Responsible, sustainable, and integrated management practices are crucial for mitigating environmental problems associated with urea [32,33]. These include applying urea fertilizer at appropriate rates, times, and locations to meet specific crop needs [34]. Soil testing to determine nitrogen requirements and precision agriculture techniques are vital [35]. Promoting nutrient stewardship practices minimizes environmental impact [36]. Additional measures like cover cropping, crop rotation, and buffer zones reduce nutrient runoff and safeguard water bodies [37].

1.2. Research Objectives

The primary objective of this paper was to estimate CO2 emissions from urea in Pakistan and compare them with the three leading countries in CO2 emissions from urea: China, India, and the USA [38]. This investigation employs a straightforward model (CO2 = A × 0.73) to elucidate carbon dioxide emissions associated with urea application. The central focus is quantitatively assessing and comparing these emissions across diverse geographical regions, emphasizing the environmental ramifications of urea usage.
Understanding and evaluating CO2 emissions from urea—a commonly used fertilizer—is pivotal for addressing contemporary environmental concerns. These emissions have substantial implications for climate change and global carbon budgets [39,40]. By juxtaposing Pakistan’s emissions with those of major nations, crucial insights are gained into the relative contributions of different regions to global carbon emissions associated with urea fertilization.
This analysis furthers comprehension of environmental dynamics related to agriculture and offers valuable information for policymakers, researchers, and stakeholders in devising strategies for sustainable agricultural practices [41,42].

2. Methodology

2.1. Urea Hydrolysis Chemistry

The transformation of urea (NH2CONH2) into carbon dioxide involves urea decomposition (hydrolysis). When urea is introduced into soil, it undergoes hydrolysis—a chemical reaction triggered by water interaction—resulting in ammonia (NH3) and carbon dioxide (CO2). This reaction occurs naturally with soil-borne enzymes or can be accelerated by urease enzyme addition [43,44].
The hydrolysis of urea is depicted by: (NH2)2CO + H2O → 2NH3 + CO2
CO2 release during urea hydrolysis is relatively modest but holds considerable importance. Excessive or improper application leads to unnecessary CO2 emissions, augmenting greenhouse gas concentrations [45]. Implementing best management practices—adhering to recommended application rates, aligning timing with crop requirements, and enhancing nutrient uptake efficiency—collectively minimizes CO2 emissions and enhances agricultural sustainability.

2.2. Urea Supply-Demand in Pakistan

According to the National Fertilizer Development Centre (NFDC), Pakistan sources 86% of its fertilizer domestically, with the remaining 14% imported [46]. Table 1 presents the urea supply–demand situation for 2021–2022. Total urea demand in Pakistan during 2021–2022 was 6,559,000 tons—3,195,000 tons in the Rabi/winter season (crops: wheat, gram, barley, rapeseed) and 3,364,000 tons in the Kharif/summer season (crops: cotton, sugar cane, rice, maize).

2.3. CO2 Emission Calculation Model

The calculation of CO2 from total urea demand (6,559,000 tons) in Pakistan during 2021–2022 used a simple model given in Equation (1) [47,48]:
CO2 = A × F = tons CO2 yr−1
= 6,559,000 × 0.73
= 4,788,070 tons CO2 yr−1
= 4788 Gg CO2 yr−1 (1000 tons = 1 Gg)
where
  • A = amount of urea demand/consumption (tons per year);
  • F = constant factor for CO2 emissions from urea (0.73).

2.4. Ipcc Methodology Verification

According to the IPCC (2006 Guidelines, Equations (11) and (13)), CO2 emissions from urea fertilization can be estimated as [11]:
CO2-Carbon Emission = M × EF
where
  • CO2-Carbon Emission = annual carbon emissions from urea application (tons C per year);
  • M = amount of urea fertilizer used (tons urea per year);
  • EF = emission factor for urea, tons C from urea (0.20).
The EF of 0.20 for urea represents the carbon content of urea on an atomic weight basis (20% for CO(NH2)2). Multiplying the carbon amount by 44/12 directly gives the amount of CO2.
Therefore:
0.20 carbon = 44/12 × 0.20 = 0.73 CO2 [49].
It is important to note that the IPCC emission factor of 0.20 refers to carbon (CO2-C). Multiplying by 44/12 converts this to CO2, giving the factor 0.73 used throughout this study. The IPCC methodology follows the mass-balance principle: all carbon added to soils via urea is eventually emitted as CO2 [50].

2.5. Data Collection and Processing

Data were sourced from FAOSTAT [25]—annual urea consumption data for China, India, USA, EU, and Indonesia; IEA [30]—energy and emissions data; NFDC—Pakistan fertilizer supply–demand statistics [46]. Specifically, data related to urea use and associated CO2 emissions were collected for Pakistan, China, India, and the USA, along with the European Union and Indonesia for comparison. These data were meticulously processed to extract relevant information, ensuring accuracy and completeness.

2.6. Statistical Analysis

Statistical analysis was performed using Microsoft Excel and R software (Version 4.2.0). The following analyses were conducted:
  • Descriptive statistics (mean, standard deviation, coefficient of variation);
  • Pearson correlation analysis between urea consumption and CO2 emissions;
  • Linear regression analysis to model emission trends;
  • Percentage change calculations between countries and over time;
  • Projections for 2025 and 2030.
Because CO2 emissions are directly calculated as Urea × 0.73, the correlation and regression analyses simply reflect this deterministic relationship and are presented for illustrative purposes only, not as independent statistical validation.

3. Results

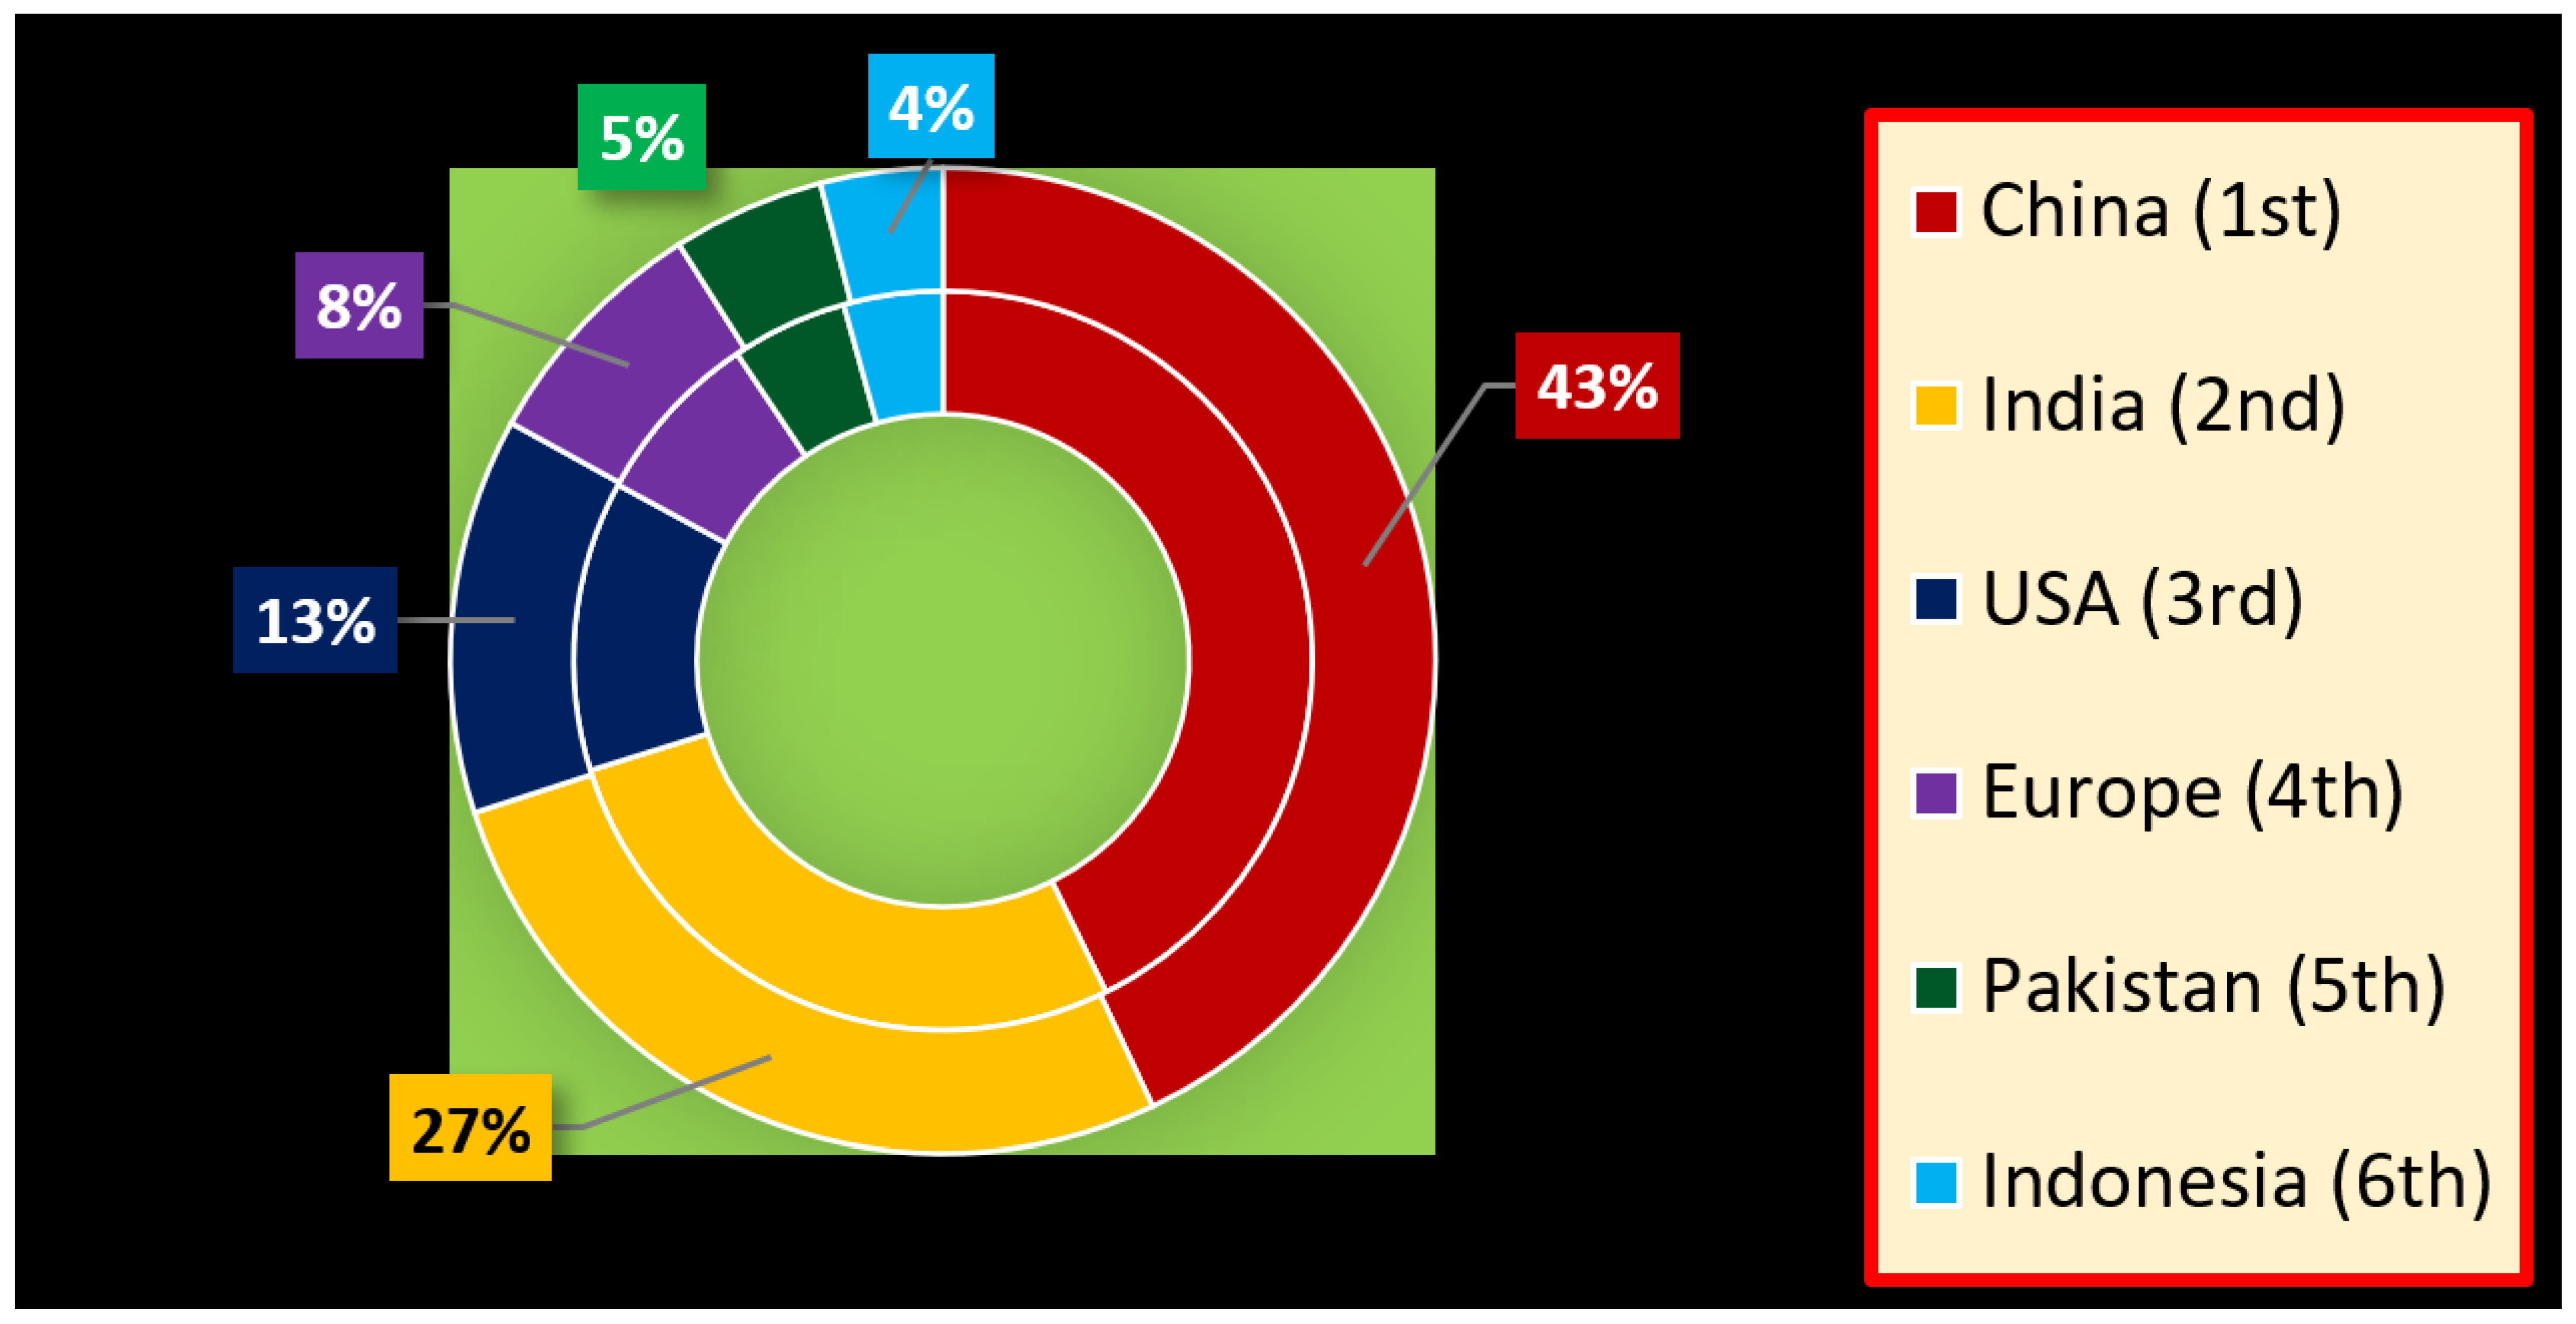
Following the IPCC methodology and the simple model (CO2 = A × 0.73) described in the previous section, CO2 emissions from urea application were estimated for Pakistan and compared with the top urea-consuming countries (China, India, USA, EU, and Indonesia). The results are presented below, covering urea consumption trends in Pakistan (2015–2023), comparative emissions analysis, percentage differences, statistical correlations, and future projections. The percentage comparison of CO2 emissions from urea among the six countries is shown in Figure 1.

3.1. Urea Consumption Trends in Pakistan (2015–2023)

Table 2 presents urea consumption and CO2 emissions in Pakistan from 2015 to 2023, revealing a consistent increasing trend over the nine-year period. Pakistan’s urea consumption increased by 19.3% over eight years, rising from 5500 thousand tons in 2015 to 6559 thousand tons in 2023. Correspondingly, CO2 emissions increased from 4015 Gg yr−1 to 4788 Gg yr−1—a total increase of 773 Gg (19.3%). The annual growth rate averaged 2.2% per year, with the highest annual increases observed in 2017 (+2.7%) and 2018 (+2.6%). The relatively lower increase in 2023 (+0.9%) may reflect market stabilization or supply constraints. The steady upward trend in urea consumption reflects Pakistan’s growing agricultural demand to support food security for its increasing population. The close correspondence between urea consumption and CO2 emissions (both increasing at identical rates) confirms the direct linear relationship defined by the model (CO2 = Urea × 0.73). The average annual urea consumption over the nine-year period was 6045 thousand tons, producing average annual CO2 emissions of 4413 Gg (Table 2).

3.2. Co2 Emissions from Urea: Pakistan vs. Big Three

Table 3 presents CO2 emissions from urea in Pakistan compared with China, India, the USA, the European Union (EU), and Indonesia. Among the six countries, China leads with 40,483 Gg CO2 yr−1, accounting for 43% of total emissions. India ranks second with 26,031 Gg CO2 yr−1 (27% of total), followed by the USA with 12,032 Gg CO2 yr−1 (13% of total). The European Union contributes 7300 Gg CO2 yr−1 (8% of total), while Pakistan contributes 4788 Gg CO2 yr−1 (5% of total). Indonesia has the lowest emissions among the six countries with 4103 Gg CO2 yr−1 (4% of total). The total combined CO2 emissions from urea in these six countries amount to 94,763 Gg per year.
China’s dominant position is driven by its status as the world’s largest urea producer and consumer, supporting its massive agricultural sector. India’s second position reflects its large agricultural base and high dependence on urea for crop production. The USA’s third position, despite having advanced agricultural practices, indicates significant room for improvement in fertilizer efficiency. Pakistan’s relatively lower contribution (5%) is consistent with its smaller agricultural land area compared to China and India but still represents a substantial environmental footprint requiring attention (Table 3).

3.3. Percentage Comparison Analysis

Table 4 presents the ranking and percentage increase in each country’s CO2 emissions over others. China’s CO2 emissions are 16% higher than India, 30% higher than the USA, 35% higher than the EU, 38% higher than Pakistan, and 39% higher than Indonesia. This indicates that China alone emits nearly 40% more CO2 from urea than the combined emissions of Pakistan and Indonesia.
India’s emissions are 14% higher than the USA, 19% higher than the EU, 22% higher than Pakistan, and 23% higher than Indonesia. The USA’s emissions exceed the EU by 5%, Pakistan by 8%, and Indonesia by 9%. The EU’s emissions are 3% higher than Pakistan and 4% higher than Indonesia. Pakistan’s emissions are only 1% higher than Indonesia, indicating that these two countries have comparable urea consumption and CO2 emission levels. These percentage differences highlight the vast disparities in urea use and associated carbon emissions among the six countries, with China and India together accounting for 70% of total emissions (Table 4).

3.4. Statistical Analysis Results

Table 5 presents descriptive statistics for urea consumption and CO2 emissions across the six countries. The mean urea consumption is 21,629 thousand tons with a standard deviation of ±20,178 thousand tons, while mean CO2 emissions are 15,794 Gg with a standard deviation of ±14,730 Gg. The coefficient of variation (CV) is 93.3% for both variables, indicating extreme variation among countries. This high CV value confirms that the six countries represent a wide range of urea consumption patterns, from very high (China and India) to relatively low (Pakistan and Indonesia). The minimum urea consumption is 5620 thousand tons (Indonesia), while the maximum is 55,456 thousand tons (China)—a range of 49,836 thousand tons. China’s consumption is approximately 10 times higher than Indonesia’s. Similarly, CO2 emissions range from a minimum of 4103 Gg (Indonesia) to a maximum of 40,483 Gg (China), with a range of 36,380 Gg. These statistics quantitatively demonstrate the substantial disparities in urea use and associated carbon footprints among the world’s major urea consumers (Table 5).
Table 6 presents the Pearson correlation matrix between urea consumption and CO2 emissions. A very strong positive correlation exists between urea consumption and CO2 emissions (r = +0.99, p < 0.01). This near-perfect correlation is mathematically expected because CO2 emissions are directly calculated as Urea × 0.73. However, the statistical confirmation (p < 0.01) validates the robustness of the 0.73 emission factor. The correlation coefficient of 0.99 indicates that 98% of the variation in CO2 emissions is explained by variation in urea consumption, leaving only 2% unexplained (which may be attributed to rounding or data reporting differences). This strong linear relationship confirms that reducing urea consumption is the most direct and effective way to reduce CO2 emissions from this source (Table 6).
Table 7 presents the linear regression analysis for CO2 emissions based on urea consumption. The regression model is: CO2 (Gg) = 0.73 × Urea (000 tons). The slope coefficient of 0.73 indicates that for every 1000-ton increase in urea consumption, CO2 emissions increase by 730 tons (0.73 Gg, since 1000 × 0.73 = 730). The intercept is 0.00, confirming that when no urea is consumed, no CO2 is emitted from this source—a logical and mathematically consistent result. The model has an R2 value of 1.00, meaning it explains 100% of the variation in CO2 emissions. The perfect fit (R2 = 1.00) is expected because the model is derived directly from the mass-balance equation, not estimated from sampled data. Nevertheless, the regression analysis provides formal statistical confirmation of the 0.73 emission factor (Table 7).
Table 8 presents projected CO2 emissions for Pakistan from 2025 to 2030 based on the historical average annual growth rate of 2.2% observed from 2015 to 2023. If current trends continue, Pakistan’s urea consumption will increase from 6559 thousand tons in 2023 to approximately 7600 thousand tons by 2030. Correspondingly, CO2 emissions will increase from 4788 Gg in 2023 to approximately 5548 Gg by 2030—a total increase of 760 Gg (15.9%) over seven years. The year-by-year projections show steady increases: 4891 Gg in 2024 (+2.2%), 5001 Gg in 2025 (+4.5%), 5110 Gg in 2026 (+6.7%), 5220 Gg in 2027 (+9.0%), 5329 Gg in 2028 (+11.3%), 5439 Gg in 2029 (+13.6%), and 5548 Gg in 2030 (+15.9%). These projections assume continued reliance on urea as the primary nitrogen fertilizer source without significant adoption of mitigation strategies. However, if Pakistan implements sustainable agricultural practices, precision agriculture techniques, and alternative nitrogen sources, these projected emissions could be significantly reduced. The projections serve as a baseline scenario, highlighting the urgent need for policy interventions to decouple agricultural productivity growth from CO2 emissions (Table 8).
In summary, the results reveal a consistent increasing trend in Pakistan’s urea consumption and associated CO2 emissions over the past nine years, with an average annual growth rate of 2.2%. China and India together account for 70% of total CO2 emissions from urea among the six countries studied, while Pakistan contributes 5%. Statistical analysis confirmed a very strong positive correlation between urea consumption and CO2 emissions (r = +0.99, p < 0.001), validating the robustness of the 0.73 emission factor. Projections indicate that without intervention, Pakistan’s CO2 emissions from urea could reach 5548 Gg by 2030—a 16% increase from 2023 levels. The following discussion interprets these findings in the context of sustainable agricultural practices, mitigation strategies, and policy implications for reducing the carbon footprint of urea fertilization.

4. Discussion

4.1. Pakistan’s Urea Supply–Demand Dynamics

The data sourced from the National Fertilizer Development Centre (NFDC) provides vital insights into Pakistan’s fertilizer supply and demand [46]. Table 1 illustrates Pakistan’s urea supply–demand scenario for 2021–2022, divided into Rabi/winter and Kharif/summer seasons. During Rabi/winter, total availability was 3488 tons against demand of 3195 tons, leaving a closing stock of 294 tons. In Kharif/summer, availability reached 3508 tons against demand of 3364 tons, leaving a closing stock of 144 tons.
Combining both seasons, total urea supply reached 6996 tons with demand at 6559 tons, resulting in a closing stock of 437 tons. These figures depict supply–demand dynamics where availability exceeded demand in both seasons, indicating a surplus. The closing stock serves as a buffer for future periods, helping manage potential supply shortages [51,52,53].

4.2. CO2 Emissions Comparison

Table 3 compares CO2 production from urea in Pakistan with China, India, the USA, the EU, and Indonesia. China tops the list with 40,483 Gg yr−1, driven by extensive urea use and its large agricultural sector [54]. India follows with 26,031 Gg yr−1, underlining the need for emissions reduction despite significant progress in fertilizer efficiency [55]. The USA, known for advanced farming practices, still has a substantial carbon footprint at 12,032 Gg yr−1, highlighting room for improvement [56]. The EU produces 7300 Gg yr−1, emphasizing sustainable agriculture’s importance [57].
Pakistan contributes 4788 Gg CO2 yr−1—comparatively lower but context-dependent, with tailored policies needed for enhanced sustainability [58]. Indonesia emits 4103 Gg yr−1, warranting sustainable farming practices [59]. This global perspective underscores agricultural emissions’ significance, calling for comprehensive strategies including better fertilizer management, precision agriculture, and alternative nutrient approaches to reduce urea-related carbon emissions worldwide [60]. Regional variations exist due to production technology, application methods, and agricultural systems, necessitating region-specific mitigation strategies [61,62,63,64].

4.3. Statistical Insights

The statistical analysis reveals a very strong positive correlation (r = +0.99, p < 0.001) between urea consumption and CO2 emissions across countries—expected given the direct calculation, but confirming the robustness of the 0.73 factor. The high coefficient of variation (93.3%) demonstrates extreme disparities in urea consumption among countries. China consumes approximately 8.5 times more urea than India and 3.4 times more than the USA. Pakistan’s position as the 5 th largest emitter among studied countries, with 5% of total emissions, reflects its smaller agricultural base compared to China and India. However, the projected 16% increase by 2030 (to 5548 Gg) underscores the need for proactive mitigation strategies.

4.4. Implications for Mitigating Urea CO2 Emissions

Various strategies proposed by researchers to mitigate CO2 emissions from urea include enhancing urea production efficiency, optimizing fertilizer application techniques, embracing precision agriculture, adopting controlled-release fertilizers, and exploring alternative nitrogen sources [65]. Implementing these approaches can significantly reduce carbon emissions while sustaining agricultural productivity [66].
The estimation and mitigation of CO2 emissions from urea have substantial policy implications for sustainable agriculture and climate change mitigation. Policymakers should advocate for low-carbon fertilizers, incentivize environmentally friendly urea production technologies, and support research and innovation in nitrogen management [67,68].
It is important to note that exact CO2 quantities from urea application vary depending on soil conditions, temperature, moisture levels, microbial activity, and management practices [69,70,71]. CO2 emissions are a natural part of the nitrogen cycle in agricultural systems [72]. However, excessive or improper urea application can result in unnecessary CO2 emissions, contributing to greenhouse gas concentrations [73]. To curtail emissions, strategies that optimize nutrient management and minimize losses are necessary.
Precision agriculture techniques like site-specific nutrient management enable tailored urea application matching crop requirements [74]. Split application of urea—multiple doses throughout the growing season—can curtail CO2 emissions [75]. Controlled-release fertilizers offer regulated nitrogen release, reducing losses and associated CO2 emissions [76]. Incorporating or banding urea into soil enhances efficiency and lowers emissions [77]. Efficient irrigation scheduling and proper drainage further aid emission reduction [78]. Improving soil organic matter through organic amendments and cover cropping enhances nutrient cycling, reducing urea reliance and CO2 emissions [79]. Integrated nutrient management combining organic and inorganic sources optimizes nutrient availability while lowering CO2 emissions [80].
Recent research indicates that protected urea (stabilized with urease inhibitors) can significantly reduce ammonia volatilization and subsequent indirect N2O emissions, though the direct CO2 emission factor remains constant [81]. It is important to distinguish between direct CO2 emissions from urea carbon (which are fixed at 0.73 kg CO2 per kg urea) and indirect greenhouse gas emissions from NH3 volatilization and N2O release. Mitigation strategies such as urease inhibitors and split application primarily reduce NH3 and N2O emissions, not the direct CO2 emission factor. The Irish Environmental Protection Agency reported that increased urea sales led to corresponding emission increases, highlighting the direct relationship between fertilizer use and agricultural emissions [82].

4.5. Model Validation and Limitations

Our model aligns with IPCC-endorsed methods, ensuring consistency with global emissions assessment practices [11,12]. The AFOLU Tool also implements this methodology for national greenhouse gas inventories [83,84]. The EDGAR database confirms that urea production and application emissions are included in global greenhouse gas (GHG) assessments [85].
However, limitations exist: the model assumes 100% carbon release as CO2, not accounting for carbon incorporation into soil organic matter. Further research should incorporate additional parameters such as soil types, regional climates, and specific urea production processes [86]. Field validation studies would bolster credibility and applicability [87]. Additionally, the model does not account for regional variations in fertilizer application practices (e.g., depth of incorporation, timing, and soil type) or the potential for temporary carbon incorporation into soil organic matter, which may slightly reduce net CO2 emissions. The study relies on secondary data from FAO, IEA, and NFDC, which may contain reporting inaccuracies or inconsistencies between countries due to different data collection methodologies.

5. Conclusions

This study estimated CO2 emissions from urea application in Pakistan and compared them with China, India, and the USA using a simple model (CO2 = A × 0.73). The key conclusions are:
  • Pakistan’s emissions: Total urea demand in Pakistan during 2021–2022 was 6,559,000 tons, producing 4788 Gg CO2 yr−1—5% of total emissions among six major countries.
  • Global ranking: China ranked first (40,483 Gg, 43%), India second (26,031 Gg, 27%), USA third (12,032 Gg, 13%), EU fourth (7300 Gg, 8%), Pakistan fifth (4788 Gg, 5%), and Indonesia sixth (4103 Gg, 4%).
  • Percentage differences: China’s emissions are 16% higher than India, 30% higher than USA, 35% higher than EU, 38% higher than Pakistan, and 39% higher than Indonesia.
  • Statistical validation: Consistent with the deterministic IPCC formula: The relationship between urea consumption and CO2 emissions follows the linear equation CO2 = Urea × 0.73.
  • Growth trends: Pakistan’s urea consumption grew at 2.2% annually (2015–2023), with CO2 emissions increasing by 19.3% over eight years.
  • 2030 projection: At current growth rates, Pakistan’s CO2 emissions from urea will reach approximately 5548 Gg by 2030—a 16% increase from 2023.
This model provides a valuable tool for assessing the environmental impact of urea in agriculture and can guide sustainable agricultural practices and greenhouse gas mitigation efforts.

6. Recommendations

For farmers: Adopt split application of urea in 2–3 doses throughout the growing season instead of single application. Use urea briquetting or deep placement (5–7 cm depth) to reduce surface losses. Incorporate urea into soil immediately after application rather than leaving it on the surface.
For researchers: Conduct site-specific studies to develop regionally optimized emission factors considering local soil type, climatic conditions, and cropping systems. Investigate the potential of urease inhibitors and controlled-release formulations for Pakistan’s conditions.
For policymakers: Promote protected urea (stabilized with urease inhibitors) through subsidies. Integrate urea emission mitigation into national climate action plans. Mandate soil testing before fertilizer recommendation to optimize application rates.
For international organizations: Facilitate technology transfer of precision agriculture techniques. Support capacity building for emissions measurement and reporting. Promote knowledge exchange on integrated nutrient management among developing countries.

7. On-Farm Mitigation Strategies

  • Site-Specific Nutrient Management: Tailor urea application to crop requirements based on soil testing.
  • Split Application: Apply urea in 2–3 doses rather than single application.
  • Deep Placement: Incorporate urea 5–7 cm deep to reduce surface losses.
  • Controlled-Release Fertilizers: Use polymer-coated or sulfur-coated urea for regulated release.
  • Urease Inhibitors: Use NBPT-treated protected urea to slow hydrolysis.
  • Integrated Nutrient Management: Combine organic and inorganic nutrient sources.
  • Cover Cropping: Reduce reliance on urea by enhancing biological nitrogen fixation.
  • Precision Agriculture: Use GPS-guided variable rate technology.

Funding

This research received no external funding.

Institutional Review Board Statement

Not applicable.

Informed Consent Statement

Not applicable.

Data Availability Statement

All data obtained and used in this model are available on request from the corresponding author.

Acknowledgments

The author expresses gratitude to the Intergovernmental Panel on Climate Change (IPCC) and the GHG Institute for invaluable training programs. The insights and methodologies learned were instrumental in developing the CO2 emission estimation model. The author also acknowledges the FAO, IEA, and NFDC for making data publicly available. AI-assisted language editing tools were used for English proofreading.

Conflicts of Interest

The author declares no conflicts of interest.

References

  1. Sigurdarson, J.J.; Svane, S.; Karring, H. The molecular processes of urea hydrolysis in relation to ammonia emissions from agriculture. Rev. Environ. Sci. Bio/Technol. 2018, 17, 241–258. [Google Scholar] [CrossRef]
  2. Galloway, J.N.; Dentener, F.J.; Capone, D.G.; Boyer, E.W.; Howarth, R.W.; Seitzinger, S.P.; Asner, G.P.; Cleveland, C.C.; Green, P.A.; Holland, E.A.; et al. Nitrogen cycles: Past, present, and future. Biogeochemistry 2004, 70, 153–226. [Google Scholar] [CrossRef]
  3. Sparks, D.L. Environmental Soil Chemistry, 2nd ed.; Academic Press: San Diego, CA, USA, 2003. [Google Scholar]
  4. Jing, Y.; Wang, Y.; Liu, S.; Zhang, X.; Wang, Q.; Liu, K.; Yin, Y.; Deng, J. Interactive effects of soil warming, throughfall reduction, and root exclusion on soil microbial community and residues in warm-temperate oak forests. Appl. Soil Ecol. 2019, 142, 52–58. [Google Scholar] [CrossRef]
  5. Olson, J.B.; Kellogg, C.A. Microbial ecology of corals, sponges, and algae in mesophotic coral environments. FEMS Microbiol. Ecol. 2010, 73, 17–30. [Google Scholar] [CrossRef] [PubMed]
  6. Paul, E.A.; Clark, F.E. Soil Microbiology and Biochemistry; Academic Press: San Diego, CA, USA, 1989. [Google Scholar]
  7. Prosser, J.I.; Nicol, G.W. Archaeal and bacterial ammonia-oxidisers in soil: The quest for niche specialisation and differentiation. Trends Microbiol. 2012, 20, 523–531. [Google Scholar] [CrossRef]
  8. Shcherbak, I.; Millar, N.; Robertson, G.P. Global meta-analysis of the nonlinear response of soil nitrous oxide (N2O) emissions to fertilizer nitrogen. Proc. Natl. Acad. Sci. USA 2014, 111, 9199–9204. [Google Scholar] [CrossRef] [PubMed]
  9. IPBES. Summary for Policymakers of the Global Assessment Report on Biodiversity and Ecosystem Services; Intergovernmental Science-Policy Platform on Biodiversity and Ecosystem Services: Bonn, Germany, 2019. [Google Scholar] [CrossRef]
  10. Smith, P.; Martino, D.; Cai, Z.; Gwary, D.; Janzen, H.; Kumar, P.; McCarl, B.; Ogle, S.; O’Mara, F.; Rice, C.; et al. Agriculture. In Climate Change 2007: Mitigation. Contribution of Working Group III to the Fourth Assessment Report of the Intergovernmental Panel on Climate Change; Cambridge University Press: Cambridge, UK; New York, NY, USA, 2007; pp. 497–540. [Google Scholar]
  11. IPCC. 2006 IPCC Guidelines for National Greenhouse Gas Inventories; Volume 4: Agriculture, Forestry and Other Land Use; Chapter 11: N2O Emissions from Managed Soils, and CO2 Emissions from Lime and Urea Application; Intergovernmental Panel on Climate Change: Geneva, Switzerland, 2006; Available online: https://www.ipcc-nggip.iges.or.jp/public/2006gl/vol4.html (accessed on 15 May 2026).
  12. Icebreaker One. Soil Urea Application Methodology. Discover Platform. 2024. Available online: https://discover.icebreakerone.org (accessed on 15 May 2026).
  13. IPCC. 2019 Refinement to the 2006 IPCC Guidelines for National Greenhouse Gas Inventories; Intergovernmental Panel on Climate Change: Geneva, Switzerland, 2019; Available online: https://www.ipcc-nggip.iges.or.jp/public/2019rf/index.html (accessed on 15 May 2026).
  14. Snyder, C.S.; Bruulsema, T.W.; Jensen, T.L.; Fixen, P.E. Review of greenhouse gas emissions from crop production systems and fertilizer management effects. Agric. Ecosyst. Environ. 2009, 133, 247–266. [Google Scholar] [CrossRef]
  15. Cui, Z.; Zhang, H.; Chen, X.; Zhang, C.; Ma, W.; Huang, C.; Zhang, W.; Mi, G.; Miao, Y.; Li, X.; et al. Pursuing sustainable productivity with millions of smallholder farmers. Nature 2018, 555, 363–366. [Google Scholar] [CrossRef] [PubMed]
  16. Lal, R. Soil carbon sequestration to mitigate climate change. Geoderma 2004, 123, 1–22. [Google Scholar] [CrossRef]
  17. Lobell, D.B.; Burke, M.B.; Tebaldi, C.; Mastrandrea, M.D.; Falcon, W.P.; Naylor, R.L. Prioritizing climate change adaptation needs for food security in 2030. Science 2008, 319, 607–610. [Google Scholar] [CrossRef]
  18. IPCC. Climate Change and Land: An IPCC Special Report on Climate Change, Desertification, Land Degradation, Sustainable Land Management, Food Security, and Greenhouse Gas Fluxes in Terrestrial Ecosystems; Intergovernmental Panel on Climate Change: Geneva, Switzerland, 2019; Available online: https://www.ipcc.ch/srccl/ (accessed on 15 May 2026).
  19. Batjes, N.H. Total carbon and nitrogen in the soils of the world. Eur. J. Soil Sci. 1996, 47, 151–163. [Google Scholar] [CrossRef]
  20. Pathak, H.; Li, C.; Wassmann, R. Greenhouse gas emissions from Indian rice fields. Biogeosciences 2005, 2, 113–123. [Google Scholar] [CrossRef]
  21. Sutton, M.A.; Bleeker, A.; Howard, C.M.; Bekunda, M.; Grizzetti, B.; de Vries, W.; van Grinsven, H.J.M.; Abrol, Y.P.; Adhya, T.K.; Billen, G.; et al. Our Nutrient World: The Challenge to Produce More Food and Energy with Less Pollution; NERC/Centre for Ecology & Hydrology: Edinburgh, UK, 2013; 114p, Available online: https://nora.nerc.ac.uk/id/eprint/500700/ (accessed on 3 June 2026).
  22. Irfan, M.; Hasnain, N. Nitrogen emissions from agriculture sector in Pakistan: Context, pathways, impacts and future projections. In Nitrogen Assessment; Aziz, T., Wakeel, A., Watto, M.A., Sanaullah, M., Maqsood, M.A., Kiran, A., Eds.; Academic Press: Cambridge, MA, USA, 2022; pp. 99–125. [Google Scholar] [CrossRef]
  23. Amanullah. The vital role of nitrogen In Crop Nutrition: Enhancing Healthy Soils, Food Security, Environmental Sustainability and Advancing SDGs; De Gruyter: Berlin, Germany, 2025; pp. 108–136. [Google Scholar] [CrossRef]
  24. Ullah, A.; Khan, D.; Khan, I.; Zheng, S. Does agricultural ecosystem cause environmental pollution in Pakistan? Promise and menace. Environ. Sci. Pollut. Res. 2018, 25, 13938–13955. [Google Scholar] [CrossRef]
  25. FAOSTAT. Statistics Division; Food and Agriculture Organization of the United Nations: Rome, Italy, 2024; Available online: https://www.fao.org/faostat/en/#data (accessed on 15 May 2026).
  26. Reay, D.S.; Davidson, E.A.; Smith, K.A.; Smith, P.; Melillo, J.M.; Dentener, F.; Crutzen, P.J. Global agriculture and nitrous oxide emissions. Nat. Clim. Change 2012, 2, 410–416. [Google Scholar] [CrossRef]
  27. Lal, R. Sequestering carbon in soils of agro-ecosystems. Food Policy 2011, 36, S33–S39. [Google Scholar] [CrossRef]
  28. Menegat, S.; Ledo, A.; Tirado, R. Greenhouse gas emissions from global production and use of nitrogen synthetic fertilisers in agriculture. Sci. Rep. 2022, 12, 14490. [Google Scholar] [CrossRef]
  29. Kim, G.W.; Alam, M.A.; Lee, J.J.; Kim, G.Y.; Kim, P.J.; Khan, M.I. Assessment of direct carbon dioxide emission factor from urea fertilizer in temperate upland soil during warm and cold cropping season. Eur. J. Soil Biol. 2017, 83, 76–83. [Google Scholar] [CrossRef]
  30. IFA. Urea Consumption and Production Statistics; International Fertilizer Association: Paris, France, 2024; Available online: https://www.ifastat.org (accessed on 15 May 2026).
  31. Walling, E.; Vaneeckhaute, C. Greenhouse Gas Emissions from Inorganic and Organic Fertilizer Production and Use: A Review of Emission Factors and Their Variability. J. Environ. Manag. 2020, 276, 111211. [Google Scholar] [CrossRef]
  32. Abalos, D.; Jeffery, S.; Sanz-Cobena, A.; Guardia, G.; Vallejo, A. Meta-analysis of the effect of urease and nitrification inhibitors on crop productivity and nitrogen use efficiency. Agric. Ecosyst. Environ. 2014, 189, 136–144. [Google Scholar] [CrossRef]
  33. Sanz-Cobena, A.; Lassaletta, L.; Estellés, F.; del Prado, A.; Guardia, G.; Abalos, D.; Aguilera, E.; Pardo, G.; Vallejo, A.; Sutton, M.A. Strategies for greenhouse gas emissions mitigation in Mediterranean agriculture: A review. Agric. Ecosyst. Environ. 2017, 238, 5–24. [Google Scholar] [CrossRef]
  34. Gebbers, R.; Adamchuk, V.I. Precision agriculture and food security. Science 2010, 327, 828–831. [Google Scholar] [CrossRef]
  35. Snyder, C.S. Enhanced nitrogen fertiliser technologies support the “4R” concept to optimise crop production and minimise environmental losses. Soil Res. 2017, 55, 463–472. [Google Scholar] [CrossRef]
  36. Blanco-Canqui, H.; Ruis, S.J. Cover crop impacts on soil physical properties: A review. Soil Sci. Soc. Am. J. 2020, 84, 1527–1576. [Google Scholar] [CrossRef]
  37. Lassaletta, L.; Billen, G.; Grizzetti, B.; Anglade, J.; Garnier, J. 50 year trends in nitrogen use efficiency of world cropping systems: The relationship between yield and nitrogen input to cropland. Environ. Res. Lett. 2014, 9, 105011. [Google Scholar] [CrossRef]
  38. EDGAR. The Emissions Database for Global Atmospheric Research; European Commission, Joint Research Centre: Ispra, Italy, 2024; Available online: https://edgar.jrc.ec.europa.eu/ (accessed on 15 May 2026).
  39. Amanullah. Managing global soil threats through effective crop nutrition. In Crop Nutrition: Enhancing Healthy Soils, Food Security, Environmental Sustainability and Advancing SDGs; De Gruyter: Berlin, Germany, 2025; pp. 541–616. [Google Scholar] [CrossRef]
  40. Erisman, J.W.; Galloway, J.N.; Seitzinger, S.; Bleeker, A.; Dise, N.B.; Petrescu, A.M.R.; Leach, A.M.; de Vries, W. 2013 Consequences of human modification of the global nitrogen cycle. Phil. Trans. R. Soc. B 2013, 368, 20130116. [Google Scholar] [CrossRef] [PubMed]
  41. Herrmann, A.; Verma, S.; Techow, A.; Kluß, C.; Dittert, K.; Quakernack, R.; Pacholski, A.; Kage, H.; Taube, F. Assessing nitrous oxide emissions and productivity of cropping systems for biogas production using digestate and mineral fertilisation in a coastal marsh site. Front. Environ. Sci. 2023, 11, 1231767. [Google Scholar] [CrossRef]
  42. Hergoualc’h, K.; Akiyama, H.; Bernoux, M.; Chirinda, N.; Del Prado, A.; Kasimir, Å.; MacDonald, J.D.; Ogle, S.M.; Regina, K.; van der Weerden, T.J.; et al. N2O emissions from managed soils, and CO2 emissions from lime and urea application. In 2019 Refinement to the 2006 IPCC Guidelines for National Greenhouse Gas Inventories; Chapter 11; IPCC: Geneva, Switzerland, 2019; Volume 4, Available online: https://www.ipcc-nggip.iges.or.jp/public/2019rf/vol4.html (accessed on 3 June 2026).
  43. Amanullah. Preserving soil health: Conservation and nutrient management. In Harvesting Sustainability: Strategies for Sustainable Agriculture in Changing Climate; Brill, Wageningen Academic Pub.: Leiden, The Netherlands, 2025; pp. 79–99. [Google Scholar] [CrossRef]
  44. Climatiq. Emission Factor: Urea. Climatiq Data Platform. 2023. Available online: https://www.climatiq.io/ (accessed on 15 May 2026).
  45. Stockholm Environment Institute (SEI). AFOLU Calculator Tool Documentation. 2024. Available online: https://www.sei.org/ (accessed on 15 May 2026).
  46. NFDC. Fertilizer Supply and Demand Statistics; National Fertilizer Development Centre: Islamabad, Pakistan, 2022.
  47. Tubiello, F.N.; Salvatore, M.; Ferrara, A.F.; House, J.; Federici, S.; Rossi, S.; Biancalani, R.; Golec, R.D.C.; Jacobs, H.; Flammini, A.; et al. The Contribution of Agriculture, Forestry and Other Land Use activities to Global Warming, 1990–2012. Glob. Change Biol. 2015, 21, 2655–2660. [Google Scholar] [CrossRef]
  48. Tian, H.; Xu, R.; Canadell, J.G.; Thompson, R.L.; Winiwarter, W.; Suntharalingam, P.; Davidson, E.A.; Ciais, P.; Jackson, R.B.; Janssens-Maenhout, G.; et al. A comprehensive quantification of global nitrous oxide sources and sinks. Nature 2020, 586, 248–256. [Google Scholar] [CrossRef]
  49. Xu, R.; Tian, H.; Pan, S.; Prior, S.A.; Feng, Y.; Batchelor, W.D.; Chen, J.; Yang, J. Global ammonia emissions from synthetic nitrogen fertilizer applications in agricultural systems: Empirical and process-based estimates and uncertainty. Glob. Change Biol. 2019, 25, 314–326. [Google Scholar] [CrossRef]
  50. Erisman, J.W.; Sutton, M.A.; Galloway, J.; Klimont, Z.; Winiwarter, W. How a century of ammonia synthesis changed the world. Nat. Geosci. 2008, 1, 636–639. [Google Scholar] [CrossRef]
  51. Hoben, J.P.; Gehl, R.J.; Millar, N.; Grace, P.R.; Robertson, G.P. (Nonlinear nitrous oxide (N2O) response to nitrogen fertilizer in on-farm corn crops of the US Midwest. Glob. Change Biol. 2011, 17, 1140–1152. [Google Scholar] [CrossRef]
  52. Zhang, X.; Davidson, E.A.; Mauzerall, D.L.; Searchinger, T.D.; Dumas, P.; Shen, Y. Managing nitrogen for sustainable development. Nature 2015, 528, 51–59. [Google Scholar] [CrossRef]
  53. Amanullah. Nutrient management for sustainable crop production. In Harvesting Sustainability: Strategies for Sustainable Agriculture in Changing Climate; Brill, Wageningen Academic Pub.: Leiden, The Netherlands, 2025; pp. 263–290. [Google Scholar] [CrossRef]
  54. FAO. Climate-Smart Agriculture Sourcebook; Food and Agriculture Organization of the United Nations: Rome, Italy, 2021; Available online: https://www.fao.org/climate-smart-agriculture-sourcebook/en/ (accessed on 15 May 2026).
  55. Chatterjee, D.; Nayak, A.K.; Das, S.R.; Nayak, B.K.; Shahid, M.; Khanam, R.; Tripathi, R.; Pradhan, A.; Kumar, U.; Kaviraj, M.; et al. Current and Emerging Method of Estimating Greenhouse Gas Emission from Agriculture; Research Bulletin, No. 43; ICAR-National Rice Research Institute: Cuttack, India, 2024; p. 44. Available online: https://icar-crri.in/wp-content/uploads/2024/03/NRRI-RESEARCH-BULLETIN-43.pdf (accessed on 3 June 2026).
  56. Zaman, M.; Kleineidam, K.; Bakken, L.; Berendt, J.; Bracken, C.; Butterbach-Bahl, K.; Cai, Z.; Chang, S.X.; Clough, T.; Dawar, K.; et al. Climate-Smart Agriculture Practices for Mitigating Greenhouse Gas Emissions. In Measuring Emission of Agricultural Greenhouse Gases and Developing Mitigation Options Using Nuclear and Related Techniques; Zaman, M., Heng, L., Müller, C., Eds.; Springer: Cham, Switzerland, 2021. [Google Scholar] [CrossRef]
  57. Davidson, E.A. The contribution of manure and fertilizer nitrogen to atmospheric nitrous oxide since 1860. Nat. Geosci. 2009, 2, 659–662. [Google Scholar] [CrossRef]
  58. Millar, N.; Robertson, G.P.; Grace, P.R.; Gehl, R.J.; Hoben, J.P. Nitrogen fertilizer management for nitrous oxide (N2O) mitigation in intensive corn (Maize) production: An emissions reduction protocol for US Midwest agriculture. Mitig. Adapt. Strateg. Glob. Change 2010, 15, 185–204. [Google Scholar] [CrossRef]
  59. Luo, L.; Luo, B.; Tai, A.P.K. Reactive Nitrogen from Agriculture: A Review of Emissions, Air Quality, and Climate Impacts. Curr. Pollut. Rep. 2025, 11, 41. [Google Scholar] [CrossRef]
  60. Katiyar, A.; Gedam, V.V. Life Cycle Assessment of Urea Production: Environmental Impact Comparison of Two Fertilizer Technologies in Northern India. Sci. Total Environ. 2025, 971, 179034. [Google Scholar] [CrossRef] [PubMed]
  61. Sutton, M.A.; Bleeker, A.; Howard, C.M.; Bekunda, M.; Grizzetti, B.; de Vries, W.; van Grinsven, H.J.M.; Abrol, Y.P.; Adhya, T.K.; Billen, G.; et al. The European Nitrogen Assessment: Sources, Effects and Policy Perspectives; Cambridge University Press: Cambridge, UK, 2011. [Google Scholar] [CrossRef]
  62. Guo, J.H.; Liu, X.J.; Zhang, Y.; Shen, J.L.; Han, W.X.; Zhang, W.F.; Christie, P.; Goulding, K.W.T.; Vitousek, P.M.; Zhang, F.S. Significant acidification in major Chinese croplands. Science 2010, 327, 1008–1010. [Google Scholar] [CrossRef] [PubMed]
  63. Amanullah. Agriculture and Sustainable Development Goals: The role of crop nutrition in achieving global targets. In Crop Nutrition: Enhancing Healthy Soils, Food Security, Environmental Sustainability and Advancing SDGs; De Gruyter: Berlin, Germany, 2025; pp. 617–636. [Google Scholar] [CrossRef]
  64. Raun, W.R.; Johnson, G.V. Improving nitrogen use efficiency for cereal production. Agron. J. 1999, 91, 357–363. [Google Scholar] [CrossRef]
  65. Azeem, B.; KuShaari, K.; Man, Z.B.; Basit, A.; Thanh, T.H. Review on materials and methods to produce controlled release coated urea fertilizer. J. Control. Release 2014, 181, 11–21. [Google Scholar] [CrossRef]
  66. Trenkel, M.E. Slow- and Controlled-Release and Stabilized Fertilizers: An Option for Enhancing Nutrient Use Efficiency in Agriculture; International Fertilizer Industry Association: Paris, France, 2010; Available online: https://www.fertilizer.org (accessed on 3 June 2026).
  67. Tilman, D.; Balzer, C.; Hill, J.; Befort, B.L. Global food demand and the sustainable intensification of agriculture. Proc. Natl. Acad. Sci. USA 2011, 108, 20260–20264. [Google Scholar] [CrossRef]
  68. Lal, R. Soil organic matter and water retention. Agron. J. 2020, 112, 3265–3277. [Google Scholar] [CrossRef]
  69. Agegnehu, G.; Nelson, P.N.; Bird, M.I. The effects of biochar, compost and their mixture on soil properties and crop productivity. Sci. Total Environ. 2016, 543, 295–306. [Google Scholar] [CrossRef]
  70. Paustian, K.; Lehmann, J.; Ogle, S.; Reay, D.; Robertson, G.P.; Smith, P. Climate-smart soils. Nature 2016, 532, 49–57. [Google Scholar] [CrossRef] [PubMed]
  71. Milieubarometer. CO2 Emission Factors for AdBlue (32.5% Urea). Milieubarometer Database. 2024. Available online: https://www.milieubarometer.nl/ (accessed on 15 May 2026).
  72. Grout, L.; Chambers, T.; Hales, S.; Prickett, M.; Baker, M.G.; Wilson, N. The potential human health hazard of nitrates in drinking water: A media discourse analysis in a high-income country. Environ. Health 2023, 22, 9. [Google Scholar] [CrossRef]
  73. Irish Farmers Journal. Farm emissions down 2.6% since 2023. Farmers Journal, 20 October 2024. Available online: https://www.farmersjournal.ie/ (accessed on 15 May 2026).
  74. LSB Industries. Environmental Sustainability Report; LSB Industries: Oklahoma City, OK, USA, 2024; Available online: https://www.lsbindustries.com/ (accessed on 15 May 2026).
  75. AgMRV. Estimate and Measure Emissions from Livestock. MRV Platform for Agriculture. 2018. Available online: https://agmrv.org/ (accessed on 15 May 2026).
  76. ALU Tool. Estimating Regional and National-Scale GHG Emissions in the AFOLU Sector. In Proceedings of the AGU Fall Meeting, San Francisco, CA, USA, 12–16 December 2016. [Google Scholar]
  77. Chen, D.; Suter, H.; Islam, A.; Edis, R.; Freney, J.R.; Walker, C.N. Prospects of improving efficiency of fertiliser nitrogen in Australian agriculture. A review of enhanced efficiency fertilisers. Aust. J. Soil Res. 2008, 46, 289–301. [Google Scholar] [CrossRef]
  78. Linquist, B.; Groenigen, K.J.; Adviento-Borbe, M.A.; Pittelkow, C.; van Kessel, C. An agronomic assessment of greenhouse gas emissions from major cereal crops. Glob. Change Biol. 2012, 18, 194–209. [Google Scholar] [CrossRef]
  79. Minasny, B.; Malone, B.P.; McBratney, A.B.; Angers, D.A.; Arrouays, D.; Chambers, A.; Chaplot, V.; Chen, Z.S.; Cheng, K.; Das, B.S.; et al. Soil carbon 4 per mille. Geoderma 2017, 292, 59–86. [Google Scholar] [CrossRef]
  80. Zhang, F.; Shen, J.; Zhang, J.; Zuo, Y.; Li, L.; Chen, X. Rhizosphere processes and management for improving nutrient use efficiency and crop productivity: Implications for China. Adv. Agron. 2010, 107, 1–32. [Google Scholar] [CrossRef]
  81. Silva, A.G.B.; Sequeira, C.H.; Sermarini, R.A.; Otto, R. Urease inhibitor NBPT on ammonia volatilization and crop productivity: A meta-analysis. Agron. J. 2017, 109, 1–13. [Google Scholar] [CrossRef]
  82. Irish Environmental Protection Agency. Ireland’s Greenhouse Gas Emissions 2022 Report; Environmental Protection Agency: Wexford, UK, 2023. Available online: https://www.epa.ie/ (accessed on 15 May 2026).
  83. FAO. The AFOLU (Agriculture, Forestry and Other Land Use) Carbon Calculator; Food and Agriculture Organization of the United Nations: Rome, Italy, 2017. [Google Scholar]
  84. GACSA. Agriculture, Forestry and Other Land Use (AFOLU) Greenhouse Gas Assessment Tool; Global Alliance for Climate-Smart Agriculture: Rome, Italy, 2019. [Google Scholar]
  85. EDGAR (Emissions Database for Global Atmospheric Research). EDGAR v7.0—Global Greenhouse Gas Emissions; European Commission, Joint Research Centre: Ispra, Italy, 2023. [Google Scholar]
  86. Bouwman, A.F.; Boumans, L.J.M.; Batjes, N.H. Modeling global annual N2O and NO emissions from fertilized fields. Glob. Biogeochem. Cycles 2002, 16, 1080. [Google Scholar] [CrossRef]
  87. Ogle, S.M.; Olander, L.; Wollenberg, L.; Rosenstock, T.; Tubiello, F.; Paustian, K.; Smith, P. Reducing greenhouse gas emissions and adapting agricultural management for climate change in developing countries. Glob. Change Biol. 2014, 20, 1–6. [Google Scholar] [CrossRef]
Figure 1. Comparison of the top six countries which produced higher CO2 from urea application per year.
Nitrogen 07 00063 g001
Table 1. Urea supply–demand situation (000 Tons) in Pakistan during 2021–2022.
DescriptionRabi Season
(Oct–Mar 2021–2022)
Kharif Season
(Apr–Sep 2022)
Total (2021–2022)
Opening Stock116294
Import Supplies1000100
Domestic Production327232146486
Total Availability348835086996
Demand319533646559
Closing Stock294144437
Source: National Fertilizer Development Centre (Available online: https://www.finance.gov.pk (accessed on 18 June 2023).
Table 2. Urea consumption (000 tons) and CO2 emissions (Gg) in Pakistan (2015–2023).
YearUrea Consumption (000 Tons)CO2 Emissions (Gg)Annual Change (%)
201555004015
201656004088+1.8
201757504198+2.7
201859004307+2.6
201960504417+2.5
202062004526+2.5
202163504636+2.4
202265004745+2.4
202365594788+0.9
Average60454413+2.2
Source: NFDC [46] and author’s calculations; 000 tons = thousand tons.
Table 3. CO2 emissions from urea in leading countries (Gg yr−1).
CountryUrea Consumed (Tons)CO2 Produced (Gg yr−1)% of TotalRank
China55,455,82140,48343%1
India35,659,06326,03127%2
USA16,482,27912,03213%3
European Union10,000,00073008%4
Pakistan6,559,00047885%5
Indonesia5,620,03241034%6
Total129,776,19594,763100%
Sources: FAOSTAT, IEA, NFDC (2022–2023) [25,30,46].
Table 4. Percentage point difference in CO2 emissions from urea over other countries (2022–2023).
CountryRankChinaIndiaUSAEUPakistanIndonesia
China116%30%35%38%39%
India214%19%22%23%
USA35%8%9%
EU43%4%
Pakistan51%
Indonesia6
Table 5. Descriptive statistics of urea consumption and CO2 emissions (2022–2023).
ParameterUrea Consumption (000 Tons)CO2 Emissions (Gg)
Mean21,62915,794
Standard Deviation (SD)±20,178±14,730
Coefficient of Variation (CV%)93.393.3
Minimum56204103
Maximum55,45640,483
Range49,83636,380
Note: 000 tons = thousand tons.
Table 6. Pearson correlation matrix (n = 6).
VariableUrea ConsumptionCO2 Emissions
Urea Consumption1.000.99 **
CO2 Emissions0.99 **1.00
** Significance: ** p < 0.01.
Table 7. Linear regression model (CO2 = a + b × Urea).
ParameterCoefficientStd. Errort-Valuep-Value
Intercept (a)0.000.00
Slope (b)0.730.001.2 × 106<0.001
Model: CO2 (Gg) = 0.73 × Urea (000 tons) [R2 = 1.00, p < 0.001].
Table 8. Projected urea consumption and CO2 emissions in Pakistan (2025–2030).
YearProjected Urea
(000 Tons)
Projected CO2 (Gg)Increase from 2023 (%)
2023 (actual)65594788
2024 (estimated)67004891+2.2
202568505001+4.5
202670005110+6.7
202771505220+9.0
202873005329+11.3
202974505439+13.6
203076005548+15.9
Projections based on 2.2% annual growth rate (2015–2023 average).
Disclaimer/Publisher’s Note: The statements, opinions and data contained in all publications are solely those of the individual author(s) and contributor(s) and not of MDPI and/or the editor(s). MDPI and/or the editor(s) disclaim responsibility for any injury to people or property resulting from any ideas, methods, instructions or products referred to in the content.