


Abstract
Water pans and small dams play a vital role in supplying domestic water in rural regions characterised by seasonal rainfall regimes, with increasing importance as a climate change adaptation measure. Despite their small individual size, the collective impact of numerous water pans is significant. Commercially available monitoring systems are often too costly to be justified for these decentralised infrastructures, resulting in limited data availability that impedes detailed studies aimed at improving their performance. Here, we developed a low-cost monitoring station network that measures water level (JSN-SR04T ultrasonic sensor), precipitation (3D-printed tipping-bucket gauge), and air temperature and humidity (DHT22 sensor). Each station costs less than 12,000 KES (≈93 USD in March 2026), making it suitable for such decentralised multi-site monitoring. A field trial conducted from June to November 2025 at four water pans in the Kakia-Esamburmbur Catchment, Kenya, compared the collected data with an automatic weather station and manual observations. Water level measurements were more accurate than manual reference readings, while air temperature showed biases of to °C. Precipitation data were largely inaccurate due to inadequate sensor levelling. Overall operational reliability reached , indicating potential for improvements to reduce maintenance efforts and fully exploit the advantages of its low-cost hardware.
1. Introduction
More than 60% of Africa’s area is characterised by seasonal rainfall regimes [1]. Harvesting of water during the rainy seasons and storage for domestic and agricultural use in the dry seasons is crucial to cope with these conditions, particularly in rural areas where piped water is not available. Small excavated reservoirs built off-stream in open areas have been shown to be effective for this purpose [2,3]. Such structures are referred to as “water pans” in Kenya [2,3]. Other terms include “Berkad/Birkad” [4], “Charco dam” [5,6], “Hafir” [5,7], “small dam” [3] and “excavated ponds” [5].
Different definitions for water pans exist: In contrast to other authors, Lindqvist [5] considers natural depressions where water accumulates as water pans. Among man-made structures, the Kenyan Ministry of Water and Irrigation (MWI) [3] distinguishes a pan from other small water storage facilities by the fact that it stores water entirely below the natural ground level, thereby not requiring any engineering design to resist hydraulic pressures. In contrast, Mati et al. [2] define a water pan based on the following characteristics: excavated structure, about 1 to 3 m deep, capacity of 500 to 5000 m3, dug off-stream or in open areas, with raised and compacted banks and fed by surface runoff only. This last definition is adopted for this study.
Various studies have been conducted on water pans, using remote sensing [8,9,10,11], interviews [12,13] or water samples [7,10,14,15] as input data. These studies were able to show the economic viability of water pans [13], provide methodologies for siting them [8,9] and identify problems with the water quality [7,14,15]. Only a limited number of studies involving hydrological assessments of water pans have been conducted. Okuku et al. [11] measured the water storage level and meteorological data at a water pan after its construction to validate a model used to identify the site of the pan. Ngigi et al. [16] monitored farm ponds, significantly smaller than water pans, to assess their ability to provide sufficient water for irrigation in dry seasons.
As water pans are becoming increasingly important for adapting to climate change– driven rainfall variability [17,18], the applications of hydrometeorological monitoring data from these pans are expanding. This includes precise predictions of water availability based on seasonal climate forecasts and more informed decision making through real-time availability of data, which allows more targeted emergency response in case of drought and better consideration of small but numerous structures in Integrated Water Resources Management. Applications in research include improving the designs as well as assessing and improving the reliability and resilience of the systems, particularly considering the impacts of climate change.
A typical water pan serves one to ten families, and its construction costs range from 140,000 to 3 million KES (≈1000 to 24,000 USD in March 2026). The significant impact on local hydrology and water security arises from the collective contribution of numerous water pans. Commercially available monitoring systems are mostly designed for single high-capital and high-impact infrastructures, where high precision is required. This comes with high costs [19] which cannot be justified for water pans with limited individual impact in rural Kenya, where financial resources are constrained. Such decentralised infrastructures require a different monitoring approach, focusing on low costs at each pan to allow monitoring of multiple sites, similar to the contexts presented by Hund et al. [20] and Segovia-Cardozo et al. [21].
Low-cost sensor networks have emerged as an alternative to commercial systems for environmental monitoring [22,23,24]. Devices can be custom-made according to the specific needs of each use case, using a variety of hardware modules available at low prices, such as microcontrollers, communication devices, sensors and power supply. By combining decentralised measurements of physical things with real-time connectivity, these devices form the backbone of the Internet of Things (IoT) [25]. Hydrological monitoring systems based on low-cost sensor networks can deliver almost the same quality of data as commercial systems while costing around 10% [22]. They have been shown to be effective, allowing high spatial sensor coverage with limited financial resources, in a variety of hydrological monitoring tasks [19,20,21,22,26,27,28,29,30].
To enable new opportunities for hydrometeorological data collection at water pans, low-cost monitoring stations to measure the water level, precipitation, air temperature, and humidity, which can be made for less than 12,000 KES (≈93 USD in March 2026), were developed. A field trial was conducted for six months at four water pans in Kakia-Esamburmbur Catchment, Kenya.
2. Materials and Methods
2.1. Study Area and Water Pans
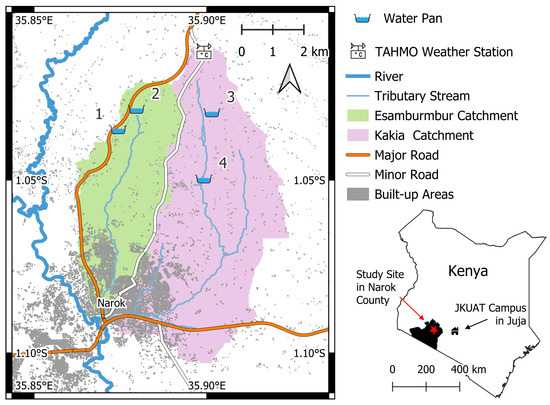
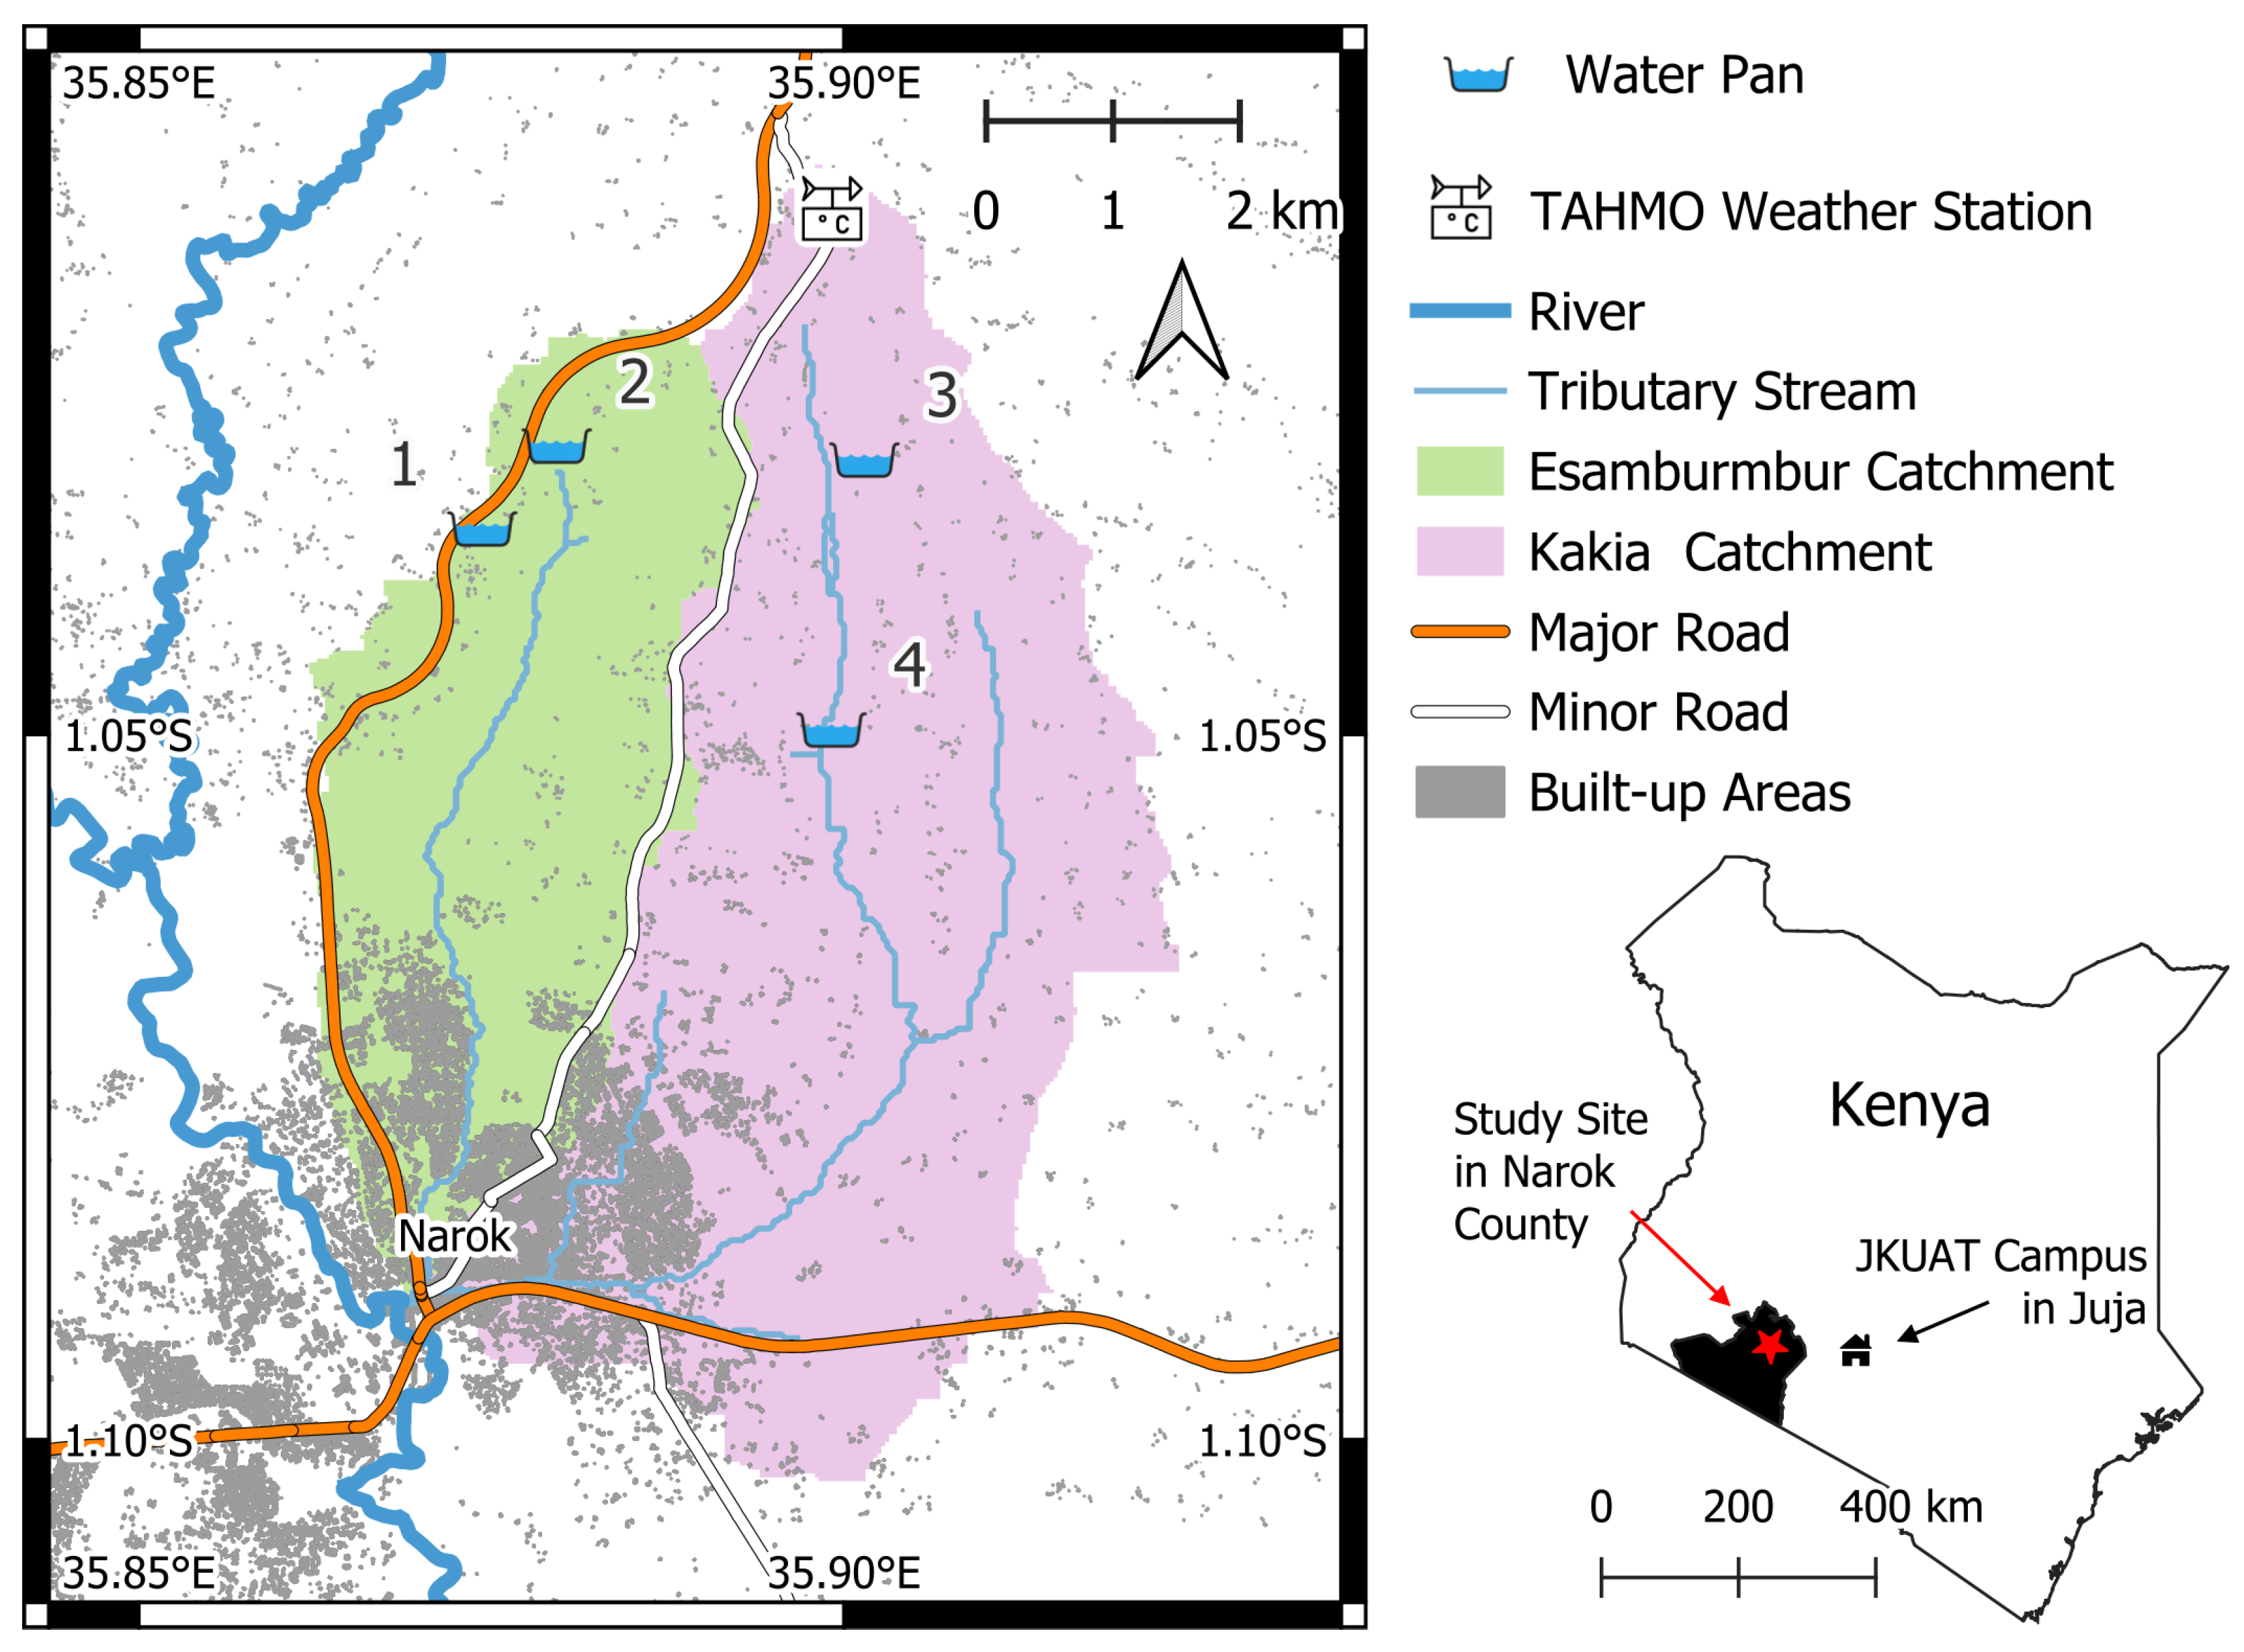
Four water pans were chosen for the study, located 5 to km north of Narok town in Kenya. The specific water pans were chosen according to two main criteria: the owners’ interest and consent to participate in the study, and whether the safety of the equipment could be guaranteed on the site. The water pans are located in the Kakia-Esamburmbur sub-catchment within the watershed of Enkare Narok River basin.
The rainfall regime in the area is characterised by an average annual precipitation of mm with high seasonal variability [31]. The long-rain season occurs between March and May, and the short-rain season between October and December [31]. The area of these water pans has a temperate, no dry season, warm summer climate (Köppen-Geiger Cfb) [32]. The water pans are located at elevations between 1990 and 2060 m. According to the owners, they are mostly used for livestock, with people from surrounding farms bringing their herds for drinking. To a smaller extent, they also provide water for domestic use and irrigation.
A weather station from the Trans-African Hydro-Meteorological Observatory (TAHMO) is located at the northern end of the Kakia Catchment at an elevation of 2121 m, 2 to km away from any of the water pans.
A map of the study area is provided in Figure 1.
Figure 1.
Overview map of the study area. Catchment boundaries and tributary streams were derived from FABDEM [33]; all other map elements from OpenStreetMap [34].
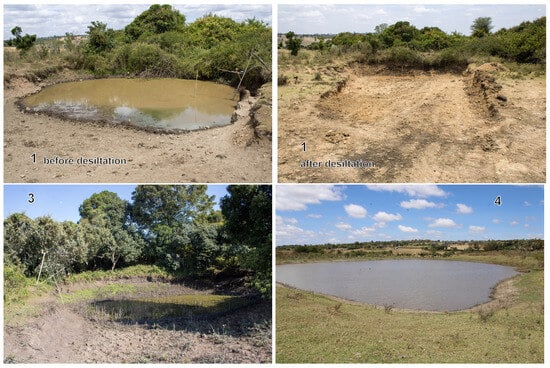
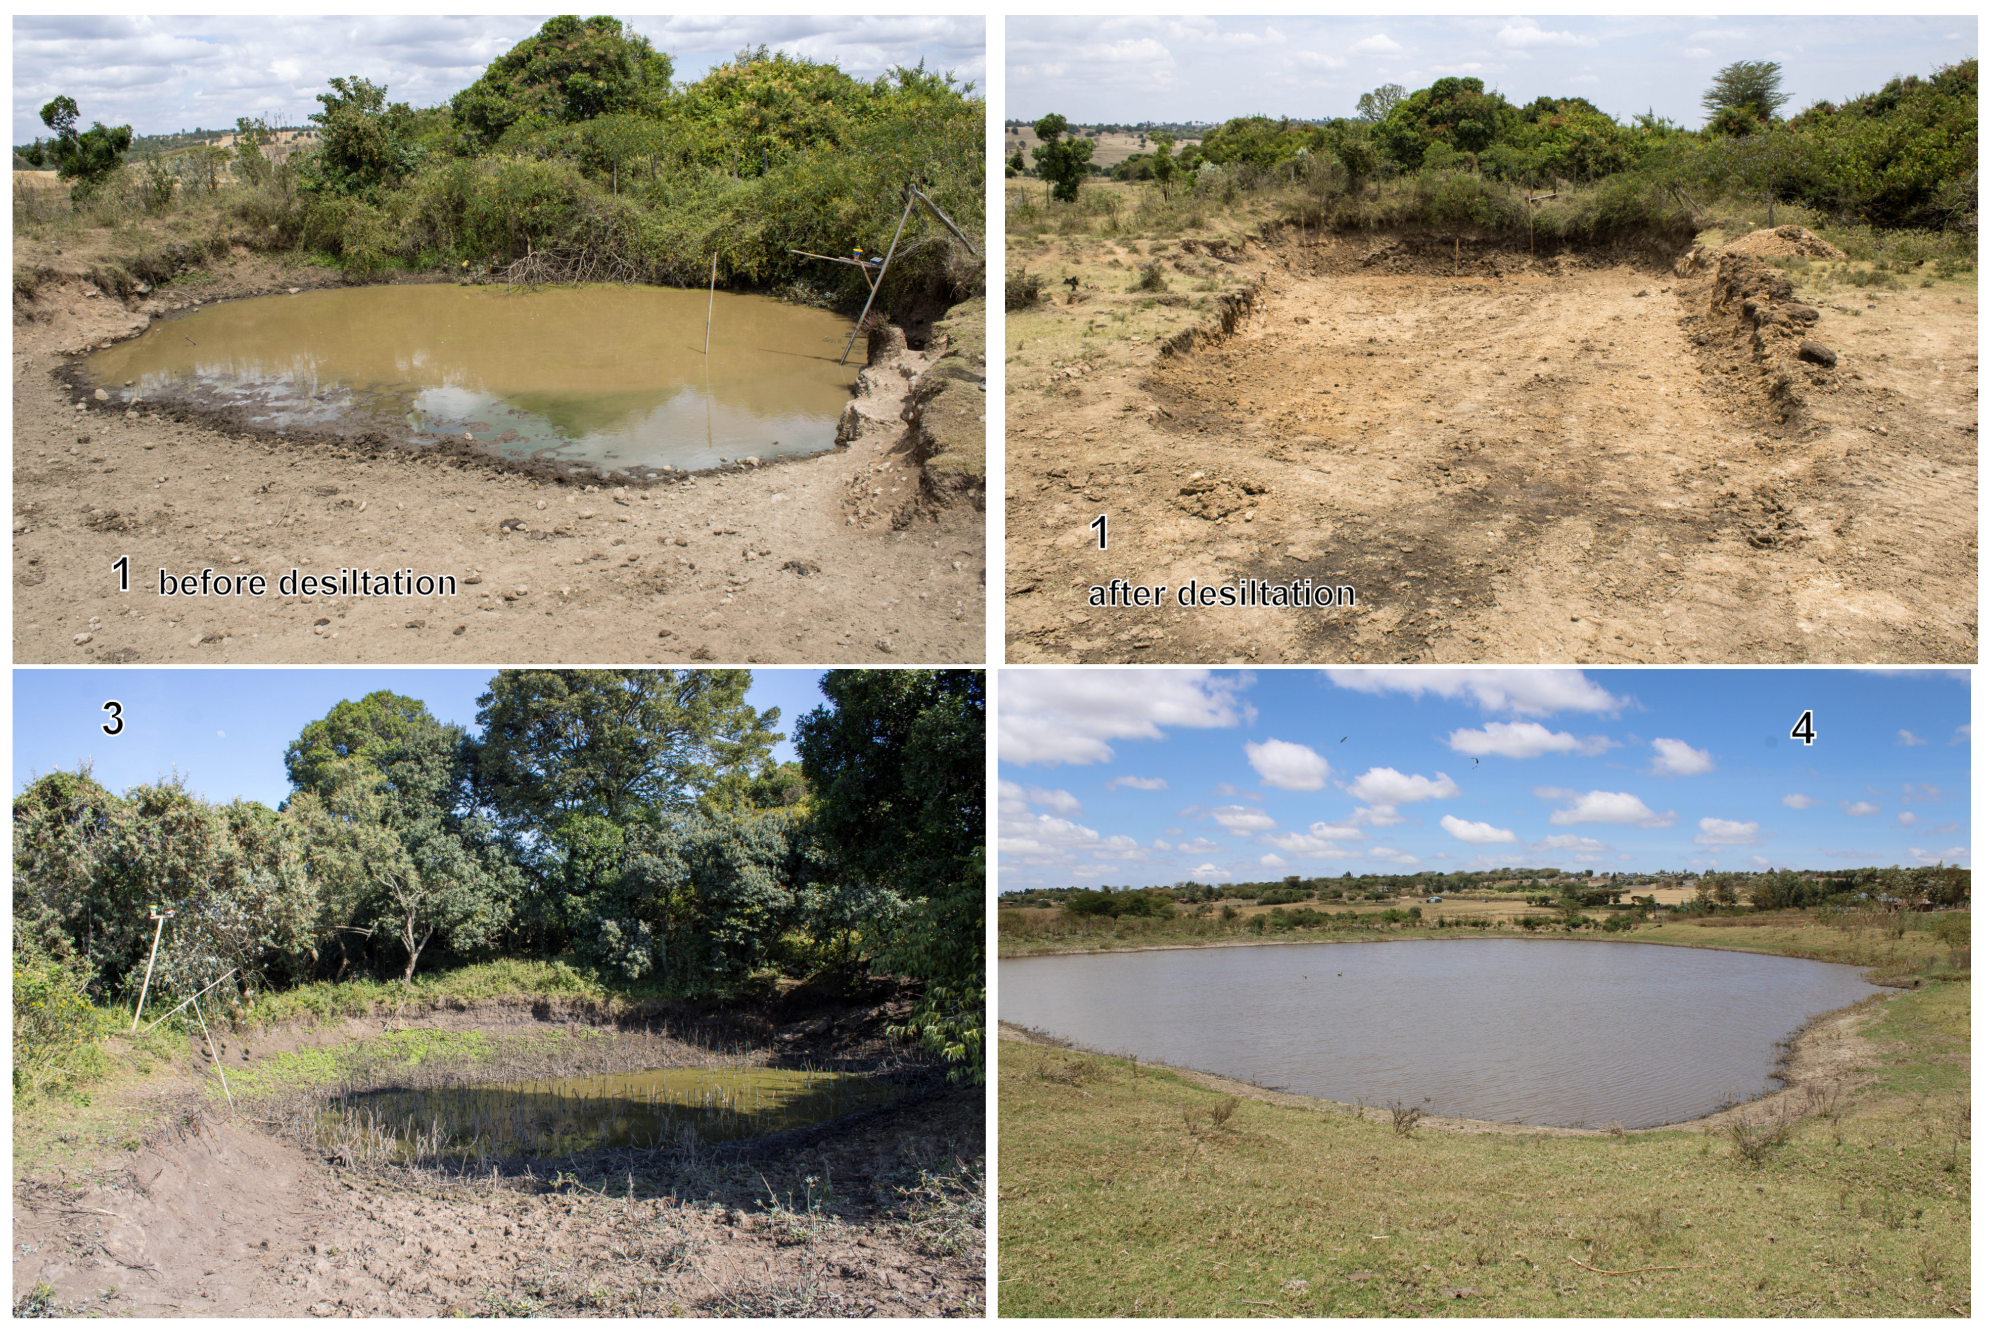
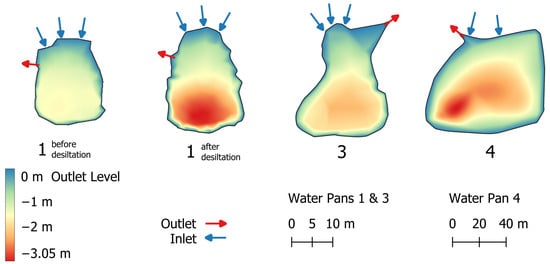
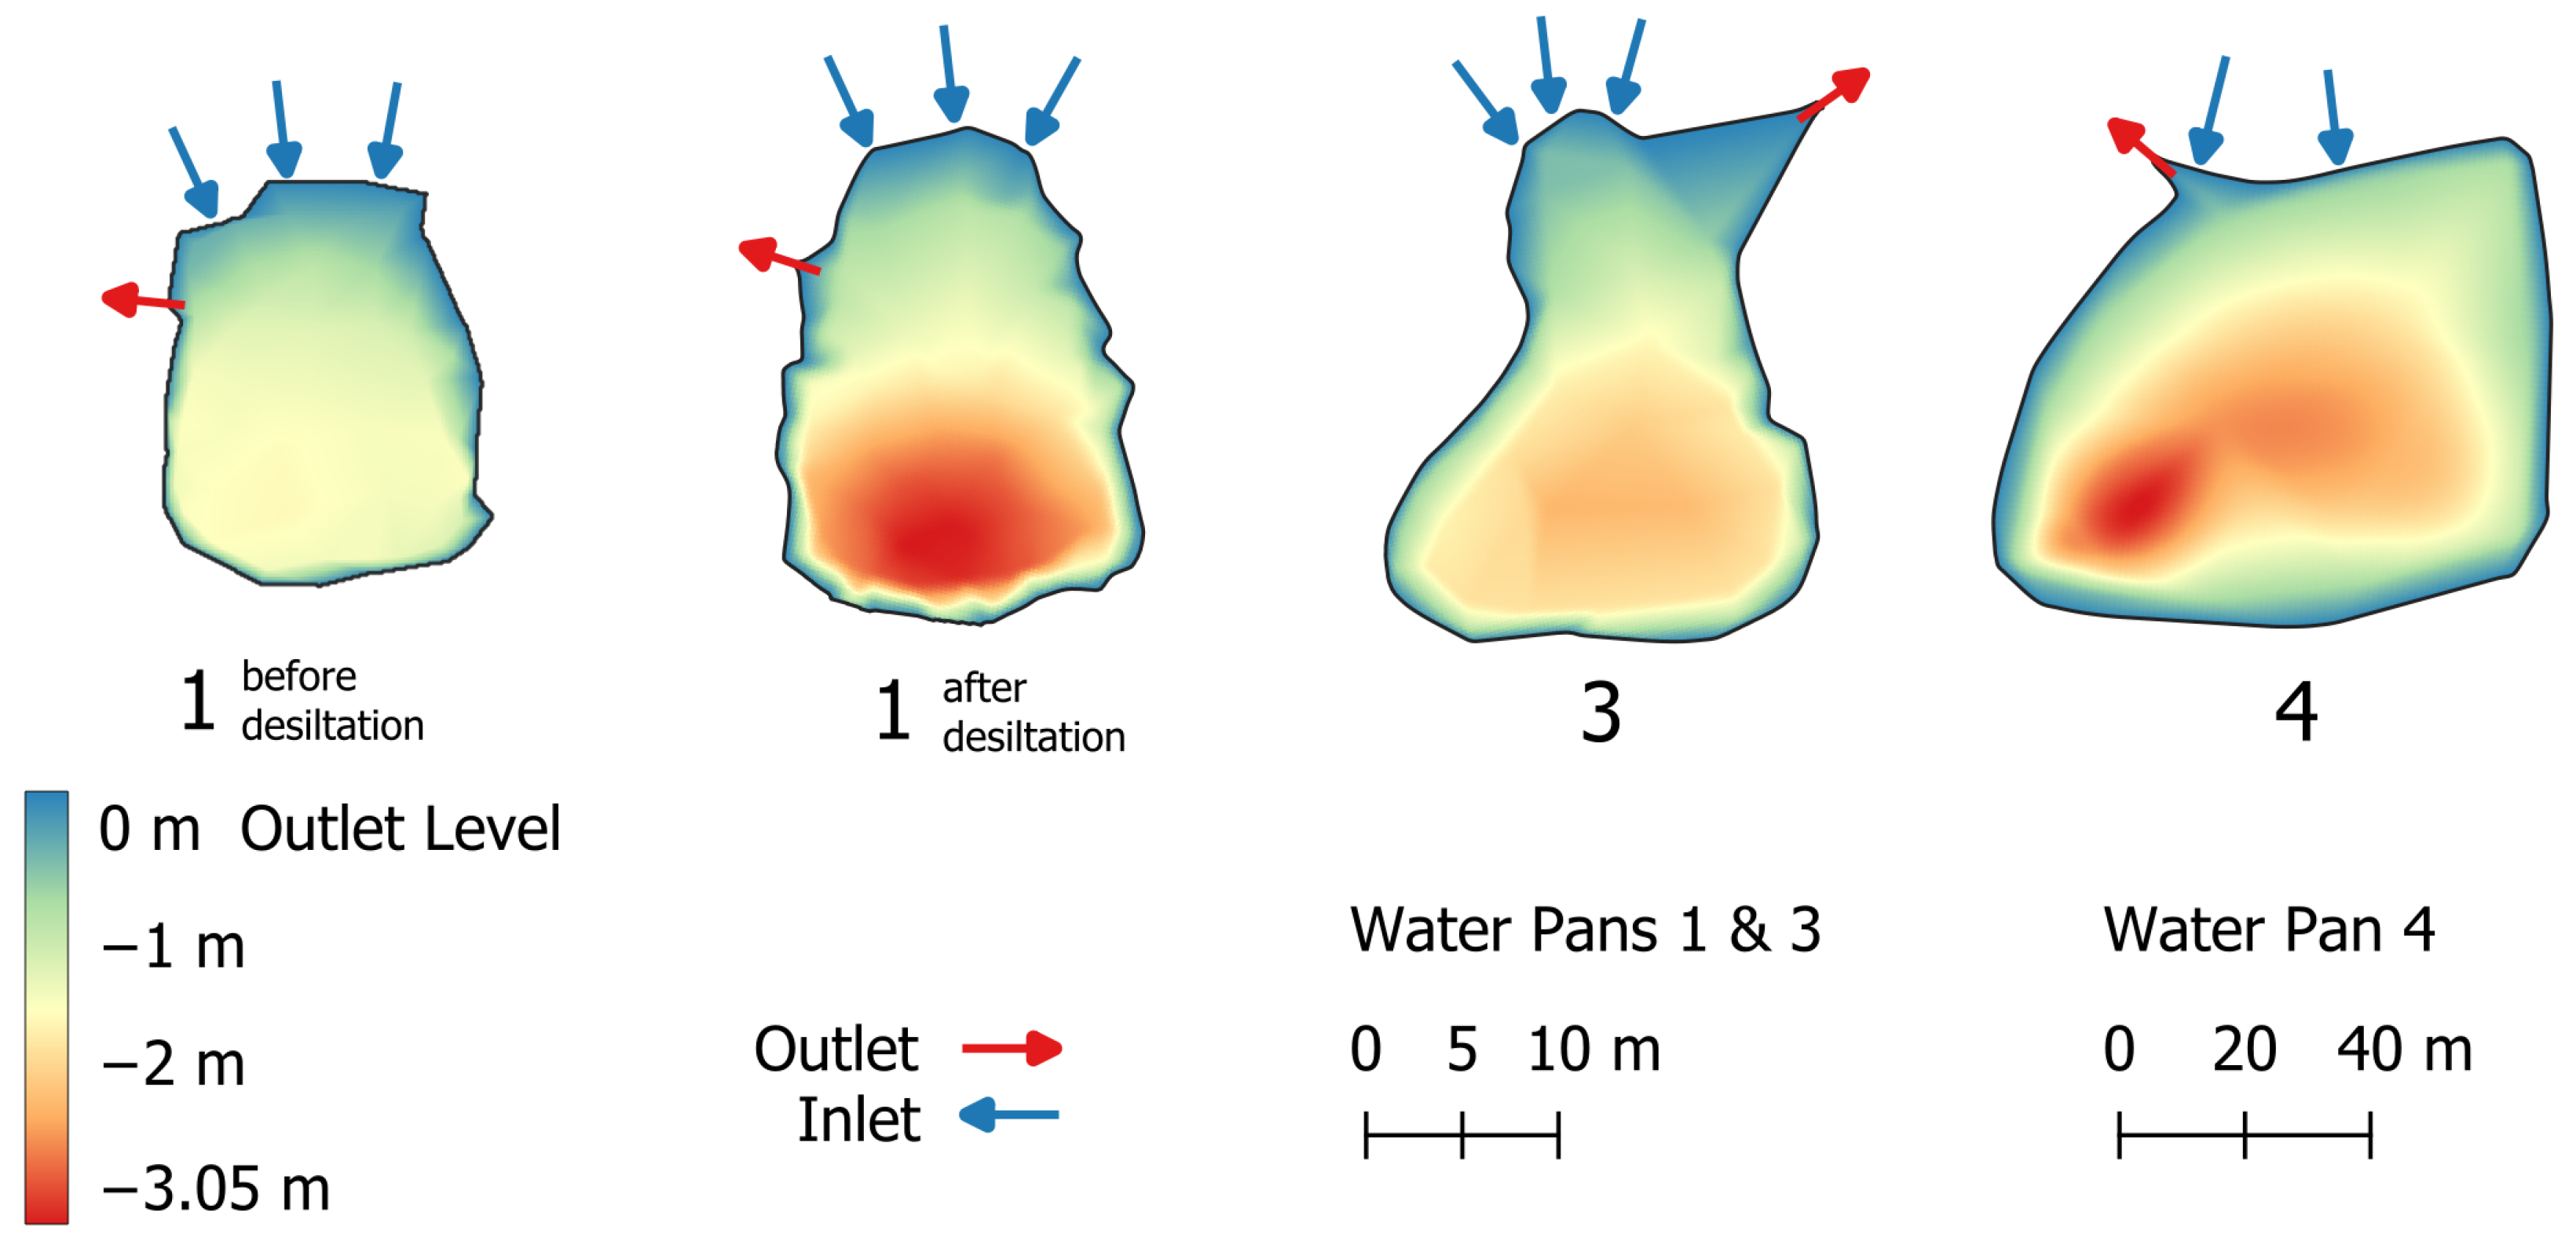
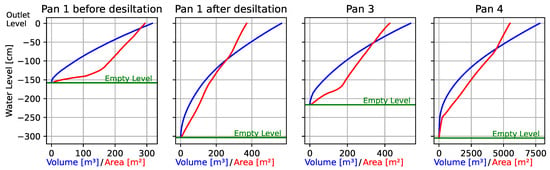
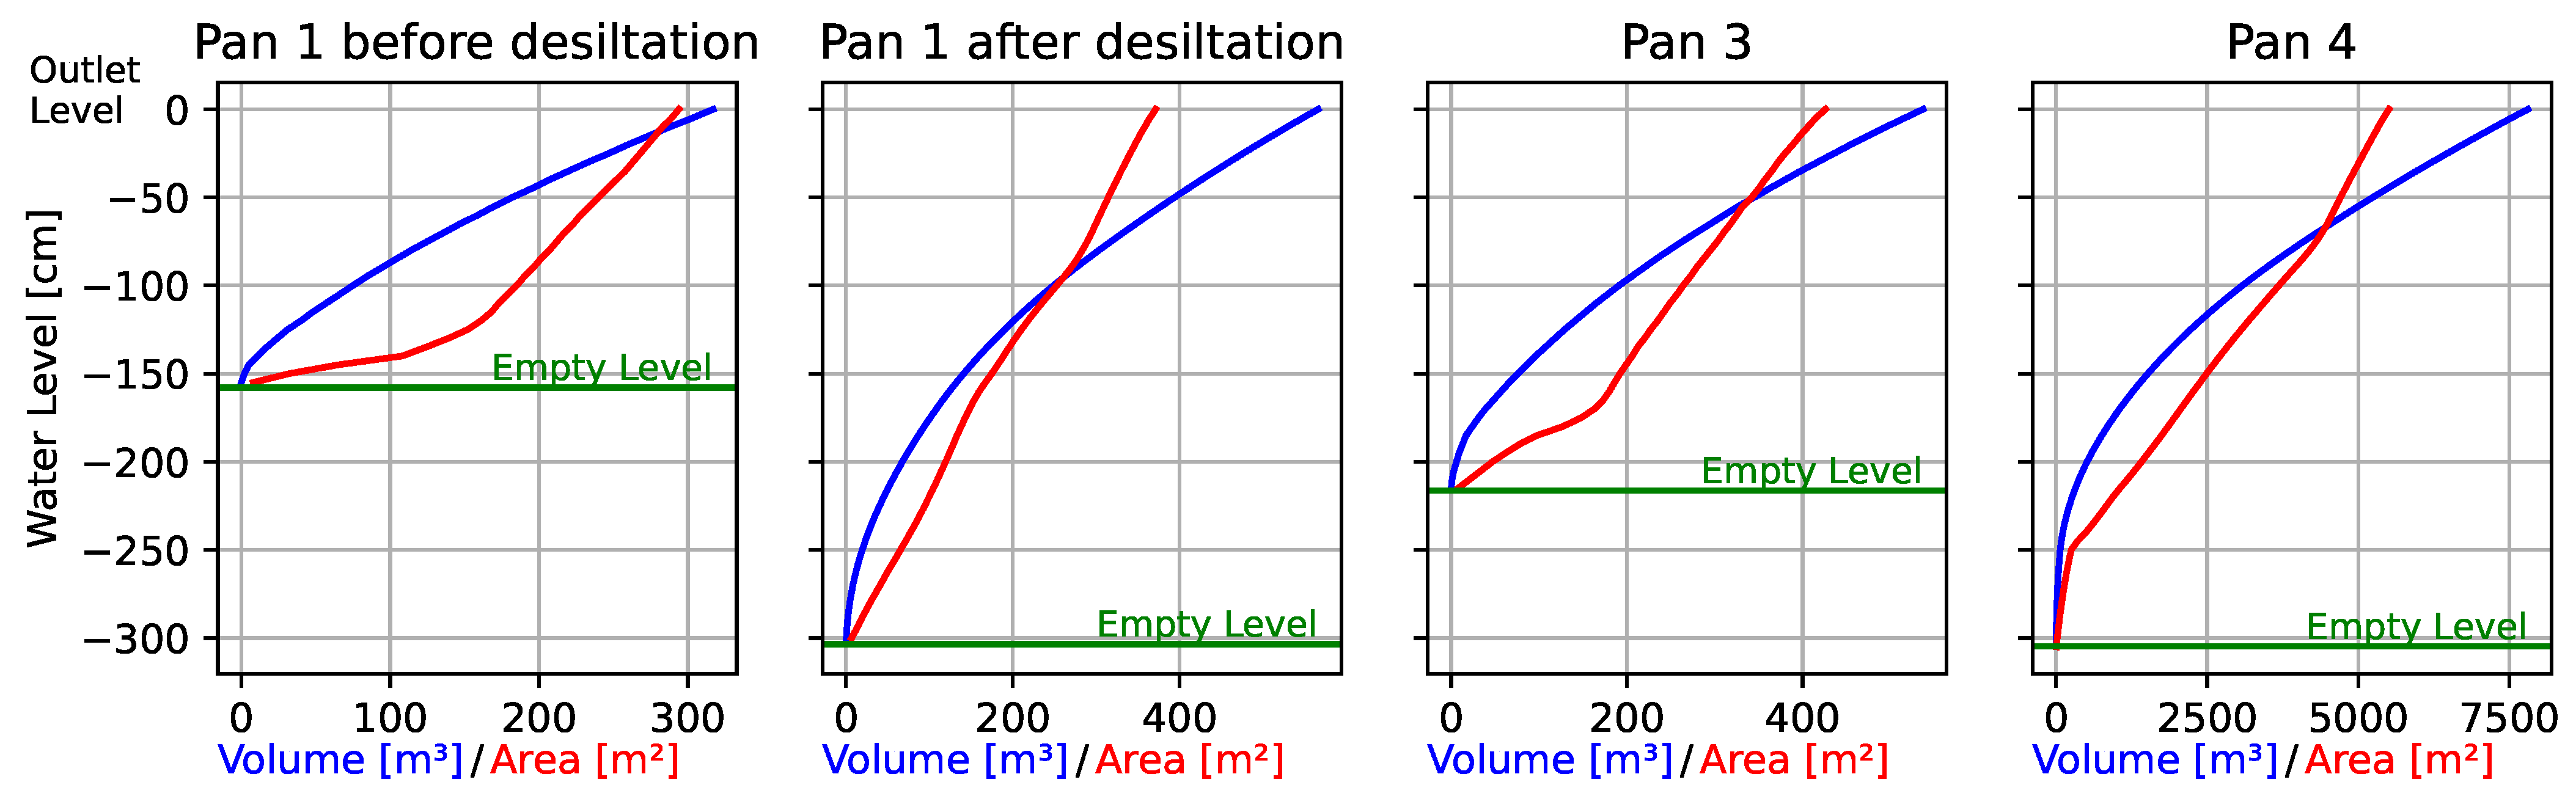
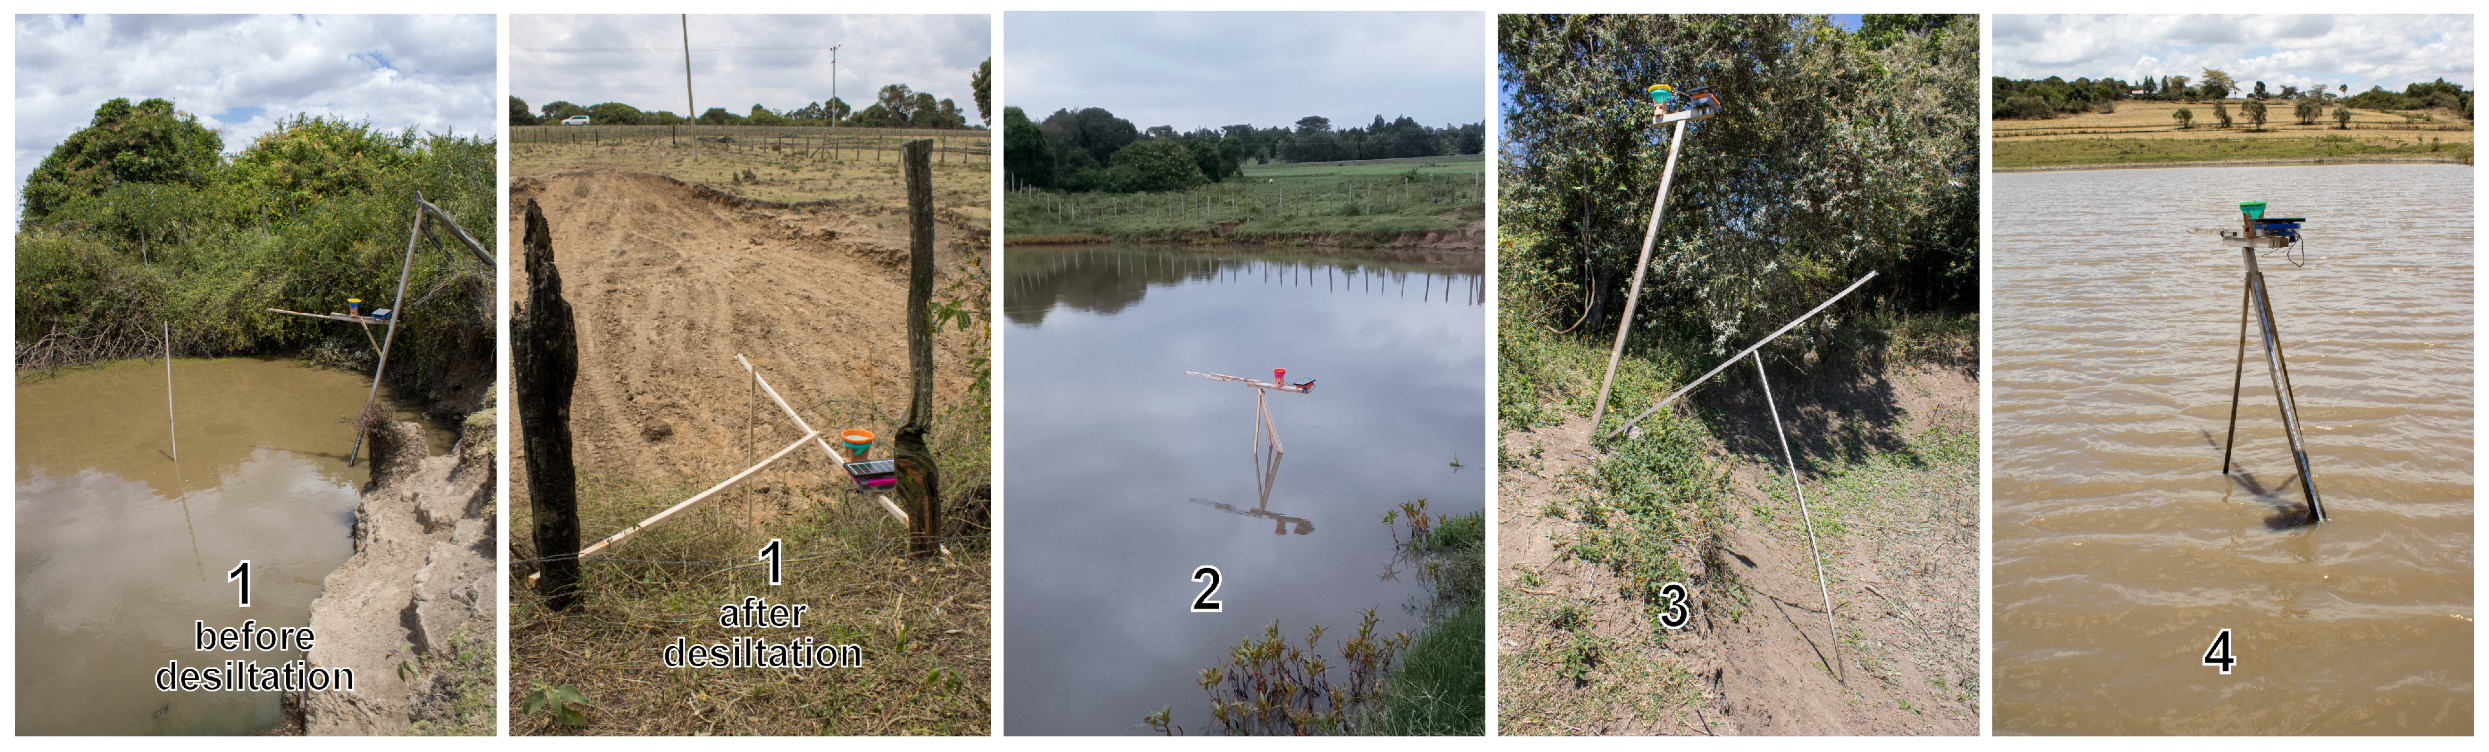
The monitoring station at water pan 2 was stolen shortly after the beginning of the field trial, and data collection there was terminated. Water pan 1 was desilted on 14 October 2025, changing its geometry and soil properties. While water pans 1 (both before and after the desiltation) and 3 are comparable in size and their capacities are at the lower end of typical water pans [2], water pan 4 is significantly bigger, and its capacity exceeds the typical capacity according to Mati et al. [2]. The details on water pans 1, 3 and 4 are provided in Table 1 and Figure 2, Figure 3 and Figure 4.
Table 1.
Parameters of the water pans when filled to the outlet level.
Figure 2.
Photos of the water pans.
Figure 3.
Bathymetric maps of the water pans, derived from geometric surveys outlined in Section 2.3.
Figure 4.
Height-volume-area curves of the water pans, derived from geometric surveys outlined in Section 2.3.
2.2. Monitoring Station
2.2.1. Hardware
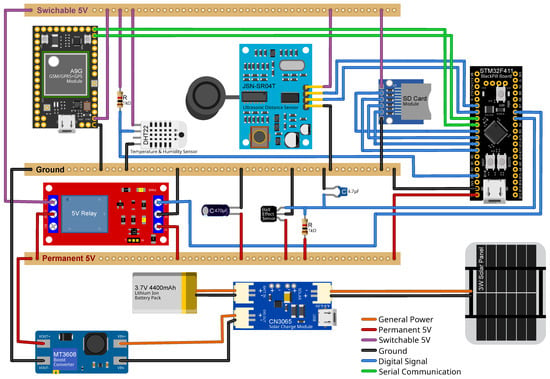
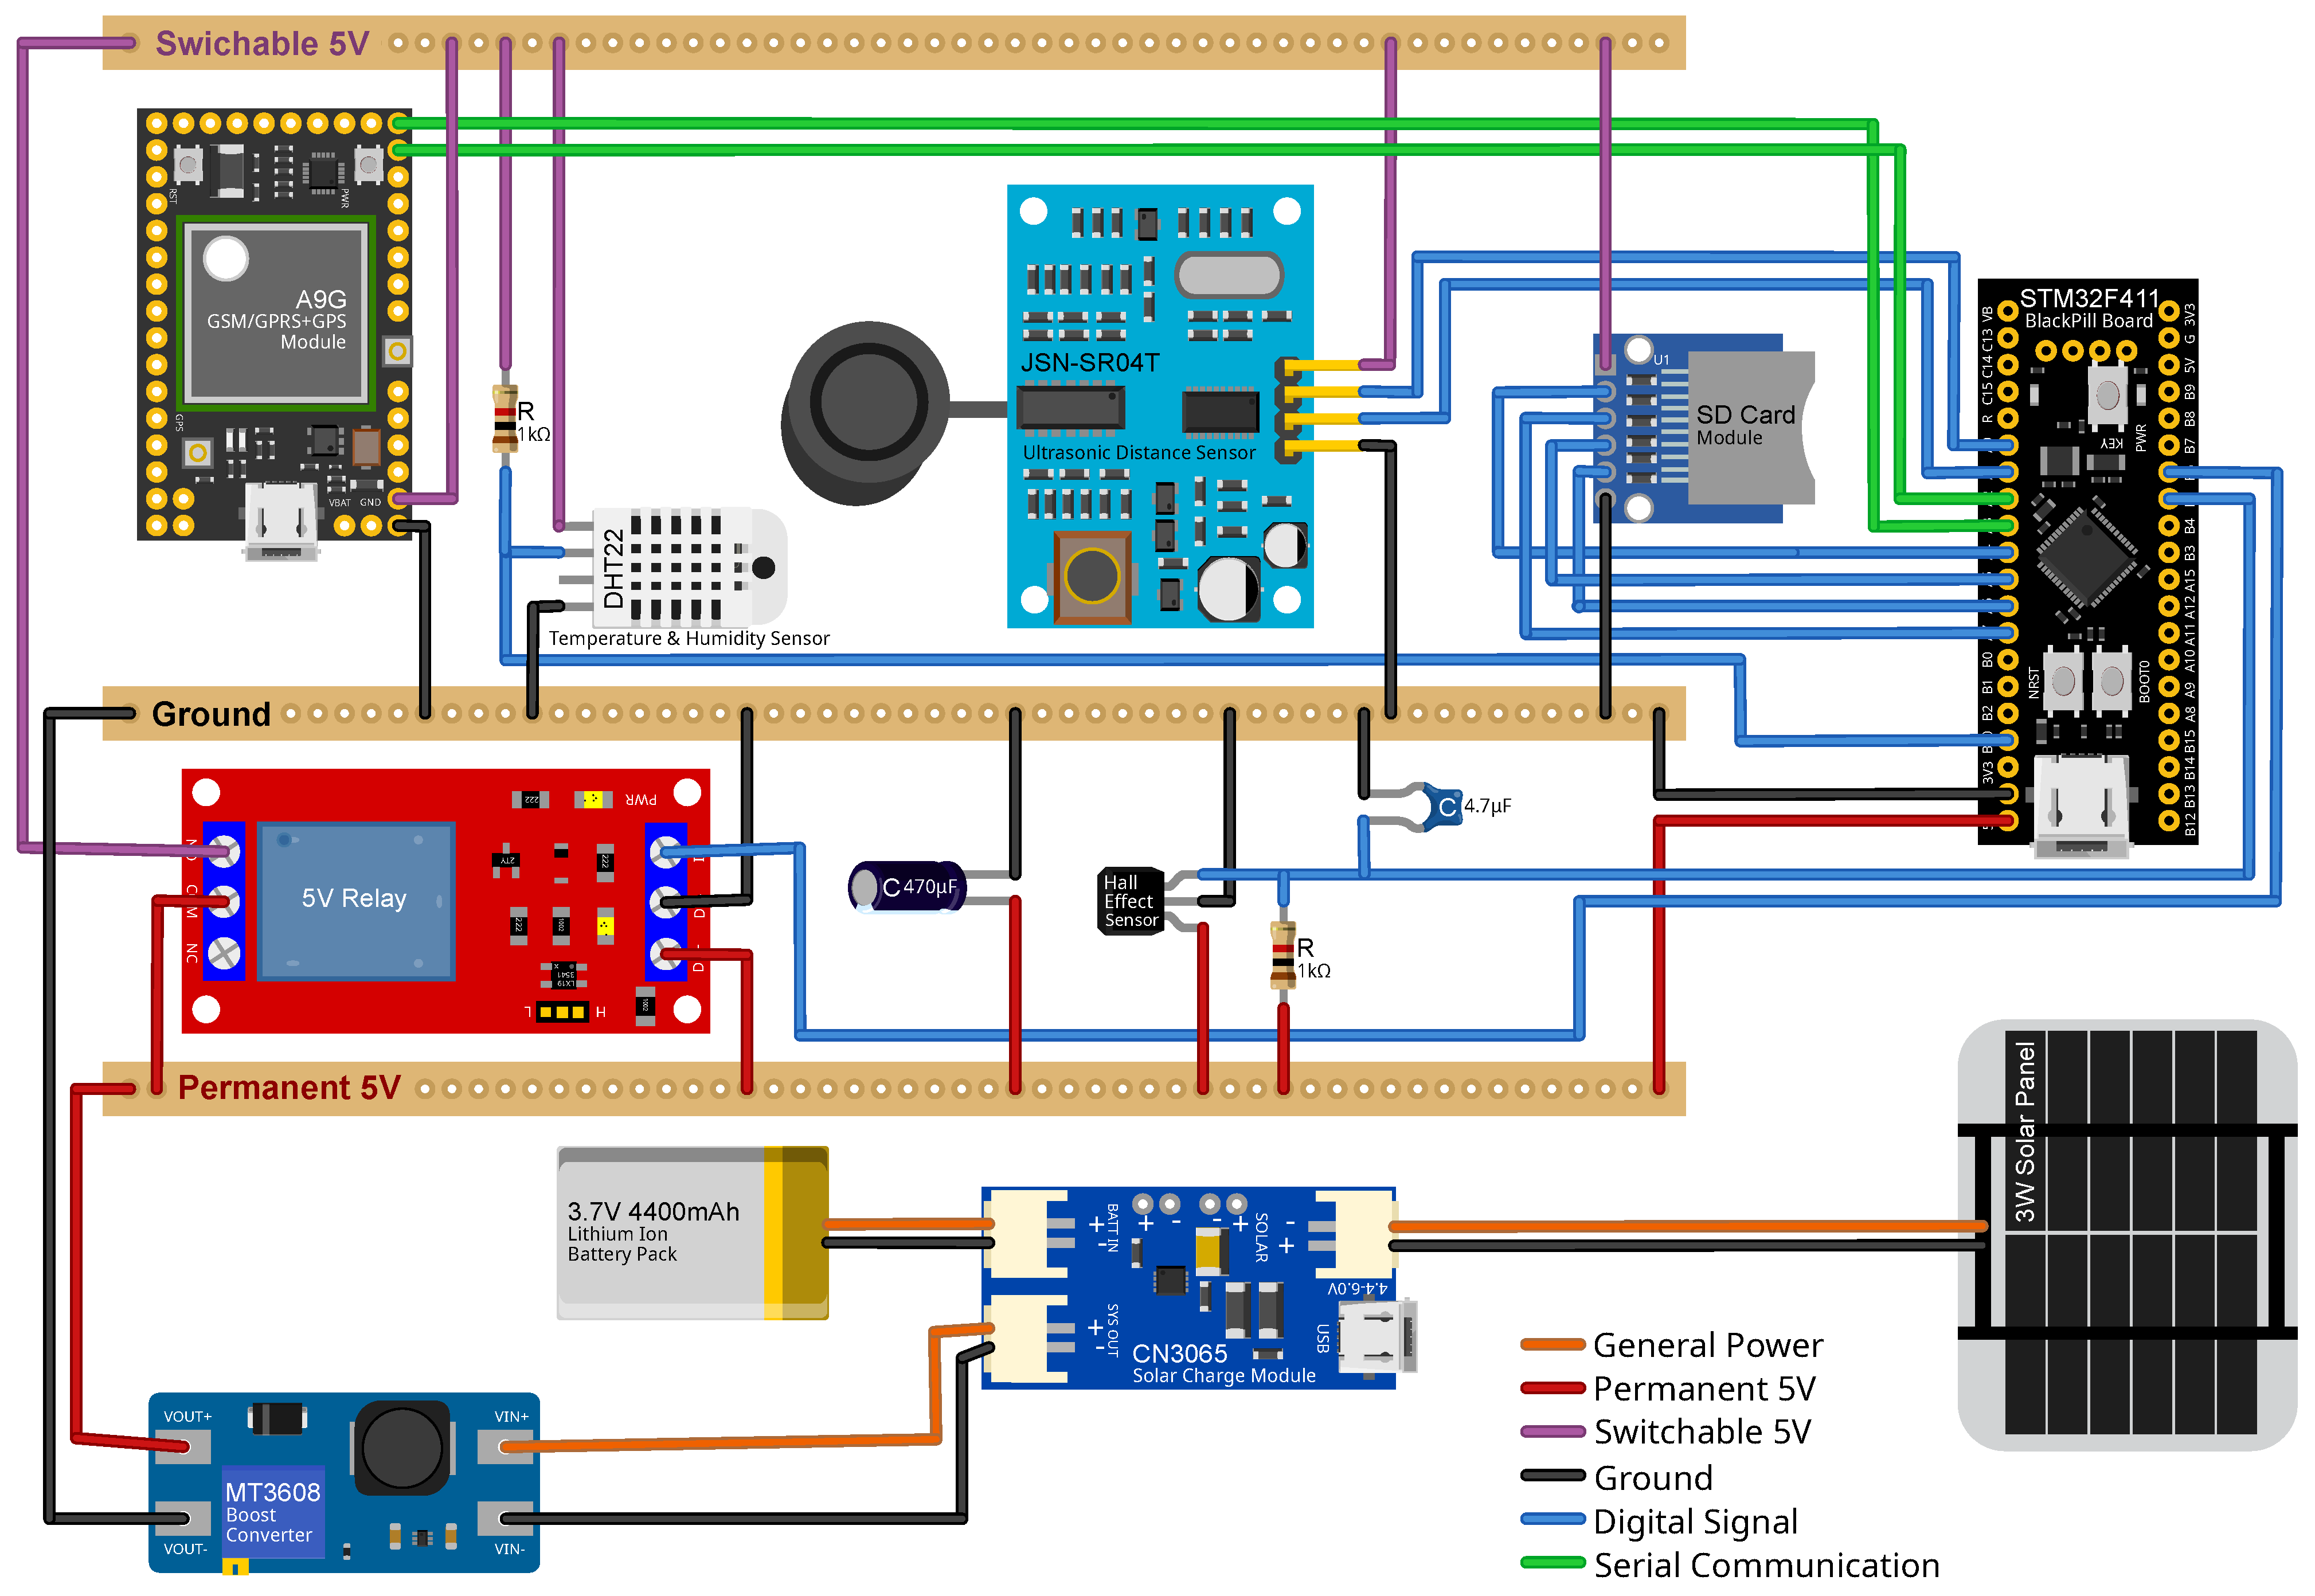
The designed monitoring station is powered by a 3 W commercial solar USB charger. Several solar panels were evaluated during preliminary field tests. Under cloudy conditions, a single day of charging with the W panel provided sufficient battery capacity to operate the station for well over 24 h. It was therefore considered adequate to ensure continuous operation throughout day and night cycles. The panel is connected to a CN3065 solar charge controller (Consonance Electronics, Shanghai, China), coupled with a V, mAh lithium-ion battery pack. The solar charge controller supplies the system with an output voltage of approximately to V, using solar power when available and the battery as an energy buffer during periods without solar input. This voltage is stepped up to a stable V using an MT3608 boost converter (Aerosemi Technology Co., Ltd., Xi’an, China).
System components are interconnected on a solderable breadboard featuring a common ground rail, a permanent V rail, and a switchable V rail. The switchable rail is connected to the permanent rail via a V relay, enabling peripherals to be powered down when not in use and thereby reducing energy consumption in low-power mode. A 470 μF capacitor between the permanent 5 V rail and ground prevents brown-outs when the relay is actuated.
An STM32F411 BlackPill development board (STMicroelectronics International N.V., Amsterdam, The Netherlands) serves as the system controller and is powered by the permanent 5 V rail. Precipitation is measured using a tipping-bucket rain gauge constructed from a plastic funnel fitted with a tea sieve to prevent debris ingress. The funnel is mounted above a 3D-printed tipping bucket housed in a 3D-printed enclosure. The bucket is mounted on a metal screw acting as an axle, with a magnet attached to the bucket and a Hall-effect sensor fixed to the enclosure. Each bucket tip, caused by the accumulation and discharge of rainfall, is detected as a change in the magnetic field. As rainfall events may occur at any time, the Hall-effect sensor is also powered from the permanent 5 V rail.
A DHT22 temperature and humidity sensor (Aosong Electronics Co., Ltd., Guangzhou, China) and a JSN-SR04T ultrasonic distance sensor (Manorshi Electronics Co., Ltd., Xinbei, China) for water level measurements are powered via the switchable 5 V rail. During preliminary testing, time synchronization via both GPS and the mobile network was evaluated, with the latter proving more reliable. Mobile connectivity is also required for data transmission. Tests with a SIM800L V2.0 module showed lower reliability than an A9G GSM/GPRS + GPS module (Ai-Thinker Technology Co., Ltd., Shenzhen, China). Consequently, the A9G module was selected. An SD card module and the A9G module are also powered via the switchable 5 V rail. While most peripherals communicate with the BlackPill controller through digital signals, the A9G module uses serial communication.
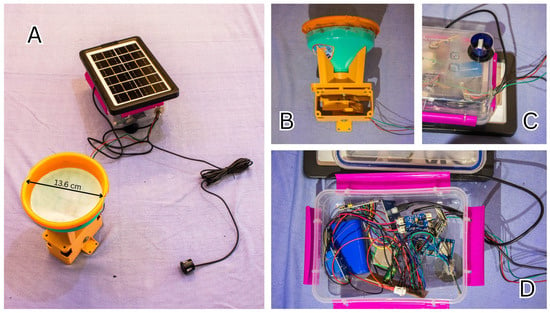
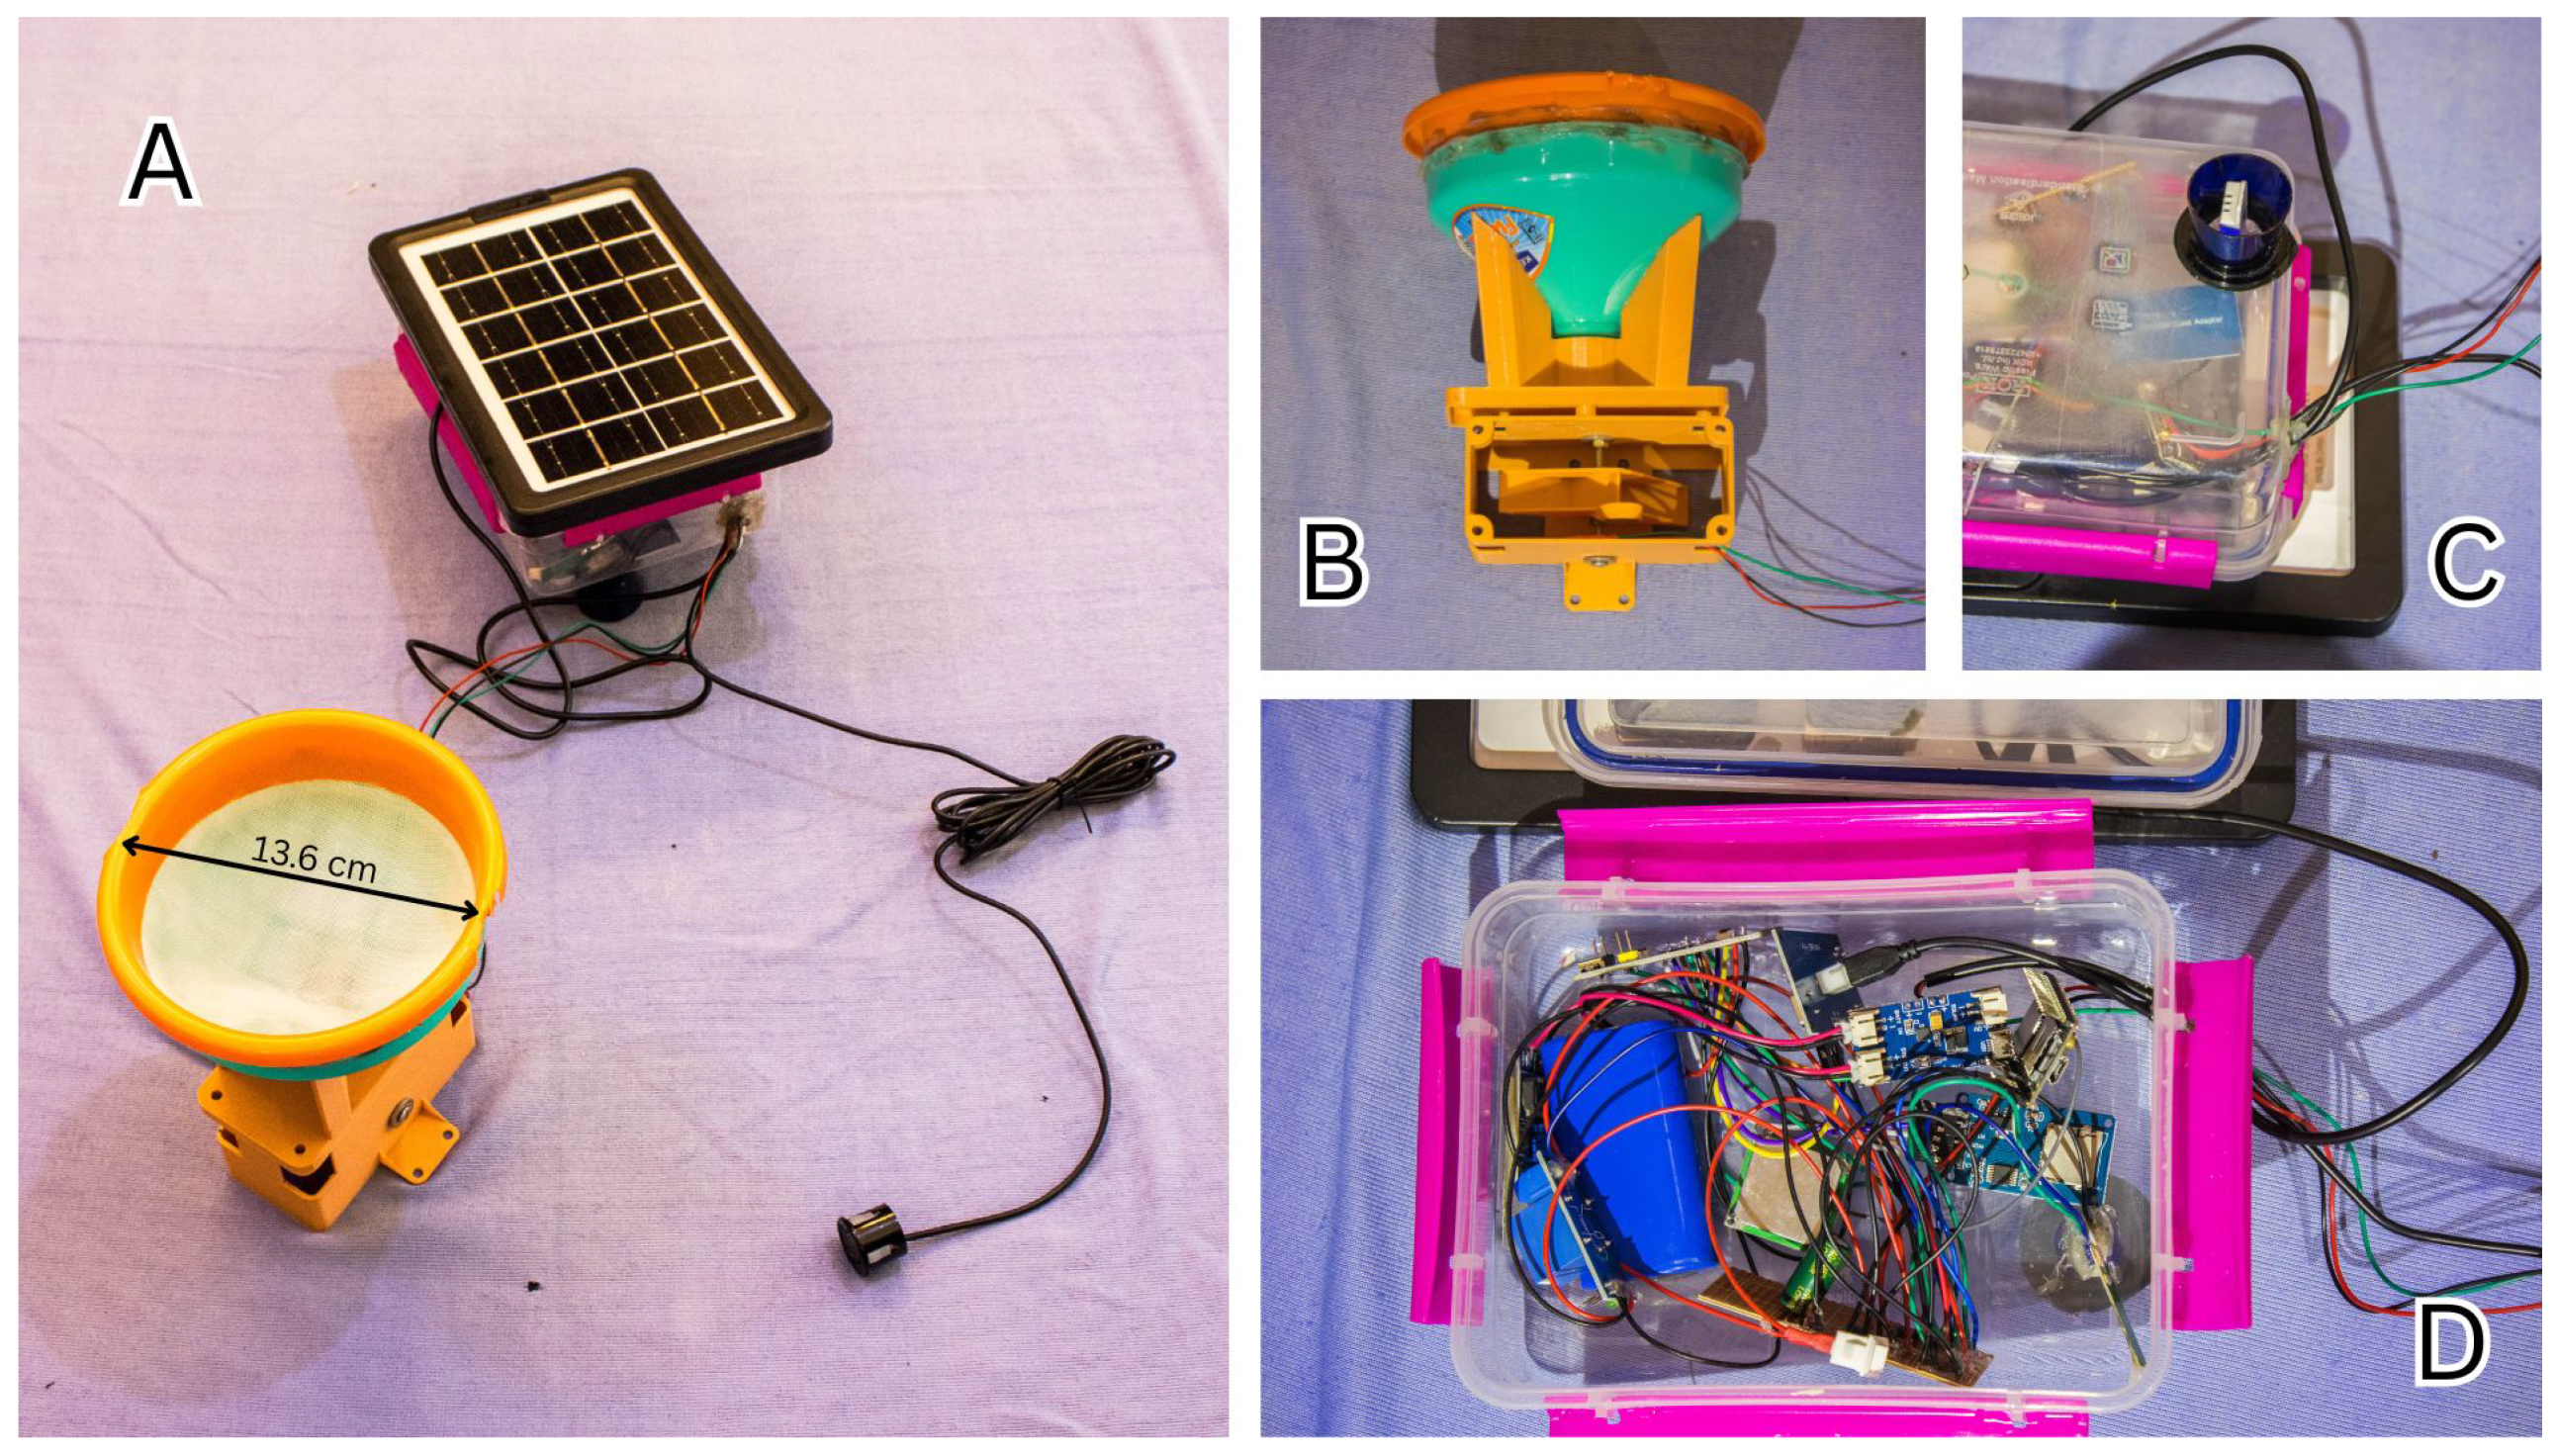
All electronics are housed in a waterproof plastic mm lunch box. A cable feed-through allows selected peripherals to be mounted externally. The solar panel is fixed to the top of the enclosure, providing unobstructed solar exposure while shielding the housing from direct sunlight. The temperature and humidity sensor is mounted on the underside of the enclosure in the shade of the solar panel and protected from rainfall by a glued plastic bottle neck. The rain gauge and ultrasonic sensor are connected via cables and mounted separately on the support structure. The complete hardware setup is illustrated in Figure 5. A list of all components and their costs is provided in Table 2. Photos of the monitoring station are provided in Figure 6.
Figure 5.
Visualization of the monitoring station’s hardware components and their connections. Visualization was created using Fritzing 1.0.6.
Table 2.
List of components of the monitoring station and their costs.
Figure 6.
Photos of the monitoring station: (A) Main enclosure with the solar panel on top, connected to the rain gauge and the ultrasonic transducer. (B) Open housing of the rain gauge. (C) Temperature and humidity sensor mounted on the underside of the main enclosure (D) Components inside the main enclosure.
2.2.2. Software
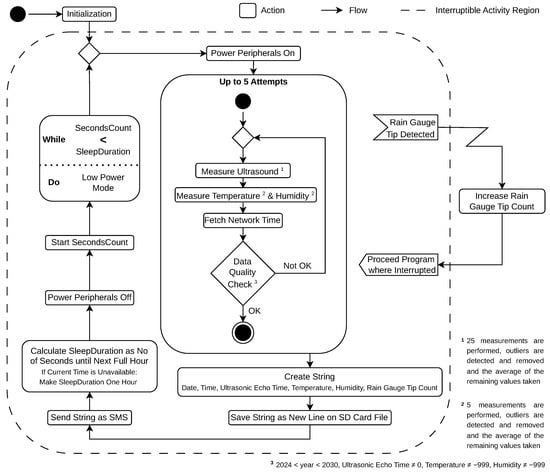
Upon power-up, the station software performs an initialisation sequence and then enters an infinite control loop. At the beginning of each cycle, all switchable peripherals are powered on. The system then attempts, up to five times, to acquire a valid set of values for ultrasonic echo time, temperature, humidity, and network time. Ultrasonic sensing is based on 25 individual echo time measurements taken at varying intervals. The lower quartile , upper quartile and interquartile range are calculated [35]. Values below or above are considered outliers [35] and discarded, and the mean of the remaining measurements is computed. For temperature and humidity, five measurements are acquired per cycle, and the same procedure is used to remove outliers and obtain an average value. Network time is retrieved via AT commands. The obtained values are subsequently checked for error values (). If any error value is identified, the entire acquisition process is repeated, up to a maximum of five attempts.
Once a valid record is obtained, a comma-delimited string containing date, time, ultrasonic echo time, temperature, humidity, and rain gauge tip count is generated and appended as a new line to a .csv file on the SD card. A status flag indicating the success of the SD card write operation is then added. The data string is then transmitted as an SMS.
Based on the current time, the software calculates the number of seconds until the next full hour. The peripherals are then powered down, and the BlackPill controller is placed into a low-power mode for the computed duration. In cases where no valid time and date are available, it goes to low-power mode for one hour. After waking, the control loop restarts.
Rainfall is recorded using an interrupt service routine attached to the Hall-effect sensor of the tipping-bucket rain gauge. Each detected bucket tip triggers an interrupt, increments a counter variable, and then allows the program to resume where it was interrupted. The interrupt remains active while the BlackPill controller is in low-power mode.
The conversion of ultrasonic echo time to distance and water level, as well as rain gauge tip counts to precipitation, is performed during post-processing. This approach provides greater flexibility in data handling and facilitates error detection and correction. The overall software workflow is illustrated in Figure 7.
Figure 7.
UML activity diagram of the monitoring station’s software.
2.2.3. Calibration and Validation
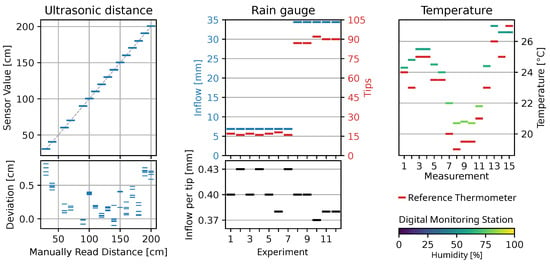
According to the data sheet [36], the JSN-SR04T ultrasonic distance sensor has an accuracy of 1 cm. A validation was performed by mounting a probe at different heights, measured using a meter tape, above the floor and comparing sensor and manual values. The software used in the validation was the same as that in the field conditions, where one value is obtained from 25 individual measurements, outliers are automatically removed, and the average is calculated. At least four readings were taken per height level. Throughout all measurements, a bias of cm and an RMSE of cm were obtained. The maximum standard deviation of all sensor readings within one height level was cm. The values obtained in the validation were better than the bias of cm and RMSE of cm reported by Kumar et al. [37].
The rain gauge was calibrated by measuring volumes of water with a measuring cup and pouring them into the rain gauge. A total of 12 calibration trials were conducted, using water volumes of either mL or mL. With a circular inlet with a diameter of cm, mL inflow corresponds to mm of precipitation. To simulate the slow flow of real rain, this was done through a cup with a small hole which dropped into the rain gauge. The tips triggered by the known water inflow were counted, which resulted in an average inflow per tip of mm. The standard deviation of the inflow per tip obtained in the 12 experiments was mm.
According to the data sheet [38], the DHT22 sensor has a temperature accuracy of 0.5 °C. For validation, the station was placed in a shaded outside area, next to a calibrated manual thermometer, and readings were taken every two hours for 30 h. While the DHT22 provides readings at a resolution of C, the reference thermometer only allowed readings at a resolution of C. The results show a bias of C and an RMSE of C, which is significant even at the reference thermometer resolution C. A review of studies quantifying the error of the DHT22 sensor conducted by Abdinoor et al. [39] found that C, equal to the bias identified here, was the highest error reported in literature.
The humidity accuracy of the DHT22 as per data sheet [38] is . As the humidity is less significant than the other parameters and no suitable equipment was available, no calibration or validation was performed. The results of all calibration and validation experiments are plotted in Figure 8.
Figure 8.
Results of the calibration and validation experiments.
2.3. System Deployment and Field Trial
Preliminary tests with a single monitoring station prototype were conducted between March and May 2025 at a pond at the Jomo Kenyatta University of Agriculture and Technology (JKUAT) campus in Juja.
Preliminary assessment of mobile network coverage at the water pan sites using a conventional mobile phone suggested adequate connectivity. Nonetheless, some installed stations experienced weaker-than-expected signals, likely owing to their low positions within the water pan basins. As this field trial focuses on the performance of the equipment in the field, data transmission was implemented via SMS as a simple and robust solution that does not require additional infrastructure such as a broker or database.
The stations for the field trial were deployed at the selected water pans in the last week of May 2025, at the end of the long-rain season. At the time of installation, all pans were close to full capacity.
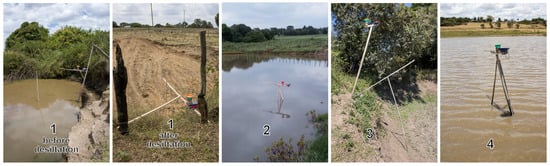
Wooden support structures were constructed to mount the stations above the water surface. Metre tapes were attached to the structures to enable daily manual readings of the water level. At water pans 2 and 4, tripod-like structures were installed directly within the pans. At water pan 1, an existing fence adjacent to the pan was used to support a boom extending over the water. It was removed before the desiltation on 14 October 25, and a new boom was installed afterwards. Due to weaker-than-expected mobile network coverage at water pan 3, the station was installed on a wooden post at a nearby elevated location, with only the ultrasonic transducer suspended over the water on a boom. Photographs of the different support structures are shown in Figure 9.
Figure 9.
Photos of the support structures used to mount the monitoring stations.
Shortly after installation, the weather station at water pan 2 was stolen. To avoid repeated theft, the station was not replaced, and data collection at this site was terminated. Consequently, no results from water pan 2 are presented in this study. During the monitoring period, water pans 1 and 3 dried out completely. Water pan 1 was later refilled following rainfall, whereas water pan 3 remained dry until the end of data collection at the end of November 2025. By that time, water pans 1 and 4 contained low water volumes.
Water pan owners were tasked with noting the daily water levels manually. Manual rain gauges were used to collect and measure the precipitation on a daily basis.
Geometric surveys were conducted on 23 September (before desiltation) and 20 October (after desiltation) at water pan 1, on 22 September at water pan 3, and on 23 September at water pan 4. As stations 1 (both before and after desiltation) and 3 remained in place, their measurements were referenced to the outlet height during the surveying. The results of the surveys are provided in Figure 3 and Figure 4. At station 4, declining water levels required several repositionings of the station. In these cases, measurements taken immediately before and after relocation were used to quantify and correct for the resulting offsets.
2.4. Data Processing
A set of Python 3.13.0 scripts was developed to convert raw measurements from the monitoring stations into structured and analysable datasets. The raw data comprises .csv files from the SD cards, each covering the period between two successive data offloads. In addition, measurements transmitted via SMS are converted into .csv format, with each SMS corresponding to a single line. Under normal operation, measurements are taken at full-hour intervals. Most observations are available from both the SD card and SMS transmission. As discussed in Section 3.1, failures in SMS transmission and/or SD card logging occasionally occurred, resulting in unequal datasets.
In some cases (discussed in Section 3.1), date and time synchronization failed, resulting in records with the year recorded as 2017 or 0000. These timestamps are corrected by interpolating from neighbouring valid measurements. Subsequently, all files for each station are merged and sorted chronologically. Erroneous temperature and humidity records, appearing as either °C/%, C/0% or °C/100% are automatically removed. Temperature readings above C and other implausible values at station 1 (discussed in Section 3.2.3) are also discarded. The ultrasonic echo time t (in μs) is then converted into a distance d (in cm) between the ultrasonic transducer and the water level, using Equation (1) which accounts for the effects of the temperature (in °C) [40].
If temperature measurements are unavailable, bias-corrected values from the TAHMO station are used instead. For most of the field trial, water levels changed only gradually, rendering hourly differences negligible. Accordingly, most distance measurements closely follow a discernible trend line, where more than 98% of consecutive hourly measurements differ by less than 1%. Some measurements, however, deviate substantially from the trend line, typically exhibiting lower distance values (meaning higher water levels). Instances of unusually high distance readings are extremely rare. The frequency of outliers varies considerably between months and across stations. Outliers are identified using a moving window of ±15 observations [41]. Within each window, the 50th and 95th percentiles are calculated, and the trimmed mean and standard deviation derived from values within this range [42]. The asymmetric percentiles correspond to the observation that outliers are asymmetric. Observations deviating from this mean by more than five standard deviations are discarded [43]. The window size, percentile thresholds, and standard deviation factor were determined empirically to optimize the performance of the outlier detection procedure. The method performs reliably under stable system conditions. However, expert judgement was applied near data gaps, during repositioning of station 4 (discussed in Section 2.3), during rapid rainfall-induced water level changes, and during a sensor malfunction at station 1 (discussed in Section 3.2.1). The remaining distance values are combined with results from the geometric survey to derive water levels. Rain gauge tip counts are converted into precipitation using the calibration results described in Section 2.2.3.
Finally, the predominantly hourly measurements are aggregated to daily values: water level, temperature, and humidity are averaged, while precipitation is summed. The resulting daily dataset undergoes an additional manual quality check, as missing values occasionally lead to artefacts during temporal aggregation.
3. Results and Discussion
3.1. Operational Reliability
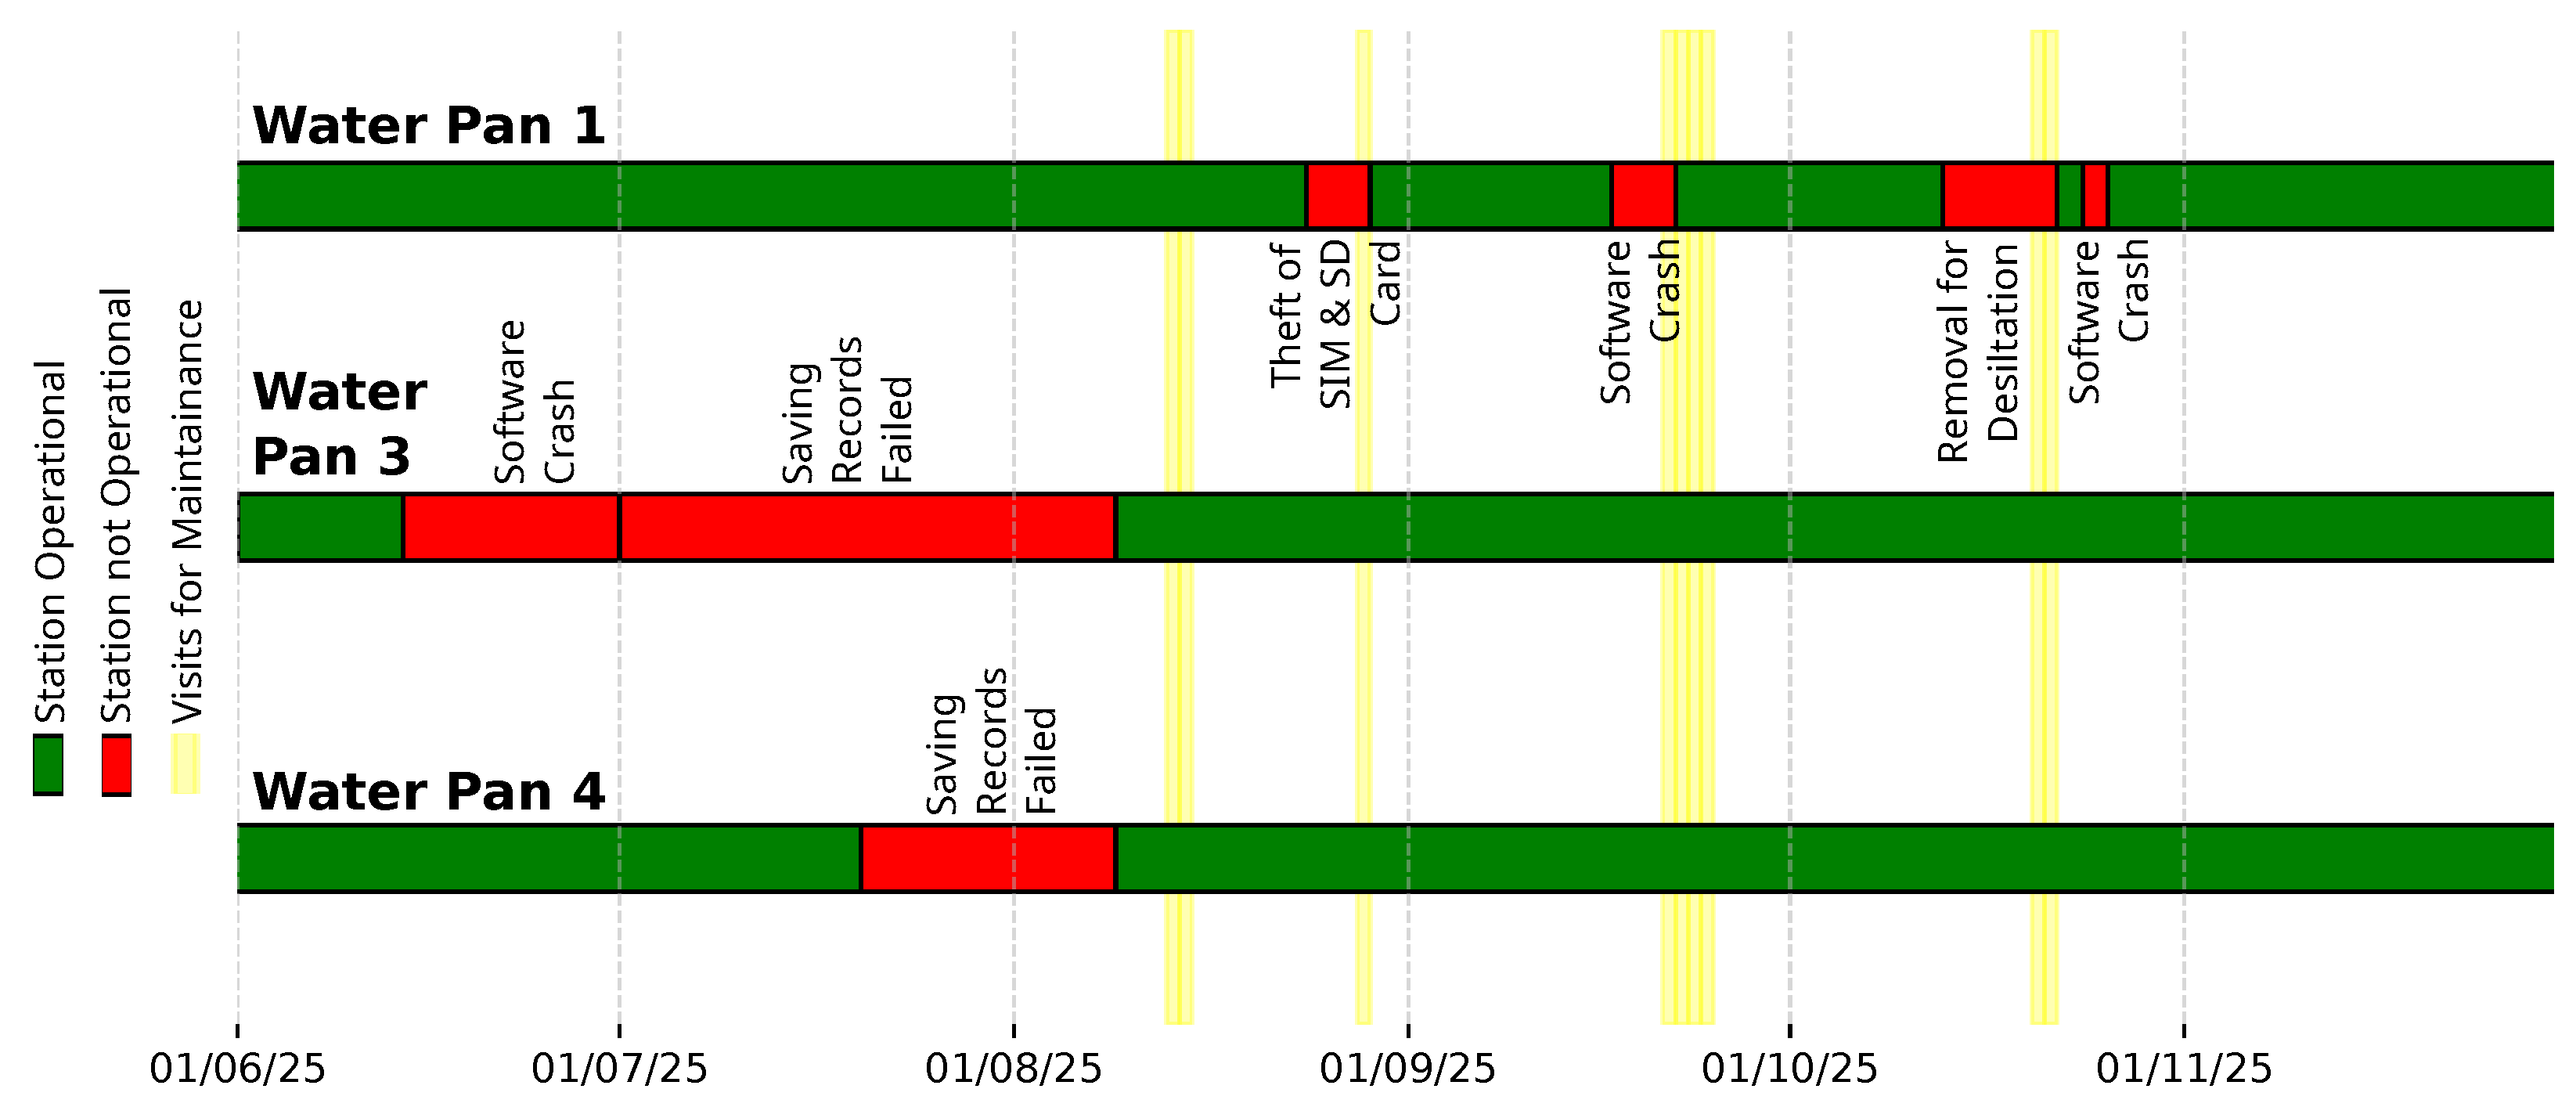
The monitoring stations were operational for of the 183-day field trial period. Station 1 was operational for 163 days (), station 3 for 127 days (), and station 4 for 163 days (). Several issues caused temporary outages.
In three instances ( station 1 & station 3), stations stopped functioning without any identifiable fault. Restarting the systems restored normal operation, suggesting software crashes as the cause. Two of these incidents (both at station 1) occurred during severe weather. A more detailed analysis of system behaviour during such events is required to identify the exact mechanism responsible for these failures.
Data logging to the SD card failed once the log file exceeded a certain size after prolonged operation. This occurred twice: after 56 days ( KB) at station 4 and after 21 days ( KB) at station 3. Under normal operation, data is stored redundantly on the SD card and transmitted via SMS. In both cases, SMS transmission functioned correctly, but the messages were not saved by the receiver due to a configuration error. After this, the receiver configuration was corrected, and the frequency of maintenance visits increased to regularly offload SD card data and operate the stations with smaller files. This problem could be solved by ensuring that a new file is created every week.
In one incident, Station 1 was opened by an unauthorized individual, and the SD and SIM cards were removed while the hardware remained intact. Consequently, no data were recorded until the cards were replaced. Together with the theft of Station 2, this highlights the importance of ensuring the security of equipment in the field. As several components must remain exposed (e.g., solar panel, ultrasonic transducer, rain gauge), opportunities for concealment are limited. For larger water pans, installing the equipment at the centre of the pan may provide natural protection through restricted accessibility. However, the individual responsible for both cases of unauthorized interference was identified and held accountable by the local water pan users, preventing further incidents. This suggests that close collaboration with water pan users through a participatory approach is likely the most effective strategy for safeguarding the equipment, as direct benefits from the system create strong incentives for its protection.
At water pan 1, the station was temporarily removed to allow desilting and extension works while the pan was dry.
At water pan 4, the station had to be repositioned progressively as the water level declined. Because the support structure also holds the manual gauge, it needed to remain close to the shore for readability while still standing in the water to measure the level. As the station was moved deeper into the basin, mobile network reception weakened. In October and November, SMS transmission largely failed, although data continued to be recorded correctly on the SD card. In many cases, date and time synchronisation failed. During post-processing, incorrect timestamps had to be identified and corrected.
The operational status timelines for all monitoring stations are provided in Figure 10.
Figure 10.
Operational status timeline of the monitoring stations.
3.2. Measurement Performance
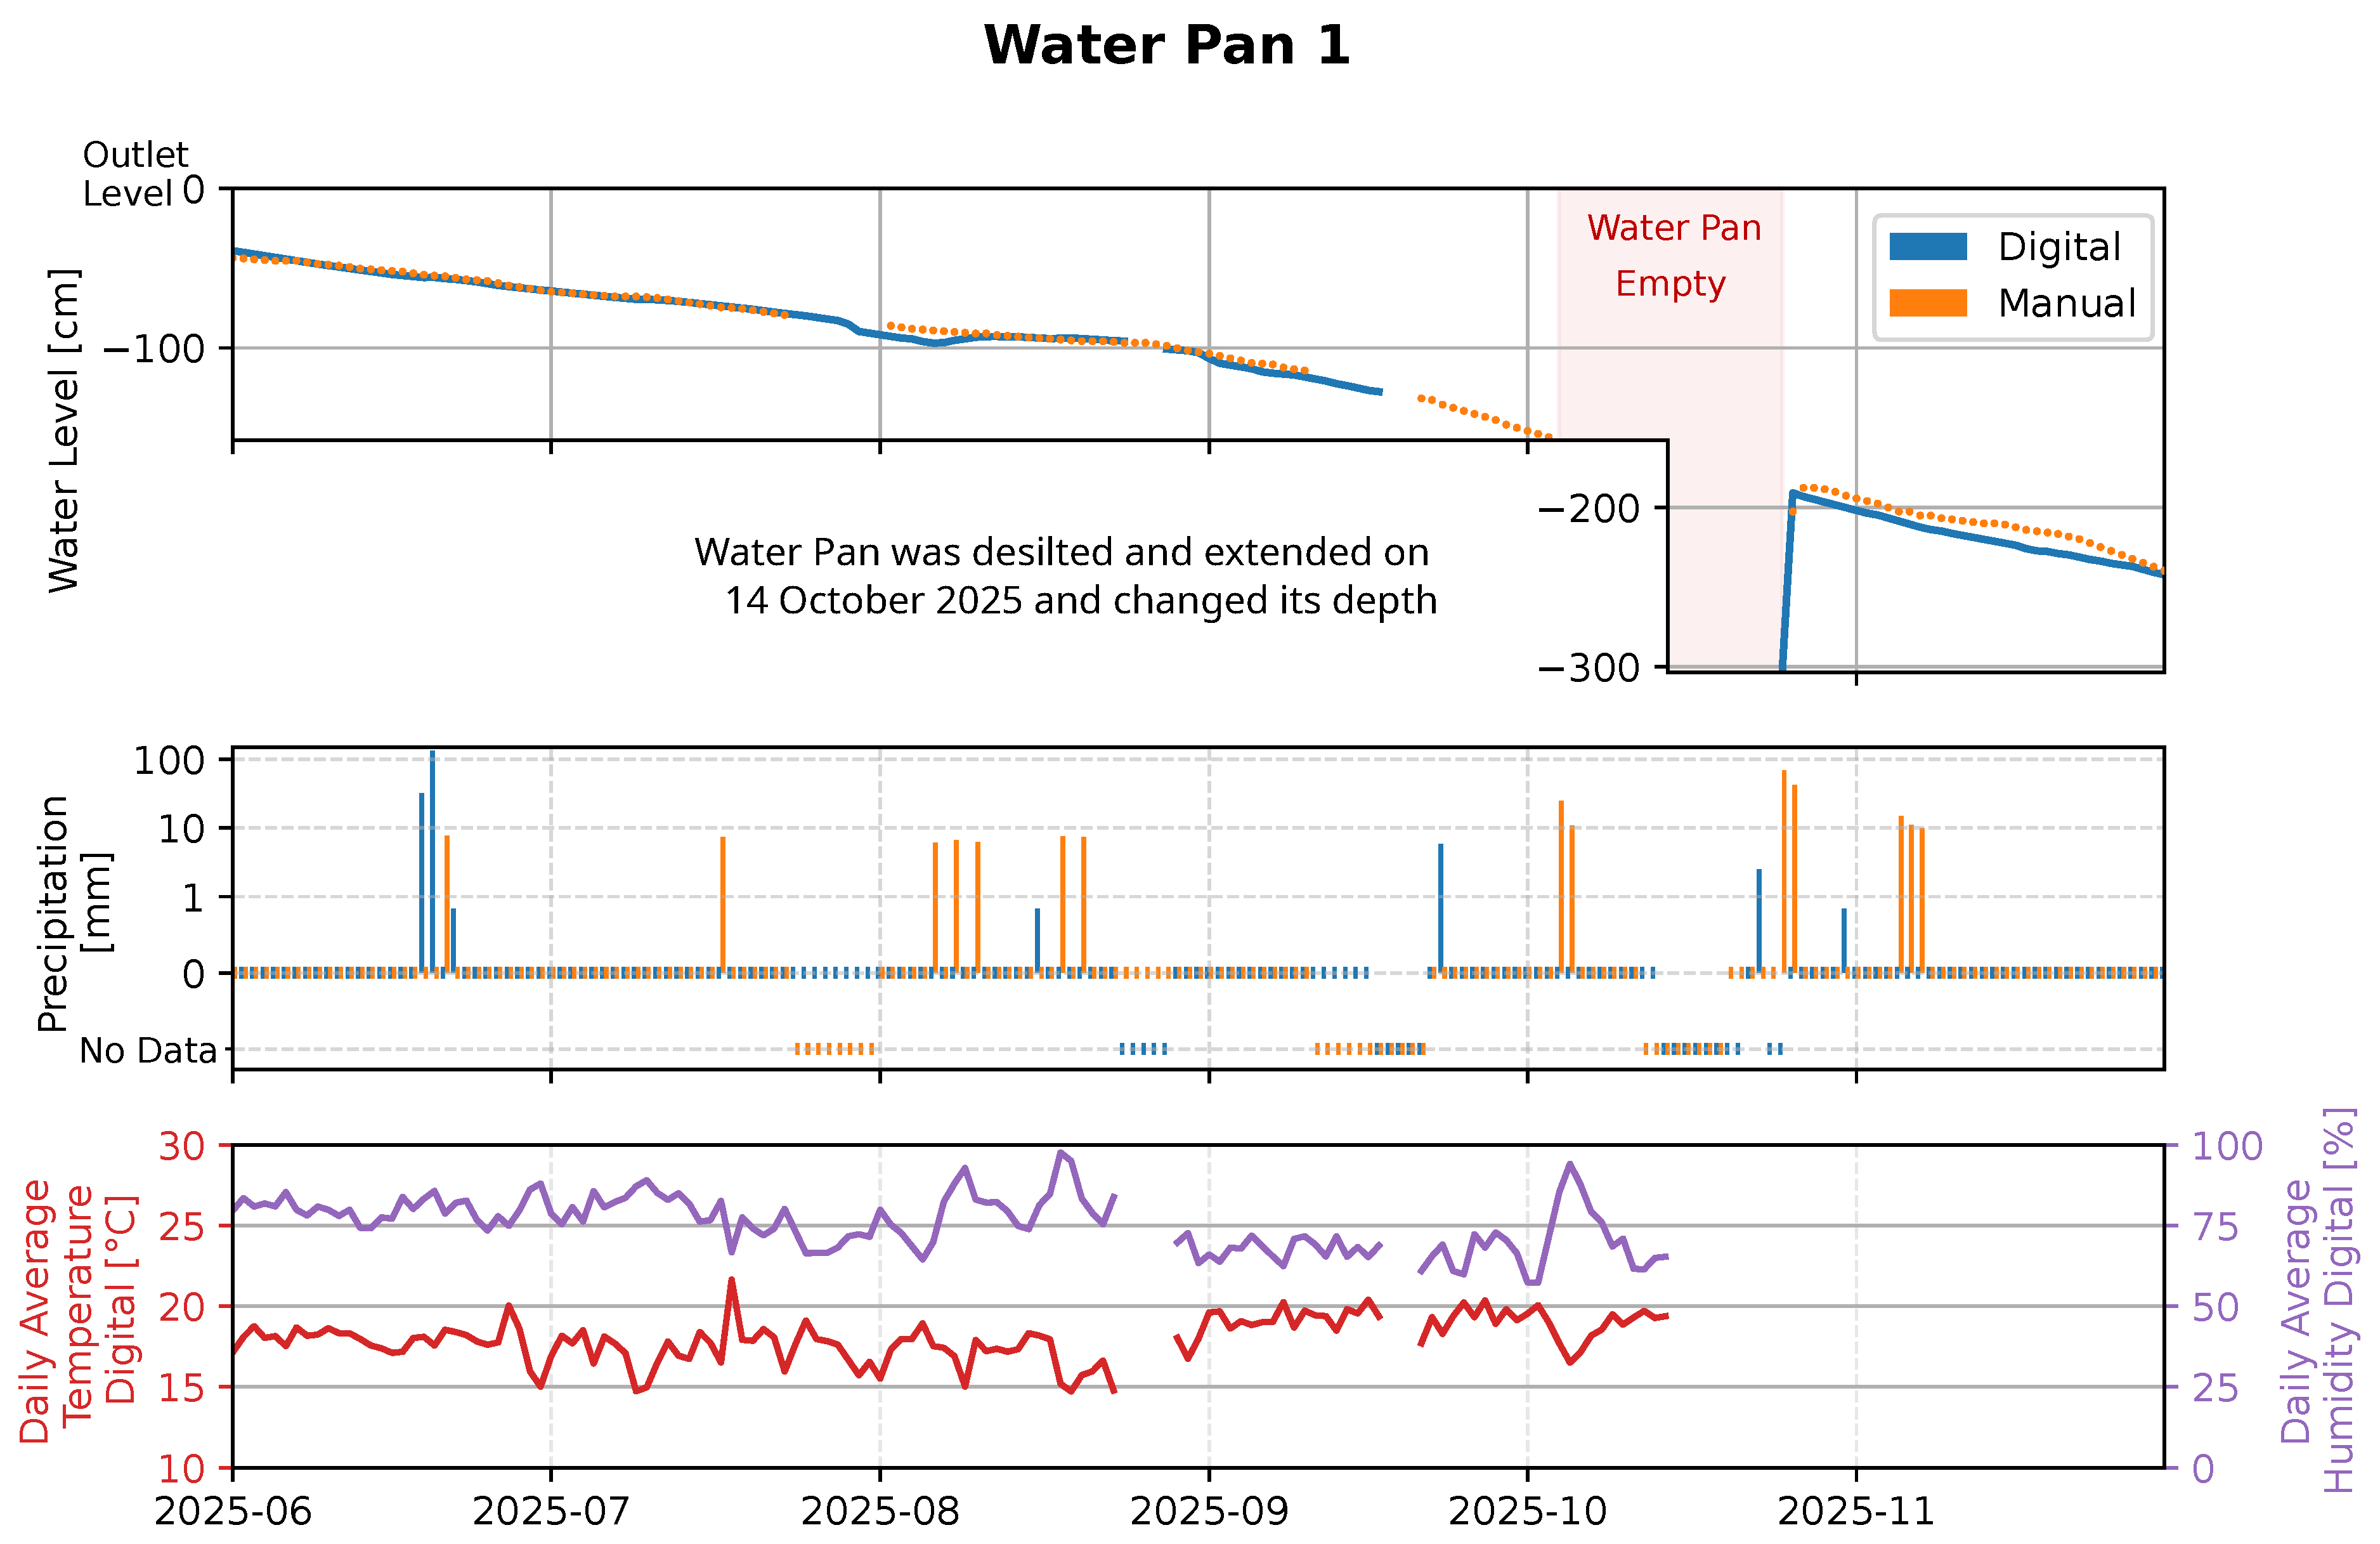
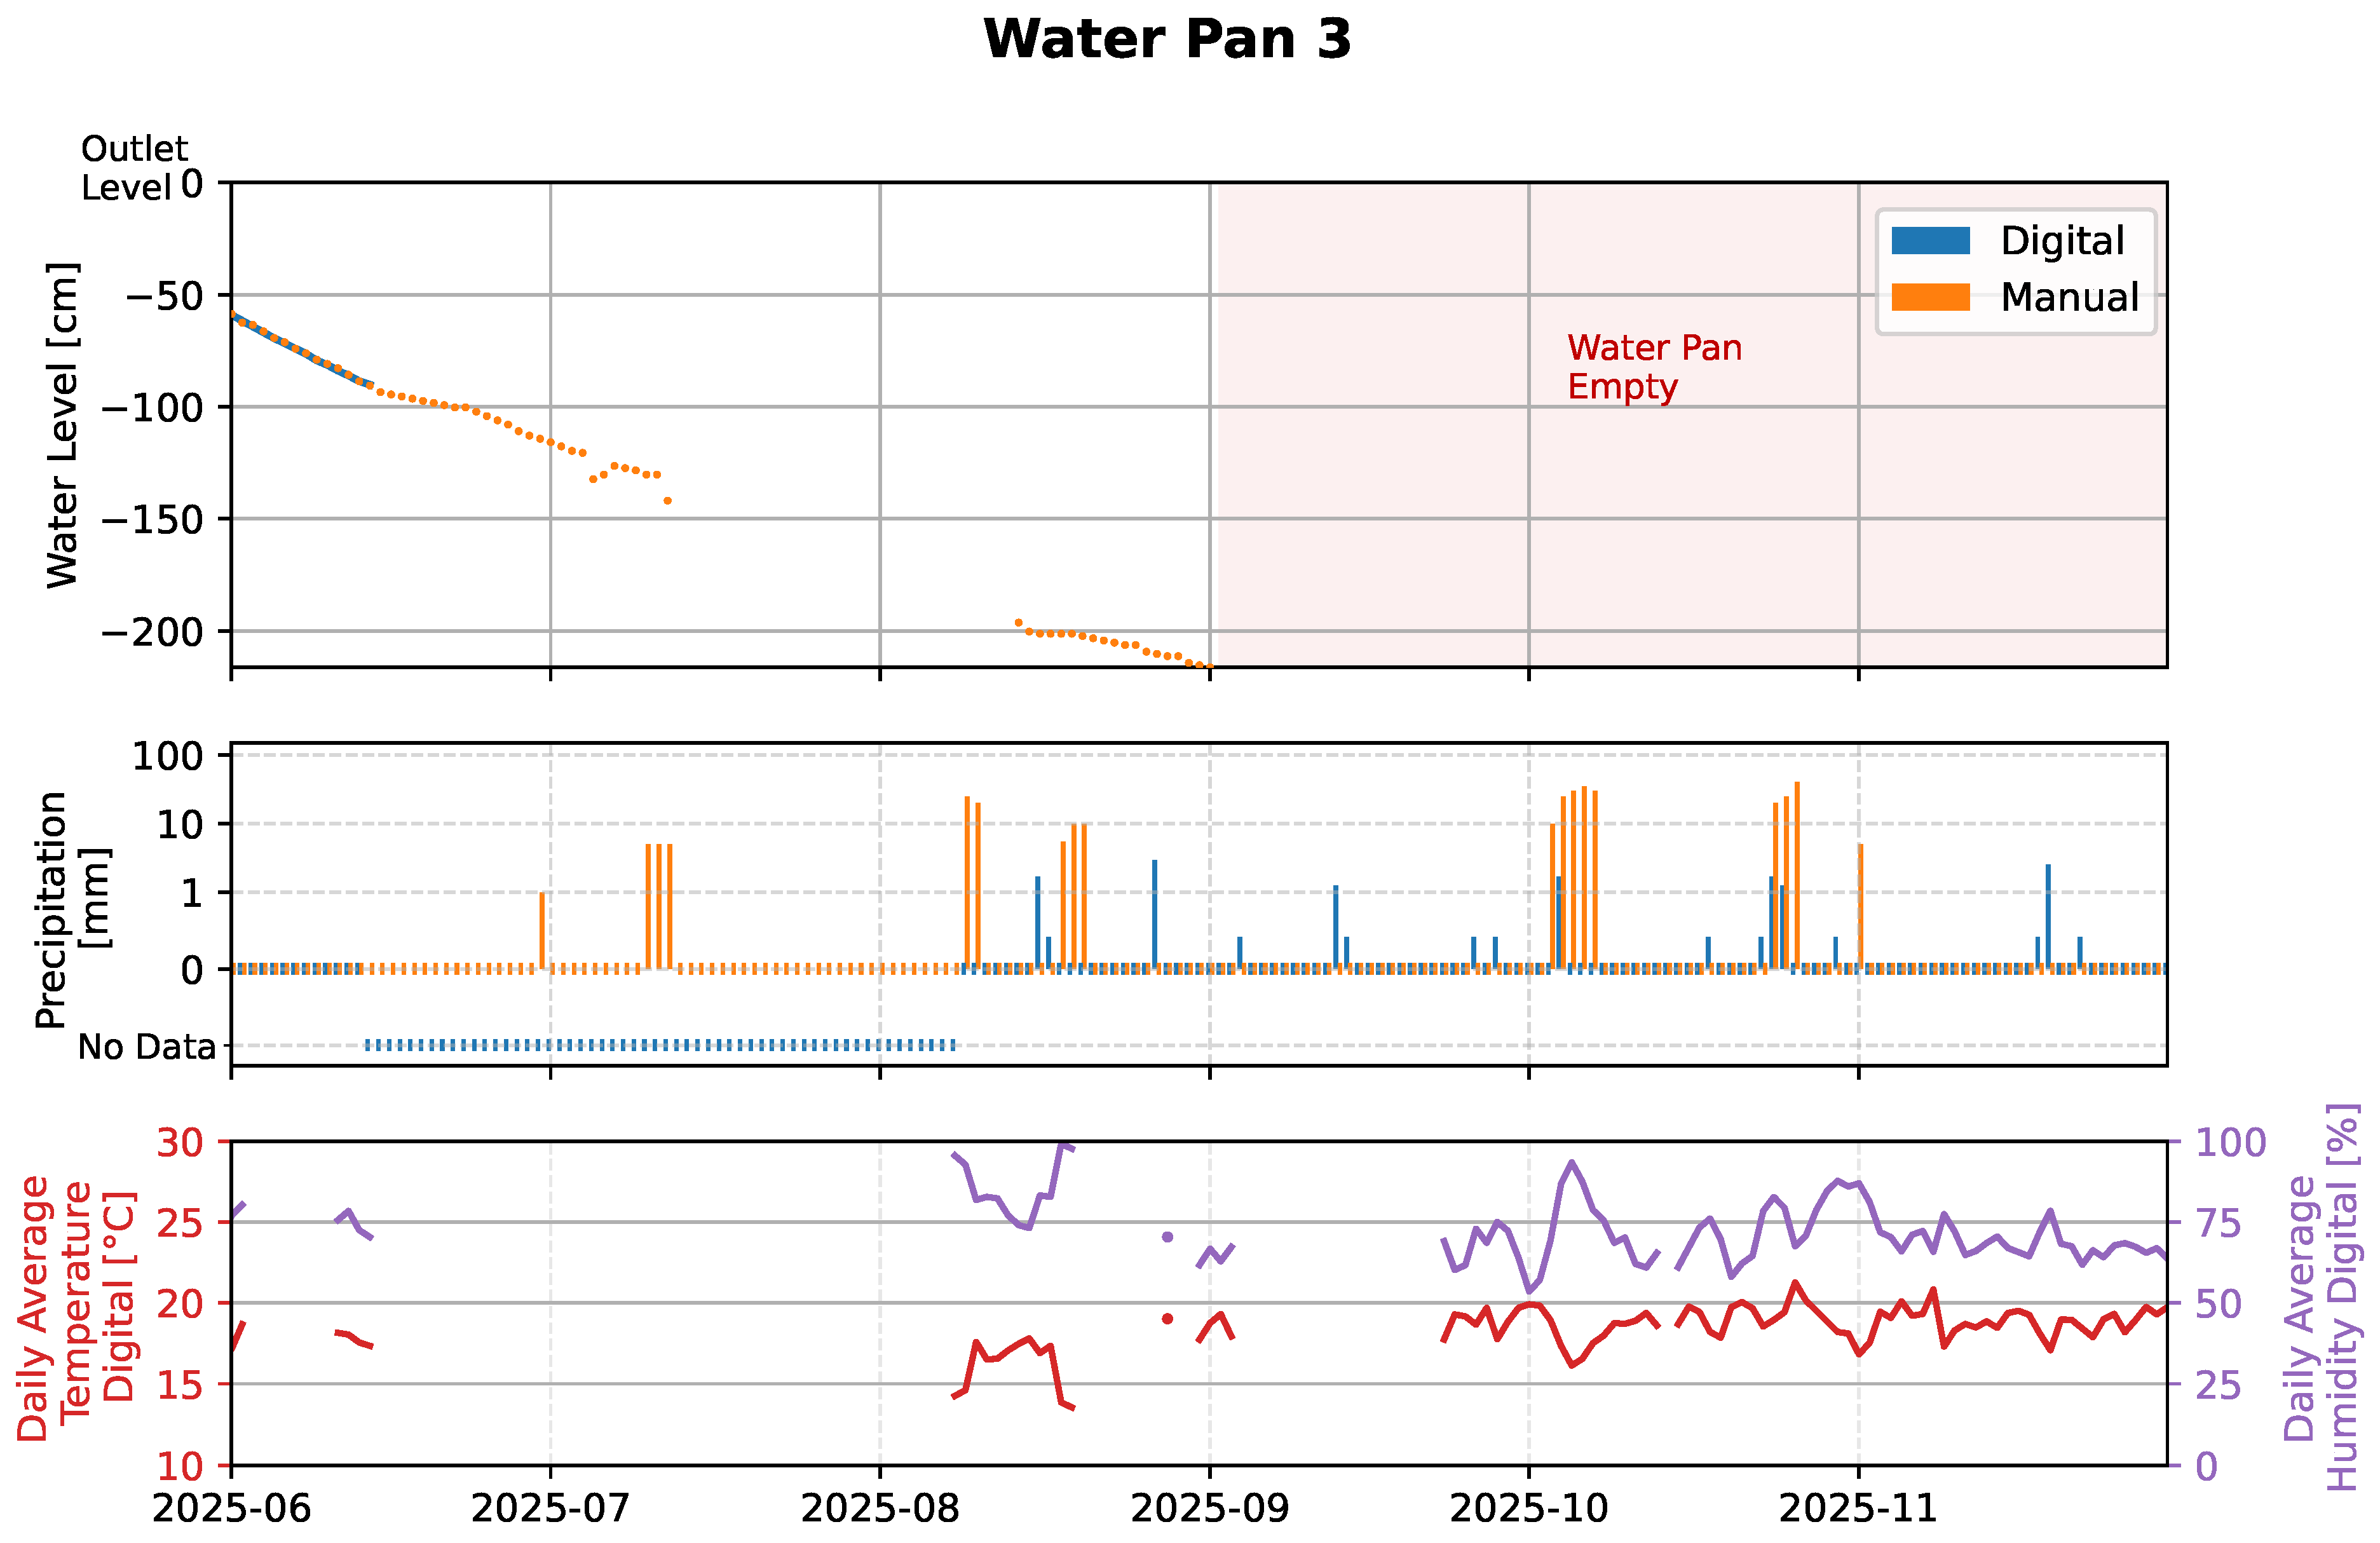
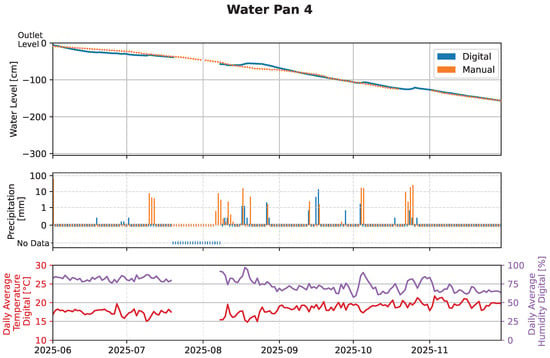
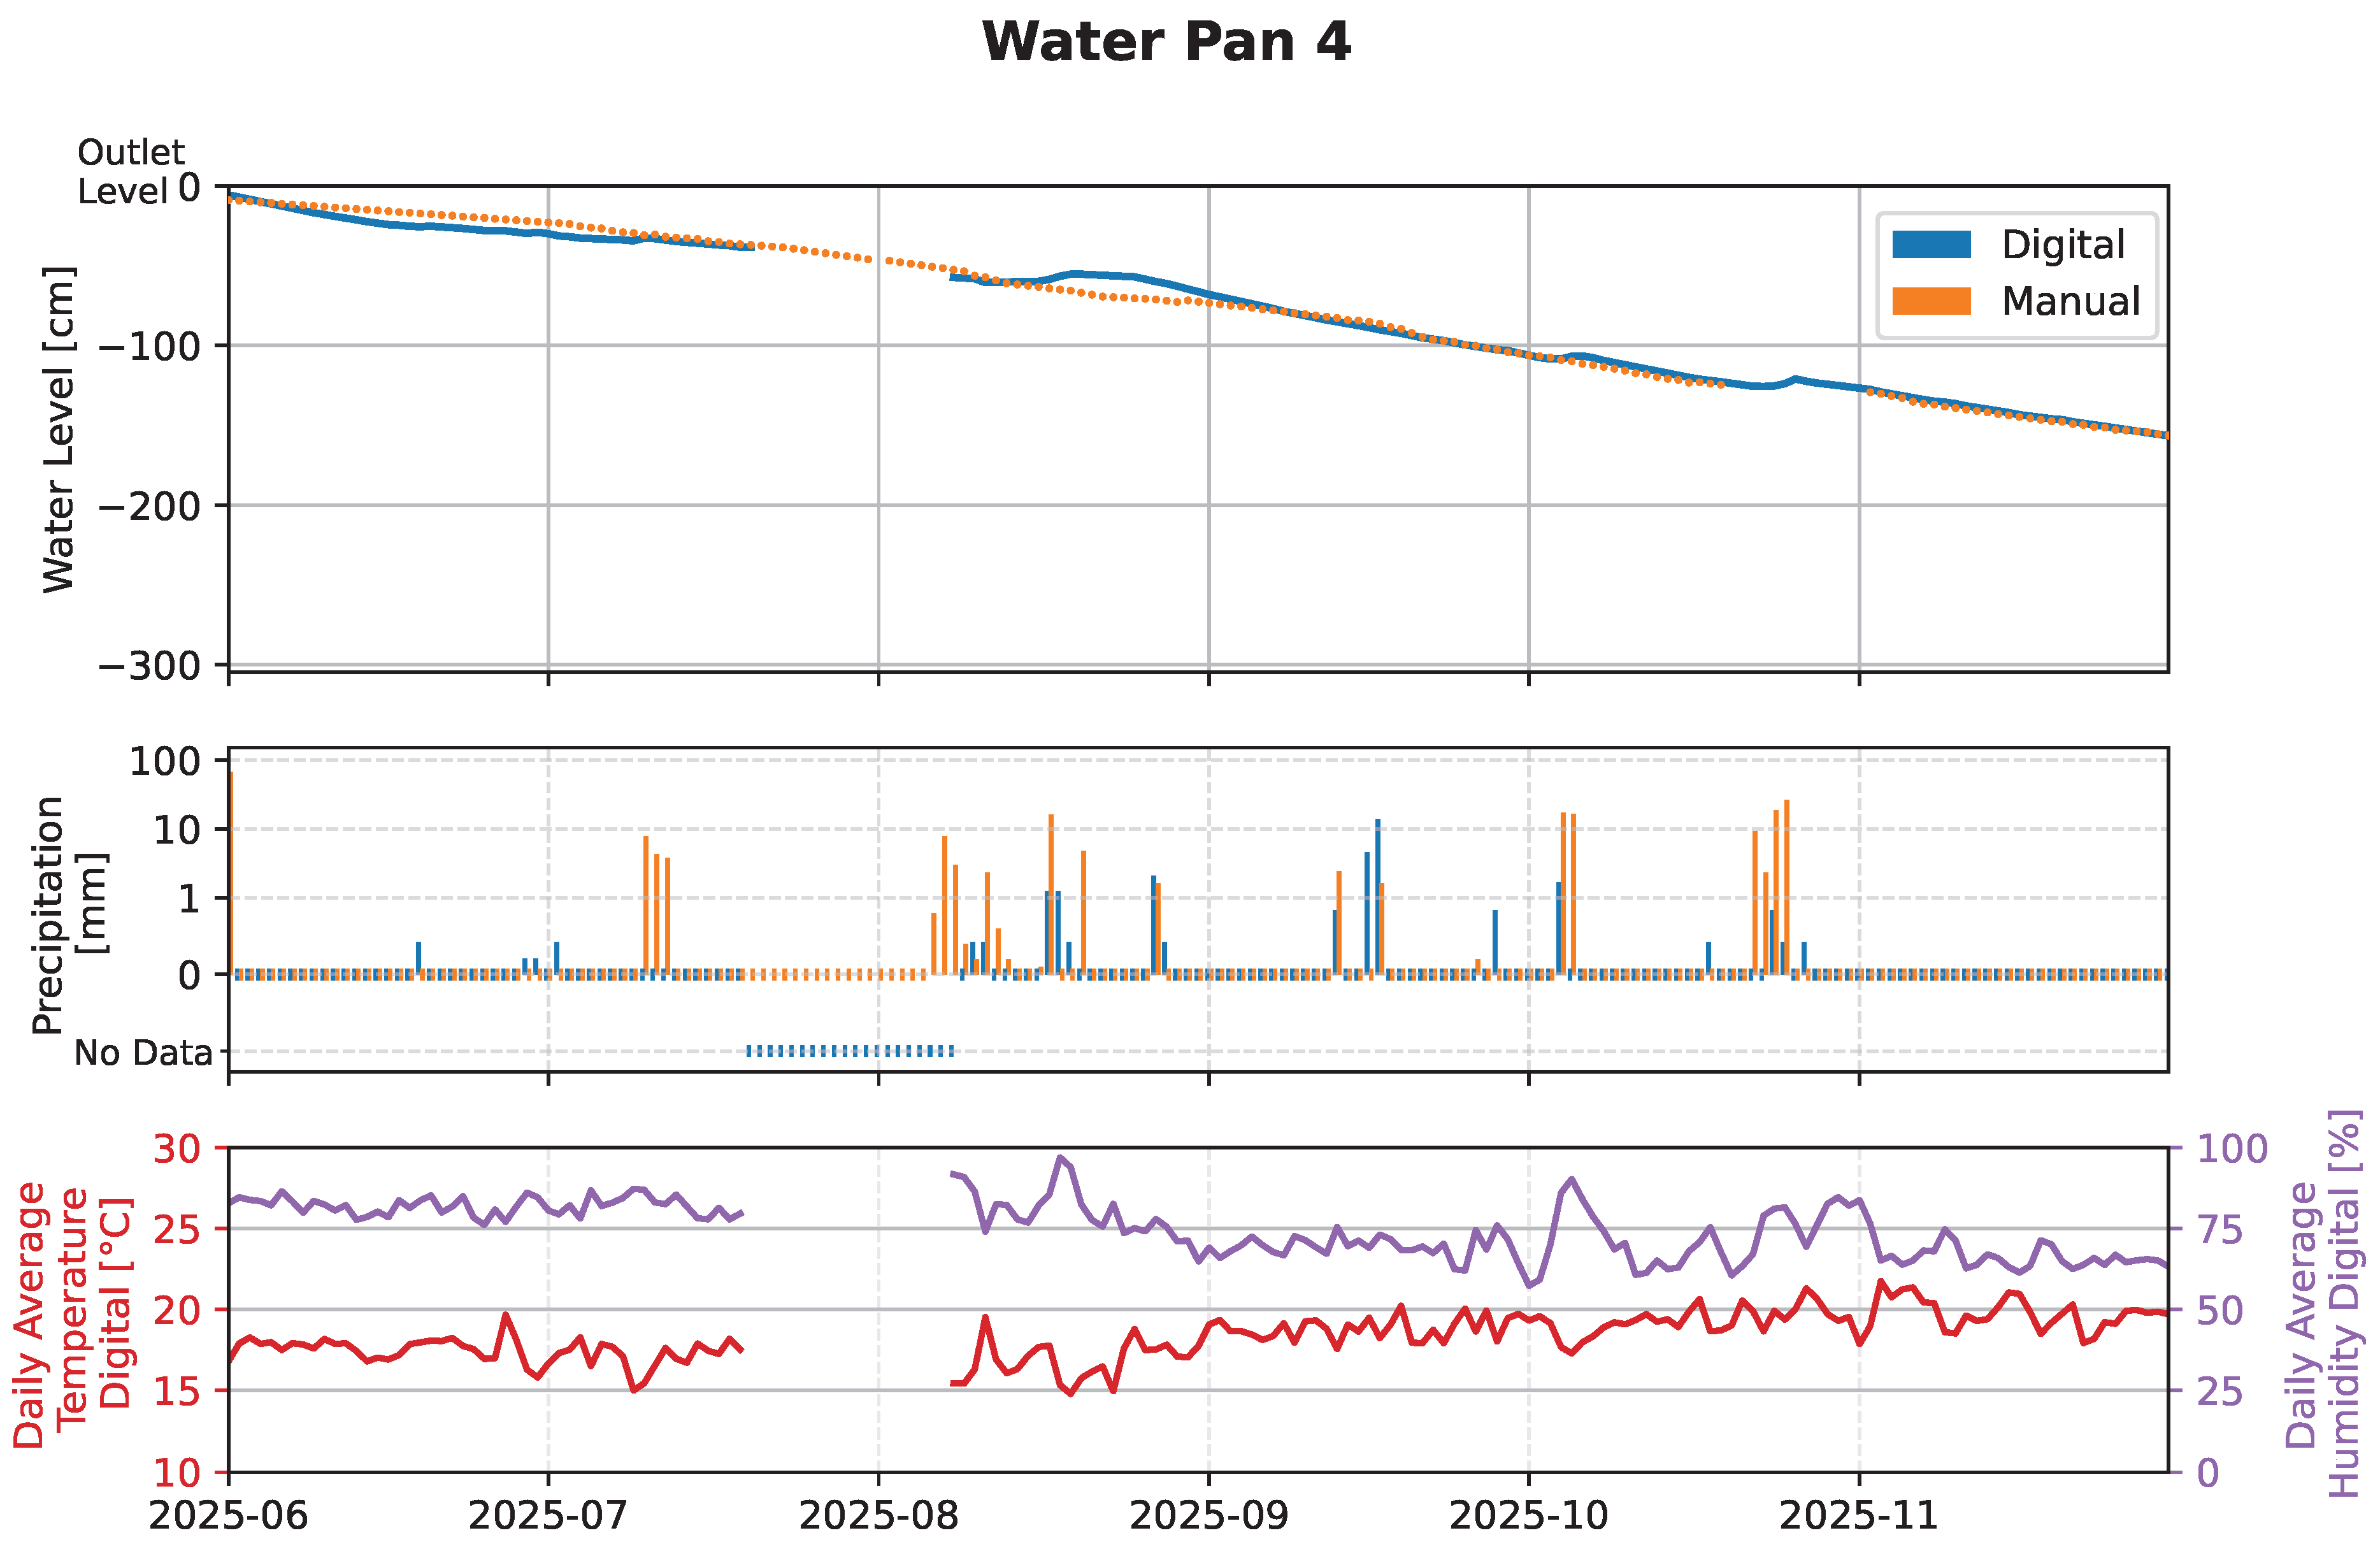
The processed data collected throughout the entire period of the field trial is visualized in Figure 11, Figure 12 and Figure 13.
Figure 11.
Data collected throughout the entire period of the field trial at water pan 1.
Figure 12.
Data collected throughout the entire period of the field trial at water pan 3.
Figure 13.
Data collected throughout the entire period of the field trial at water pan 4.
3.2.1. Water Level
Several factors affected the reliability of the water-level measurements. From mid-September onward, station 1 produced an increasing number of outliers, to the extent that the trend line and anomalous values could no longer be unambiguously distinguished using the methodology described in Section 2.4. Consequently, daily mean water levels are unavailable for this period. The issue was resolved by replacing the ultrasonic transducer on 20 October. Because the water pan was empty for most of this time, only 13 days were affected.
At water pan 3, weaker-than-expected mobile network coverage required the station to be installed at an elevated location next to the pan. Because this change was unplanned, the ultrasonic transducer cable length limited the possible deployment area. Since the pan was full and positioning relied on estimates from local users, the sensor ended up not being placed above the deepest point, preventing digital measurements at low water levels. This affected 24 days. In addition, the pan was empty for approximately half of the field trial period, and the station was non-operational for 56 days while water was present (see Section 3.1). Consequently, only 14 days of digital water-level data are available for this pan.
Manual water level readings on partially submerged metre tape were taken by non-technical local operators. Therefore, reading errors cannot fully be ruled out. Occasionally, measurements were taken only every second day. Then, intermediate values were linearly interpolated. Because most of the tapes were not mounted perpendicular to the water surface, inclination angles were measured and geometrically corrected. Offsets between tape readings and referenced water levels were determined during geometric surveys and subsequently corrected.
Recurring issues were corrosion of the submerged measuring tape, fading of markings, and algal growth, all of which impaired readability and required frequent replacement.
For water pan 1, the maximum deviation between digital and manual measurements is cm, and comparing digital and manual measurements on all dates where both are available leads to an RMSE of cm. At water pan 3, the maximum deviation is cm and the RMSE cm, while at water pan 4 the corresponding values are cm and cm. The substantially better agreement at water pan 3 is primarily due to the limited number of days for which both datasets are available. During these days, the correspondence was very strong. A summary of these results is provided in Table 3.
Table 3.
Comparison of the digital and manual water level measurements at each water pan.
The digital data, particularly at water pan 4, exhibits several short-term increases that coincide with rainfall events and likely reflect rises in water level. These features are not evident in the manual records. Together with the documented challenges of manual measurement and the high precision of the digital sensors, this suggests that the digital water-level data is generally more accurate than the manual readings.
3.2.2. Precipitation
As the manual rain gauges were installed in close proximity to the digital monitoring stations, true spatial differences in precipitation are expected to be minimal. Nevertheless, substantial discrepancies are observed between manual and digital precipitation measurements across all water pans.
The main source of uncertainty in the manual measurements is potential incorrect use or reading of the rain gauges by non-technical local operators. Although the gauges were jointly installed and proper training was provided, occasional handling or reading errors cannot be ruled out.
Several sources of error were identified for the digital rain gauges. The tipping-bucket gauges require precise levelling to ensure tipping at the correct water volume. When improperly levelled, tipping may be delayed or, in extreme cases, may not occur at all. Although all gauges were carefully levelled during installation, repeated site visits revealed that ground settlement and warping of the wooden support structures often caused the instruments to become misaligned over time. While the gauges were relevelled during each maintenance visit, intermittent misalignment likely resulted in an underestimation of precipitation. Conversely, the support structures were not fully rigid and allowed slight movement. Wind, human interaction, or contact with animals may therefore have induced spurious bucket tips unrelated to rainfall, potentially leading to occasional overestimation.
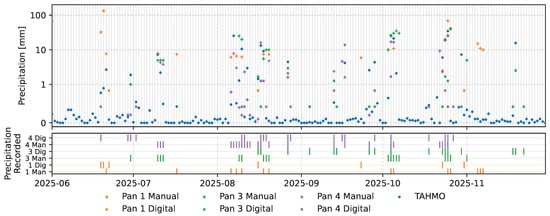
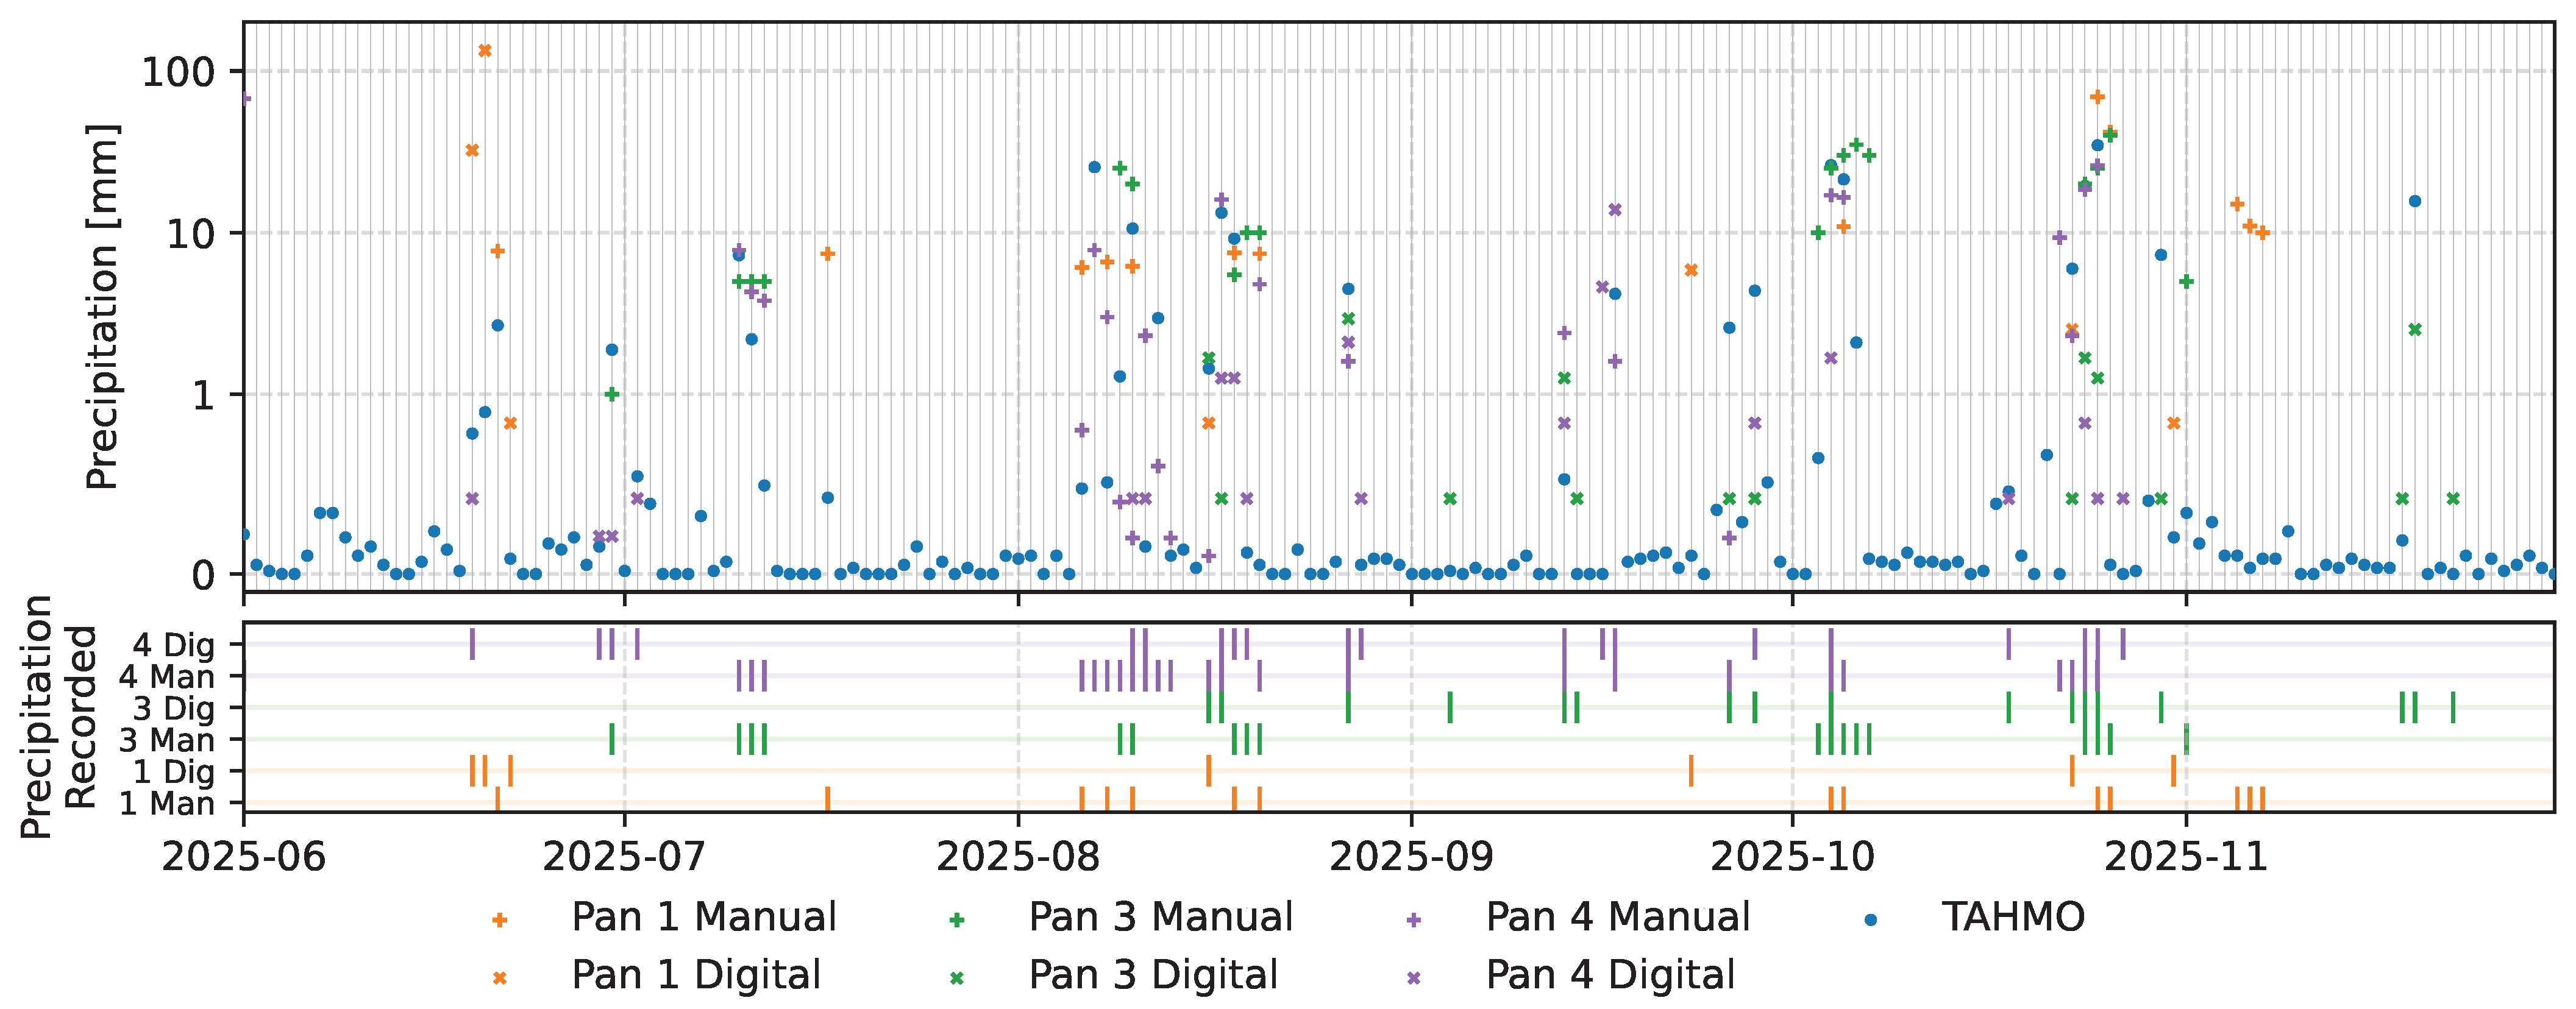
All precipitation records are plotted in Figure 14. When precipitation measurements are compared amongst each other and with data from the TAHMO station, the manual measurements exhibit closer agreement than the digital measurements. Together with the identified sources of error affecting the digital gauges, these observations suggest that the manual precipitation measurements are more reliable than the digital ones. During the preliminary tests, the 3D-printed rain gauge provided accurate measurements. Improving field measurement accuracy can follow two complementary approaches, ideally implemented together: first, a more robust gauge installation to prevent misalignment and slight movement, for instance, through metallic rather than wooden support structures or a small concrete foundation; second, mechanical modifications of the tipping bucket mechanism to reduce sensitivity to misalignment and slight movement. Specific design improvements remain to be investigated.
Figure 14.
Precipitation records from the TAHMO station with digital and manual measurements obtained at all water pans.
3.2.3. Temperature and Humidity
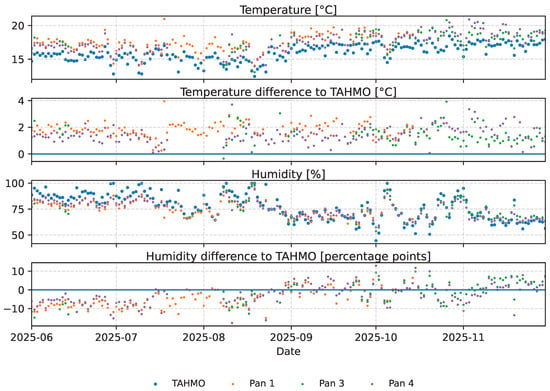
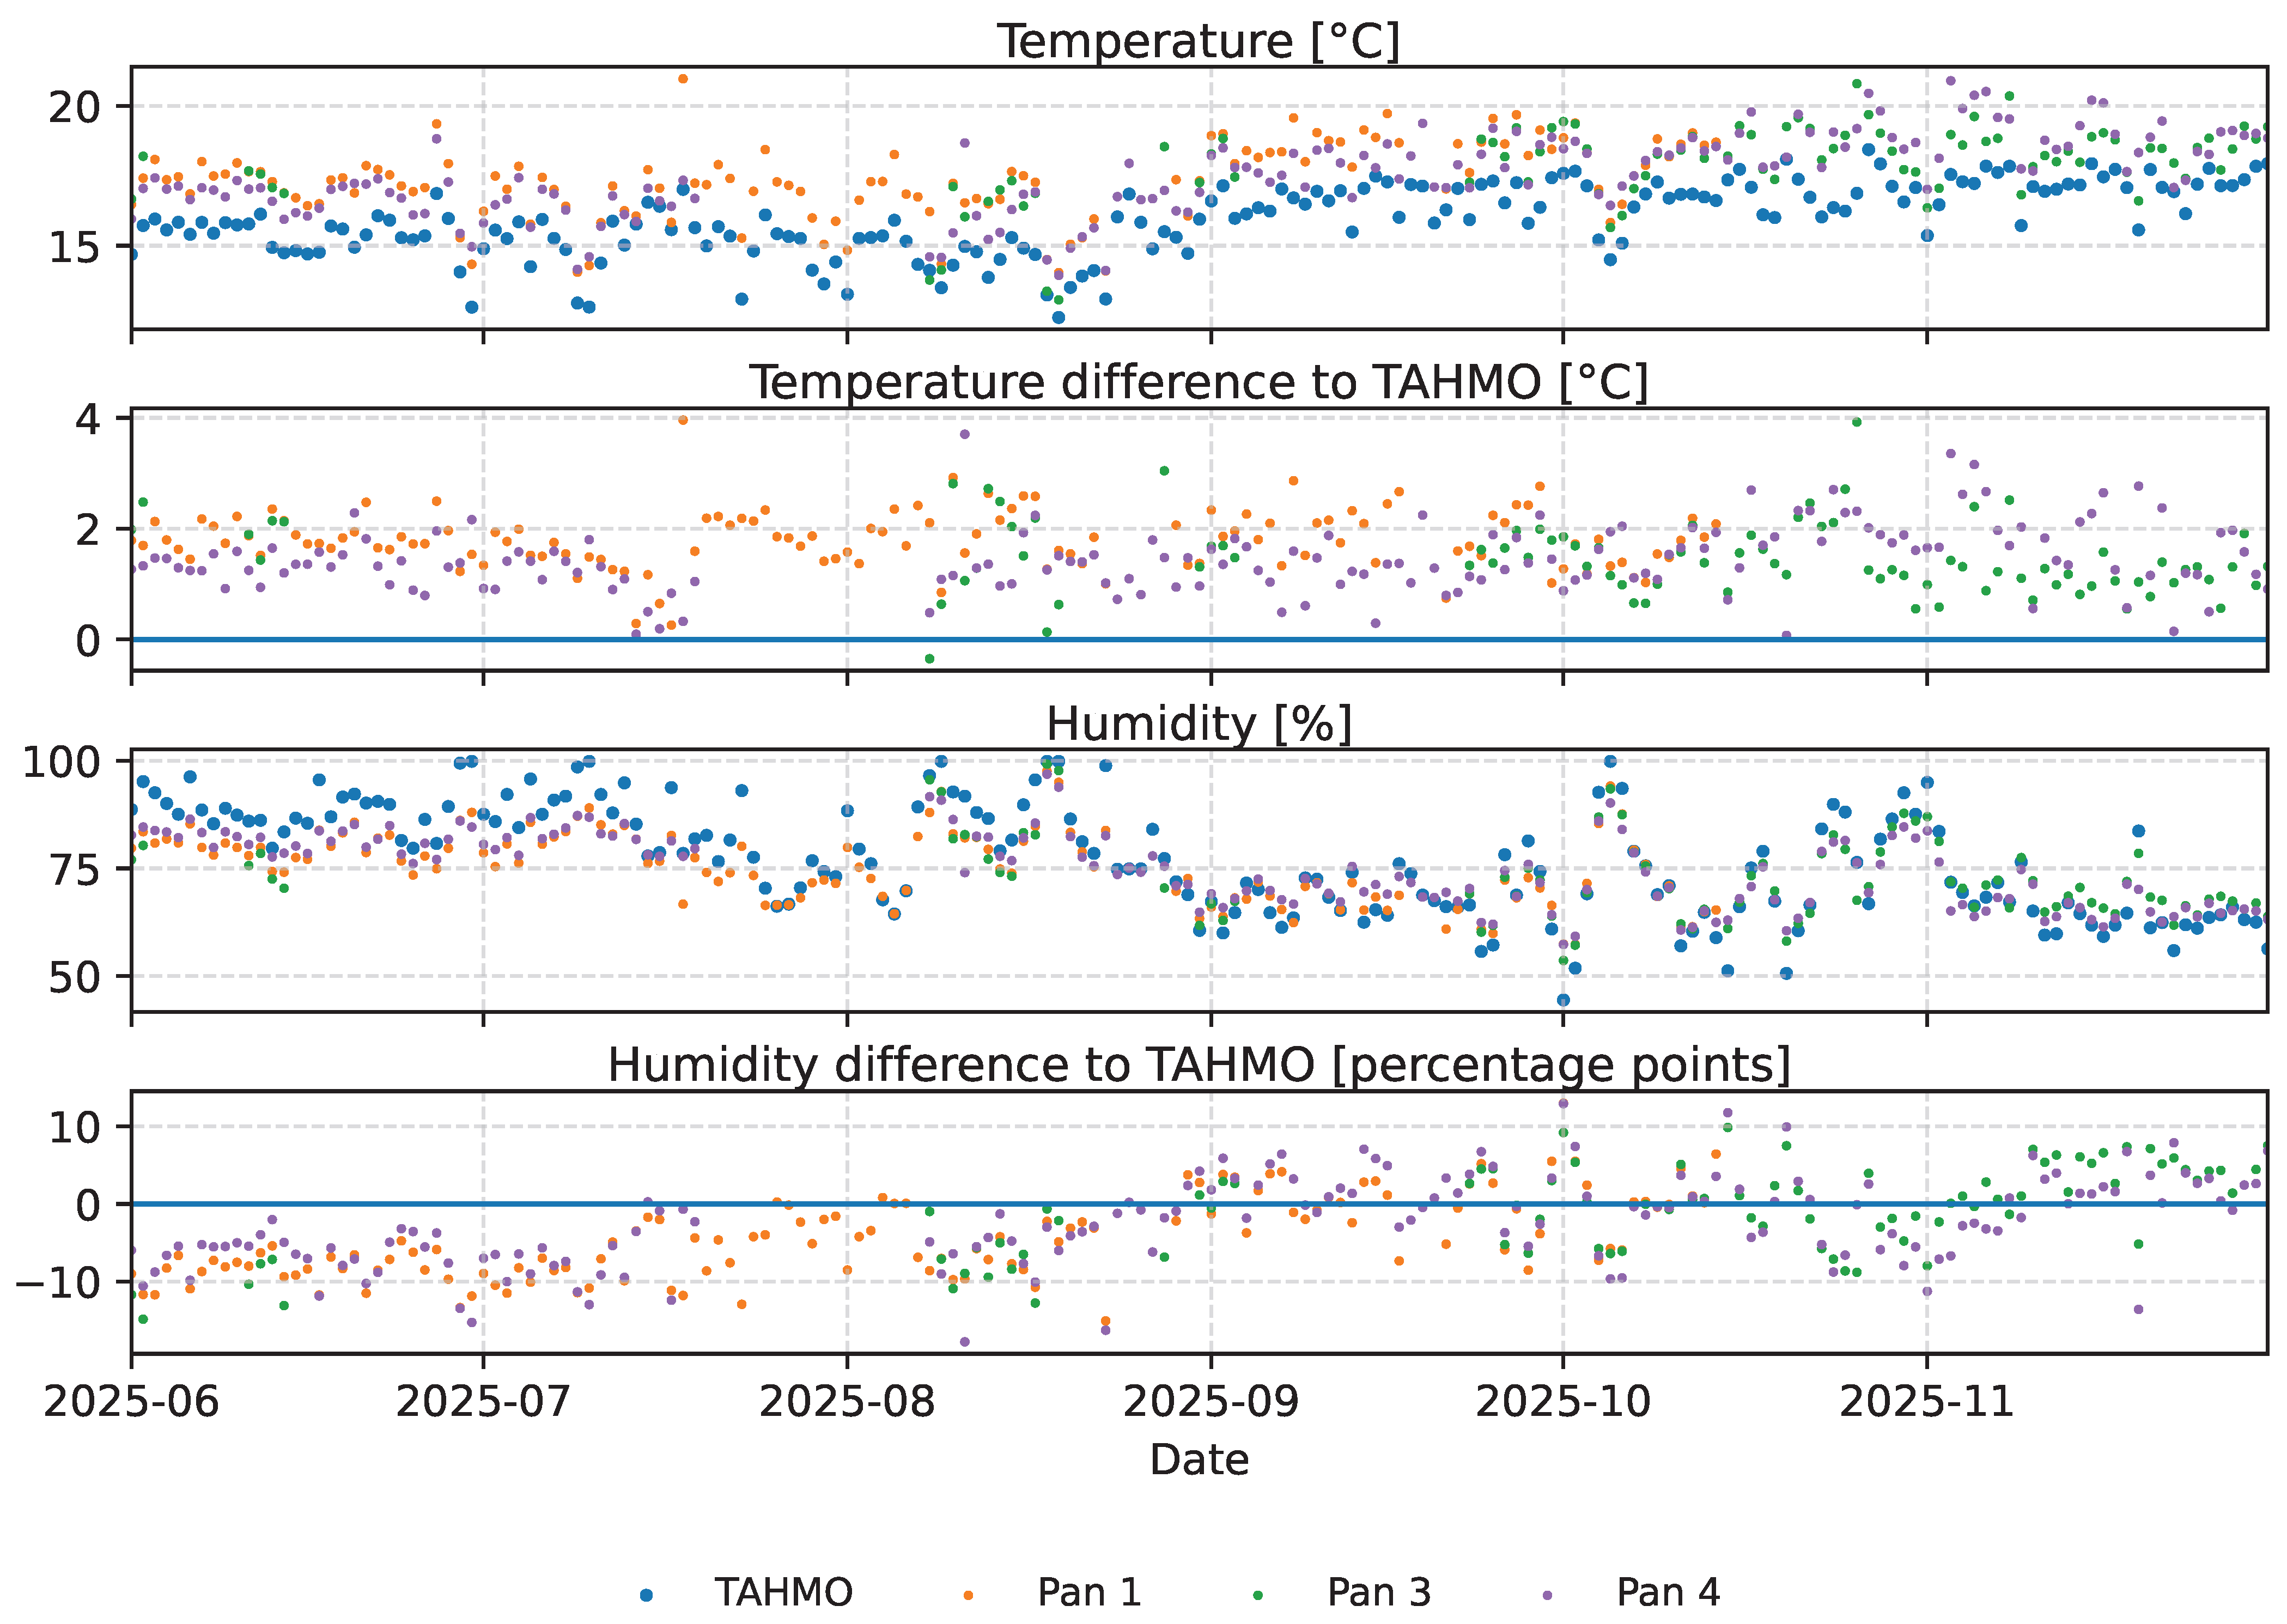
Two issues affected the temperature and humidity measurements, resulting in missing data on some days. Station 3 recorded of all measurements as the error value , with both temperature and humidity either valid or simultaneously. These erroneous measurements occurred randomly, but more frequently at night, leading to insufficient data to calculate meaningful daily mean temperatures on some days. In particular, measurements were often available during warmer daytime periods but missing at cooler night times, preventing calculation of daily means. In total, this resulted in 39 days without valid temperature and humidity data. As this was not observed at any other station, it was most likely caused by a sensor malfunction.
Station 1 exhibited increasing discrepancies toward the end of the field trial, with daytime temperatures considerably higher and nighttime temperatures considerably lower than the other stations. Although daily mean temperatures remained roughly comparable, the measurements were considered invalid, and the corresponding 42 days were treated as missing. Due to the interdependence of temperature and humidity, the associated humidity values were also removed.
The remaining datasets were compared with the TAHMO station, located 2 to km away and up to m higher than the water pans. A temperature correction of C per m [44] was applied to account for the difference in elevation before the comparison. The results are provided in Table 4. The temperature datasets show biases between C and C, which are even higher than the bias of C observed during the validation of the measurements, presented in Section 2.2.3. The RMSE being only slightly larger than the bias, despite the spatial separation, indicates mostly systematic and only small random measurement errors. Even though the systematic bias could be corrected, these findings suggest that an alternative sensor type should be considered. The DS18B20 sensor, a comparably priced alternative with lower reported measurement errors [39], has been successfully applied in water monitoring contexts [27]. However, it does not provide humidity measurements.
Table 4.
Comparison of the temperature and humidity values from the monitoring stations with the TAHMO station.
Considering the distance between the measurement points and the sensor accuracy, the observed humidity bias and RMSE fall within expected ranges. During June, July, and August, when the TAHMO station recorded relatively high humidity, the monitoring stations generally measured lower values. In contrast, for the drier months of September, October, and November, no such trend is apparent. All temperature and humidity records are plotted in Figure 15 and the results of the comparison with the TAHMO station provided in Table 4.
Figure 15.
Temperature and humidity records from all monitoring stations compared with the TAHMO station. Measurements were corrected for elevation differences using the values provided in Table 4.
3.3. Operational Costs
The field trial further yielded insights into operational costs beyond the hardware components presented in Table 2. However, these aspects, particularly transportation costs, are strongly context-dependent. Therefore, the conclusions derived here should be evaluated individually for future deployments. Within the study area, transportation was arranged via motorcycle taxis from Narok town, incurring daily costs of around 3000 KES per vehicle.
A one-day field visit with the local chief and staff from the Water Resources Authority was conducted to identify suitable water pans in the Kakia–Esamburmbur sub-catchment and discuss the project with local users, incurring labour and transportation costs. Installation, carried out jointly by the research team and water pan users, required about half a day per pan with three people working on it. Wooden support material at around 500 KES per pan was delivered to the sites from Narok. As discussed in Section 3.2.2, more robust support structures are recommended for future deployments, with installation logistics and costs yet to be assessed.
Local water pan users received 1000 KES per pan per month for manual recording of water level and precipitation. Once automated monitoring is reliable, manual measurements will no longer be required. Nevertheless, assigning and compensating a local user to oversee the system remains recommended.
Network charges amounted to 100 KES per pan per month for an SMS package. Even if data transmission is switched to Message Queuing Telemetry Transport (MQTT), as discussed in Section 4, costs are expected to remain of the same order of magnitude.
As noted in Section 3.1, maintenance visits approximately once per month were required during the field trial, mainly to offload SD cards, relevel rain gauges, and replace metre tapes for manual readings. These routine tasks could mostly be performed at all water pans within one day. With the improvements proposed in Section 3.1 and Section 3.2.2, and the elimination of manual measurements, maintenance frequency can likely be reduced. Maintenance visits were particularly costly due to the distance between the study area and the JKUAT campus where the research team is based, making transport and accommodation the main expenses. Future deployments should therefore train and compensate local water pan users to perform routine maintenance, not only to reduce logistical costs, but also to strengthen the participatory approach while increasing community benefits.
During the six-month field trial, Station 2 was lost to theft, and one ultrasonic transducer (1400 KES) was replaced. Long-term spare part needs and station lifespan require evaluation over a longer deployment period.
4. Conclusions
Low-cost monitoring stations for water pans were developed to measure water level, precipitation, air temperature, and humidity. Four stations were deployed in Kakia-Esamburmbur Catchment, Kenya, and operated over a six-month field trial. The system generated new datasets, which can be used to better understand the dynamics of these pans, provide water availability predictions based on seasonal drought forecasts, and perform scientific studies to improve the designs and assess and improve the reliability and resilience. This can help to strengthen water security for dependent communities. Continuous operation and real-time data access would further expand the range of potential applications.
However, during the field trial, regular maintenance visits were required, with associated logistical costs exceeding those of hardware procurement and installation. To fully exploit the advantages of low-cost hardware in long-term monitoring, operational reliability must therefore be improved. This particularly includes preventing software crashes, ensuring that file sizes remain manageable for the microcontroller, improving the robustness of the rain gauge installation, and using more reliable temperature sensors. With these improvements, decentralised monitoring of numerous water pans and small dams becomes feasible within limited budgets across diverse contexts.
During the trial, data transmission was implemented via SMS as a simple, preliminary solution. For continuous monitoring and real-time data access, a server with a centralised database communicating with the stations via protocols such as MQTT [45,46] would be more suitable. This approach would also necessitate that the data processing described in Section 2.4 be performed fully automatically and in real time. Implementation of this system is feasible with the existing hardware, requiring only software modifications, and would transform the sensor network into a fully integrated IoT system.
Author Contributions
N.M., J.M.G. and J.K.S. conceptualised the idea and developed the methodology; N.M. developed the monitoring stations, including software and hardware, deployed and maintained the system in the field and performed the data curation, formal analysis and visualisation. The work was supervised by J.M.G. and J.K.S. and validated by J.M.G., J.K.S. and R.N. The original draft was written by N.M. and reviewed and edited by all authors. All authors have read and agreed to the published version of the manuscript.
Funding
This research received no external funding.
Institutional Review Board Statement
Not applicable.
Data Availability Statement
The data presented in this study will be available from the corresponding author upon request, after an embargo period following publication to allow submission of the research findings as a thesis.
Acknowledgments
The authors gratefully acknowledge the support of local landowners and water pan users for granting access to the study sites and for their assistance with manual data collection. They also appreciate the logistical support provided by the Water Resources Authority (WRA). This study was conducted as part of a fellowship of the German Academic Exchange Service (DAAD).
Conflicts of Interest
The authors declare no conflicts of interest.
Abbreviations
The following abbreviations are used in this manuscript:
| csv | Comma-Separated Values |
| FABDEM | Forest And Buildings Removed Copernicus Digital Elevation Model |
| GPS | Global Positioning System |
| IoT | Internet of Things |
| JKUAT | Jomo Kenyatta University of Agriculture and Technology |
| KES | Kenyan Shilling |
| MQTT | Message Queuing Telemetry Transport |
| MWI | Ministry of Water and Irrigation, Kenya |
| pp | Percentage Points |
| RMSE | Root Mean Square Error |
| SD card | Secure Digital Card |
| SMS | Short Message Service |
| TAHMO | Trans-African Hydro-Meteorological Observatory |
| UML | Unified Modeling Language |
| USB | Universal Serial Bus |
| USD | United States Dollar |
| WRA | Water Resources Authority |
References
- Herrmann, S.M.; Mohr, K.I. A Continental-Scale Classification of Rainfall Seasonality Regimes in Africa Based on Gridded Precipitation and Land Surface Temperature Products. J. Appl. Meteorol. Climatol. 2011, 50, 2504–2513. [Google Scholar] [CrossRef] [Scilit]
- Mati, B.M.; Kigomo, M.K.; Kyallo, F.M.; Ondieki-Mwaura, F.; Githiri, S.; Nyangau, W.O. Water and Resource Management for Resilient Livelihoods in the Semi-Arid Zones of Kenya: A Technical Manual for Planners and Decision Makers; Rural Resilience Programme, World Food Programme: Nairobi, Kenya, 2018. [Google Scholar]
- Ministry of Water and Irrigation (MWI). Practice Manual for Small Dams, Pans and Other Water Conservation Structures in Kenya; Ministry of Water and Irrigation (MWI): Nairobi, Kenya, 2015.
- Mati, B.M. Best Practices for Rainwater Harvesting from Open Surfaces with Storage in Structures. Training Manual 2; Nile Basin Initiative—NELSAP and Regional Agricultural and Trade Programme (RATP): Bujumbura, Burundi, 2012. [Google Scholar]
- Lindqvist, A.K. Water from Ponds, Pans and Dams: A Manual on Design, Construction and Maintenance; Regional Land Management Unit (RELMA in ICRAF)/World Agroforestry Centre Eastern and Central Africa Regional Programme (ICRAF-ECA): Nairobi, Kenya, 2005. [Google Scholar]
- Mahoo, H.F.; Rwehumbiza, F.B.R.; Demgard-Larsen, S.; Hatibu, N.; Kitali, A.; Kahabi, M. Challenges and Benefits of Participatory Interventions in Rainwater Harvesting: Improvement of Charco Dams in Tanzania. In Proceedings of the International Symposium on Water, Poverty and Productive Uses of Water at the Household Level, Soil Water Management Research Group (SWMRG), Sokoine University of Agriculture; RELMA: Nairobi, Kenya; SAIPRO Trust Fund: Tanzania, South Africa, 2003; pp. 124–130. [Google Scholar]
- Amara, H.M.; Saad, S.A. Seasonal Variation of Hafirs’ Water Quality in North Kordufan State, Sudan. Int. J. Environ. Sci. Toxicol. Res. 2014, 2, 168–179. [Google Scholar]
- Mutua, C.; Boitt, M. Suitability Analysis of Water Pan Sites for Pastoralists: A Case Study of Kajiado County in Kenya. Univers. J. Geosci. 2017, 5, 65–72. [Google Scholar] [CrossRef] [Scilit]
- Dos Anjos Luís, A.; Cabral, P. Small Dams/Reservoirs Site Location Analysis in a Semi-Arid Region of Mozambique. Int. Soil Water Conserv. Res. 2021, 9, 381–393. [Google Scholar] [CrossRef] [Scilit]
- Makokha, M.; Obiero, C.; Mwangi, H.; Mburu, D.; Nyangau, W.; Abban-Baiddoo, E. Water Resources Availability and Accessibility for Water Security and Improved Livelihoods in Kenyan Drylands: Case Study of Isiolo and Samburu Counties. Int. J. Environ. Geoinform. 2024, 12, 38–51. [Google Scholar] [CrossRef] [Scilit]
- Okuku, K.O.; Onyando, J.O.; Matheri, N.W.; Kinyanjui, S.M. Validation of Ex-Situ Runoff Harvesting in Semi-Arid Areas Using Grid-Based NRCS–CN. Am. J. Water Sci. Eng. 2023, 9, 77–85. [Google Scholar] [CrossRef] [Scilit]
- Othoche, B. An Assessment of the Impact of Floods and Drought on Fresh Water Resources in the Lower Catchment Region of River Tana, Kenya. Int. J. Res. Innov. Soc. Sci. 2024, VIII, 2104–2114. [Google Scholar] [CrossRef] [Scilit]
- Mwaura, J.; Koske, J.; Kiprotich, B. Economic Value of Water Harvesting for Climate-smart Adaptation in Semi-arid Ijara Garissa, Kenya. Environ. Syst. Res. 2017, 6, 11. [Google Scholar] [CrossRef] [Scilit]
- Kurui, E.J.; Ogendi, G.M.; Moturi, W.N. Microbiological Contamination of Water Pans in Baringo County. J. Water Sanit. Hyg. Dev. 2017, 7, 485–494. [Google Scholar] [CrossRef] [Scilit]
- Ndubi, D.; Abila, R. Microbial Composition and Abundance in Drinking Water Sources Within Narok Town and Its Surrounding, Kenya. J. Kenya Natl. Comm. UNESCO 2021, 1, 179–187. [Google Scholar]
- Ngigi, S.N.; Savenije, H.H.G.; Thome, J.N.; Rockström, J.; Penning de Vries, F.W.T. Agro-hydrological Evaluation of On-farm Rainwater Storage Systems for Supplemental Irrigation in Laikipia District, Kenya. Agric. Water Manag. 2005, 73, 21–41. [Google Scholar] [CrossRef] [Scilit]
- Caretta, M.A.; Mukherji, A.; Arfanuzzaman, M.; Betts, R.A.; Gelfan, A.; Hirabayashi, Y.; Lissner, T.K.; Liu, J.; Lopez Gunn, E.; Morgan, R.; et al. Water. In Climate Change 2022: Impacts, Adaptation and Vulnerability. Contribution of Working Group II to the Sixth Assessment Report of the Intergovernmental Panel on Climate Change; Pörtner, H.O., Roberts, D.C., Tignor, M., Poloczanska, E.S., Mintenbeck, K., Alegría, A., Craig, M., Langsdorf, S., Löschke, S., Möller, V., et al., Eds.; Cambridge University Press: Cambridge, UK; New York, NY, USA, 2022; pp. 551–712. [Google Scholar] [CrossRef] [Scilit]
- Pathak, M.; Slade, R.; Shukla, P.R.; Skea, J.; Pichs-Madruga, R.; Ürge-Vorsatz, D. Technical Summary. In Climate Change 2022: Mitigation of Climate Change. Contribution of Working Group III to the Sixth Assessment Report of the Intergovernmental Panel on Climate Change; Shukla, P.R., Skea, J., Slade, R., Al Khourdajie, A., van Diemen, R., McCollum, D., Pathak, M., Some, S., Vyas, P., Fradera, R., et al., Eds.; Cambridge University Press: Cambridge, UK; New York, NY, USA, 2022. [Google Scholar] [CrossRef] [Scilit]
- Shi, B.; Catsamas, S.; Kolotelo, P.; Wang, M.; Lintern, A.; Jovanovic, D.; Bach, P.M.; Deletic, A.; McCarthy, D.T. A Low-Cost Water Depth and Electrical Conductivity Sensor for Detecting Inputs into Urban Stormwater Networks. Sensors 2021, 21, 3056. [Google Scholar] [CrossRef] [Scilit] [PubMed]
- Hund, S.V.; Johnson, M.S.; Keddie, T. Developing a Hydrologic Monitoring Network in Data-Scarce Regions Using Open-Source Arduino Dataloggers. Agric. Environ. Lett. 2016, 1, 160011. [Google Scholar] [CrossRef] [Scilit]
- Segovia-Cardozo, D.A.; Rodríguez-Sinobas, L.; Canales-Ide, F.; Zubelzu, S. Design and Field Implementation of a Low-Cost, Open-Hardware Platform for Hydrological Monitoring. Water 2021, 13, 3099. [Google Scholar] [CrossRef] [Scilit]
- Garbossa, L.H.P.; Novaes, A.L.; Lapa, K.R. Low-Cost Automation for Hydrological Monitoring in Water Resources Management. Proceedings 2020, 48, 29. [Google Scholar] [CrossRef] [Scilit]
- Nundloll, V.; Porter, B.; Blair, G.; Cosby, J.; Emmett, B.; Winterbourn, B.; Dean, G.; Beattie, P.; Shaw, R.; Jones, D.; et al. The Design and Deployment of an End-to-end IoT Infrastructure for the Natural Environment. Future Internet 2019, 11, 129. [Google Scholar] [CrossRef] [Scilit]
- Hamel, P.; Ding, N.; Cherqui, F.; Zhu, Q.; Walcker, N.; Bertrand-Krajewski, J.L.; Champrasert, P.; Fletcher, T.D.; McCarthy, D.T.; Navratil, O.; et al. Low-cost Monitoring Systems for Urban Water Management: Lessons from the Field. Water Res. X 2024, 22, 100212. [Google Scholar] [CrossRef] [Scilit]
- International Telecommunication Union (ITU). Overview of the Internet of Things (Recommendation ITU-T Y.2060); Technical Report; Telecommunication Standardization Sector of ITU: Geneva, Switzerland, 2012. [Google Scholar]
- Bogdan, R.; Paliuc, C.; Crisan-Vida, M.; Nimara, S.; Barmayoun, D.L. Low-Cost Internet-of-Things Water-Quality Monitoring System for Rural Areas. Sensors 2023, 23, 3919. [Google Scholar] [CrossRef] [Scilit]
- Cherif, I.; Cherqui, F.; Perret, F.; Bourjaillat, B.; Lord, L.; Bertrand-Krajewski, J.L.; Walcker, N.; Gisi, M.; Bacot, L.; Navratil, O. LevelWAN: A Cost-effective, Open-source IoT System for Water Level Monitoring in Highly Dynamic Aquatic Environments. HardwareX 2025, 23, e00685. [Google Scholar] [CrossRef] [Scilit]
- Marino, P.; Roman Quintero, D.C.; Santonastaso, G.F.; Greco, R. Prototype of an IoT-Based Low-Cost Sensor Network for the Hydrological Monitoring of Landslide-prone Areas. Sensors 2023, 23, 2299. [Google Scholar] [CrossRef] [Scilit]
- Kombo, O.H.; Kumaran, S.; Bovim, A. Design and Application of a Low-Cost, Low-Power, LoRa-GSM, IoT Enabled System for Monitoring of Groundwater Resources With Energy Harvesting Integration. IEEE Access 2021, 9, 128417–128433. [Google Scholar] [CrossRef] [Scilit]
- Mokua, N.; wa Maina, C.; Kiragu, H. A Raw Water Quality Monitoring System Using Wireless Sensor Networks. Int. J. Comput. Appl. 2021, 174, 35–42. [Google Scholar] [CrossRef] [Scilit]
- Tchouateu, O.T.; Mwangi, H.M.; Sang, J.K.; Ngugi, H.N. Impacts of Climate Change on Peak Streamflow in Kakia-Esamburmbur Sub-catchment of Enkare Narok River Catchment, Kenya. J. Sustain. Res. Eng. 2020, 5, 194–205. [Google Scholar]
- Beck, H.E.; McVicar, T.R.; Vergopolan, N.; Berg, A.; Lutsko, N.J.; Dufour, A.; Zeng, Z.; Jiang, X.; van Dijk, A.I.; Miralles, D.G. High-Resolution (1 km) Köppen-Geiger Maps for 1901–2099 Based on Constrained CMIP6 Projections. Sci. Data 2023, 10, 724. [Google Scholar] [CrossRef] [Scilit] [PubMed]
- Hawker, L.; Uhe, P.; Paulo, L.; Sosa, J.; Savage, J.; Sampson, C.; Neal, J. A 30 m Global Map of Elevation with Forests and Buildings Removed. Environ. Res. Lett. 2022, 17, 024016. [Google Scholar] [CrossRef] [Scilit]
- OpenStreetMap Contributors. 2025. Available online: https://www.openstreetmap.org (accessed on 24 August 2025).
- Ali, M.M.; Imon, R.; Ali, I. Statistical Outliers and Related Topics, 1st ed.; CRC Press, an imprint of Taylor and Francis Group: Boca Raton, FL, USA, 2025. [Google Scholar] [CrossRef] [Scilit]
- Manorshi Electronics Co., Ltd. JSN-SR04T-3.0 Data Sheet. Available online: www.manorshi.com/Distance-Measuring-Digital-Sensor-Module-Ultrasonic-Module-pd47224559.html (accessed on 3 February 2026).
- Kumar, A.; Sarangi, A.; Singh, D.K.; Dash, S.; Mani, I. Evaluation of Ultrasonic Sensor for Flow Measurement in Open Channel. J. Sci. Ind. Res. 2023, 82, 1091–1099. [Google Scholar] [CrossRef] [Scilit]
- Liu, T. Digital-Output Relative Humidity & Temperature Sensor/Module DHT22 (also Named as AM2302) Datasheet. Available online: www.aosong.com/en/Products/info.aspx?itemid=2294&lcid=139 (accessed on 3 February 2026).
- Abdinoor, J.A.; Hashim, Z.K.; Horváth, B.; Zsebő, S.; Stencinger, D.; Hegedüs, G.; Bede, L.; Ijaz, A.; Kulmány, I.M. Performance of Low-Cost Air Temperature Sensors and Applied Calibration Techniques—A Systematic Review. Atmosphere 2025, 16, 842. [Google Scholar] [CrossRef] [Scilit]
- Kinsler, L.E.; Frey, A.R.; Coppens, A.B.; Sanders, J.V. Fundamentals of Acoustics, 3rd ed.; John Wiley & Sons, Inc.: New York, NY, USA, 2000. [Google Scholar]
- Goring, D.G.; Nikora, V.I. Despiking Acoustic Doppler Velocimeter Data. J. Hydraul. Eng. 2002, 128, 117–126. [Google Scholar] [CrossRef] [Scilit]
- Huber, P.J. Robust Statistics; John Wiley & Sons, Inc.: New York, NY, USA, 1981. [Google Scholar]
- Taylor, J.R. An Introduction to Error Analysis: The Study of Uncertainities in Physical Measurement, 2nd ed.; University Science Books: Sausalito, CA, USA, 1982. [Google Scholar]
- ISO 2533:1975; Standard Atmosphere. International Organization for Standardization: Geneva, Switzerland, 2024.
- Has, M.; Kreković, D.; Kušek, M.; Podnar Žarko, I. Efficient Data Management in Agricultural IoT: Compression, Security, and MQTT Protocol Analysis. Sensors 2024, 24, 3517. [Google Scholar] [CrossRef] [Scilit]
- OASIS Message Queuing Telemetry Transport (MQTT) Technical Committee. MQTT Version 5.0 Standard; OASIS Message Queuing Telemetry Transport (MQTT) Technical Committee: Woburn, MA, USA, 2019. [Google Scholar]

Disclaimer/Publisher’s Note: The statements, opinions and data contained in all publications are solely those of the individual author(s) and contributor(s) and not of MDPI and/or the editor(s). MDPI and/or the editor(s) disclaim responsibility for any injury to people or property resulting from any ideas, methods, instructions or products referred to in the content. |
© 2026 by the authors. Licensee MDPI, Basel, Switzerland. This article is an open access article distributed under the terms and conditions of the Creative Commons Attribution (CC BY) license.