


Abstract
The Upper Colorado River Basin (UCRB), through the process of snow accumulation, to snowmelt, to streamflow runoff, provides a critical water source to approximately 40 million residents in the Southwestern United States. Given the importance of late fall–winter–early spring (October, November, December, January, February, March, or ONDJFM), cumulative precipitation, future estimates of ONDJFM cumulative precipitation, and potential drought occurrence would provide a benefit to water managers and planners. Previous research efforts successfully reconstructed (extended the period of record) the regional April 1st Snow Water Equivalent (SWE) in the UCRB using tree-ring chronologies and reconstructed climate (El Niño–Southern Oscillation or ENSO). The current research efforts differ by (a) incorporating future [Shared Socioeconomic Pathway (SSP) 5-8.5] predictions of ONDJFM cumulative precipitation (in lieu of April 1st SWE) at a single station location (Kendall R.S.) in the UCRB; (b) reconstructing ONDJFM cumulative precipitation (in lieu of April 1st SWE) using tree-ring chronologies and ENSO; and (c) evaluating an alternative reconstructed ENSO index. The reconstructed record, recent past observations, and future (SSP 5-8.5) ONDJFM cumulative precipitation were then combined to provide a paleo perspective of future drought. Results indicate that extreme ONDJFM cumulative precipitation drought periods projected for the ~2040s were exceeded in the reconstructed record. A pattern of alternating wet and dry conditions was also identified, consisting of a wet (pluvial) period in the 2030s, followed by drought conditions in the 2040s, and another wet period in the 2050s. Many of the extreme future wet (pluvial) periods exceeded those in the recent record and reconstructed record.
1. Introduction
The Upper Colorado River Basin (UCRB) includes the states of Wyoming, New Mexico, Utah, and Colorado. During the late fall–winter–early spring season, precipitation is generally in the form of snow. Due to sub-freezing temperatures at high (>2000 m) elevations, the snow accumulates and forms snowpack. The Green River Basin (GRB) in southwestern Wyoming forms the headwaters of the Green River, a major tributary within the UCRB. The basin is characterized by a high-elevation landscape (~1800 to ~2400 m above sea level) with the Wind River Range to the north and east and the Uinta Mountains to the south. The GRB topography consists of wide sagebrush steppe plains, rolling hills, and alluvial valleys. The climate is semi-arid continental, with cold winters, warm summers, and relatively low annual precipitation (typically ~200–400 mm), much of which falls as winter snow in the Wind River Range and Unita Mountains. Climate stations across the basin collect various data, including Snow Water Equivalent (SWE) and streamflow. The United States Department of Agriculture (USDA) maintains a network of SNOTEL (SNOwpack TELemetry Network) sites, which collect SWE data remotely [1]. Given the variability in snow moisture content (i.e., wet or dry snow), SWE provides the depth of water over a given area of snowpack due to melting. It has been estimated that the UCRB snowpack provides almost 90% of the Colorado River’s total streamflow because of the high elevation snowmelt [2]. Generally, the measurement of April 1st SWE has long been associated with the “peak” snowpack and used in forecasting spring–summer runoff (streamflow). However, ref. [3] noted that observational data revealed that the onset of snowmelt across Colorado now occurs ~10 to ~20 days earlier in many basins. The 21st century has displayed a persistent reduction (decline) in snowpack, which in turn has resulted in a decline in streamflow. Since 2000, ref. [4] has estimated an almost 20% reduction in UCRB streamflow. The reduction in streamflow was associated with an almost 15% decline in spring precipitation combined with increased evapotranspiration due to warming temperatures, reduced cloud cover, and increased solar radiation [4]. Droughts during the late fall–winter–early spring season (referred to as “snow droughts”) show an increase in frequency and intensity in the 21st century, which impacts (reduces) streamflow runoff [5]. Increased warming has reduced snow-dominated areas by over 10%, thus contributing to less runoff [6]. Satellite records revealed that dust consistently lowers snow albedo and contributes to accelerated snowmelt at mid to high elevations [7].
While these recent research efforts show a consistent pattern of decreased snowpack in the 21st century, future climate models display both increasing and declining precipitation patterns [8]. Ref. [8] used 4 km resolution dynamical downscaling (Regional Climate Model version 4 or RegCM4) under the Shared Socioeconomic Pathway (SSP) 5-8.5 to project continental U.S. drought evolution. Persistent, severe drying is expected in the southwest U.S., peaking in 2030 to 2040 [8]. Thus, ref. [8] provides monthly precipitation (millimeters or mm) for the late fall–winter–early spring (October, November, December-January, February, March, or ONDJFM) season from 1980/81 to 2058/59 [8].
While [8] provides future estimates of ONDJFM cumulative precipitation, historic and paleo data help characterize hydrologic variability in the UCRB. Previous research efforts [9,10] successfully developed reconstructions of snowpack, soil moisture, and streamflow in the GRB using tree-ring chronologies (commonly referred to as Dendrohydrology) and climate (El Niño–Southern Oscillation, or ENSO) [10,11,12,13]. Regional April 1st SWE was successfully reconstructed back to the early 1700s in the GRB, displaying drought and wet (pluvial) periods [10].
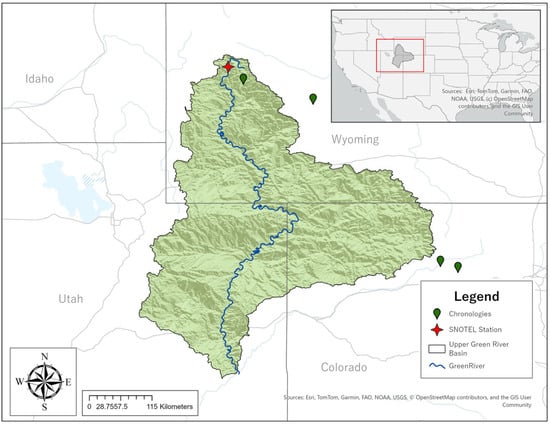
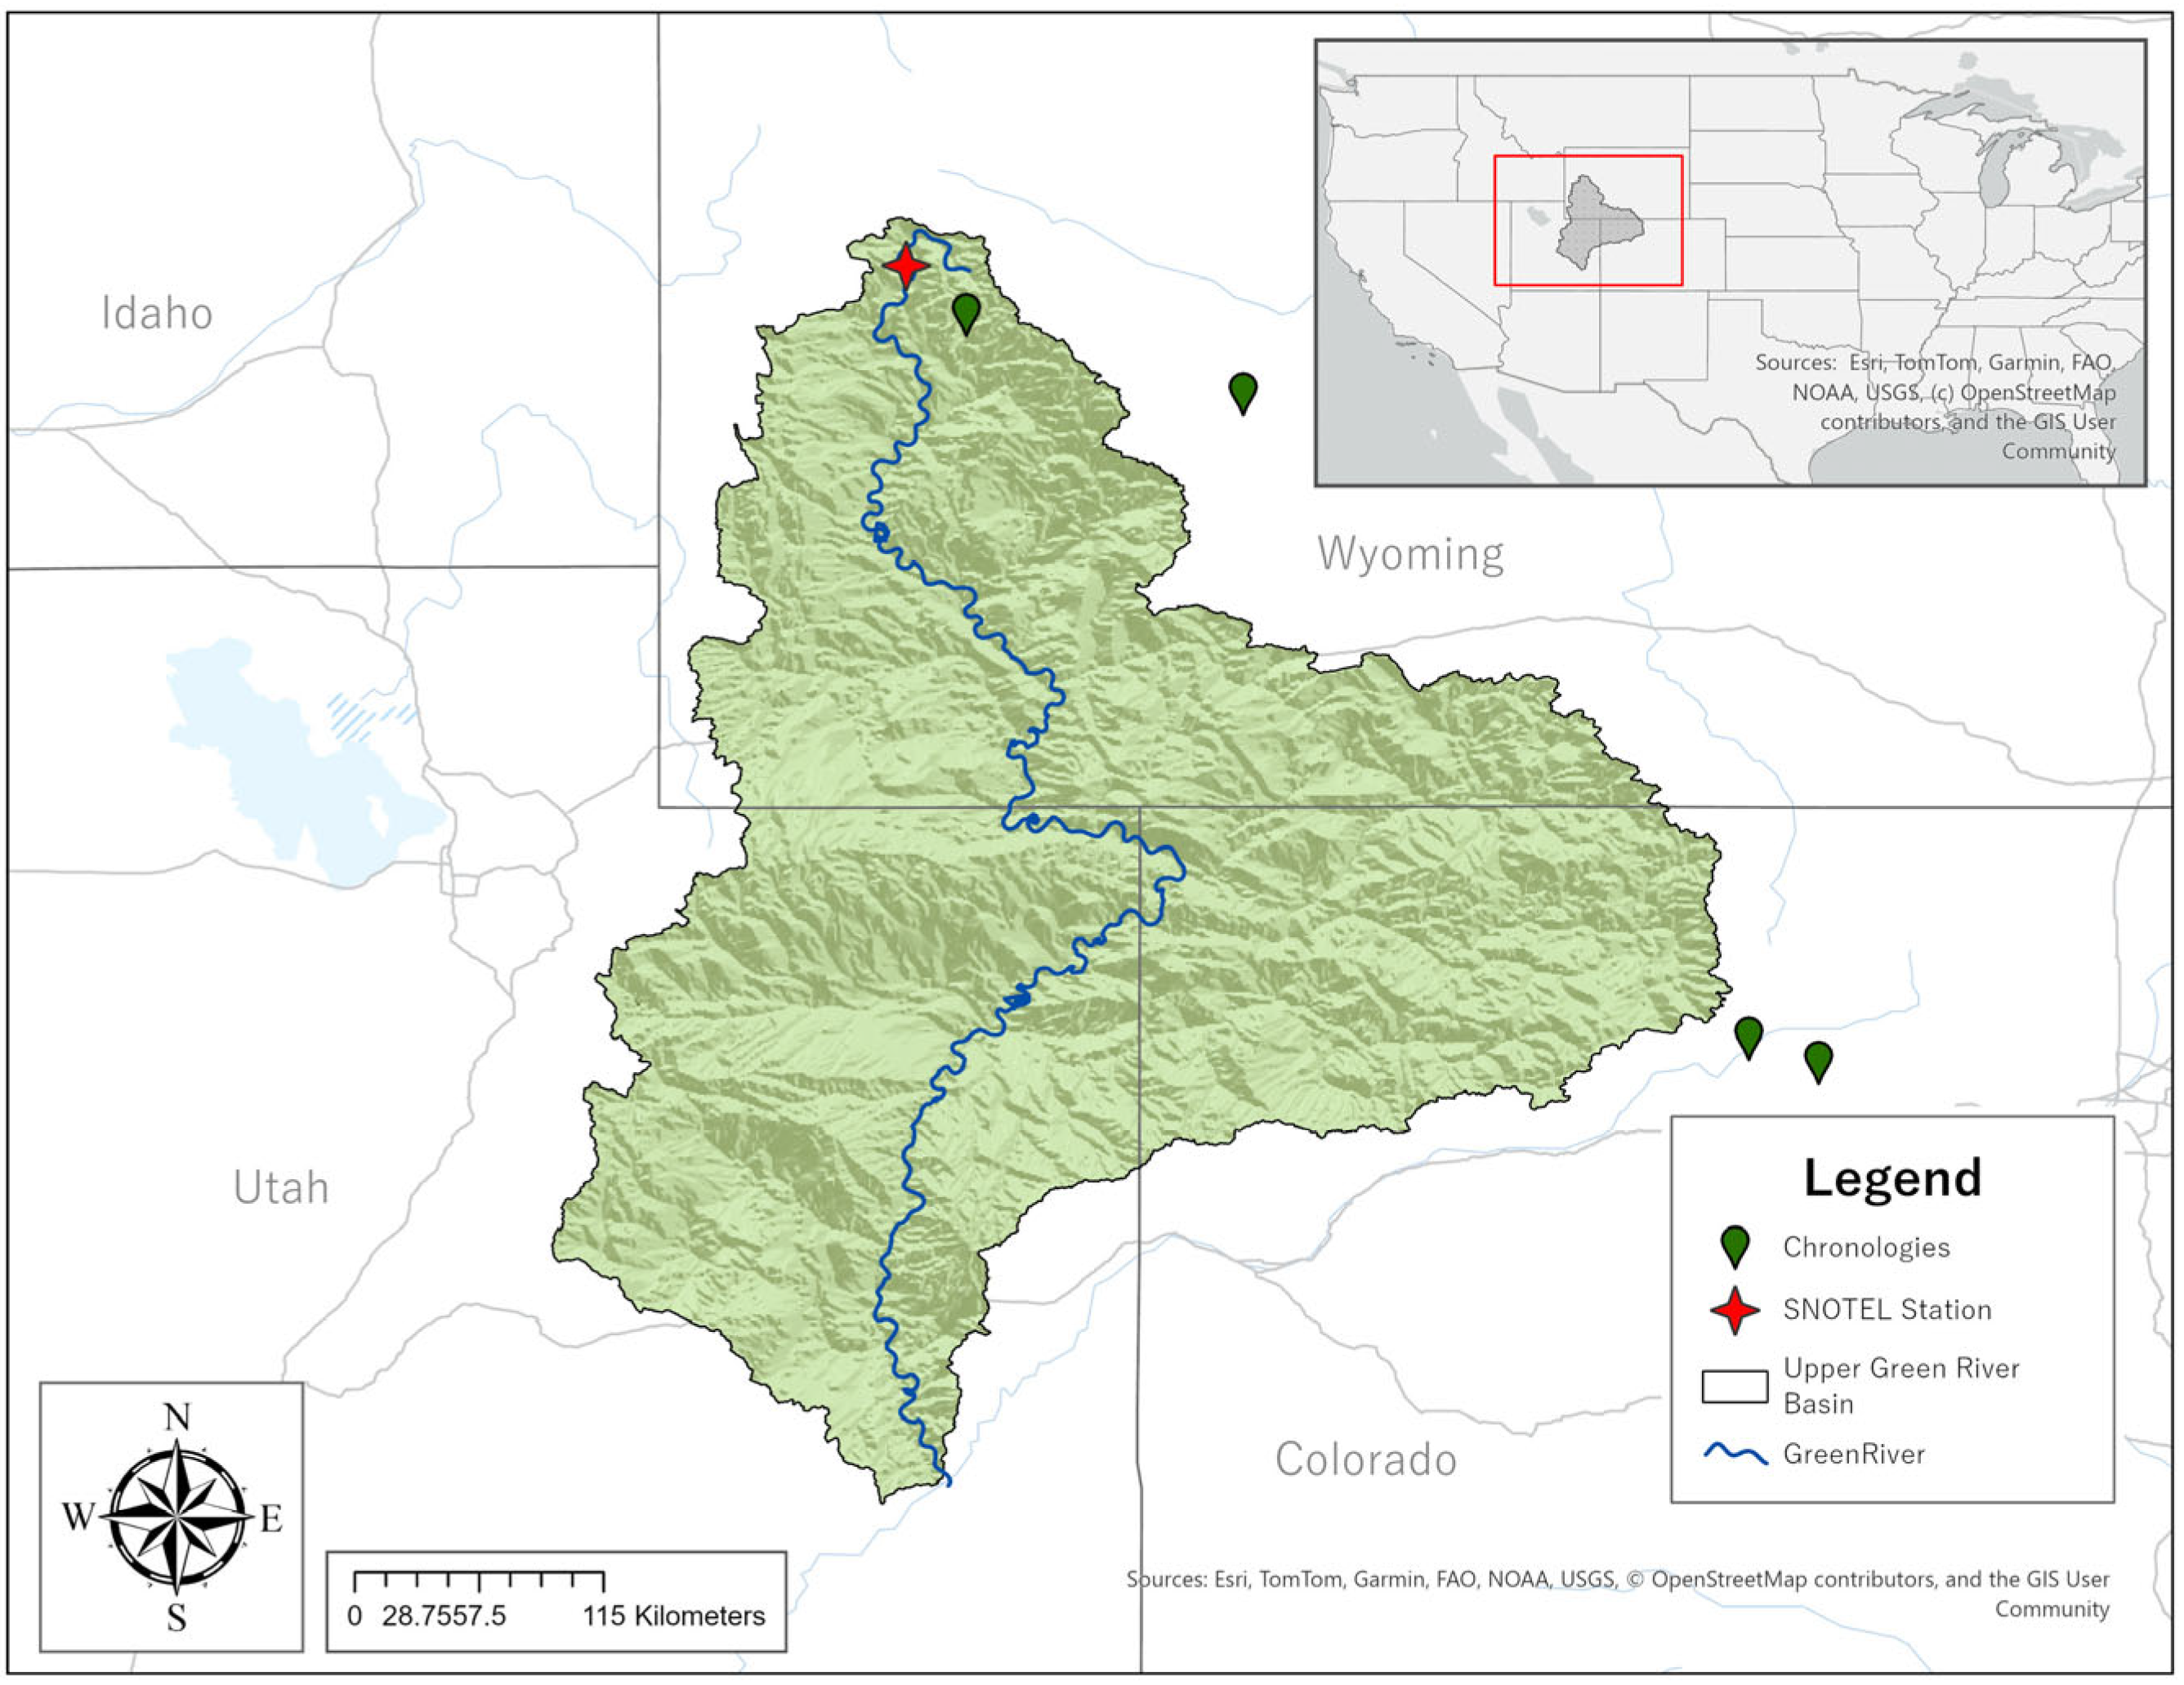
The challenge and research need was to “integrate” future projections of snowpack (e.g., ONDJFM cumulative precipitation for SSP 5-8.5) with reconstructions (using tree-ring chronologies and ENSO) of snowpack (e.g., April 1st SWE) to provide a paleo perspective of future drought. This research aligns with national priorities identified by the National Academies of Sciences, Engineering, and Medicine’s committee on The Future of Drought in the United States, which seeks improved methods for drought characterization [14]. Utilizing tree-ring chronologies and climate (ENSO), skillful reconstructions of ONDJFM cumulative precipitation at a single gauge site (Kendall R.S.) in the GRB (Figure 1) were developed and integrated with future (SSP 5-8.5) projections of ONDJFM cumulative precipitation. The current research investigated the additional gauges (e.g., Loomis Park and Snider Basin) included in the previous research efforts [10] and found similar results. Thus, the research presented here focused exclusively on the Kendall R.S. site. This allowed for the first-time integration of past (paleo, based on tree-ring and climate), recent past, and future (based on SSP 5–8.5) snowpack in the GRB (UCRB) at a single site. Both drought and wet (pluvial) periods in the integrated snowpack record were examined to assess future impacts on water supply in the UCRB.
Figure 1.
Location map showing the Green River Basin (watershed within the UCRB), Kendall R.S. SNOTEL site, and the four tree-ring chronologies retained in reconstruction models.
2. Materials and Methods
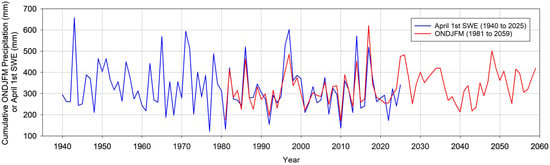
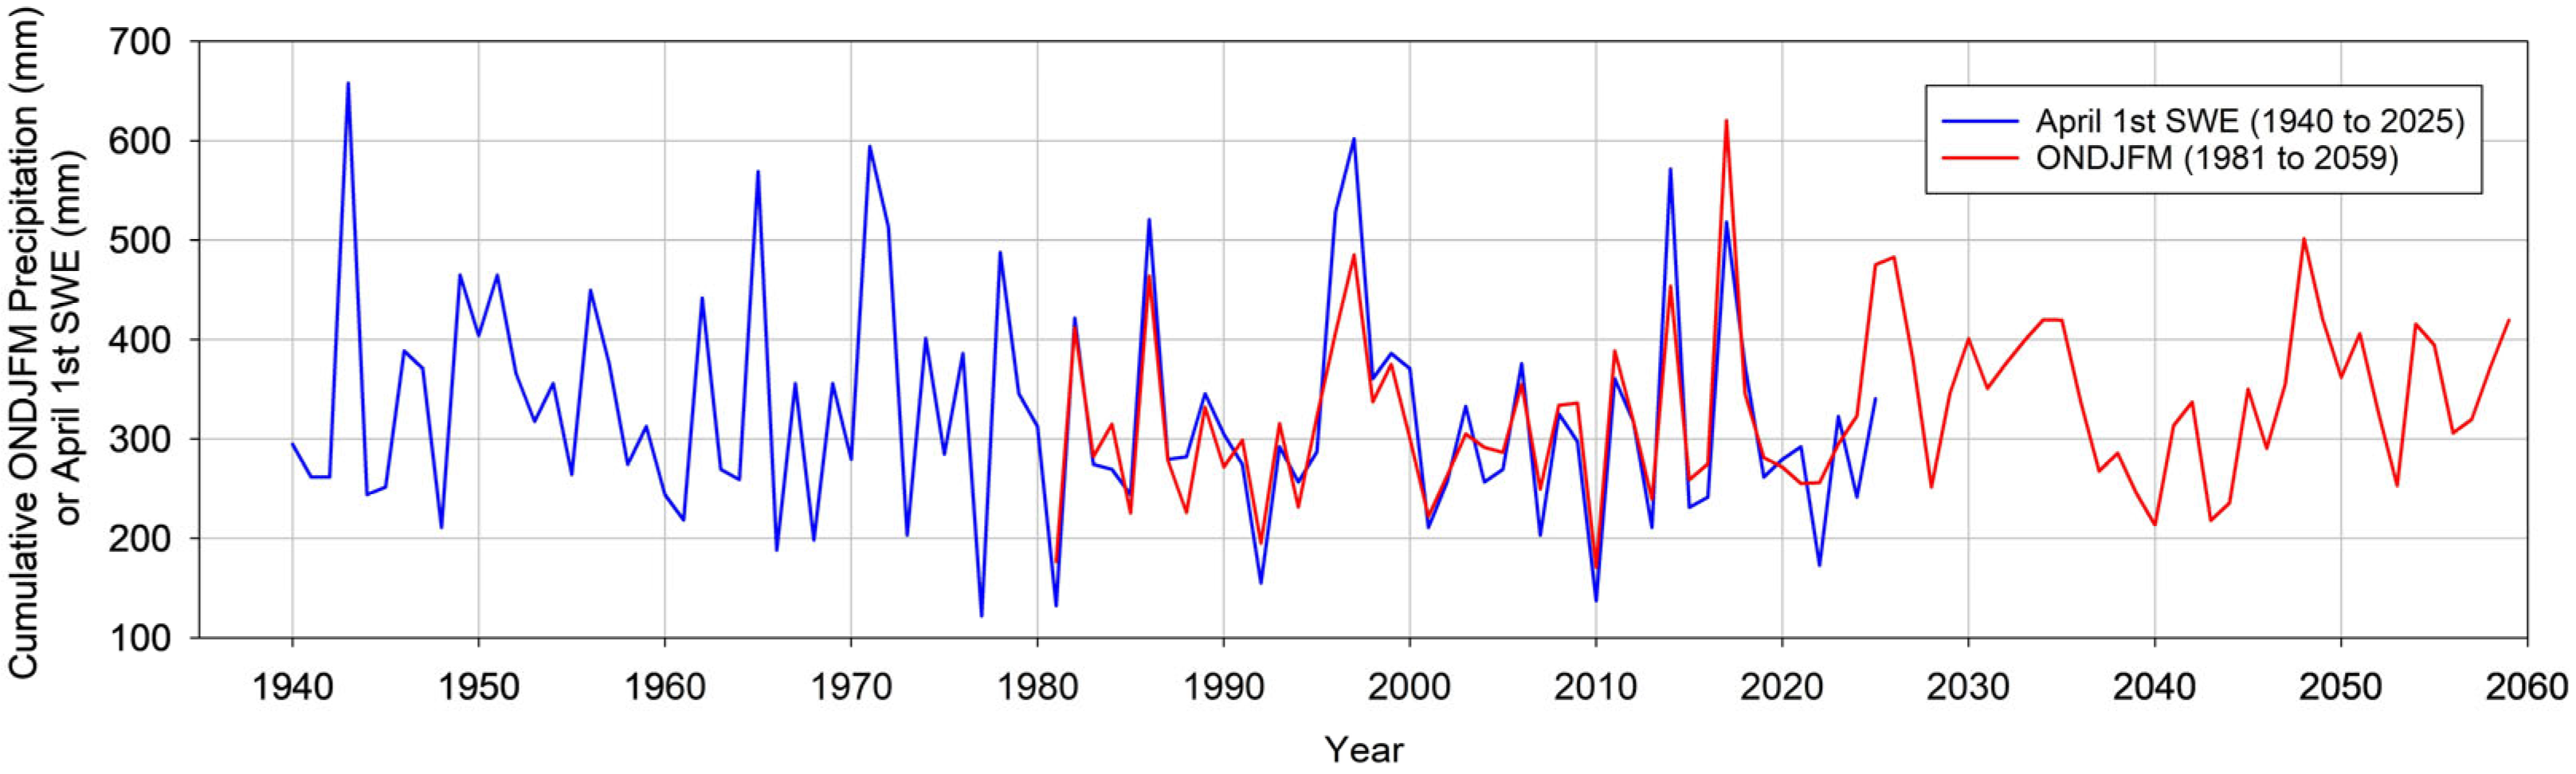
Seasonal (October, November, December, January, February, March, or ONDJFM) cumulative precipitation (millimeters or mm) was obtained for the grid point nearest the Kendall R.S. (SNOTEL–SNOwpack TELemetry Network) station (Latitude 43.25 and Longitude −110.02) [8]. The ONDJFM cumulative precipitation begins in 1980 (OND) and 1981 (JFM), and the beginning year of the vector was represented by 1981 (ONDJFM). The ONDJFM cumulative precipitation ends in 2058 (OND) and 2059 (JFM), and the end year of the vector was represented by 2059 (ONDJFM) [8]. The ONDJFM cumulative precipitation data consisted of hindcast data (1980 to 2014) and future data (2015 to 2059) based on SSP5-8.5, commonly referred to as the “worst case” future climate scenario [8]. The study [8] applied dynamical downscaling using the Regional Climate Model version 4 (RegCM4) to refine coarse-resolution CMIP6 global climate model outputs (~110 km) into high-resolution regional climate projections at ~4 km grid spacing. RegCM4 preserves the large-scale circulation patterns from the driving GCMs while explicitly resolving regional atmospheric processes, including terrain-induced precipitation, mesoscale convection, and land–atmosphere interactions [8]. This approach improved the representation of local hydroclimate dynamics that are often poorly captured by coarse global models. To further enhance accuracy, the downscaled outputs were bias-corrected using the Daymet V4 observational dataset, which adjusts precipitation and temperature distributions and improves the representation of extremes [8]. The resulting high-resolution dataset provided more realistic regional climate information for evaluating drought indices and regional hydrological variability [8]. Kendall R.S. April 1st SWE data consisted of snow course (in situ measurements) from 1940 to 1986, prior to the transition to the SNOTEL remote-sensed collection from 1987 to 2025 [15]. While uncertainty exists when comparing in situ and downscaled (modeled) datasets at a single grid point, we hypothesized that ONDJFM cumulative precipitation would show similarity (i.e., temporal variability and magnitude) to snow accumulation (e.g., the April 1st SWE measurement) for the overlapping period of 1981 to 2025. Figure 2 displays the strong relationship for this overlapping period of record (1981 to 2025), both temporally (r = 0.87) and in magnitude, between ONDJFM cumulative precipitation (average of 314 mm and standard deviation of 88 mm) and April 1st SWE (average of 311 mm and standard deviation of 107 mm) at the Kendall R.S. site. While measurements of April 1st SWE would incorporate losses due to temperature (snowmelt), the high elevation (2360 m) of the station likely minimizes March snowmelt.
Figure 2.
Kendall R.S. April 1st SWE (mm) from 1940 to 2025 and ONDJFM cumulative precipitation (mm) from 1981 to 2059.
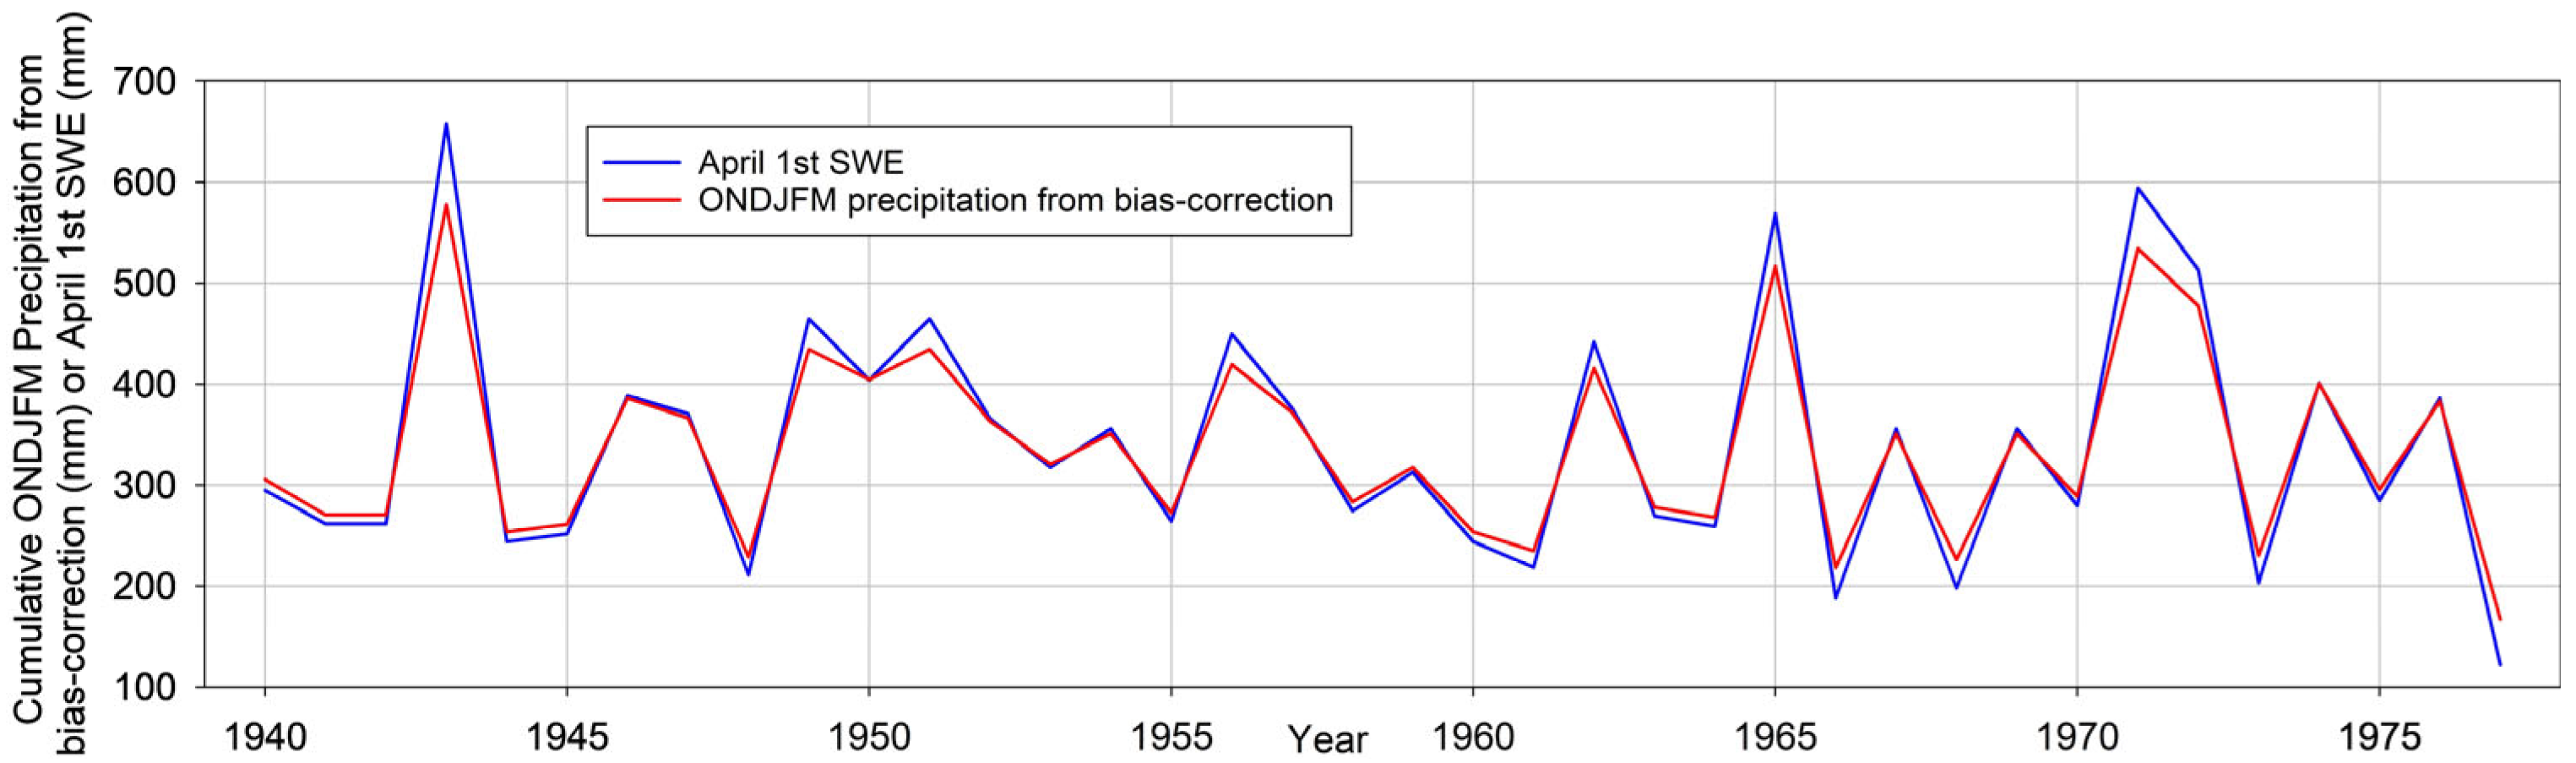
Previous research efforts [9] utilized an overlapping period of 1940 to 1977 between tree-ring chronologies and climate (e.g., El Niño–Southern Oscillation or ENSO) to develop a regional (applying Principal Component Analysis or PCA to multiple SNOTEL stations that included the Kendall R.S. station) reconstruction of April 1st SWE for the UCRB. The current research reconstructed ONDJFM cumulative precipitation at a single point (e.g., the Kendall R.S. station location) such that the future predictions (applying SSP 5-8.5) of ONDJFM cumulative precipitation can be integrated with the reconstructed ONDJFM cumulative precipitation to provide a paleo perspective of future snowpack drought in the UCRB. The challenge in reconstructing ONDJFM cumulative precipitation is that the beginning date for the dataset (1981) provides no overlap with many tree-ring chronologies, given the end date of 1977 used in the reconstruction [10]. Given the established strong relationship between Kendall R.S. April 1st SWE and ONDJFM cumulative precipitation for the overlapping period of 1981 to 2025 (Figure 2), we used Kendall R.S. April 1st SWE as a proxy to extend ONDJFM cumulative precipitation back to 1940. We applied bias-correction [16], using the overlapping period of 1981 to 2025 to extend the ONDJFM cumulative precipitation back in time to 1940 using Kendall R.S. April 1st SWE (Figure 3). The ONDJFM cumulative precipitation vector (1940 to 1977) developed from the bias correction and displayed in Figure 3 was used in the reconstruction models described below.
Figure 3.
Comparison of annual ONDJFM cumulative precipitation (mm) from bias correction versus annual April 1st SWE (mm) for the Kendall R.S. station for the overlapping period (1940 to 1977) used in the reconstruction models.
As described in [10], the fifty (50) tree-ring chronologies and, to represent climate (El Niño–Southern Oscillation or ENSO), the reconstructed Southern Oscillation Index (SOI) [17] were used as reconstruction proxies in the current research. An additional proxy of reconstructed ENSO, the reconstructed Niño 3.4 index [18], was also considered. The reconstructed Niño 3.4 extends back to 1301, while the reconstructed SOI extends back to 1706. Thus, the inclusion of the reconstructed Niño 3.4 may extend the reconstruction of ONDJFM cumulative precipitation. The reconstruction methods described in [10] were repeated in the current research efforts. Hereon were the steps to develop the RECON 1 and RECON 2 models:
- (1)
- Pre-screening of tree-ring chronologies: Two prescreening steps were performed to determine which tree-ring proxies can be used in the Stepwise Linear Regression (SLR) model.
- (2)
- Pre-screening Step 1 correlated ONDJFM precipitation and tree-ring chronologies. The correlations must meet or exceed a positive correlation of 95% (p ≤ 0.05) [10]. Step 1 identified tree-ring proxies that are highly (positively) correlated over the entire period of record. Per [10], the overlapping period of record was 1940 to 1977 to include all tree-ring proxies.
- (3)
- Pre-screening Step 2 investigated stability throughout the record by using the retained tree-ring proxies from Step 1. Step 2 used a moving correlation window of approximately one-third of the total record, and all correlation values were required to be positive [10].
- (4)
- The SLR model (Forward-Backwards) [19] was applied to reconstruct ONDJFM cumulative precipitation (1940 to 1977) for the Kendall R.S. site, incorporating the tree-ring chronologies retained from the pre-screening steps. For RECON 1, the SOI was included, while for RECON 2, the Niño 3.4 was included.
- (5)
- For RECON 1 and RECON 2, a variety of statistics were evaluated to determine reconstruction skill such as R2, R2 predicted (using drop-one cross validation), Variation Inflation Factor or VIF (evaluates multicollinearity) [20], the Durbin–Watson (DW) statistic (evaluates autocorrelation) [21], and the Sign Test (evaluates if the model is over or underestimating).
- (6)
- The RECON 1 and RECON 2 reconstructions were bias corrected applying the same technique used to develop the ONDJFM cumulative precipitation vector (1940 to 1977) [16]. The bias correction technique applied a quantile mapping approach, which adjusts predicted (reconstructed) values based on the overlap (1940 to 1977) between ONDJFM cumulative precipitation and the ONDJFM values determined in the reconstruction models [16].
- (7)
- Upon completion of the reconstructions of ONDJFM cumulative precipitation for each of the two models, the bias-corrected reconstructed data were integrated with recent past and future (1981 to 2059) ONDJFM cumulative precipitation, and 5-year and 10-year end-of-year filters (moving averages) were applied. These window lengths were selected to capture both short-term (multi-year) and decadal drought and pluvial variability, consistent with drought characterization approaches used in paleoclimate reconstructions [10,11]. Shorter windows (e.g., 2–3 years) may capture seasonal anomalies rather than sustained drought periods, while longer windows (e.g., 20–30 years) may obscure the temporal structure of individual drought events. The future (2026 to 2059) 5-year or 10-year low ONDJFM cumulative precipitation was then projected back to the recent past and reconstructed records. This allows for comparison of the “worst” future 5-year or 10-year drought to those droughts observed in the recent past and reconstructed (paleo) record.
3. Results
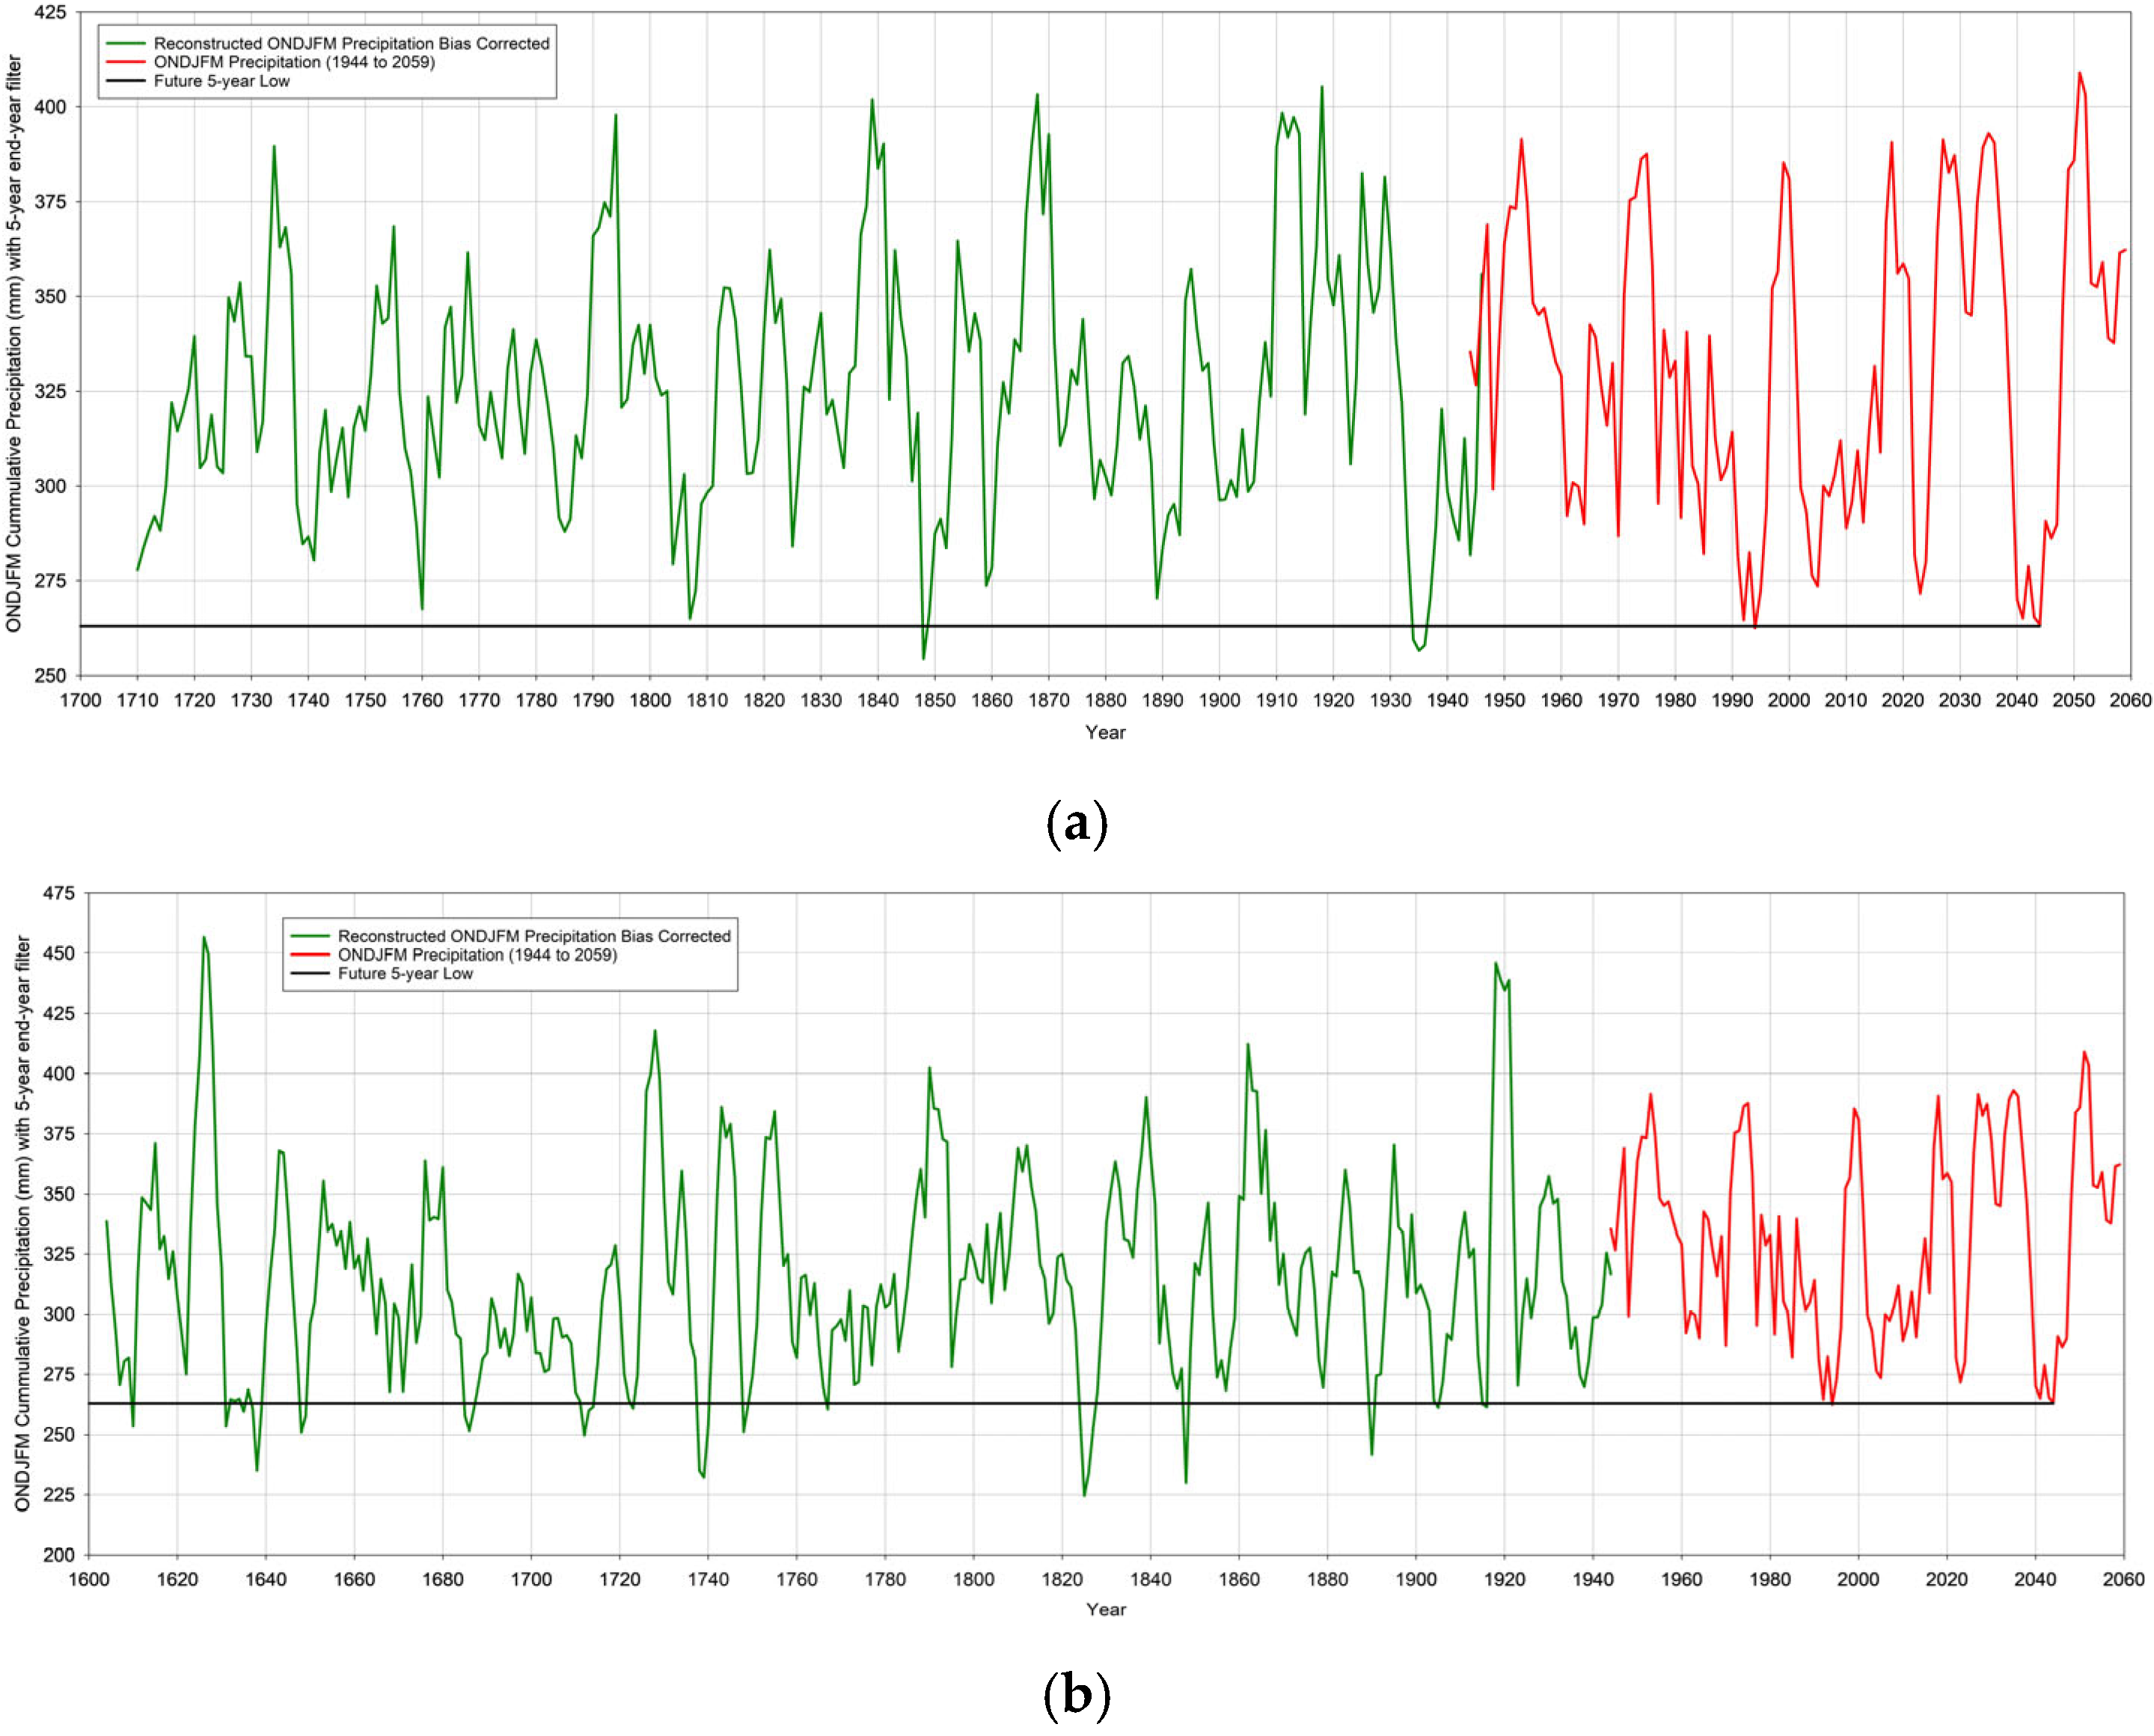
For both RECON 1 and RECON 2, the ONDJFM cumulative precipitation reconstruction skill was exceptional as all skill statistic thresholds were exceeded (Table 1). Filters (5-year end-year, Figure 4, and 10-year end-year, Figure 5) were applied to the reconstructed (green line) and the combined recent past/future (based on SSP 5-8.5) (red line). The RECON 1 reconstruction was limited in the length of record (early 1700s) by the reconstructed SOI (Table 1). The RECON 2 reconstruction was limited in length of record (early 1600s) by the Red Canyon Upper tree-ring chronology (Table 1). The use of the reconstructed Niño 3.4 increased the reconstruction length of record by ~100 years, although reconstruction skill (e.g., R2, etc.) was reduced (Table 1).
Table 1.
Reconstruction, period of overlap (period), reconstructed: R2, R2 predicted (R2P), variation inflation factor (VIF), Durbin–Watson (DW), sign test (ST), and regression equation (RE) [with tree-ring chronology or ENSO (SOI or Niño 3.4) in parenthesis]. The SOI and Niño 3.4 indices are dimensionless, as are the tree-ring chronologies (standardized ring-width index).
Figure 4.
Five-year, end-of-year, filtered, bias-corrected, reconstructed (green line), recent past–future (red line), and lowest future (black line) ONDJFM precipitation (mm) for (a) RECON 1 (b) and RECON 2.
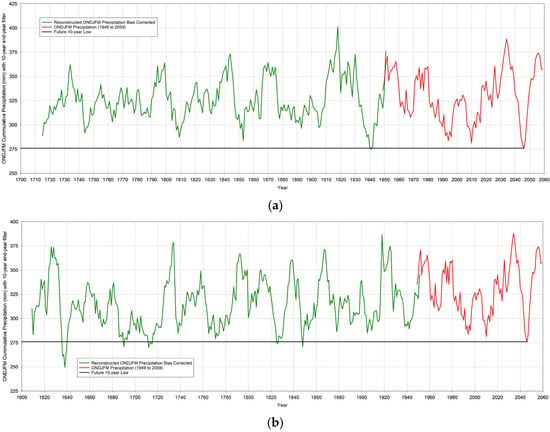
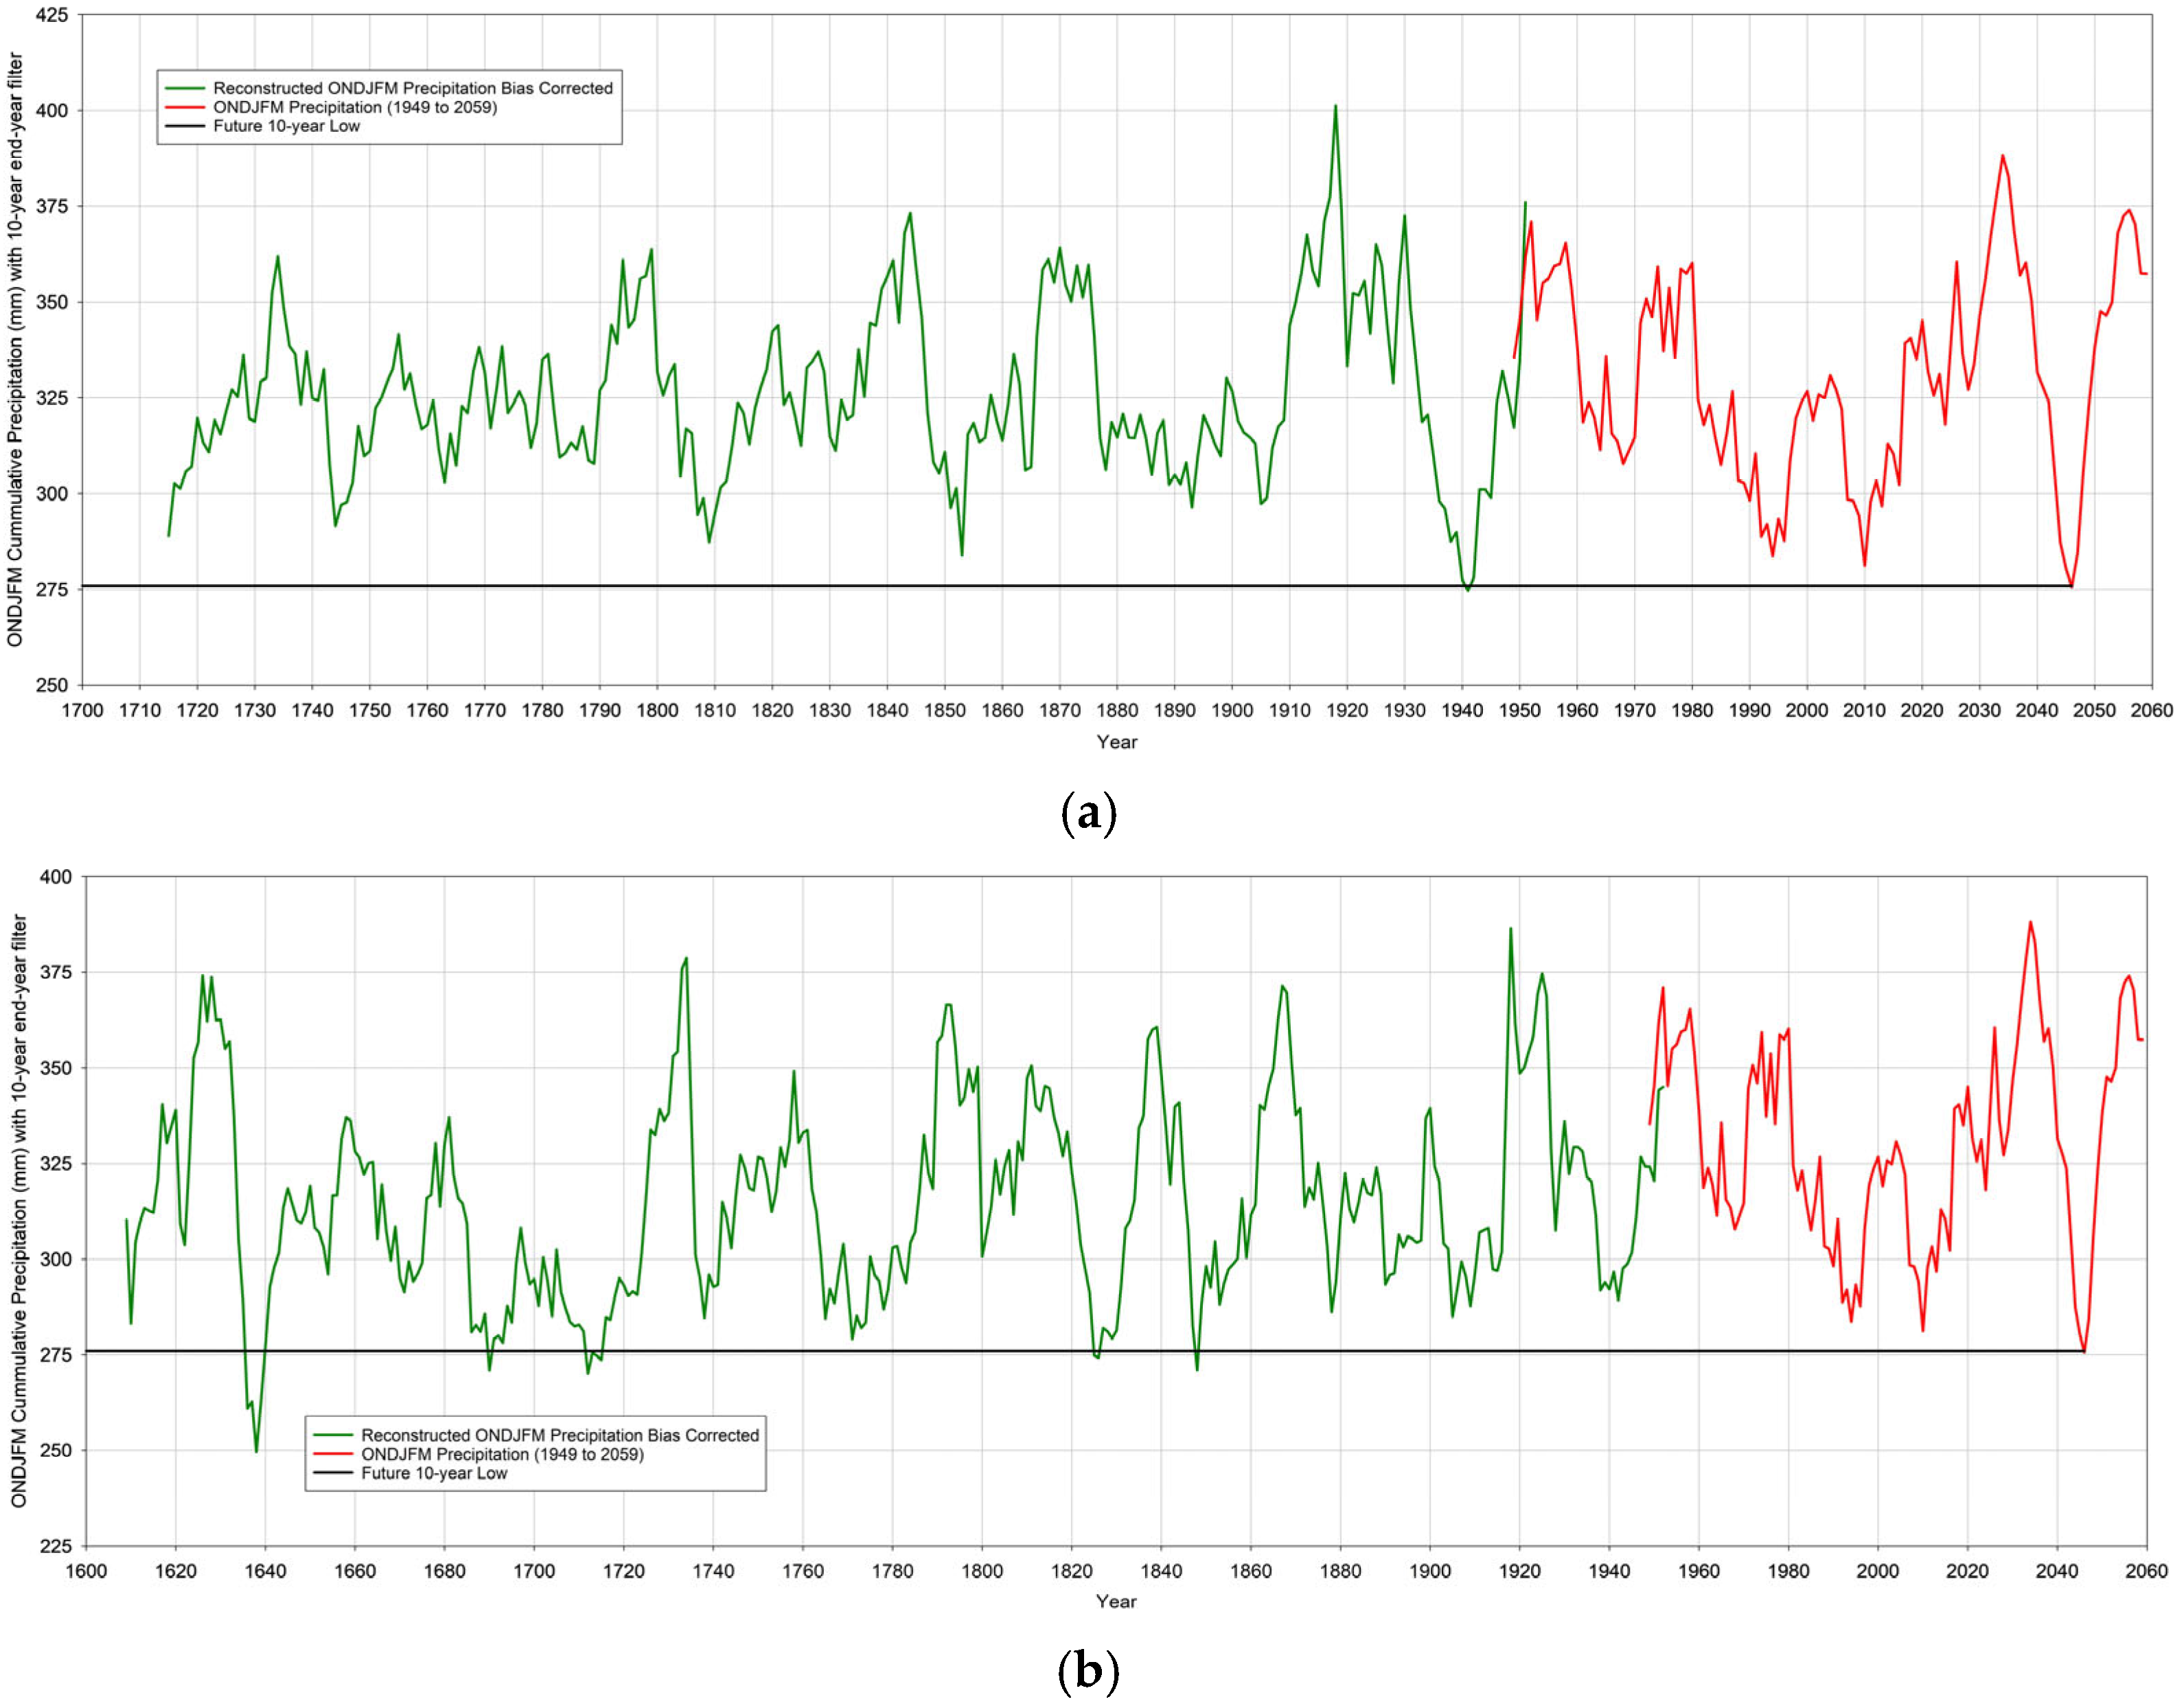
Figure 5.
Ten-year, end-of-year, filtered, bias-corrected, reconstructed (green line), recent past–future (red line), and lowest future (black line) ONDJFM precipitation (mm) for (a) RECON 1 and (b) RECON 2.
An interesting result was the impact of using either the reconstructed SOI (RECON 1) or the reconstructed Niño 3.4 (RECON 2) to develop regression equations. As displayed in Table 1 and Table 2, the tree-ring chronologies (Green Mountain Reservoir and Freemont Lake) retained in RECON 1 when using the reconstructed SOI differed from the tree-ring chronologies (Pumphouse and Red Canyon Upper) retained in RECON 2 when using the reconstructed Niño 3.4. The resulting regression equations and results differed, which benefits by providing uncertainty in the reconstruction. Note that the Freemont Lake and Red Canyon Upper tree-ring chronologies were developed per [12]. When comparing the reconstructed SOI to the reconstructed Niño 3.4 for the overlapping period for the reconstruction models (1940 to 1977), the correlation was r = −0.57. The negative value was expected given a negative (positive) SOI value and a positive (negative) Niño 3.4 value, identifying an El Niño (La Niña). While significant (p < 0.01), the lack of a “strong” r value revealed a difference in the temporal variability of each ENSO index and likely contributed to the different regression models (RECON 1 and RECON 2).
Table 2.
Tree-ring chronologies retained in RECON 1 and RECON 2, including chronology name, state, latitude, longitude, elevation, species, and earliest-year. All four chronology sites are located at or near the upper treeline.
The previous research efforts in reconstructing regional April 1st SWE retained the Freemont Lake tree-ring chronology along with the reconstructed SOI [10]. The regional reconstruction identified that the “worst” 5-year drought occurred in ~1945, while the “worst” 10-year drought occurred in ~1745. RECON 1 identified the “worst” 5-year droughts in the 1930s and 1840s (Figure 4a). The addition of the Green Mountain Reservoir tree-ring chronology in the reconstruction model, along with the use of the single Kendall R.S. station (and ONDJFM cumulative precipitation) in lieu of a regional reconstruction of April 1st SWE, likely impacted the difference in the results. It should be noted that the regional April 1st SWE reconstruction skill (R2 = 0.58, R2 predicted = 0.50, Durbin Watson = 1.9 per [10]) was similarly exceptional to that of RECON 1. However, the previous regional reconstruction of April 1st SWE was not bias corrected. Although the sign test passed, the 32/6 results [10] revealed skewness in the regional reconstruction, which could account for differences in identifying past drought periods.
The 5-year droughts (Figure 4) varied between the two reconstruction models (RECON 1 and RECON 2). This is likely attributed to retaining different tree-ring chronologies and the use of different ENSO reconstructions (SOI and Niño 3.4). It is important to note that given the lengths of the reconstructions vary (RECON 1 to ~1700 and RECON 2 to ~1600), a visual comparison (per below) was challenging. The “worst” 5-year future drought (~2040s) appears to be matched in the recent past (1990s). RECON 1 displays approximately two paleo droughts that exceed the 1990s/2040s drought, while RECON 2 displays ~15 droughts that exceed the 1990s/2040s drought. While the two reconstructions provide uncertainty, both confirm paleo 5-year drought periods that exceed the “worst” future 5-year drought when evaluating the “worst case” SSP 5-8.5 model for future ONDJFM cumulative precipitation predictions.
Like the 5-year droughts, the 10-year droughts (Figure 5) varied between the two reconstruction models (RECON 1 and RECON 2). The noticeable difference between the 10-year and the 5-year droughts were (1) the “worst” future 10-year drought was not exceeded in the recent past period of record (1981 to 2025), and (2) the 10-year droughts in the reconstructed (paleo) record that exceed the “worst” future 10-year drought were fewer in frequency when compared to the frequency of 5-year droughts. Both the 5-year (Figure 4) and 10-year (Figure 5) show a severe future drought which “peaks” (minimum) in the 2040s, followed by a robust period of increased ONDJFM cumulative precipitation. While the future decline in ONDJFM cumulative precipitation is severe, the reconstructed records for both models (RECON 1 and RECON 2) for both filters (5-year and 10-year) display multiple “worst” droughts.
4. Discussion
For both models (RECON 1 and RECON 2) and both filters (5-year and 10-year), the most robust (wettest) period was generally observed during the 1910s and 1920s. This was an important observation as it confirmed the reconstruction model results and the current challenges with the management of the Colorado River Basin. The Colorado River Compact was established in the 1920s and provided allocation of streamflow to both the upper basin and lower basin states. The streamflow measurements from the Colorado River from the period of 1905 to 1922 were used to establish these allocations, and this period was identified as having the highest average annual flow in the 20th century [22].
A visual comparison of the Kendall R.S. ONDJFM cumulative precipitation reconstruction (10-year filter, Figure 5a) to the regional April 1st SWE reconstruction referenced in ref [10] (10-year filter, Figure 3c in that study) revealed similar mid-18th century, early-19th century, mid-19th century, and mid-20th century (most severe in both studies) droughts. A limitation of the previous regional April 1st SWE reconstruction was the lack of applying bias correction. Similarly, a visual comparison of the Kendall R.S. ONDJFM cumulative precipitation reconstruction (5-year filter, Figure 4a) to the annual, regional soil moisture reconstruction reported in [11] (5-year filter, Figure 5a in that study) displayed similar temporal variability with droughts in ~1740, ~1760, ~1810, ~1850, and ~1940 (most severe in both studies).
Based on the reconstructed record, the projected ~2040s drought is exceeded by approximately 2 paleo events (RECON 1, 5-year filter) to ~15 paleo events (RECON 2, 5-year filter), suggesting a low-to-moderate historical frequency of droughts of this severity. For the 10-year filter, fewer paleo exceedances were identified in both models, indicating that a sustained decadal drought of the projected magnitude would be rare in the context of the paleo record.
Recent studies reveal that UCRB snowpack will likely decline under the SSP5-8.5 scenario, while precipitation variability was substantial [23,24,25]. Studies concur with the observations at the Kendall R.S. station that winter (ONDJFM) cumulative precipitation may increase during the 21st century. However, rising temperatures shift the form of the precipitation from snowfall to rainfall. This results in reduced seasonal snow storage and lower SWE. Episodic pluvial conditions, as observed at the Kendall R.S. station until ~2035, may occur but within a broader long-term decline in snowpack and earlier snowmelt. These changes reflect the increasing sensitivity of western United States mountain snowpacks to warming temperatures and the upward elevation migration of the snow-to-rain transition in the UCRB [23,24,25].
While the current research focused on a single site (Kendall R.S.) within the Upper Green River Basin, the similar results obtained at nearby stations (Loomis Park and Snider Basin) suggest that the findings are spatially consistent within the upper GRB headwaters. However, caution is warranted when extrapolating these results to the broader UCRB, as snowpack dynamics can vary substantially with elevation, aspect, and basin geography. The single-site approach was necessitated by the availability of co-located future ONDJFM precipitation projections and is considered a limitation of the current study.
5. Conclusions
The use of April 1st SWE as a proxy to extend ONDJFM cumulative precipitation for the Kendall R.S. station displayed excellent annual temporal variability while capturing the annual magnitude (mm) of ONDJFM cumulative precipitation (Figure 2). In evaluating ONDJFM cumulative precipitation across several millennia, past and projected:
- Given the exceptional reconstruction skill displayed by both RECON 1 and RECON 2, we have high confidence in the reconstructions presented.
- Future ONDJFM cumulative precipitation, based on the “worst case” SSP 5-8.5 scenario, displayed a severe drought in the ~2040s.
- The reconstructed (paleo) record revealed multiple droughts that exceed the predicted (future ~2040s) drought.
- The future appeared to show a pattern of extreme wet (~2030s) to extreme dry/drought (~2040s) to extreme wet (2050s).
- The future extreme wet periods appear to exceed recent past and reconstructed past wet periods, while future dry (drought) periods were exceeded in either the recent past or reconstructed periods.
The use of tree-ring chronologies and climate (ENSO) to reconstruct ONDJFM precipitation, combined with future projections of ONDJFM precipitation, provides a paleo perspective of future drought and pluvials in the UCRB. The study was limited to the “worst” case SSP5-8.5 scenario, and precipitation (not snowpack or SWE) was evaluated. Future research may consider other, less severe SSP(s) and resulting projections of precipitation.
Author Contributions
Conceptualization, A.A.R.M., G.T. and Z.S.; methodology, A.A.R.M. and G.T.; software, A.A.R.M. and Z.S.; validation, A.A.R.M. and G.T.; formal analysis, A.A.R.M. and G.T.; investigation, A.A.R.M. and G.T.; resources, J.F.; data curation, J.F.; writing—original draft preparation, A.A.R.M. and G.T.; writing—review and editing, A.A.R.M., G.T., Z.S. and J.F.; visualization, A.A.R.M. and G.T.; supervision, G.T.; project administration, A.A.R.M. and G.T.; funding acquisition, G.T. and J.F. All authors have read and agreed to the published version of the manuscript.
Funding
This study was supported by the Cooperative Institute for Research to Operations in Hydrology (CIROH) through the project “CIROH: Evaluating model selection impacts on forecast uncertainty in the Upper Colorado River Basin: Implications for USGS modeling and monitoring.” Additional support provided by the National Science Foundation Research Traineeship (NRT), Research to Operations in Data-driven Hydrologic Forecasting and Decision-making (Water-R2O), Award No. 2152140. Previous support was provided by the National Science Foundation Paleo Perspectives on Climate Change (P2C2) program under Award No. AGS-1003393.
Data Availability Statement
The data supporting the results of this study are available and archived at The University of Alabama (please contact the corresponding author).
Acknowledgments
The authors wish to thank The University of Alabama, Alabama Water Institute (AWI), and the Cooperative Institute for Research to Operations in Hydrology (CIROH) for their institutional support.
Conflicts of Interest
The authors declare no conflicts of interest.
Abbreviations
The following abbreviations are used in this manuscript:
| UCRB | Upper Colorado River Basin |
| ONDJFM | October, November, December, January, February, and March |
| SWE | Snow Water Equivalent |
| ENSO | El Niño–Southern Oscillation |
| SSP | Shared Socioeconomic Pathway |
| SNOTEL | SNOwpack TELemetry Network |
| PCA | Principal Component Analysis |
| SOI | Southern Oscillation Index |
| SLR | Stepwise Linear Regression |
| R2 | Coefficient of Determination |
| R2P | R-squared Predicted |
| VIF | Variation Inflation Factor |
| DW | Durbin Watson |
| ST | Sign Test |
| RE | Regression Equation |
| RECON 1 | Reconstruction Model #1 |
| RECON 2 | Reconstruction Model #2 |
References
- United States Department of Agriculture, Natural Resources Conservation Service (USDA NRCS). Snow Survey and Water Supply Forecasting Program. Available online: https://www.nrcs.usda.gov/programs-initiatives/sswsf-snow-survey-and-water-supply-forecasting-program (accessed on 28 July 2025).
- U.S. Geological Survey. How Much Snow for Colorado River Flow? 2025. Available online: https://www.usgs.gov/centers/geosciences-and-environmental-change-science-center/science/how-much-snow-colorado-river (accessed on 16 January 2026).
- United States Department of Agriculture, Natural Resources Conservation Service, Colorado Snow Survey. Colorado’s Snowpack Declines as Summer Precipitation Patterns Begin. 2025. Available online: https://www.nrcs.usda.gov/state-offices/colorado/news/colorados-snowpack-declines-as-summer-precipitation-patterns-begin (accessed on 16 January 2026).
- Hogan, M.; Barnhart, T.; Williams, M.; Livneh, B. Recent Upper Colorado River Streamflow Declines Driven by Loss of Spring Precipitation. Geophys. Res. Lett. 2024, 51, e2024GL109826. [Google Scholar] [CrossRef] [Scilit]
- Heldmyer, A.; Kampf, S.; Fassnacht, S. A 21st-Century Perspective on Snow Drought in the Upper Colorado River Basin. J. Am. Water Resour. Assoc. 2023, 59, 1027–1042. [Google Scholar] [CrossRef] [Scilit]
- Bass, B.; Milly, P.C.D.; Dunne, K.A.; Dettinger, M.D.; Famiglietti, J.S. Aridification of the United States Driven Water Losses Despite Ameliorating Effects of Vegetation. Water Resour. Res. 2023, 59, e2022WR033454. [Google Scholar] [CrossRef] [Scilit]
- Naple, A.; Skiles, S.M.; Painter, T.H. Dust-on-Snow Radiative Forcing and Contribution to Melt in the Colorado River Basin. Geophys. Res. Lett. 2025, 52, e2025GL110155. [Google Scholar] [CrossRef] [Scilit]
- Zhang, L.; Rubin, H.J.; Chien, R.-Y.; Fu, J.S.; Rastogi, D.; Kao, S.-C.; Ashfaq, M. Projected Evolution of Droughts and Human Exposure in the Contiguous United States under SSP5-8.5: A Regional Downscaling Perspective. Environ. Res. Lett. 2025, 20, 094021. [Google Scholar] [CrossRef] [Scilit]
- National Science Foundation (NSF). P2C2: Upper Colorado River Basin Snowpack Reconstructions Incorporating Climate Variability. Award Abstract # 1003393. Available online: https://www.nsf.gov/awardsearch/show-award?AWD_ID=1003393 (accessed on 28 July 2025).
- Anderson, S.; Moser, C.; Tootle, G.A.; Grissino-Mayer, H.D.; Timilsena, J.; Piechota, T. Snowpack Reconstructions Incorporating Climate in the Upper Green River Basin (Wyoming). Tree-Ring Res. 2012, 68, 105–144. [Google Scholar] [CrossRef] [Scilit] [PubMed]
- Anderson, S.; Tootle, G.; Grissino-Mayer, H. Reconstructions of Soil Moisture for the Upper Colorado River Basin Using Tree-Ring Chronologies. J. Am. Water Resour. Assoc. 2012, 48, 849–858. [Google Scholar] [CrossRef] [Scilit]
- Barnett, F.A.; Gray, S.; Tootle, G. Upper Green River Basin (United States) Streamflow Reconstructions. J. Hydrol. Eng. 2010, 15, 567–579. [Google Scholar] [CrossRef] [Scilit]
- Anderson, S.; Aziz, O.; Tootle, G.; Grissino-Mayer, H.; Barnett, A. Using Pacific Ocean Climatic Variability to Improve Hydrologic Reconstructions. J. Hydrol. 2012, 434, 69–77. [Google Scholar] [CrossRef] [Scilit]
- National Academies of Sciences, Engineering, and Medicine. Approaches for Future Drought Characterization, Assessment, and Response. Available online: https://www.nationalacademies.org/projects/DELS-WSTB-24-02 (accessed on 16 January 2026).
- United States Department of Agriculture (USDA). Natural Resources Conservation Service (NRCS). Water and Climate Data Collection and Stewardship. Available online: https://www.nrcs.usda.gov/resources/education-and-teaching-materials/water-and-climate-data-collection-and-stewardship (accessed on 28 July 2025).
- Robeson, S.M.; Maxwell, J.T.; Ficklin, D.L. Bias Correction of Paleoclimatic Reconstructions: A New Look at 1200+ Years of Upper Colorado River Flow. Geophys. Res. Lett. 2020, 47, e2019GL086689. [Google Scholar] [CrossRef] [Scilit]
- Stahle, D.W.; D’Arrigo, R.D.; Krusic, P.J.; Cleaveland, M.K.; Cook, E.R.; Allan, R.J.; Cole, J.E.; Dunbar, R.B.; Therrell, M.D.; Gay, D.A.; et al. Experimental Dendroclimatic Reconstruction of the Southern Oscillation. Bull. Am. Meteorol. Soc. 1998, 79, 2137–2152. [Google Scholar] [CrossRef] [Scilit]
- Li, J.; Xie, S.-P.; Cook, E.R.; Morales, M.S.; Christie, D.A.; Johnson, N.C.; Chen, F.; D’Arrigo, R.D.; Fowler, A.M.; Gou, X.; et al. NOAA/WDS Paleoclimatology–700-Year El Niño/Southern Oscillation (ENSO) Niño3.4 Index Reconstruction; Dataset; NOAA National Centers for Environmental Information: Asheville, NC, USA, 2013. [CrossRef]
- Woodhouse, C.A. A 431-Year Reconstruction of Western Colorado Snowpack from Tree Rings. J. Clim. 2003, 16, 1551–1561. [Google Scholar] [CrossRef] [Scilit]
- O’Brien, R.M. A Caution Regarding Rules of Thumb for Variance Inflation Factors. Qual. Quant. 2007, 41, 673–690. [Google Scholar] [CrossRef] [Scilit]
- Durbin, J.; Watson, G.S. Testing for Serial Correlation in Least Squares Regression, I. Biometrika 1950, 37, 409–428. [Google Scholar] [PubMed]
- Webb, R.H.; McCabe, G.J.; Hereford, R.; Wilkowske, C.D. Climatic Fluctuations, Drought, and Flow in the Colorado River Basin; U.S. Geological Survey Fact Sheet 2004-3062, Version 2; U.S. Geological Survey: Reston, VA, USA, 2004. [CrossRef] [Scilit]
- Siirila-Woodburn, E.R.; Rhoades, A.M.; Hatchett, B.J.; Huning, L.S.; Szinai, J.; Tague, C.; Nico, P.S.; Feldman, D.R. A low-to-no-snow future and its impacts on water resources in the western United States. Nat. Rev. Earth Environ. 2021, 2, 800–819. [Google Scholar] [CrossRef] [Scilit]
- Mote, P.W.; Li, S.; Lettenmaier, D.P.; Xiao, M.; Engel, R. Dramatic declines in snowpack in the western United States. npj Clim. Atmos. Sci. 2018, 1, 2. [Google Scholar] [CrossRef] [Scilit]
- Musselman, K.N.; Lehner, F.; Ikeda, K.; Clark, M.P.; Prein, A.F.; Liu, C.; Barlage, M.; Rasmussen, R. Projected increases and shifts in rain-on-snow flood risk over western North America. Nat. Clim. Chang. 2021, 11, 772–778. [Google Scholar] [CrossRef] [Scilit]

Disclaimer/Publisher’s Note: The statements, opinions and data contained in all publications are solely those of the individual author(s) and contributor(s) and not of MDPI and/or the editor(s). MDPI and/or the editor(s) disclaim responsibility for any injury to people or property resulting from any ideas, methods, instructions or products referred to in the content. |
© 2026 by the authors. Licensee MDPI, Basel, Switzerland. This article is an open access article distributed under the terms and conditions of the Creative Commons Attribution (CC BY) license.