


Abstract
This study presents a robust deep learning-based approach for temperature sensing using Fiber Specklegram Sensors (FSS), leveraging an extended experimental framework to evaluate model generalization. A convolutional neural network (CNN), specifically a customized MobileNet architecture (MNet-reg), was trained on multiple experimental datasets to assess the impact of increasing data availability on sensing accuracy. Generalization is evaluated as cross-dataset performance under unseen experimental realizations, rather than under controlled intra-dataset splits. The experimental setup utilized a multi-mode optical fiber (MMF) (core diameter 62.5 µm) subjected to controlled thermal cycles via a PID-regulated heating system. The curated dataset comprises 24,528 specklegram images captured over a temperature range of 25.00 °C to 200.00 °C with increments of ~0.20 °C. The experimental results demonstrate that models trained with an increasing number of datasets (from 1 to 13) significantly improve accuracy, reducing Mean Absolute Error (MAE) from 13.39 to 0.69 °C, and achieving a Root Mean Square Error (RMSE) of 0.90 °C with an R2 score of 0.99. Our systematic analysis establishes that scaling experimental data diversity—through training on multiple independent realizations—is the foundational strategy to overcome domain shift and enable robust cross-dataset generalization.
1. Introduction
Optical fiber sensors have become indispensable tools in modern metrology due to their distinctive advantages, including immunity to electromagnetic interference, lightweight construction, and multiplexing capabilities [1,2]. Among the various architectures proposed, Fiber Specklegram Sensors (FSS) have gained significant attention due to their high sensitivity to external perturbations, including temperature variations and mechanical deformations [3].
The speckle pattern, or specklegram, observed at the output of a multi-mode optical fiber (MMF) arises from the interference among multiple spatial modes propagating through the fiber [3]. As detailed in recent comprehensive reviews, the spatial characteristics of this pattern are highly sensitive to external disturbances that alter the refractive index or fiber geometry, forming the physical basis for detection and measurement [4]. Unlike single-mode fiber (SMF) sensors that often require complex interferometric setups (e.g., Mach–Zehnder or Fabry–Pérot), FSS utilizes simple MMF and cost-effective imaging hardware, making it a promising alternative for industrial applications [5].
However, the interrogation of FSS signals presents significant challenges. The transfer function of a specklegram is inherently quasi-random, nonlinear, and susceptible to signal fading due to environmental drift and modal noise. Traditional demodulation techniques, such as zero-mean normalized cross-correlation (ZNCC) or inner-product coefficients, are effective for relative measurements but often struggle with absolute sensing and require frequent recalibration [6,7]. Previous comparative studies have explicitly demonstrated that while classical methods like radial moments or optical power measurement offer computational simplicity, they often fail to capture the full spectrum of information contained within the specklegram, resulting in significantly higher prediction errors compared to data-driven approaches [8,9].
In the last decade, FSS technology has seen remarkable advancements with the integration of Machine Learning (ML) and Deep Learning (DL) techniques. Convolutional Neural Networks (CNNs) have proven superior in extracting abstract features from complex interference patterns, mapping them directly to physical variables without the need for analytical models [10]. For instance, Liang et al. (2022) demonstrated a pressure sensor based on fiber specklegram analysis, achieving a pressure resolution of 0.001 MPa using CNNs [11]. Similarly, previous work has applied a CNN-based interrogation method for an FSS, showing that deep learning-based approaches outperformed conventional methods like cross-correlation in temperature prediction accuracy [12]. Furthermore, recent reviews highlight the versatility of CNNs in applications ranging from curvature sensing and tactile recognition to pulse characterization [13,14].
Despite these successes, a critical challenge in developing reliable FSS interrogation systems lies in ensuring model generalization across different experimental realizations. Models trained on limited or single-instance experimental data often struggle to adapt to the inherent stochastic variability of speckle patterns and complex environmental noise [8]. Most existing studies rely on small datasets or synthetic simulations, which, although valuable for theoretical validation as shown in recent works, may not fully capture the modal instability and thermal hysteresis present in real-world hardware [15,16,17]. Consequently, evaluating training performance using multiple, distinct experimental datasets becomes essential to mitigate these variations and achieve high-accuracy prediction in real-world scenarios.
Building upon an automated acquisition framework [18], this study fundamentally provides a systematic investigation of how data diversity governs cross-dataset generalization for deep learning-based FSS. Our core contribution is a controlled, quantitative benchmark that establishes scaling the number of independent experimental realizations—from 1 to 13 datasets—as the fundamental strategy to overcome domain shift. By training a model on sequentially expanded data, we directly link this increased diversity to a dramatic 17-fold reduction in error on unseen domains. This work thus provides clear guidelines for the data required to bridge the critical gap between high intra-dataset accuracy and reliable performance in real-world deployment, where models must contend with varying modal excitations and thermal histories.
2. Materials and Methods
2.1. Experimental Setup and Data Acquisition
The dataset was generated using an automated experimental Fiber Specklegram Sensor (FSS) platform and acquisition protocol previously reported in [18]. The system was designed to ensure repeatability and minimize noise. Key parameters are summarized here for completeness: λ = 633 nm (HeNe laser), a 70 cm MMF, a 2 cm sensing zone exposed to thermal perturbation, and a CCD camera (1280 × 1024 pixels) for imaging the speckle output. The experimental data were acquired using an automated thermal cycling system with PID control, ensuring consistent sampling conditions throughout the data collection process.
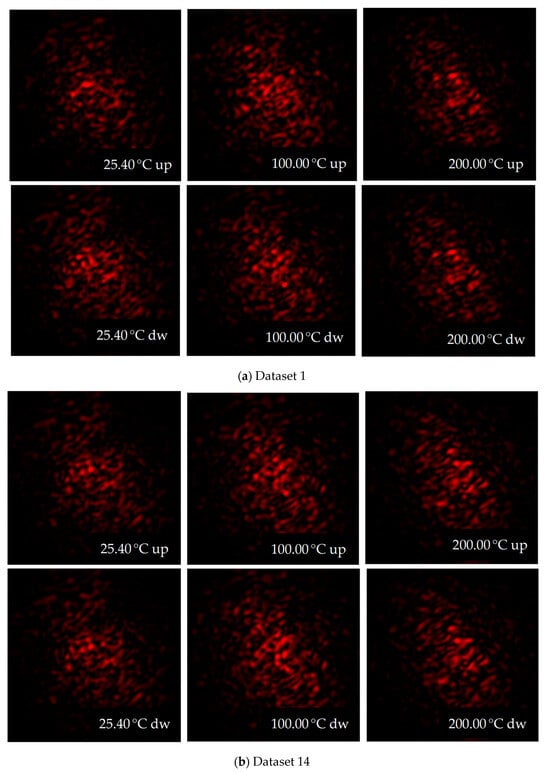
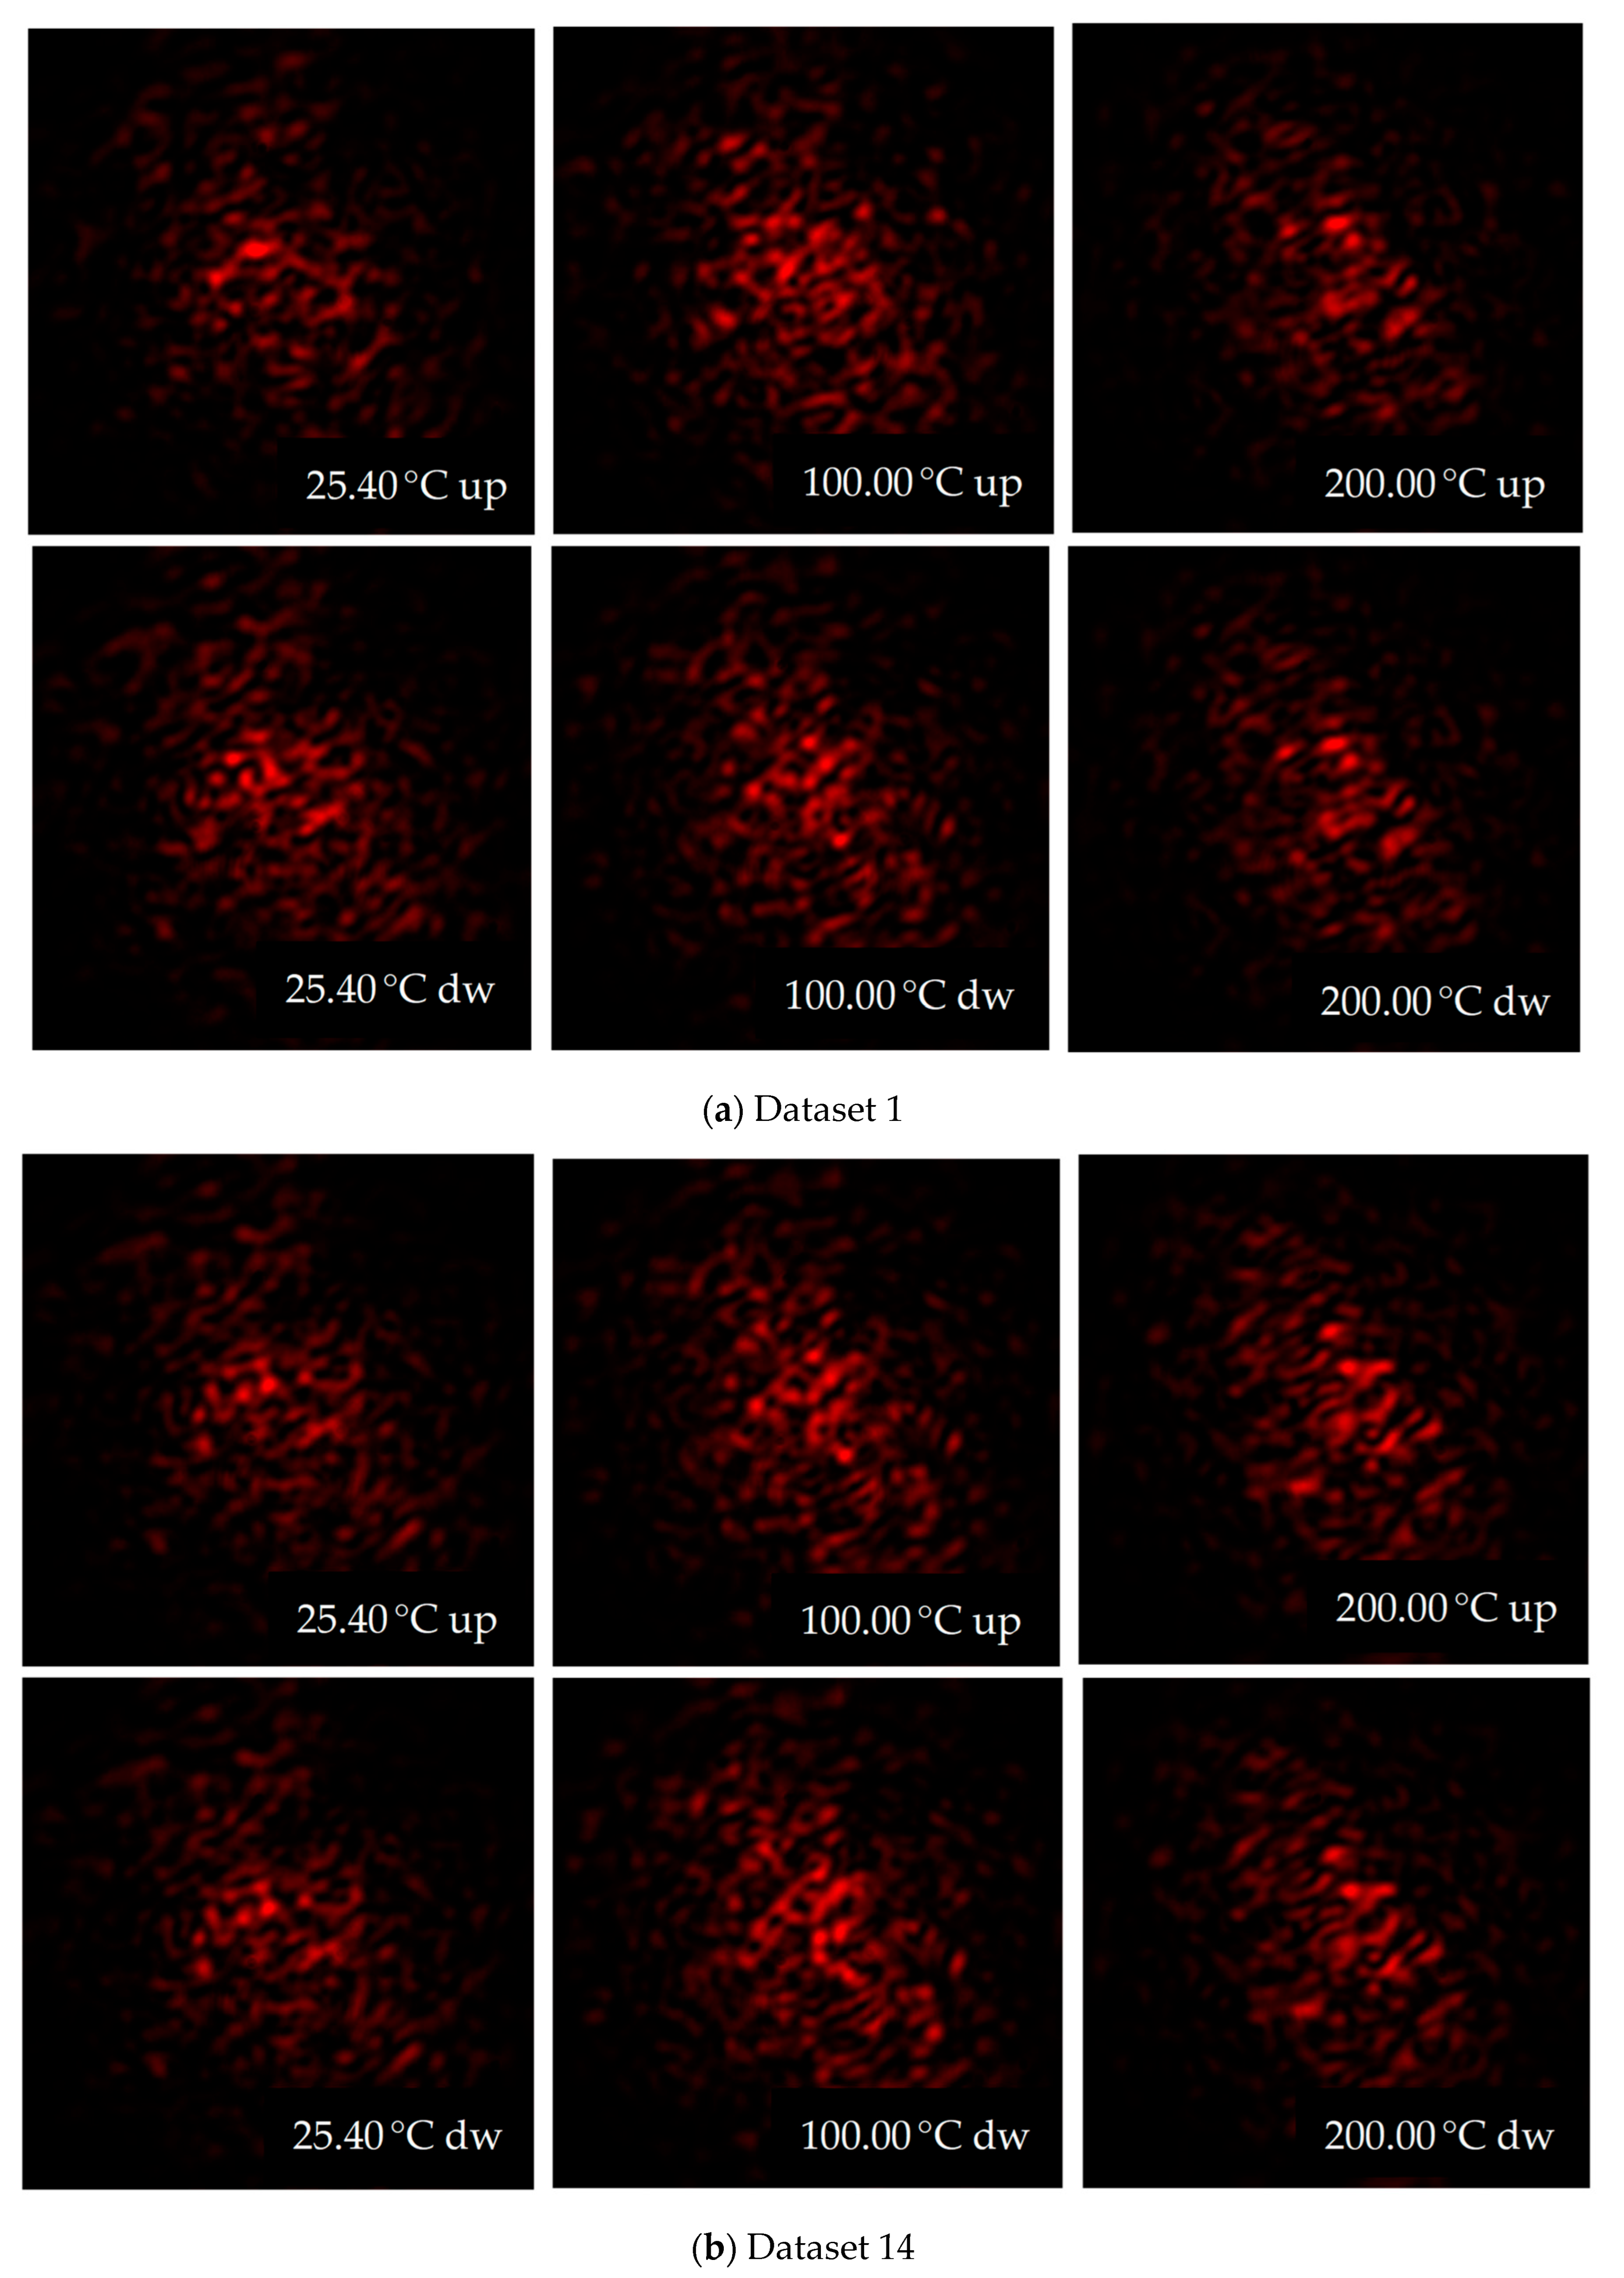
Experiments use the public Specklegram Temperature Dataset, which comprises 14 datasets and a total of 24,528 TIFF images across the temperature range of 25.00 °C to 200.00 °C. with an incremental step of approximately 0.20 °C. This dataset and its labeling convention (e.g., encoding temperature, phase, and dataset ID) are fully described in [18]. Figure 1 displays representative specklegrams, showing distinct pattern evolution corresponding to thermal changes for datasets 1 and 14. The only preprocessing applied consisted of cropping each image to the speckle region of interest (ROI) to remove non-informative border areas, followed by pixel-value rescaling (division by 255). No image-quality-enhancing preprocessing (e.g., denoising or filtering) nor synthetic data augmentation was used. This ROI cropping helps the model focus on physically meaningful interference patterns.
Figure 1.
Specklegram images from thermal cycles. (a) (Rows 1, 2) Dataset 1 and (b) (rows 3, 4) Dataset 14, imaged at 25.40 °C, 100.0 °C, and 200.0 °C (left to right). Odd rows: heating phase; even rows: cooling phase.
2.2. Deep Learning Model and Training Strategy
To balance accuracy and computational efficiency for edge deployment, this study employs MNet-reg, an efficient MobileNet-based CNN architecture previously utilized for regression tasks in optical sensing [16]. MobileNet is a lightweight CNN architecture designed for mobile and embedded vision applications [19]. It leverages depthwise separable convolutions to significantly reduce computational complexity and model weight, making it particularly suitable for real-time deployment on edge devices with limited resources. While recent state-of-the-art benchmarks on this specific dataset have utilized Vision Transformers (ViT) to achieve high accuracy and explainability [20,21], such models often require a high parameter count and significant memory overhead. In contrast, the selection of a lightweight model like MNet-reg allows us to isolate the impact of the data scaling hypothesis; by achieving high precision with a constrained architecture, we demonstrate that robustness emerges from the diversity and volume of the training data rather than from the sheer complexity of the network.
The architecture utilized pre-trained ImageNet weights as a stable initialization for the convolutional filters, followed by intensive training on the experimental specklegram patterns to ensure the learning of features specifically tailored to the optical domain. Input images were resized to 224 × 224 pixels, and the feature extractor was followed with three 1024-neuron dense layers followed by a single-neuron linear output for scalar temperature estimation.
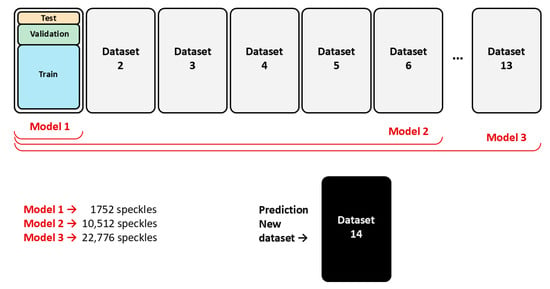
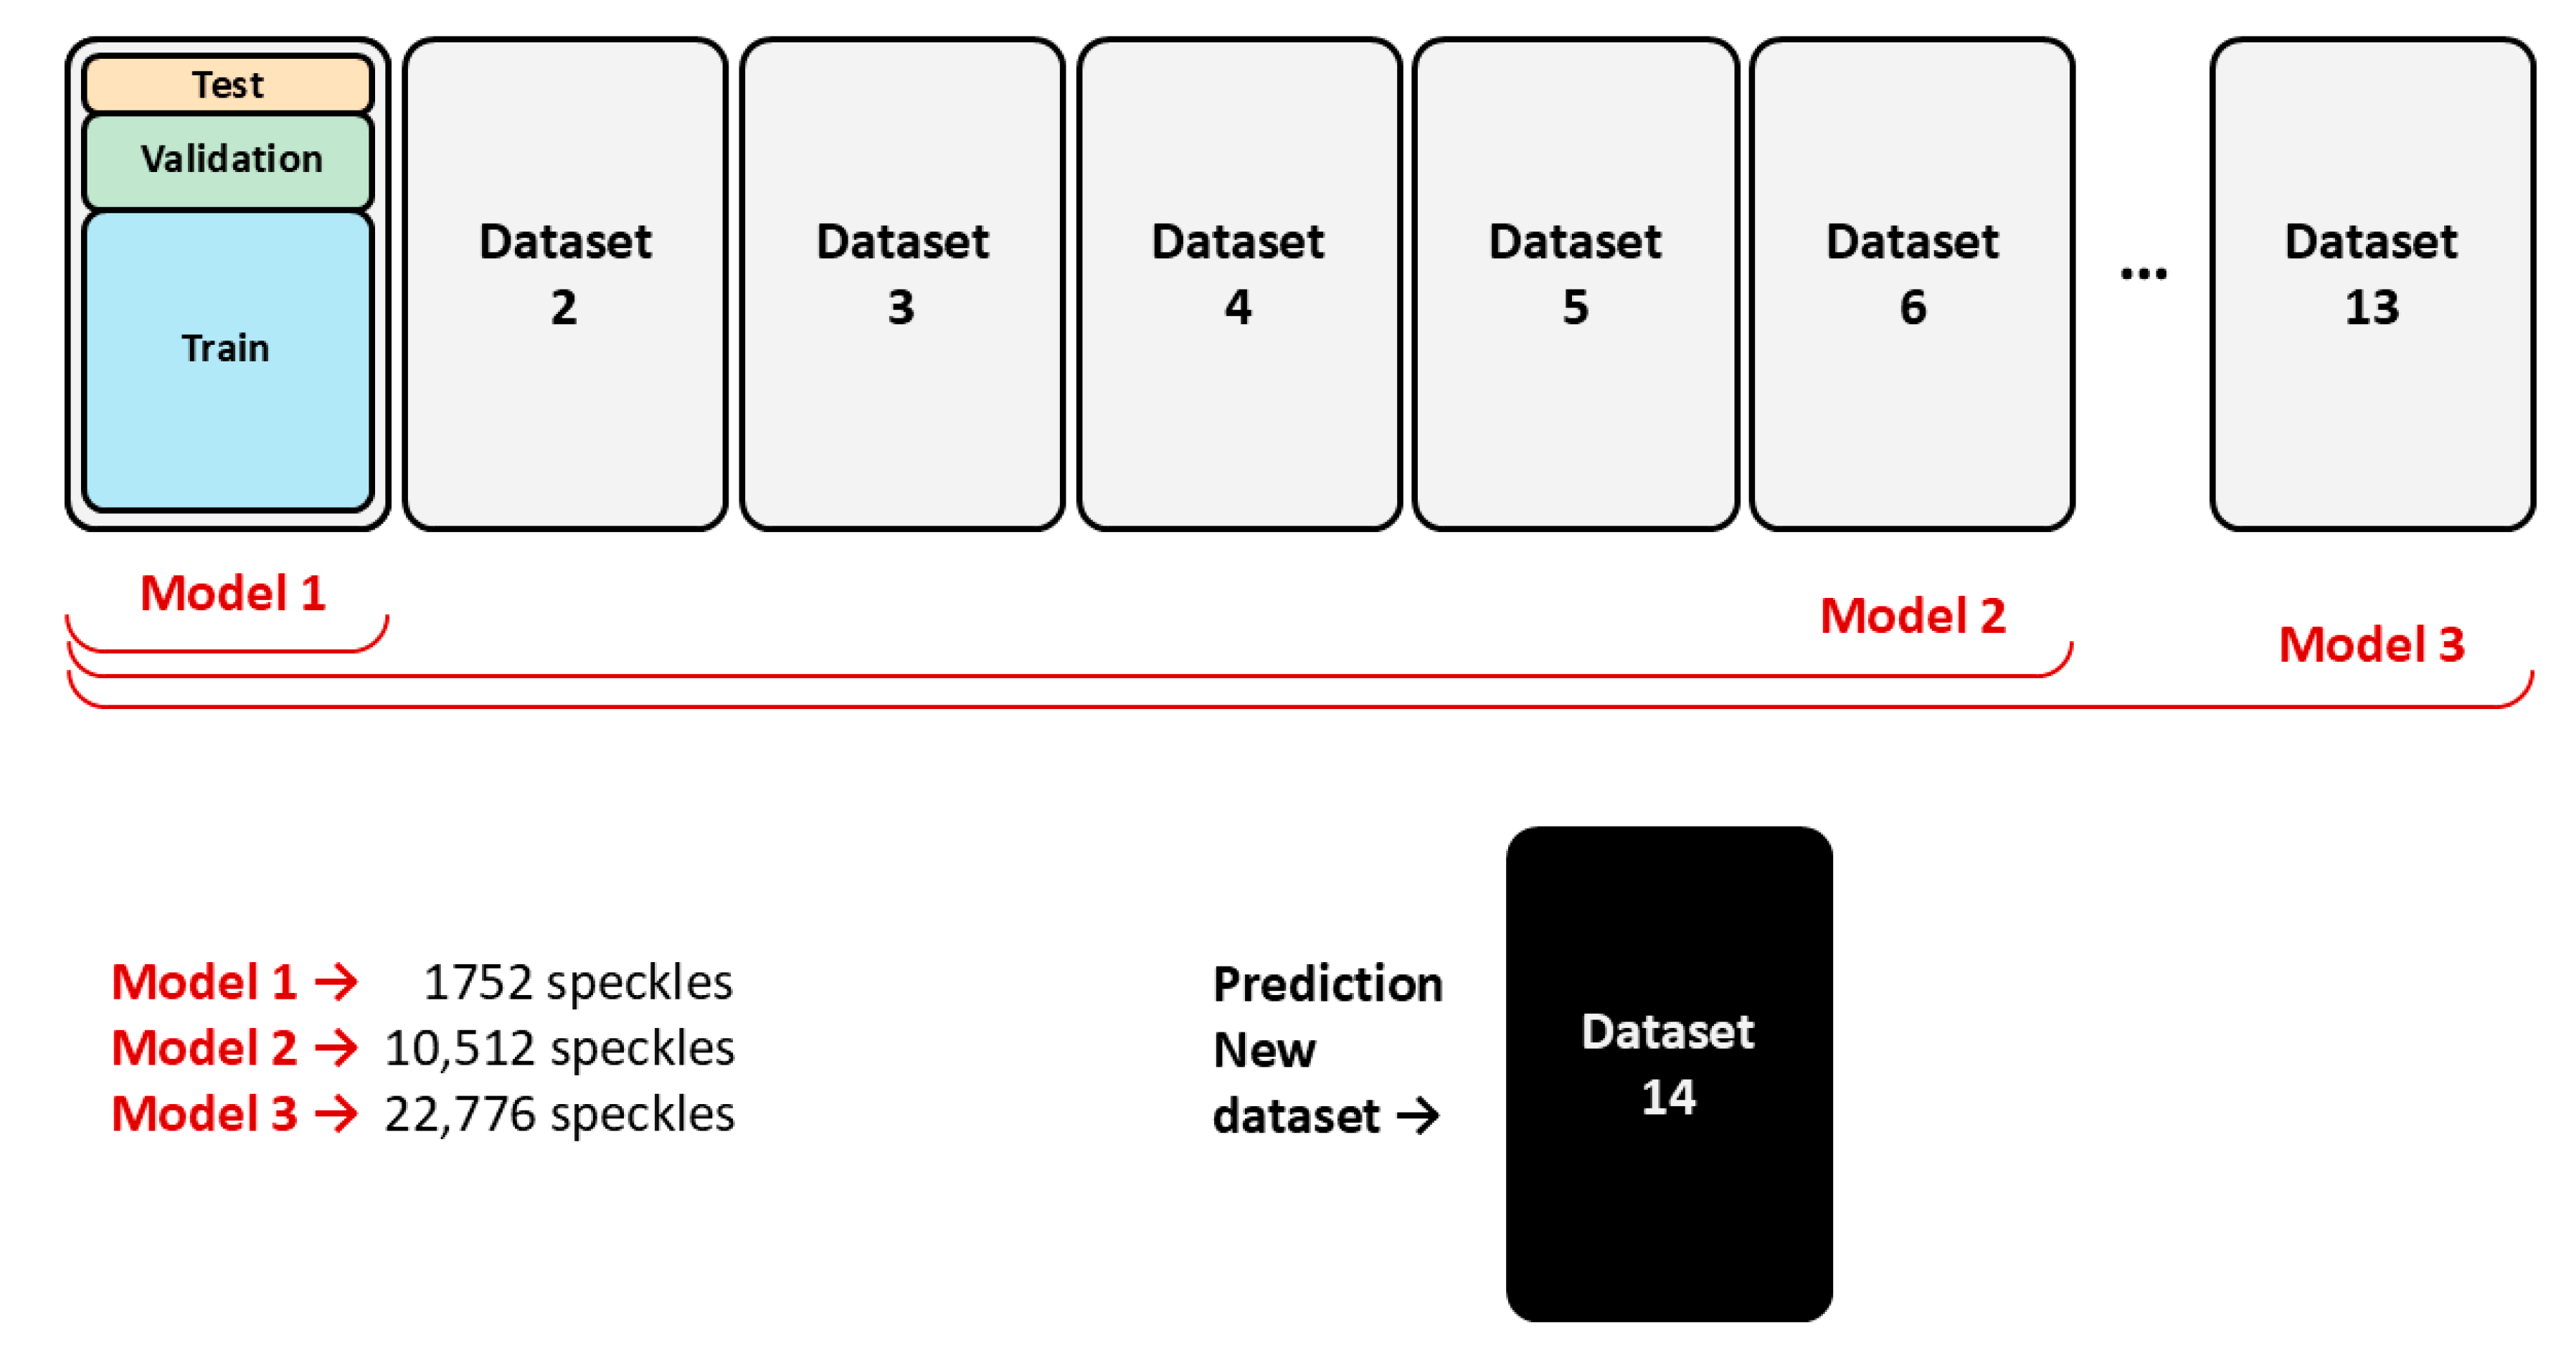
To systematically evaluate how data quantity and domain variability affect model generalization, we employed the first 13 of 14 sequentially available experimental datasets. These datasets inherently capture key physical variations—thermal cycles, modal excitation differences, and initial phase conditions—introducing a realistic domain shift that broadens the feature distribution during training and discourages overfitting. The specific subset sizes of 1, 6, and 13 datasets were chosen to create a controlled scaling progression: Model 1 (Dataset 1, 1752 images) establishes a single-domain baseline; Model 2 (Datasets 1–6, 10,512 images) tests generalization with moderate diversity; and Model 3 (Datasets 1–13, 22,776 images) assesses performance with near-complete variability. This design isolates the contribution of increasing data volume and cross-domain heterogeneity, providing clear benchmarks to distinguish between gains from more samples and gains from broader domain representation. This workflow, summarized in Figure 2, illustrates how increasing data volume serves as the primary mechanism to bridge the statistical gaps between distinct experimental manifolds. For each training configuration, the data were first split, reserving 10% as an internal test set. The remaining 90% was then divided 80/20 into training and validation subsets, resulting in effective proportions of 72% training, 18% validation, and 10% internal test. This split was applied consistently across all configurations. Dataset 14 was strictly reserved as a completely unseen, external test set to evaluate performance under domain shift conditions.
Figure 2.
Machine learning workflow for the three models trained with increasing dataset sizes from Dataset 1 to 13, and used to predict temperature from specklegrams in Dataset 14.
Models were implemented in Python 3.9.16 using Keras/TensorFlow 2.11.0 and trained for 50 epochs with an optimized learning rate of 1 × 10⁻⁴. To ensure reliable results and align with a realistic deployment scenario, all reported metrics are from a single training run of the final, optimally selected model. Model selection was based on continuous validation monitoring, with weights saved only upon improvement. The stabilizing use of transfer learning from pre-trained weights and the substantial dataset size mitigate potential variability from training randomness, ensuring robust and representative outcomes. The training hyperparameters are summarized in Table 1.
Table 1.
Training Hyperparameters and Protocol.
3. Results and Discussion
3.1. Data Domain and Manifold Characterization
To establish a solid foundation for the performance analysis of the MNet-reg model, it is essential to characterize the underlying structure and consistency of the experimental data. The following visualizations employ dimensionality reduction and statistical distance metrics to uncover the relationship between the physical thermal signal and the systematic variability inherent in the 14 experimental cycles. This analysis confirms the presence of distinct data manifolds and quantifies the domain shift that the neural network must navigate to achieve robust generalization.
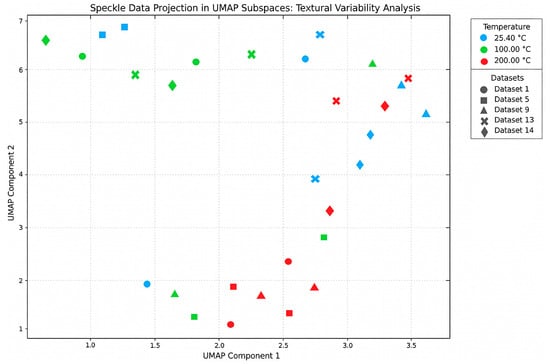
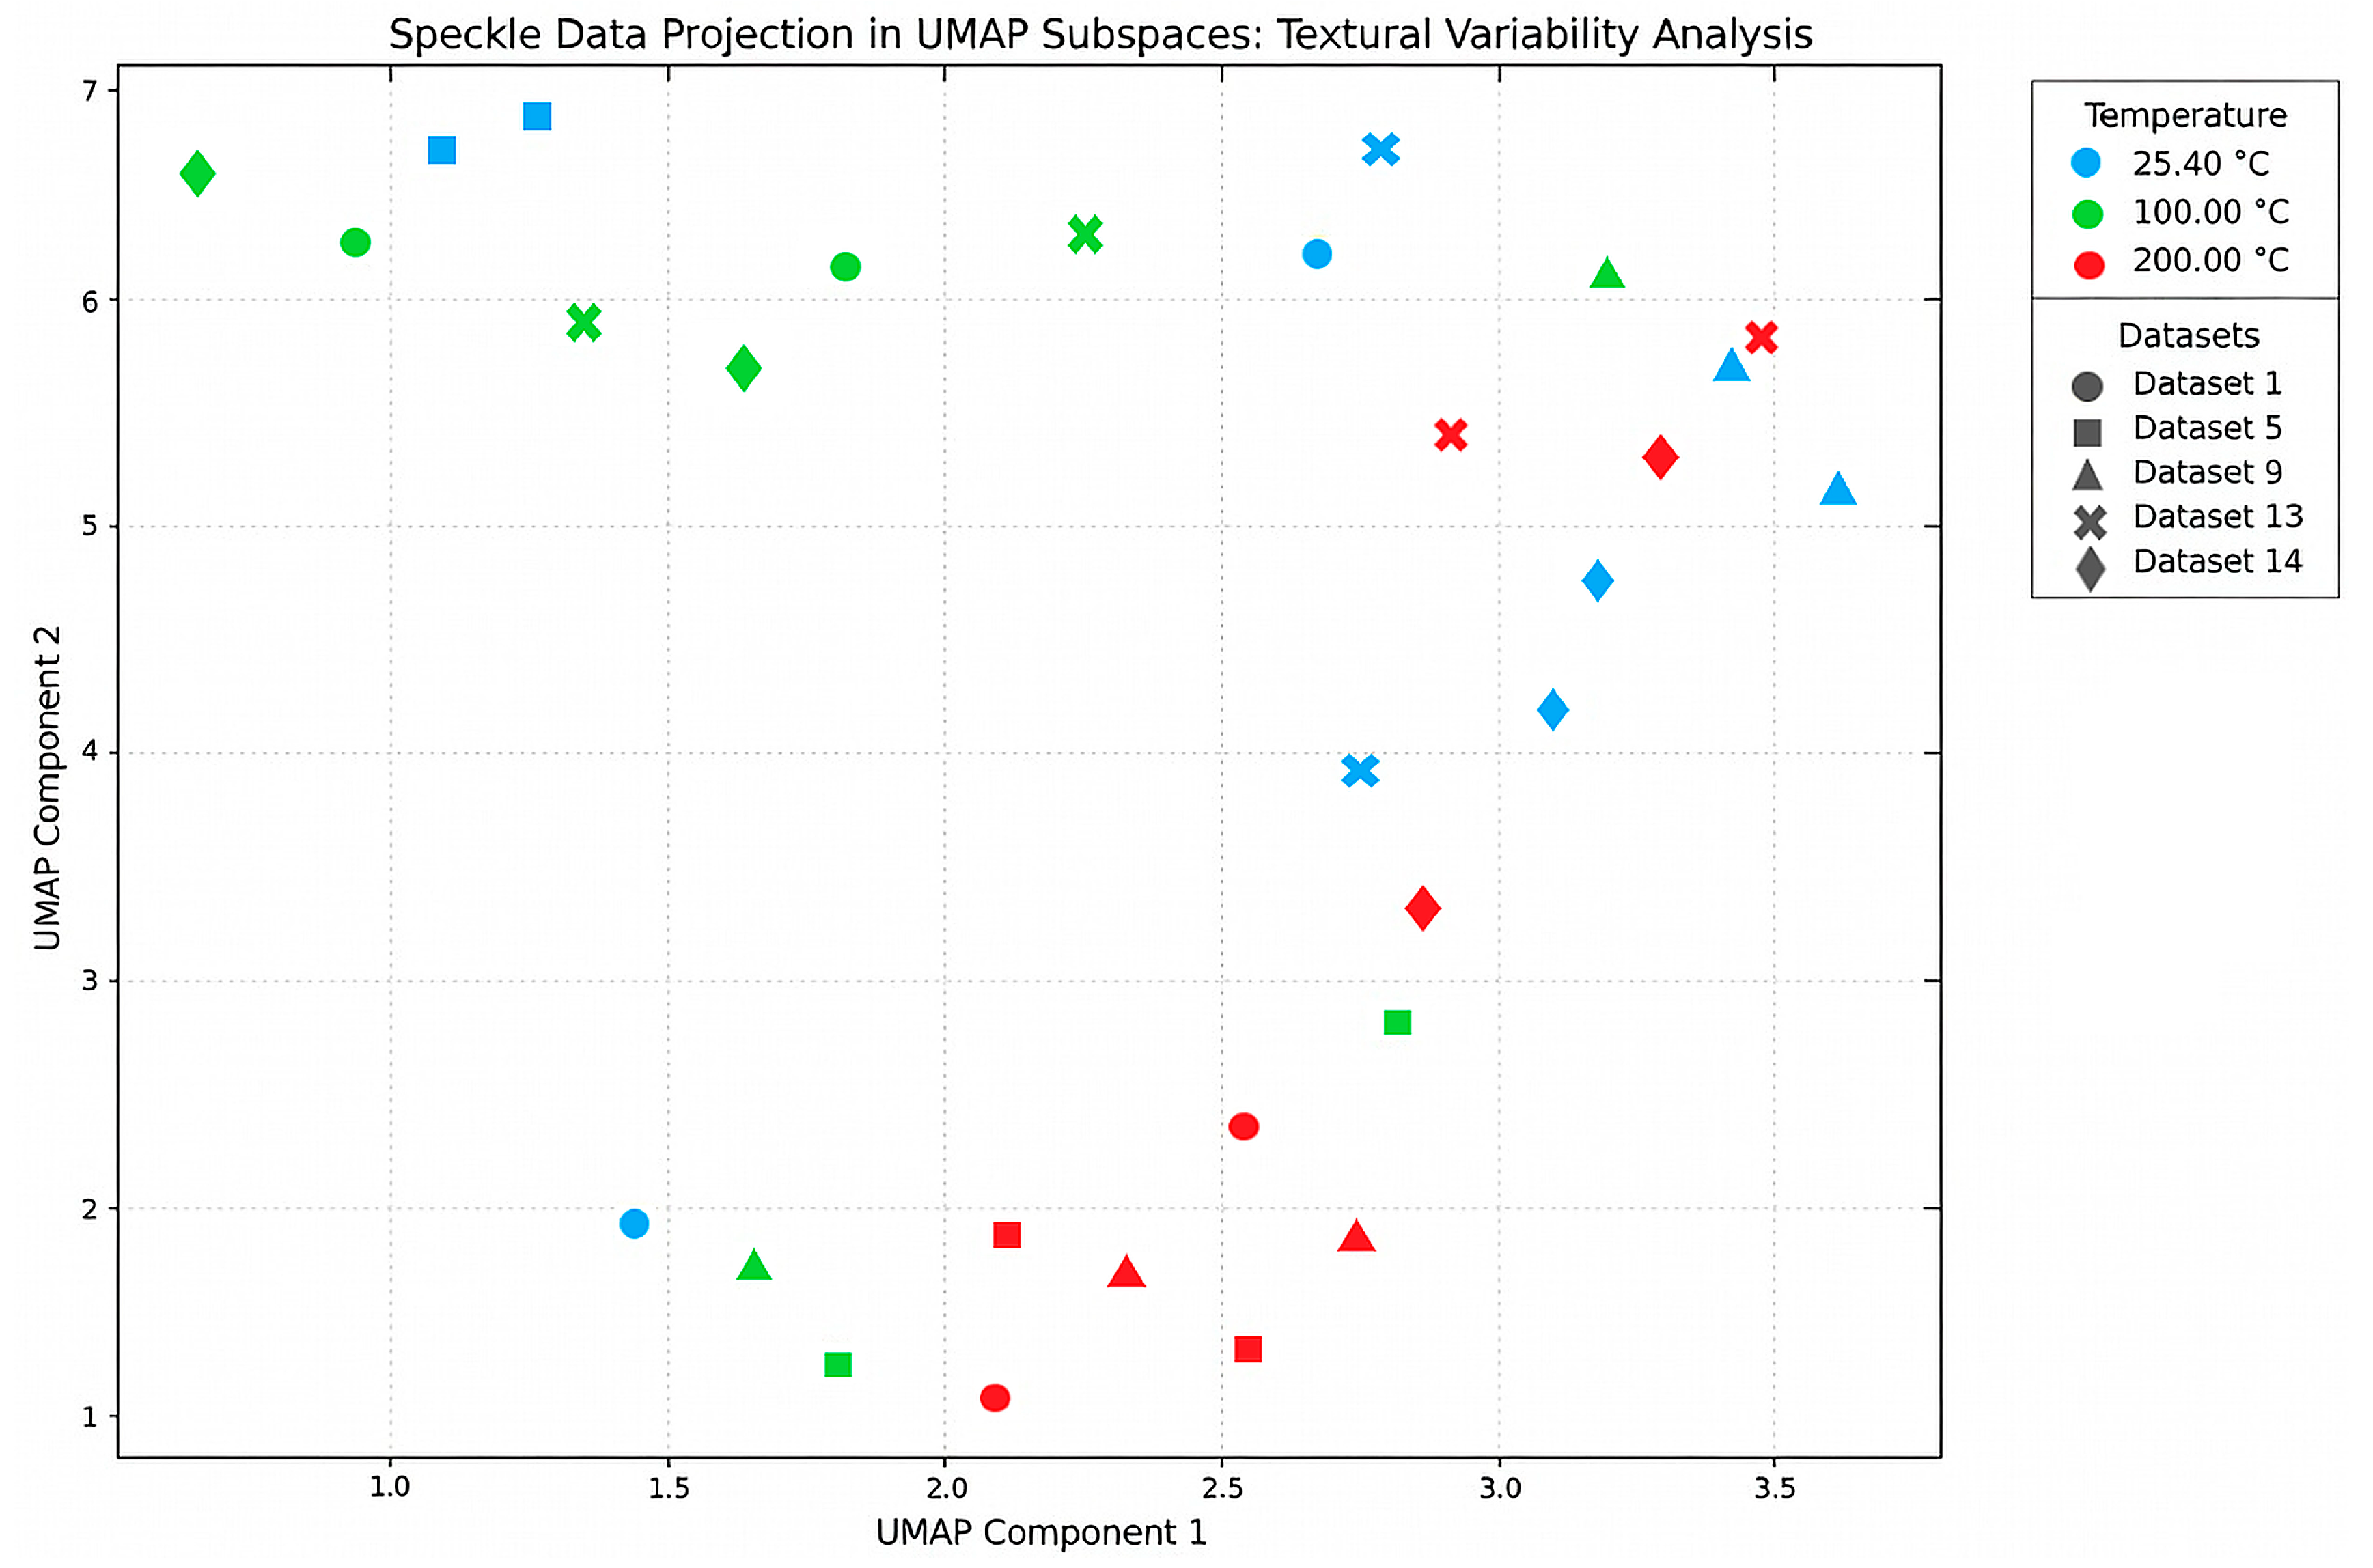
The UMAP (Uniform Manifold Approximation and Projection for Dimension Reduction) projection (Figure 3) reveals a clear, continuous parabolic trajectory that captures the global thermal evolution of the speckle grains. By organizing the data into a cohesive manifold, the analysis demonstrates that the textural changes induced by temperature are monotonic and physically consistent across all datasets, moving from the 25.40 °C baseline toward the 200.00 °C peak. However, a distinct vertical stratification is observed within this trajectory, where individual datasets occupy sub-clusters. This stratification confirms the presence of a systematic domain shift, where experimental variables (e.g., laser stability or mechanical alignment) create unique textural fingerprints for each cycle without obscuring the underlying thermal signal.
Figure 3.
UMAP projection of speckle patterns across three thermal states (25.40 °C, 100.00 °C, and 200.00 °C). The manifold reveals a continuous parabolic trajectory representing the global thermal evolution, while the vertical stratification highlights the systematic domain shift between independent experimental cycles.
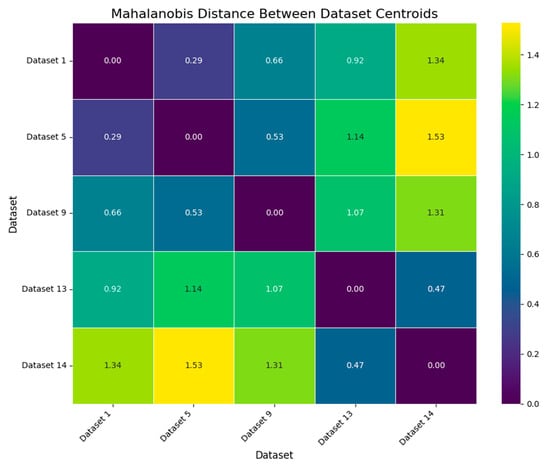
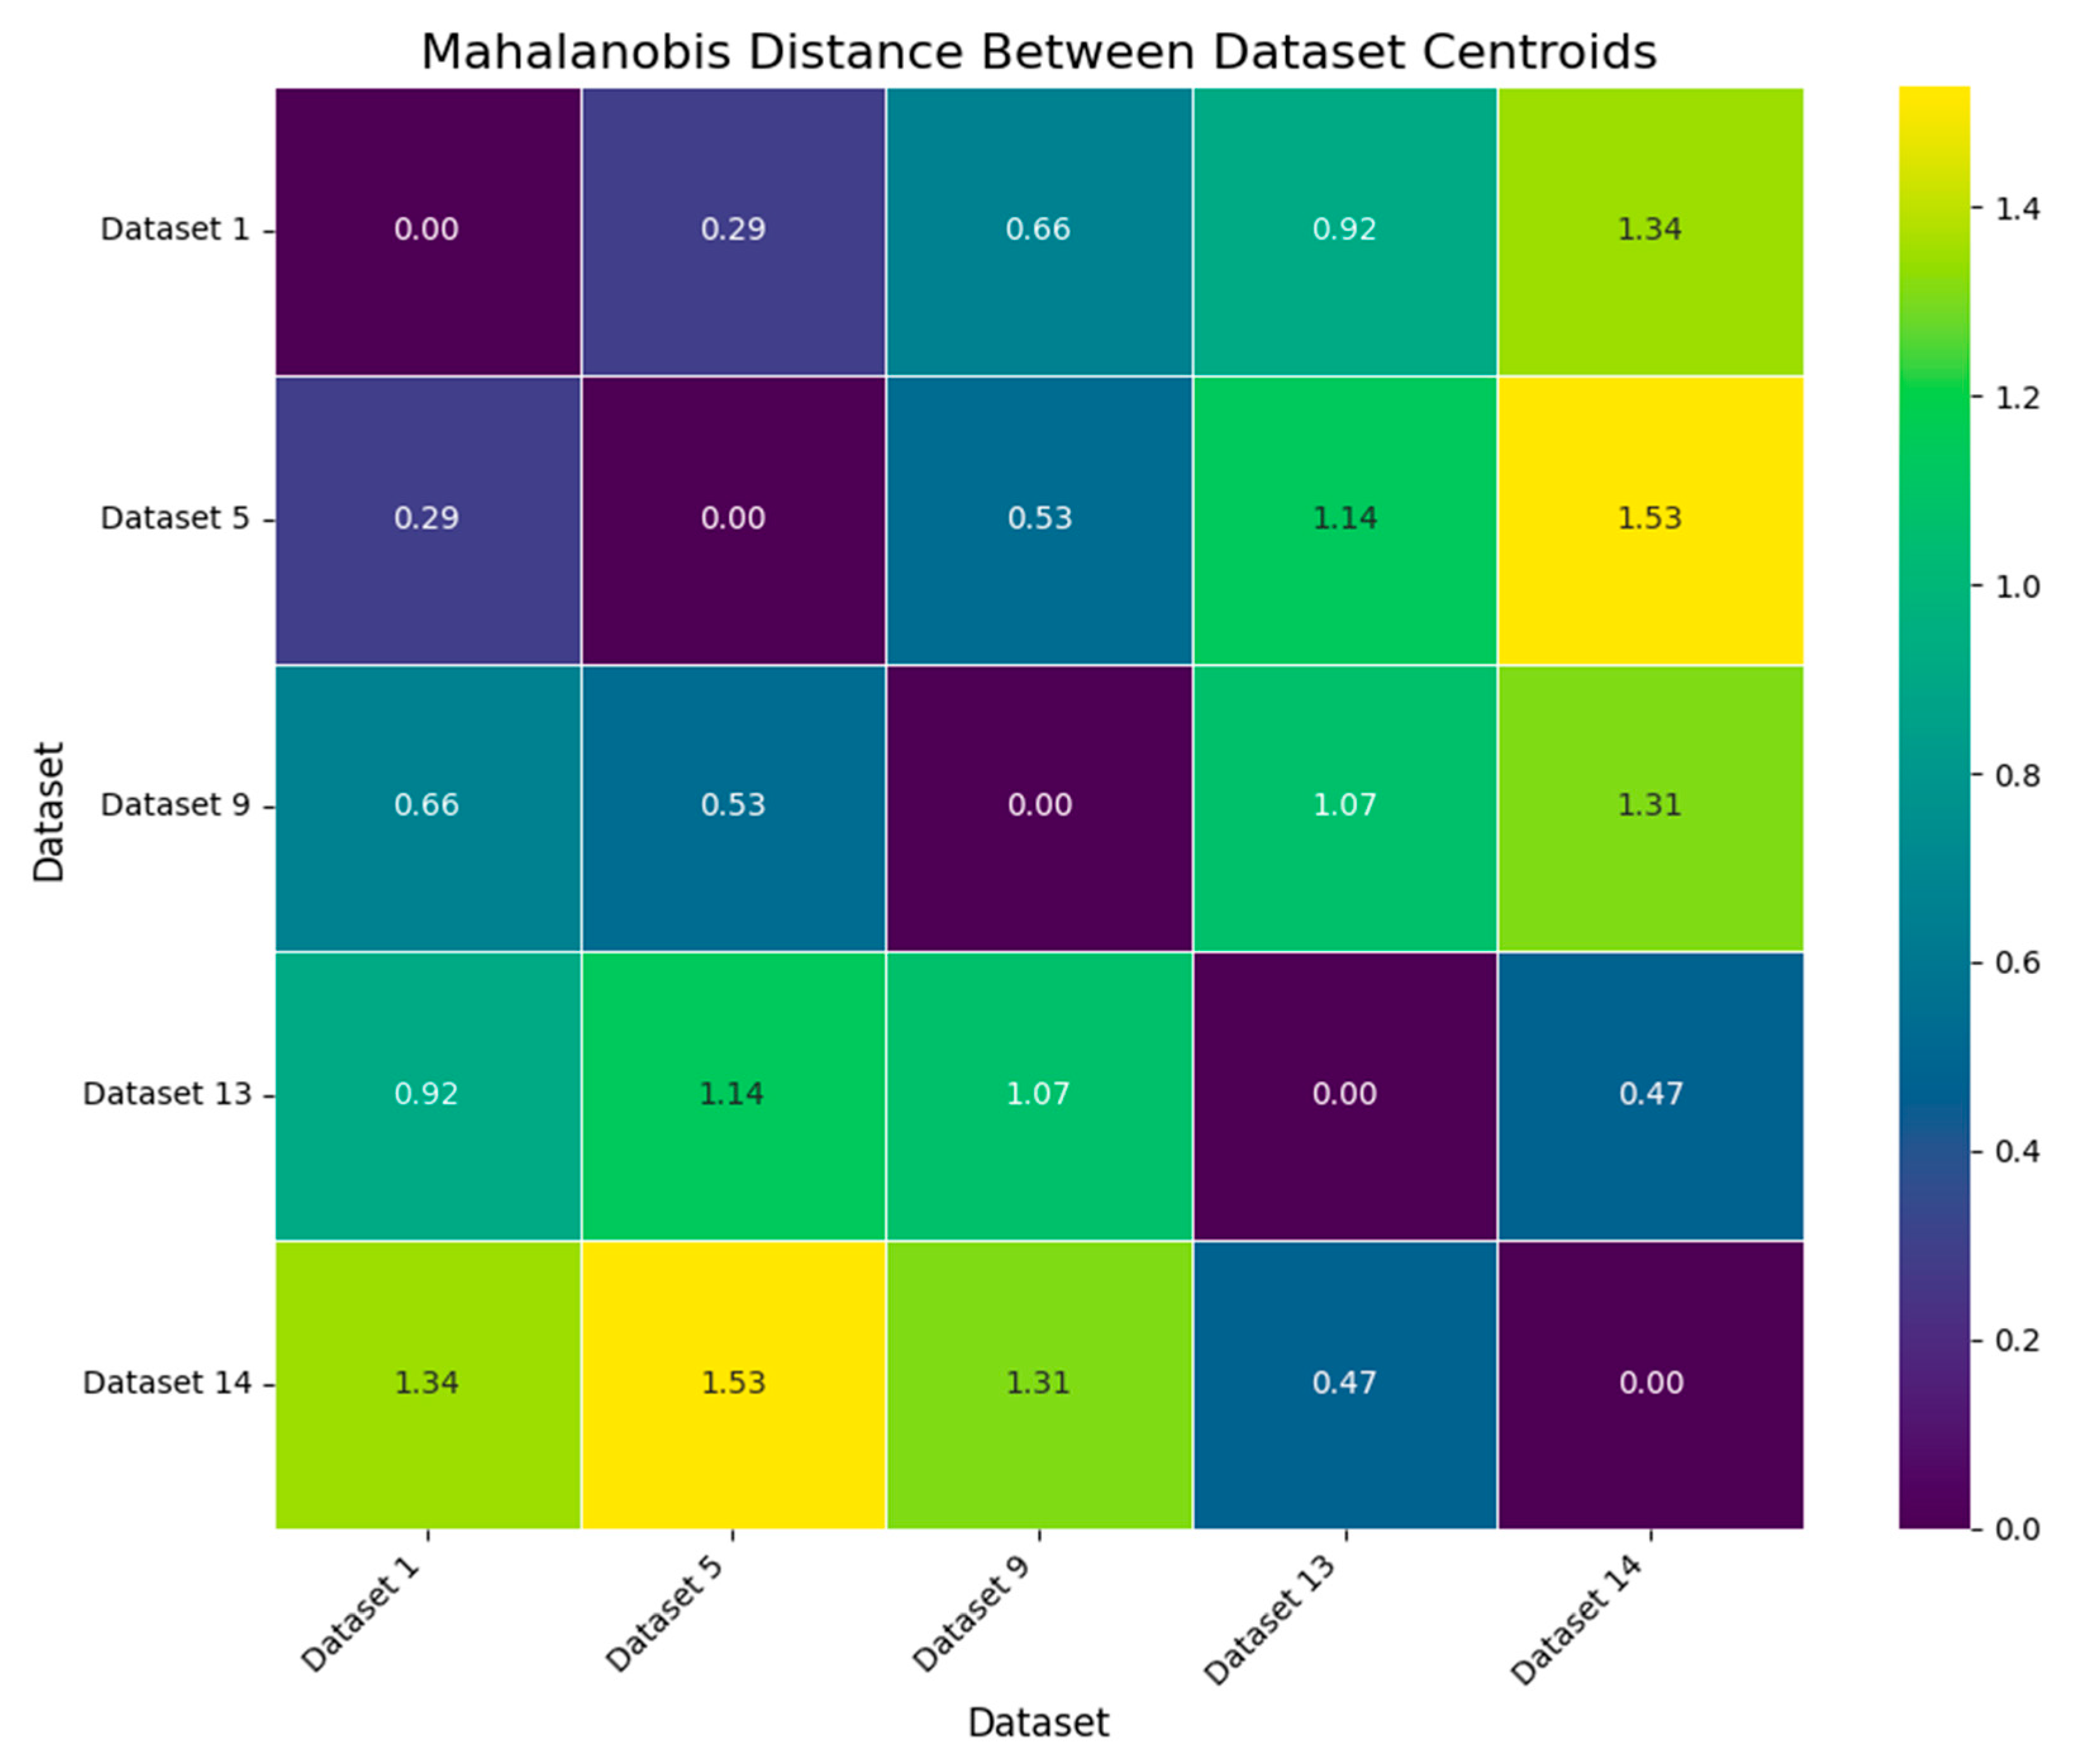
Complementing this visual evidence, the Mahalanobis distance matrix (Figure 4) provides a statistical quantification of the separation between these data subspaces. The analysis identifies a maximum distance of 1.53 between the training datasets and Dataset 14, the independent testing domain. This measured divergence highlights the complexity of the regression task, as the model is required to bridge significant statistical gaps to maintain accuracy on unseen data. The proximity between Dataset 13 and Dataset 14 (distance = 0.47) suggests a stabilization of experimental conditions in the final stages, yet the overall variability across the 14 cycles underscores the robustness required by the architecture to extract domain-invariant features.
Figure 4.
Mahalanobis distance matrix between dataset centroids. The color scale quantifies the statistical separation between thermal cycles, identifying a maximum domain shift of 1.53. This metric justifies the requirement for a robust regression model capable of generalizing across distinct data subspaces.
This statistical characterization of the data manifold clarifies the learning objective: the model must extract features that correlate with the monotonic thermal signal—evident along the horizontal axis of the UMAP projection—while becoming invariant to the experimental-cycle variability represented by the vertical stratification. As analyzed in Section 3.4, visualization of the learned features reveals that the network progressively shifts its focus from noisy, dataset-specific patterns toward stable, high-contrast textural elements in the speckle centroid. These elements—likely corresponding to robust interference modes less sensitive to initial conditions—form the physical basis for the domain-invariant representation that enables successful generalization to Dataset 14.
3.2. Impact of Dataset Size on Performance
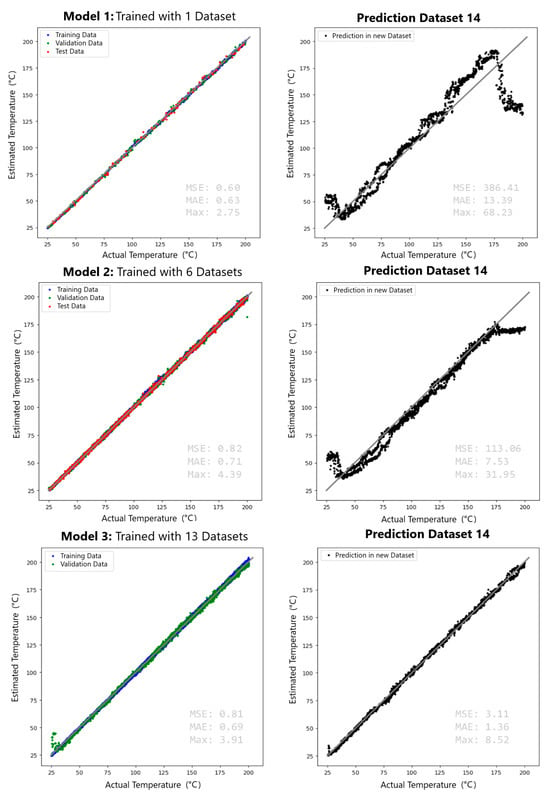
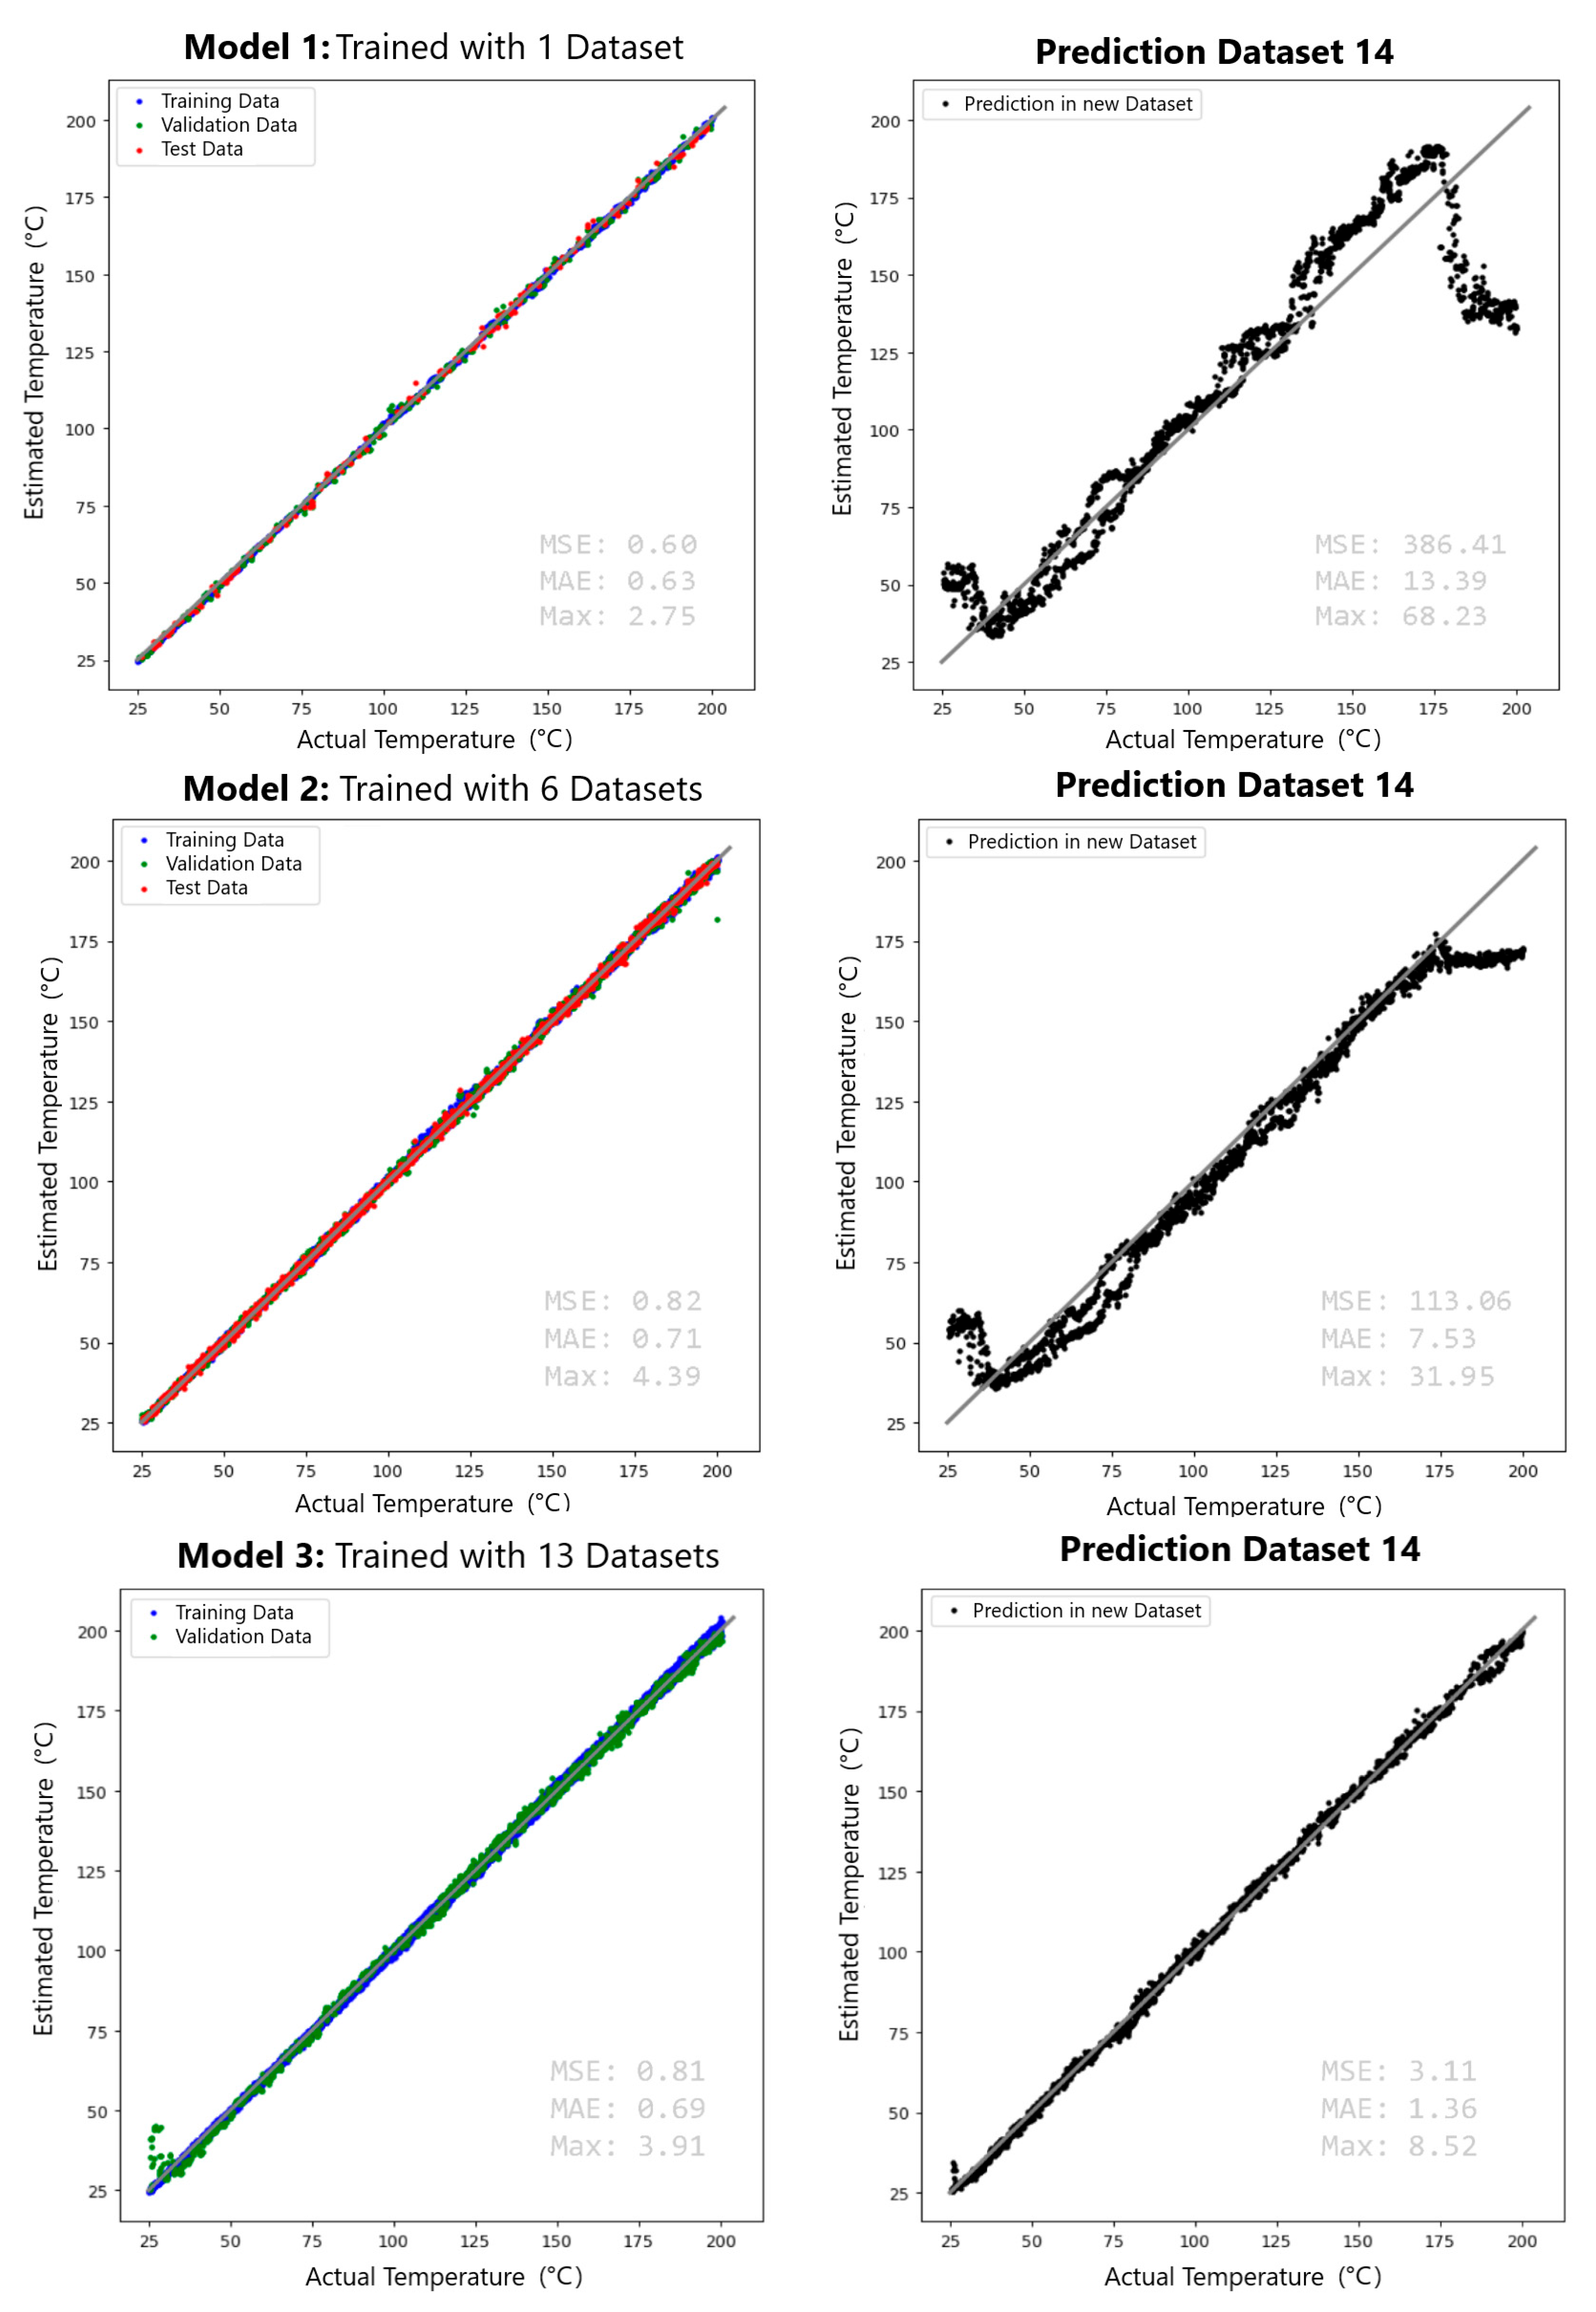
To qualitatively evaluate the impact of data volume on generalization, Figure 5 illustrates the regression performance for the three training configurations: Model 1 (1 Dataset 1), Model 2 (Dataset 1–6), and Model 3 (Dataset 1–13). The plots on the left column display the fit during the training and validation phases, while the right column reveals the ability of the model to predict temperature on the completely unseen Dataset 14.
Figure 5.
Evolution of temperature prediction performance with increasing dataset size. The left column shows training and validation results, while the right column displays generalization on the unseen Dataset 14.
The progression of model performance is visually evident in Figure 5, which plots the estimated temperature versus the real temperature for both training (left column) and the unseen test set (Dataset 14, right column).
Model 1 (Single Dataset Training): As illustrated in the top row of Figure 5, Model 1 achieves near-perfect performance on its training set, accurately mapping the specific speckle evolution of a single experimental run. However, when evaluated on the independent Dataset 14, the prediction curve exhibits severe non-linearity and a substantial thermal offset, leading to a Maximum Error of 68.23 °C. This performance gap indicates that the model overfitted to the specific modal coupling conditions of the initial experiment, failing to extract underlying temperature-invariant features. The stochastic ‘wavy’ nature of the prediction on the unseen data suggests that the network became highly sensitive to random phase shifts—inherent to MMF—that do not correlate with the global thermal gradient. This failure is directly corroborated by the Mahalanobis distance analysis, which revealed a statistical separation of up to 1.53 between the training and testing domains. Such a significant distance confirms that a single dataset provides insufficient manifold coverage to account for the systematic drift and experimental variability of the sensor system.
Model 2 (Intermediate Scaling): By increasing the training pool to 6 datasets (middle row), the model begins to average out the stochastic noise. The prediction on Dataset 14 tightens significantly, with the R2 score improving to 0.93. However, a visible drift remains, particularly in the lower temperature range, indicating that the network still lacks sufficient diversity to fully decouple the temperature signal from environmental noise.
Model 3 (Full Data Scaling): The bottom row of Figure 5 demonstrates the system’s full capacity. With 13 training datasets, the prediction on the unseen Dataset 14 (bottom right) aligns almost perfectly with the ideal diagonal line. The Max Error drops dramatically to 3.91 °C, representing a 17-fold improvement over Model 1. The hysteresis loops often observed in fiber sensors are effectively suppressed, suggesting the MNet-reg architecture successfully learned to generalize the heating and cooling phases across different experimental realizations.
A clear evolutionary process is observed: while Model 1 exhibits severe overfitting, fitting the training data perfectly but failing to track the test data, the progressive inclusion of experimental variability in Models 2 and 3 drastically corrects this behavior. This visual transition from a noisy, non-linear response to a highly linear prediction confirms that the network requires diverse historical data to learn the temperature-invariant features of the speckle patterns effectively, moving from a memorization state to true generalization.
3.3. Performance Evaluation Metrics
The quantitative impact of increasing the volume of training data is summarized in Table 2, which presents the performance metrics for the three model configurations designed to test the data-scaling hypothesis.
Table 2.
Performance metrics for models trained with increasing dataset sizes.
To rigorously assess the model’s accuracy and stability against random experimental errors, we employed standard statistical metrics [22]. The Root Mean Square Error (RMSE) quantifies the standard deviation of the prediction errors, penalizing larger outliers visible in the regression plots:
The Coefficient of Determination (R2), on the other hand, indicates the proportion of the variance in the dependent variable that is predictable from the independent variables, providing a robust measure of how well observed outcomes are replicated by the model [23]. Additionally, we applied 95% confidence intervals (±1.96 × SE) to filter outliers (Figure 5), thereby reducing noise impact from experimental data.
In their formulas, is the total number of specklegram images, is the true temperature for the i-th image, and is its predicted value. The term represents the average of all true temperatures in the dataset.
These metrics provide a confidence assessment of the model’s generalization, ensuring that the reported accuracy is not an artifact of random noise.
The results in Table 2 demonstrate a clear and significant positive correlation between dataset size and model performance. As the volume of training data increases, all error metrics sharply decrease while the coefficient of determination improves dramatically.
Specifically, Model 3, trained on 13 cumulative datasets, achieves exceptional predictive accuracy, with a near-perfect R2 score of 0.99. Its error metrics are orders of magnitude lower than those of the smaller models (e.g., MSE of 0.81 °C2 vs. 386.41 °C2 for Model 1). This indicates that the model captures almost all the variance in the data.
Model 2 shows substantial improvement over Model 1, reducing the MSE by approximately 70% and increasing the R2 score from 0.76 to 0.93. This confirms a strong, non-linear benefit to data scaling, where incremental data yields disproportionately large gains in generalization and robustness, as evidenced by the drastic reduction in maximum error from 68.23 °C to 3.91 °C across the model series. These findings on the importance of data scaling align with recent simulations performed on synthetic datasets, where combining multiple simulated conditions was shown to be essential for generalization [16].
While the presented metrics are deterministic outputs from a single optimal model, they provide strong indirect evidence of predictive robustness and reduced sensitivity to experimental noise. The consistent, order-of-magnitude improvement in all error metrics (RMSE, MAE, Max Error) as more independent datasets are added demonstrates that the model’s predictions become significantly more stable and less variable when faced with the domain shift present in Dataset 14. The extreme reduction in maximum error—from 68.23 °C with one dataset to 3.91 °C with thirteen—is particularly indicative of this increased robustness. This scaling strategy inherently mitigates the stochastic variability of multimode speckle patterns by forcing the model to learn temperature-invariant features from a broad distribution of experimental conditions (modal excitations, initial phases, thermal histories). Consequently, the high accuracy maintained on the completely unseen and statistically distant test domain (Dataset 14) suggests that the final model’s predictions exhibit low uncertainty for the evaluated operational range, as it has learned to generalize across the primary sources of variability inherent to the FSS system. Recent works have further expanded this concept by using data augmentation techniques on synthetic datasets to improve robustness [16,24,25]. Our results validate that this “scaling law” is equally critical when dealing with real-world experimental data susceptible to environmental drift.
3.4. Robustness and Feature Stability
The results confirm that the “data scaling” strategy effectively forces the CNN to ignore the stochastic initial phase conditions of the MMF and focus on the high-frequency textural changes driven by the thermo-optic effect. As training data volume increased from Model 1 to Model 3, the network successfully transitioned from memorizing dataset-specific noise to identifying temperature-invariant features. This shift is statistically supported by the reduction in prediction variance as the model learned to navigate the 1.53 Mahalanobis distance between independent experimental domains. By exposing the architecture to 13 distinct experimental realizations, the training process effectively populated the global manifold, allowing the model to interpolate across the systematic drift that previously led to the 68.23 °C maximum error in the single-dataset configuration.
Furthermore, the model’s marked improvement in generalization—evidenced by the suppression of hysteresis and the 17-fold error reduction—suggests a shift in learned representation. We infer that, by training on diverse experimental realizations, the network learns to prioritize more stable textural features, likely moving its focus from the noisy periphery of the specklegram toward the well-defined centroid regions which provide higher contrast under varying conditions. This interpretation, based on the observed performance trends, aligns with the feature-stability advantages reported in other fiber-sensing contexts [26,27], where robust feature extraction is critical to overcome environmental cross-sensitivity.
The final RMSE of 0.90 °C is highly competitive with complex spectral interrogation systems—such as those based on Fiber Bragg Gratings (FBG) or interferometry [28,29]—and significantly outperforms traditional correlation-based methods tested in similar setups [9,20]. Comparative Performance Evaluation of Classical Methods and a Deep Learning Approach for Temperature Prediction in Fiber Optic Specklegram Sensors. The system’s precision confirms that deep learning, through manifold-scale diversity, acts as a digital compensator that decouples the thermal signal from hardware and environmental instabilities. By effectively filtering intrinsic modal noise, polarization drift, and potential deployment perturbations—such as mechanical shifts or misalignments—the MNet-reg framework enables the transition from sensitive laboratory prototypes to robust, invariant industrial sensing tools.
While this study establishes data-scaling as crucial for robust FSS sensing, its scope presents clear opportunities for future work. Our findings are based on a single-fiber configuration; extending this approach to multi-fiber systems would test its generality amid more complex modal interactions. Furthermore, we focused exclusively on thermal domain shifts. Introducing additional variables like curvature or strain would challenge the framework with multi-parameter disentanglement. Finally, employing finer thermal control and gradients could further probe the limits of generalization under more precise or transient conditions.
4. Conclusions
This study successfully validated a Deep Learning interrogation scheme for Fiber Specklegram Sensors (FSS) using a massive experimental dataset, confirming that data quantity and diversity are decisive factors in sensor robustness. By systematically scaling the training data from 1752 to 22,776 images, we demonstrated a robust nonlinear reduction in error metrics across the 25.00 °C to 200.00 °C range. The system achieved a final Root Mean Square Error (RMSE) of 0.90 °C, a Mean Absolute Error (MAE) of 0.69 °C, and an R2 of 0.99. These metrics demonstrate a high-precision thermal monitoring capacity suitable for industrial environments, significantly outperforming models limited by data scarcity.
The performance of the MNet-reg architecture confirms that extensive data scaling is essential to navigate the statistical gaps between independent experimental cycles. While Model 1, trained on a single dataset, failed to generalize due to its inability to bridge the measured manifold distances (up to 1.53 in Mahalanobis units), Model 3—leveraging 13 cumulative datasets—effectively learned to extract temperature-invariant features while filtering out stochastic modal noise. This strategy resulted in a 17-fold improvement in predictive accuracy, successfully suppressing the hysteresis and environmental drift typically associated with intensity-based MMF imaging setups.
In summary, these findings demonstrate that the robustness of a learning-based sensor is as dependent on the diversity of the experimental training manifold as it is on the network architecture. This methodology establishes a new benchmark for robust optical sensing, suggesting that large-scale, diverse datasets are essential to transitioning deep learning models from laboratory proof-of-concepts to reliable industrial tools. The proposed data-scaling strategy is not limited to temperature sensing with FSS; it provides a generalizable framework for other fiber-optic sensing modalities (e.g., strain, curvature, or chemical sensing) and for multi-parameter interrogation where cross-sensitivity is a challenge. Future work will focus on hybrid modeling approaches, integrating synthetic datasets generated via the Finite Element Method (FEM) to further improve generalization in harsh environments and expanding the architecture towards multi-parameter sensing systems.
Author Contributions
Conceptualization, F.J.V.H. and J.A.H.-R.; methodology, F.J.V.H. and J.D.A.; deep learning model development, J.D.A. and J.A.H.-R.; writing—original draft preparation, F.J.V.H.; writing—review and editing, J.A.H.-R., V.H.A. and C.T.; supervision, F.J.V.H., C.T., V.H.A. and J.A.H.-R.; funding acquisition, F.J.V.H., C.T. and J.A.H.-R. All authors have read and agreed to the published version of the manuscript.
Funding
This work was partially funded by Universidad Cooperativa de Colombia (UCC) (INV3612); Instituto Tecnologico Metropolitano (ITM) (PE24201), EAFIT University and MINCIENCIAS National Doctorates program.
Institutional Review Board Statement
Not applicable.
Informed Consent Statement
Not applicable.
Data Availability Statement
The original data presented in the study are openly available for academic research in Open Science Framework OSF repository at https://doi.org/10.17605/OSF.IO/8NXVK under Creative Commons license CC-BY-SA 4.0.
Conflicts of Interest
The authors declare no conflicts of interest related to this work.
Abbreviations
The following abbreviations are used in this manuscript:
| FSS | Fiber Optic Specklegram Sensor |
| PID | Proportional–Integral–Derivative |
| CCD | Charge Coupled Device |
| MMF | Multi-Mode Optical Fiber |
| SMF | Single-Mode Optical Fiber |
| ROI | Region Of Interest |
| CNNs | Convolutional Neural Networks |
| UMAP | Uniform Manifold Approximation and Projection for Dimension Reduction |
References
- Pendão, C.; Silva, I. Optical Fiber Sensors and Sensing Networks: Overview of the Main Principles and Applications. Sensors 2022, 22, 7554. [Google Scholar] [CrossRef] [Scilit]
- Theodosiou, A.; Kalli, K. Recent Trends and Advances of Fibre Bragg Grating Sensors in CYTOP Polymer Optical Fibres. Opt. Fiber Technol. 2019, 54, 102079. [Google Scholar] [CrossRef] [Scilit]
- Leal-Junior, A.; Frizera, A.; Marques, C.; Pontes, M.J. Optical Fiber Specklegram Sensors for Mechanical Measurements: A Review. IEEE Sens. J. 2019, 20, 569. [Google Scholar] [CrossRef] [Scilit]
- Chapalo, I.; Stylianou, A.; Mégret, P.; Theodosiou, A. Advances in Optical Fiber Speckle Sensing: A Comprehensive Review. Photonics 2024, 11, 299. [Google Scholar] [CrossRef] [Scilit]
- Fujiwara, E.; dos Santos, M.F.M.; Suzuki, C.K. Optical Fiber Specklegram Sensor Analysis by Speckle Pattern Division. Appl. Opt. 2017, 56, 1585. [Google Scholar] [CrossRef] [Scilit] [PubMed]
- Song, H.; Sun, F.; Sun, Y.; Liu, W. The Optimization of Multimode Fiber Speckle Sensor for Microvibration. Int. J. Opt. 2023, 2023, 3356849. [Google Scholar] [CrossRef] [Scilit]
- Gu, L.; Gao, H.; Hu, H. Demonstration of a Learning-Empowered Fiber Specklegram Sensor Based on Focused Ion Beam Milling for Refractive Index Sensing. Nanomaterials 2023, 13, 768. [Google Scholar] [CrossRef] [Scilit]
- Liu, Q.; Xu, Z.; Tao, G.; Sun, X.; Xue, M.; Yuan, W.; Pan, S. Harnessing Modal Fields Retrieved from Speckle for Multi-Dimensional Metrology. arXiv 2025, arXiv:2509.03976. [Google Scholar] [CrossRef] [Scilit]
- Vélez, F.J.; Arango, J.D.; Aristizábal, V.H.; Trujillo, C.A.; Herrera-Ramírez, J. Comparative Performance Evaluation of Classical Methods and a Deep Learning Approach for Temperature Prediction in Fiber Optic Specklegram Sensors. Comput. Opt. 2024, 48, 689. [Google Scholar] [CrossRef] [Scilit]
- Newaz, A.; Faruque, M.O.; Mahmud, R.A.; Sagor, R.H.; Khan, M.Z.M. Machine-Learning-Enabled Multimode Fiber Specklegram Sensors: A Review. IEEE Sens. J. 2023, 23, 20937. [Google Scholar] [CrossRef] [Scilit]
- Liang, Q.; Tao, J.; Wang, X.; Wang, T.; Gao, X.; Zhou, P.; Xu, B.; Zhao, C.; Kang, J.; Wang, L.; et al. Demodulation of Fabry–Perot Sensors Using Random Speckles. Opt. Lett. 2022, 47, 4806–4809. [Google Scholar] [CrossRef] [Scilit]
- Arango, J.D.; Aristizábal, V.H.; Carrasquilla, J.; Gómez, J.A.; Quijano, J.; Vélez, F.J.; Herrera-Ramírez, J. Deep Learning Classification and Regression Models for Temperature Values on a Simulated Fibre Specklegram Sensor. J. Phys. Conf. Ser. 2021, 2139, 12001. [Google Scholar] [CrossRef] [Scilit]
- Liu, X.; He, S.; Kang, J.; Liu, B.; Zhu, C. Machine Learning Enhanced Smart Tactile Specklegram Fiber Sensor Using Spatial Mode Downsampling. Opt. Express 2024, 32, 31783. [Google Scholar] [CrossRef] [Scilit]
- Yang, Z.; Gu, L.; Gao, H.; Hu, H. Demodulation of Fiber Specklegram Curvature Sensor Using Deep Learning. Photonics 2023, 10, 169. [Google Scholar] [CrossRef] [Scilit]
- Wang, K.; Zhu, C.; Colicchia, E.; Dong, X.; Kurz, W.; Mizuno, Y.; Jakobi, M.; Koch, A.; Chong, Y.D. Neural Network-Based Multimode Fiber Imaging and Characterization Under Thermal Perturbations. arXiv 2024, arXiv:2409.15797. [Google Scholar] [CrossRef] [Scilit]
- Huertas-Montes, I.; Vélez, F.J.; Aristizábal, V.H.; Trujillo, C.; Herrera-Ramírez, J. Evaluating the Generalization Capability of MobileNet-Based CNNs for Temperature Prediction in Simulated Specklegram Fiber Optic Sensors with Combined Synthetic Datasets and Data Augmentation. Trans. Energy Syst. Eng. Appl. 2025, 6, 1–12. [Google Scholar] [CrossRef] [Scilit]
- Yang, L.; Wang, X.; Wu, T.; Lin, H.; Luo, S.; Chen, Z.; Liu, Y.-J.; Pu, J. Deep Learning-Based Multimode Fiber Distributed Temperature Sensing. Sensors 2025, 25, 2811. [Google Scholar] [CrossRef] [Scilit]
- Vélez, F.J.; Arango, J.D.; Aristizábal, V.H.; Trujillo, C.; Herrera-Ramírez, J. Experimental Dataset for Fiber Optic Specklegram Sensing Under Thermal Conditions and Use in a Deep Learning Interrogation Scheme. Data 2025, 10, 44. [Google Scholar] [CrossRef] [Scilit]
- Howard, A.; Zhu, M.; Chen, B.; Kalenichenko, D.; Wang, W.; Weyand, T.; Andreetto, M.; Adam, H. MobileNets: Efficient Convolutional Neural Networks for Mobile Vision Applications. arXiv 2017, arXiv:1704.04861. [Google Scholar] [CrossRef] [Scilit]
- Sadik, S.A. Explainable Vision Transformer Based Temperature Sensing with Fiber Specklegram Sensors. Discov. Sens. 2025, 1, 25. [Google Scholar] [CrossRef] [Scilit]
- Li, Y.; Ju, H.; Wen, Y.; Evangelidis, G.; Salahi, K.; Wang, Y.; Tulyakov, S.; Ren, J. Rethinking Vision Transformers for MobileNet Size and Speed. In Proceedings of the 2023 IEEE/CVF International Conference on Computer Vision (ICCV), Paris, France, 1–6 October 2023; p. 16843. [Google Scholar] [CrossRef] [Scilit]
- Piñeiro, G.; Perelman, S.; Guerschman, J.P.; Paruelo, J.M. How to Evaluate Models: Observed vs. Predicted or Predicted vs. Observed? Ecol. Model. 2008, 216, 316. [Google Scholar] [CrossRef] [Scilit]
- Montgomery, D.C.; Runger, G.C. Applied Statistics and Probability for Engineers, 7th ed.; Wiley: Hoboken, NJ, USA, 2021. [Google Scholar]
- Gao, X.; Wu, J.; Song, B.; Liu, H.; Duan, S.; Zhang, Z.; Liu, X.; Sun, H. Deep Learning for Temperature Sensing with Microstructure Fiber in Noise Perturbation Environment. IEEE Photonics Technol. Lett. 2023, 35, 1247. [Google Scholar] [CrossRef] [Scilit]
- Liu, J.; Ke, Y.; Yang, D.; Deng, Q.; Hei, C.; Han, H.; Peng, D.; Wen, F.; Feng, A.; Zhao, X. Deep Learning-Based Simultaneous Temperature- and Curvature-Sensitive Scatterplot Recognition. Sensors 2024, 24, 4409. [Google Scholar] [CrossRef] [Scilit]
- Li, G.; Liu, Y.; Qin, Q.; Zou, X.; Wang, M.; Ren, W. Feature Extraction Enabled Deep Learning From Specklegram for Optical Fiber Curvature Sensing. IEEE Sens. J. 2022, 22, 15974. [Google Scholar] [CrossRef] [Scilit]
- Long, H.; Chen, X.D.; Cheng, J.; Liu, X.; Yao, P.; Xu, L. Specklegram Evolution under Fiber-End Movement: Theory, Experiment, and High-Prediction-Accuracy Displacement Sensing. Infrared Phys. Technol. 2025, 152, 106224. [Google Scholar] [CrossRef] [Scilit]
- Silveira, M.; Rocha, H.R.O.; Antunes, P.; André, P.; Segatto, M.E.V.; Frizera, A.; Díaz, C.A.R. An Optimized Self-Compensated Solution for Temperature and Strain Cross-Sensitivity in FBG Interrogators Based on Edge Filter. Sensors 2021, 21, 5828. [Google Scholar] [CrossRef] [Scilit]
- Sun, H.; Wu, J.; Song, B.; Wang, J.; Liu, X. Speckle-Decoded Temperature-Insensitive Strain Identification in a Multimode Optical Fiber. Opt. Lett. 2024, 49, 6185. [Google Scholar] [CrossRef] [Scilit]

Disclaimer/Publisher’s Note: The statements, opinions and data contained in all publications are solely those of the individual author(s) and contributor(s) and not of MDPI and/or the editor(s). MDPI and/or the editor(s) disclaim responsibility for any injury to people or property resulting from any ideas, methods, instructions or products referred to in the content. |
© 2026 by the authors. Licensee MDPI, Basel, Switzerland. This article is an open access article distributed under the terms and conditions of the Creative Commons Attribution (CC BY) license.