


Abstract
Residual copper in recycled steel scrap causes surface hot shortness during high-temperature reheating: a copper-rich liquid forms at the scale–metal interface and infiltrates prior austenite grain boundaries (PAGBs). The attack is sharply selective: some boundaries fail completely while immediately adjacent ones stay intact. We resolve its crystallographic basis. Commercial secondary steel wire rod (0.21 wt.% Cu) was sensitized at 1200 °C and water-quenched to martensite. Parent grain reconstruction of high-resolution electron backscatter diffraction (EBSD) data recovered the vanished austenite boundary network, and correlative overlay with scanning electron microscopy crack maps paired 199 classified PAGB segments with their misorientation angle and a binary sensitized/unsensitized state. Wetting begins near 20–22°: no boundary below 20° is penetrated, the sensitized fraction reaches 50% at 24° (95% CI 22–26°), and above 35° every non-Σ3 boundary is penetrated. The onset coincides with the misorientation at which the austenite boundary energy crosses the Smith wetting limit of 2γsl ≈ 0.86 J/m2, calculated to fall at 16–20°. Σ3 boundaries (approximately 60°) are entirely immune despite their high misorientation, their energy lying far below that limit. In this steel, boundary energy rather than misorientation angle alone governs copper wetting, identifying grain boundary engineering as a candidate route to scrap-tolerant steels.
1. Introduction
The transition toward a circular steel economy depends on increased use of secondary, recycled scrap. Residual copper, however, enters the scrap stream as an inevitable tramp element and cannot be removed by conventional oxidative refining [1,2,3,4,5,6,7]. This accumulation limits the recyclability of steel through a degradation mode known as surface hot shortness [8,9]. During reheating near 1200 °C, preferential oxidation of iron at the surface concentrates the more noble copper into the sub-scale region [10]. When local copper levels exceed the solid solubility limit in austenite, a copper-rich liquid phase forms at the scale–metal interface and infiltrates the underlying steel matrix [1,2,3,4,11].
The condition for liquid formation follows from the Fe–Cu phase diagram [12]. A copper-rich liquid coexists with austenite above the peritectic reaction L + γ-Fe ⇌ ε-Cu at 1096 °C, and the solubility of copper in austenite is of the order of 8–10 at.% between 1100 and 1200 °C, rising with temperature to a retrograde maximum of about 12 at.% near 1410 °C. For the 0.21 wt.% Cu steel studied here, the local copper concentration at the scale–metal interface must therefore exceed the bulk level by a factor of roughly fifty before a liquid can form. That enrichment is supplied by the selective oxidation of iron. In this material it has been quantified in earlier work on the same rod: after reheating to 1200 °C and rapid cooling, the copper-rich zones extend about 37 µm into the rod with widths of about 10 µm, and where the copper-rich phase remains solid and can be analyzed quantitatively, at 1050 °C, energy-dispersive spectroscopy gives local copper contents of up to 13 wt.%, above the solubility limit [2,3]. Alloying with nickel, which raises the solubility of copper in austenite and alters the composition of the liquid, is the established metallurgical countermeasure [5,13,14]; it acts on the liquid, not on the boundaries the liquid wets.
The damage this liquid causes is a form of liquid metal embrittlement (LME) [15]. The liquid copper penetrates prior austenite grain boundaries (PAGBs), weakening intergranular cohesion and producing surface cracks under thermomechanical stress [16,17,18]. Cross-sectional microscopy shows that the penetration is not uniform: under identical thermal and stress conditions, liquid copper wets certain boundaries while immediately adjacent boundaries remain completely intact. The micrographs in Section 3.1 show this directly: boundaries meeting at a single triple junction respond in opposite ways to the same liquid.
This selectivity has a thermodynamic explanation. Smith’s classical wetting criterion [19] states that a liquid phase completely wets a solid grain boundary only when the intrinsic energy of that boundary (γgb) equals or exceeds the combined energy of the two solid–liquid interfaces that would replace it (2γsl) [20,21]. The criterion is a statement of local equilibrium at the line where the boundary meets the liquid; it applies wherever liquid is in contact with a boundary and does not require the specimen as a whole to be at a steady temperature. In other words, liquid copper cannot penetrate a boundary unless doing so lowers the total interfacial energy of the system.
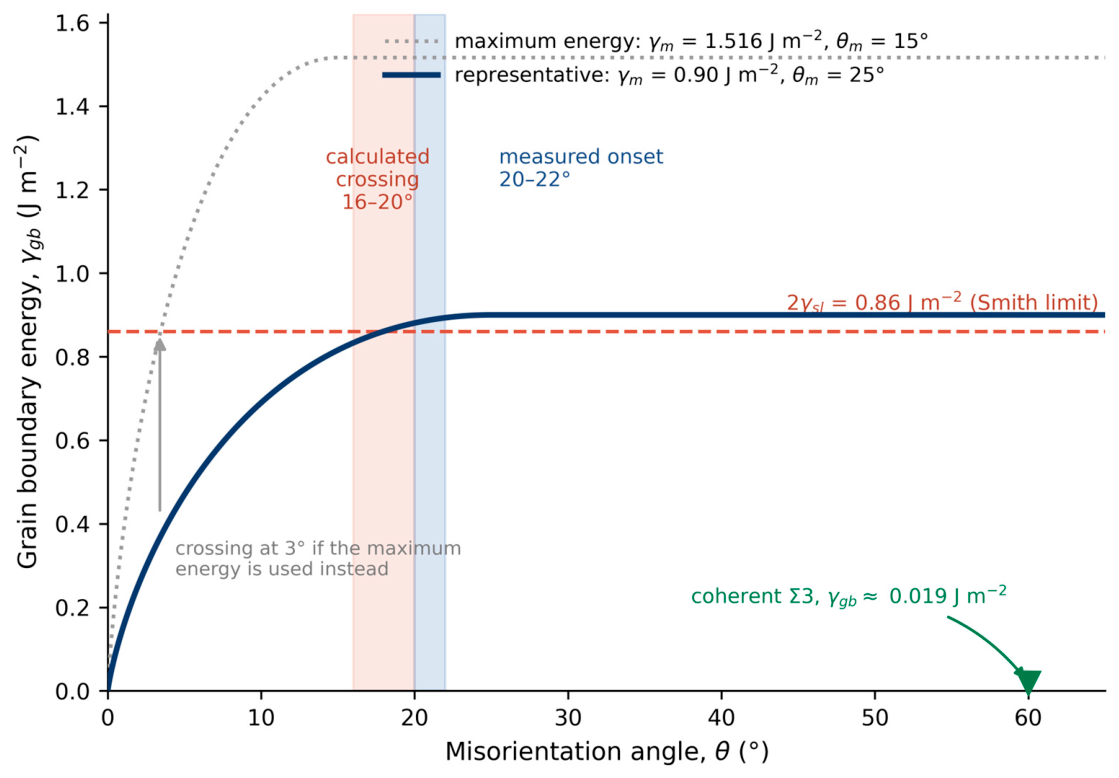
Grain boundary energy, however, is not a single number for a given material. It is strongly anisotropic and is dictated in the first instance by crystallographic misorientation [22,23]. Random high-angle grain boundaries (RHAGBs) have disordered atomic structures and correspondingly high intrinsic energies, making them thermodynamically favorable paths for liquid penetration. Low-angle grain boundaries (LAGBs) and high-symmetry coincidence site lattice (CSL) boundaries—particularly Σ3 coherent twins—exhibit deep energy cusps and should, in principle, resist wetting [24,25]. Strictly, boundary energy depends on five macroscopic degrees of freedom: three describing the misorientation and two defining the boundary plane inclination. It therefore varies between tilt, twist and mixed character even at a fixed misorientation angle [22]. The present study accesses only the misorientation component through two-dimensional EBSD; the consequences of that limitation are addressed in Section 4.4. The dependence of boundary energy on misorientation angle, and its relation to the wetting limit derived below, are shown in Figure 1 [22,26].
Figure 1.
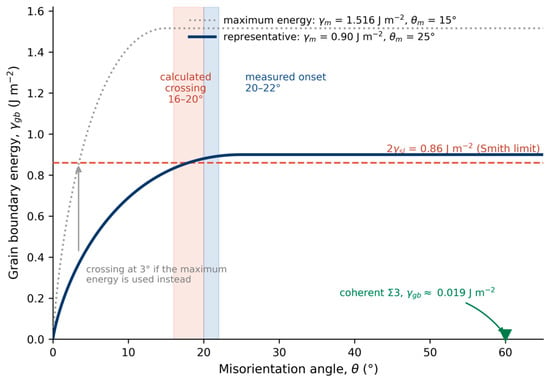
Grain boundary energy γgb as a function of misorientation angle θ, computed from the Read–Shockley relation, Equation (1). Solid curve: a representative austenite high-angle boundary energy, γm = 0.90 J/m2 with θm = 25°. Dotted curve: the maximum computed austenite boundary energy, γm = 1.516 J/m2 with θm = 15°. The dashed line marks the Smith wetting limit, 2γsl = 0.86 J/m2. The representative curve crosses that limit at 16–20° (red band), immediately below the measured onset of sensitization at 20–22° (blue band); anchoring the curve to the maximum energy instead would place the crossing near 3°. The coherent Σ3 cusp at 60° (γgb ≈ 0.019 J/m2) lies far below the limit.
Quantitative bounds can be placed on this expectation. At 1200 °C the solid–liquid interfacial energy between FCC austenite and liquid copper is taken as γsl ≈ 0.43 J/m2 [20,21], so Smith’s criterion requires γgb ≥ 2γsl ≈ 0.86 J/m2 for complete wetting. Atomistic calculations using embedded-atom-method (EAM) potentials for austenitic steel, covering 388 boundaries that span the five-parameter space, give a maximum grain boundary energy of approximately 1.516 J/m2, with coherent Σ3 twin boundaries as low as approximately 0.019 J/m2 [26,27]. That maximum is an upper bound over the full five-parameter boundary space, not the energy of a typical boundary. Experimental determinations of the average high-angle boundary energy of austenite lie well below it: 0.86–0.94 J/m2 for γ-iron at 1350 °C from a recent evaluation of interfacial free energies [28], and 0.76–0.85 J/m2 for γ-iron and austenitic stainless steel in the classical compilation of Murr [27]. A representative random high-angle boundary energy of order 0.9 J/m2 is adopted here on that basis. In the Read–Shockley description of low-angle boundaries [29],
the energy rises steeply with misorientation and saturates at the low- to high-angle structural transition angle θm. Evaluated with a representative γm of order 0.9 J/m2 and θm ≈ 25°, Equation (1) crosses the 0.86 J/m2 Smith limit at approximately 16–20°. The estimate is sensitive to γm: anchoring it instead to the maximal 1.516 J/m2, with the conventional transition angle θm ≈ 15°, places the crossing near 3°. The distinction between a maximal and a representative boundary energy is therefore the controlling assumption in this comparison, and Section 4.1 returns to it. What Equation (1) establishes unambiguously is the ordering: boundaries well below the transition angle cannot satisfy Smith’s criterion, boundaries well above it can, and coherent Σ3 twins are excluded regardless of angle because their energy lies more than forty times below the Smith limit.
γgb(θ) = γm (θ/θm) [1 − ln(θ/θm)], θ ≤ θm,
Testing this expectation experimentally presents a distinct difficulty. Copper penetration occurs at high temperature in the FCC austenite phase. On quenching to preserve the copper distribution for microscopy, the austenite undergoes a displacive transformation to martensite and the original PAGB network is destroyed [30]. Room-temperature EBSD therefore captures only the product phase and masks the crystallographic identity of the boundaries that were present during sensitization [31].
To overcome this barrier, we exploit the crystallographic memory inherent in martensitic transformations. Because the austenite-to-martensite transformation is displacive, the product laths maintain strict orientation relationships with their parent grains, principally the Kurdjumov–Sachs (K–S) relationship [32], which defines a specific parallelism between close-packed planes and directions in austenite (FCC) and martensite (BCC) [33,34]. Parent grain reconstruction (PGR) algorithms invert this relationship to recover the vanished austenite network from high-resolution EBSD data of the martensite [33,35].
The question addressed here is therefore specific: which crystallographic property of a prior austenite boundary decides whether liquid copper penetrates it, and can that property be measured on a boundary network that no longer exists at room temperature? We hypothesize that the susceptibility of a given PAGB to copper sensitization is set by its interfacial energy rather than by its misorientation angle as such, and therefore that (i) a misorientation threshold separating wetted from unwetted boundaries exists in or above the low- to high-angle transition regime, and (ii) Σ3 boundaries are immune irrespective of their angle. To test this, the study combines high-resolution EBSD with computational parent grain reconstruction on a commercial scrap-derived wire rod sensitized under a reheating-type thermal cycle, pairs every classified austenite boundary segment with its misorientation and its observed damage state, and compares the resulting distribution with Smith’s criterion evaluated for the Fe–Cu system.
The novelty of the work lies in three points. The misorientation dependence of grain boundary wetting has been established in model systems such as Cu–In [20]; it has not previously been measured for liquid copper in steel, where the wetted phase transforms on cooling and the boundary population of interest has to be recovered computationally. The measurement is made on a commercial secondary steel under conditions representative of industrial reheating rather than on a bicrystal or a model alloy. And the outcome is a criterion, γgb ≥ 2γsl expressed as a misorientation threshold with a Σ3 exception, that connects the damage to a processing variable, the grain boundary character distribution, which can be engineered.
2. Materials and Methods
2.1. Material and Sensitization Treatment
The experimental material was as-rolled secondary steel wire rod of 5.5 mm diameter containing 0.21 wt.% Cu, representative of typical industrial scrap compositions from shredded automotive and heavy scrap [1,2,3,4]. The full chemical composition of the wire rod is given in Table 1; it is the bulk analysis reported for this rod in the companion studies [1,2,3,4], in which the same material, sourced through Michelin from a commercial wire rod supplier, was first characterized, and it was not re-determined here. The rod was used as received, in the as-rolled condition, with no thermal cycling before the sensitization treatment. Sections of the rod were subjected to a controlled sensitization cycle designed to induce liquid copper formation and grain boundary infiltration while preserving the microstructural state for subsequent crystallographic analysis. The cycle reproduces the thermal exposure a wire rod receives during reheating prior to hot rolling. The specimens were not deformed, and the rapid quench freezes the copper distribution and the boundary damage in the state reached at temperature rather than allowing either to evolve on cooling; any redistribution that would occur during the rolling pass itself is therefore outside the scope of these experiments.
Table 1.
Chemical composition of the 21Cu steel wire rod (wt.%, balance Fe).
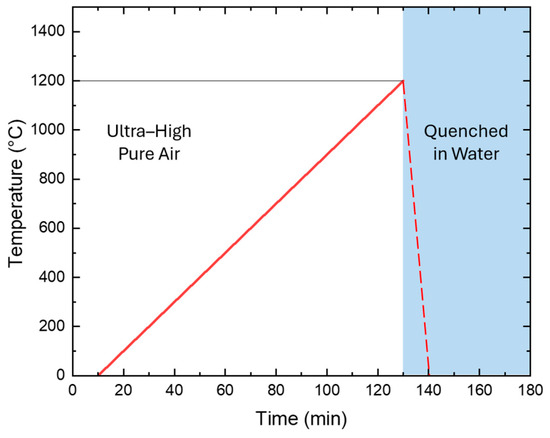
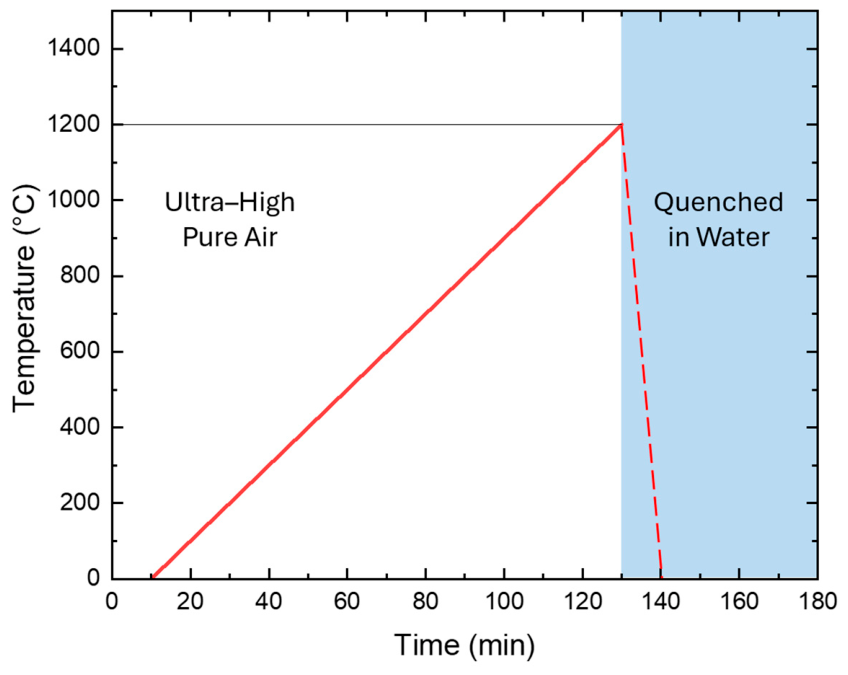
Samples were heated to 1200 °C at approximately 10 °C/min in an SH Scientific SH-FU series tube furnace (SH Scientific Co., Ltd., Sejong, Republic of Korea) under ultra-high-purity air. The atmosphere was oxidizing by design. The selective oxidation of iron is the mechanism that enriches copper beneath the scale, and it is what a wire rod experiences in the combustion atmosphere of an industrial reheating furnace; no protection of the specimen from oxidation was intended or required. Ultra-high-purity air was used rather than laboratory air so that the oxygen partial pressure and the humidity were the same in every run. The furnace tube was purged well in advance of each run so that the atmosphere had reached a steady state before heating began, and a flow of approximately 15 mL/min was maintained through the cycle to replace the oxygen consumed by scale growth. The peak temperature of 1200 °C lies within the reheating range used before hot rolling of wire rod, above the temperature at which a copper-rich liquid can coexist with austenite (1096 °C [12]), and it matches the sensitization temperature of the companion studies on this material [1,2,3,4], so that the damage examined here is the damage those studies treated. Complete austenitization is not in question at this temperature. The Ac3 temperature of the steel, estimated from the composition in Table 1 with Andrews’ relation [36], is approximately 740 °C, so the specimens spent about 46 min above Ac3 during the ramp, the last 30 min of it above 900 °C, which is ample for dissolution of the pearlitic cementite and homogenization of carbon in a 5.5 mm rod. Throughout the ramp, preferential oxidation of iron concentrates copper at the sub-surface until the solubility limit in austenite is exceeded, forming a liquid copper-rich phase that infiltrates the active austenite boundary network. The ramp occupied approximately 120 min, of which the final 10 min lay above the temperature at which the copper-rich liquid forms (1096 °C); on reaching 1200 °C the samples were withdrawn from the furnace and quenched immediately in deionized water at room temperature. Copper enrichment proceeds throughout the oxidizing ramp and does not require an isothermal hold at temperature, so no dwell was applied. Oxidation in air has two side effects. Surface decarburization is addressed below. Internal oxidation of the less noble solutes, silicon, manganese and chromium, at the scale–metal interface accompanies the copper enrichment and is the reason those elements do not follow copper into the sub-scale metal (Section 2.2).
The quench served two purposes. It arrested the copper distribution in the state reached at temperature: the copper-rich liquid solidifies on cooling through the peritectic temperature, and the boundaries it had penetrated remain marked by the solidified phase and by the associated cracking. It also forced a martensitic transformation, bypassing equilibrium ferrite/pearlite formation [30,34]. The martensitic transformation is not itself an object of the study; it is the vehicle that makes the vanished austenite network recoverable. Because the transformation is diffusionless, the product laths preserve the K–S orientation relationship with their parent grains, which is what parent grain reconstruction inverts (Section 2.3). The sequence matters for the interpretation of the results: wetting and penetration occur in austenite at 1200 °C; the liquid solidifies near 1096 °C; and martensite forms only below the martensite start temperature of 238 °C given below, so the transformation and the volume change that accompanies it postdate the sensitization by two stages and cannot alter which boundaries were wetted. The martensitic state is a consequence of the characterization route rather than of the industrial process, and its mechanical implications, including the loss of ductility associated with copper-sensitized boundaries, are reported for this same material in earlier work [2,3]; the present study concerns the crystallographic origin of the damage rather than its mechanical expression.
Heating in air introduces the possibility of surface decarburization. The immediate quench on reaching 1200 °C limits the time spent at the temperatures where decarburization is fastest, and EBSD phase maps confirmed a predominantly martensitic microstructure across all mapped regions, indicating that any decarburization did not extend into the analysis zone. At the carbon level of this steel the martensitic transformation is not expected to run to completion on quenching to room temperature. A martensite start temperature of 238 °C was calculated for this composition, in agreement with the 240 °C obtained from Andrews’ empirical relation applied to the composition in Table 1 [36]. The Koistinen–Marburger relation [37], f = 1 − exp[−α(Ms − T)], in which f is the transformed martensite fraction, T the temperature and α = 0.011 K−1, then gives f = 90.4% at room temperature, leaving approximately 9.6% retained austenite. This residual austenite does not compromise the analysis: it is the untransformed parent phase, so where it is indexed its orientation is already a parent orientation and requires no reconstruction, and it provides a direct check on the orientations recovered from the surrounding martensite. The thermal cycle is illustrated in Figure 2.
Figure 2.
Thermal profile (temperature versus time): heating ramp to 1200 °C under flowing ultra-high-purity air and immediate water quench on reaching temperature.
2.2. Metallographic Preparation and EBSD Acquisition
Following the quench, samples were sectioned longitudinally to expose the sub-surface region in which LME occurred. Because EBSD interrogates only the topmost nanometers of the crystal lattice, sample preparation must produce a surface free of mechanical damage. The quenched specimens were first demagnetized to prevent residual magnetic fields in the martensitic matrix from deflecting the electron beam. Samples were then mounted in conductive resin and prepared by sequential grinding with silicon carbide papers, followed by prolonged vibratory polishing with 0.05 µm colloidal silica to remove any residual amorphous damage layers. For the etched micrograph presented with the results (Section 3.1), a companion section prepared in the same way was etched in 2% nital for approximately 8 s, the procedure used for this material in the companion studies [1,3], to reveal the prior austenite grain boundaries; the sections used for EBSD were not etched.
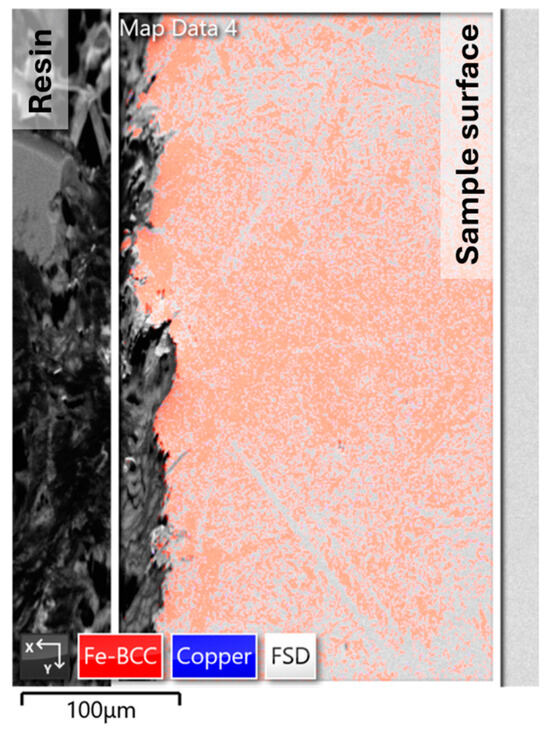
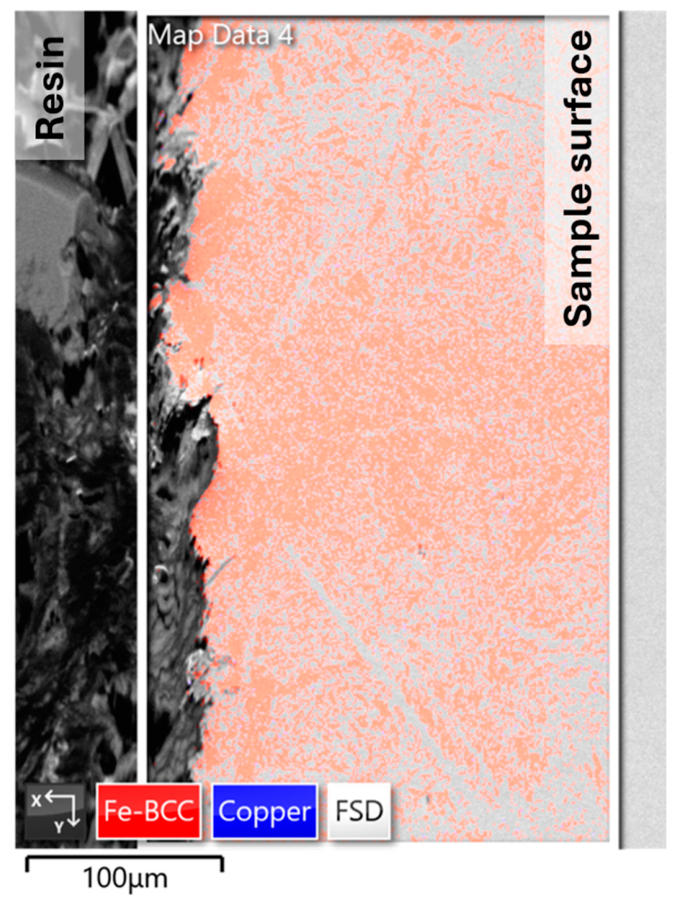
EBSD mapping targeted the extreme periphery of the wire rod cross-sections, the immediate sub-surface region, because copper rejection and intergranular penetration propagate inward from the external scale–metal interface (Figure 3). Backscattered-electron imaging of the damage was performed at 5.00 kV and a 4.0 mm working distance using an angular backscatter detector; the lower-magnification overview in Figure 3 was collected with a forward-scatter detector. Orientation mapping was performed on a Zeiss Auriga SEM/FIB (Carl Zeiss Microscopy GmbH, Jena, Germany) fitted with an Oxford Instruments Symmetry S2 EBSD detector at the Eyring Materials Center, Arizona State University, with acquisition in AZtec and subsequent processing in AztecCrystal 3.3 (Oxford Instruments, High Wycombe, UK) [33]. Maps were collected at an accelerating voltage of 20 kV, a specimen tilt of 70° and a step size of 0.625 µm. Patterns were indexed against BCC ferrite/martensite, FCC austenite and FCC copper phase files; the mean indexing rate was approximately 75%, consistent with the difficulty of indexing as-quenched martensite. Copper and austenite are both face-centered cubic with lattice parameters that differ by less than 1% (0.3615 nm for copper against approximately 0.36 nm for carbon-bearing austenite), so the two cannot be separated reliably by Kikuchi-pattern geometry alone; EBSD phase assignment was therefore used to confirm the martensitic matrix and to locate retained austenite, not as evidence for the presence of copper. The identification of the intergranular phase as copper-rich rests on the correlative chemical analysis already reported for this material, in which copper-enriched zones were shown to coincide with sensitized segments of the prior austenite boundary network [1,2,3,4]; the present study builds on that identification rather than repeating it. Copper is enriched beneath the scale precisely because it is more noble than iron and is rejected from the advancing oxidation front, whereas manganese, chromium and silicon are less noble than iron and report to the scale rather than concentrating in the sub-scale metal. No comparable sub-surface enrichment of those elements is therefore expected, and none has been reported for this material [1,2,3,4]. The reconstructed maps and correlative overlays obtained from these data are presented in Section 3.
Figure 3.
Forward-scatter detector (FSD) image of the wire rod cross-section overlaid with EBSD phase identification, with the indexed Fe-BCC matrix shown in salmon over the gray FSD signal. The resin mount is visible at the far left and the sample surface at the right. The high-resolution EBSD mapping described below targeted the sub-surface region shown here.
2.3. Parent Grain Reconstruction and Misorientation Analysis
Parent grain reconstruction was performed in AztecCrystal (Oxford Instruments) [33], with the K–S relationship as the starting orientation relationship and the software’s standard tolerance and minimum-size settings; the MTEX toolbox [35,38] was used independently during method development to validate the reconstructions obtained, and the two implementations gave consistent parent grain networks for the maps compared. The algorithm applies the inverse rotation operators of the K–S orientation relationship to the measured martensite orientations [32,34]. The K–S relationship defines a strict crystallographic parallelism between the close-packed planes and directions of the parent and child phases: {111}γ || {011}α′ and ⟨01⟩γ || ⟨1⟩α′ [32,33]. This is the most commonly observed orientation relationship in low-alloy carbon steels. The FCC austenite lattice contains four crystallographically equivalent {111} planes, each hosting three equivalent ⟨110⟩ directions related by the K–S parallelism, giving twelve distinct plane–direction pairings; because each pairing can be realized in two symmetry-related senses, a single parent austenite grain can produce up to 24 distinct martensite variants on transformation [34].
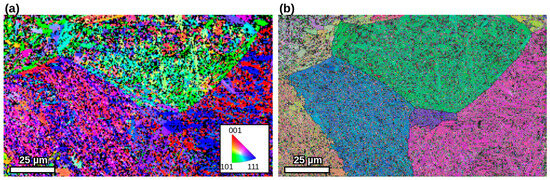
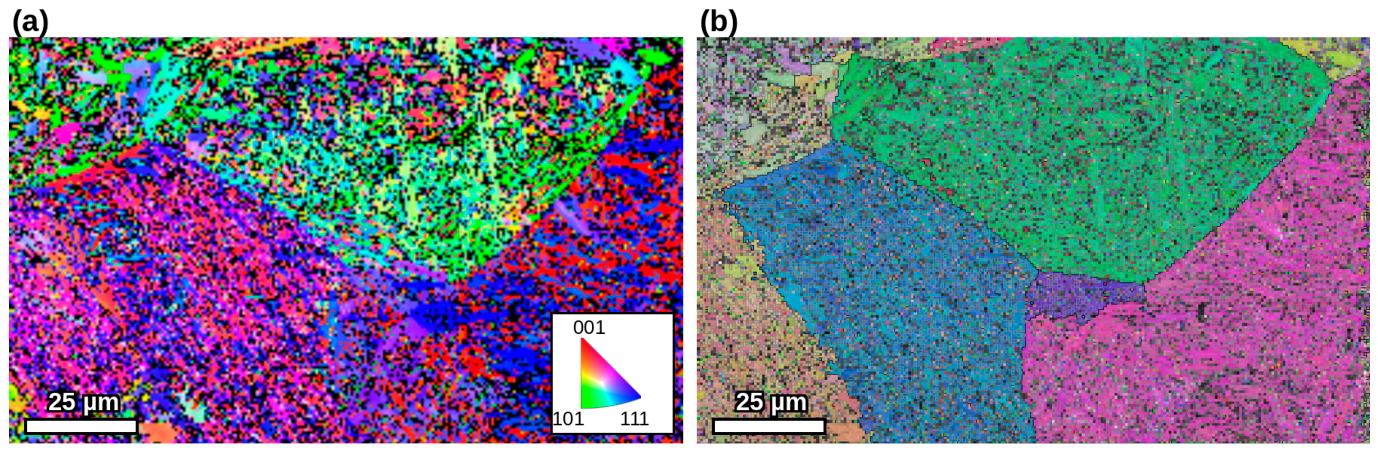
Although the ideal K–S relationship provides the theoretical framework, the operative orientation relationship in real steels commonly deviates slightly, lying between the K–S and the Nishiyama–Wassermann (N–W) relationships depending on local transformation strains and alloy composition [33]. Reconstruction algorithms accommodate this by evaluating the interconnectedness of adjacent variant networks and determining a consensus parent orientation for each group of laths, rather than inverting the orientation relationship lath by lath; the implementations in AztecCrystal and in MTEX differ in detail but share that logic [33,35,39]. Validation of this class of algorithm against austenite maps measured directly at temperature has shown that parent orientations and parent grain sizes are recovered reliably, while the exact morphology of some parent boundaries, twin boundaries in particular, can be lost [40]. Two internal checks were available here: the retained austenite, whose measured orientation is a parent orientation and must coincide with the orientation reconstructed from the surrounding martensite, and the etched micrographs, in which the reconstructed boundary traces could be compared with the chemically revealed ones (Section 3.1). Both were consistent with the reconstructions used. An illustration of the reconstruction procedure is shown in Figure 4.
Figure 4.
Parent grain reconstruction applied to the present material: (a) inverse pole figure (IPF) map of the as-measured martensitic microstructure, unindexed points black; (b) the prior austenite grains and boundaries reconstructed from it, over band contrast. Both panels are the same field, 156 × 94 µm at a 0.625 µm step, and share the IPF colour key inset in (a).
Once parent orientations are assigned, the misorientation angle θ is calculated for every boundary segment between adjacent reconstructed grains. For two grains with orientation matrices gA and gB, the misorientation is defined by the rotation matrix
Δg = gB · gA−1.
Because FCC austenite has 24 rotational symmetry operators and the symmetry applies to both grains, Equation (2) admits a large set of symmetrically equivalent angle–axis pairs describing the same physical boundary; the minimum rotation angle among these equivalents is taken as the misorientation value for that segment. Boundary segments were additionally classified as CSL types using the Brandon criterion, Δθmax = 15°·Σ−1/2 [41], which for Σ3 admits a deviation of 8.66° from the exact 60°/⟨111⟩ relationship, truncated at the upper end by the 62.8° maximum misorientation permitted by cubic symmetry. Segments meeting the Σ3 condition were counted as Σ3 rather than as random high-angle boundaries, irrespective of their misorientation angle.
2.4. Boundary Classification and Dataset
The reconstruction output was spatially overlaid with the correlative SEM imaging. Each reconstructed PAGB segment was tagged with two quantities: its calculated misorientation angle θ, and a binary physical state, “sensitized” (exhibiting copper wetting or cracking) or “unsensitized” (intact), determined from the SEM data. A segment was classed as sensitized when a copper-filled or cracked trace was visible along it in the backscattered-electron image, and as unsensitized when no such trace was visible along its entire length within the mapped field. Segments that could not be assigned unambiguously, for example where a crack trace ran out of the mapped field, were excluded. In total, ten maps acquired on five specimens yielded 199 distinct prior austenite grain boundary segments, of which 153 were sensitized and 46 unsensitized; of the unsensitized segments, 21 were random boundaries and 25 met the Σ3 condition. This paired dataset provides the basis for directly testing Smith’s wetting criterion against the observed damage distribution. The statistical treatment of the dataset is described with the results in Section 3.3.
3. Results
3.1. Morphological Observations of Copper Penetration
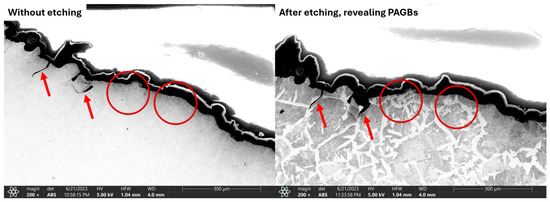
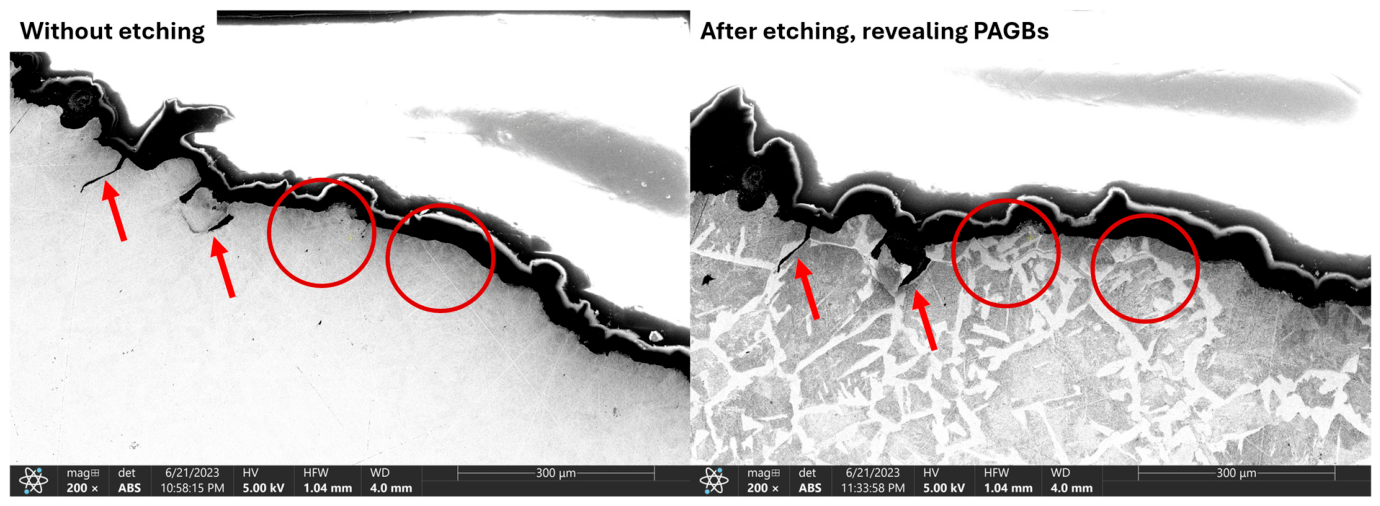
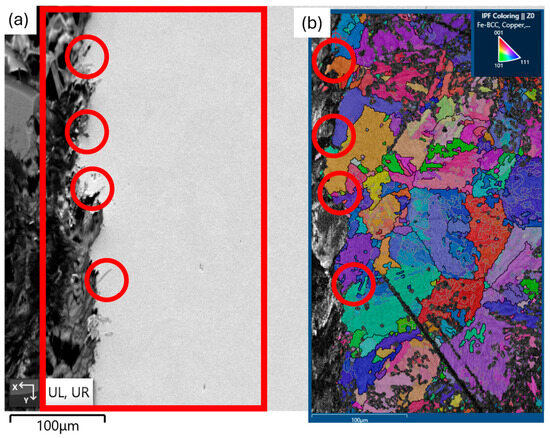
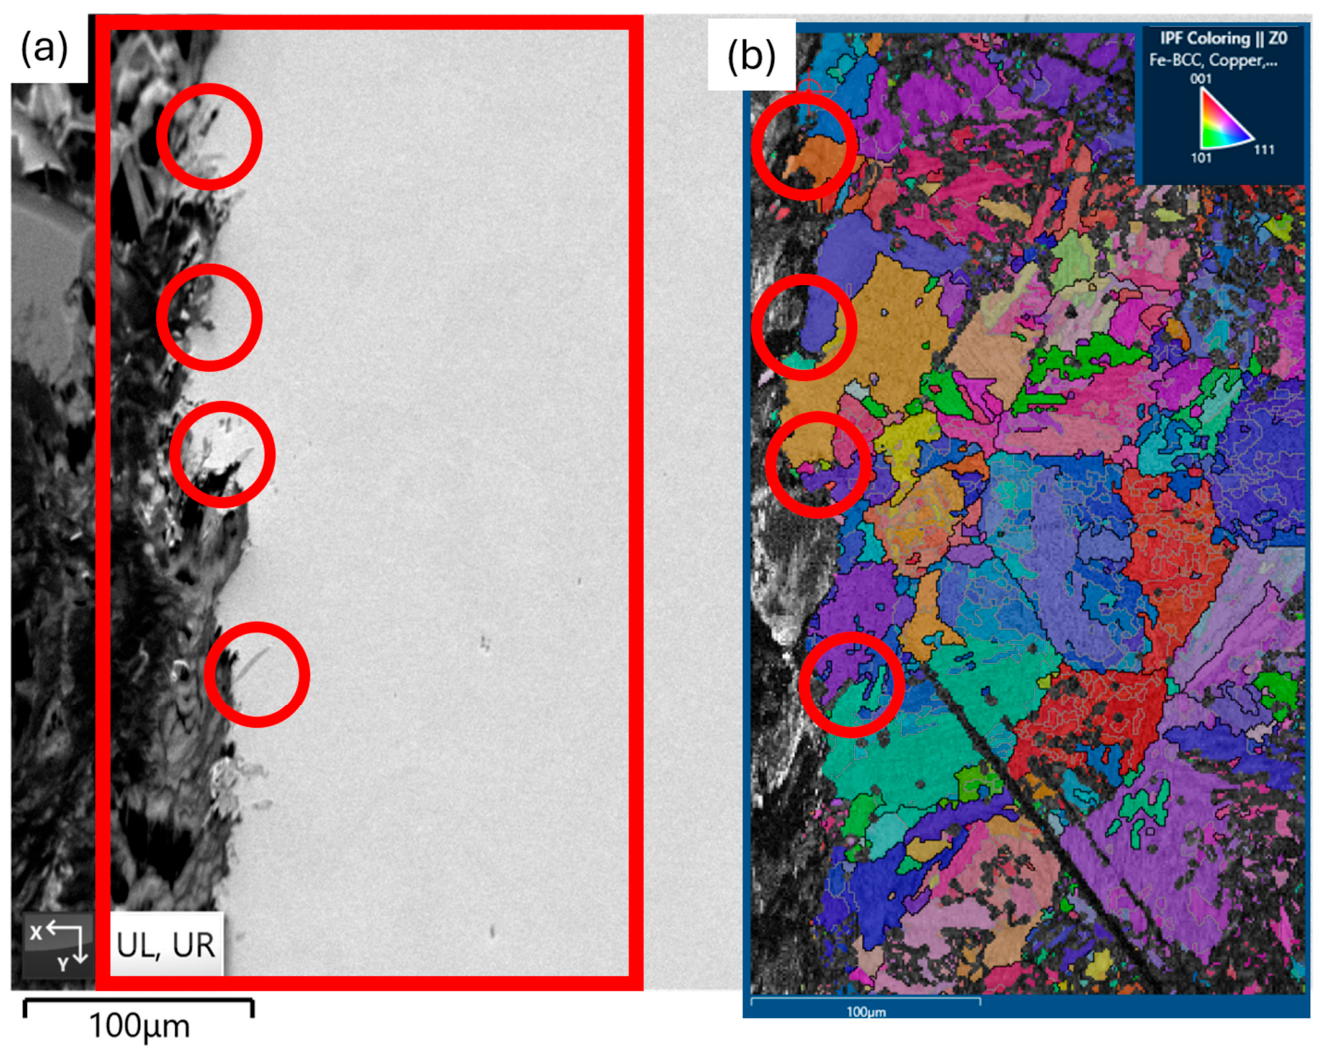
SEM characterization of the quenched specimens revealed severe, localized intergranular cracking and continuous copper penetration networks originating from the wire rod periphery (Figure 5). The observed copper penetration was highly selective: at individual triple junctions a crack would propagate along one or two connected boundary segments but arrest abruptly at the junction, leaving the adjacent boundary entirely intact (Figure 6a). On this basis, each unambiguously assignable boundary segment within the mapped regions was given a binary physical state, sensitized or unsensitized, for the quantitative analysis that follows.
Figure 5.
Cross-sectional SEM micrographs of the steel sub-surface: (left) as-polished (unetched), showing copper penetration cracks along grain boundaries; (right) after chemical etching (2% nital), revealing prior austenite grain boundaries (PAGBs). Arrows indicate sensitized (cracked) boundaries; circles mark neighboring junctions where the boundaries, revealed by etching in the right-hand panel, remain intact, illustrating the selective nature of copper wetting.
Figure 6.
Correlative overlay: (a) SEM micrograph with copper crack traces, the box marking the region mapped by EBSD, and circles marking sites of intergranular copper infiltration; (b) the EBSD-reconstructed prior austenite grain map of the same region, with the corresponding sites circled, confirming spatial alignment of copper penetration with the computed PAGB network.
3.2. Correlative Austenite Reconstruction Maps
The reconstruction resolved the martensitic EBSD data into a coherent map of equiaxed prior austenite grains and their interconnected boundary networks. Superimposing the physical SEM crack traces onto the reconstructed PAGB map confirmed that the copper cracks aligned with the computed prior austenite boundaries. No cracks were observed along the martensite lath, block or packet boundaries interior to a reconstructed prior austenite grain. This spatial correspondence validates both the reconstruction parameters and the expectation that liquid copper penetration propagates exclusively along PAGBs (Figure 6).
3.3. Quantitative Misorientation Distribution
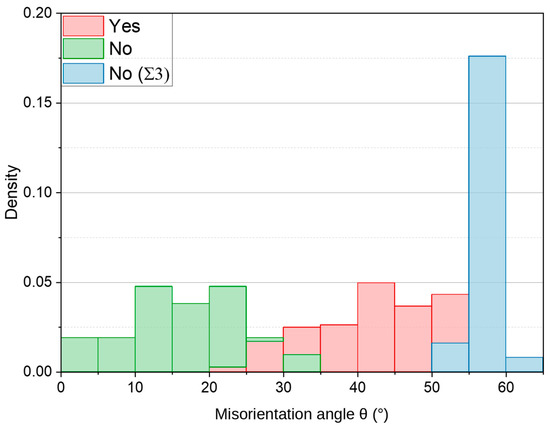
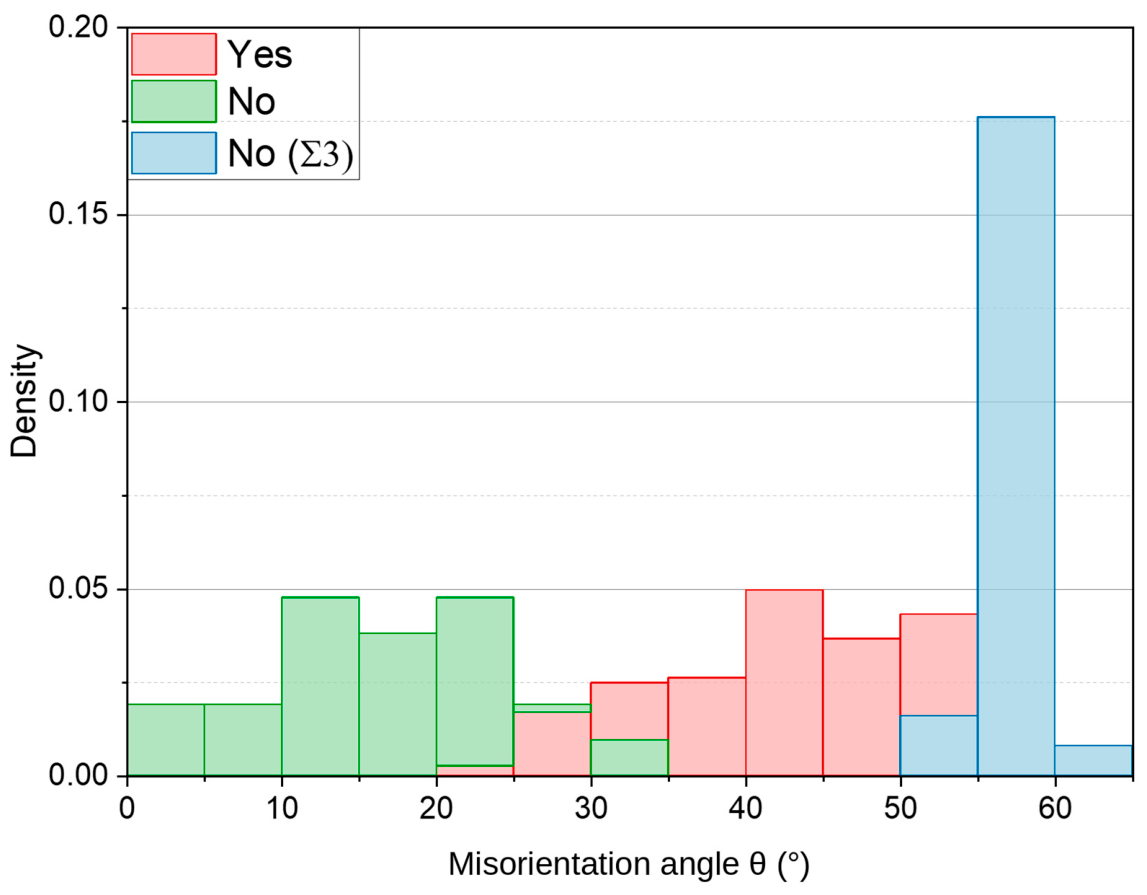
Aggregating the paired data, binary sensitization state and calculated misorientation angle, across all classified boundary segments produced a clear bifurcation in boundary behavior (Figure 7).
Figure 7.
Misorientation angle distribution of the classified prior austenite boundary segments, in 5° bins. Horizontal axis: misorientation angle θ (°); vertical axis: probability density. Data are separated into sensitized (“Yes”, red), unsensitized (“No”, green) and unsensitized Σ3 (“No (Σ3)”, blue) populations; of the 199 classified segments, 153 were sensitized and 46 unsensitized (21 random, 25 Σ3). Each of the three populations is normalized to unit area independently, so bar heights describe the shape of each distribution and not the relative number of boundaries in it.
The unsensitized random boundaries clustered in the low-angle regime, with 13 of the 21 below approximately 20° and the remaining eight forming a tail extending to about 35°. The sensitized boundaries populated the high-angle regime: the first sensitized segments appear in the 20–25° interval, and the population extends to 55° with its highest densities between 40° and 55°. The lower bound is sharp—no segment below approximately 20° was sensitized, and the lowest sensitized segment was measured at 21.5°—but the changeover is not instantaneous. The sensitized fraction of the non-Σ3 population rises from zero below 20° to 2 of 7 in the 20–25° bin, 13 of 15 in the 25–30° bin and 19 of 20 in the 30–35° bin, and only above 35° is every non-Σ3 boundary in the dataset sensitized (119 of 119).
Within the high-angle regime, a distinct anomaly was observed: a population of unsensitized boundaries peaking between 55° and 60°, corresponding to Σ3 boundaries under the Brandon criterion. Despite their high misorientation, none of these boundaries showed copper penetration. Σ3 was the only special boundary type present in the classified population in more than isolated numbers; no other CSL type occurred often enough to support conclusions about its individual wetting behavior.
The strength of this separation can be stated statistically. Fisher’s exact test on the two classes that carry the threshold claim, the 13 non-Σ3 segments below 20° (none sensitized) and the 119 above 35° (all sensitized), gives p ≈ 3 × 10⁻¹⁸, and the Cochran–Armitage test for a trend in sensitized fraction with misorientation angle across all 174 non-Σ3 segments gives p ≈ 6 × 10⁻²¹. A logistic regression of sensitization state on misorientation angle for the non-Σ3 segments places the angle at which the probability of wetting reaches 50% at θ50 = 24°, with a bootstrap 95% confidence interval of 22–26° obtained by resampling segments; the 10% and 90% points fall at about 19° and 29°. For the classes in which no event was observed, the exact one-sided 95% upper bound on the underlying probability is 1 − 0.051/n [42]: the probability of wetting below 20° is bounded at 0.21 (n = 13), the probability of an intact non-Σ3 boundary above 35° at 0.025 (n = 119), and the probability of wetting of a Σ3 boundary at 0.11 (n = 25). The threshold is therefore well determined; the weakest element of the dataset is the small number of low-angle boundaries, which bounds the immunity below 20° less tightly than the other conclusions.
These observations reproduce the ordering predicted in Section 1: low-angle boundaries remain intact, random high-angle boundaries are wetted, and Σ3 boundaries are immune despite their high misorientation. The measured onset falls immediately above the 16–20° at which Equation (1) crosses the Smith limit, and the fitted 50% point lies a few degrees higher still. Section 4.1 examines that comparison.
4. Discussion
4.1. The Wetting Threshold and Smith’s Criterion
The misorientation distribution in Figure 7 divides the reconstructed boundary population into three groups: unsensitized low-angle boundaries below approximately 20°, sensitized boundaries appearing from 20–22° upward and extending to 55°, and unsensitized Σ3 boundaries peaking at 55–60°. The lower bound is sharp: no boundary below approximately 20° was sensitized, which is the signature of a threshold rather than of a smoothly increasing probability. The changeover above that bound is not instantaneous, however. Sensitized and unsensitized segments coexist between roughly 20° and 35°, with the sensitized fraction rising from about 30% in the 20–25° bin to about 90% by 25–30°, and only above 35° does the sensitized population take over completely. A threshold with a finite changeover width is exactly what an energy-based gate acting on a distributed boundary population should produce, and the width is informative in its own right.
The ordering is exactly what Smith’s criterion predicts. In the low-angle regime, grain boundaries consist of ordered arrays of discrete dislocations whose energy rises logarithmically with misorientation according to Equation (1) [29]. Coherent Σ3 twins sit in a deep energy cusp far below the Smith limit [26]. Between these limits lie the random high-angle boundaries, whose disordered, high-excess-volume structure carries the highest energies in the austenite boundary population [26] and which are therefore the thermodynamically favored conduits for liquid copper.
The absolute position of the threshold follows from Equation (1) once a representative rather than a maximal boundary energy is used. With γm of order 0.9 J/m2 and θm ≈ 25°, the calculated γgb crosses the 0.86 J/m2 Smith limit at approximately 16–20°, immediately below the measured onset of 20–22°. Given the uncertainty in γsl and the width of the boundary energy distribution at a fixed misorientation, that is agreement rather than coincidence. Three points qualify it.
First, the comparison is controlled by the choice of γm. The 1.516 J/m2 reported by Ratanaphan et al. [26] is the maximum over the full five-parameter boundary space, not the energy of a typical boundary at a given misorientation; substituted into Equation (1) with the conventional transition angle of 15° it would place the crossing near 3°, far below anything observed. The representative value of order 0.9 J/m2 used here is instead the measured average boundary energy of austenite [27,28], and it is that average, not the maximum, that a boundary drawn at random from the network is likely to carry. Boundaries sharing a misorientation angle sample a broad distribution of energies set by their rotation axis and boundary plane [22,26], and the width of that distribution means the transition from “no boundary wets” to “essentially every boundary wets” is spread over a range of angles rather than occurring at a single point. The observed 20–35° coexistence window is the experimental signature of that spread, and its width is a direct, if coarse, measure of how broad the energy distribution is at a given misorientation angle.
Second, Smith’s criterion is a necessary but not a sufficient condition for observable penetration. Satisfying γgb ≥ 2γsl makes wetting thermodynamically permissible; producing a continuous, micrometer-scale infiltrated path within the available time additionally requires liquid to reach the boundary and rapid transport along it. Grain boundary diffusivity rises by orders of magnitude across the low- to high-angle structural transition, as the discrete dislocation array gives way to a disordered core [22,23,43], and the penetration of liquid copper along iron boundaries is itself a kinetic process whose rate depends on boundary structure [15,18]. Time was limited in this cycle: the specimens spent about 10 min above the temperature of liquid formation (1096 °C) and were quenched on reaching 1200 °C, so a marginally supercritical low-angle boundary may be thermodynamically wettable and yet kinetically unable to develop a resolvable crack. Mechanical factors enter in the opposite sense. No external load was applied during sensitization, so the penetration observed here is driven by interfacial energy, assisted at most by the stresses of scale growth and of thermal gradients in the oxidizing rod; under the tensile stresses of hot rolling, liquid-filled boundaries above the threshold would open as cracks more readily, but stress does not make a sub-critical boundary wettable. The absence of applied stress is what isolates the thermodynamic term this study set out to measure, and the threshold reported here is a wetting threshold, not a fracture threshold under load. Finally, the criterion is applied to a specimen that reached 1200 °C on a ramp rather than at a fixed temperature. That is legitimate because Smith’s condition is a local equilibrium at the triple line, which does not require the specimen as a whole to be at a steady temperature, and because γgb and γsl vary only weakly over the 1096–1200 °C interval in which liquid is present; the criterion is evaluated at the peak temperature, which is the state the quench preserved.
Third, γsl for austenite in contact with liquid copper at 1200 °C is itself uncertain. The 0.43 J/m2 adopted here [20,21] is drawn from analogous systems rather than measured directly for Fe–Cu, and the calculated crossing is sensitive to it, and asymmetrically so: a few percent lower moves the crossing down by two to three degrees, while a few percent higher lifts 2γsl above the representative boundary energy altogether, at which point no boundary satisfies the criterion. The comparison should therefore be read in the right direction. Smith’s criterion is not used here to predict the threshold from first principles; it is used to test whether a threshold of the observed kind exists, whether it lies where a representative boundary energy crosses 2γsl, and whether the Σ3 exception follows. The measurement in turn constrains the interfacial energy: an onset at 20–22° on the representative Read–Shockley curve corresponds to γgb ≈ 0.88–0.89 J/m2, that is to γsl ≈ 0.44–0.45 J/m2, within 5% of the adopted value, and the persistence of intact boundaries up to 35° is what is expected of boundaries whose energy lies below the population average at their misorientation. The adopted value is thus consistent with the observation rather than assumed independently of it, and a direct measurement of γsl for the Fe–Cu system, by the dihedral-angle method for instance, would convert that consistency into a test.
Taken together, these qualifications do not weaken the conclusion; they define its precision. Copper-induced sensitization is not stochastic. It is gated by boundary energy: the gate is shut at low misorientations and opens over a narrow band as the boundary structure approaches the high-angle regime. That band is calculated at 16–20° from Smith’s criterion with a representative austenite boundary energy, and measured at 20–22° in this material. Closing the remaining gap will require the five-parameter grain boundary energy distribution for austenite together with a directly measured γsl for the Fe–Cu system.
4.2. The Σ3 Anomaly: Energy, Not Angle, Governs Wetting
The most striking feature of the misorientation distribution is the isolated population of unsensitized boundaries peaking at 55–60° (Figure 7, blue). These are Σ3 boundaries under the Brandon criterion, and they carry the single most informative piece of evidence in this study.
If misorientation angle alone determined wetting susceptibility, Σ3 boundaries would be among the most vulnerable: they sit squarely in the high-angle regime, well above the 20–22° threshold. They are instead completely immune. No Σ3 boundary in the classified dataset showed copper penetration. The explanation is the energy cusp associated with the Σ3 configuration. A coherent Σ3 twin, the {111} mirror-symmetric configuration, produces a highly ordered, low-excess-volume interface with an intrinsic energy as low as approximately 0.019 J/m2 in austenitic steel [26], more than forty times below the Smith limit. Replacing such an interface with two solid–liquid interfaces would raise, not lower, the total free energy, so it cannot be wetted even when fully surrounded by liquid copper at 1200 °C.
One caveat deserves emphasis. Two-dimensional EBSD resolves the misorientation but not the boundary plane, so the Σ3 population identified here cannot be separated into coherent and incoherent variants; incoherent Σ3 boundaries share the 60°/⟨111⟩ misorientation but have substantially higher energies. That the entire Σ3 population resisted wetting therefore admits two readings, and both support the energy argument rather than undermining it. Either the population is dominated by coherent twins, which is the expected outcome because annealing twins in austenite form on {111} planes, or those incoherent Σ3 boundaries that are present also fall below the Smith limit, which is plausible because Σ3 energies in FCC metals lie well below the random high-angle maximum even when the boundary plane departs from {111} [26]. Distinguishing between the two requires the boundary plane, and therefore three-dimensional characterization (Section 4.4). A further caveat concerns the reconstruction itself: validation studies report that twin boundaries are the feature most often lost or misplaced by reconstruction algorithms [40], so the Σ3 population identified here is, if anything, an undercount, and the immunity conclusion rests on the segments that were recovered.
Σ3 is also the dominant special boundary type in this microstructure; no other CSL type occurred in the classified population in numbers sufficient to assess. The practical implication is clear. In this alloy and at this processing condition, Σ3 boundaries are the only special boundary type present in sufficient quantity to meaningfully interrupt the RHAGB network.
The distinction between angle and energy as the governing parameter is not merely academic. It means that any predictive model of copper sensitization must incorporate boundary character, not just boundary angle. Two boundaries at 55° misorientation can respond in opposite ways to liquid copper depending on whether the interface is a coherent twin or a random configuration. The grain boundary character distribution (GBCD), rather than a misorientation angle histogram alone, is the correct metric for assessing a steel’s vulnerability to hot shortness.
4.3. Implications for Grain Boundary Engineering
The results indicate two structural conditions under which boundaries resist copper sensitization: low misorientation angle or high lattice coincidence (Σ3). Conversely, vulnerability is concentrated in the interconnected network of RHAGBs that spans the microstructure. The practical question is whether that network can be disrupted by design.
Grain boundary engineering (GBE) offers a direct pathway. Thermomechanical processing schedules involving controlled strain and annealing cycles can significantly increase the fraction of Σ3 annealing twins in FCC metals [25,44,45]. In the present dataset Σ3 boundaries make up about one eighth of the classified segments (25 of 199), and GBE processing could increase that fraction substantially. More importantly, increasing the Σ3 population fragments RHAGB connectivity. Because Σ3 boundaries act as thermodynamic dead ends that arrest liquid copper propagation, inserting them into the RHAGB network creates discontinuities that limit the penetration depth of any individual crack.
Razmpoosh et al. [25] demonstrated this principle in the Zn–steel system, showing that twin-induced GBE suppressed liquid metal embrittlement by disrupting crack-path continuity. The present findings extend the concept to the Fe–Cu system and, critically, supply a quantitative criterion—γgb ≥ 2γsl, corresponding to θ ≳ 20–22° in this material—that defines which boundaries need to be eliminated or broken up. A GBE strategy targeting minimum RHAGB connectivity, combined with the desensitization heat treatment validated in earlier work [1,2,3,4], could provide a two-pronged defense: the heat treatment redistributes copper already segregated at boundaries, while GBE removes the structural vulnerability that allowed segregation to become catastrophic in the first place.
Grain boundary engineering and nickel alloying act on opposite sides of the same inequality. Nickel addresses the liquid: it raises the solubility of copper in austenite, so that more copper must accumulate before a liquid forms, and it partitions into the liquid that does form, altering its composition and its interfacial energy against austenite [5,13,14]. Grain boundary engineering addresses the boundary population: it lowers the fraction of boundaries whose energy exceeds 2γsl and breaks the connectivity of those that remain. The two are complementary rather than alternative, and the second has a practical attraction the first lacks, in that it requires no alloying addition to a scrap-derived melt whose composition is not fully under the steelmaker’s control. The threshold reported here is specific to the copper-rich liquid that forms in this low-nickel steel; in a nickel-bearing grade both γsl and the amount of liquid change, and the angular threshold would be expected to shift accordingly (Section 4.4).
This reframes the copper contamination problem. Rather than treating all grain boundaries as equally vulnerable and relying solely on reactive thermal remediation, the crystallographic data indicate that a steel whose boundary network is dominated by LAGBs and Σ3 twins should be structurally more tolerant of elevated copper levels, a proposition that remains to be tested by processing trials. The question becomes one of processing optimization: which thermomechanical schedules, in the context of wire rod production, would maximize the Σ3 fraction without compromising the fine pearlitic microstructure required for downstream cold drawing?
4.4. Methodological Considerations
The correlative approach used in this study, combining PGR-derived crystallographic data with physical SEM damage mapping, represents a necessary advance for mechanistic studies of high-temperature degradation. Conventional etching can reveal the macroscopic traces of prior austenite boundaries [30,31], and recent deep-learning approaches can reconstruct prior austenite grains from optical micrographs [46], but neither provides the crystallographic misorientation data needed to test energy-based wetting models. Without misorientation data it is impossible to test whether a boundary’s wetting behavior correlates with its energy, its CSL character or any other structural parameter. The successful reconstruction of the vanished austenite network, and the spatial alignment of the reconstructed boundaries with the physical copper cracks (Figure 6), confirm that PGR applied to martensitic microstructures is a reliable tool for this class of problem.
Several limitations should be acknowledged. First, the analysis is performed on two-dimensional cross-sections, which capture only three of the five macroscopic degrees of freedom that define a grain boundary. The misorientation angle and axis are accessible, but the boundary plane orientation is not. Because grain boundary energy depends on all five parameters [22,26], some of the scatter in the data may reflect boundary plane effects that the present analysis cannot resolve. This is most evident in the changeover zone between 20° and 35°, where the sensitized and unsensitized populations coexist, and it is also what prevents the coherent and incoherent Σ3 populations from being separated (Section 4.2). Three-dimensional EBSD, by serial sectioning or diffraction contrast tomography, would provide the full five-parameter characterization, though at considerably greater experimental cost.
Second, the reconstruction algorithm assumes a single dominant orientation relationship. While the K–S relationship is well justified for low-alloy carbon steels, local deviations from the ideal relationship still occur. These can arise from residual transformation strains or from compositional gradients near the copper-enriched boundaries, and could introduce small errors in the reconstructed orientations. Reconstruction algorithms that refine the orientation relationship from the data itself partially mitigate this [33,35], but quantifying the residual uncertainty in the reconstructed misorientations remains an area for further work. A quantitative uncertainty budget would be particularly valuable near the threshold, where an error of a few degrees would move individual segments across it. Two considerations bound the effect. Validation against austenite measured in situ shows that parent orientations are recovered reliably even where the morphology of some boundaries is not [40], and the residual austenite in the present maps provided an internal check of the same kind. The changeover window observed here, 20–35°, is wide compared with the few degrees of orientation uncertainty that reconstruction introduces, and only the segments in the 15–25° bins, 11 of 174 non-Σ3 segments, lie close enough to the lower bound for such an error to change their class; even if every one of them were misassigned, the bound would move by one bin, not disappear. The volume change of the martensitic transformation is a separate matter: it occurs after the copper has solidified and cannot redistribute it or alter which boundaries were wetted, but it contributes to the local deviations from the ideal orientation relationship discussed above. Local misorientation metrics of the martensite, such as the kernel average misorientation, could be used in future work to weight or exclude regions of high transformation strain from the reconstruction, and a formal propagation of the orientation uncertainty into the threshold, by reconstructing each map under perturbed orientation relationships and repeating the classification, would settle the point. Reconstruction quality metrics beyond the indexing rate, such as the variant clustering accuracy or the fraction of laths assigned to a consensus parent, were not retained from the present workflow and would be a useful addition in future work. A related point concerns decarburization, which is bounded more directly by the phase maps than by a diffusion estimate: carbon diffusion in austenite over this thermal cycle gives a characteristic depletion length of the order of a hundred micrometers, but a decarburized layer transforms to ferrite rather than martensite on quenching and would be conspicuous in the phase maps, and the mapped sub-surface regions indexed as martensite throughout. A measured carbon profile would settle the point quantitatively.
Third, the present dataset, while sufficient to establish the threshold and to demonstrate the Σ3 exception, would benefit from expansion across a wider range of copper concentrations and sensitization conditions in order to assess the generality of the 20–22° threshold. The threshold reflects the interplay of the austenite boundary energy distribution with the Fe–Cu interfacial energy, and both depend on alloy composition, so the angular value reported here should not be assumed to carry over to other grades without that confirmation. The logistic regression reported in Section 3.3 gives the threshold with a confidence interval, but a larger low-angle population would tighten the bound on immunity below 20°, which is the least well constrained of the conclusions, and would allow the changeover width to be resolved by boundary type.
Fourth, the threshold is a property of the austenite boundary energy distribution and of γsl for the austenite–liquid copper system, and both depend on composition. Nickel is the classical suppressant of copper-induced hot shortness because it raises the solubility of copper in austenite and alters the liquid that forms [5]; chromium and silicon likewise modify the sub-scale chemistry. The steel studied here contains 0.07 wt.% Ni and 0.13 wt.% Cr, low enough that their effect on γsl should be small, but the threshold reported here should not be assumed to transfer unchanged to a nickel-bearing grade. By the same argument, raising the copper content should increase the volume of liquid available and the depth to which it penetrates without displacing the angular threshold itself, because the threshold is set by the interfacial energies rather than by the amount of liquid present. That is a straightforward prediction and it has not been tested here. Thermal history enters through the amount and distribution of liquid rather than through the threshold: a longer or hotter cycle enriches more copper and drives penetration deeper along boundaries that already satisfy the criterion, whereas a cycle that stays below the temperature of liquid formation produces solid-state copper enrichment along the boundaries without the liquid wetting studied here, as the companion studies on this material show [2,3]. The grain-boundary-engineering argument of Section 4.3 is likewise made for this alloy class; in steels whose boundary energy distribution or γsl differ materially, the angular position of the threshold, though not the logic of the criterion, would have to be re-established.
Fifth, wetting thresholds reported for other systems do not all fall at 20–22°, and there is no reason to expect them to. The threshold is set by 2γsl relative to the boundary energy distribution of the host phase, so a different liquid metal, a different matrix or a different temperature moves it. Straumal et al. [20] report the misorientation dependence of complete wetting in the Cu–In system, and comparable studies in other liquid-metal systems place the transition elsewhere. A meaningful comparison across systems requires matching both the interfacial energy and the boundary energy distribution of the host, and the value reported here should be read as specific to austenite in contact with liquid copper at 1200 °C rather than as a universal constant.
Finally, the analysis addresses the misorientation between adjacent parent grains rather than the absolute orientation of either grain. Whether the orientation of a parent grain relative to the free surface influences the depth to which copper penetrates along its boundaries is a separate question, and one the present dataset does not resolve.
5. Conclusions and Recommendations
This study investigated the crystallographic determinants of preferential copper sensitization in recycled steel wire rods by combining high-resolution EBSD with computational parent grain reconstruction. The principal findings are:
- The PGR algorithm successfully reconstructed the high-temperature prior austenite grain boundary network from room-temperature martensitic EBSD data. Spatial overlay with SEM crack maps confirmed that copper penetration occurred exclusively along the computed PAGBs, validating the reconstruction approach for mechanistic studies of liquid metal embrittlement.
- A misorientation threshold of approximately 20–22° governs the onset of copper wetting in this material: no boundary below 20° was sensitized. Above the threshold the sensitized fraction rises across a changeover band of roughly 20–35°, reaching 50% at 24° (95% confidence interval 22–26°), and above 35° every non-Σ3 boundary in the dataset (119 of 119) was penetrated.
- The measured threshold agrees with Smith’s criterion. Taking γsl = 0.43 J/m2 for the austenite–liquid copper system and a representative rather than maximal austenite boundary energy in the Read–Shockley description, the 2γsl = 0.86 J/m2 crossing falls at 16–20°, immediately below the measured onset. The comparison is controlled by the choice of boundary energy: anchoring it to the maximum computed value instead would place the crossing near 3°, so the distinction between a maximal and a representative energy is the governing assumption.
- Σ3 boundaries, the dominant special boundary type in this microstructure, are completely immune to copper sensitization despite their high misorientation (approximately 60°). This demonstrates that boundary energy, not misorientation angle alone, is the governing variable, and that the grain boundary character distribution is the appropriate metric for assessing susceptibility.
- These findings provide a quantitative basis for evaluating grain boundary engineering as a proactive strategy against copper-induced hot shortness. If the Σ3 fraction can be raised and the connectivity of the random high-angle network broken by thermomechanical processing, a steel structurally tolerant of elevated residual copper becomes conceivable. The results identify the boundaries such a strategy must target, in one steel and one sensitization cycle; they do not by themselves establish that the strategy is achievable in wire rod production.
Recommendations and Future Scope
Three lines of work follow directly from these results. First, the boundary-energy gate identified here should be tested across copper levels and sensitization cycles, to establish how far the angular threshold shifts with composition, which the interfacial-energy argument ties to changes in γsl and in the boundary energy distribution rather than to the copper level itself.
Second, the practical target for grain boundary engineering is not the Σ3 fraction in isolation but the connectivity of the random high-angle network. The quantity a processing route should be designed to reach is the special-boundary fraction at which continuous penetration paths through that network are interrupted, and percolation analysis of reconstructed boundary networks is the natural way to identify it. Reporting a target Σ3 fraction without that analysis would not be meaningful, since the same fraction can leave the network either connected or broken depending on how the special boundaries are distributed.
Third, on the processing side, the thermomechanical schedules known to raise annealing-twin fractions in FCC metals—moderate strain followed by annealing, applied iteratively—should be evaluated for wire rod production under the constraint that the fine pearlitic microstructure required for downstream cold drawing is preserved. That constraint, rather than the achievable twin fraction, is likely to set the practical limit.
Beyond these three lines, the work that would most directly extend the present results is as follows. A direct determination of γsl for austenite in contact with liquid copper, by dihedral-angle measurement at the sensitization temperature, would replace the value taken from analogous systems and make the comparison with Smith’s criterion a test rather than a consistency check. Three-dimensional EBSD, by serial sectioning or diffraction contrast tomography, would supply the boundary plane and separate coherent from incoherent Σ3 boundaries. Repeating the measurement on steels of different copper, nickel and silicon content and under different reheating cycles would establish how far the threshold moves with composition, and whether raising the copper level alone leaves it in place as the interfacial-energy argument predicts. A larger low-angle boundary population, together with a formal propagation of the reconstruction uncertainty, would tighten the bound on immunity below the threshold. Direct chemical mapping of the penetrated boundaries in the quenched specimens, by energy-dispersive spectroscopy at the resolution of the reconstruction, would close the remaining gap between the crystallographic and the chemical descriptions of the same boundaries. And percolation analysis of reconstructed boundary networks would convert the Σ3 fraction into the quantity that matters for processing, the connectivity of the wettable network, and set the target for grain boundary engineering trials.
A final observation. Copper is not only a contaminant. It is deliberately added to precipitation-strengthened steels, where ε-Cu precipitation is an established strengthening route, and the framework set out here does not preclude that use: it concerns the liquid phase that forms above the solubility limit at reheating temperatures, not the solid-state precipitates that form on ageing. Whether a scrap-derived steel can be processed so that its residual copper is taken into strengthening precipitates rather than left available to form a boundary-wetting liquid is an attractive question, and one on which the present results bear only indirectly.
Author Contributions
Conceptualization, R.G. and S.S.; methodology, R.G.; software, R.G.; validation, R.G., P.A., T.S., C.M., N.N. and S.S.; formal analysis, R.G.; investigation, R.G.; resources, T.S., C.M., S.H., N.N. and S.S.; data curation, R.G.; writing—original draft, R.G.; writing—review and editing, R.G., P.A., T.S., C.M., S.H., N.N. and S.S.; visualization, R.G.; supervision, T.S., C.M., S.H., N.N. and S.S.; project administration, T.S., C.M., S.H., N.N. and S.S.; funding acquisition, S.H., N.N. and S.S. All authors have read and agreed to the published version of the manuscript.
Funding
This material is based upon work supported by the U.S. Department of Energy’s Office of Energy Efficiency and Renewable Energy (EERE) under the Advanced Manufacturing Office Award Number DE-EE0007897 awarded to the REMADE Institute, a division of Sustainable Manufacturing Innovation Alliance Corp.
Institutional Review Board Statement
Not applicable.
Informed Consent Statement
Not applicable.
Data Availability Statement
The original contributions presented in this study are included in the article. The misorientation angle and sensitization state of each classified boundary segment, and any further information, are available from the corresponding author on request.
Acknowledgments
The authors acknowledge the John M. Cowley Center for High-Resolution Electron Microscopy and the Eyring Materials Center at Arizona State University. The assistance and cooperation of our industry supporters (Nucor, EVRAZ and Michelin) are greatly acknowledged.
Conflicts of Interest
Authors Charlotte Mayer and Sebastien Hollinger were employed by the company Michelin. The remaining authors declare that the research was conducted in the absence of any commercial or financial relationships that could be construed as potential conflicts of interest. The company Michelin had no role in the design of the study; in the collection, analyses or interpretation of data; in the writing of the manuscript; or in the decision to publish the results.
References
- Gandra, R.; Acharya, P.; Shyrokykh, T.; Mayer, C.; Hollinger, S.; Neithalath, N.; Sridhar, S. Mitigation of Cu-induced grain boundary sensitization in steel wire rods through a desensitization heat treatment. Processes 2026, 14, 195. [Google Scholar] [CrossRef] [Scilit]
- Acharya, P.; Gandra, R.; Shyrokykh, T.; Mayer, C.; Hollinger, S.; Sridhar, S.; Neithalath, N. Sensitization and mechanical response of Cu-containing steel rods. Steel Res. Int. 2025, 96, 2400358. [Google Scholar] [CrossRef] [Scilit]
- Gandra, R.; Acharya, P.; Shyrokykh, T.; Mayer, C.; Hollinger, S.; Neithalath, N.; Sridhar, S. Effect of heat treatment on the microstructure and tensile properties of Cu-bearing steel rods. J. Adv. Manuf. Process. 2025, 7, e70030. [Google Scholar] [CrossRef] [Scilit]
- Gandra, R.; Acharya, P.; Shyrokykh, T.; Mayer, C.; Hollinger, S.; Neithalath, N.; Sridhar, S. A predictive diffusion model for designing a desensitization heat treatment in steels with Cu impurities. Processes 2026, 14, 1603. [Google Scholar] [CrossRef] [Scilit]
- Shibata, K. Suppression of surface hot shortness of steel due to Cu (+Sn) from scrap without using Ni. Trans. Mater. Res. Soc. Jpn. 2004, 29, 1871–1874. [Google Scholar]
- Daehn, K.E.; Cabrera Serrenho, A.; Allwood, J.M. How will copper contamination constrain future global steel recycling? Environ. Sci. Technol. 2017, 51, 6599–6606. [Google Scholar] [CrossRef] [Scilit]
- Kalhor, A.; Skowronek, A.; Rodak, K.; Kuc, D.; Krupp, U.; Grajcar, A. Copper in steels: From residual contamination to a functional alloying element. Steel Res. Int. 2026, 2501329. [Google Scholar] [CrossRef] [Scilit]
- Nicholson, A.; Murray, J.D. Surface hot shortness in low-carbon steel. J. Iron Steel Inst. 1965, 203, 1007–1018. [Google Scholar]
- Melford, D.A. The influence of residual and trace elements on hot shortness and high temperature embrittlement. Philos. Trans. R. Soc. Lond. A 1980, 295, 89–103. [Google Scholar] [CrossRef] [Scilit]
- Huang, Y.; Yang, F.; Lu, J.; Wang, S.; Mao, X. Thermo-history-dependent copper enrichment during high-temperature oxidation of recycled steels. Materials 2026, 19, 595. [Google Scholar] [CrossRef] [Scilit]
- Chu, Y.; Wen, D.; Wang, W. Study on the embrittlement of steel grain boundaries caused by penetration and diffusion of liquid copper. Coatings 2025, 15, 408. [Google Scholar] [CrossRef] [Scilit]
- Swartzendruber, L.J. Cu-Fe (Copper-Iron). In Binary Alloy Phase Diagrams, 2nd ed.; Massalski, T.B., Ed.; ASM International: Materials Park, OH, USA, 1990; pp. 1408–1409. [Google Scholar]
- Imai, N.; Komatsubara, N.; Kunishige, K. Effect of Cu, Sn and Ni on hot workability of hot-rolled mild steel. ISIJ Int. 1997, 37, 217–223. [Google Scholar] [CrossRef] [Scilit]
- Shibata, K.; Seo, S.-J.; Kaga, M.; Uchino, H.; Sasanuma, A.; Asakura, K.; Nagasaki, C. Suppression of surface hot shortness due to Cu in recycled steels. Mater. Trans. 2002, 43, 292–300. [Google Scholar] [CrossRef] [Scilit]
- Joseph, B.; Picat, M.; Barbier, F. Liquid metal embrittlement: A state-of-the-art appraisal. Eur. Phys. J. Appl. Phys. 1999, 5, 19–31. [Google Scholar] [CrossRef] [Scilit]
- Bhattacharya, D.; Cho, L.; Van der Aa, E.; Ghassemi-Armaki, H.; Pichler, A.; Findley, K.O.; Speer, J.G. Transgranular cracking in a liquid Zn embrittled high strength steel. Scr. Mater. 2020, 175, 49–54. [Google Scholar] [CrossRef] [Scilit]
- Razmpoosh, M.H. Investigation of Liquid-Metal-Embrittlement Crack-Path: Role of Grain Boundaries and Responsible Mechanism. Ph.D. Thesis, University of Waterloo, Waterloo, ON, Canada, 2020. [Google Scholar]
- Fredriksson, H.; Hansson, K.; Olsson, A. On the mechanism of liquid copper penetration into iron grain boundaries. Scand. J. Metall. 2001, 30, 41–50. [Google Scholar] [CrossRef]
- Smith, C.S. Grains, phases, and interfaces: An interpretation of microstructure. Trans. AIME 1948, 175, 15–51. [Google Scholar]
- Straumal, A.B.; Yardley, V.A.; Straumal, B.B.; Rodin, A.O. Influence of the grain boundary character on the temperature of transition to complete wetting in the Cu–In system. J. Mater. Sci. 2015, 50, 4762–4771. [Google Scholar] [CrossRef] [Scilit]
- Takashima, M.; Wynblatt, P.; Adams, B.L. Correlation of grain boundary character with wetting behavior. Interface Sci. 2000, 8, 351–361. [Google Scholar] [CrossRef] [Scilit]
- Rollett, A.D. Grain Boundary Properties: Energy; Lecture Notes; Course 27-750; Carnegie Mellon University: Pittsburgh, PA, USA, 2014. [Google Scholar]
- Takata, N.; Ikeda, K.; Yoshida, F.; Nakashima, H.; Abe, H. Grain boundary structure and its energy of ⟨110⟩ symmetric tilt boundary in copper. Mater. Sci. Forum 2004, 467–470, 807–812. [Google Scholar] [CrossRef] [Scilit]
- Jiang, S. Thermally Induced Sensitisation of Austenitic Stainless Steel for AGR Fuel Cladding. Ph.D. Thesis, University of Birmingham, Birmingham, UK, 2019. [Google Scholar]
- Razmpoosh, M.H.; Macwan, A.; Goodwin, F.; Biro, E.; Zhou, Y. Suppression of liquid-metal-embrittlement by twin-induced grain boundary engineering approach. Materialia 2020, 11, 100668. [Google Scholar] [CrossRef] [Scilit]
- Ratanaphan, S.; Sarochawikasit, R.; Kumanuvong, N.; Hayakawa, S.; Beladi, H.; Rohrer, G.S.; Okita, T. Atomistic simulations of grain boundary energies in austenitic steel. J. Mater. Sci. 2019, 54, 5570–5583. [Google Scholar] [CrossRef] [Scilit]
- Murr, L.E. Interfacial Phenomena in Metals and Alloys; Addison-Wesley: Reading, MA, USA, 1975. [Google Scholar]
- Hanao, M. Experimental evaluation of interfacial free energy of solid iron. ISIJ Int. 2020, 60, 436–441. [Google Scholar] [CrossRef] [Scilit]
- Read, W.T.; Shockley, W. Dislocation models of crystal grain boundaries. Phys. Rev. 1950, 78, 275–289. [Google Scholar] [CrossRef] [Scilit]
- Vander Voort, G.F. Revealing Prior-Austenite Grain Boundaries; Vac Aero International: Burlington, ON, Canada, 2014; Available online: https://vacaero.com/information-resources/metallography-with-george-vander-voort/1405-revealing-prior-austenite-grain-boundaries.html (accessed on 15 April 2026).
- Collins, J.; Taylor, M.; Scarlett, A.L.; Palmiere, E.J.; Pickering, E.J. Prior austenite grain measurement: A direct comparison of EBSD reconstruction, thermal etching and chemical etching. Mater. Charact. 2024, 208, 113656. [Google Scholar] [CrossRef] [Scilit]
- Kurdjumov, G.; Sachs, G. Über den Mechanismus der Stahlhärtung. Z. Phys. 1930, 64, 325–343. [Google Scholar]
- Oxford Instruments. Parent Grain Reconstruction Using EBSD Data; Oxford Instruments NanoAnalysis: High Wycombe, UK; Available online: https://www.ebsd.com/ois-ebsd-system/parent-grain-reconstruction (accessed on 15 April 2026).
- Huang, C.-Y.; Lu, S.-L.; Yen, H.-W. Digital reconstruction of engineered austenite: Revisiting effects of grain size and ausforming on variant selection of martensite. Metals 2022, 12, 1511. [Google Scholar] [CrossRef] [Scilit]
- Niessen, F.; Nyyssönen, T.; Gazder, A.A.; Hielscher, R. Parent grain reconstruction from partially or fully transformed microstructures in MTEX. J. Appl. Crystallogr. 2022, 55, 180–194. [Google Scholar] [CrossRef] [Scilit]
- Andrews, K.W. Empirical formulae for the calculation of some transformation temperatures. J. Iron Steel Inst. 1965, 203, 721–727. [Google Scholar]
- Koistinen, D.P.; Marburger, R.E. A general equation prescribing the extent of the austenite–martensite transformation in pure iron–carbon alloys and plain carbon steels. Acta Metall. 1959, 7, 59–60. [Google Scholar] [CrossRef] [Scilit]
- Bachmann, F.; Hielscher, R.; Schaeben, H. Texture analysis with MTEX—Free and open source software toolbox. Solid State Phenom. 2010, 160, 63–68. [Google Scholar] [CrossRef] [Scilit]
- Nyyssönen, T.; Isakov, M.; Peura, P.; Kuokkala, V.-T. Iterative determination of the orientation relationship between austenite and martensite from a large amount of grain pair misorientations. Metall. Mater. Trans. A 2016, 47, 2587–2590. [Google Scholar] [CrossRef] [Scilit]
- Taylor, M.; Smith, A.D.; Donoghue, J.; Burnett, T.L.; Pickering, E.J. In-situ heating-stage EBSD validation of algorithms for prior-austenite grain reconstruction in steel. Scr. Mater. 2024, 242, 115924. [Google Scholar] [CrossRef] [Scilit]
- Brandon, D.G. The structure of high-angle grain boundaries. Acta Metall. 1966, 14, 1479–1484. [Google Scholar] [CrossRef] [Scilit]
- Hanley, J.A.; Lippman-Hand, A. If nothing goes wrong, is everything all right? Interpreting zero numerators. JAMA 1983, 249, 1743–1745. [Google Scholar] [CrossRef] [Scilit]
- Turnbull, D.; Hoffman, R.E. The effect of relative crystal and boundary orientations on grain boundary diffusion rates. Acta Metall. 1954, 2, 419–426. [Google Scholar] [CrossRef] [Scilit]
- Watanabe, T. An approach to grain boundary design for strong and ductile polycrystals. Res. Mech. 1984, 11, 47–84. [Google Scholar]
- Randle, V. Twinning-related grain boundary engineering. Acta Mater. 2004, 52, 4067–4081. [Google Scholar] [CrossRef] [Scilit]
- Bachmann, B.I.; Müller, M.; Britz, D.; Durmaz, A.R.; Ackermann, M.; Shchyglo, O.; Staudt, T.; Mücklich, F. Efficient reconstruction of prior austenite grains in steel from etched light optical micrographs using deep learning and annotations from correlative microscopy. Front. Mater. 2022, 9, 1033505. [Google Scholar] [CrossRef] [Scilit]

Disclaimer/Publisher’s Note: The statements, opinions and data contained in all publications are solely those of the individual author(s) and contributor(s) and not of MDPI and/or the editor(s). MDPI and/or the editor(s) disclaim responsibility for any injury to people or property resulting from any ideas, methods, instructions or products referred to in the content. |
© 2026 by the authors. Licensee MDPI, Basel, Switzerland. This article is an open access article distributed under the terms and conditions of the Creative Commons Attribution (CC BY) license.