


Abstract
When droop control of virtual synchronous generators (VSGs) with rotational inertia is adopted in islanded alternating current (AC) microgrids, the coupling mechanism among reactive power loads, control parameters and system virtual inertia remains unclear, and there is a lack of quantitative evaluation schemes. To address this issue, this paper proposes a quantitative evaluation method for virtual inertia based on a reduced-order equivalent model. First, the control system of grid-forming converters is simplified to construct a reduced-order model for microgrid voltage support, and the analytical expression of voltage dynamics and the calculation formula of the system-level inertia time constant are derived. Subsequently, a three-dimensional response surface is utilized to multi-dimensionally analyze the influence laws of filter cutoff frequency, reactive power load, rotational inertia and damping coefficient on system inertia and steady-state voltage drop. Finally, a reduced-order model of the AC microgrid is established based on the RT-Lab hardware-in-the-loop (HIL) experimental platform, and multiple sets of results validate the correctness of the theoretical analysis.
1. Introduction
In recent years, the installed capacity of wind power, photovoltaics (PV), and distributed energy storage has continued to grow, and AC microgrids, as a vital form of local renewable energy consumption, have been widely deployed. By leveraging microgrids, renewable energy can be integrated nearby and loads supplied locally, establishing them as a key technological pathway for advancing the energy transition of new power systems. However, following the integration of numerous power-electronic distributed generators, the stochastic output of renewables couples with the strong nonlinearity of converters, often leading to issues such as node voltage fluctuations and insufficient system stability margins. Virtual Synchronous Generators (VSGs), by emulating the inertia and external characteristics of synchronous machines, effectively support the voltage and frequency of islanded microgrids. They have become the mainstream grid-forming control solution for such systems, and research focusing on VSG control optimization has emerged as a hotspot in the field of power-electronic-based distribution networks [1].
Rich research achievements have been attained domestically and internationally in the direction of traditional droop and VSG reactive power sharing optimization. Reference [2] proposed an adaptive virtual impedance VSG strategy, relying on surface fitting to dynamically tune the virtual resistance, achieving precise reactive power sharing proportional to capacity under different operating conditions. Reference [3] counteracted line impedance voltage drops by adding a controlled compensation voltage source to the droop loop, coordinating with secondary regulation to realize bus voltage restoration. Sliding mode control based on average voltage observers and communication-free voltage regulation schemes via small AC signal injection have also been utilized to improve reactive power sharing accuracy [4,5]. Multi-agent cooperative control and improved secondary droop strategies can effectively optimize reactive power sharing characteristics in islanded microgrids [6,7,8]; other studies have further enhanced sharing precision by optimizing the traditional droop architecture [9]. The above works have effectively improved the steady-state voltage regulation and reactive power distribution performance of microgrids, but most of them focus on control topology optimization, with insufficient attention to the dynamic inertia mechanism behind voltage support.
With the continuous expansion of grid-forming converter application scenarios, relevant research has gradually extended from islanded microgrids in the distribution network to the transmission grid level, and the massive integration of grid-forming power converters has become an important feature of future low-inertia power systems [10]. At the research level of fundamental theories and advanced control algorithms for grid-forming converters, Reference [11] systematically summarizes the control principles, synchronization methods, and cutting-edge development directions of various grid-forming converter types. Reference [11] utilizes non-intrusive online impedance identification to enhance the transient performance of oscillator-type grid-forming converters. For weak grid fault conditions, the fast IVS control scheme accelerates the voltage recovery process at the Point of Common Coupling (PCC) [12]. Advanced algorithms—including nonlinear generalized minimum variance control, finite-time secondary voltage regulation, and distributed regulation accounting for communication delays—have been successively implemented for microgrid voltage optimization [13,14,15]. Concurrently, some studies have investigated parameter matching and operational stability in systems coexisting with grid-forming and grid-following converters [16,17]. Mature solutions are also available for reference regarding secondary reactive power and voltage coordinated control in droop systems [18].
In terms of quantitative analysis of virtual inertia, reduced-order modeling has become a core approach to reveal the inertial characteristics of power electronic systems. Reference [19] established a reduced-order equivalent model for photovoltaic-storage hybrid systems and evaluated the system inertia level from the perspective of frequency dynamic response. From the data-driven perspective, measurement-based inertia estimation methods tailored for AC microgrids have also been developed, which identify the equivalent inertia of the system through measured dynamic waveforms [20]. However, existing inertia quantification studies mostly focus on the frequency dimension and seldom analyze the influence of low-pass filter links on voltage dynamic performance. There is still a lack of explicit analytical derivation and systematic evaluation methods for the virtual inertia characteristics in the voltage support process of islanded AC microgrids.
Although existing studies have improved the voltage regulation and reactive power sharing performance of microgrids, most of them focus on the optimization of voltage regulation algorithms and control topologies while generally ignoring the influence of the rotational inertia link in droop control. Quantitative derivation and quantitative evaluation tools for the coupling mechanism among reactive power loads, filter parameters and system virtual inertia are insufficient, making it difficult to realize refined tuning of VSG control parameters in practical engineering.
Given the research gaps identified above, the main contributions of this work are as follows:
- (1)
- Taking the islanded AC microgrid adopting droop control with virtual synchronous generators (VSGs) as the research object, a reduced-order equivalent model was established.
- (2)
- The analytical expression of the voltage dynamic response and the evaluation formula for the system inertia time constant were derived.
- (3)
- Three-dimensional response surfaces were plotted to illustrate how the key parameters affect system inertia and steady-state voltage drop.
2. Virtual Inertia Analysis of Voltage Support Capability in AC Microgrids
2.1. Topology and Control of AC Microgrids for Voltage Support Capability
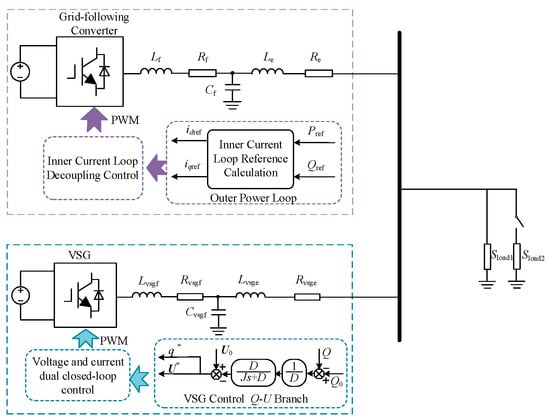
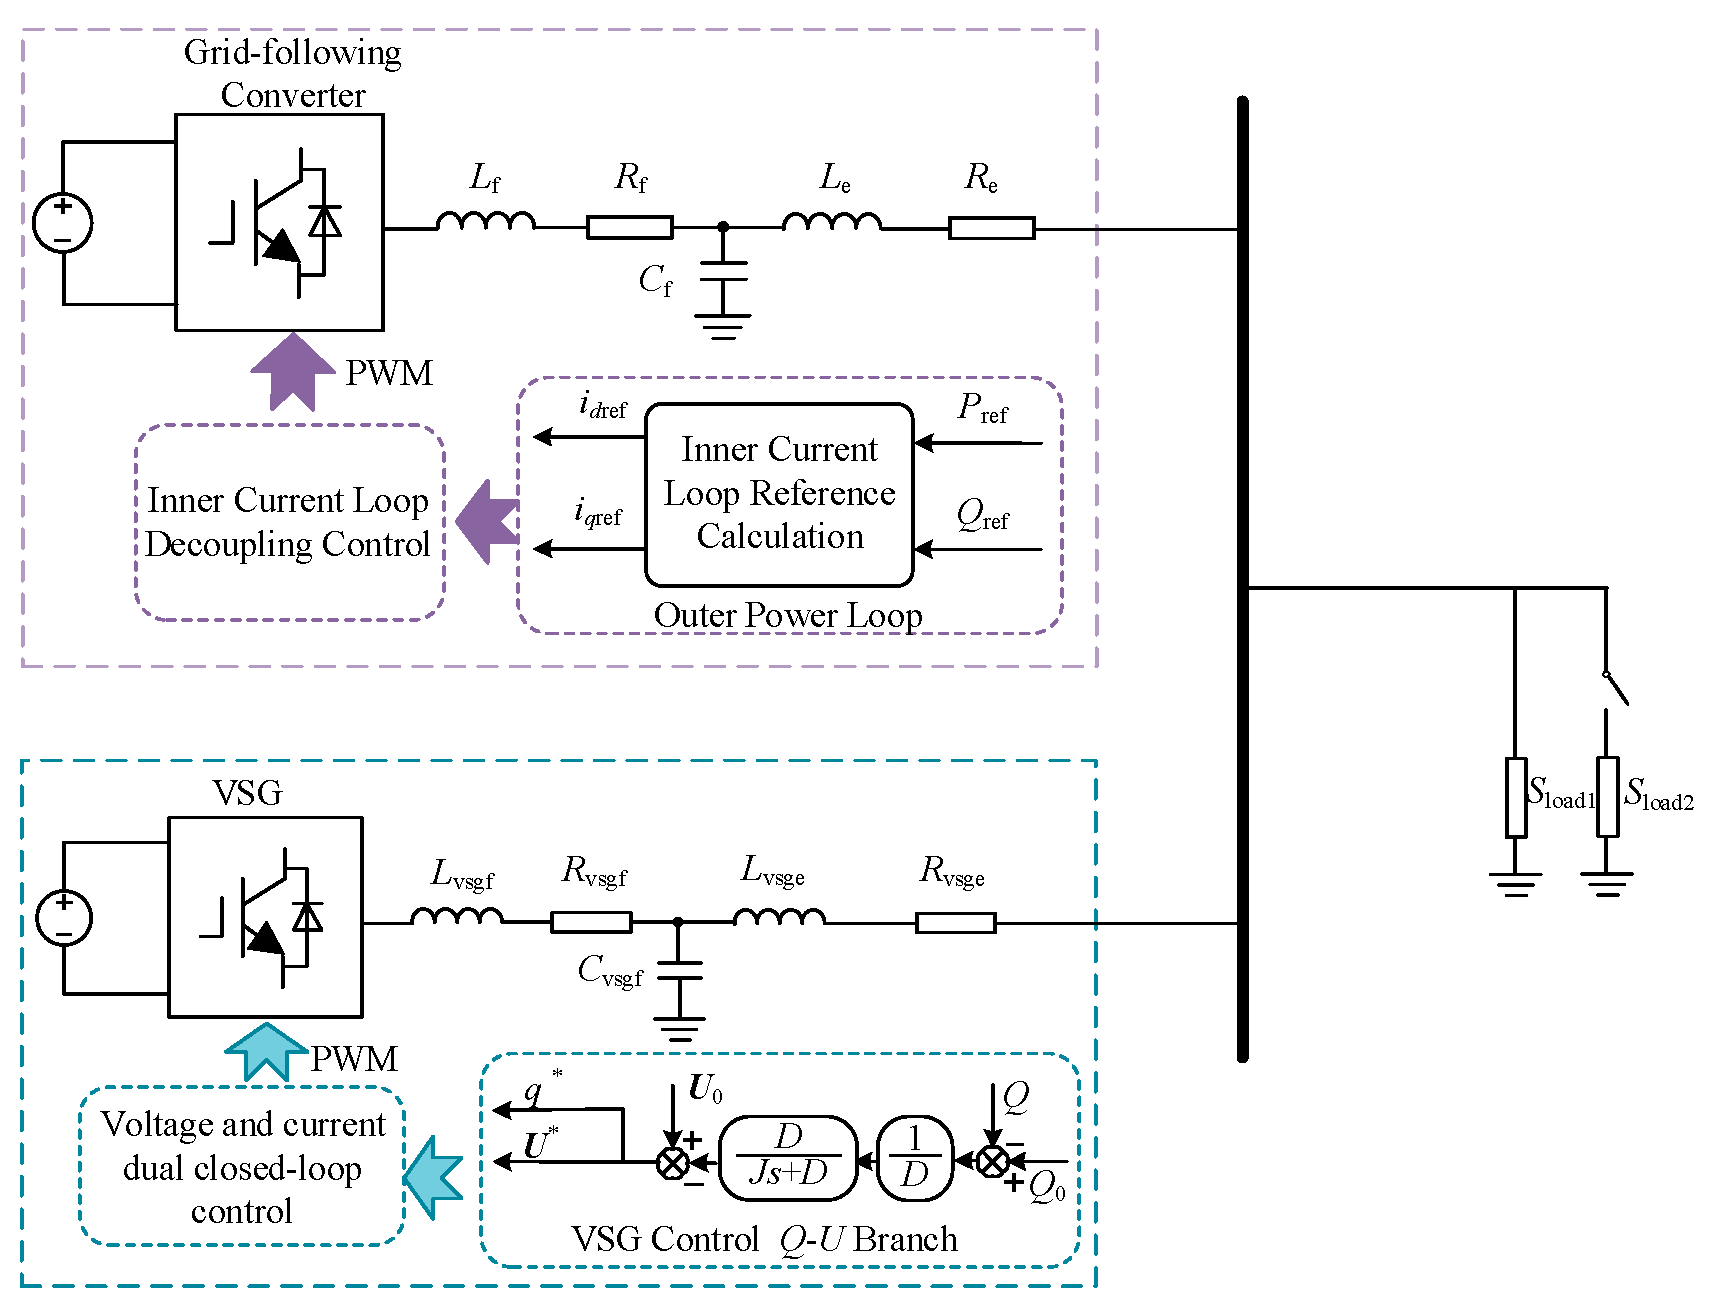
This study takes the islanded AC microgrid shown in Figure 1 as the research object (unless otherwise specified, this AC microgrid is referred to in the following text). The system is composed of VSG-type droop-controlled grid-forming converters and grid-following converters. In the figure, Lf, Rf, Cf, Lvsgf, Rvsgf, Cvsgf, J, D and Sload denote the filter inductance, filter resistance, filter capacitance, filter inductance of the droop-controlled grid-forming converter, filter resistance, filter capacitance, rotational inertia, damping coefficient, and load power, respectively. The control framework consists of an outer droop loop and an inner voltage-current double closed-loop structure. Q-U droop control is adopted to achieve voltage support and reactive power sharing, which ultimately drives the output of the inverter. Grid-following converters do not participate in the system’s inertial response and have no direct impact on the virtual inertia time constant. However, the reactive power output characteristics of grid-following converters affect the steady-state voltage amplitude. Therefore, grid-forming converters dominate the system’s virtual inertia and dynamic voltage response characteristics, while grid-following converters mainly influence the system’s steady-state voltage level.
Figure 1.
Topology of the AC microgrid.
2.2. Voltage Dynamic Response Process of AC Microgrids for Voltage Support Capability
To verify the description accuracy of voltage dynamic characteristics for the islanded AC microgrid established in this paper, a model characterizing the voltage support capability of the AC microgrid is constructed on the MATLAB/Simulink (R2022a) simulation platform. The built simulation model operates based on the islanded operation mode, and the system is equipped with droop-controlled grid-forming converters. With the autonomous voltage and frequency regulation functions of the converters, stable operation of the AC microgrid can be realized without support from the bulk power grid. The system parameters are presented in Table 1.
Table 1.
Simulation parameters of the AC microgrid.
The low-pass filter is used to filter out high-frequency interference in the voltage detection signal, ensuring the stability and control accuracy of the droop control.
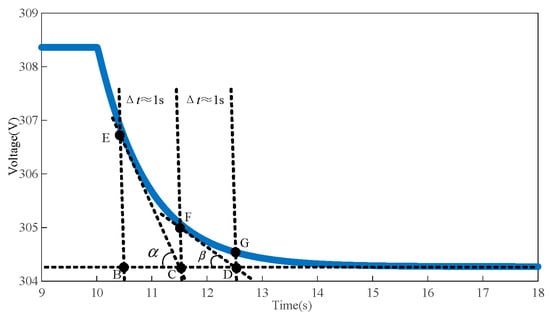
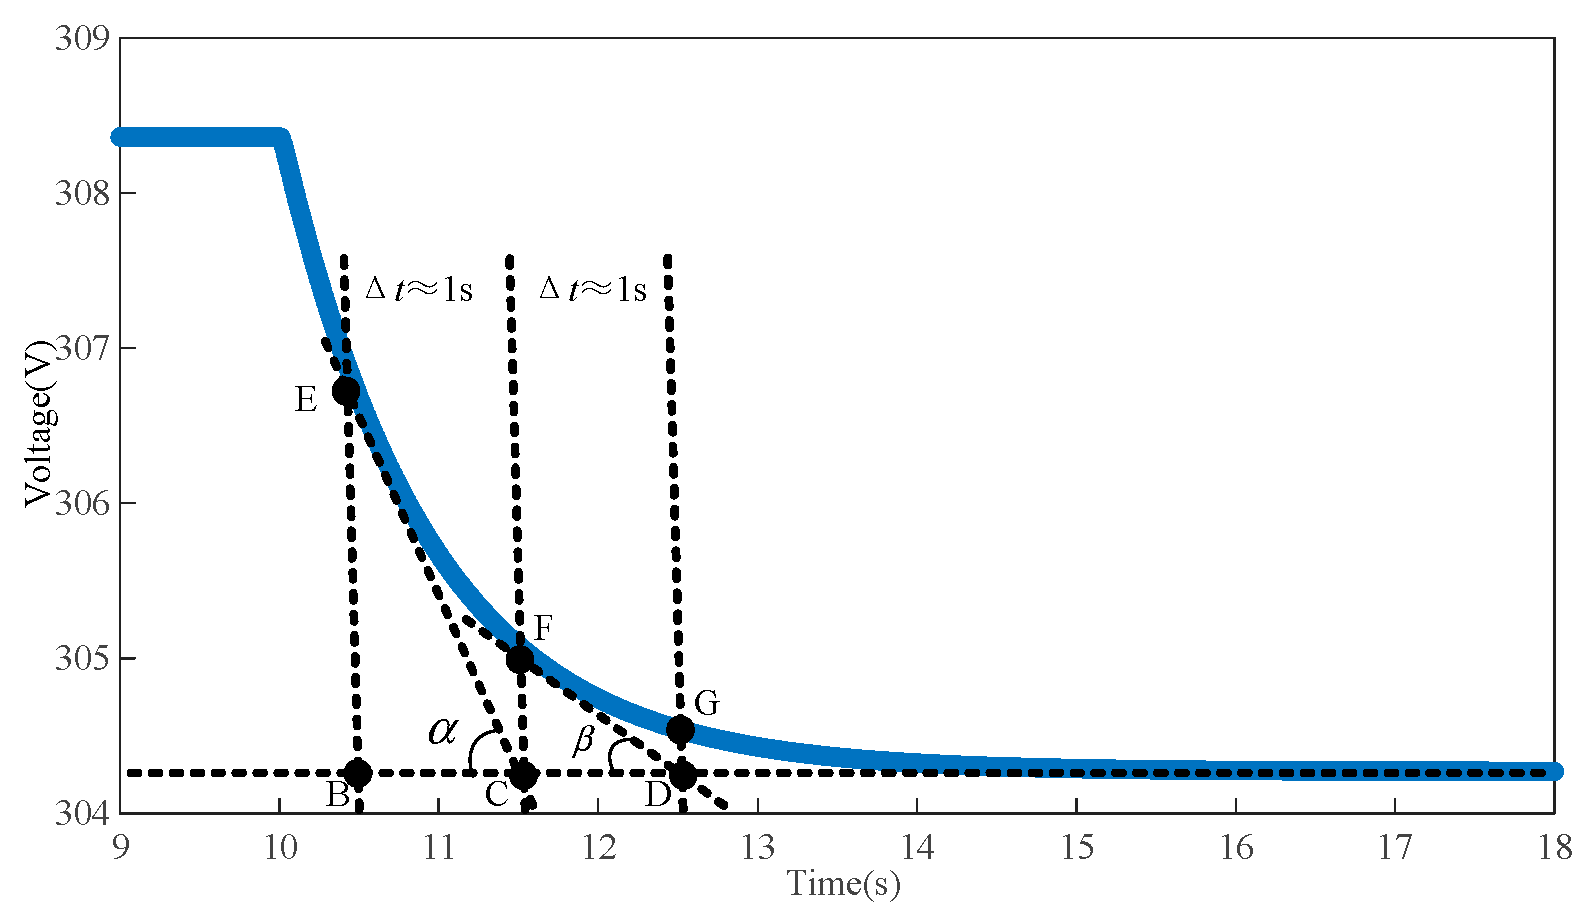
At t = 10 s, Sload2 is connected to the circuit. Consequently, the system reactive power disturbance increases from 20 kvar to 40 kvar. The voltage simulation results of the AC microgrid are presented in Figure 2, exhibiting distinct virtual inertia characteristics. During the simulation, the system voltage drops from 308.4 V to 304.3 V following a specific dynamic pattern, with the entire sag process lasting approximately 5 s. This paper defines this duration as the system virtual inertia response time, which intuitively reflects the inertial support capability and dynamic response characteristics of the AC microgrid under reactive power disturbances.
Figure 2.
Voltage simulation results of the AC microgrid.
In Figure 2, a tangent line EC is drawn through point E. Here, α denotes the angle between the tangent line EC and the horizontal time axis, and EB represents the vertical voltage magnitude difference. Similarly, for the tangent line FD drawn through point F, β denotes the angle between the tangent line FD and the horizontal time axis, and FC represents the corresponding vertical voltage magnitude difference.
Selecting point E in Figure 2 and drawing a tangent line EC through point E, the sub-tangent BC can be obtained as shown in Equation (1).
Similarly, by drawing a tangent line FD through point F in Figure 2, the sub-tangent CD can be derived as shown in Equation (2).
Evidently, the sub-tangent BC is identical to the sub-tangent CD. This phenomenon indicates that the sub-tangent remains constant at different moments during the dynamic steady-state voltage drop process. This is a typical characteristic of a system possessing a constant virtual inertia time constant. Furthermore, it validates that the AC microgrid, under droop control, exhibits stable voltage support capability, and its virtual inertia characteristic does not change with time during the disturbance process.
3. Evaluation Formula for the System-Level Inertia Time Constant of Voltage Support in AC Microgrids
3.1. Reduced-Order Model of Voltage Support Capability for AC Microgrids
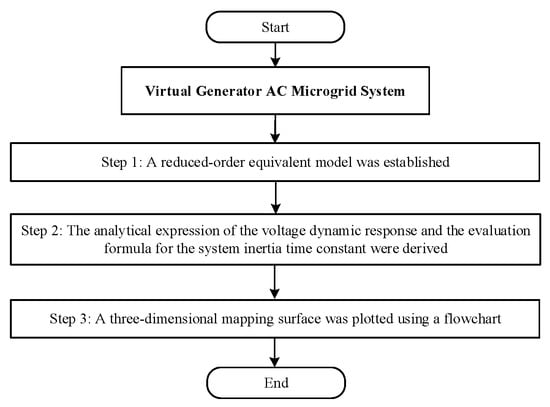
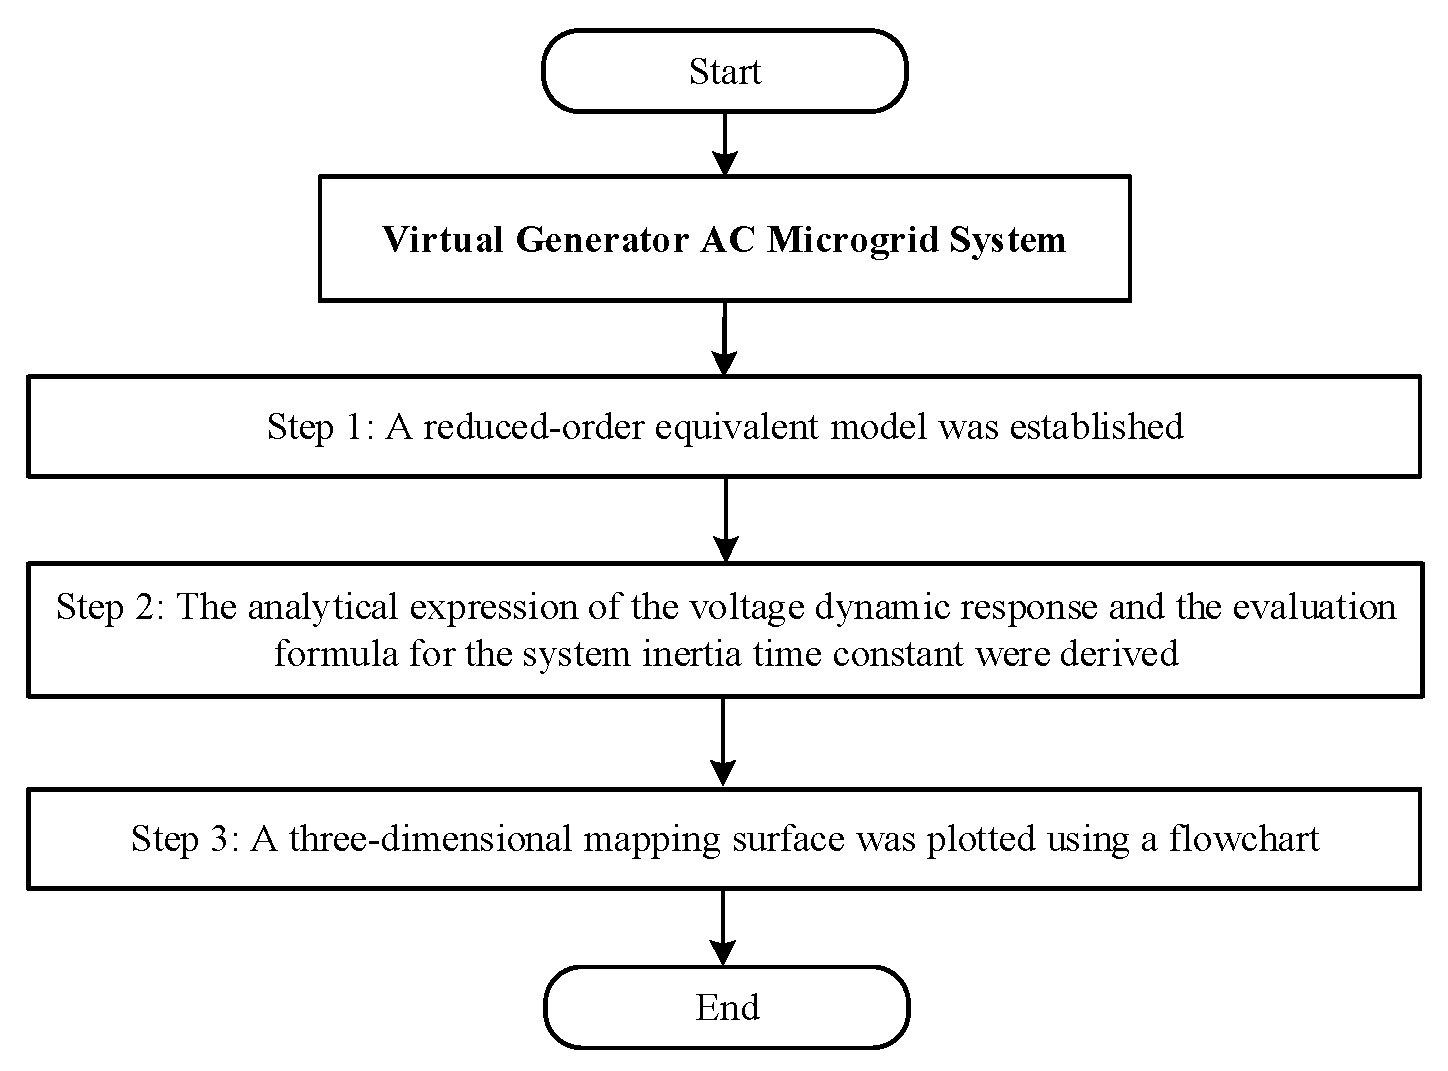
From the perspective of control bandwidth, the ratio of D to J is more suitable to serve as the evaluation basis for virtual inertia reflecting the voltage support capability of AC microgrids. Figure 3 clearly illustrates the specific methodology analysis process.
Figure 3.
Overall methodology analysis flowchart.
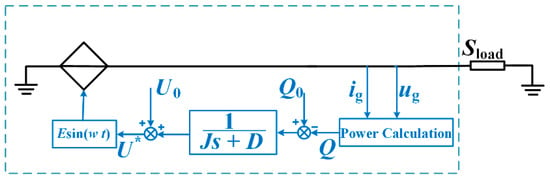
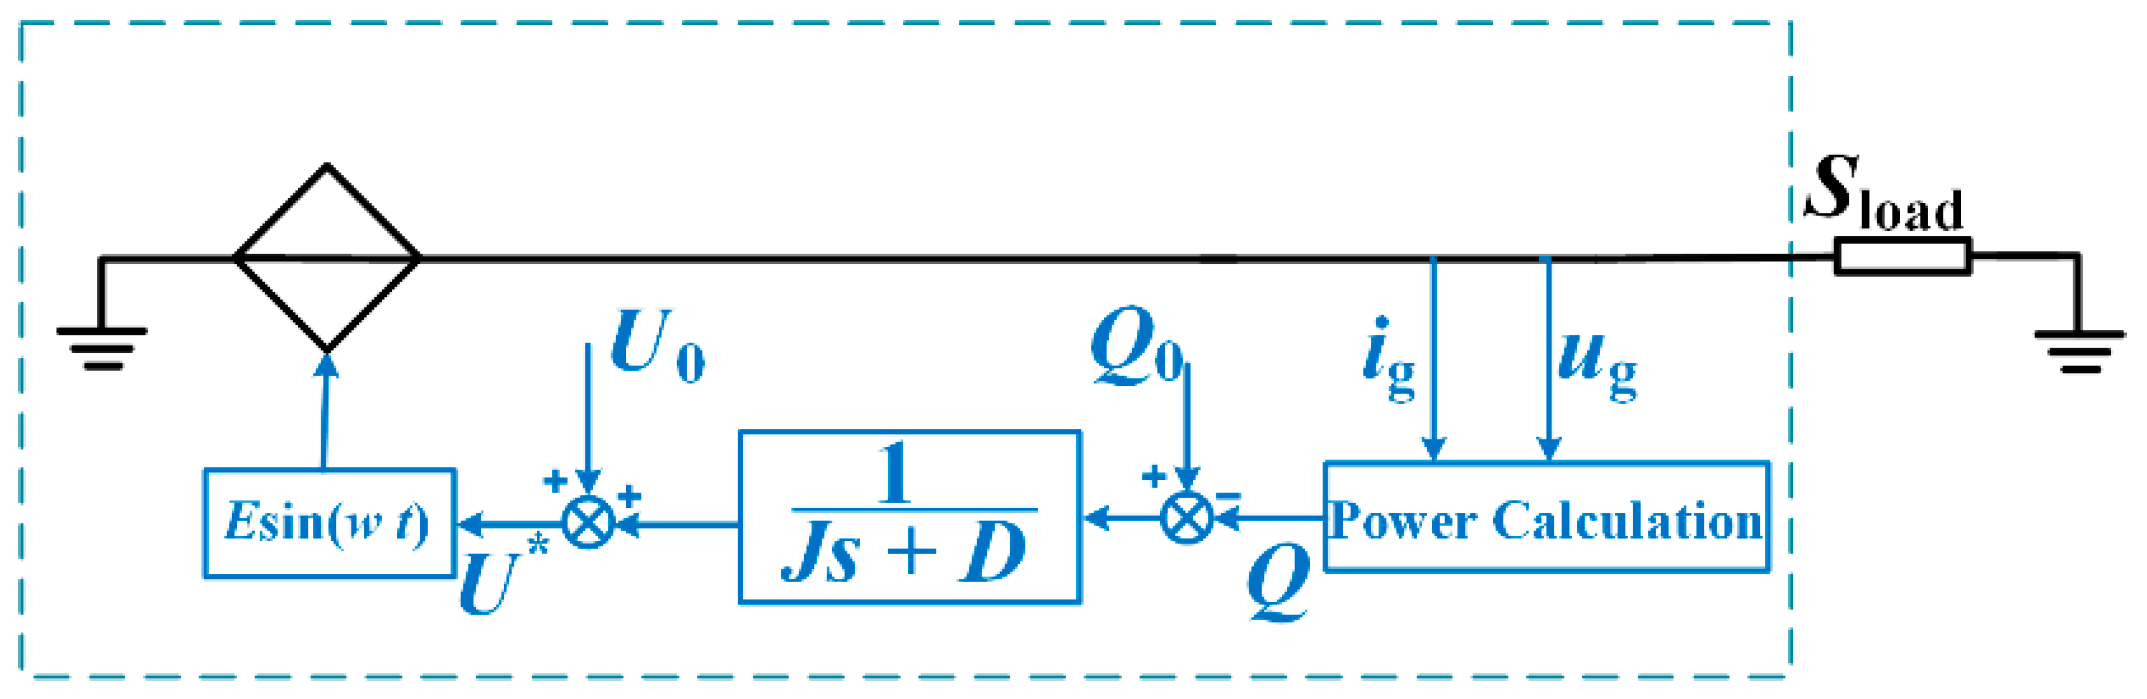
When the voltage control bandwidth is much larger than the cutoff angular frequency of the low-pass filter, the system virtual inertia related to the voltage support performance of the AC microgrid mainly depends on the virtual inertia control link consisting of rotational inertia and damping coefficient. Under this condition, the influence of the voltage control loop on virtual inertia can be neglected. Similarly, when the microgrid operates in islanded mode, the effects of the current control loop, filter resistance, filter inductance and other factors on system inertia can also be ignored. Grid-forming converters can be equivalent to controlled voltage sources, while grid-following converters correspond to controlled current sources. Accordingly, the structural diagram describing the voltage support capability of the AC microgrid shown in Figure 1 can be simplified into the reduced-order model presented in Figure 4.
Figure 4.
Model for voltage support capability of AC microgrids.
When the voltage control loop bandwidth is less than 10 times the cutoff angular frequency of the low-pass filter, the voltage control loop and the low-pass filter jointly dominate the frequency dynamic response, and the system exhibits a non-virtual-inertia phenomenon. When the voltage control loop bandwidth reaches more than 10 times the cutoff angular frequency of the low-pass filter, the response speed of the voltage controller is much faster than that of the low-pass filter, enabling the frequency ω to quickly track the frequency reference ω* generated by the low-pass filter. In summary, the applicable condition of the unified reduced-order model proposed in this paper is: the voltage control loop bandwidth should be no less than 10 times the cutoff angular frequency of the low-pass filter. If this condition is not satisfied, the coupling between the voltage control loop and the low-pass filter cannot be neglected, and the model proposed in this paper is no longer applicable; thus, the full dynamics of the voltage control loop must be retained.
According to the control structure shown in Figure 4, the transmission path of reactive power is as follows.
The actual reactive power Q is measured and then passes through a low-pass filter to obtain the filtered reactive power Qf:
The filtered reactive power is compared with the reactive power reference Q0, and the voltage correction ΔU is generated via the Q-U droop:
The voltage reference U* is obtained by subtracting the correction from the base voltage U0:
When the voltage inner-loop bandwidth is sufficiently high, the actual output voltage U(t) ≈ U*(t), thus yielding Equation (6). Applying the inverse Laplace transform to Equation (5) gives the time-domain expression
where * denotes the convolution operation. When the reactive power Q(t) undergoes a step change ΔQ, the above equation simplifies to
This equation is an equivalent form of Equation (7), which clearly demonstrates the entire process by which the reactive power disturbance ΔQ generates an exponential voltage response through the low-pass filter.
3.2. Analytical Expression for Voltage Dynamic Response Based on the Reduced-Order Model
Since the value of (1/D)Q0 is consistent with U(t0), and the value of (1/D)Q(t) is consistent with U(∞), Equation (6) can be transformed into the form of Equation (8). The analytical expression for the voltage dynamic response based on the reduced-order model is given by
In the equation, U(t) denotes the system voltage at time t; U(t0) represents the voltage at the initial moment of disturbance; U(∞) is the steady-state voltage value; and τ is the system-level inertia time constant. According to the definition of the inertia time constant provided in Section 2.2, the relational expression among rotational inertia J, damping coefficient D and inertia time constant τ for droop-controlled grid-forming converters of AC microgrids is expressed as Equation (9).
The unit of τ is seconds (s), and τ represents the time required for the capacitor voltage to decay to 0.368 of its initial value. It can be used to characterize the time needed for the virtual inertia of a conventional VSG to decline. By simultaneously solving Equations (8) and (9), the dynamic response expression for the system voltage U(t) is obtained as Equation (10).
The system voltage U(t) of the virtual inertia system for voltage support capability of the AC microgrid is jointly determined by the steady-state value U(∞), initial value U(t0), rotational inertia J and damping coefficient D. When the system is subjected to a step reactive power load disturbance, U(t) decays to the new post-disturbance steady state along an exponential trajectory, where the speed of this dynamic transient process is exclusively dictated by the system-level inertia time constant τ. Physically, τ quantifies the rate of voltage evolution during the transient interval and serves as the core metric characterizing the strength of virtual inertia underlying the voltage support capability of the AC microgrid.
Equation (10) consists of a steady-state AC voltage component Ust(t) and a transient AC voltage component Utr(t). Specifically, the expression for the steady-state AC voltage component Ust(t) is
Analysis shows that the steady-state AC voltage component Ust(t) corresponds to the steady-state solution of the equivalent virtual synchronous machine model, and its value is determined by the AC voltage reference Uref, the virtual resistance Re, and the steady-state load current Ig(∞).
The expression for the transient AC voltage component Utr(t) is
Herein, ΔU represents the steady-state voltage drop. Obviously, τ satisfies the expression given in Equation (9). Combined with Equation (12), it can be seen that the transient voltage component is jointly determined by rotational inertia J and damping coefficient D. This AC transient voltage component decays exponentially over time, and its decay rate is governed by the inertia time constant. Analysis demonstrates that the inertia time constant τ acts as the core indicator for quantifying the magnitude of system virtual inertia: a larger inertia time constant τ corresponds to a longer time for the transient component to decay to zero, and the system exhibits a more prolonged inertial process; on the contrary, the inertial process becomes shorter. According to circuit theory, the time required for the transient component to decay to zero is approximately 5τ.
4. Virtual Inertia Assessment of Voltage Support Capability in AC Microgrids Based on Simulation Models
Based on the reduced-order model established in Section 3, the system-level inertia time constant τ can be expressed as a function of parameters such as output voltage variation, rotational inertia and damping coefficient. To intuitively reveal the influence laws of various factors on the system-level inertia time constant, this section adopts the three-dimensional mapping surface method to conduct multi-dimensional graphical representation of the above relationships and carries out analysis from the following three aspects:
- (1)
- Analysis of the impact of reactive power load disturbance borne by grid-following converters on the system-level inertia time constant;
- (2)
- Analysis of the influence of reactive power load on the steady-state voltage drop in AC microgrids;
- (3)
- Analysis of the coupling relationship among reactive power load, droop control parameters and steady-state voltage support capability.
4.1. Impact of Load Reactive Power on Grid-Following Converters Regarding the System-Level Inertia Time Constant
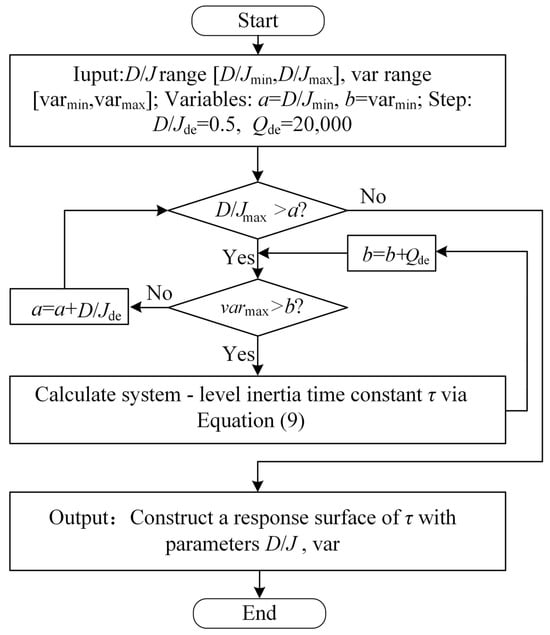
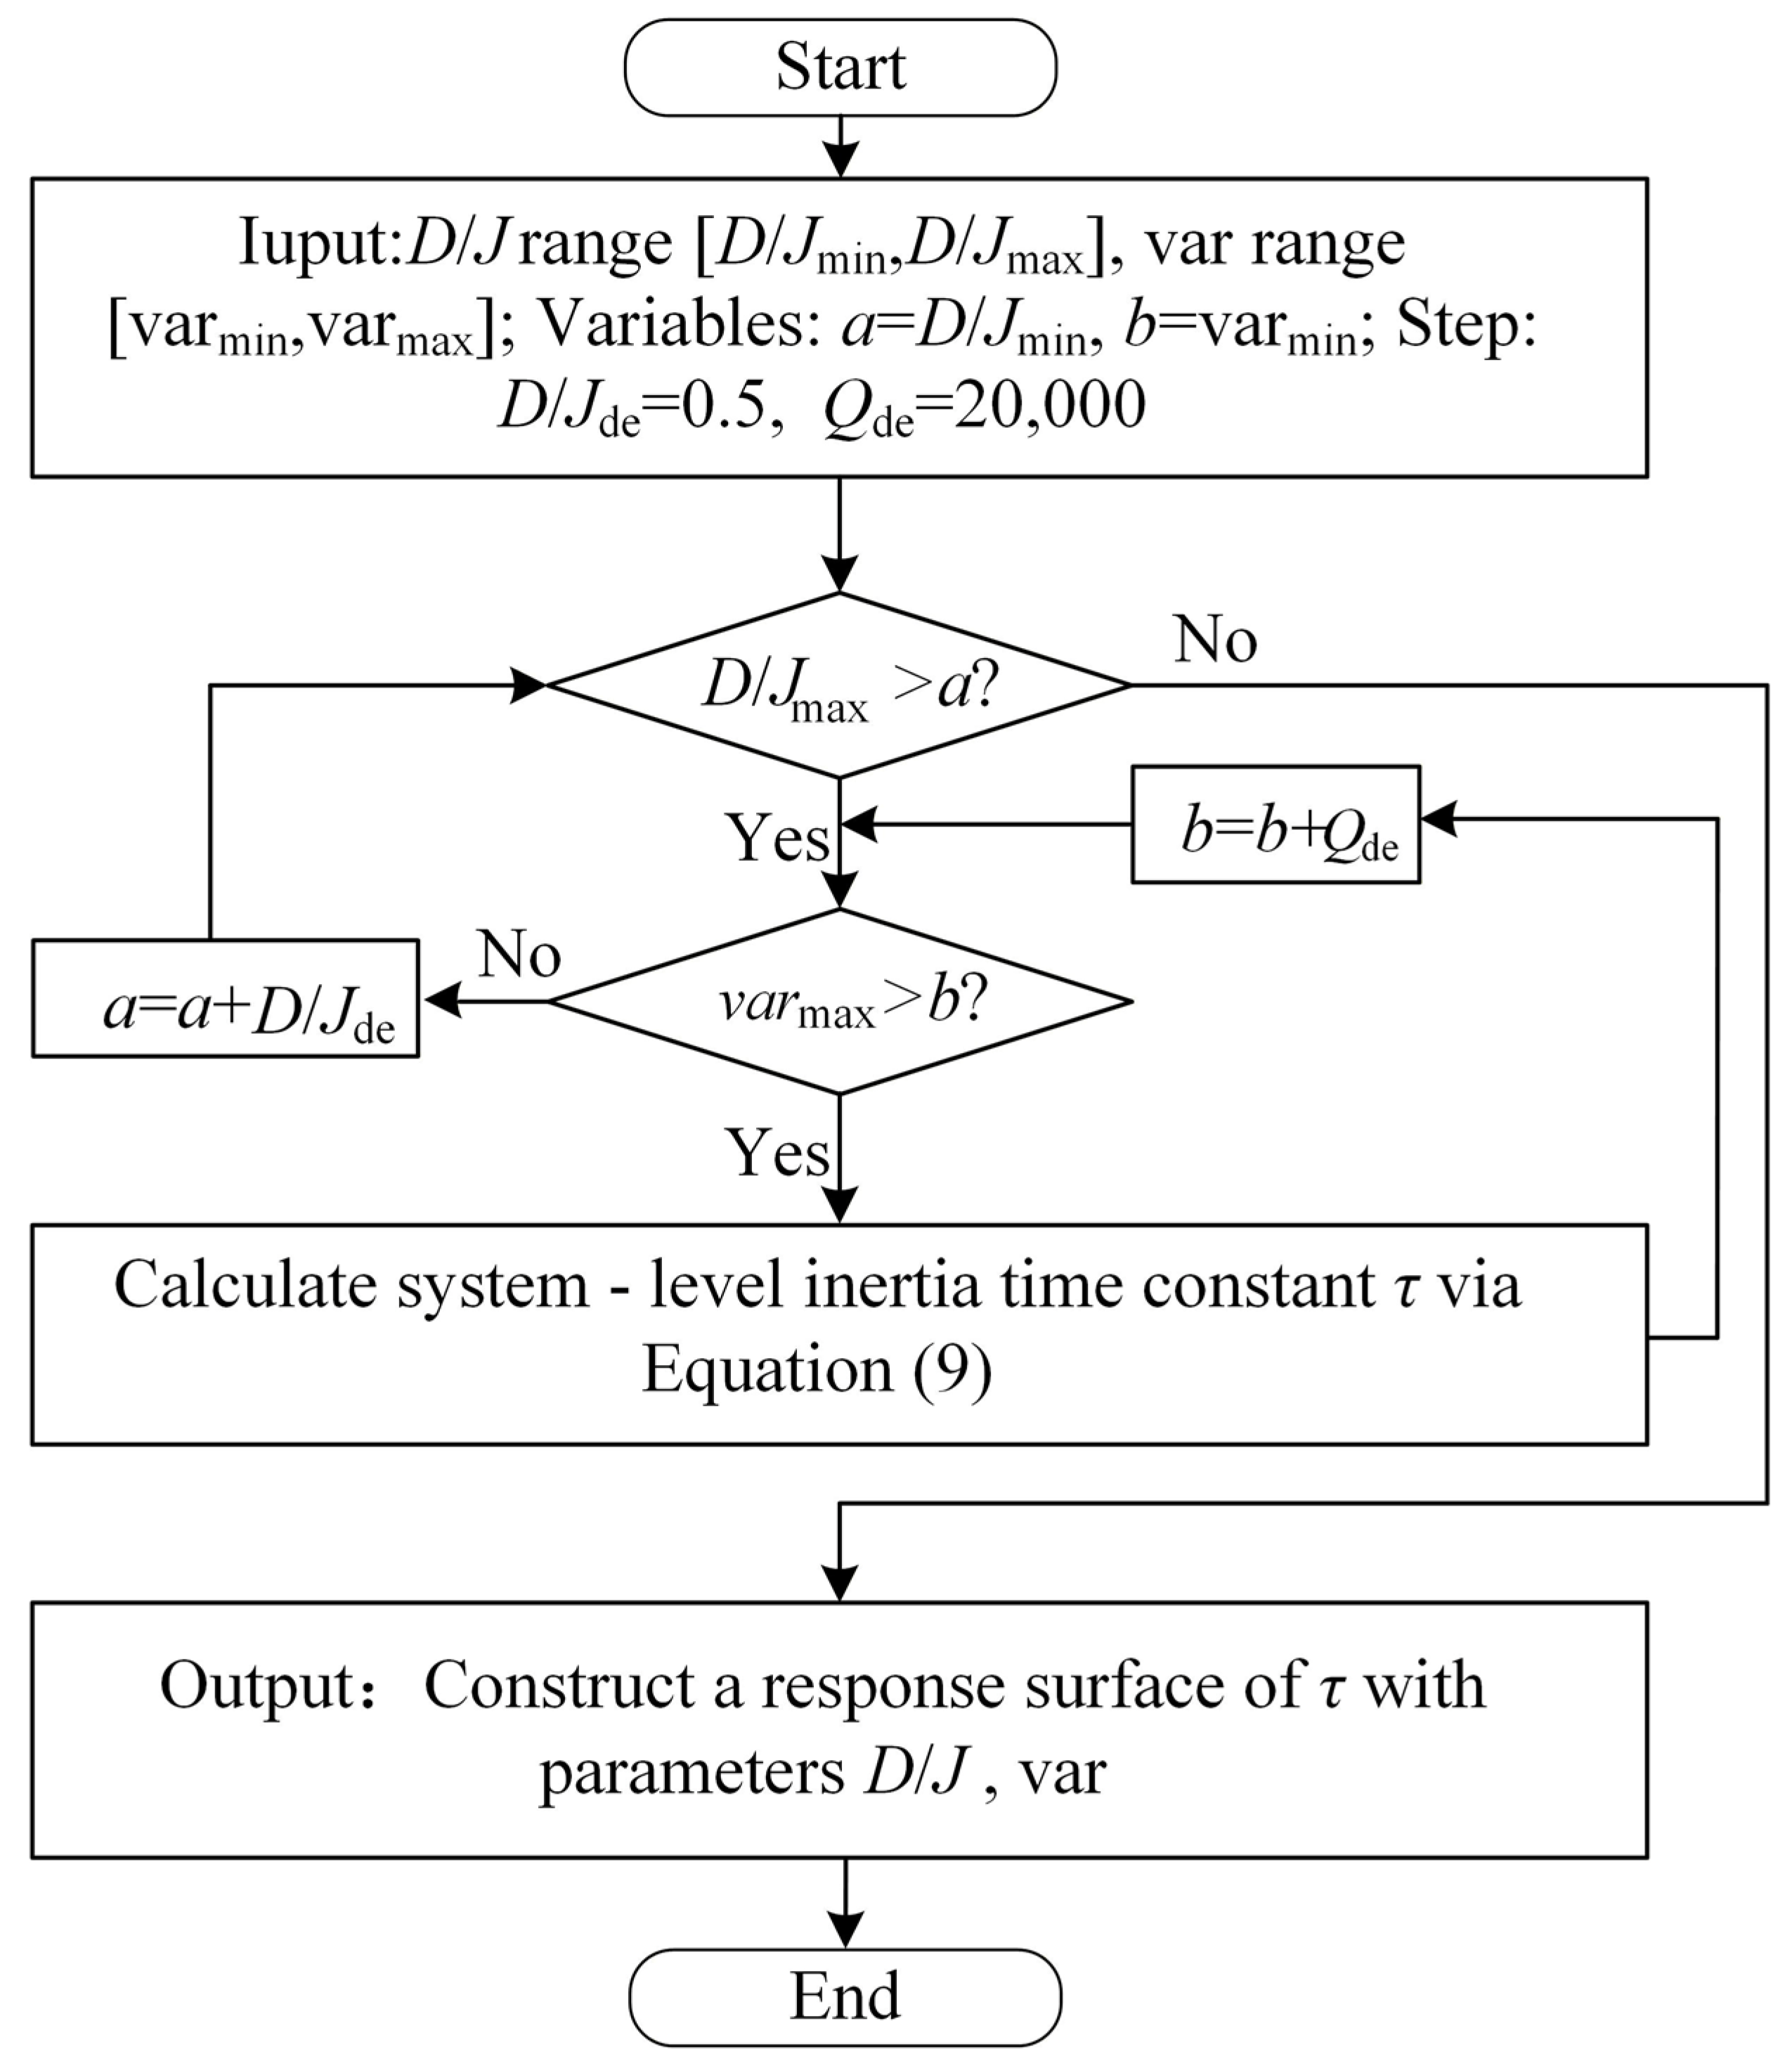
To reveal the influence law of the reactive power load disturbance borne by grid-following converters on the system-level inertia time constant, a response surface of system-level inertia time constant based on the reactive power load borne by grid-following converters is constructed, with the reactive power load Q borne by grid-following converters, the ratio of damping coefficient D to rotational inertia J, and the system-level inertia time constant τ as the parameter space, respectively. The detailed procedure is illustrated in Figure 5.
Figure 5.
Construction flowchart of system-level inertia time constant response surface based on grid-following converters under load reactive power disturbances.
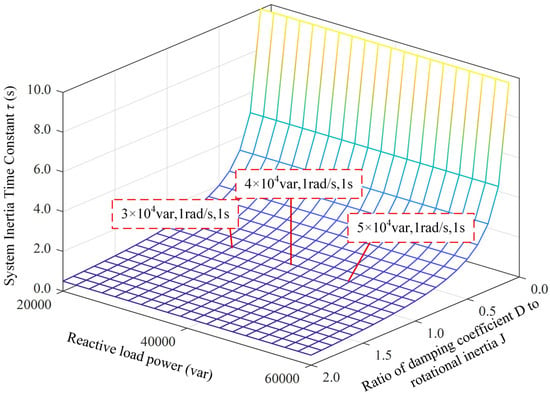
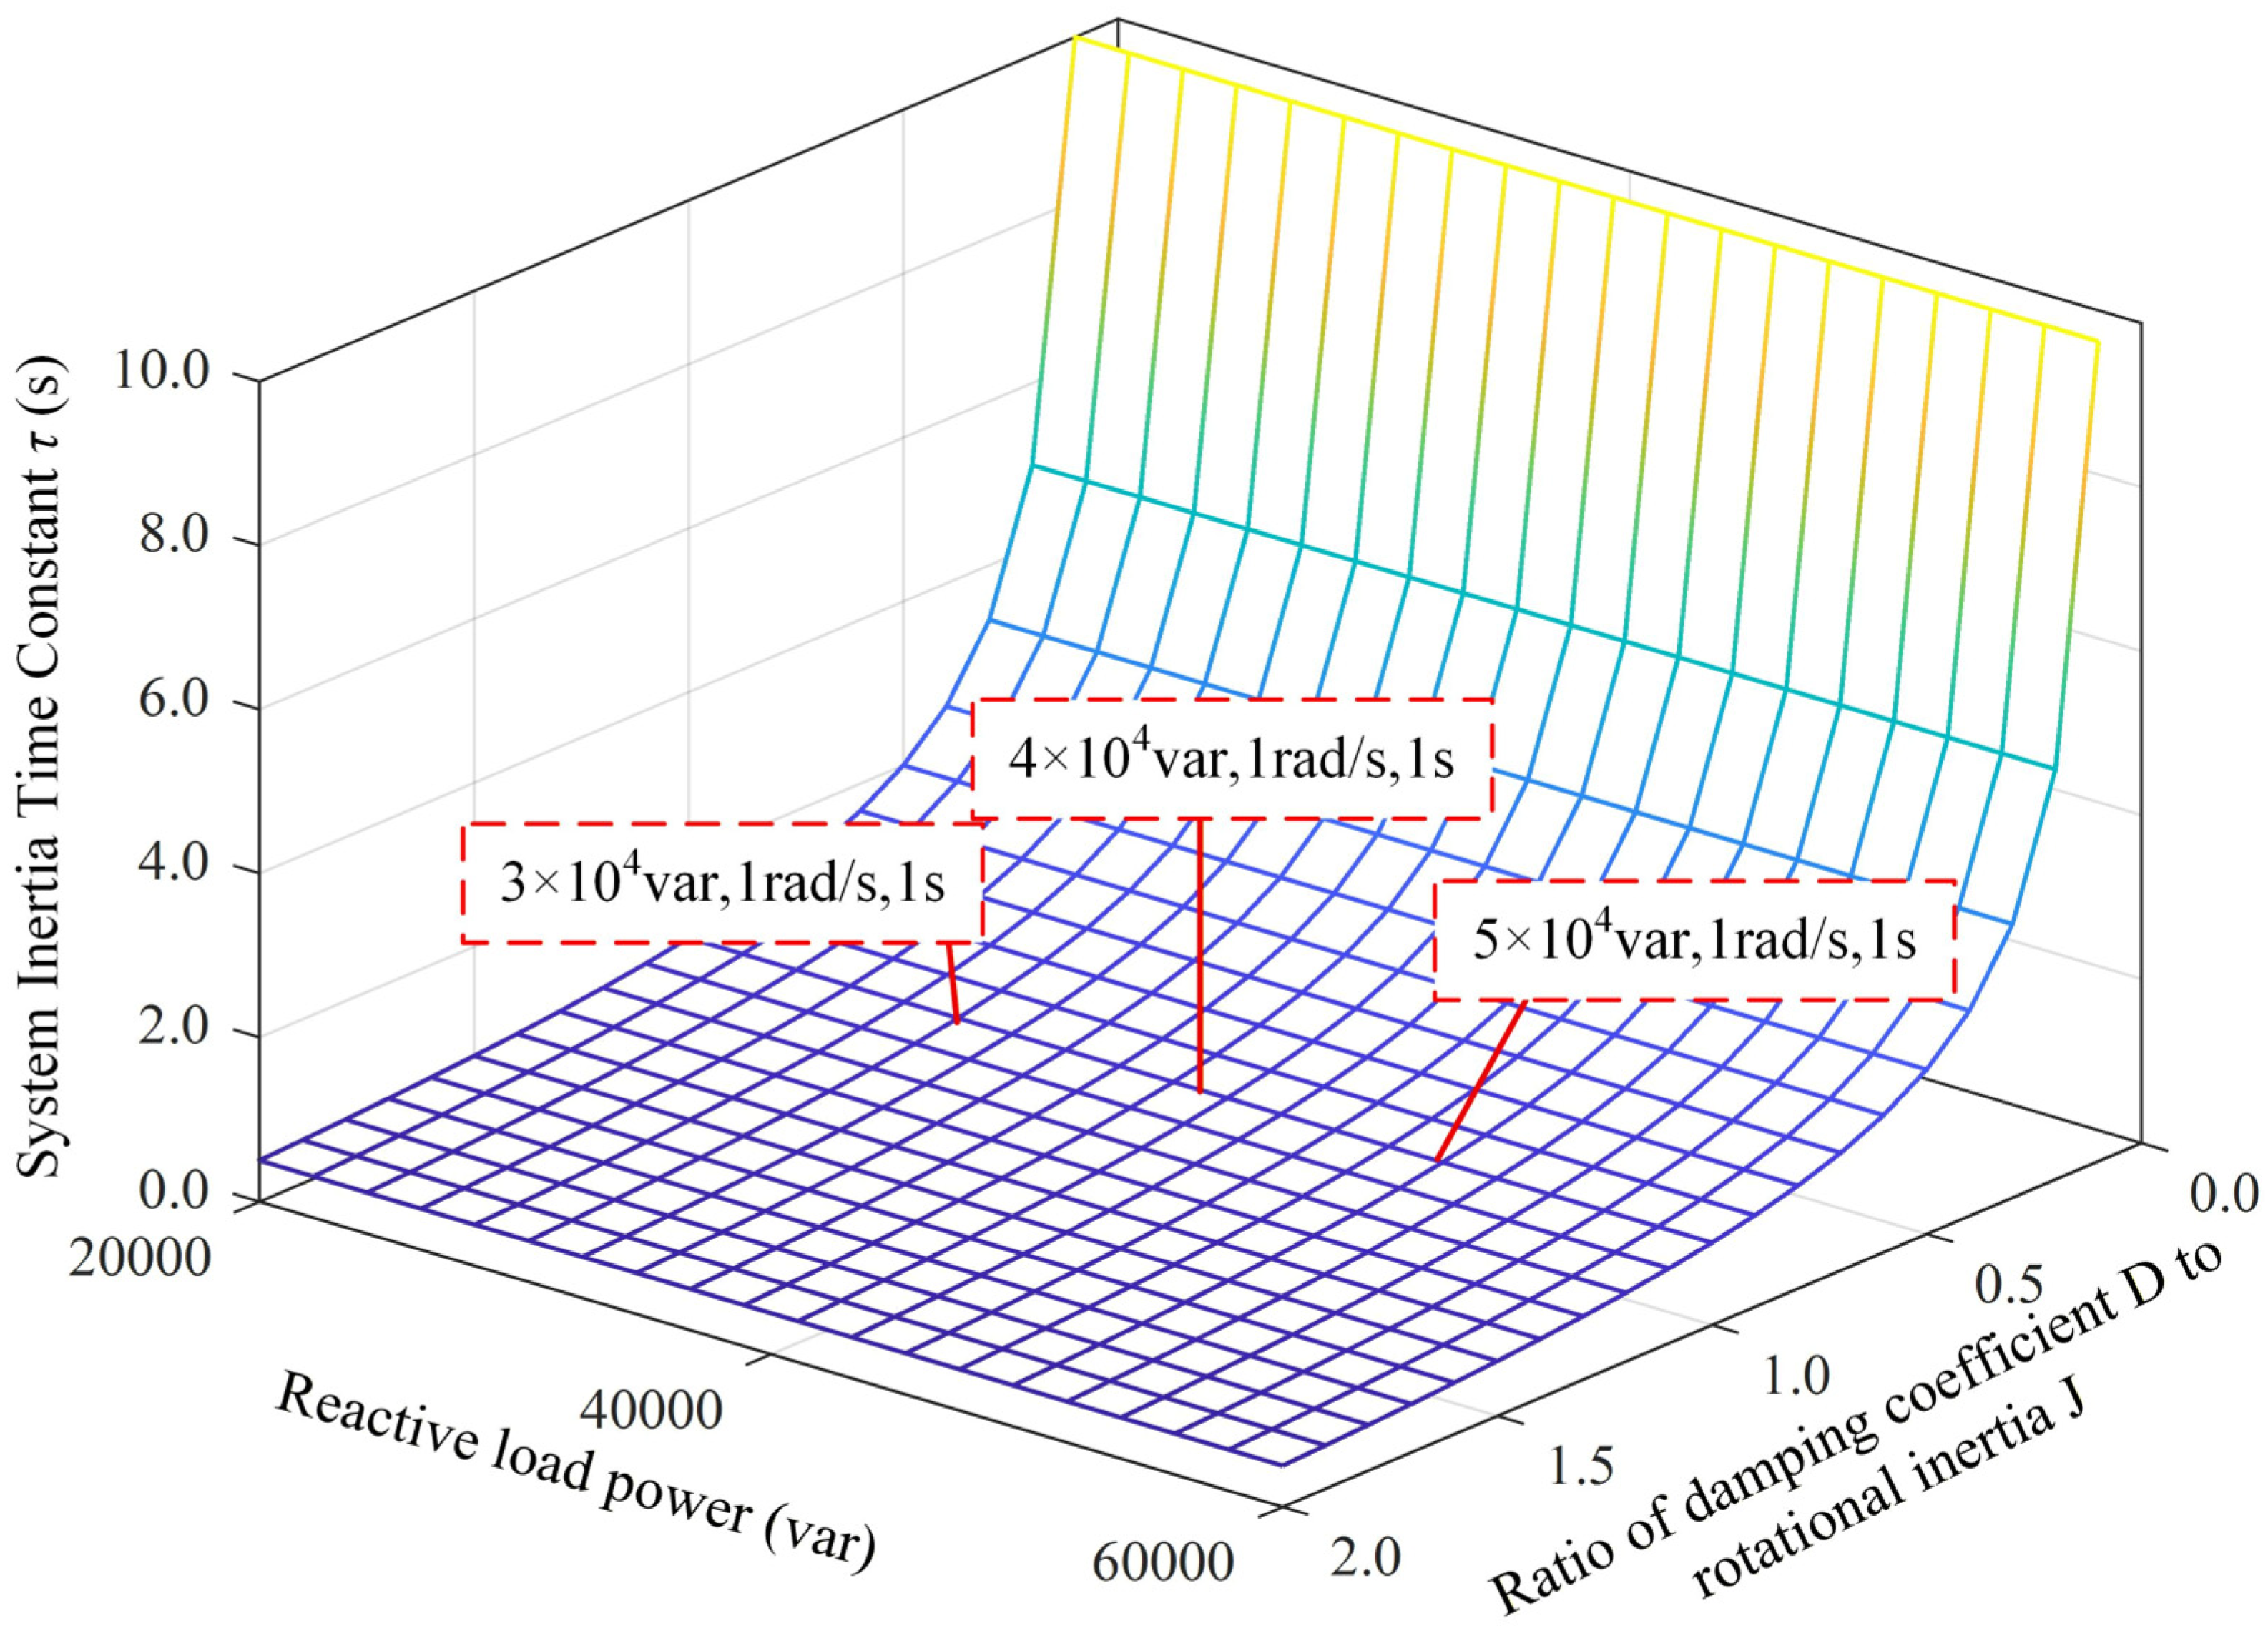
When the damping coefficient and rotational inertia of the grid-forming converter are 2000 and 2000 respectively, the system-level inertia time constant τ = 1 s can be derived from Equation (9). The applied reactive power load disturbances are set to 30 kvar, 40 kvar and 50 kvar, respectively.
Based on the parameter settings mentioned above and following the flowchart depicted in Figure 5, the response surface of the system-level inertia time constant—subjected to load reactive power on grid-following converters—is obtained, as illustrated in Figure 6. As can be observed from Figure 6, the system-level inertia time constant remains constant at 1 s. Consequently, it is concluded from the above analysis that the reactive power load borne by grid-following converters does not affect the system-level inertia time constant.
Figure 6.
Response surface of the system-level inertia time constant for grid-following converter systems.
4.2. Analysis of the Impact of VSG Intrinsic Parameters on System-Level Inertia Time Constant
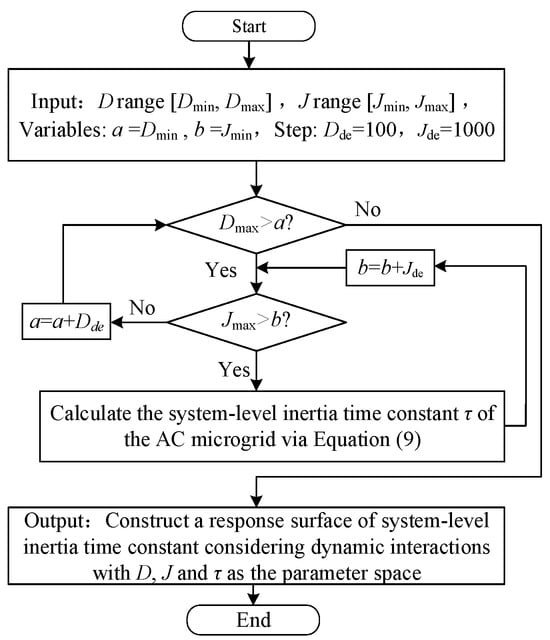
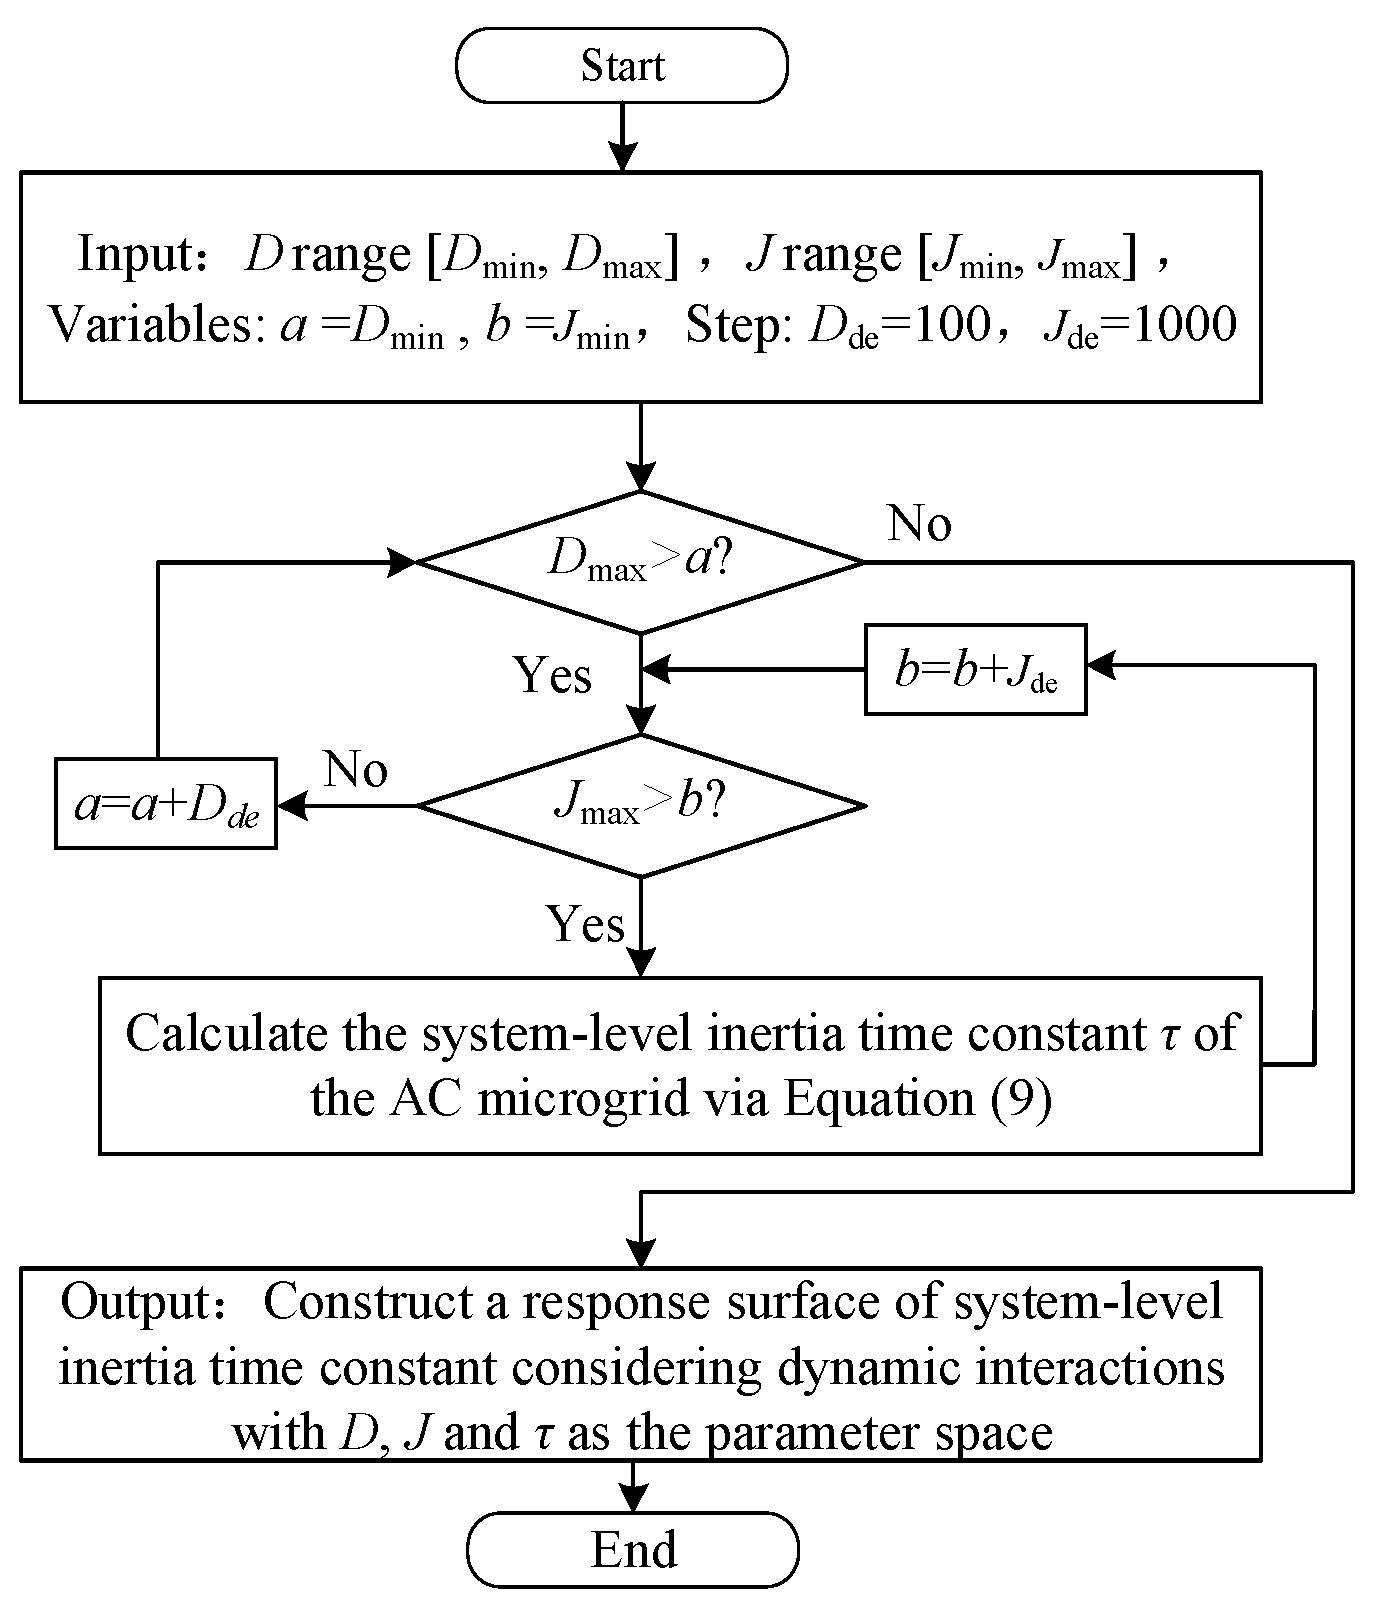
From Equations (8) and (11), it can be derived that the inertia time constant τ equals the ratio of rotational inertia J to damping coefficient D, and τ corresponds directly to this ratio. Therefore, the VSG intrinsic parameters indirectly modify the system’s virtual inertia through equivalent relationships. To intuitively characterize the influence of VSG-controlled grid-forming converters on the system-level inertia time constant, a system-level inertia time constant response surface accounting for dynamic interactions is constructed using the damping coefficient D, rotational inertia J, and system-level inertia time constant τ as the parameter space, with the detailed procedure illustrated in Figure 7.
Figure 7.
Flowchart for construction based on VSG Inertia time constant and control parameters.
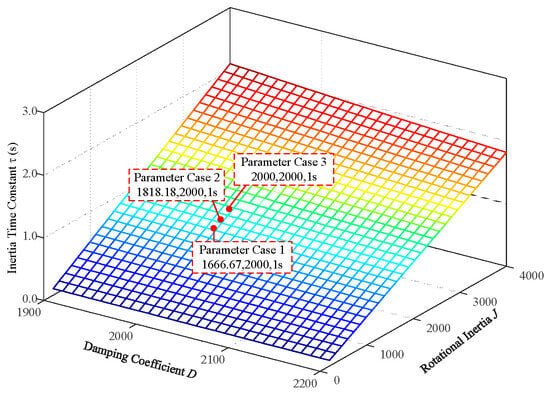
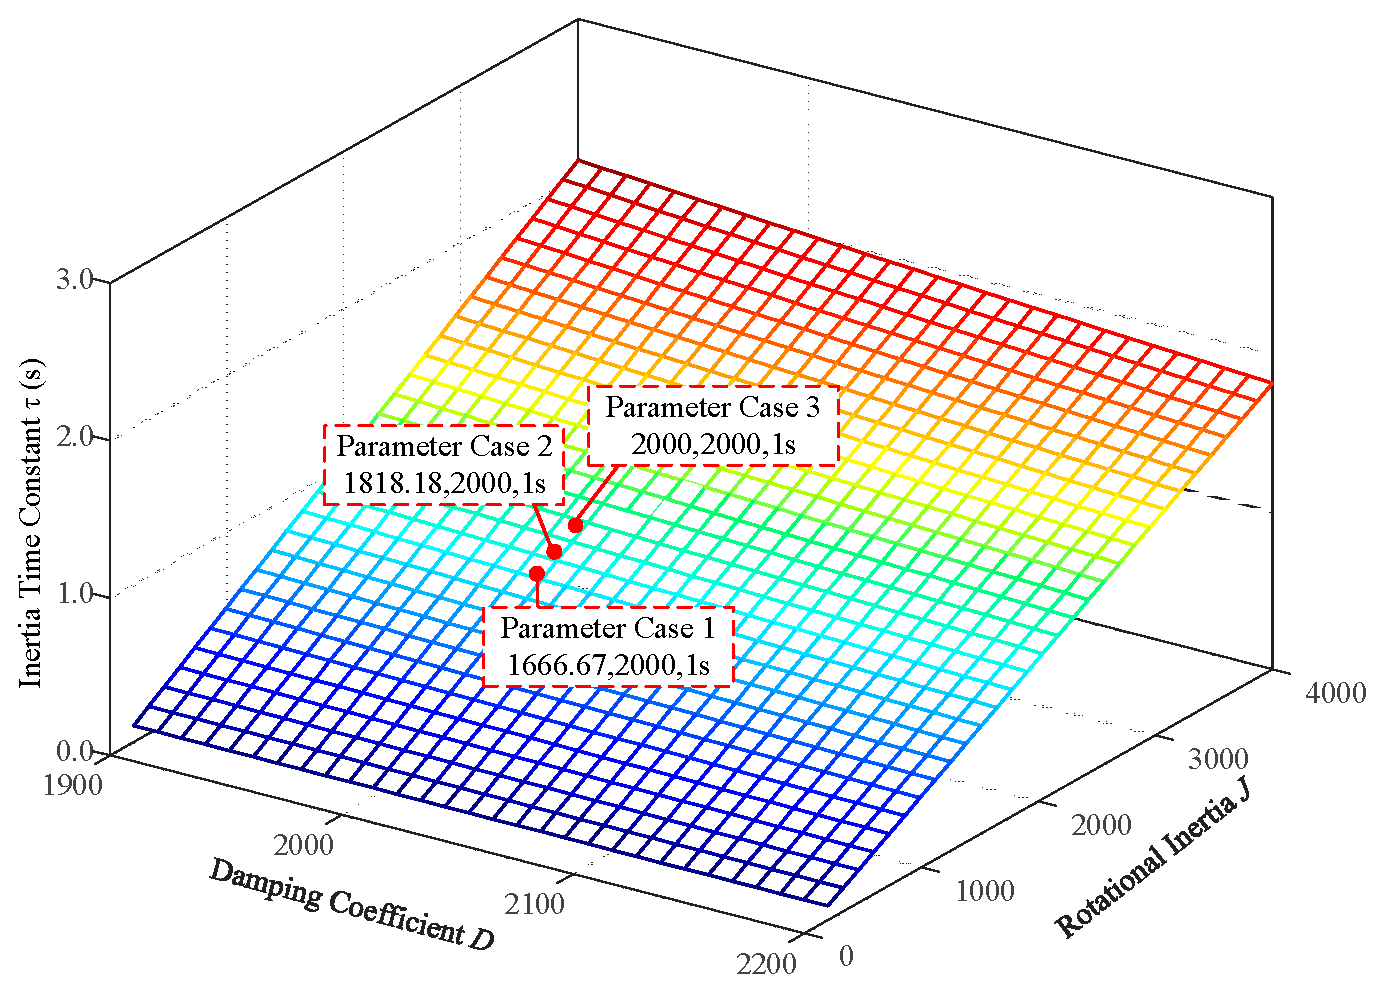
For the VSG grid-forming converter, the range of the system-level inertia time constant τ is set to [0, 10] s, the range of rotational inertia J is set to [0, 4000], and the damping coefficient D is set to the range [1900, 2100]. Based on the above parameter settings and following the flowchart shown in Figure 7, the system-level inertia time constant response surface is obtained, as presented in Figure 8.
Figure 8.
Response surface of control parameters and system-level inertia time constant for grid-forming converters.
It can be observed from Figure 8 that the damping coefficient D is fixed at 2000. When J1 = 1666.67, the corresponding system-level inertia time constant equals τ = 0.833 s, which is set as Parameter Case 1. When J2 = 1818.18, the corresponding system-level inertia time constant equals τ = 0.909 s, which is set as Parameter Case 2. When J3 = 2000, the corresponding system-level inertia time constant equals τ = 1 s, which is set as Parameter Case 3.
4.3. Analysis of Steady-State Voltage Drop Characteristics with VSG Control Parameters
To further characterize the influence laws of VSG control parameters on steady-state voltage drop characteristics, this section analyses the quantitative correlation among damping coefficient D, rotational inertia J and the system steady-state voltage drop ΔU. Based on the VSG model, the damping coefficient D directly determines the damping strength of reactive power-voltage regulation, while rotational inertia J characterizes the inertia level of the system voltage dynamic process. Both parameters jointly affect the system reactive power regulation process and steady-state voltage deviation.
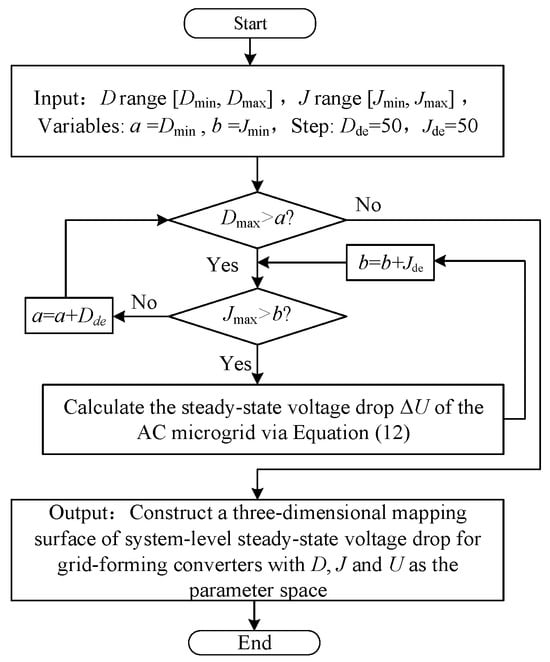
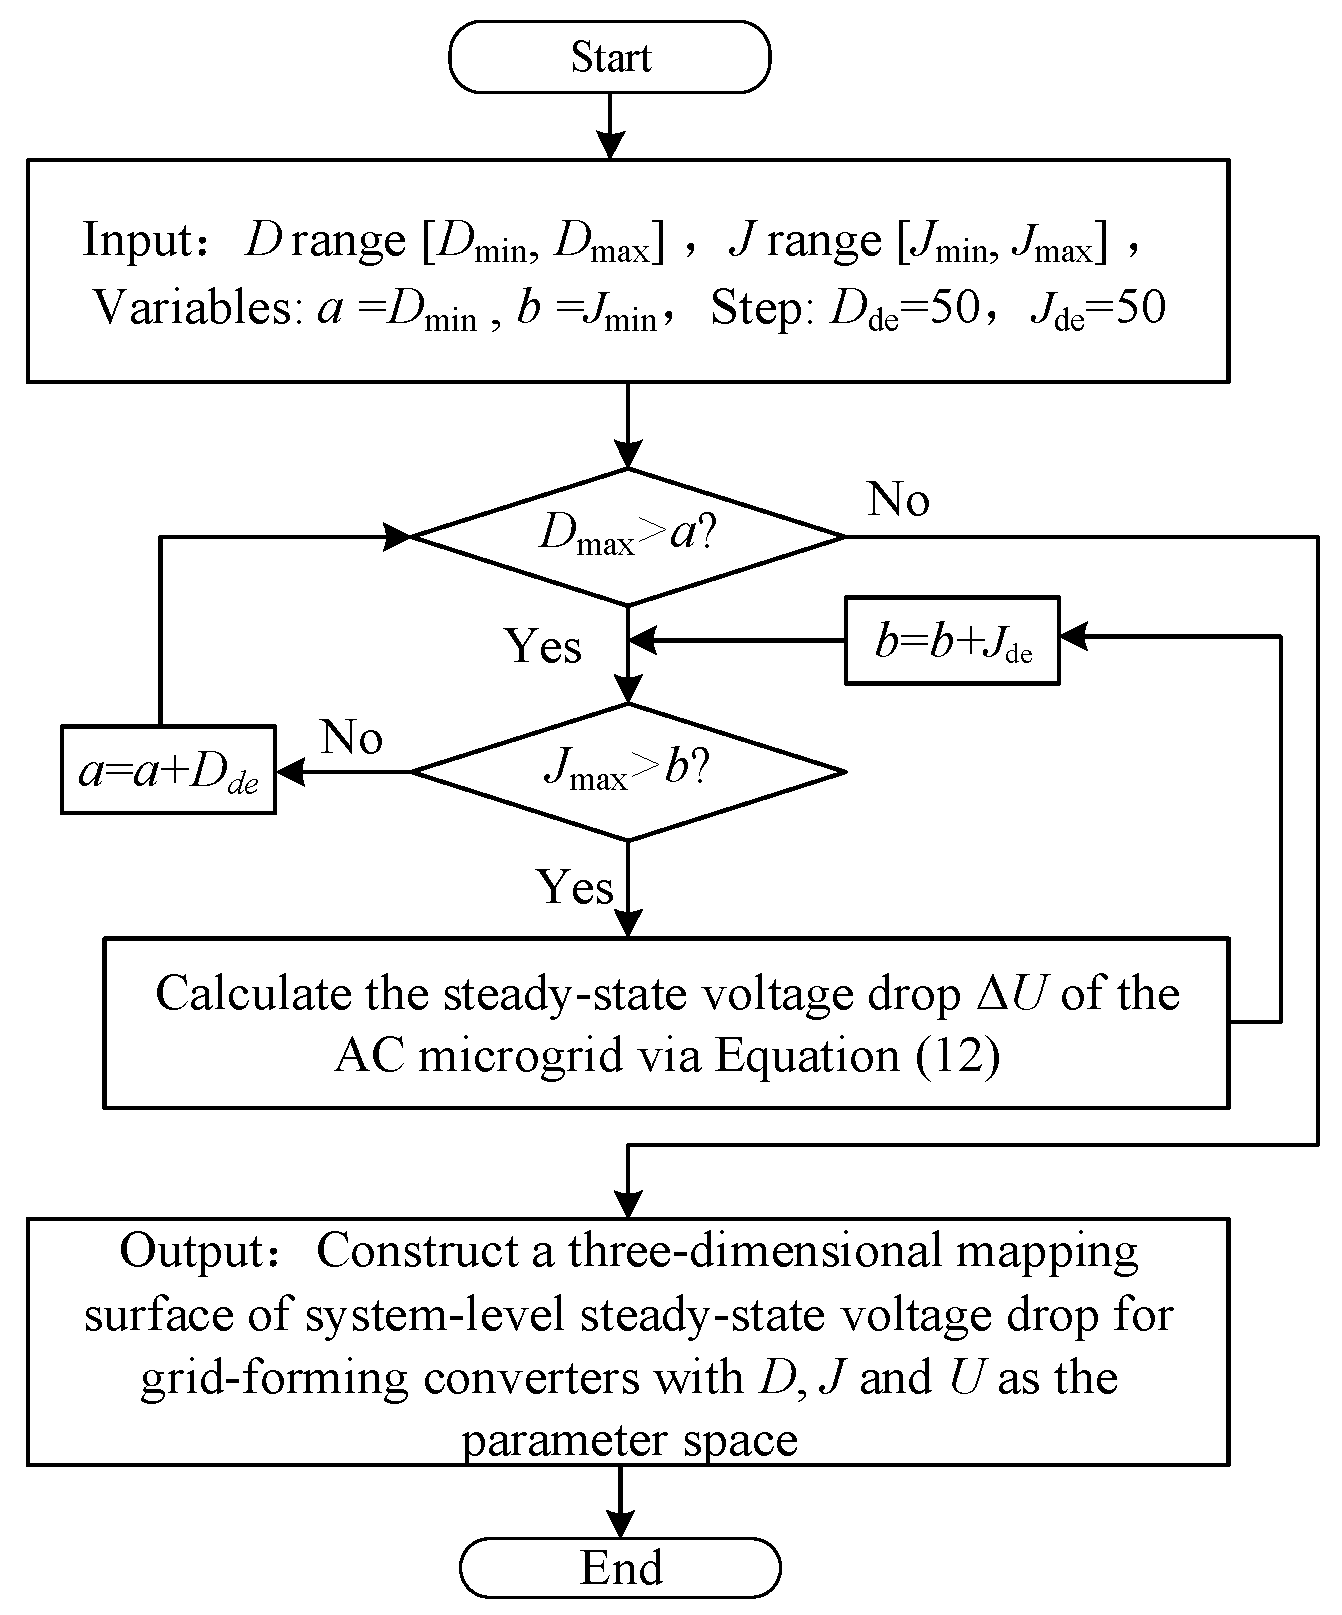
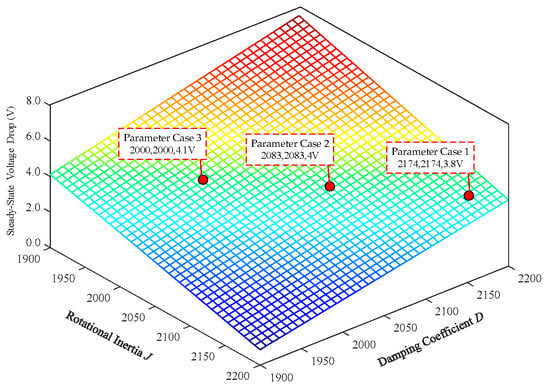
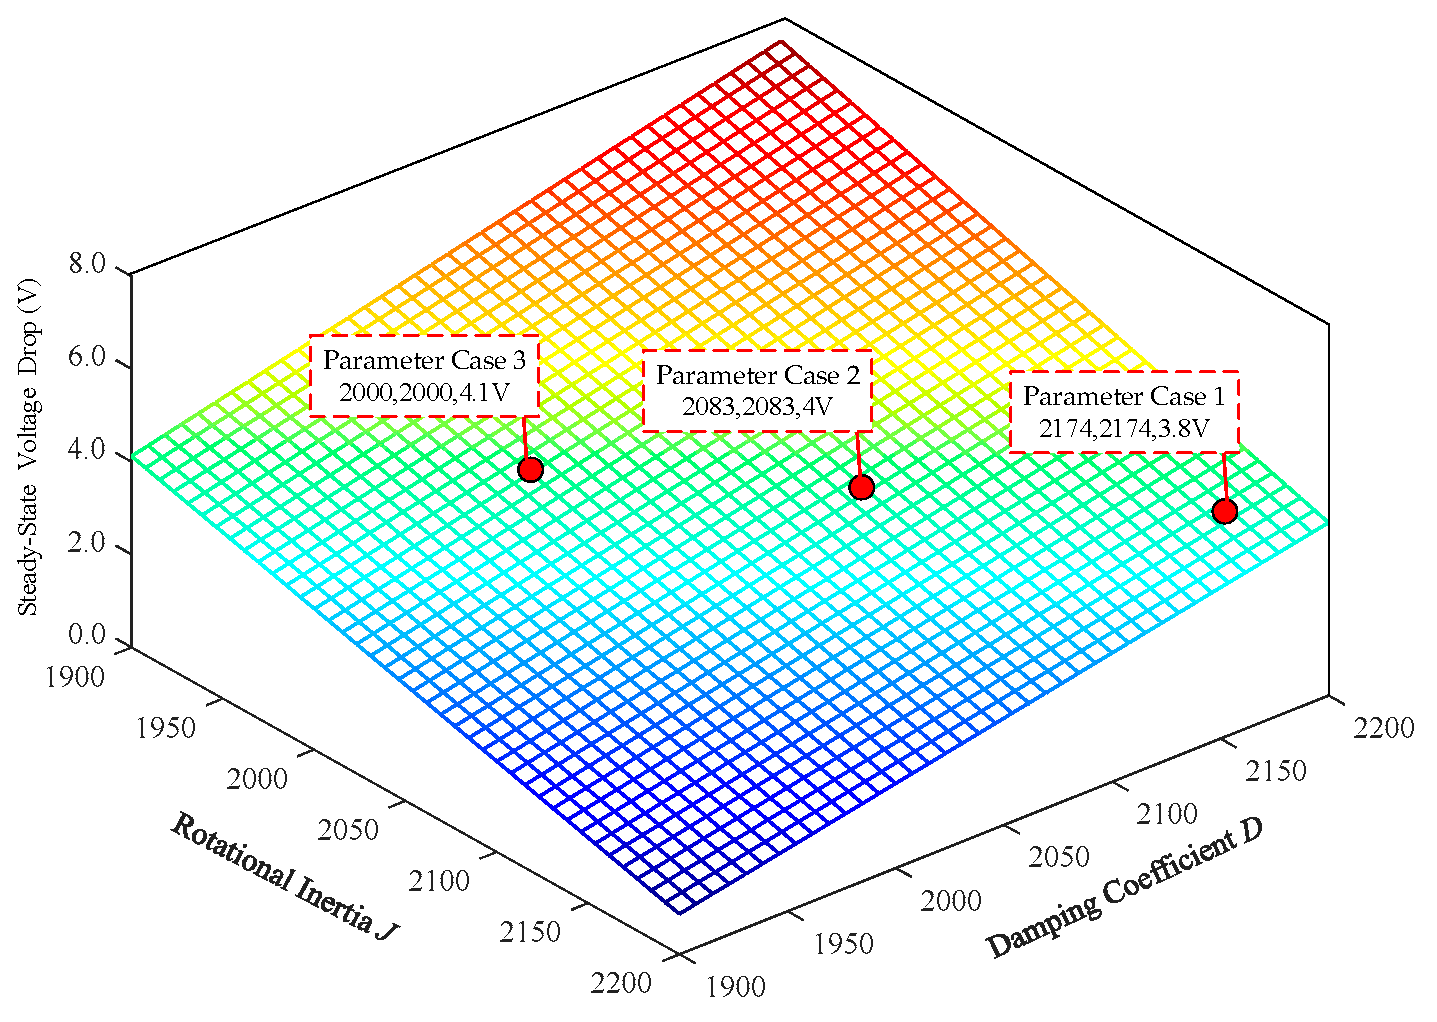
Within the Q-U droop control framework, the damping coefficient D and rotational inertia J mainly dominate the voltage dynamic regulation process, and both exert an indirect effect on the steady-state voltage through parameter coupling. The range of steady-state voltage drop is set to [0, 8] V, the range of rotational inertia J is set to [1900, 2200], and the range of damping coefficient D is set to [1900, 2200]. A three-dimensional mapping surface is constructed following the procedure shown in Figure 9, and the simulation results are presented in Figure 10.
Figure 9.
Flowchart for constructing three-dimensional mapping surface of steady-state voltage drop for VSG grid-forming converters.
Figure 10.
Three-dimensional mapping surface of system-level steady-state voltage drop based on grid-forming converters.
The system-level inertia time constant τ is fixed at 1 s throughout the simulation, and three sets of damping coefficients D1 = 2174, D2 = 2083 and D3 = 2000 are selected for verification. As can be observed from Figure 10, when D1 = 2174 and J1 = 2174, the corresponding steady-state voltage drop is 3.8 V, which is defined as Parameter Case 1; when D2 = 2083 and J2 = 2083, the corresponding steady-state voltage drop is 4 V, which is defined as Parameter Case 2; when D3 = 2000 and J3 = 2000, the corresponding steady-state voltage drop is 4.1 V, which is defined as Parameter Case 3.
5. Experimental Verification
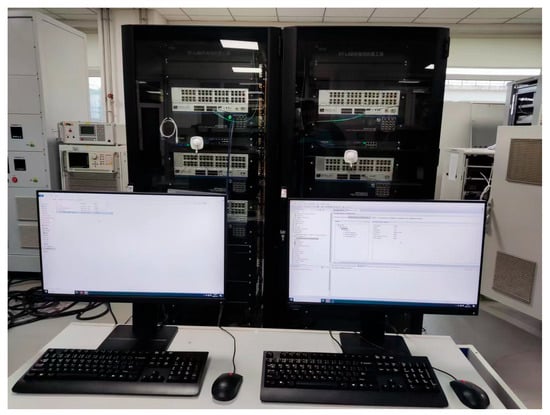
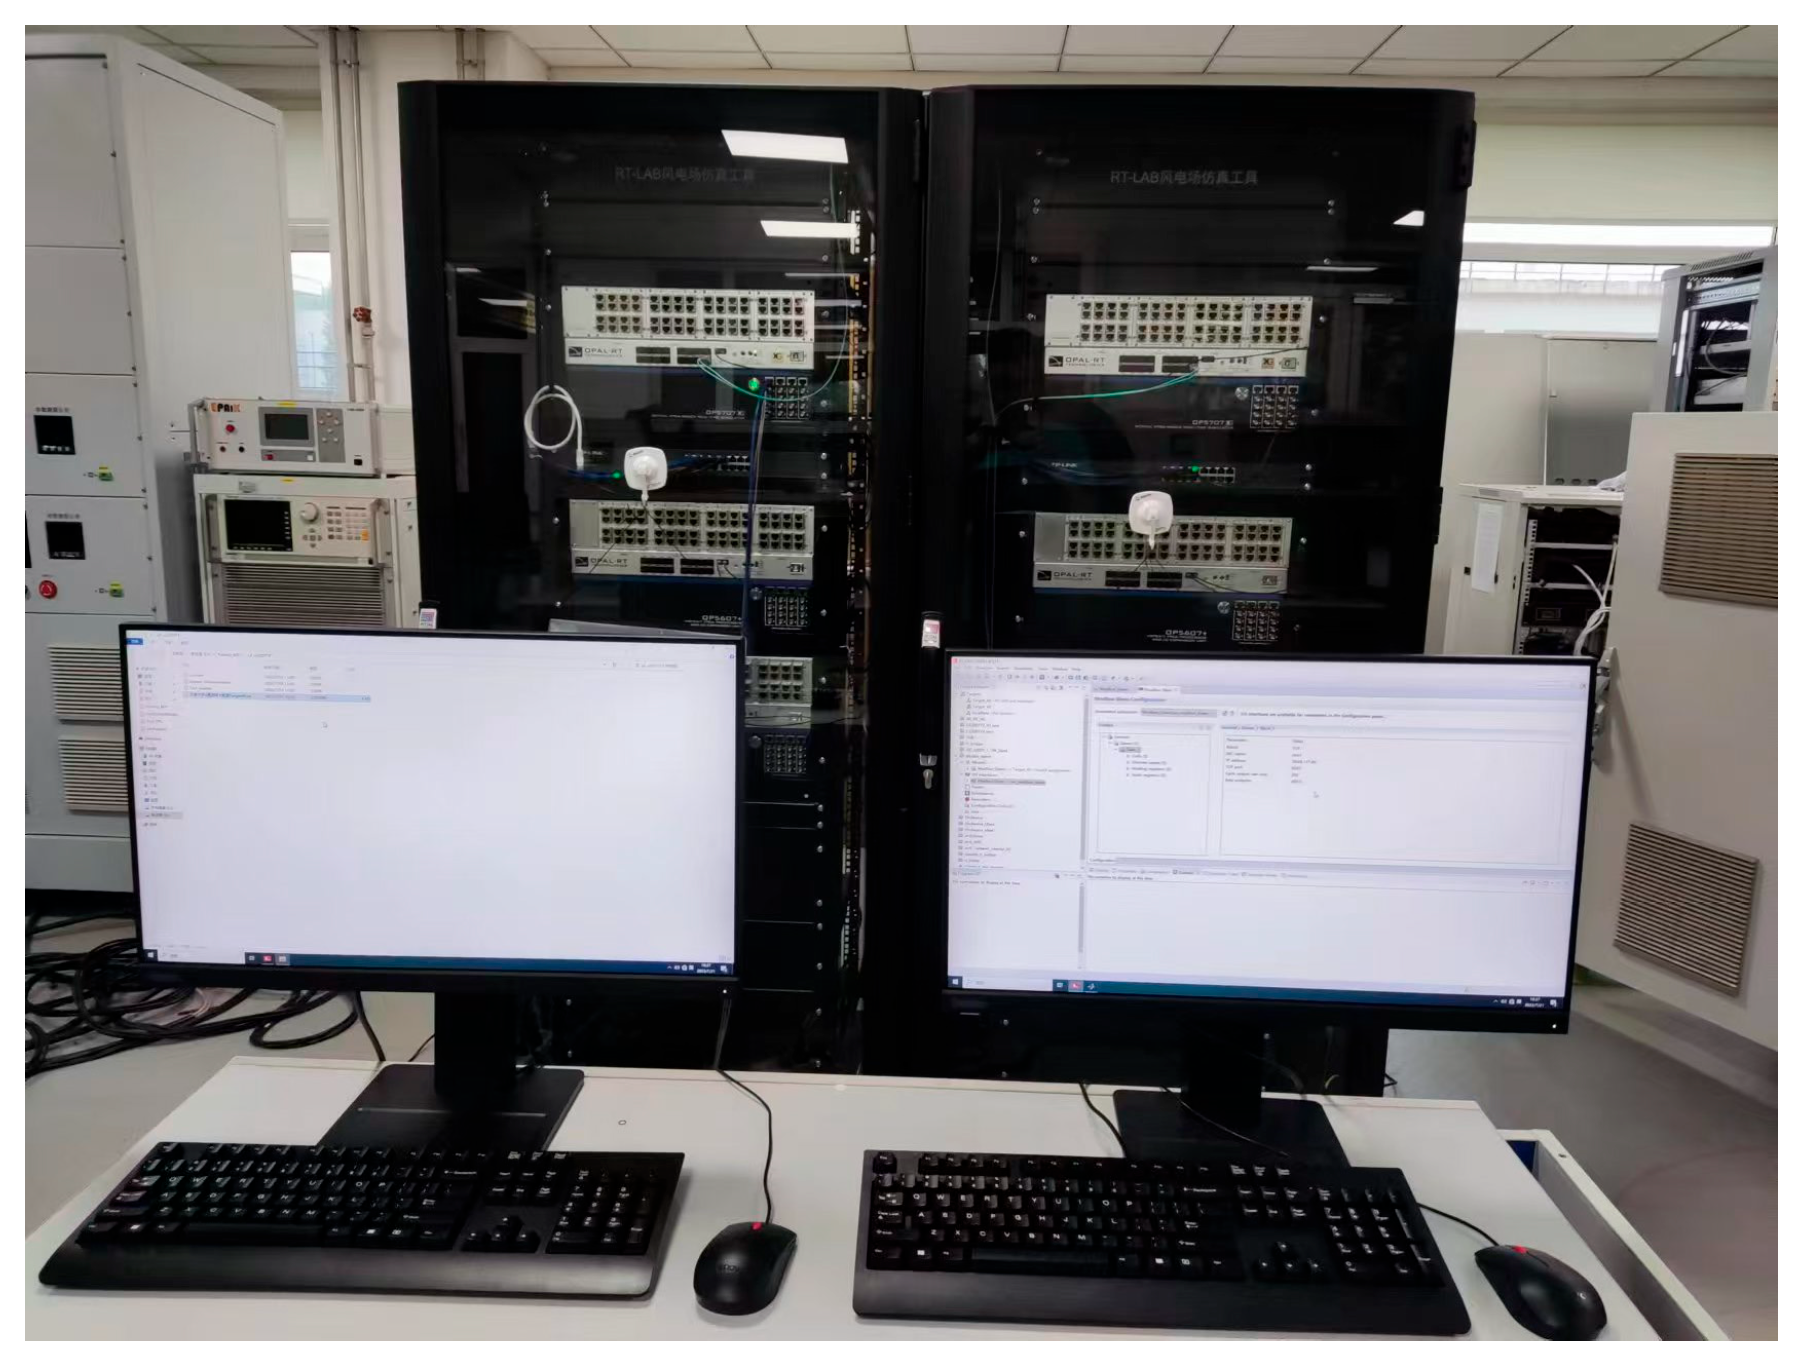
To verify the accuracy of the aforementioned theoretical analysis, a reduced-order model of the AC microgrid was developed on the RT-LAB hardware-in-the-loop platform comprising two OP5707XG simulators and four OP5607+ expansion units (OPAL-RT Technologies Inc., Montréal, QC, Canada; supplied by Shanghai KeLiang Information Technology Co., Ltd., Shanghai, China), as shown in Figure 11.
Figure 11.
RT-Lab hardware-in-the-loop experimental platform.
5.1. Experimental Verification for Scenarios with Different Rotational Inertia Control Bandwidths
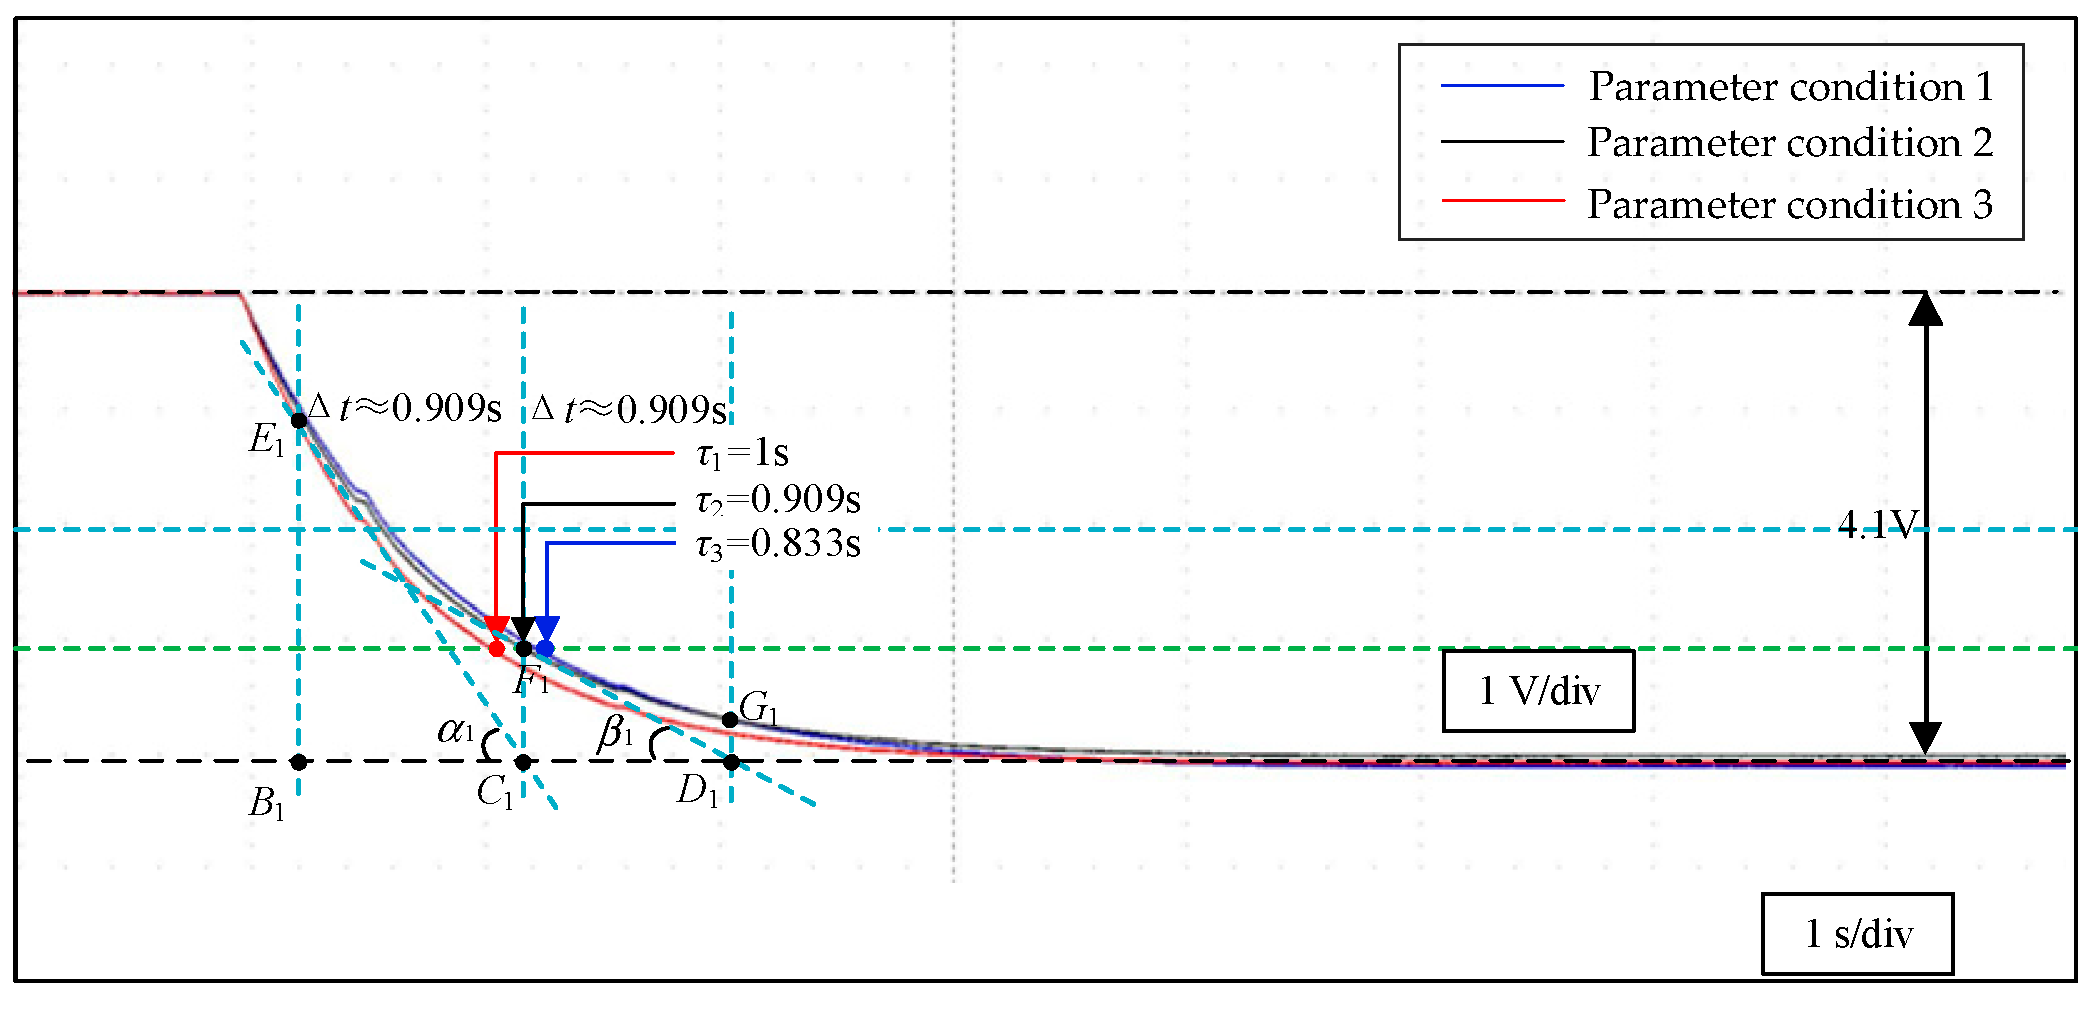
At t = 10 s, the reactive power load disturbance steps from 20 kvar to 40 kvar, and the experimental AC voltage waveforms are displayed in Figure 12. In three disturbance cases with different rotational inertia J, the waveforms of voltage support capability obtained from the reduced-order model of the AC microgrid achieve favourable consistency, which verifies the accuracy of the reduced-order model proposed in this paper.
Figure 12.
Experimental results under different rotational inertia disturbance conditions.
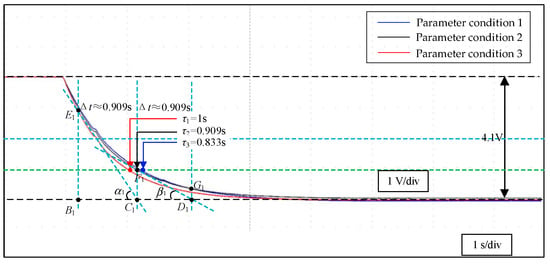
It can be observed from Figure 12 that the initial voltage magnitude in Case 1 to Case 3 of varying J is uniformly 308.4 V, and the whole steady-state voltage drop process exhibits exponential decay characteristics. Three rotational inertia values J1 = 1666.67, J2 = 1818.18 and J3 = 2000 are adopted for comparative research. After the reactive power load disturbance is applied in the experiment, the system voltage stabilizes at 304.3 V for all working conditions, and the exponential decay features during steady-state voltage drop remain consistent. This conclusion agrees with the theoretical analysis results in Section 4.1. It is demonstrated that the established reduced-order model meets performance requirements across all rotational inertia bandwidth scenarios and can accurately describe the voltage support and dynamic inertia characteristics of AC microgrids under various control parameter configurations. τ is defined as the time required for the voltage to decay from its initial value to the steady-state value plus 0.368 times the difference between the initial value and the steady-state value. Under different rotational inertia parameter conditions, τ takes the values τ1, τ2, and τ3, respectively. Figure 12 visually annotates these time constants and focuses on analysing the physical meaning of the sub-intercept at τ2, which is approximately equal to the τ value at that moment; the physical meaning at τ3 is identical. This visual analysis provides a clear methodological basis for voltage support assessment.
For the disturbance case where the reactive power load steps from 20 kvar to 40 kvar, theoretical calculation yields the initial AC voltage Us(t0) = 308.4 V and steady-state AC voltage Us(∞) = 304.3 V. It can be derived from Equation (10) that, at t = t0 + τ, the theoretical AC voltage values corresponding to the three rotational inertia scenarios (Case 1, Case 2 and Case 3 with different inertia parameters) are 305.534 V, 305.665 V and 305.809 V, respectively. The experimental results plotted in Figure 12 show that the measured AC voltage values of the three rotational inertia scenarios are 305.672 V, 305.671 V and 305.669 V, respectively. The relative error is calculated by dividing the difference between measured and theoretical AC voltage values by the transient voltage component; the relative errors of the three scenarios are 3.37%, 0.15% and 3.41%, correspondingly. At t = t0 + 2τ, the comparison results of theoretical and measured AC voltage values for the three rotational inertia cases are listed in Table 2. As illustrated in Table 2, the theoretical and measured AC voltage values of the three rotational inertia scenarios maintain favourable consistency, and the relative error of each working condition is controlled within 4%. The error accuracy satisfies the requirements of engineering analysis and theoretical research. Meanwhile, it can be observed from Figure 12 that the steady-state voltage drop deviation of the system under the three distinct reactive power load disturbance cases stabilizes at 4.1 V with identical values, which verifies the accuracy of the analytical expression for voltage dynamic response derived in this paper and proves its validity for AC microgrids under scenarios with various rotational inertia control bandwidths.
Table 2.
Voltage errors under different rotational inertia parameters.
5.2. Experimental Verification Under Different Damping Coefficient Scenarios
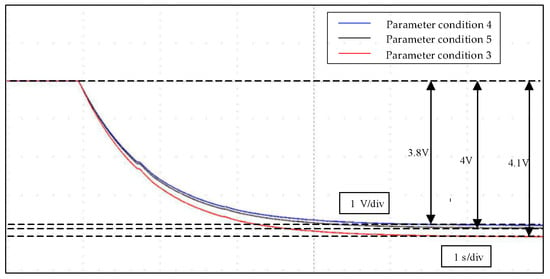
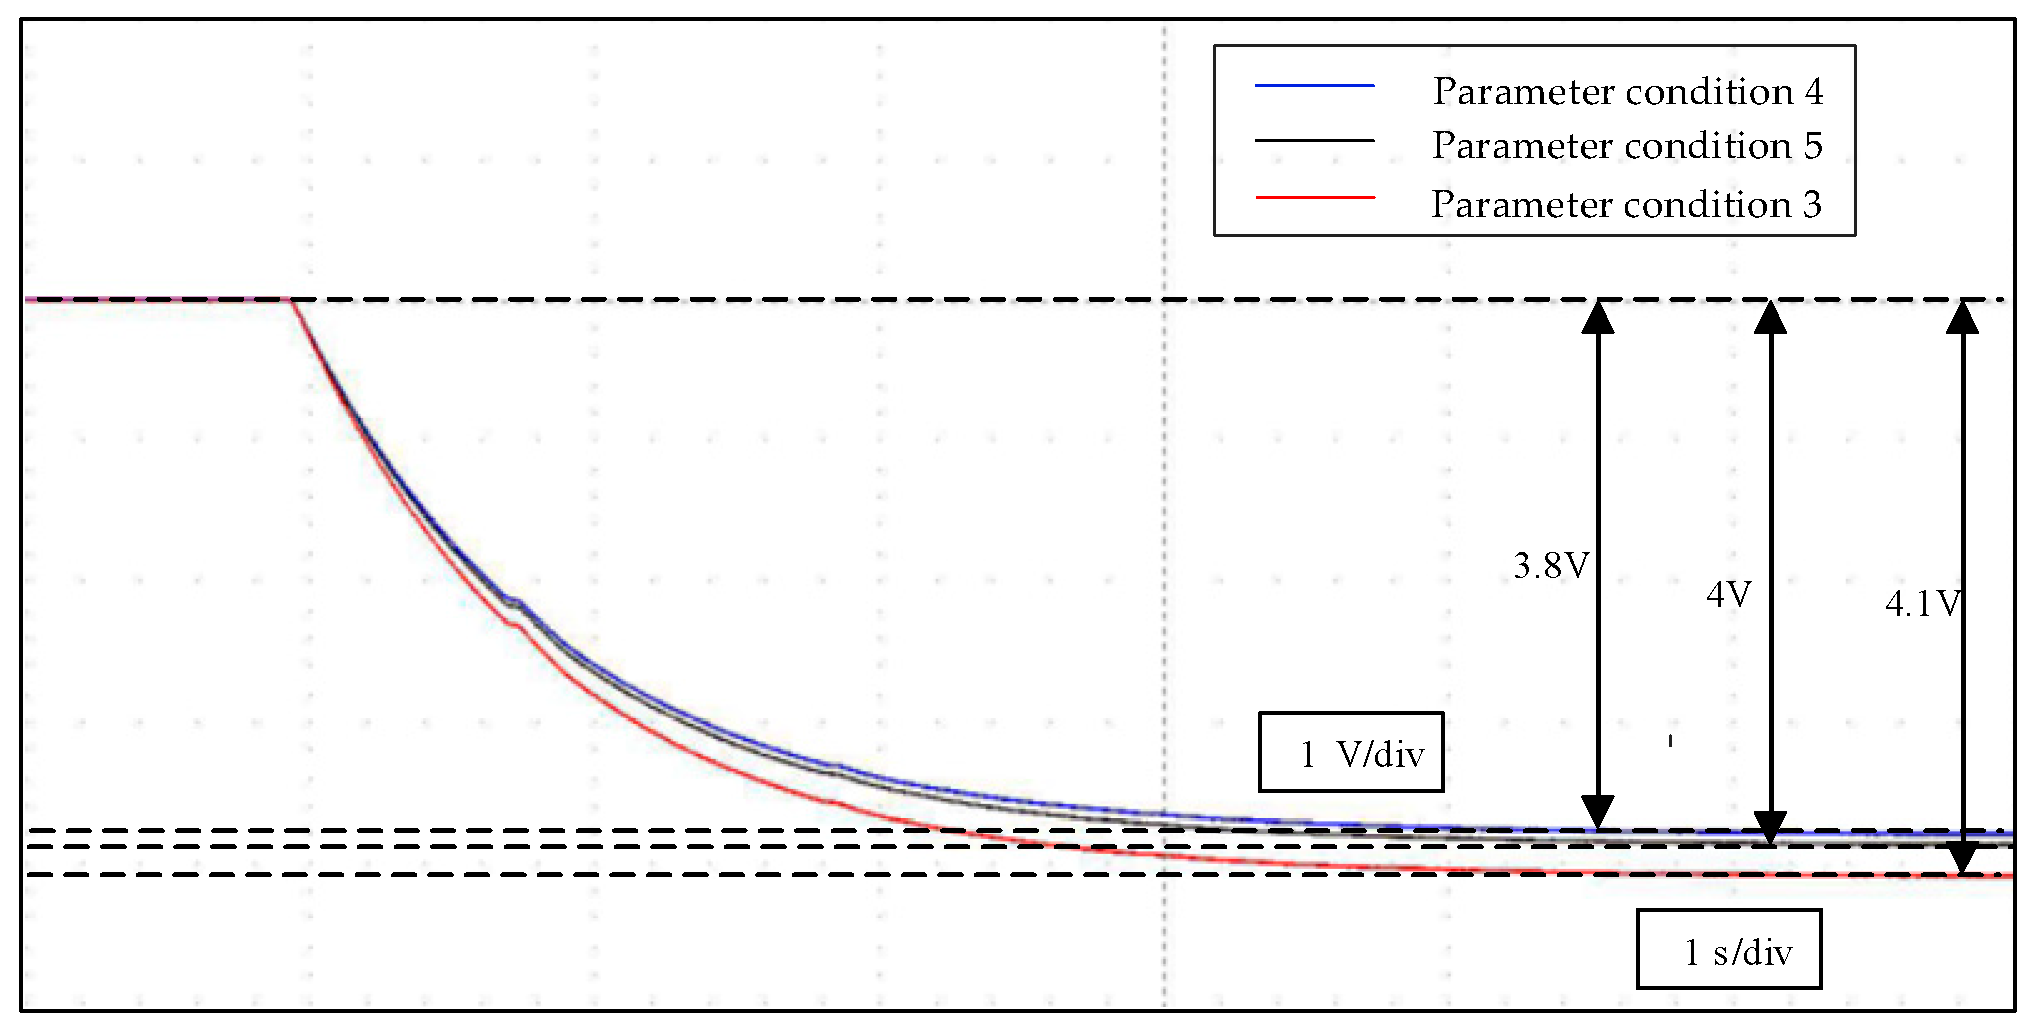
In the experiment, the system load step disturbance is configured such that the reactive power load disturbance increases from 20 kvar to 40 kvar at t = 10 s, with the corresponding inertia time constant τ = 1 s remaining unchanged. Three damping coefficient cases, namely D1 = 2174, D2 = 2083 and D3 = 2000, are selected for comparative experiments, and the comparison of voltage dynamic responses between the reduced-order model is shown in Figure 13. Meanwhile, the system voltage sag deviations under the three different damping coefficient cases stabilize at 3.8 V, 4.0 V and 4.1 V, respectively. The voltage sag deviation decreases significantly with the increase of damping coefficient, which proves that damping coefficient variation is a key factor affecting the system voltage sag magnitude—in particular, the smaller the damping coefficient, the more prominent the voltage sag deviation will be.
Figure 13.
Experimental results under different damping coefficient scenarios.
For different damping coefficient scenarios, theoretical calculations show that the initial AC voltage values Us(t0) in the three reactive power load disturbance cases are 308.6 V, 308.5 V and 308.4 V, respectively. After the reactive power load disturbance occurs, the steady-state AC voltage values Us(∞) of the first, second and third reactive power load disturbance cases are 304.8 V, 304.5 V and 304.3 V, respectively. According to Equation (10), when t = t0 + τ (i.e., t = 11 s), the theoretical AC voltage values of the first, second and third reactive power load disturbance cases are 306.198 V, 305.972 V and 305.809 V, respectively. As shown in Figure 13, the measured AC voltage values of the three corresponding cases are 306.077 V, 305.873 V and 305.669 V, respectively. Comparative analysis reveals that the theoretical and measured AC voltage values of the three cases are nearly consistent, with relative errors of 3.18%, 2.48% and 3.41%, respectively. At t = t0 + 2τ (i.e., t = 12 s), the comparison results of theoretical and measured AC voltage values under the three different damping coefficient scenarios are listed in Table 3. As indicated by Table 3, the theoretical and measured AC voltage values are also basically consistent, with all relative errors constrained within 4%. This validates the correctness of the proposed analytical expression of time-domain AC voltage response, which can accurately characterize the dynamic voltage variation law of AC microgrids in response to different reactive power load disturbances. After the reactive power load disturbance is applied, the system voltage drops from the initial value to a new steady-state value, and the entire sag process exhibits an exponential decay characteristic.
Table 3.
Voltage errors under different damping coefficient parameter conditions.
5.3. Experimental Verification Under Different Load Reactive Power Disturbance Scenarios
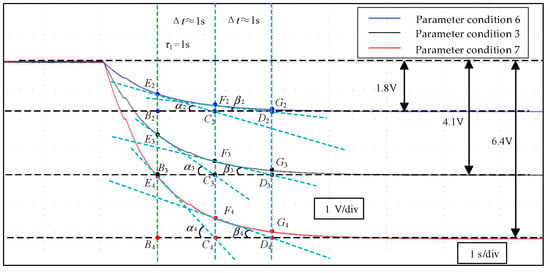
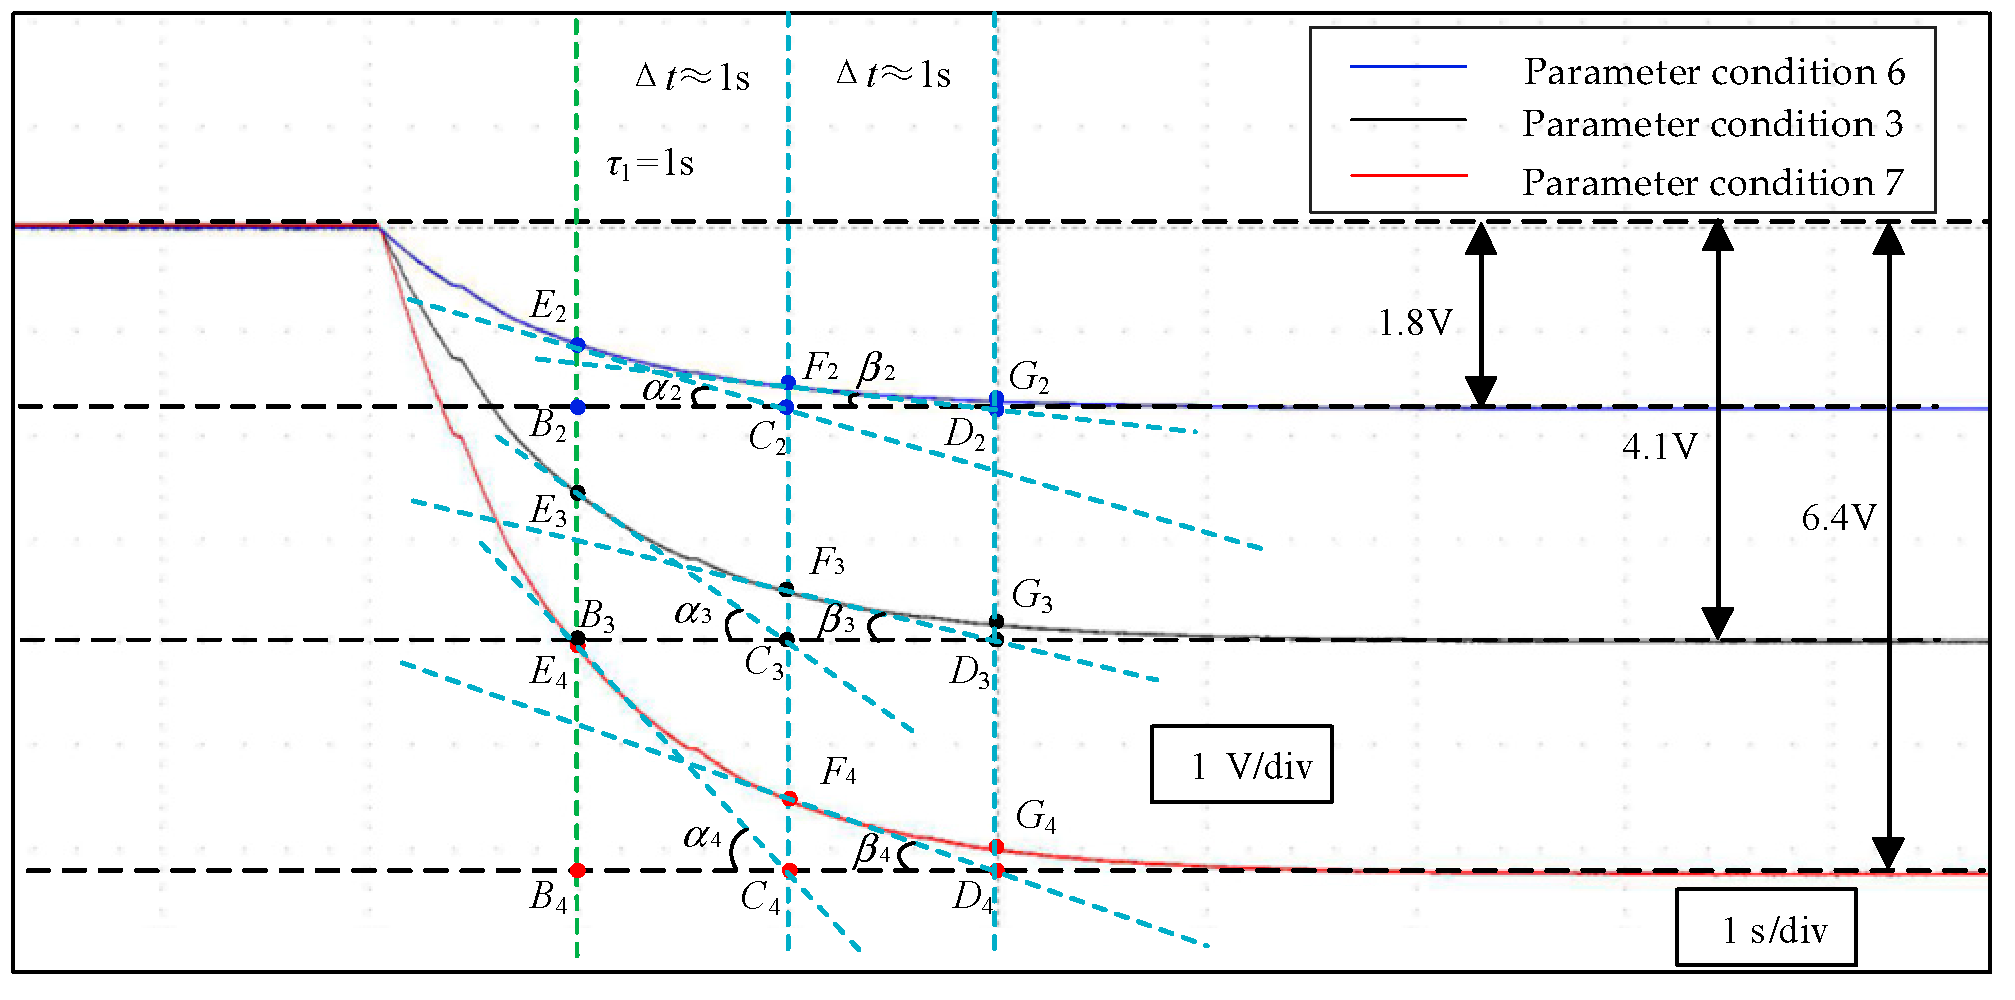
To verify the applicability of the proposed method, we conduct experiments on the AC microgrid in varying load reactive power disturbance scenarios. To verify the applicability of the proposed method to varying disturbance amplitudes, three load reactive power step disturbances are applied at t = 10 s: the load reactive power increases from the base value of 20 kvar to 30 kvar (Q1), to 40 kvar (Q2), and to 50 kvar (Q3), respectively. The experimental results are presented in Figure 14. As shown in Figure 14, under the three reactive power load disturbance conditions, the dynamic voltage curves output by the reduced-order model agree well with the measured waveforms. After the disturbance occurs, the system voltage drops from the initial value of 308.4 V to a new steady-state value (the steady-state value decreases with the increase of load disturbance amplitude). Furthermore, the system steady-state voltage drop deviations under the three different reactive power load cases stabilize at 1.8 V, 4.1 V and 6.4 V, respectively. The steady-state voltage drop deviation increases significantly with the growth of reactive power load amplitude, which fully demonstrates that reactive power load disturbance is a key factor affecting the system steady-state voltage drop magnitude—in particular, the larger the reactive power load, the more prominent the steady-state voltage drop deviation will be.
Figure 14.
Experimental results under various load reactive power disturbance conditions.
Under different reactive power load disturbance conditions, the corresponding value of τ is consistently τ1. Figure 14 visually annotates the inertia time constant τ1 and analyses the physical meaning of the sub-intercept at the τ1 moment. This visual analysis provides a clear methodological basis for voltage support assessment.
For disturbance scenarios under different load reactive power conditions, theoretical calculations indicate that the initial AC voltage Us(t0) is consistently 308.4 V across all three cases. Following the reactive power disturbance, the steady-state AC voltage values Us(∞) for the first, second, and third disturbance scenarios are calculated to be 306.6 V, 304.3 V, and 302 V, respectively. Based on Equation (10), at t = t0 + τ (i.e., t = 11 s), the theoretical AC voltage values for the three scenarios are 307.262 V, 305.809 V, and 304.355 V, respectively. As shown in Figure 14, the corresponding measured AC voltage values are 307.218 V, 305.670 V, and 304.180 V, respectively. A comparative analysis reveals that the theoretical and measured values are in close agreement, with relative errors of 2.44%, 3.39%, and 2.73% for the respective cases, as detailed in Table 4. At t = t0 + 2τ (i.e., t = 12 s), the theoretical and measured AC voltages remain fundamentally consistent, with all relative errors maintained within 4%. This validates the correctness of the proposed time-domain voltage response analytical expression and confirms its capability to accurately characterize the dynamic voltage variation patterns of the AC microgrid under different load reactive power disturbances.
Table 4.
Voltage deviation under various load reactive power disturbance conditions.
5.4. Voltage Experimental Verification of Grid-Following Converter
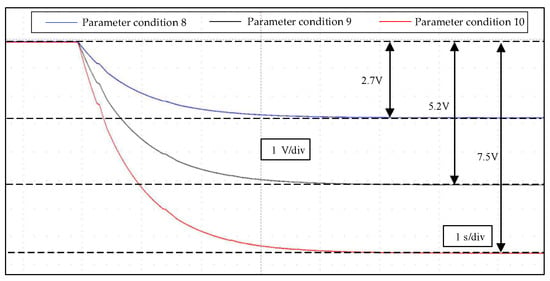
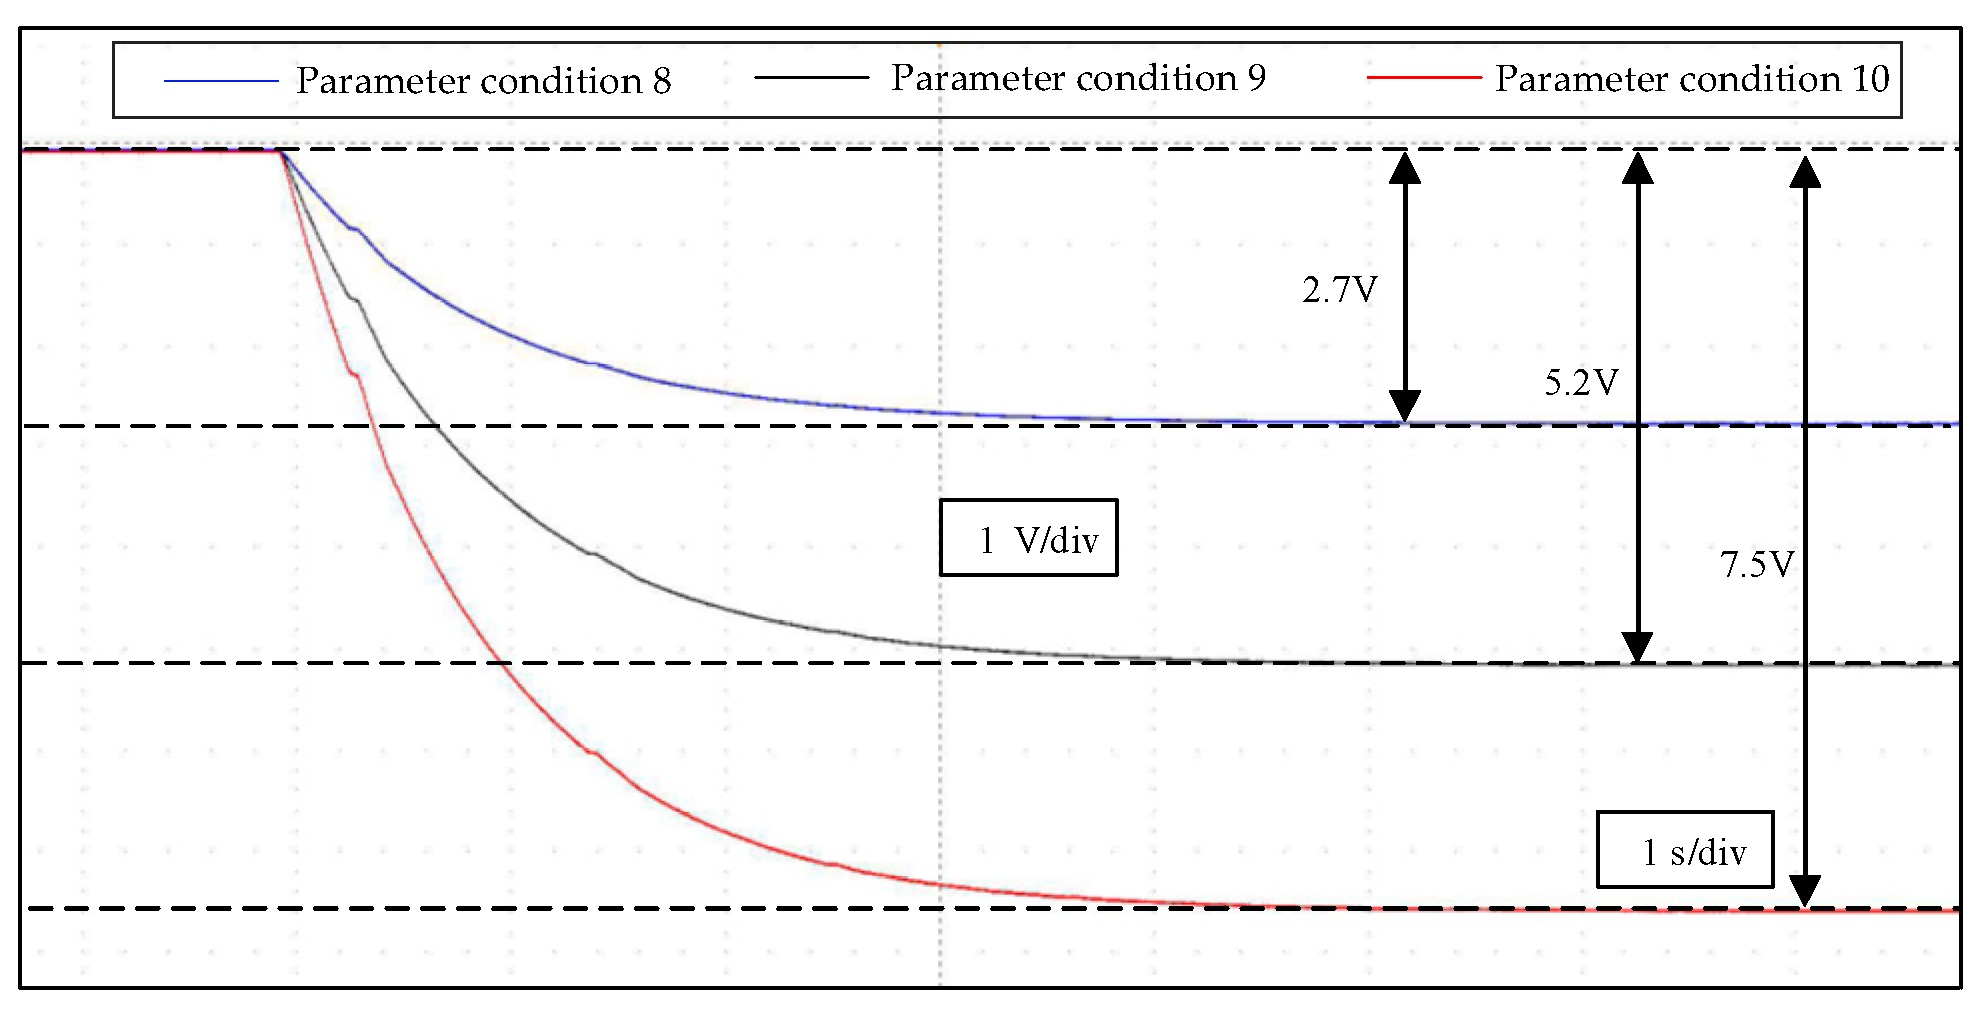
To validate the applicability of the proposed method, experimental verification was carried out based on different reactive power load disturbance scenarios of the grid-following converter. At t = 10 s, different reactive power load disturbances were applied, namely 10 kvar, 20 kvar, and 30 kvar, corresponding to Q4, Q5, and Q6 in Figure 15, respectively. A comparative analysis of the three reactive power load variations was conducted, and the experimental results are shown in Figure 15. It can be seen from Figure 15 that, under the three reactive power load disturbance conditions, the voltage dynamic curves output by the grid-following converter model agree well with the measured waveforms of the switching model. After the disturbance occurs, the system voltage drops from the initial value of 311.8 V to a new steady-state value, and the steady-state value decreases as the disturbance amplitude increases. Moreover, under the three different reactive power load conditions, the steady-state voltage drop deviations are 2.7 V, 5.2 V, and 7.5 V, respectively, and the voltage drop deviation increases significantly with the increase in the reactive power load amplitude.
Figure 15.
Experimental results of the grid-following converter under different reactive power load disturbance conditions.
For disturbance conditions under different reactive power loads, theoretical calculations show that the initial AC voltage value U(t0) for all three reactive power load disturbance scenarios is 311.8 V. After the reactive power load disturbance occurs, the steady-state AC voltage values U(∞) for the third, fourth, and fifth reactive power load disturbance scenarios are 309.1 V, 306.6 V, and 304.3 V, respectively. According to Equation (10), when t = t0 + τ (i.e., t = 11 s), the theoretical AC voltage values for the first, second, and third reactive power load disturbance scenarios are 310.094 V, 308.514 V, and 307.06 V, respectively. As shown in Figure 15, the measured AC voltage values for the first, second, and third reactive power load disturbance scenarios are 310.053 V, 308.427 V, and 306.855 V, respectively. Comparative analysis shows that the theoretical and measured AC voltage values for the first, second, and third reactive power load disturbance scenarios are almost identical, with relative errors of 1.52%, 1.67%, and 2.73%, respectively, as detailed in Table 5. At t = t0 + 2τ (i.e., t = 12 s), the theoretical and measured AC voltage values are also basically consistent, and all relative errors are within 4%. This verifies the correctness of the proposed analytical expression for the AC voltage time-domain response and confirms that it can capture the voltage dynamic variation law of the AC microgrid under different reactive power load disturbances of the grid-following converter.
Table 5.
Voltage error of the grid-following converter under different reactive power load disturbance conditions.
5.5. Generator Model Voltage Experimental Verification
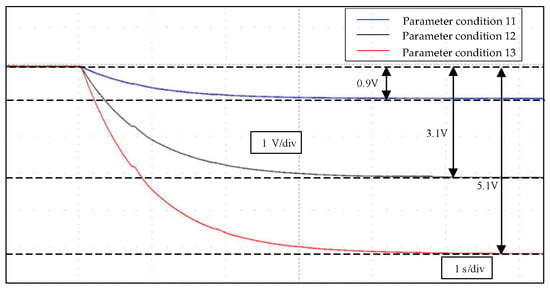
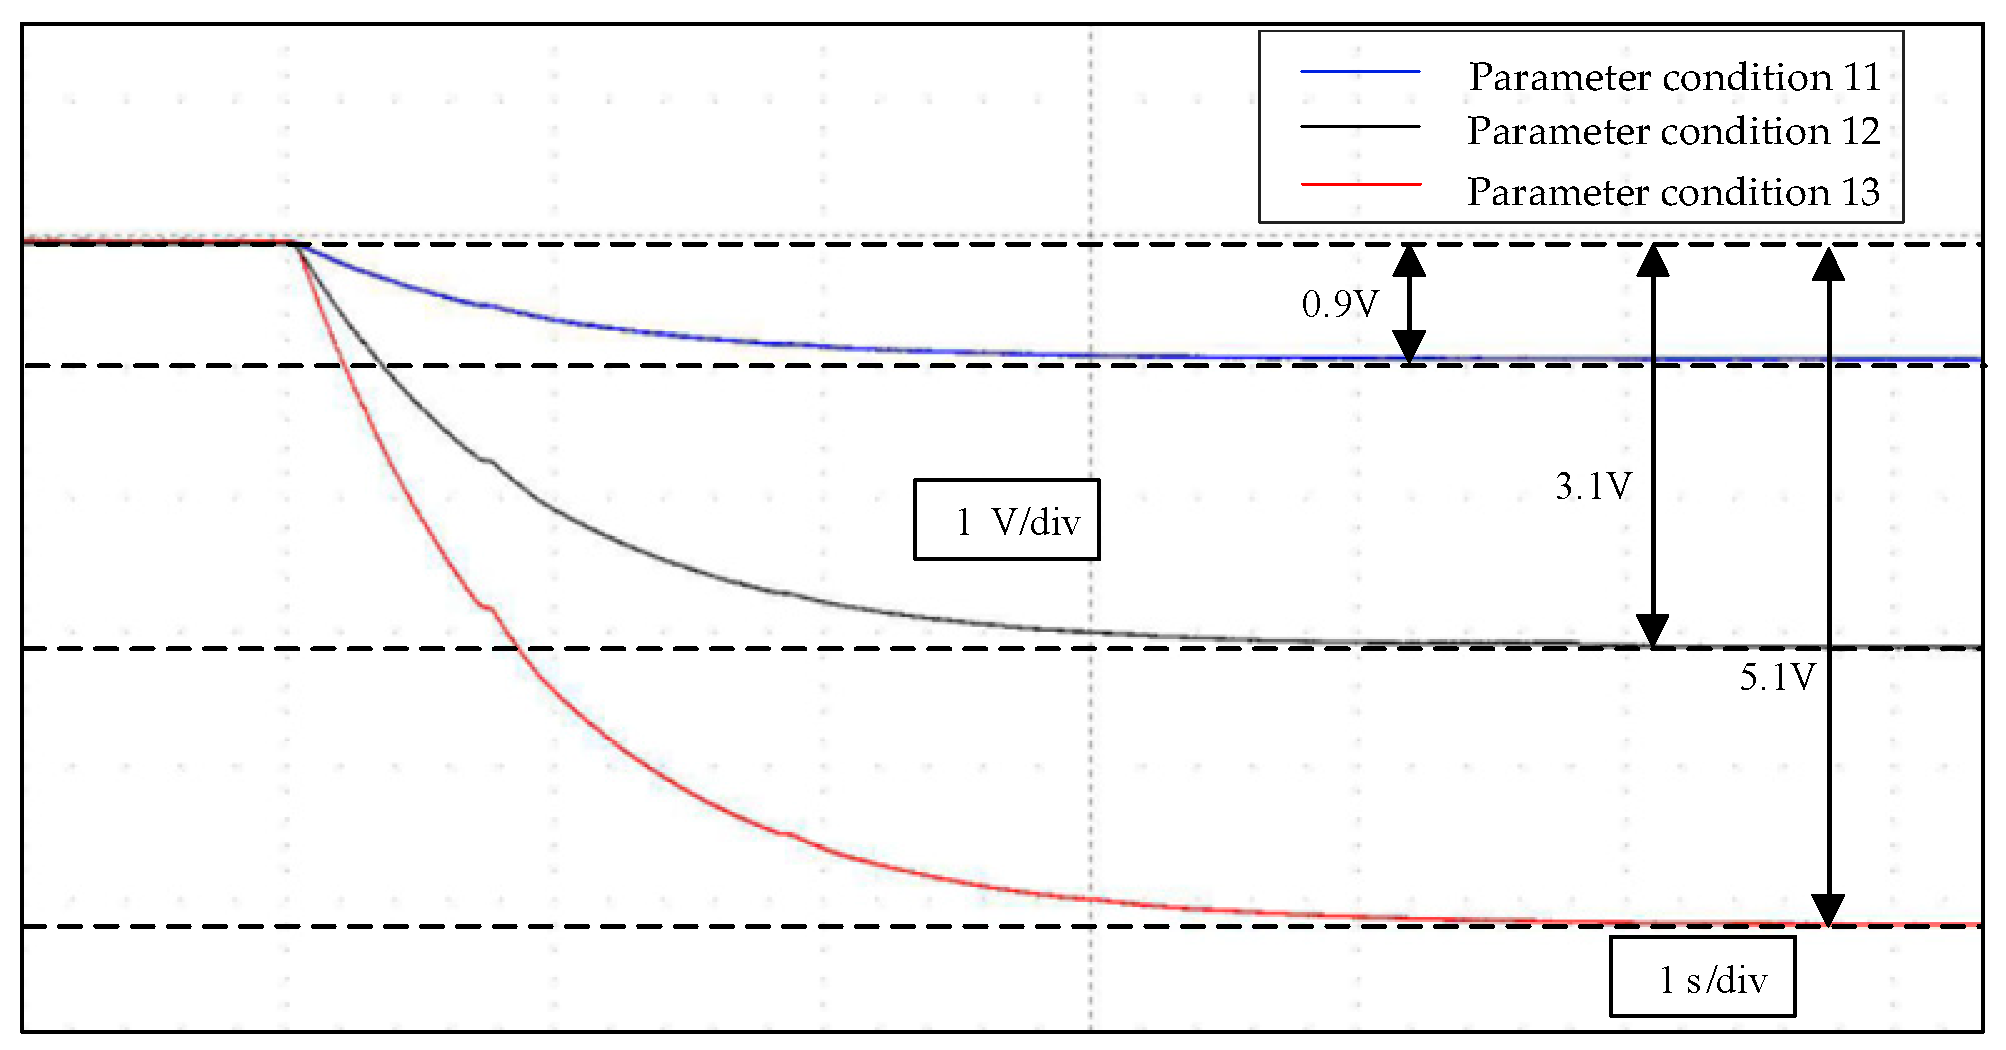
To verify the applicability under nonlinear and unbalanced loads, experimental verification was carried out based on different reactive power load disturbance scenarios by incorporating a motor model into the AC microgrid. At t = 10 s, different reactive power load disturbances were applied, namely 10 kvar, 20 kvar, and 30 kvar, corresponding to Q7, Q8, and Q9 in Figure 16, respectively. A comparative analysis of the three reactive power load variations was conducted, and the experimental results are shown in Figure 16. It can be seen from Figure 16 that, under the three reactive power load disturbance conditions, the voltage dynamic curves output by the reduced-order model agree well with the measured waveforms of the switching model. After the disturbance occurs, the system voltage drops from the initial value of 305.1 V to a new steady-state value, and the steady-state value decreases as the disturbance amplitude increases. Under the three different reactive power load conditions, the steady-state voltage drop deviations are 0.9 V, 3.1 V, and 5.1 V, respectively, and the voltage drop deviation increases significantly with the increase in the reactive power load amplitude.
Figure 16.
Experimental results of the generator model under different reactive power load disturbance conditions.
For disturbance conditions under different reactive power loads, theoretical calculations show that the initial AC voltage value U(t0) for all three reactive power load disturbance scenarios is 305.1 V. After the reactive power load disturbance occurs, the steady-state AC voltage values U(∞) for parameter conditions 11, 12, and 13 are 304.2 V, 302 V, and 300 V, respectively. According to Equation (10), when t = t0 + τ (i.e., t = 11 s), the theoretical AC voltage values for parameter conditions 11, 12, and 13 are 304.531 V, 303.141 V, and 301.877 V, respectively. As shown in Figure 16, the measured AC voltage values for parameter conditions 11, 12, and 13 are 304.551 V, 303.083 V, and 301.679 V, respectively. Comparative analysis shows that the theoretical and measured AC voltage values for parameter conditions 11, 12, and 13 are almost identical, with relative errors of 2.22%, 1.87%, and 3.88%, respectively, as detailed in Table 6. At t = t0 + 2τ (i.e., t = 12 s), the theoretical and measured AC voltage values are also basically consistent, and all relative errors are within 4%. This verifies the correctness of the proposed analytical expression for the AC voltage time-domain response and confirms that it can capture the voltage dynamic variation law of the AC microgrid under different reactive power load disturbances with nonlinear and unbalanced loads.
Table 6.
Voltage errors of the generator model under different reactive power load disturbance conditions.
5.6. Dynamic Response Analysis of Reactive Power Support
In practical engineering, grid-forming VSGs in islanded microgrids are required not only to suppress transient voltage fluctuations via virtual inertia, but also to provide fast reactive power support to cope with operating conditions such as sudden load changes and fault disturbances. According to current grid-connected technical guidelines, the response time for reactive power output to rise from 0 to 90% of the target value is generally required to be no more than 200 ms [21,22]. The virtual inertia strength and the active support response speed are jointly determined by rotational inertia J and damping coefficient D, with an inherent parameter-coupling relationship between them. It is necessary to clarify their quantitative influence laws and trade-off boundaries. Based on the experimental model established above, this section derives the analytical expression of the dynamic response for reactive power support, quantifies the correlation between response time and system inertia, and verifies the parameter matching relationship through experimental results.
According to the mechanism of Q-U droop control with a virtual inertia link, the differential relationship between reactive power disturbance and voltage dynamics can be expressed as
where ΔU denotes the voltage deviation, and ΔQ represents the reactive power disturbance. When the system is subjected to reactive power load disturbance, the tracking process of reactive power output is equivalent to the step response of a first-order inertial element, whose time-domain expression is given by
where Q0 is the initial value of reactive power output before disturbance, ΔQstep is the amplitude of the reactive power step disturbance, and τ is the system-level inertia time constant satisfying Equation (9) above. By setting the reactive power output to reach 90% of the steady-state expected value and substituting it into Equation (14), the 90% response time is derived as t90% ≈ 2.303τ. If the engineering requirement for the dynamic response time of active support is t90% < 200 ms, the equivalent time constant shall satisfy τ < 86.8 ms. This result reveals that improving the response speed of active support requires reducing the system-level inertia time constant at the cost of partial virtual inertia support capability, and there exists an explicit parameter trade-off relationship between the two.
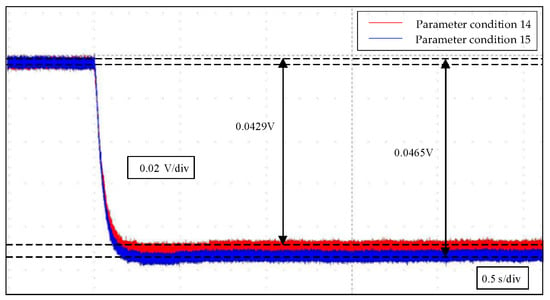
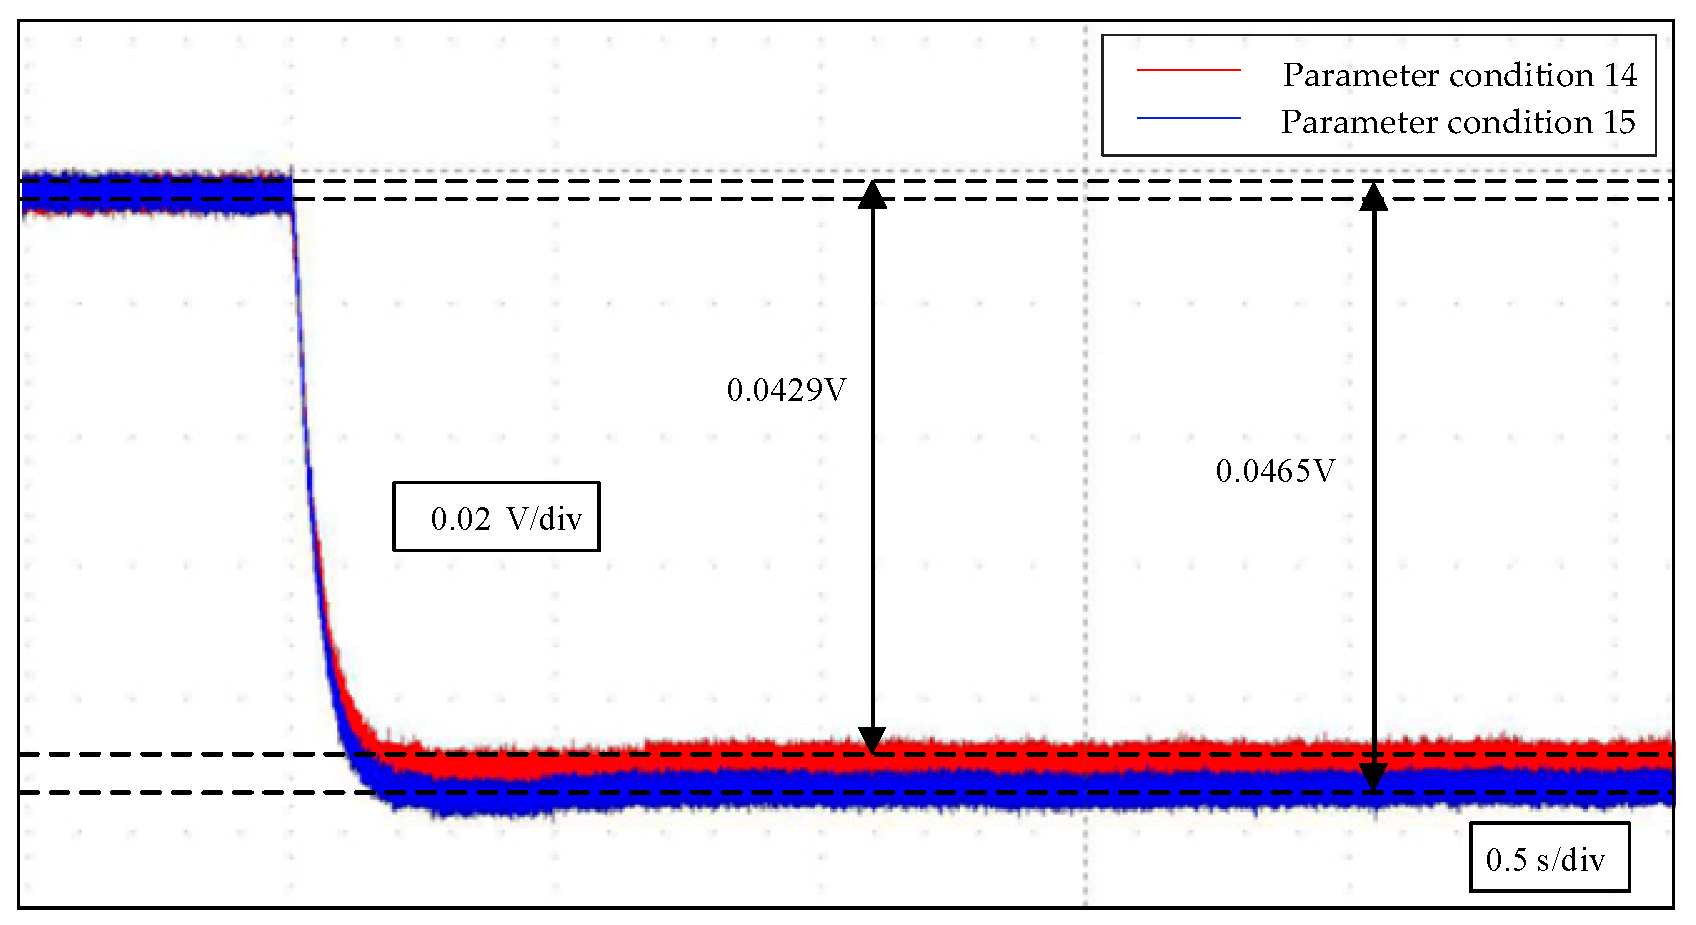
To verify the accuracy of the above theoretical derivation and reveal the influence of damping coefficient on steady-state voltage drop at the same response speed, this section adopts a fixed system-level inertia time constant τ = 87 ms, which is close to the critical threshold of 200 ms response time. Two comparative cases are designed by synchronously matching parameters J and D: Case 1 adopts D1 = 208,333, J1 = 18,125; and Case 2 adopts D2 = 192,308, J2 = 16,731. A step reactive power load disturbance of 20 kvar is applied at t = 10 s, and the voltage dynamic response curves of the two cases are shown in Figure 17.
Figure 17.
Experimental results under different dynamic response disturbance conditions.
The experimental results show that the time for the reactive power output to reach 90% of the steady-state value is approximately 200 ms in both cases, meeting the response speed requirement for reactive power support. Case 1 with a larger damping coefficient corresponds to a smaller steady-state voltage drop, which is consistent with the previous conclusion that increasing the damping coefficient can suppress steady-state voltage drop, verifying the correctness of the parameter matching relationship. The theoretical values of voltage dynamic response in the two cases are calculated based on Equation (10) and compared with the simulated measured values, with the error statistics shown in Table 7. As indicated by the table, at the two characteristic moments t = t0 + τ and t = t0 + 2τ, the relative errors between theoretical and measured voltage values of both cases are controlled within 4%, which proves that the experimental model and analytical expression proposed in this paper are also applicable to scenarios with small time constants and fast responses.
Table 7.
Voltage errors under different dynamic response disturbance conditions.
6. Conclusions
Focusing on the core issue of quantifying the voltage support capability and virtual inertia of droop-controlled Virtual Synchronous Generators (VSGs) in islanded AC microgrids, this paper presents a systematic study on theoretical modeling, analytical derivation, and experimental verification. The aim is to provide scientific and reliable quantitative criteria for VSG parameter tuning and microgrid voltage stability control. The main contributions are summarized as follows:
- (1)
- A first-order reduced-order model is established, and the analytical expression of system voltage dynamic response is derived. This expression indicates that the voltage dynamic characteristics of the AC microgrid voltage support capability are jointly determined by the initial voltage value U(t0), the steady-state voltage value U(∞) and the system-level inertia time constant τ. Multiple sets of experimental results show that the theoretical values obtained from the analytical expression of voltage dynamic response are in good agreement with the measured values, with all relative errors within 4%, which fully verifies the accuracy and effectiveness of the proposed model. Experimental results confirm that the system steady-state voltage drop is positively correlated with the reactive power load disturbance and negatively correlated with the damping coefficient: the larger the reactive power load disturbance, the greater the steady-state voltage drop; the smaller the damping coefficient, the more pronounced the steady-state voltage drop.
- (2)
- An evaluation formula for the system-level inertia time constant accounting for load disturbance intensity is derived. This formula demonstrates that the system-level inertia time constant τ is determined by the ratio of rotational inertia to damping coefficient and is independent of both the amplitude of the load step disturbance and the magnitude of the reactive power load disturbance borne by grid-following converters. Furthermore, the filter bandwidth parameter only exerts an influence on the dynamic inertia process without altering the magnitude of the system steady-state voltage drop. Under multiple sets of operating conditions with varying reactive power loads, the relative error between the calculated and measured values of the output voltage U is consistently maintained within 4%, which validates the accuracy of the proposed evaluation formula.
- (3)
- Definition of 5τ as the quantitative benchmark for virtual inertia response time. Based on the derived voltage dynamic response expression, 5τ is established as the assessment benchmark for virtual inertia response time. The analysis results indicate that the system voltage enters the steady-state neighborhood after 5τ. Multi-scenario experimental results are in strong agreement with this benchmark, demonstrating that adopting 5τ as the evaluation criterion for virtual inertia response time and system dynamic stability is rigorous and effective.
In summary, the proposed virtual inertia evaluation method, the influence laws of key parameters, and the mechanism of reactive power load on steady-state voltage drop can provide quantitative guidance for the reasonable tuning of VSG operating parameters in engineering practice, and offer theoretical support and technical reference for the transient voltage stability control of high-penetration renewable energy microgrids.
Author Contributions
Conceptualization, S.S. and L.Z.; methodology, S.S. and Y.W.; software, X.M., L.F. and X.Z.; validation, S.S., Y.W. and L.F.; investigation, S.S. and X.M.; writing—original draft preparation, X.M.; writing—review and editing, S.S., L.Z., Y.W., X.M., L.F. and X.Z.; visualization, X.M. and X.Z.; supervision, S.S. and X.M.; project administration, X.M. All authors have read and agreed to the published version of the manuscript.
Funding
This work is supported by Science and Technology Project of State Grid Henan Electric Power Company (Research on Configuration and Optimized Operation of PV-Storage-Charging in Distribution Network for Hosting Capacity Enhancement, No. 5217G0260001).
Data Availability Statement
Data is contained within the article.
Conflicts of Interest
Authors Sipei Sun, Liang Zhang, Yisu Wang, and Xueqian Min are employed by the Luohe Power Supply Company, State Grid Henan Electric Power Company. Authors Liang Feng and Xueshen Zhao are employed by the School of Electrical and Electronic Engineering at Shandong University of Technology. The remaining authors declare that the research was conducted in the absence of any commercial or financial relationships that could be construed as a potential conflict of interest.
References
- Liu, D.; Jiang, K.; Ji, X.; Cao, K.; Xu, C.; Sang, S.; Yang, D. Improved VSG strategy of grid-forming inverters for supporting inertia and damping. Front. Energy Res. 2024, 11, 1001–1024. [Google Scholar] [CrossRef] [Scilit]
- Liang, X.; Andalib-Bin-Karim, C.; Li, W.; Mitolo, M.; Shabbir, M.N.S.K. Adaptive virtual impedance-based reactive power sharing in virtual synchronous generator controlled microgrids. IEEE Trans. Ind. Appl. 2021, 57, 46–60. [Google Scholar] [CrossRef] [Scilit]
- Zhang, S.; Chen, C.; Dong, L.; Li, Y.; Zhao, J.; Niu, S. An enhanced droop control strategy for accurate reactive power sharing in islanded microgrids. In Proceedings of the 2019 IEEE Innovative Smart Grid Technologies—Asia (ISGT Asia), Chengdu, China, 21–24 May 2019; pp. 2352–2356. [Google Scholar]
- Huang, L.; Sun, W.; Yan, Z.; Li, Q.; Li, W. Average voltage observer based distributed secondary sliding mode control with reactive power sharing for microgrids. In Proceedings of the 2023 IEEE 6th International Electrical and Energy Conference, Hefei, China, 12–14 May 2023; pp. 2473–2478. [Google Scholar]
- Shi, Y.; Liu, Z.; Wang, J.; Liu, J. A small-AC-signal injection based decentralized secondary voltage control for parallel inverters with accurate reactive power sharing in islanded microgrids. IEEE Trans. Power Electron. 2023, 38, 14573–14589. [Google Scholar] [CrossRef] [Scilit]
- Lai, J.; Lu, X.; Li, X.; Tang, R.-L. Distributed multiagent-oriented average control for voltage restoration and reactive power sharing of autonomous microgrids. IEEE Access. 2018, 6, 25551–25561. [Google Scholar] [CrossRef] [Scilit]
- Chen, Y.; He, J. Distributed secondary frequency and voltage control of multiagent based autonomous micro grid with enhanced active and reactive power sharing. In Proceedings of the 2017 9th IEEE-GCC Conference and Exhibition (GCCCE), Manama, Bahrain, 8–11 May 2017; pp. 1–9. [Google Scholar]
- Shi, C.; Zhang, J.; Zhang, X.; Liu, Y.; Yang, Z.; Chen, W. A new secondary reactive power control strategy of microgrids based on droop control. In Proceedings of the 2020 12th IEEE PES Asia-Pacific Power and Energy Engineering Conference, Nanging, China, 20–23 September 2020; pp. 1–5. [Google Scholar]
- Verma, V.; Solanki, S.K.; Solanki, J. Improved reactive power sharing between droop controlled inverters in islanded microgrid. In Proceedings of the 2020 IEEE Power & Energy Society General Meeting, Montreal, QC, Canada, 3–6 August 2020; pp. 1–5. [Google Scholar]
- Crivellaro, A.; Tayyebi, A.; Gavriluta, C.; Groß, D.; Anta, A.; Kupzog, F.; Allgöwer, A. Beyond low-inertia systems: Massive integration of grid-forming power converters in transmission grids. In Proceedings of the 2020 IEEE Power & Energy Society General Meeting, Montreal, QC, Canada, 3–6 August 2020; pp. 1–5. [Google Scholar]
- Tran, T.-T.; Gurumurthy, S.K.; Tran, M.-Q.; Nguyen-Huu, T.-A.; Heins, T.; Ponci, F. Grid-forming converters: Control approaches, grid-synchronization, and future trends—A review. IEEE Open J. Ind. Appl. 2021, 2, 93–109. [Google Scholar] [CrossRef] [Scilit]
- Kim, K.-H.; Kim, S.; Wu, H.; Cui, S.; Jung, J.-J. A fast IVS control for grid-forming converters to enhance transient stability and accelerate PCC voltage recovery in weak grids. In Proceedings of the 2025 10th IEEE Workshop on the Electronic Grid, Glasgow, UK, 30 September–2 October 2025; pp. 1–6. [Google Scholar]
- Habibi, S.I.; Sheikhi, M.A.; Khalili, T.; Abadi, S.A.G.K.; Bidram, A.; Guerrero, J.M. Multiagent-based nonlinear generalized minimum variance control for islanded AC microgrids. IEEE Trans. Power Syst. 2024, 39, 316–328. [Google Scholar] [CrossRef] [Scilit]
- Vaishnav, V.; Sharma, D.; Jain, A. Network-based finite-time secondary level control for critical bus voltage restoration and accurate reactive power-sharing. In Proceedings of the 2022 22nd National Power Systems Conference, New Delhi, India, 17–19 December 2022; pp. 584–589. [Google Scholar]
- Wang, Z.; Wang, J.; Lu, Y.; Zhou, L. A distributed finite-time control for islanded AC microgrid with communication delays. In Proceedings of the 2022 Asia Power and Electrical Technology Conference, Shanghai China, 11–13 November 2022; pp. 150–156. [Google Scholar]
- Mei, Y.; Yuan, X.; Chen, X.; Zhou, S.; Yang, R.; Huang, J. Stability analysis of grid-following and grid-forming hybrid system with synchronized parameters. In Proceedings of the 2025 2nd International Conference on Energy Technology and Electrical Power, Hengyang, China, 26–28 December 2025; pp. 526–530. [Google Scholar]
- Ma, Y.; Chen, N.; Ge, L. Reduced-order modeling and stability analysis of grid-following and grid-forming hybrid renewable energy plants. Energies 2025, 18, 1752. [Google Scholar] [CrossRef] [Scilit]
- Micallef, A.; Apap, M.; Staines, C.S.; Zapata, J.M.G. Secondary control for reactive power sharing and voltage amplitude restoration in droop-controlled islanded microgrids. In Proceedings of the 2012 3rd IEEE International Symposium on Power Electronics for Distributed Generation Systems, Aalborg, Denmark, 25–28 June 2012; pp. 492–498. [Google Scholar]
- Li, G.; Wang, J.; Wang, X.; Zhang, L. Virtual inertia analysis of photovoltaic energy storage systems based on reduced-order model. Front. Energy Res. 2023, 11, 1276273. [Google Scholar] [CrossRef] [Scilit]
- Phurailatpam, C.; Rather, Z.H.; Bahrani, B.; Doolla, S. Measurement-based estimation of inertia in AC microgrids. IEEE Trans. Sustain. Energy 2020, 11, 1975–1984. [Google Scholar] [CrossRef] [Scilit]
- Zheng, C.; Zhu, D.; Li, L.; Zou, X.; Hu, J.; Kang, Y. Review of Reactive Power and Voltage Control Requirements for Wind Farms in International Grid Codes. Power Syst. Technol. 2025, 49, 3977–3991. [Google Scholar]
- National Grid ESO. Guidance Notes for DC Converter Stations GB User Issue 2; National Grid ESO: Warwick, UK, 2019; p. 25. [Google Scholar]

Disclaimer/Publisher’s Note: The statements, opinions and data contained in all publications are solely those of the individual author(s) and contributor(s) and not of MDPI and/or the editor(s). MDPI and/or the editor(s) disclaim responsibility for any injury to people or property resulting from any ideas, methods, instructions or products referred to in the content. |
© 2026 by the authors. Licensee MDPI, Basel, Switzerland. This article is an open access article distributed under the terms and conditions of the Creative Commons Attribution (CC BY) license.