


Abstract
This paper assesses mining-induced surface deformation in Mine-A of the Khetri Copper Belt, India, using a three-dimensional (3-D) numerical model based on geological, geotechnical, mine layout, and in situ stress data. 3-D numerical models were developed for the virgin state, current mining state, next 5 years of mining, and next 10 years of mining, and their corresponding strain and displacement were analysed in different directions. For the mine lease boundary, the strain increment from the virgin to current mining state shows maximum surface strain of 2.41 mm/m, 1.93 mm/m, and 2.35 mm/m in the XX, YY, and ZZ directions, respectively, and the displacement increment from the virgin to current mining state shows maximum surface displacement of 0.003 m, 0.002 m, and 0.003 m in the X, Y, and Z directions, respectively. The results indicate that the model-predicted surface deformation response for the current, next 5 years, and next 10 years of mining states is mainly concentrated around already disturbed zones, while the incremental deformation outside such zones remains comparatively limited under the simulated mining sequence. The spatial concentration of deformation within the mining-influenced zone is further supported by available Total Station monitoring data. From a mine planning perspective, the validated modelling framework is useful for identifying locations requiring focused subsidence monitoring, slope stability assessment, and future model refinement.
1. Introduction
Land surface deformation refers to measurable changes in Earth’s surface from its original position, expressed as either sideways shifting or vertical movement in the form of sinking (subsidence) or rising (uplift). Such changes are driven by both natural processes and human activities [1]. Natural causes include the slow pressing down of loose sediments, melting of frozen ground in cold regions, dissolving of limestone and similar rocks, and movements of Earth’s crust. Although these processes usually occur slowly, they can still reshape landscapes and disturb water systems and ecosystems. Human actions, by contrast, often produce quicker and more severe changes. Such deformation can be a significant engineering issue in mining environments because it can influence slope stability, surface infrastructure, drainage conditions and the long-term safety of the mine operations. Pumping out groundwater, extracting oil and gas, using geothermal energy, large-scale construction, and especially underground mining are leading causes of subsidence [2].
Mining-induced subsidence happens when underground material is removed and the rocks above lose support, leading them to bend, crack, or collapse into empty spaces. This movement shows up on the surface as hollows, cracks, scarps, or bowl-shaped depressions [3]. Subsidence may occur suddenly after a roof or pillar fails, or slowly over years as stresses continue to shift [4,5]. Its consequences are serious: it can damage buildings, roads, and pipelines; disrupt transport; change groundwater flow; cause flooding or waterlogging; reduce farm yields; and harm the environment. Although it is often considered an unavoidable result of underground mining, better prediction and monitoring can reduce its impacts [4]. Moreover, subsidence assessment in mining sites can also serve environmental appraisal and land-impact assessment as per the relevant regulatory frameworks, such as those involving forest land. Mine subsidence can be quantified in two principal ways: (i) through predictive models tailored to the prevailing geo-mining and geotechnical settings, and (ii) through dedicated monitoring methods. In practice, these two approaches should be treated as complementary, because predictive models help identify potential deformation-prone zones, whereas monitoring data are ultimately required for calibration and validation [6]. The present study emphasises the first approach, relying on model-based assessment. Out of the existing prediction methods, three-dimensional numerical modelling offers an advantage in the structurally complex mining context since it can capture realistic excavation geometry, material variability, and the redistribution of stress in a more effective manner compared to simplified empirical methods [7,8]. Furthermore, the precision of predicting mine subsidence using three-dimensional numerical models remains a source of concern because of the extensive input requirements, particularly geological and geotechnical parameters [9]. In underground metal mines, deformation is further enhanced by the fact that irregular stoped-out areas, pre-existing troughs, topographic variation, and locally complicated rock mass conditions often affect the deformation.
Numerical modelling has gained relevance in rock mechanics and mining engineering for analysing complex subsurface deformation problems [10]. Numerical techniques have found wide application in subsidence studies, especially where geological heterogeneity, irregular mine geometry, and stage-wise excavation make simplified analytical treatment inadequate [11,12]. The transition from simplified empirical and analytical approaches to numerical modelling has enabled more robust assessment of mining-induced subsidence. Empirical techniques rely on past data and oversimplification [13,14,15], whereas numerical methods solve stress–strain relationships computationally and thereby improve understanding of subsurface deformation behaviour [16].
A 3-D finite difference method in FLAC3D was applied to predict surface subsidence at the Wutong copper mine in China, demonstrating that mine-scale continuum modelling with field-calibrated parameters can reproduce the spatial pattern of observed surface deformation with acceptable accuracy [17]. A full three-dimensional elastoplastic FEM framework was used to predict mining-induced surface subsidence and ground movements at the Diavik diamond mine in Canada, showing that a calibrated continuum model can provide reliable deformation predictions in hard-rock settings, with an average relative error of approximately 8% between model predictions and field monitoring data [18]. Field measurements were combined with FDM-based numerical modelling to study mining-induced subsidence in an underground mining area in northwestern China, establishing the importance of integrating predictive modelling with field-based monitoring for practical subsidence management [19]. Numerical simulation was used to investigate surface subsidence and backfill material movement induced by underground mining, demonstrating that deformation patterns are strongly governed by excavation geometry and surrounding rock mass properties [20].
FDM modelling was combined with stacking InSAR monitoring to study ground movement in a mining area with geological faults, demonstrating the value of integrating numerical prediction with remote sensing validation for constraining subsidence behaviour in structurally complex settings [21]. 3-D numerical modelling was integrated with InSAR monitoring at a block caving mine to constrain and calibrate subsidence predictions, showing that deformation tends to localise within the mining-influenced corridor with limited outward propagation [7]. 3-D discontinuum modelling was applied to an underground iron mine in China, where surface deformation was found to remain spatially concentrated around the stoped-out zone under staged extraction [8]. Deformation was also confirmed to concentrate around the caving zone in a sublevel caving iron mine, with stress increases occurring in both the hanging wall and footwall in a hump-shaped distribution pattern, findings directly comparable to the stress redistribution behaviour observed in the present study [22].
Despite these contributions, the published literature is dominated by coal mines, block caving operations, and mines with relatively regular geometry in sedimentary or simple metamorphic settings. Underground copper mines in structurally complex metamorphic terrain, such as those in the Khetri Copper Belt, India, with irregular stoped zones, pre-existing collapse troughs, and mixed metamorphic lithologies, have received very limited attention in the published numerical subsidence literature. Furthermore, most published studies report predicted deformation values without providing detailed discussion of stage-wise deformation localisation behaviour and its practical consequences for monitoring strategy and mine-ground management [6,12,23]. This gap motivates the present study. Different numerical methods for subsidence prediction are summarised in Table 1.
Table 1.
Characterisation of numerical methods for mine subsidence prediction.
Against this background, the present study develops a site-specific three-dimensional FEM framework for Mine-A in the Khetri Copper Belt to assess strain and displacement behaviour under virgin, current, next 5 years, and next 10 years of mining conditions. The study specifically examines whether future extraction is likely to produce significant outward extension of the subsidence response or mainly intensify deformation within already disturbed zones. Its practical significance lies in supporting subsidence monitoring, slope-stability assessment, and future model refinement using field observations. In addition, available Total Station monitoring points at Mine-A are used as a basis for field comparison.
The originality of the study lies in the following aspects: (i) a site-specific three-dimensional FEM framework is developed for a structurally complex underground copper mine in the Khetri Copper Belt, India, a geological and mining setting that has received limited attention in the published numerical subsidence literature, which predominantly addresses coal mines or simpler geometries; (ii) a comparative stage-wise assessment of deformation localisation is presented, explicitly distinguishing between inward intensification of deformation within the already disturbed zone versus outward extension of the subsidence footprint—a distinction that has direct practical significance for subsidence monitoring and mine planning; and (iii) field-based validation using Leica TS16 Total Station monitoring data from 11 surface stations is used to assess the spatial pattern of model-predicted deformation, providing a practical basis for confidence in the modelling framework.
2. Study Area
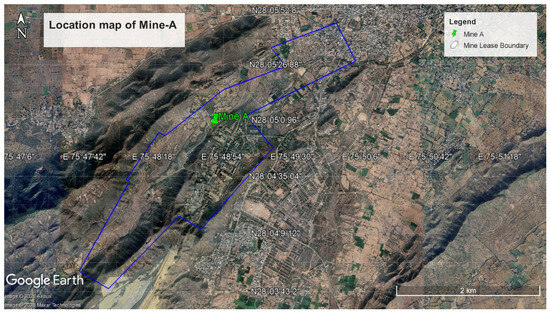
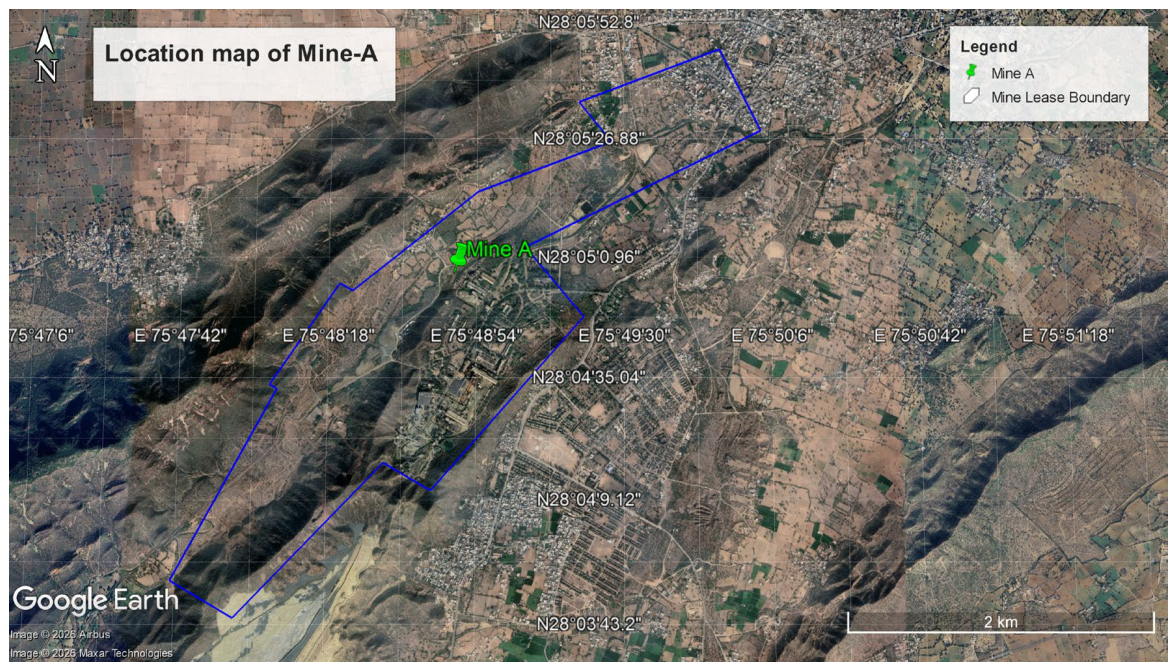
The current area that is being investigated is located in the Khetri Copper Belt (KCB), as shown in Figure 1, which is one of the copper-rich belts that are located in India. The primary assets of KCB are two major underground copper mines, Mine-A and Mine-B. The northern point of KCB is where the mining lease areas of Mine-A and Mine-B are located. The area falls in the Survey of India Toposheet No. 44/P16. The geographical location of the study area is latitude 28°00′46″ N to 28°05′50″ N and longitude 75°45′32″ E to 75°49′53″ E.
Figure 1.
Geographic position of the application area as seen in Google Earth Pro (version-7.3.7.1155, 64-bit).
The geological model developed for this study serves as the foundation for the subsidence analysis and numerical simulation. The study area comprises a complex stratigraphic sequence of metamorphic rocks, including feldspar quartzite, amphibole quartzite, phyllite, and sericite quartzite, each with distinct mechanical properties that influence the ground response. Structural discontinuities such as joints, faults, and lithological contacts play a critical role in subsidence propagation and were explicitly incorporated into the model. These discontinuities not only affect stress redistribution but also act as potential planes of weakness, impacting the overall deformation mechanism. Geological mapping, core logging, and laboratory testing were employed to determine essential rock mass parameters, including Young’s modulus, Poisson’s ratio, cohesion, and the internal friction angle. The orientation of strata, ore body geometry, and mining sequence were integrated into the model to simulate subsurface conditions realistically. This comprehensive geological framework was then translated into a three-dimensional mesh using the Strand7 FEM platform, ensuring that the simulation accurately reflects actual field conditions and supports the accurate prediction of surface subsidence under ongoing and future mining operations.
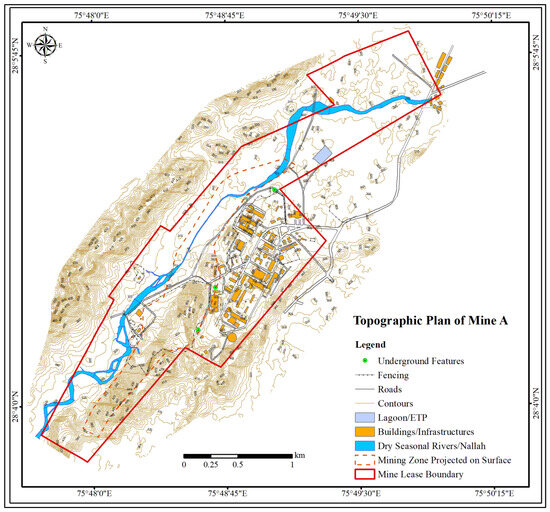
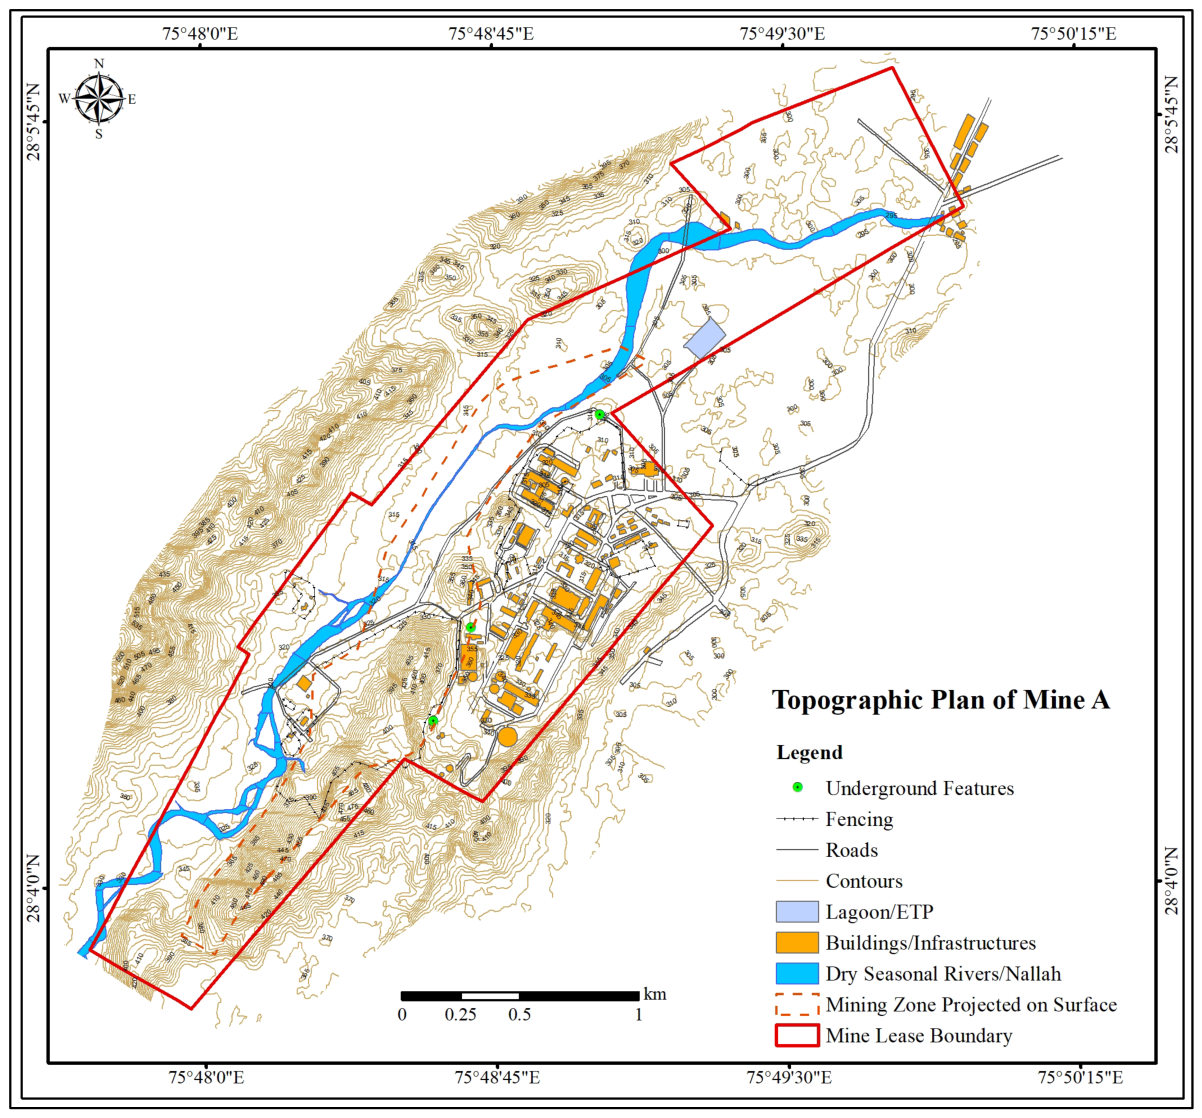
The site lies at the northern tip of the Aravalli hills. Within the lease, three NE–SW ridges are separated by sandy plains. The eastern foothills of the Makro range occur to the west, while the central ridge hosts the copper mineralisation; it is divided from the Makro Hills by the Kharkhara Valley. In the east, a moderately elevated magnetite quartzite ridge is set apart by a valley that accommodates plant facilities, stores, and administrative buildings. Hill slopes are very steep and largely barren of soil. Terrain in the south of the lease is hilly; to the north, it grades into soil-covered plains. Elevations range from a valley floor nearly 350 m above MSL to a local high of 555 m above mean sea level (MSL). Two seasonal streams drain the area—Kharkhara along the west and Sukhnadi to the east—and the overall drainage trend is toward the northeast. Figure 2 shows the topographic layout of Mine-A, including the ridge valley configuration, the local elevation variation, and the surface setting relevant to the numerical subsidence analysis.
Figure 2.
Topographic layout of Mine-A showing the surface relief and terrain features relevant to subsidence assessment.
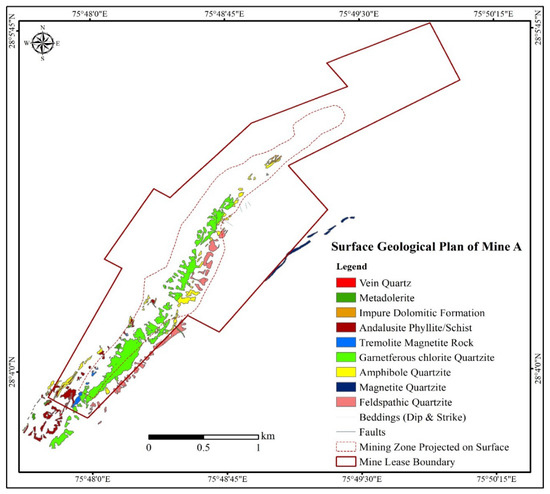
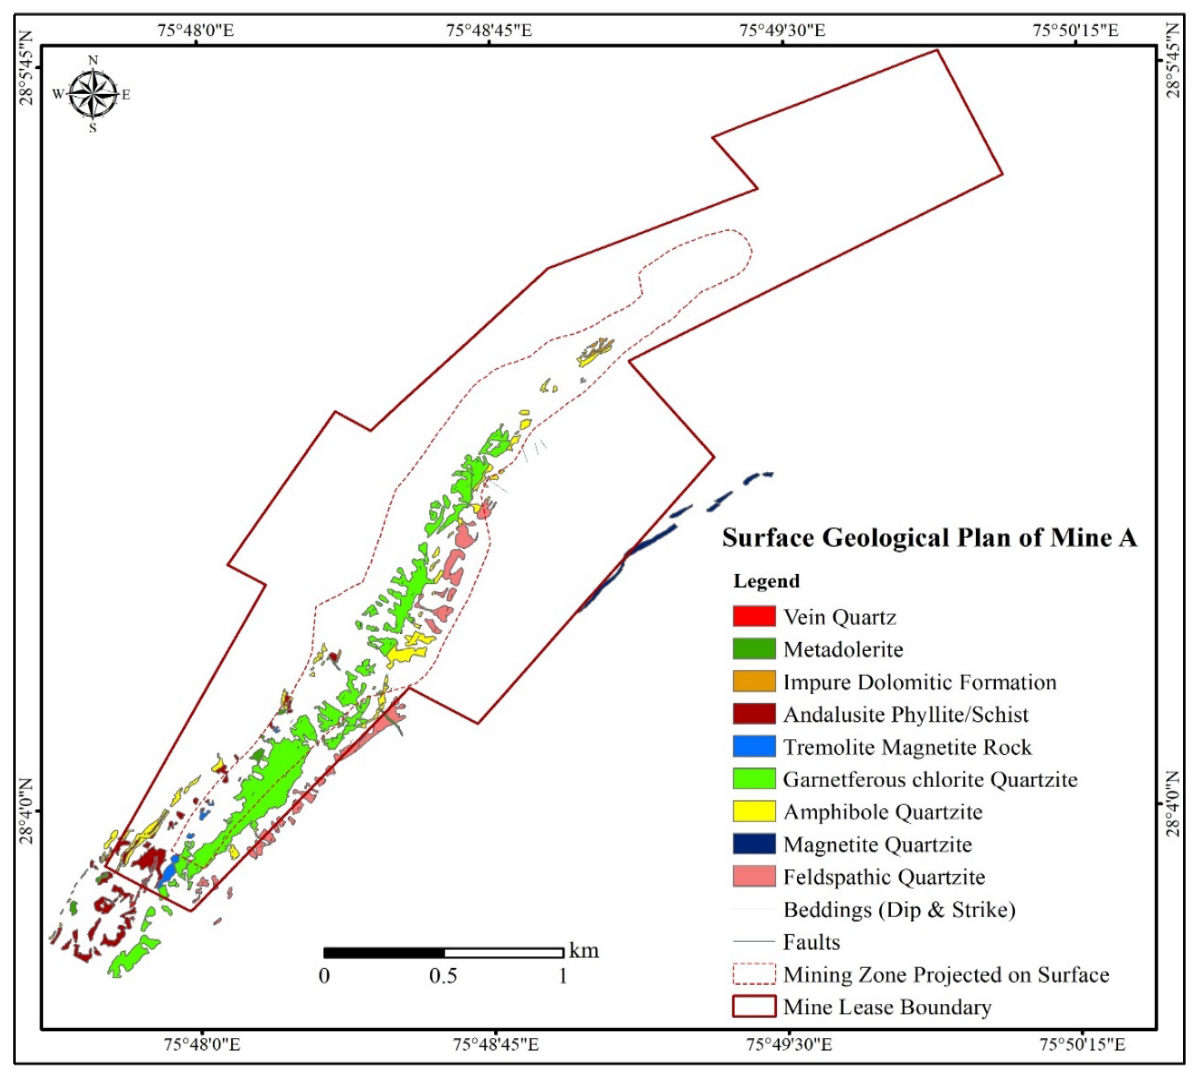
The Mine-A area is underlain chiefly by argillaceous sediments and metamorphosed arenites with intercalated calcareous bands. These sequences are intruded by younger basic bodies and acidic phases, including pegmatite, granite, and quartz veins. The Surface Geological Plan of Mine-A is shown in Figure 3. The principal rock units mapped within and around the lease, listed from the footwall on the east to the hanging wall on the west, comprise feldspathic quartzite; amphibole quartzite with bands of amphibole magnetite rock and amphibole-rich rock; garnet–chlorite–quartzite schist with biotite and amphibole; amphibole magnetite rock; and amphibole-rich rock, andalusite/phyllite schist, and sericite quartzite. A gradational contact is observed between the feldspathic quartzite and the overlying amphibole quartzite sequence.
Figure 3.
Surface geological plan of Mine-A derived from GIS-based software.
Mine-A has been developed over a strike length of approximately 3425 m and has eight levels at a vertical interval of 60 m, namely, 421, 350, 300, 240, 180, 120, 60, and 0 mRL. The upper four levels (421, 350, 300, and 240 mRL) are exhausted and isolated from the active workings. Production is ongoing at the 180, 120, and 60 mRL levels, with mine development continuing at the 180, 120, 60, and 0 mRL levels. The adopted method of extraction is sublevel open stoping, with longitudinal blast hole stoping being the dominant variant, depending upon the ore body geometry. The stoping sequence proceeds from the hanging wall to the footwall, and from top to bottom in the vertical direction.
3. Data and Resources
The numerical subsidence simulation for Mine-A is based on a structure for mine geometry and material behaviour, as well as initial stresses. Level plans/sections and future schedules providing excavation layout, extraction sequence and model boundaries provide direct control for subsidence development (Table 2). The approved mining plan and method of working ensures modelling assumptions are consistent with operational extraction and supporting philosophy. Geological and geotechnical parameters and rock mechanics test reports were used to assign lithology/domain-wise properties and validating inputs like density, E, ν, UCS, tensile strength, cohesion (c) and friction angle (φ) (Table 3). In situ stresses were modelled by depth-dependent SH, Sh and Sv equations to provide the initial stress tensor for realistic deformation and failure response.
Table 2.
Data acquisition for Mine-A subsidence numerical model.
Table 3.
Summary of rock mass mechanical properties for subsidence modelling of Mine-A. Average values are reported per lithological group; individual sample numbers are listed for traceability to laboratory test reports. All mechanical parameters (UCS, E, ν, tensile strength, cohesion c, friction angle φ) are derived directly from laboratory testing of drill core samples.
The in situ stresses considered for numerical modelling as per National Institute of Rock Mechanics (NIRM) reports are as follows:
where SH = major horizontal stress (MPa);
SH = Syy = 1.955 + 0.0327 × Z MPa
Sh = Sxx = 2.557 + 0.0148 × Z MPa
SV = Szz = 1.7278 + 0.0244 × Z MPa
Sh = minor horizontal stress (MPa);
Sv = vertical stress (MPa);
H = depth (m);
x = direction in horizontal plane along the strike of the Ore body;
y = direction in horizontal plane across the strike of the Ore body;
Z = perpendicular to the horizontal plane.
4. Methodology
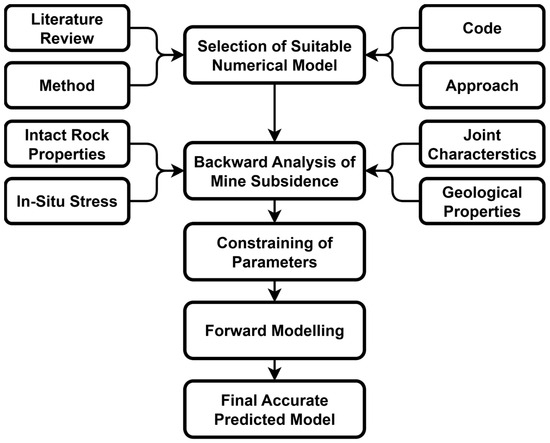
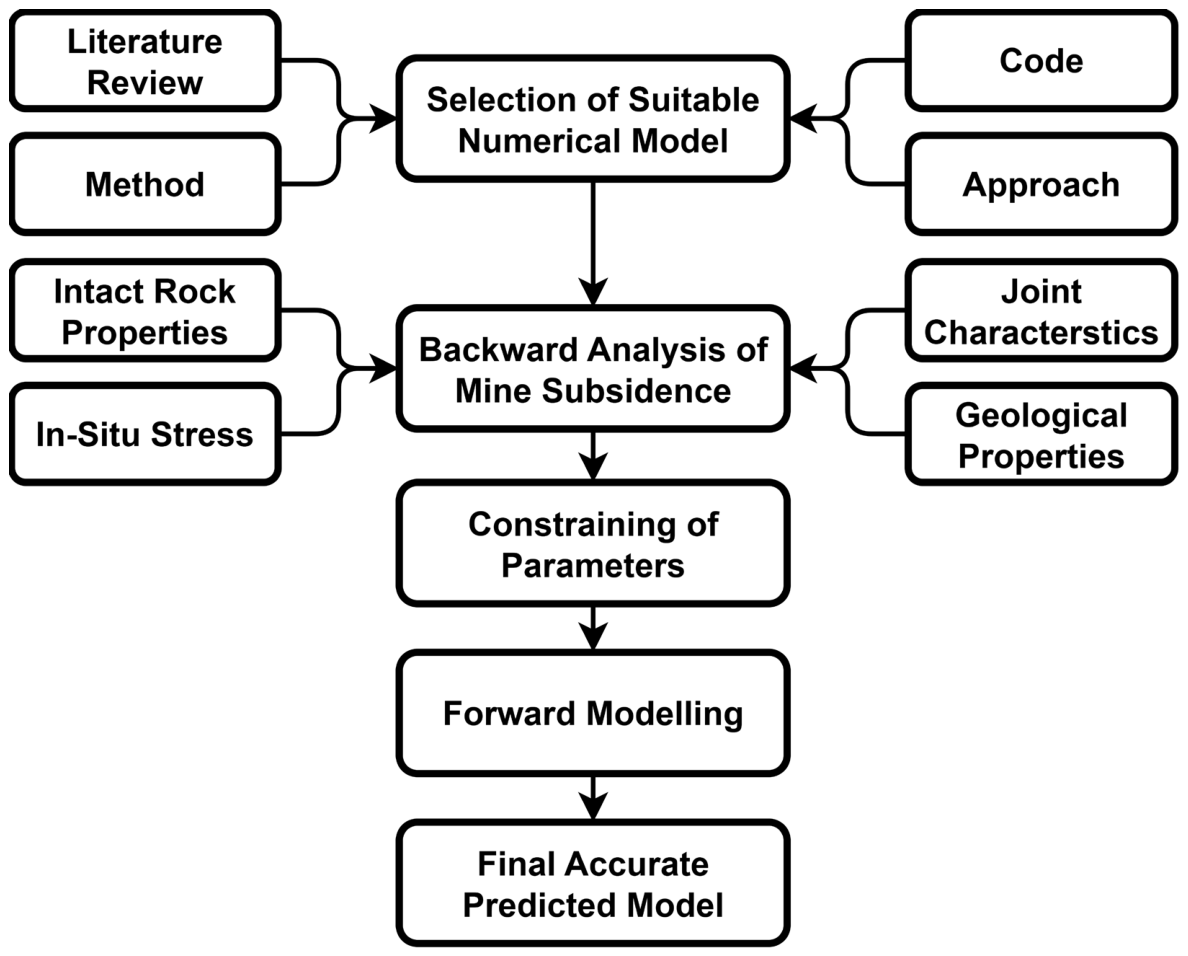
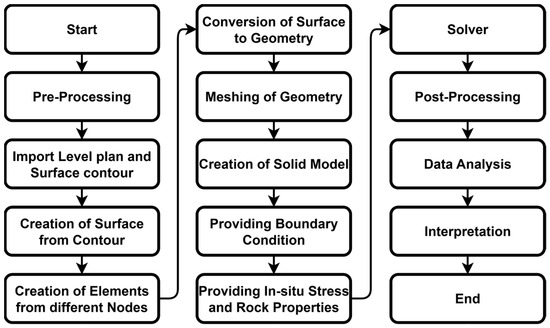
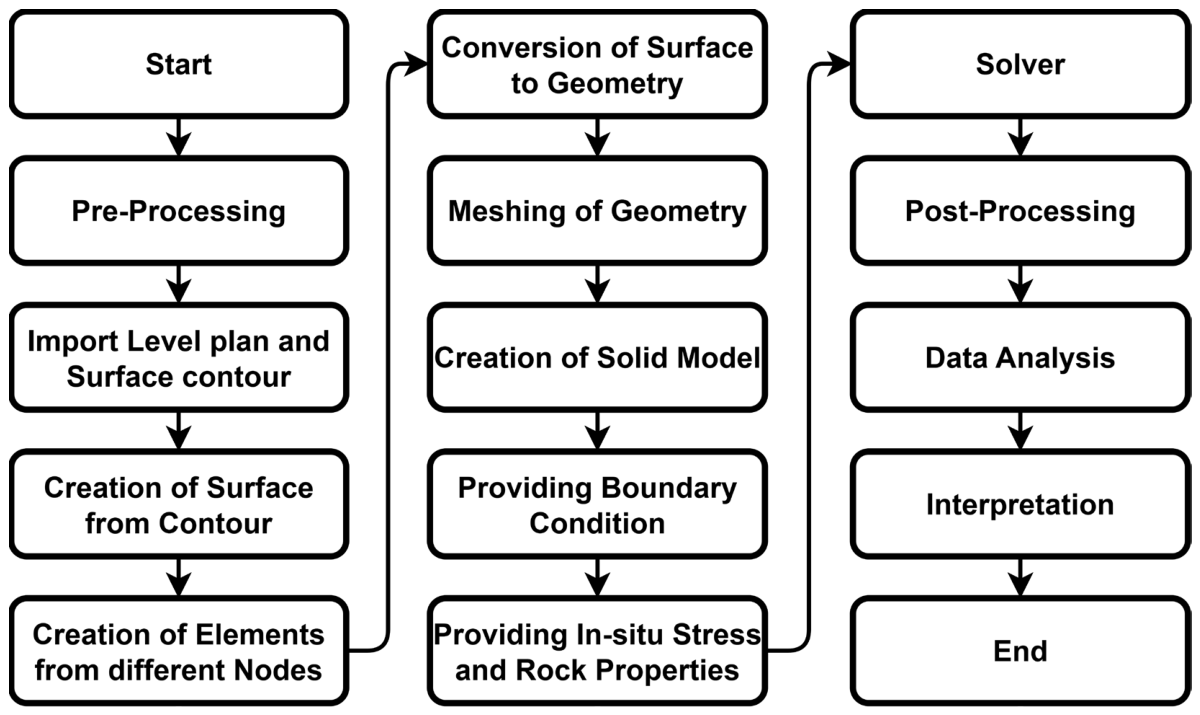
The methodology adopted in this study follows a structured numerical modelling workflow to predict mine subsidence in Mine-A. The 3-D FEM model domain spans approximately 5080 m in the X (E–W) direction, 1400 m in the Y (N–S) direction, and 480 m in the Z (depth) direction, which was sufficient to contain the subsidence influence zone and ensure that the applied boundary conditions do not significantly affect the surface deformation results. It begins with identification of a suitable three-dimensional numerical framework based on the geological, geotechnical, and operational characteristics of the mine. The model was developed using systematic pre-processing (geometry construction, meshing and assignment of boundary conditions, in situ stresses and rock mass properties), solution and post-processing. A backward analysis was used to constrain key parameters using available geotechnical and stress information, and the calibrated model is finally used for forward prediction under existing and future mining scenarios [33,34]. The research methodology followed for subsidence modelling in this study is summarised in the flow diagram presented in Figure 4 and Figure 5.
Figure 4.
Flowchart of the subsidence modelling methodology used in this study.
Figure 5.
Subsidence modelling flowchart for the present case using the suitable 3-D numerical modelling tool.
In the backward-analysis stage, the initial rock mass properties were assigned from available geological, geotechnical, laboratory, and in situ stress data. Parameters with comparatively higher uncertainty were then adjusted iteratively within reasonable engineering bounds derived from the available dataset and published rock mechanics practice. The suitability of the parameter set was assessed by checking whether the resulting deformation distribution was consistent with the known site condition, pre-existing trough geometry, excavation sequence, and the broad tendency indicated by the available monitoring data. Thus, the adopted parameter set was not selected arbitrarily but constrained through iterative engineering back-analysis using available field and geotechnical evidence before being used for forward assessment of the current and future mining stages.
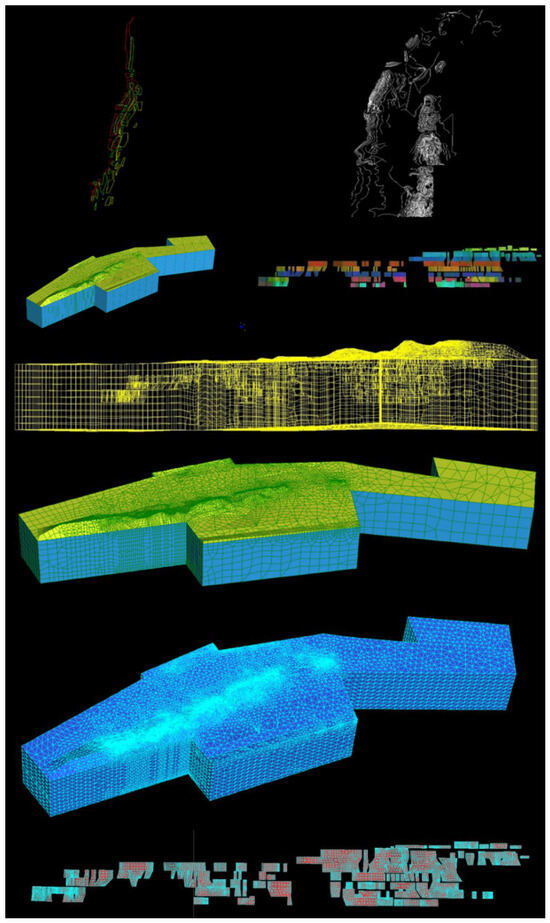
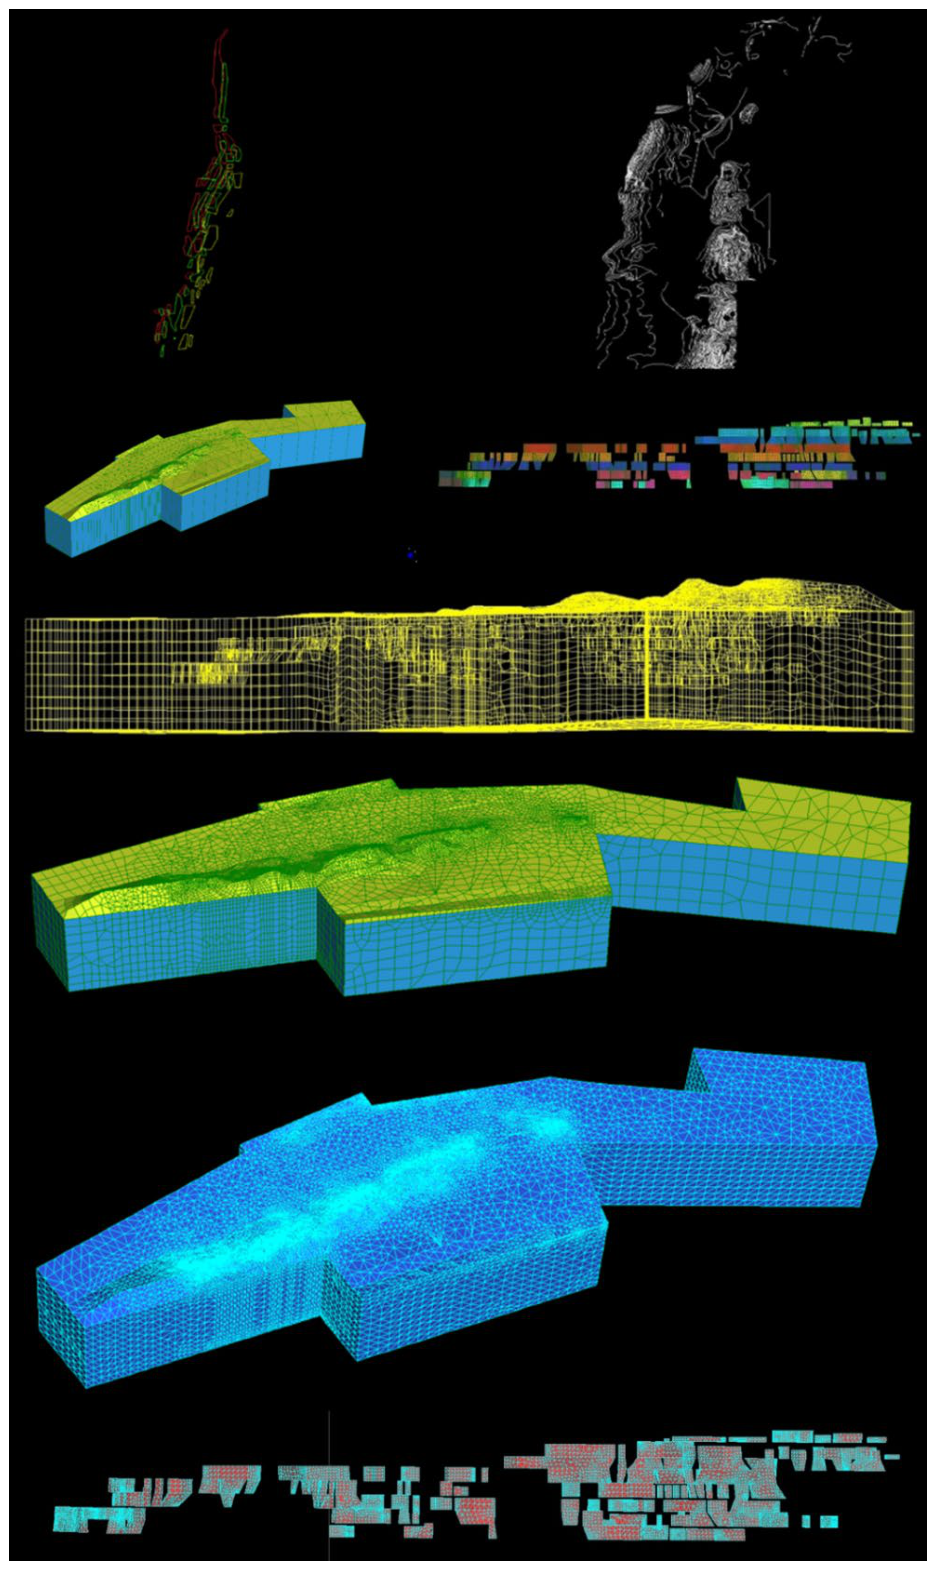
The numerical analysis was performed in Strand7 (version 2.4.6) using a nonlinear static solution scheme. This model had 73,039 nodes, 118 beam elements and 307,869 brick elements. The element size was selected based on the scale of the model domain and the expected deformation gradients, following standard engineering practice for mine-scale continuum FEM analysis. A uniform mesh was adopted throughout the model domain. Nonlinear geometry and nonlinear material behaviour were also taken into account, and geometric stiffness was added to the solution. The rock mass constitutive behaviour was modelled using a Mohr–Coulomb elastoplastic model with a non-associated flow rule; a dilation angle of ψ = 0° was adopted, consistent with conservative engineering practice for jointed metamorphic rock masses. A tension cut-off equal to 10% of the uniaxial compressive strength (UCS) was applied to each lithological unit to prevent unrealistic tensile stress development. The cohesion (c) and friction angle (φ) values used as yield criterion parameters for each domain are listed in Table 3. At each iteration, the global stiffness matrix was updated. An iterative Preconditioned Conjugate Gradient (PCG) solver was used, with a convergence tolerance of 1.0 × 10⁻⁵ and a maximum of 5000 iterations to analyse it. Four load increments were used in the nonlinear static analysis. Figure 6 outlines the key pre-processing flow, comprising data import, geometry correction, meshing, and transformation to the solid numerical model that will be used to perform the deformation analysis. The domain-wise material properties were attributed based on the available geological and geotechnical data. The overall stress field of the mine was reproduced through the application of the boundary conditions and in situ stresses.
Figure 6.
Steps involved in subsidence modelling for the present case using suitable software.
The model was analysed at four mining stages, i.e., virgin, current mining, next 5 years of mining and next 10 years of mining, after the application of the boundary conditions presented in Table 4, assignment of in situ stresses and material properties, and elimination of the volume of pre-existing collapsed subsidence troughs. Surface strain in the XX, YY and ZZ directions and surface displacement in the X, Y and Z directions were then extracted to be compared in terms of their assessment. The near-surface layer was assigned weathered rock conditions over a depth of approximately 5–7.5 m below the ground surface to reflect the comparatively weakened nature of the uppermost rock mass. The compressive strength of the weathered rock layer was taken as 90% of the intact rock strength immediately below the weathered zone, consistent with the approach adopted in the original consultancy report for this site. This simplification is acknowledged as a source of uncertainty in near-surface deformation predictions and is identified as an area for future refinement through improved field characterisation. This simplification was taken as a first-order engineering assumption and is known to be a cause of uncertainty, which needs to be improved in further model validation.
Table 4.
Applied boundary conditions for numerical modelling.
The chosen boundary conditions were intended to reduce rigid-body movement and permit the development of deformation in the model domain due to the redistribution of stresses caused by mining. The normal horizontal directions of the side boundaries were restrained, the bottom boundary fixed in all directions, and the ground surface was kept free, allowing surface deformation to develop naturally in response to excavation.
In the current forward-analysis, it was assumed that no significant new joints or discontinuities would occur during the simulated mining steps, that the mining technique used would remain the same and that the mining of the ore would proceed as per the scheduled future mine development program. It was also assumed that there would be no significant disturbance of groundwater or drainage that would cause a significant change in the mechanical response during the simulated period. Moreover, the mass of surrounding rock was presumed to maintain the generally similar mechanical behaviour over the simulated sequence of extraction in the continuum representation adopted. The assumptions were made in order to permit a first-order comparative evaluation of deformation under staged mining circumstances and are considered acceptable for mine-scale evaluation of relative deformation evolution. To assess the influence of parameter uncertainty on model predictions, a basic sensitivity evaluation was performed by varying the Young’s modulus (E) and cohesion (c) of the dominant lithological unit (hanging wall, 60 ML) by ±20% from the baseline values used in the model. The resulting variation in peak surface displacement was less than ±15%, confirming that the model response is not critically sensitive to moderate uncertainty in these parameters within the range assessed. This provides confidence that the adopted parameter set produces numerically stable and physically reasonable predictions for the purposes of comparative stage-wise deformation assessment. Continued field monitoring remains essential to detect any deviation between actual and predicted ground response and to support future model refinement.
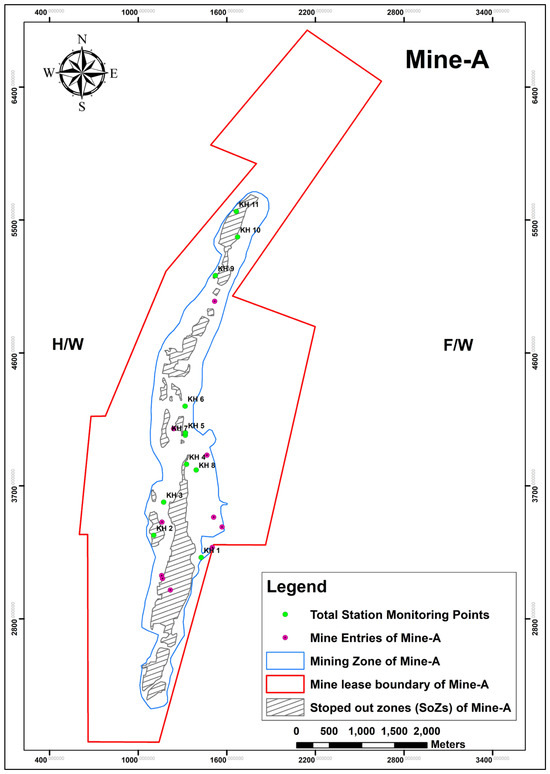
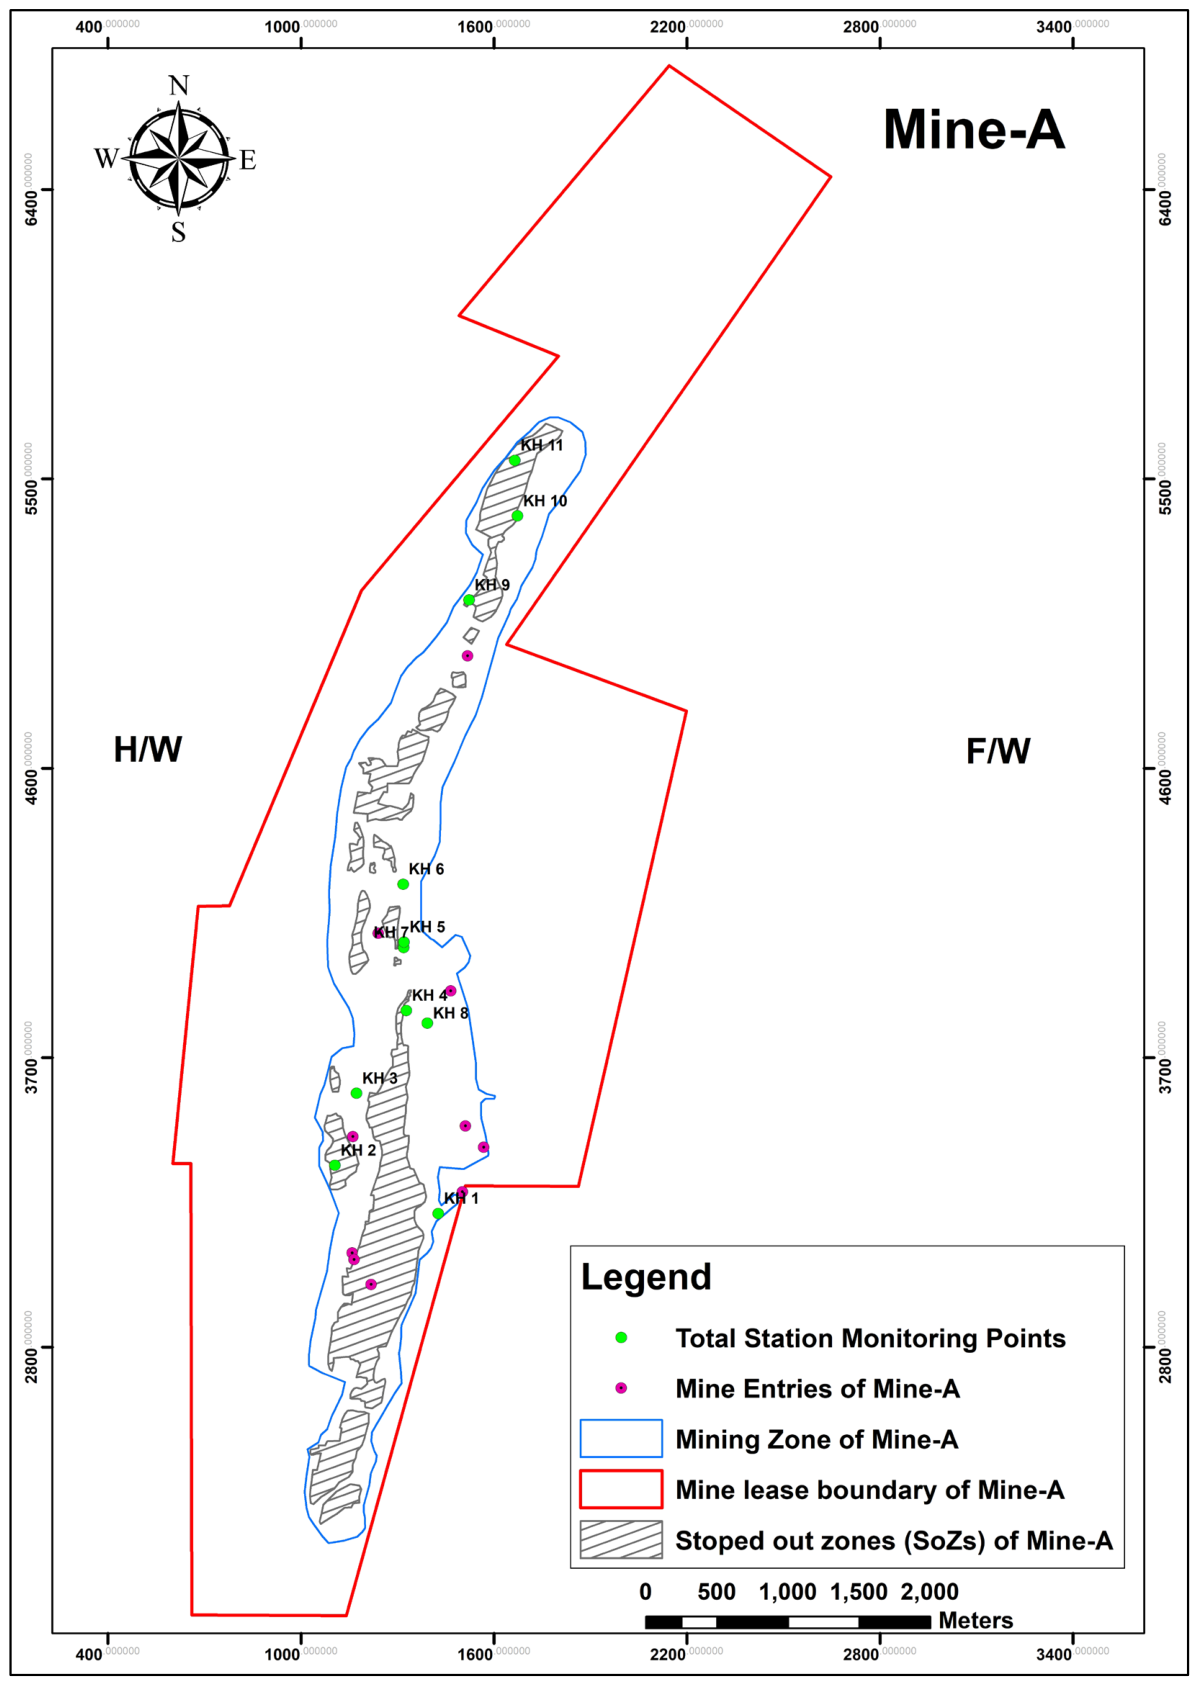
For model validation, surface monitoring data from Total Station monitoring points distributed along the mining zone of Mine-A were compiled and compared with the corresponding FEM-predicted deformation response. The monitoring network comprises eleven stations (KH1-KH11) distributed along the mining corridor and around the stoped-out areas. Cumulative movement in Easting, Northing and Elevation was observed compared to the predicted values of deformation that were obtained in the numerical model following conversion to a common unit system.
5. Results and Discussion
The numerical simulations were conducted to quantify the mining-induced surface response at Mine-A in four scenarios, namely, virgin, current mining, next 5 years and next 10 years, after the volume of pre-existing collapsed subsidence troughs had been excluded. The findings are reported in surface strain in XX (E–W), YY (N–S) and ZZ (vertical) directions and surface movement in X, Y, and Z directions. In addition to reporting deformation magnitudes, the discussion focuses on deformation localisation, stage-wise evolution, engineering implications, and validation against field-monitored Total Station data.
5.1. Results of Obtained Strain in XX (E–W), YY (N–S) and ZZ Direction
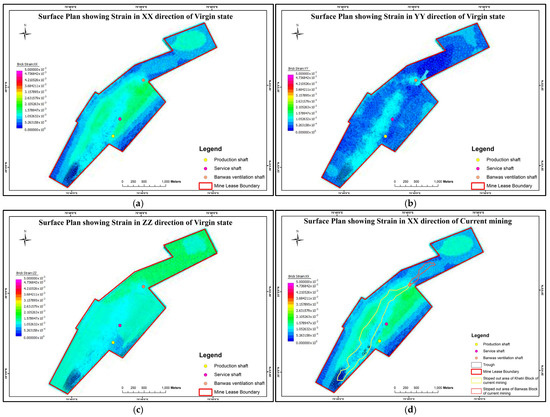
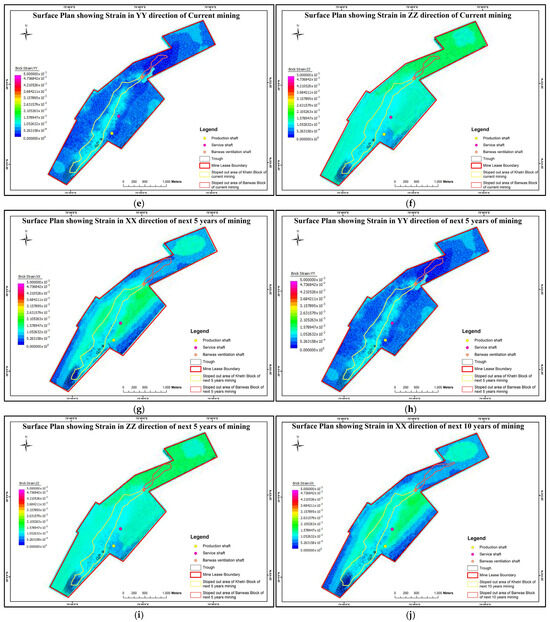
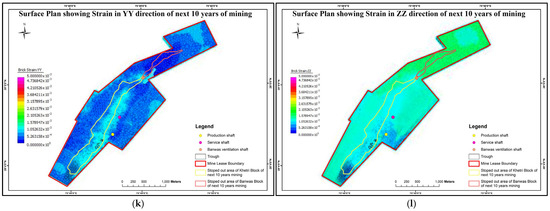
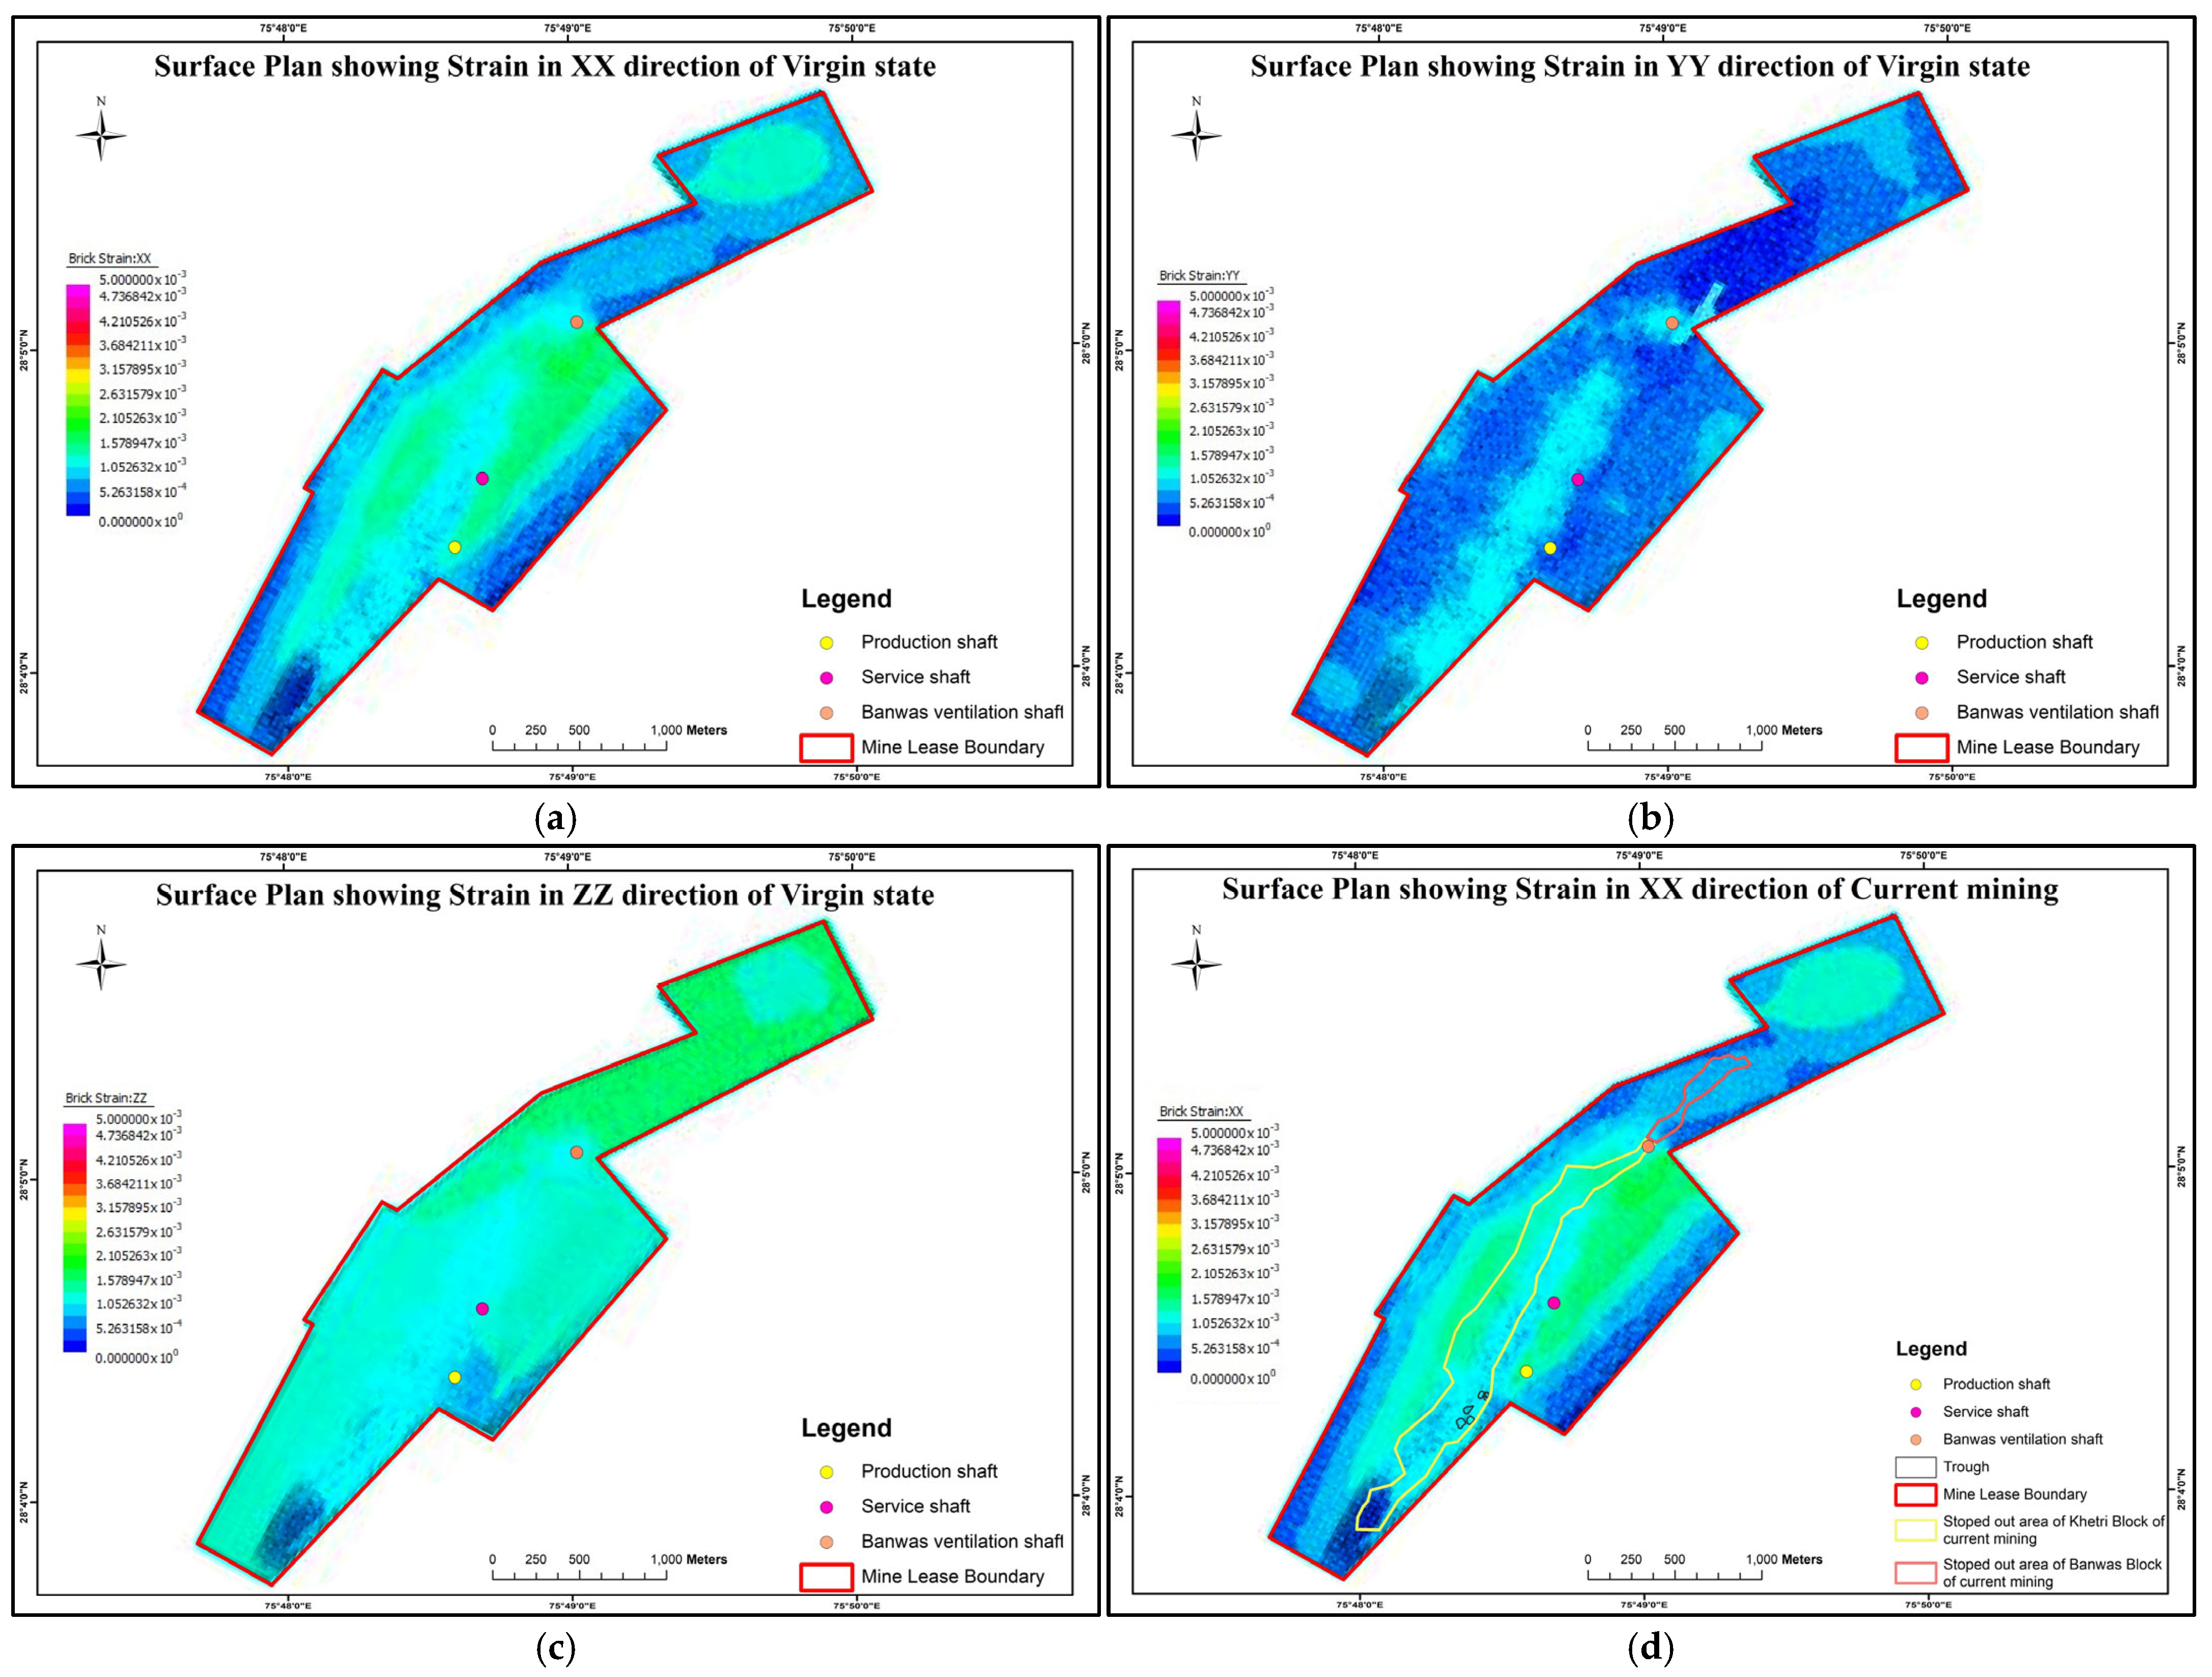
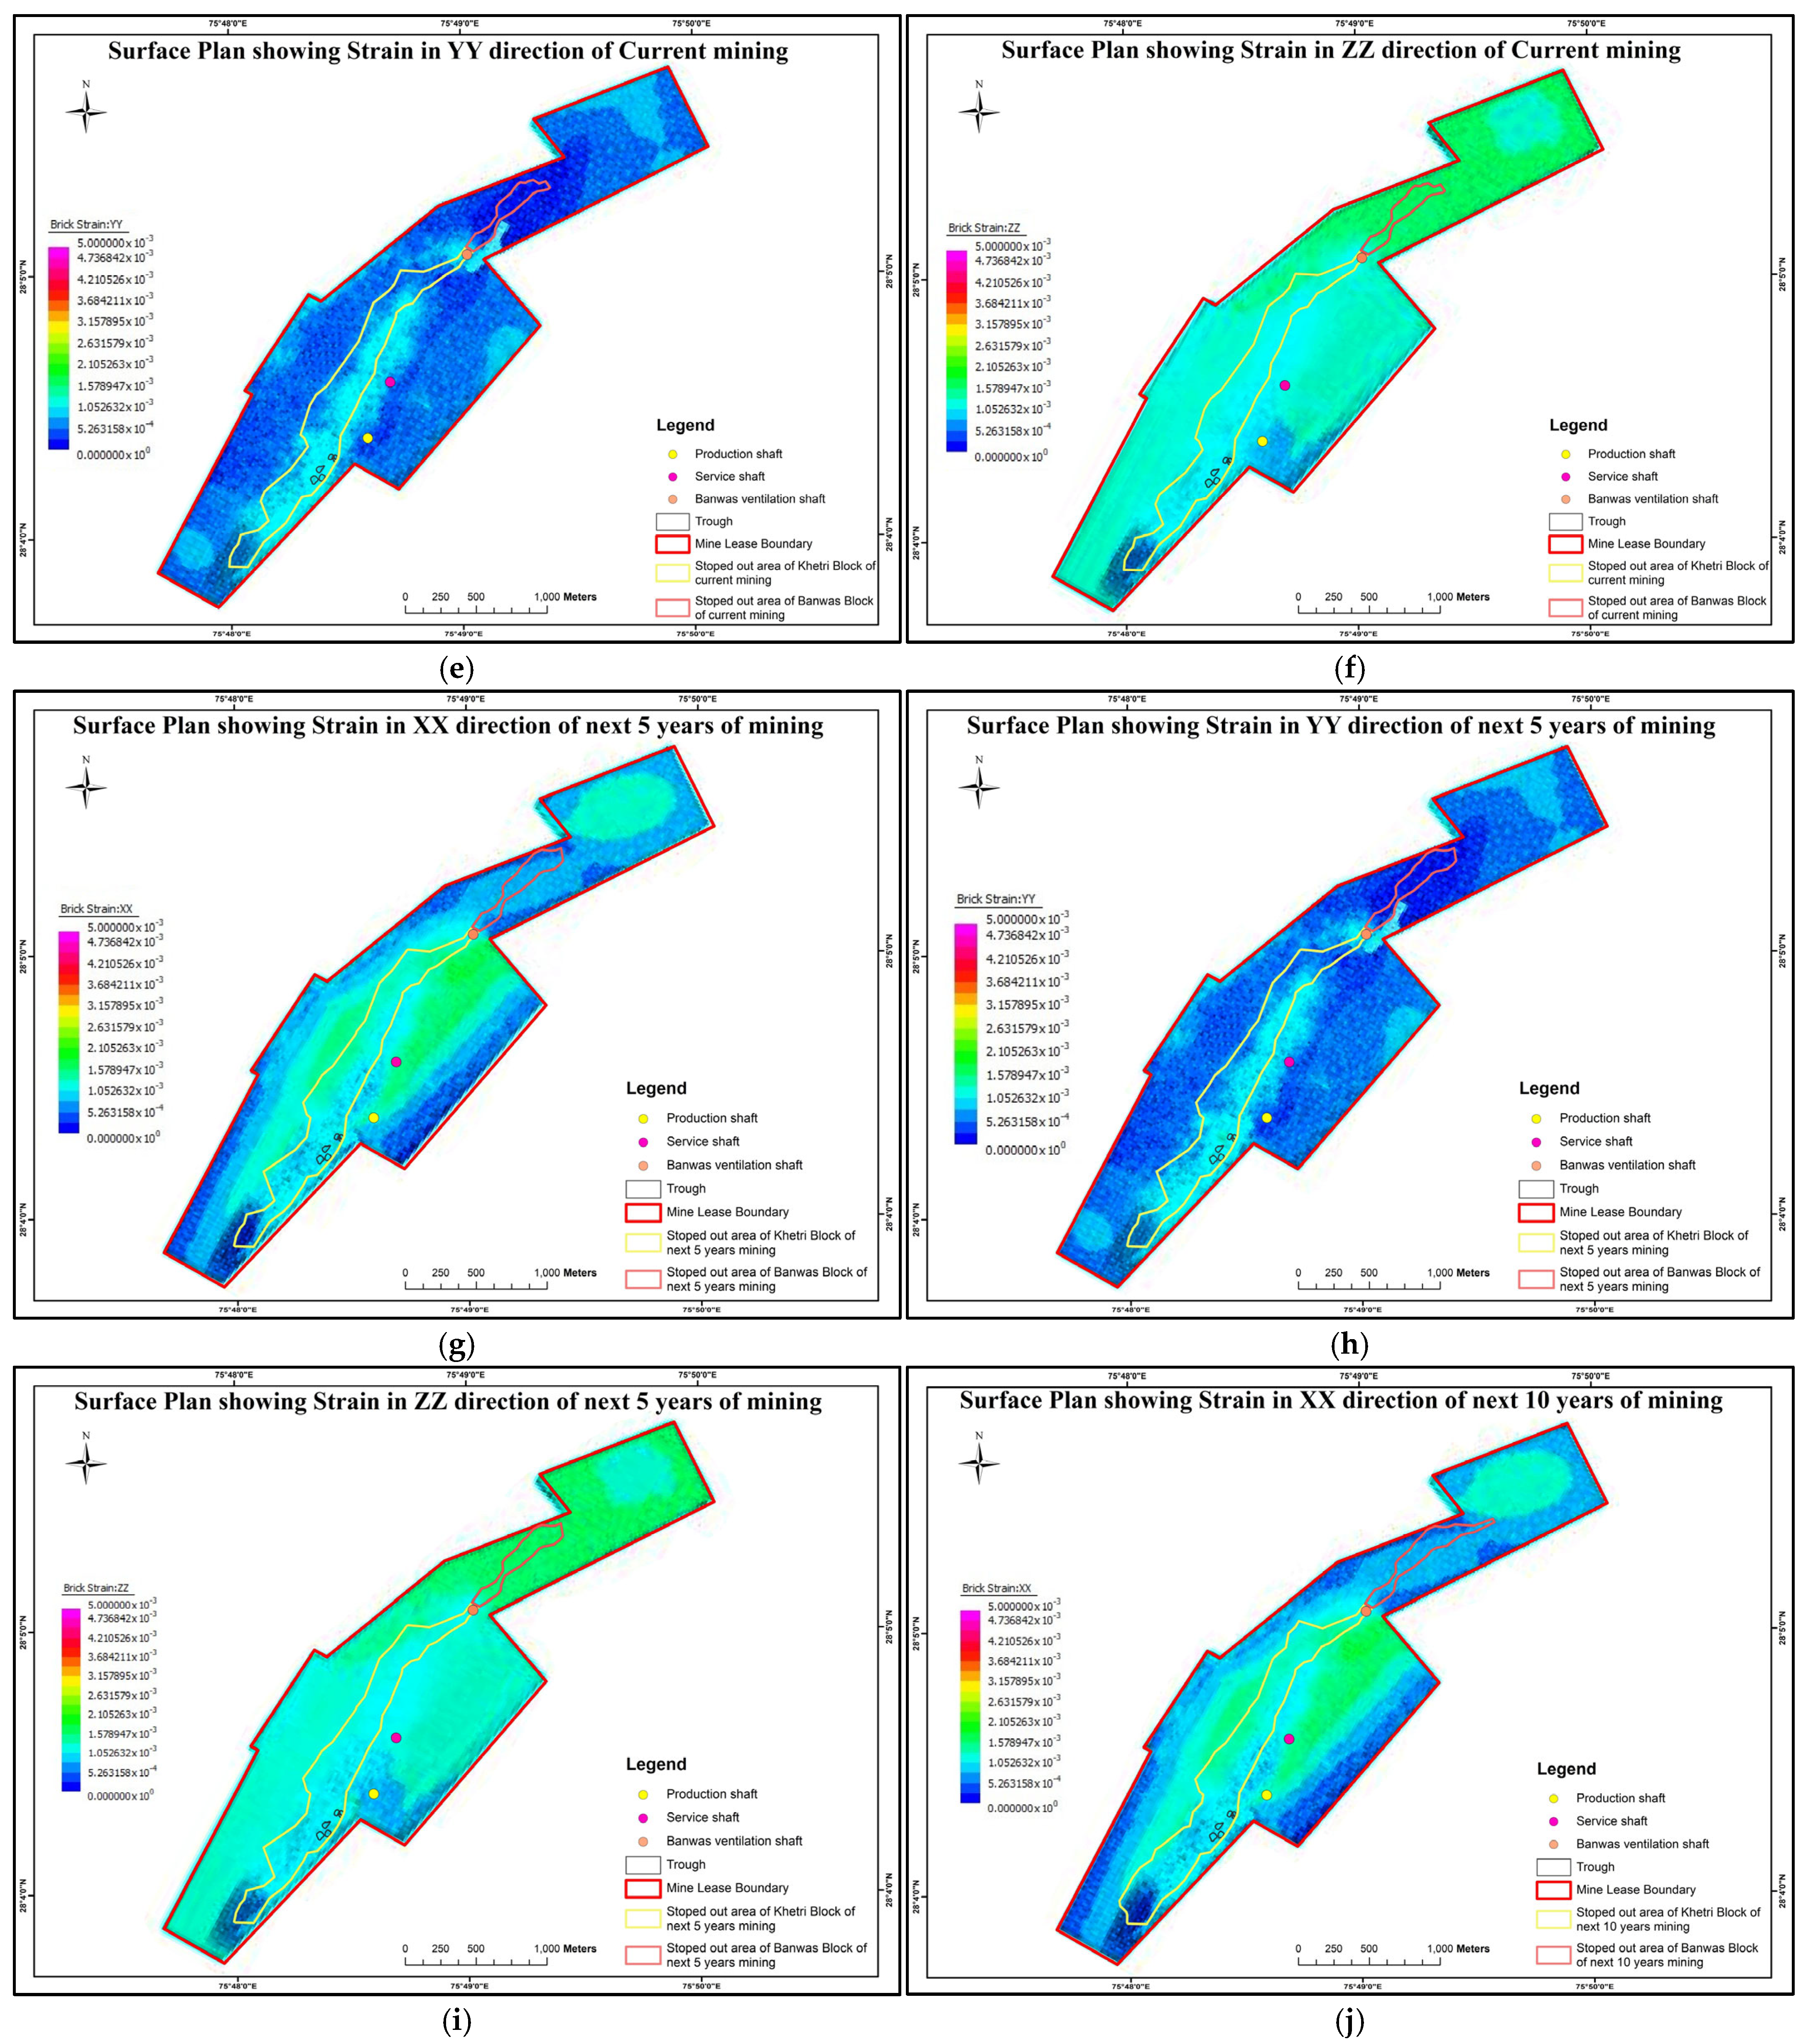
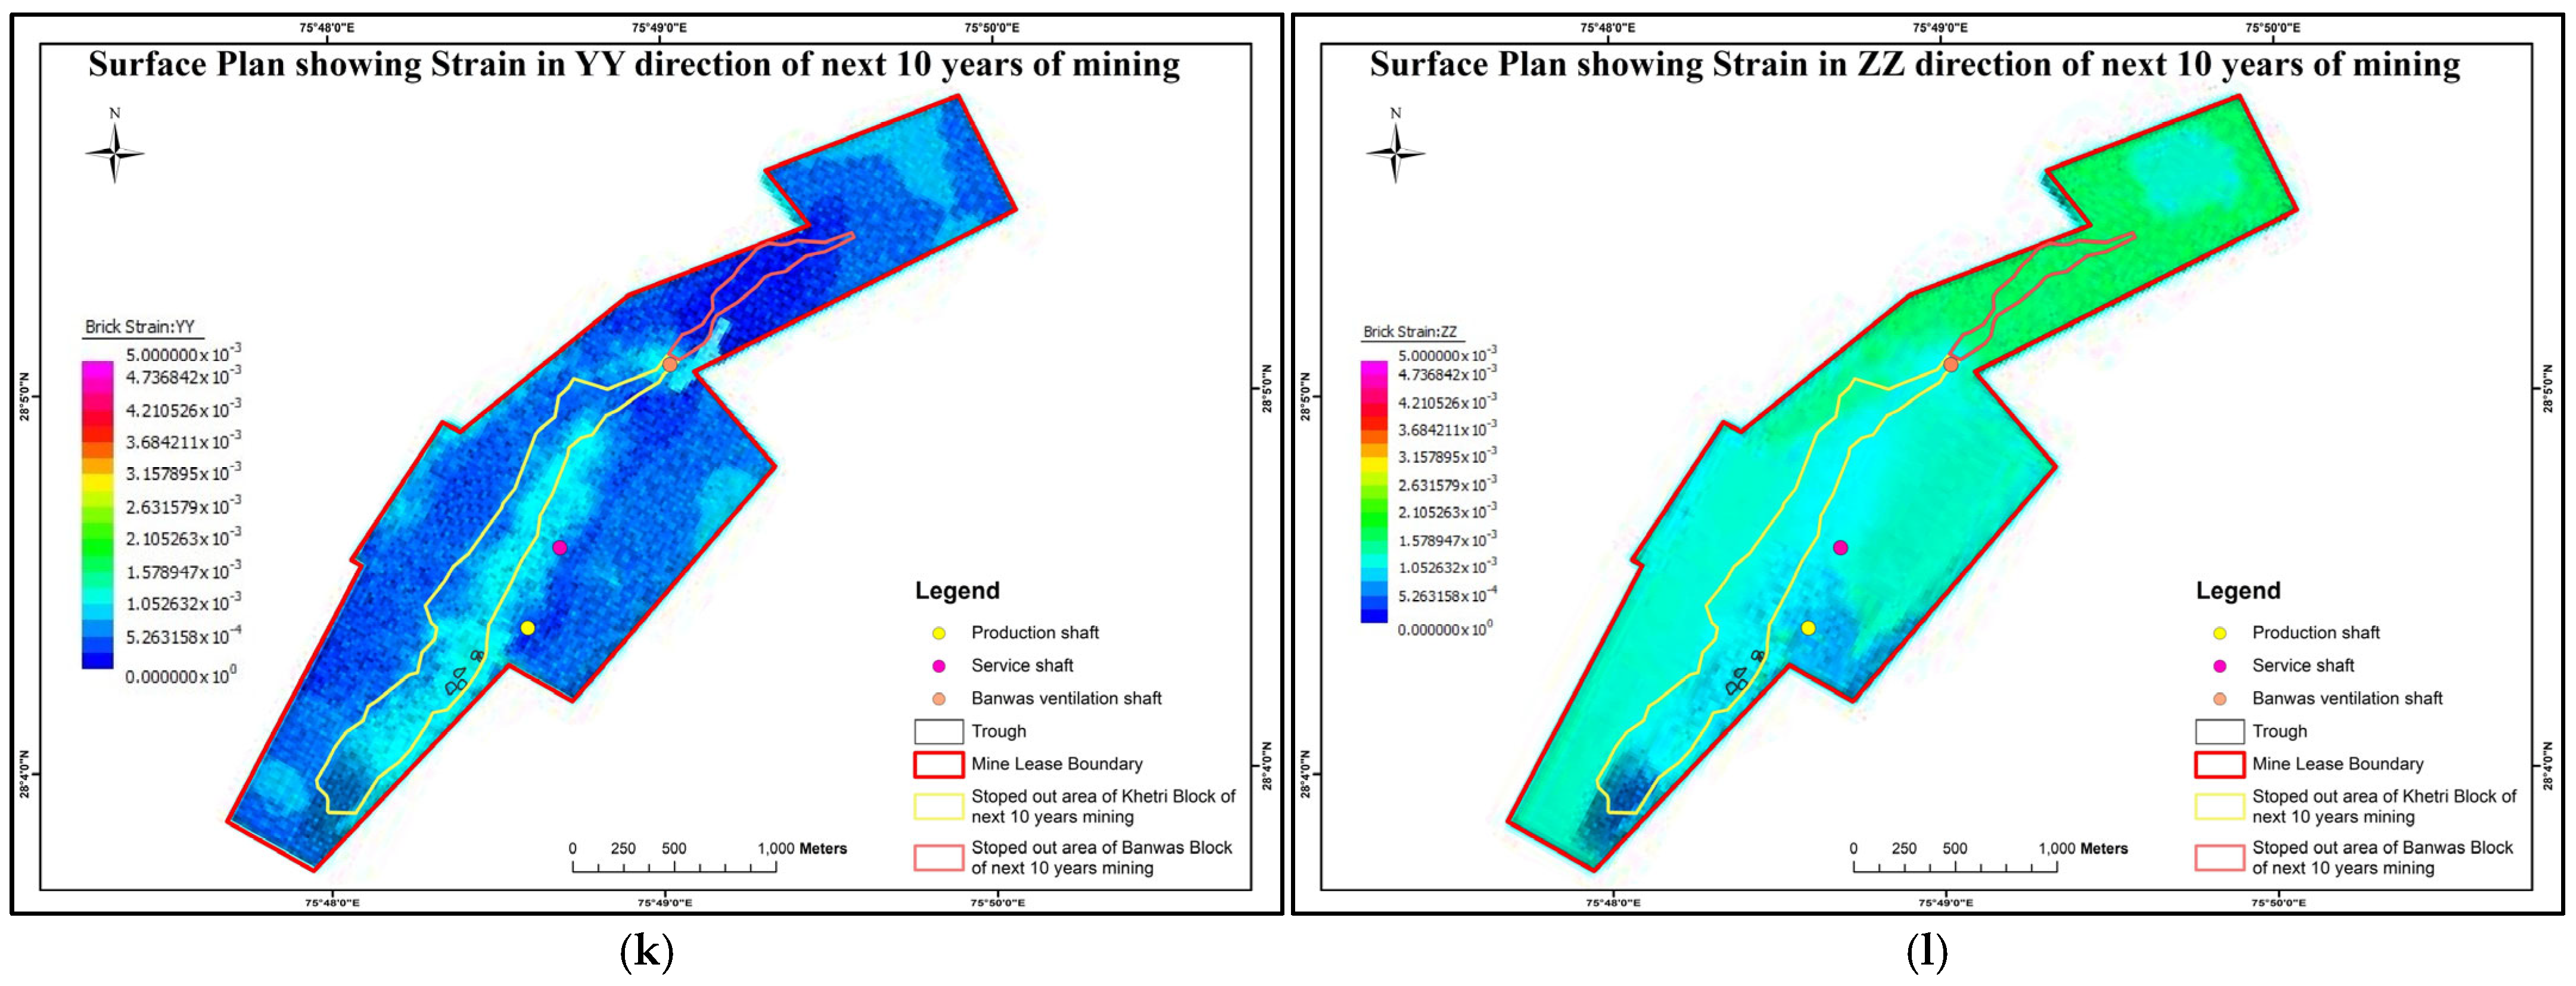
For the mine lease boundary, the strain increment from the virgin to current mining state shows the minimum surface strain increment of 0 mm/m, 0 mm/m, 0 mm/m and the maximum surface strain of 2.41 mm/m, 1.93 mm/m, 2.35 mm/m in the XX, YY and ZZ directions, respectively, as shown in Table 5 and Figure 7 and Figure 8. The strain increment from the virgin to the next 5 years mining state shows the minimum surface strain increment of 0 mm/m, 0 mm/m, 0 mm/m and maximum surface strain of 3.24 mm/m, 2.31 mm/m, 3.54 mm/m in the XX, YY and ZZ directions, respectively. Similarly, the strain increment from the virgin to the next 10 years mining state shows the minimum surface strain increment of 0 mm/m, 0 mm/m, 0 mm/m and the maximum surface strain of 3.24 mm/m, 2.31 mm/m, 3.64 mm/m in the XX, YY and ZZ directions, respectively.
Table 5.
Minimum and maximum strain in XX and YY direction of virgin, current, next 5 years and next 10 years of mining state of Mine-A.
Figure 7.
(a–l): Plan showing surface strain of virgin state, current mining, next 5 years mining and next 10 years mining in XX, YY and ZZ direction. (a): Surface strain in the XX direction for the virgin mining state of Mine-A. (b): Surface strain in the YY direction for the virgin mining state of Mine-A. (c): Surface strain in the ZZ direction for the virgin mining state of Mine-A. (d): Surface strain in the XX direction for the current mining state of Mine-A. (e): Surface strain in the YY direction for the current mining state of Mine-A. (f): Surface strain in the ZZ direction for the current mining state of Mine-A. (g): Surface strain in the XX direction for the next 5 years mining state of Mine-A. (h): Surface strain in the YY direction for the next 5 years mining state of Mine-A. (i): Surface strain in the ZZ direction for the next 5 years mining state of Mine-A. (j): Surface strain in the XX direction for the next 10 years mining state of Mine-A. (k): Surface strain in the YY direction for the next 10 years mining state of Mine-A. (l): Surface strain in the ZZ direction for the next 10 years mining state of Mine-A.
Figure 8.
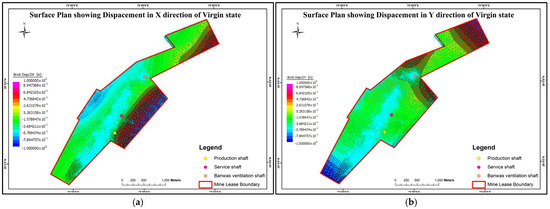
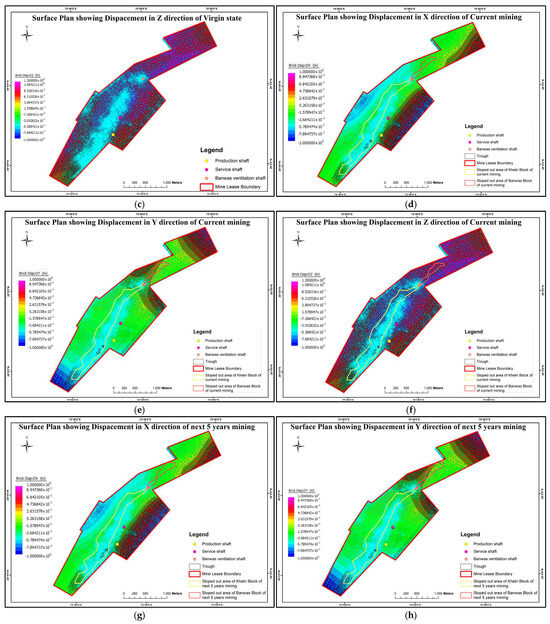
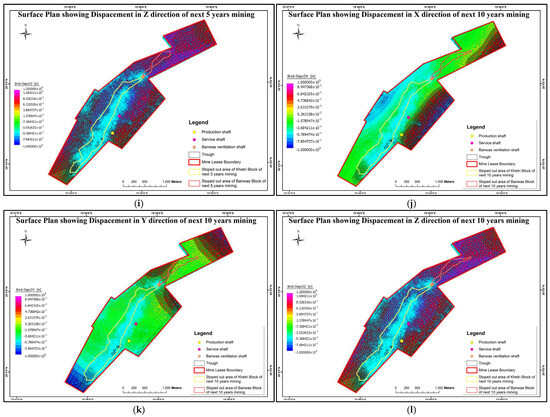
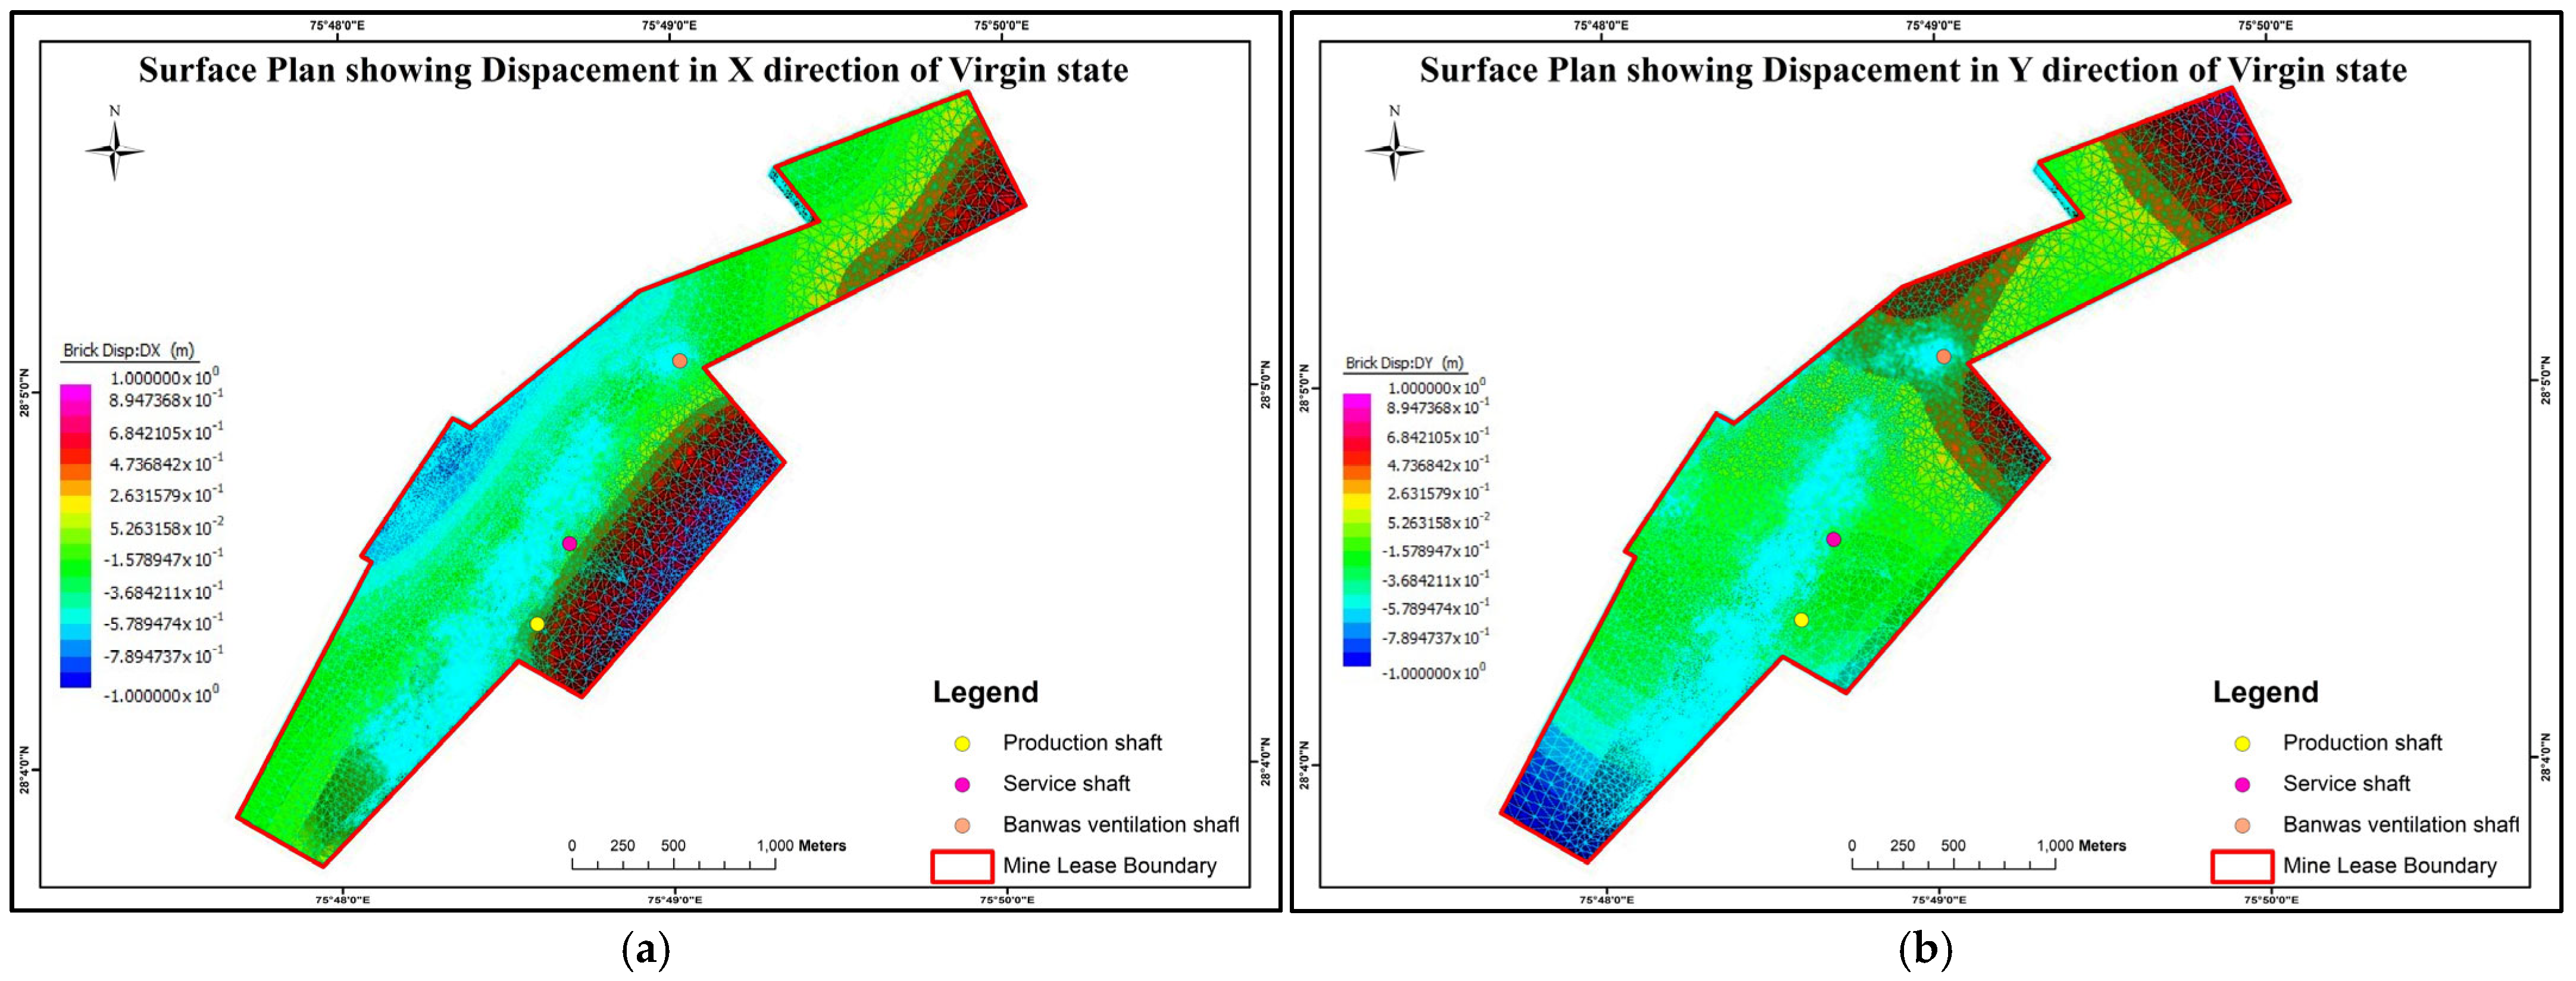
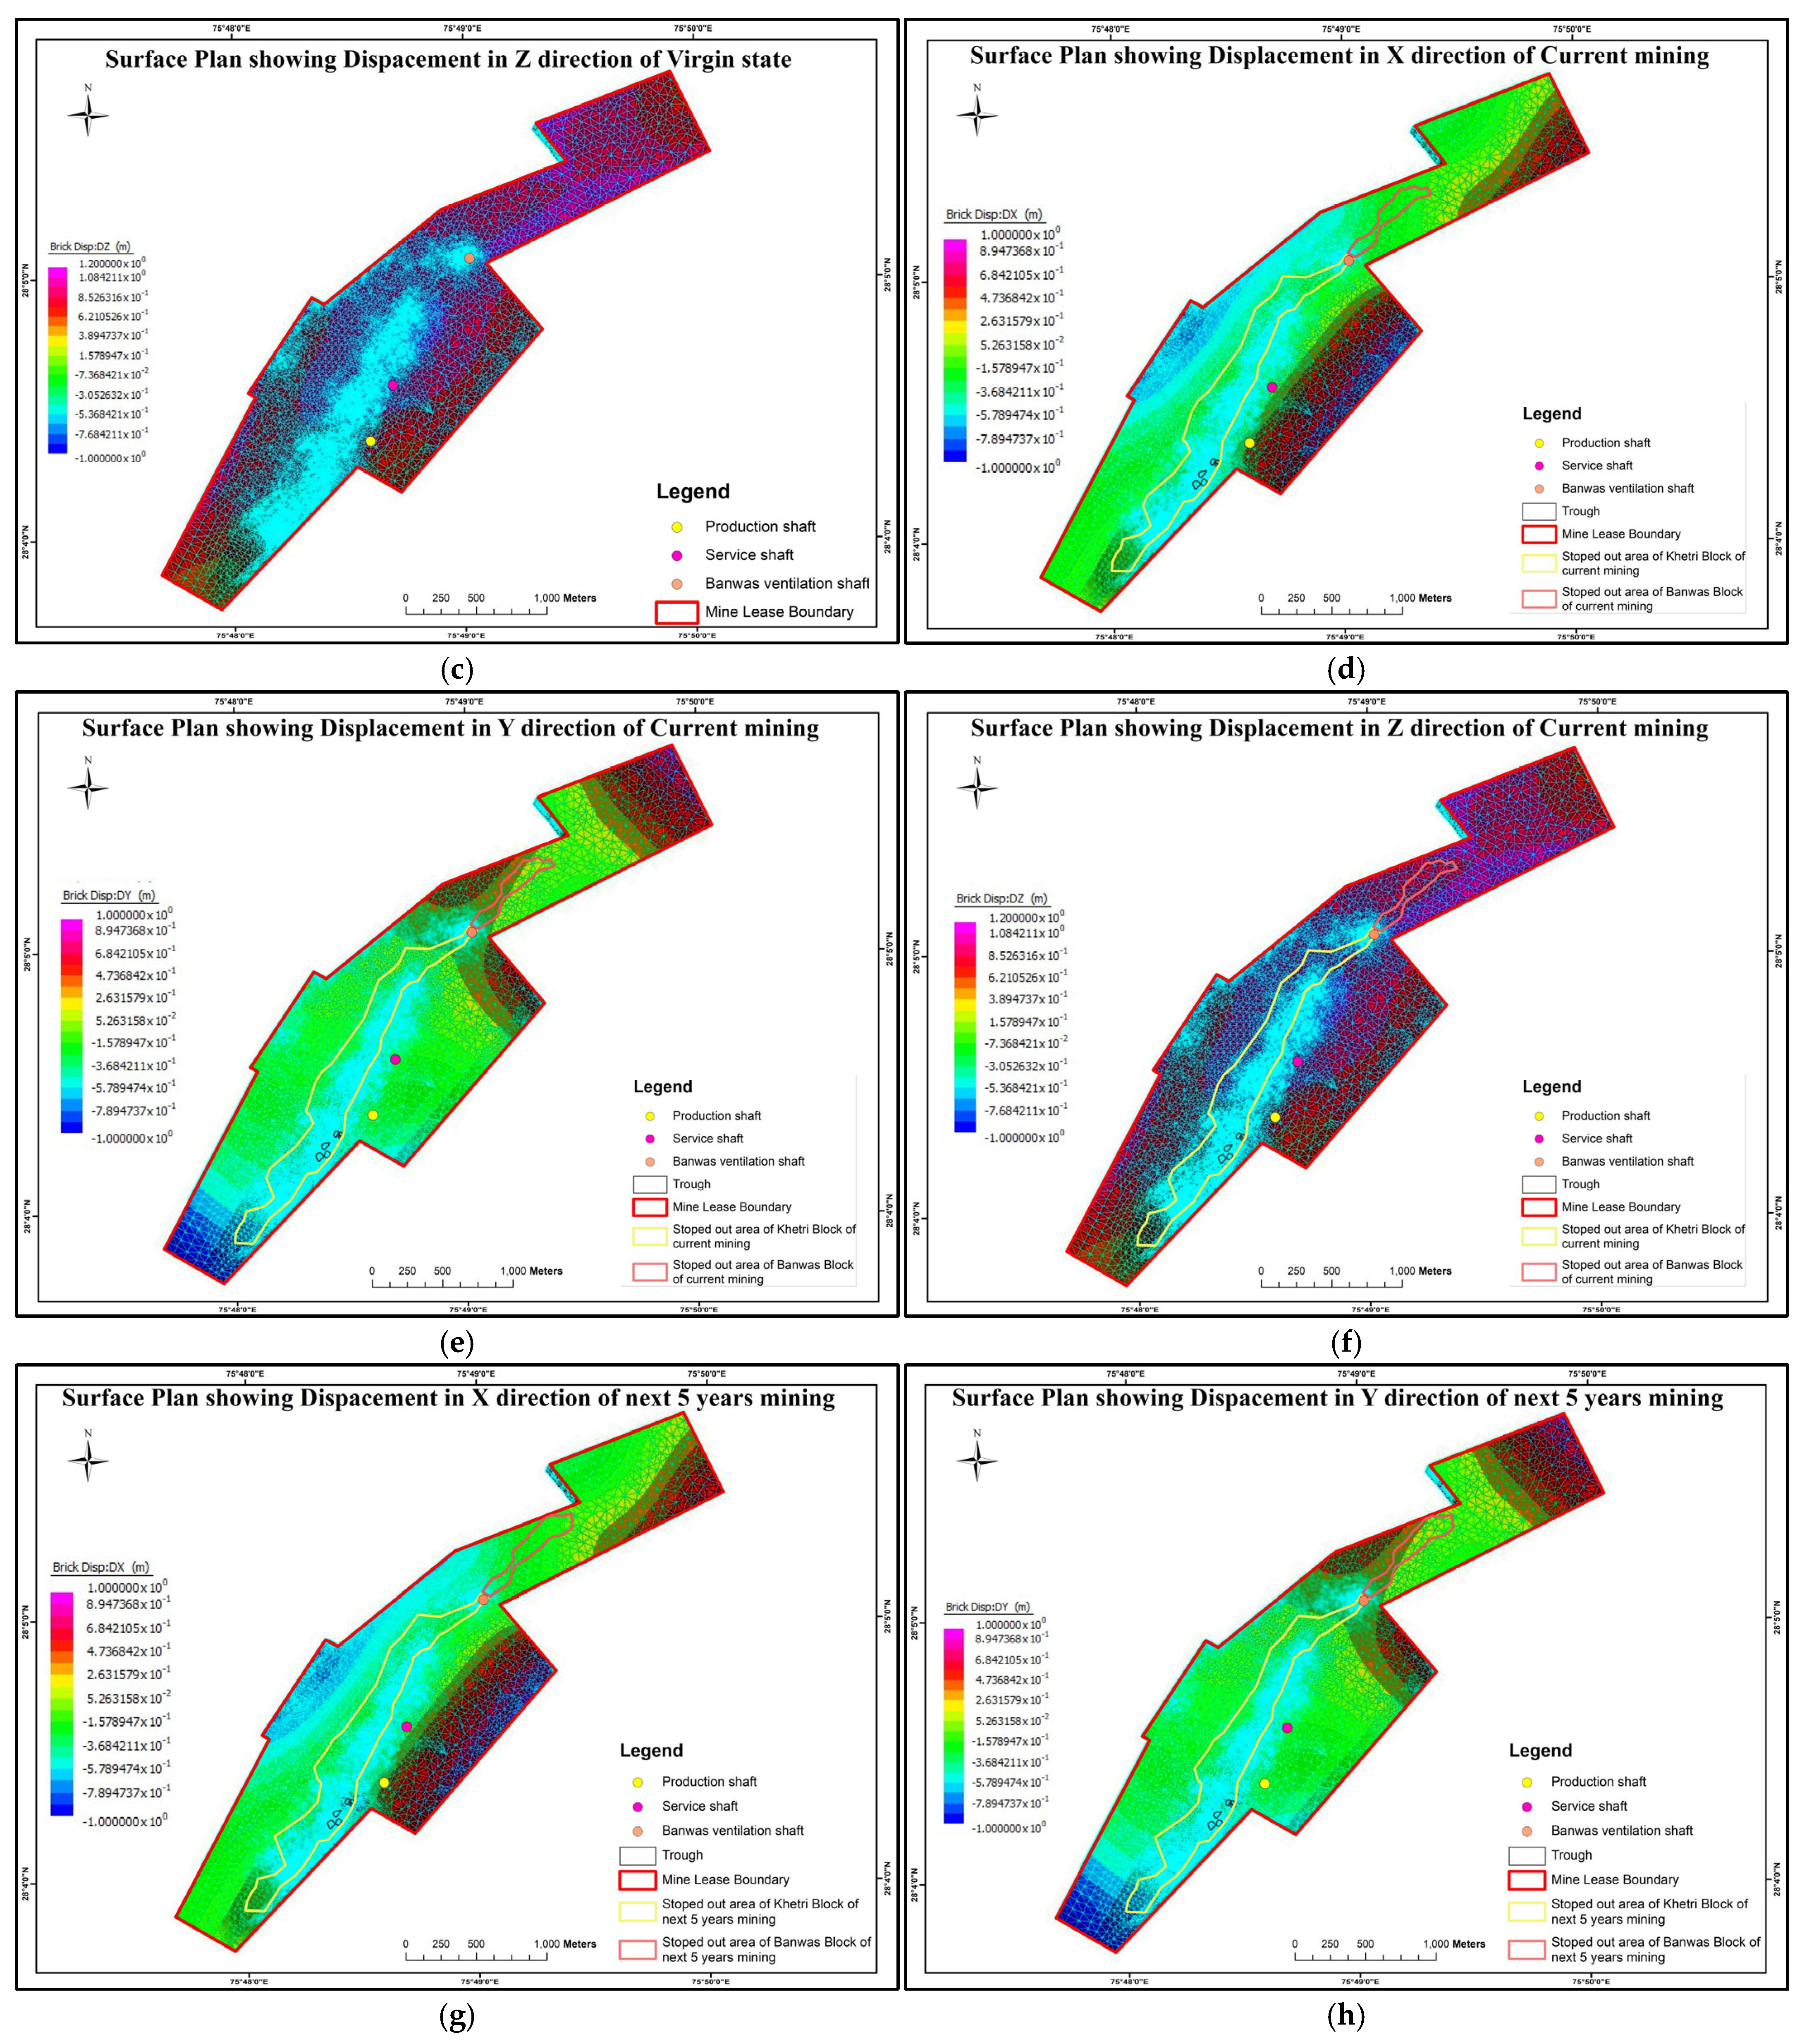
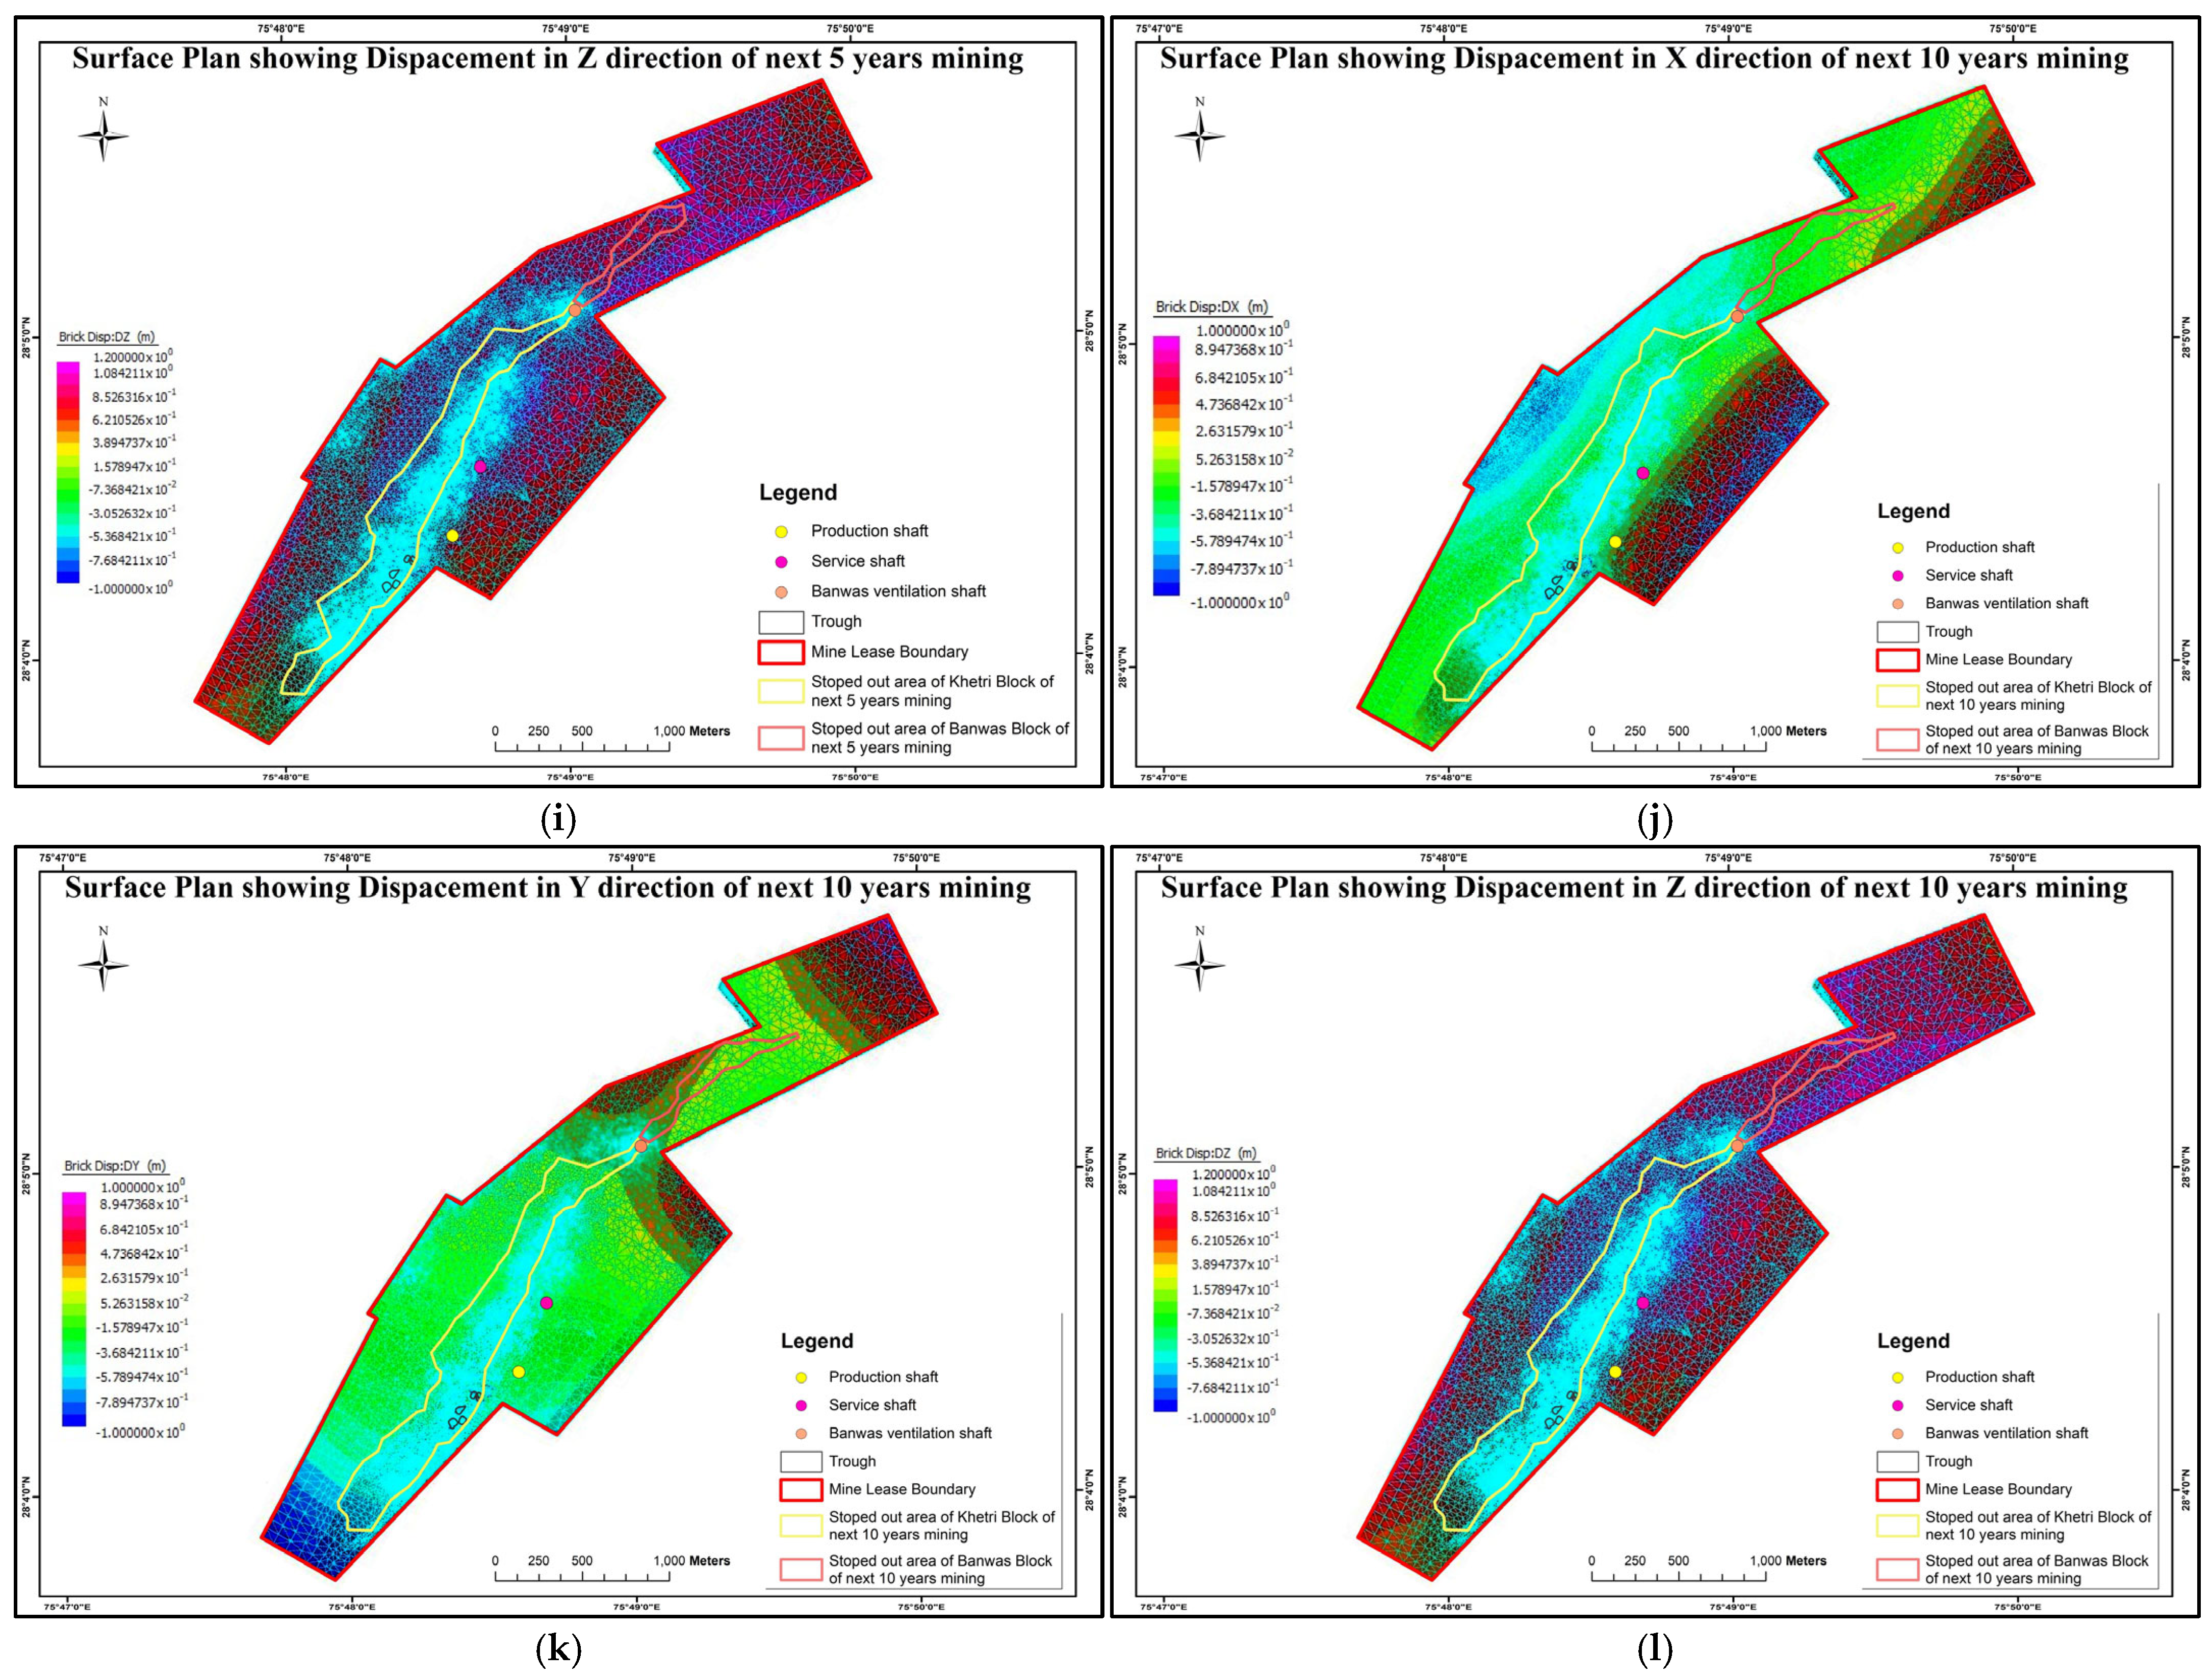
(a–l): Surface displacement distribution in the X, Y, and Z directions for different mining stages of Mine-A. (a): Surface displacement in the X direction for the virgin mining state of Mine-A. (b): Surface displacement in the Y direction for the virgin mining state of Mine-A. (c): Surface displacement in the Z direction for the virgin mining state of Mine-A. (d): Surface displacement in the X direction for the current mining state of Mine-A. (e): Surface displacement in the Y direction for the current mining state of Mine-A. (f): Surface displacement in the Z direction for the current mining state of Mine-A. (g): Surface displacement in the X direction for the next 5 years mining state of Mine-A. (h): Surface displacement in the Y direction for the next 5 years mining state of Mine-A. (i): Surface displacement in the Z direction for the next 5 years mining state of Mine-A. (j): Surface displacement in the X direction for the next 10 years mining state of Mine-A. (k): Surface displacement in the Y direction for the next 10 years mining state of Mine-A. (l): Surface displacement in the Z direction for the next 10 years mining state of Mine-A.
The results of the strain analysis show that the deformation is growing with progressive mining, but the growth is not spatially even. The XX and ZZ components have higher peak values than the YY components, indicating that there is directional variability in the ground response. This behaviour shows that redistribution of strain is dependent on excavation geometry and the arrangement of already disturbed areas and not on uniform regional settlement.
Engineering perspective indicates that the strain level is rising with the future mining stages, and the local ground response can be enhanced in the current mining-affected corridor. The fact that the minimum strain values have increased only slightly, however, demonstrates that the expansion of deformation outside the main disturbed area is relatively limited. From a geomechanical perspective, the observed directional variability in surface strain, where XX (E–W) and ZZ (vertical) components consistently show higher peak values than the YY (N–S) component, can be attributed to the orientation of the ore body and the principal in situ stress field. The ore body at Mine-A strikes in the NE–SW direction, and the major horizontal stress SH acts across the strike (Y direction). As stoping progresses, stress is redistributed around the growing excavation void, with the greatest stress concentration developing in the E–W and vertical directions, consistent with the observed higher XX and ZZ strain magnitudes. The spatial concentration of deformation within the pre-existing disturbed zone, rather than uniform expansion across the lease area, reflects the fact that the already stoped and collapsed regions represent zones of reduced stiffness where incremental mining-induced stress changes preferentially manifest as additional strain.
This behaviour is consistent with the findings of multiple published studies. Similar deformation localisation around existing excavation voids has been reported in a 3-D numerical study of a copper mine [17]. Directionally variable surface movement patterns have also been demonstrated in a hard-rock FEM study at a diamond mine, where such variations were attributed to stress redistribution [18]. Hump-shaped stress concentration in the hanging wall and footwall of a sublevel caving iron mine has been reported, which is consistent with the directional strain asymmetry observed in the present study [22]. Comparable strain concentration patterns have also been attributed to stress redistribution around irregular stoped zones, collectively supporting the geomechanical interpretation presented here [8].
5.2. Results of Obtained Surface Displacement in X, Y and Z Direction
For mine lease boundary, the displacement increments from the virgin to the current mining state show minimum surface displacement increments of 0.001 m, 0.001 m, and 0.001 m and maximum surface displacement of 0.003 m, 0.002 m, and 0.003 m in the X, Y and Z directions, respectively. The displacement increments from the virgin to the next 5 years mining state shows minimum surface displacement increments of 0.001 m, 0.001 m, and 0.001 m and maximum surface displacement of 0.005 m, 0.004 m, and 0.004 m in the X, Y and Z directions, respectively. Similarly, the displacement increments from the virgin to the next 10 years mining state shows minimum surface displacement increments of 0.001 m, 0.001 m, and 0.001 m and surface displacement of 0.005 m, 0.004 m and 0.004 m in the X, Y and Z directions, respectively. Minimum and maximum displacement in the X, Y and Z direction of the virgin, current, next 5 years and next 10 years of the mining state of Mine-A are shown in Table 6. Figure 8 shows the displacement of the virgin state, current mining, next 5 years mining and next 10 years mining in the X, Y and Z direction, along with the mine lease boundary, stoped-out area, service shaft, production shaft ventilation shaft and trough location.
Table 6.
Minimum and maximum displacement in X, Y and Z direction of virgin, current, next 5 years and next 10 years of mining state of Mine-A.
The results of the displacement indicate a gradual increase in the current stage to the future mining stages, but the increase is small, and it is still concentrated in the same general deformation zone. It means that subsequent extraction will be more likely to increase the response to subsidence in the area than to produce a significant outward extension of the deformation footprint. It is important to clarify that the physically meaningful quantity in this study is the incremental displacement, that is, the change in displacement from one mining stage to the next. These incremental values range from 1 to 5 mm across all directions and all mining stages, confirming that the additional ground movement induced by future mining beyond the current state is very small. The surface strains reported in Section 5.1 are computed from the spatial gradients of the displacement field across the model domain at each stage, which can be significant even when absolute incremental displacements are small, because strain depends on differential movement between adjacent points rather than absolute movement magnitude.
The relatively low displacement changes between the 5-year and 10-year cases indicate the propensity towards stabilisation of deformation in the current model. This can be an indication that the prevailing subsidence geometry is already determined by the existing excavation pattern and the reaction of the rock mass around it.
5.3. Model Validation Using Total Station Monitoring Data
To validate the FEM-based deformation assessment, observed surface-movement data from Total Station monitoring points at Mine-A were compared with the corresponding model-predicted deformation response. The monitoring network comprises 11 stations (KH1–KH11) located along the mining zone and around the stoped-out corridor, as shown in Figure 9, thereby providing field-based reference locations for evaluating whether the model reproduces the observed deformation pattern. Surface movement monitoring was carried out using a Leica TS16 total station, which has an angular accuracy of 1″ and a distance measurement accuracy of ±1 mm + 1.5 ppm. Surveys were conducted on a quarterly basis. Cumulative movement in Easting, Northing, and Elevation was recorded at each station over the respective monitoring periods, as indicated in Table 7. The quarterly survey frequency was considered appropriate given the relatively slow rate of deformation predicted by the numerical model and observed in the field.
Figure 9.
Layout of Mine-A showing the mine lease boundary, mining zone, stoped-out zones, mine entries, and Total Station monitoring points (KH1-KH11) used for validation of the FEM-predicted deformation response.
Table 7.
Comparison between observed Total Station monitoring data and FEM-predicted deformation values at monitoring points of Mine-A.
The observed values were taken from cumulative movement in Easting, Northing, and Elevation over the respective monitoring period, while the predicted values were extracted from the FEM validation dataset for the current mining state. Here, “predicted deformation” refers to the displacement response obtained from the FEM model for the corresponding mining stage at the monitoring-point locations. Because the predicted deformation values were originally obtained in metres, they were converted into millimetres before comparison so that both observed and predicted values could be expressed in a common unit system. Figure 9 shows the spatial distribution of the Total Station monitoring points used for validation. This spatial arrangement is suitable for evaluating whether the FEM model reproduces the localisation of deformation predicted for the current mining state.
To provide a more quantitative basis for validation assessment, the relative percentage error between observed and predicted deformation values has been computed for each station and displacement component and is presented in Table 7. The relative error is defined as: Relative Error (%) = |Observed − Predicted|/|Observed| × 100. Where observed values are very small (less than 0.5 mm), relative errors are inherently large and should be interpreted with caution, as small absolute differences produce large percentage values at such low magnitudes. Table 7 shows that the monitored deformation is spatially variable and localised within the mining-influenced corridor rather than being uniform across the entire lease area. Stations such as KH3, KH4, KH8, KH10, and KH11 exhibit comparatively larger cumulative movement, whereas stations such as KH2 and KH5 show lower displacement. The FEM results reproduce the same broad tendency of deformation concentration within the mined and already disturbed zone, indicating that the numerical model captures the relative spatial pattern of surface response. However, differences remain between the observed and predicted magnitudes at individual monitoring points.
Table 8 provides the summary statistics of the validation error, giving a quantitative foundation to assess the performance of the model against field-observed Total Station data. In the case of Easting displacement, the mean absolute error (MAE) is 0.293 mm and the root mean square error (RMSE) is 0.424 mm, with a bias of −0.101 mm indicating a very slight tendency to overpredict eastward movement. In the case of Northing displacement, the MAE and RMSE are 0.323 mm and 0.426 mm, respectively, with a bias of −0.132 mm. In the vertical component, the MAE is 0.298 mm and the RMSE is 0.412 mm, with a near-zero bias of 0.078 mm, indicating no systematic tendency to overpredict or underpredict vertical movement. The horizontal displacement magnitude shows an MAE of 0.725 mm and RMSE of 1.035 mm, with a bias of −0.010 mm. All MAE values are below 0.73 mm and all RMSE values are below 1.04 mm across all displacement components, which represents a good level of agreement for a mine-scale continuum FEM model given the inherent simplifications in geometry representation, parameter assignment, and the continuum assumption. The relative errors at individual stations (Table 7) are all below 37%, further confirming the model’s ability to reproduce the spatial pattern of deformation within the mining-influenced corridor. This quantitative comparison directly supports the practical credibility of the numerical model for stage-wise subsidence assessment at Mine-A.
Table 8.
Summary validation metrics between observed Total Station monitoring data and FEM-predicted deformation values.
The present findings are broadly consistent with published numerical subsidence studies at comparable underground metal mines, and together these studies establish a coherent pattern of deformation behaviour in hard-rock mining environments. Continuum numerical modelling with field-calibrated parameters has been shown to reproduce the spatial pattern of observed surface deformation at the Wutong mine, with deformation remaining concentrated around existing excavations under progressive extraction [17]. Comparable localisation behaviour has also been reported at the Diavik diamond mine using a 3-D elastoplastic FEM, where predicted surface movements agreed well with field monitoring data, achieving an average relative error of approximately 8%, and deformation was concentrated within the mining-influenced zone rather than being uniformly distributed [18].
Integrated 3-D numerical modelling and InSAR monitoring at a block caving mine have further demonstrated that deformation tends to localise within the mining-influenced corridor, with limited outward propagation under progressive extraction, directly consistent with the present findings [7]. Similar behaviour has also been confirmed through 3-D discontinuum modelling of an underground iron mine in China, where surface deformation remained spatially concentrated around the stoped-out zone under staged extraction [8]. Subsidence and stress changes have likewise been found to concentrate around the caving zone in a sublevel caving mine, with stress increases developing in both the hanging wall and footwall [22].
Numerical simulation has also shown that deformation patterns are governed by excavation geometry and rock mass properties rather than by uniform areal settlement [20]. Combined FDM modelling and InSAR monitoring have demonstrated that ground movement in structurally complex mining settings can be effectively characterised by integrating numerical prediction with field-based validation, which is the same integrated approach adopted in the present study [21]. The collective evidence from these studies, conducted across different continents, mining methods, geological settings, and numerical approaches, consistently supports the central geomechanical conclusion of the present study: in underground metal mines with pre-existing disturbed zones, future mining intensifies deformation within the already disturbed corridor rather than expanding the subsidence footprint outward significantly. This convergence across independent studies strengthens confidence in the present model predictions and supports the practical applicability of the validated modelling framework for subsidence assessment in structurally complex hard-rock mining environments.
From an engineering perspective, the validation outcomes confirm the applicability of the model to detecting deformation-prone regions, which need more intensive ground monitoring and management attention. Specifically, the localisation of movement in the mined and already disturbed corridor suggests that the priorities of monitoring and mitigation activities should be prioritised around stoped-out areas, trough edges, and regions of known surface instability. Therefore, the model is useful not only for numerical prediction, but also for informing field-monitoring strategy and risk-based management of subsidence.
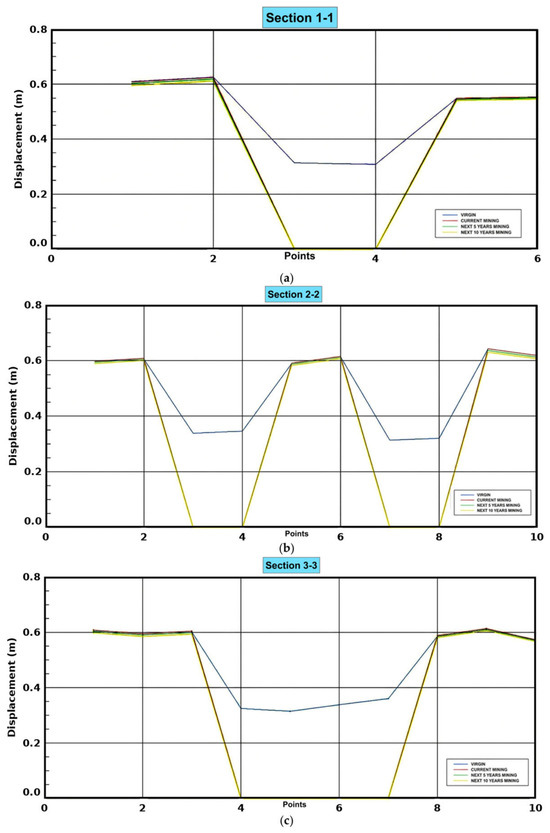
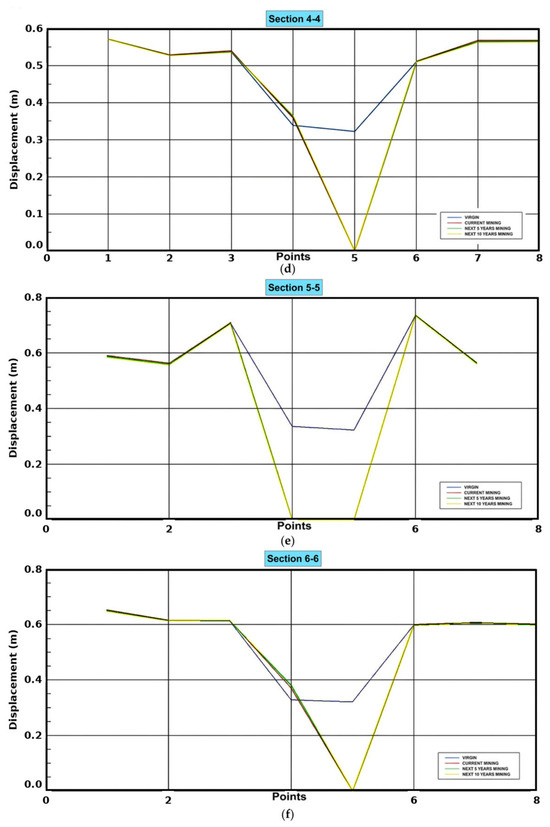
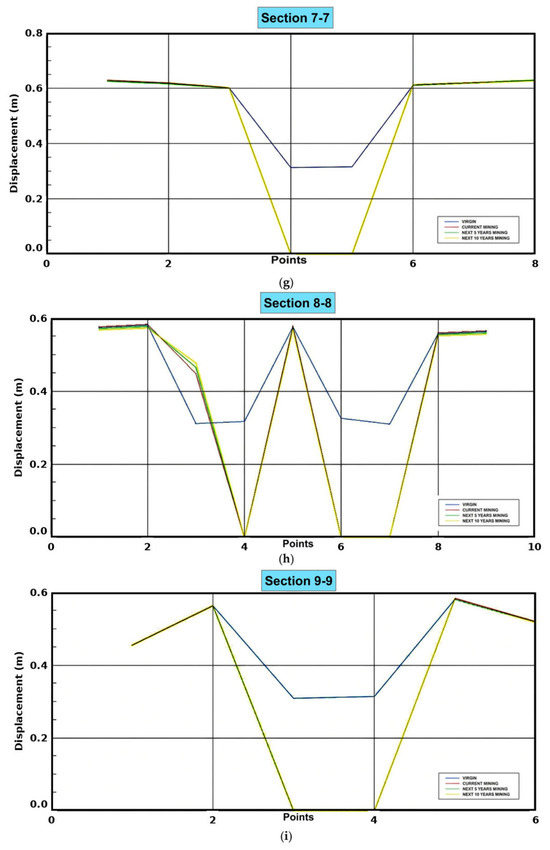
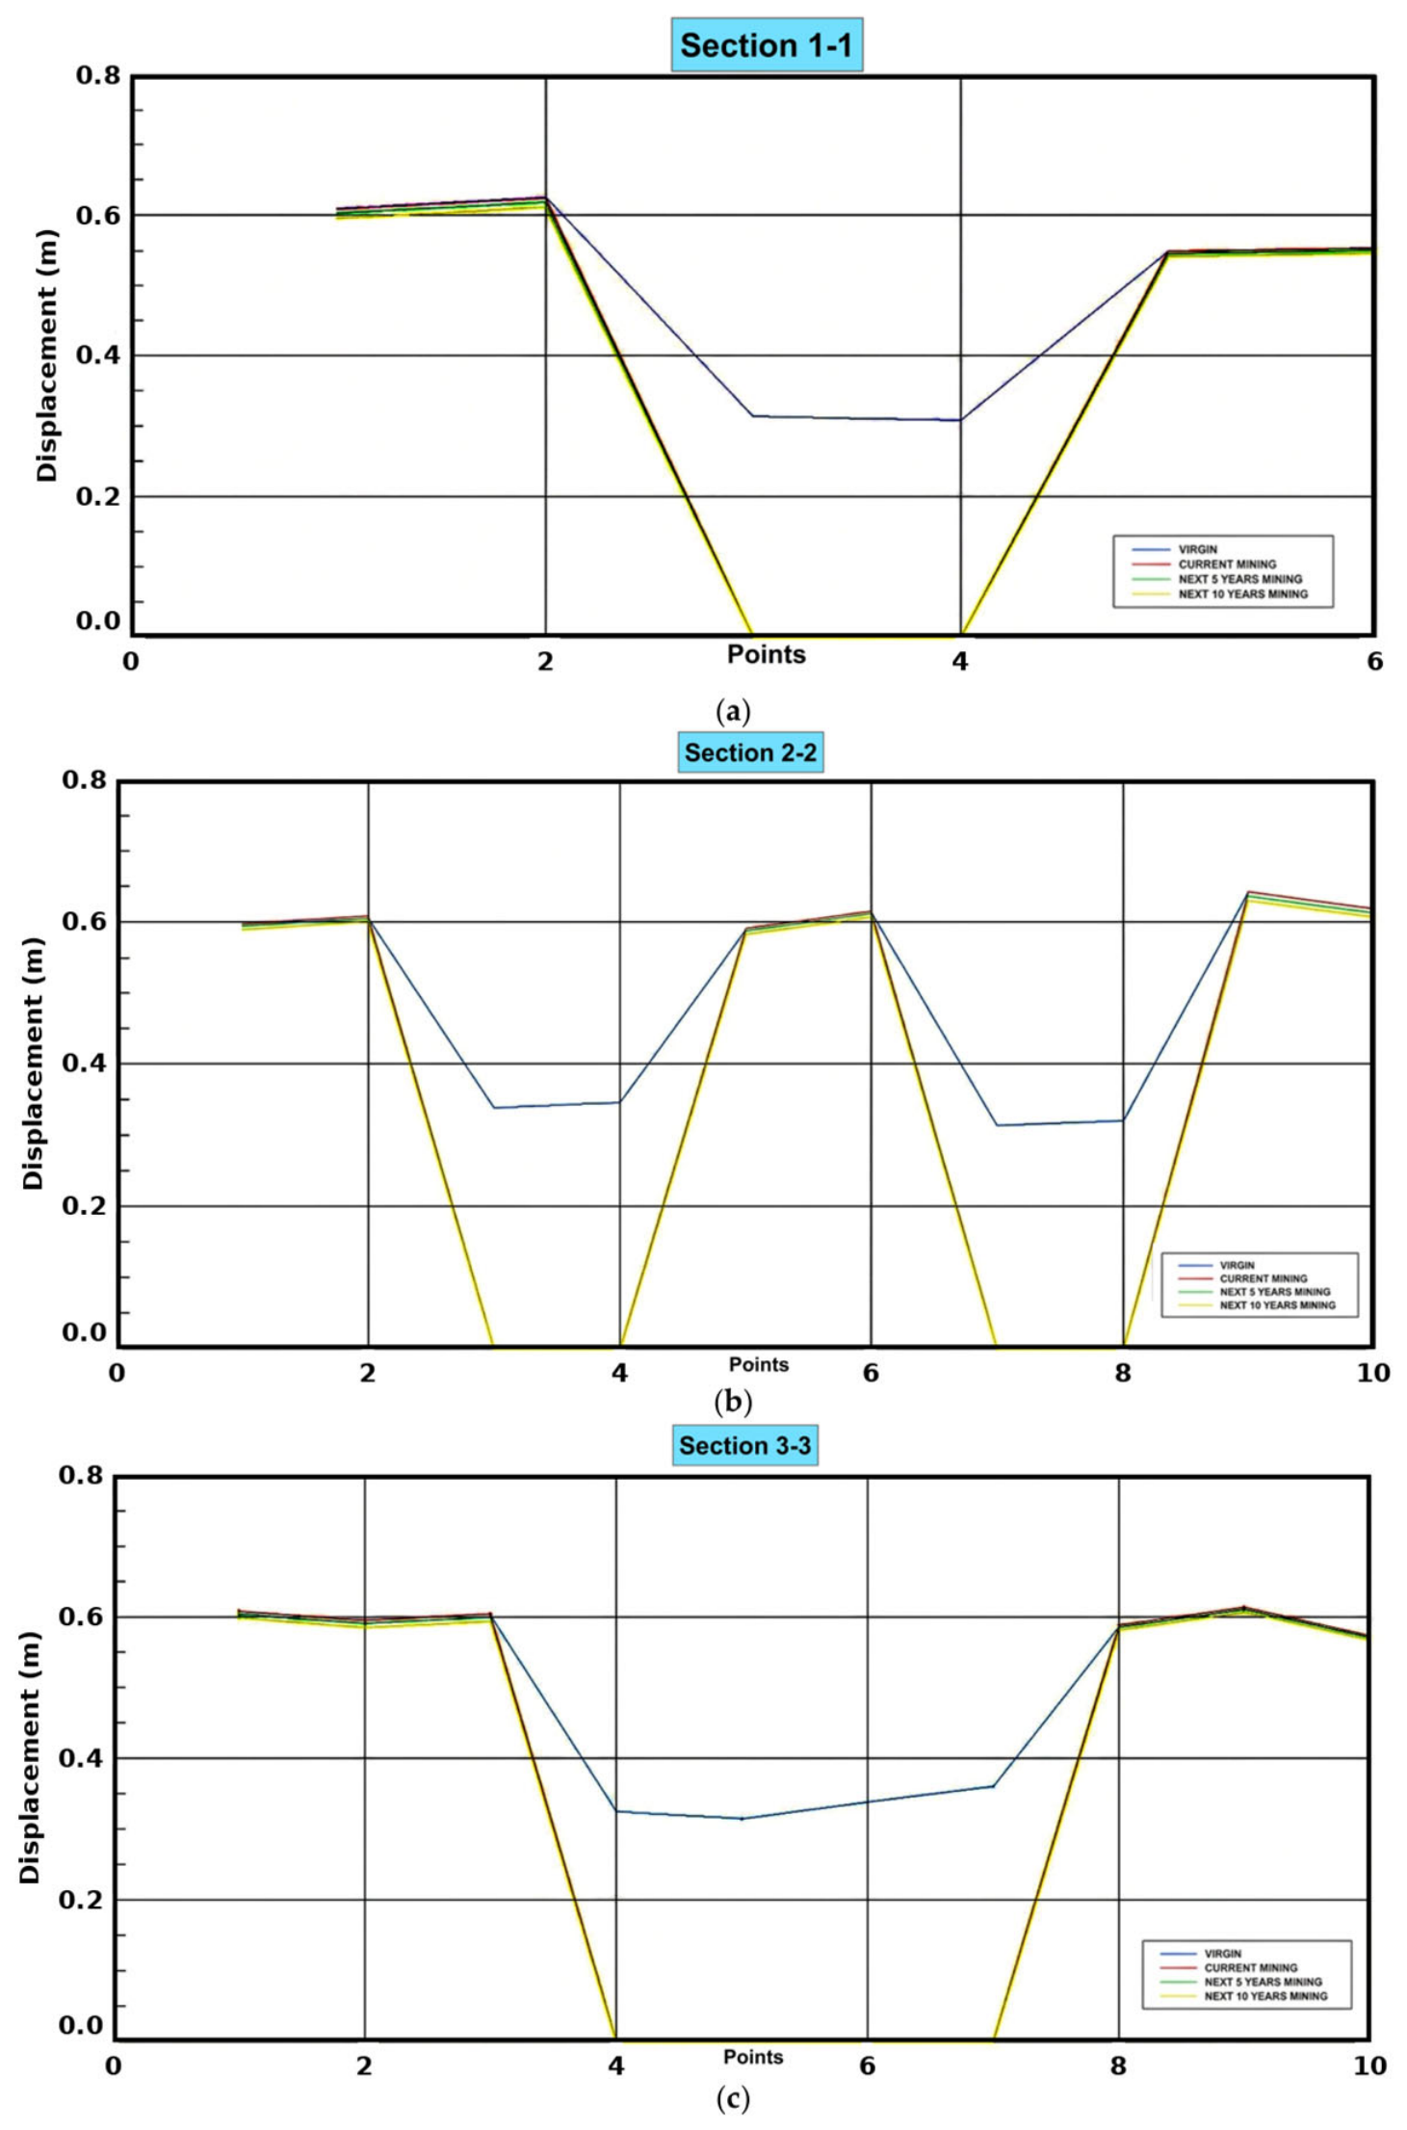
5.4. Analysis of Displacement in Z Direction in and Around the Collapsed Trough
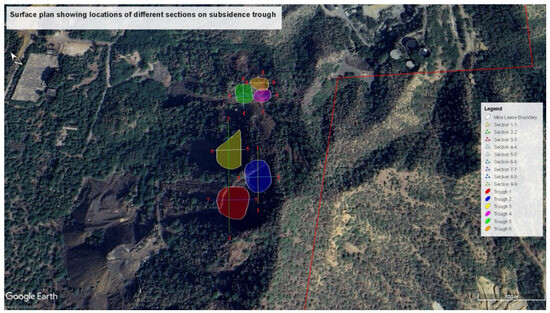
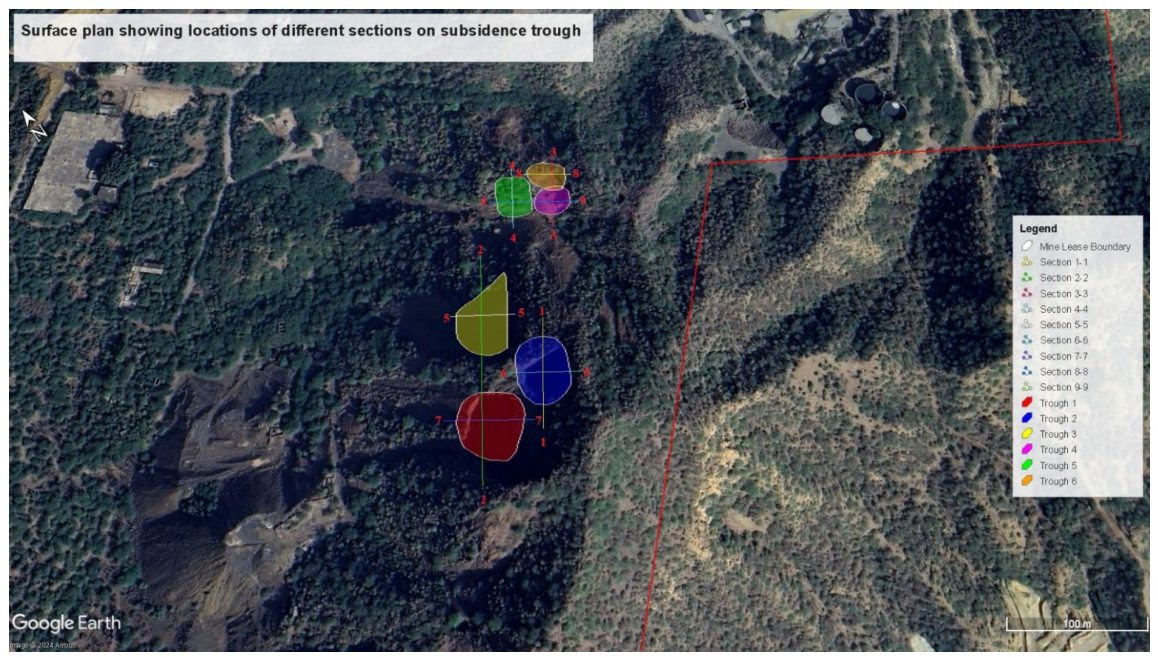
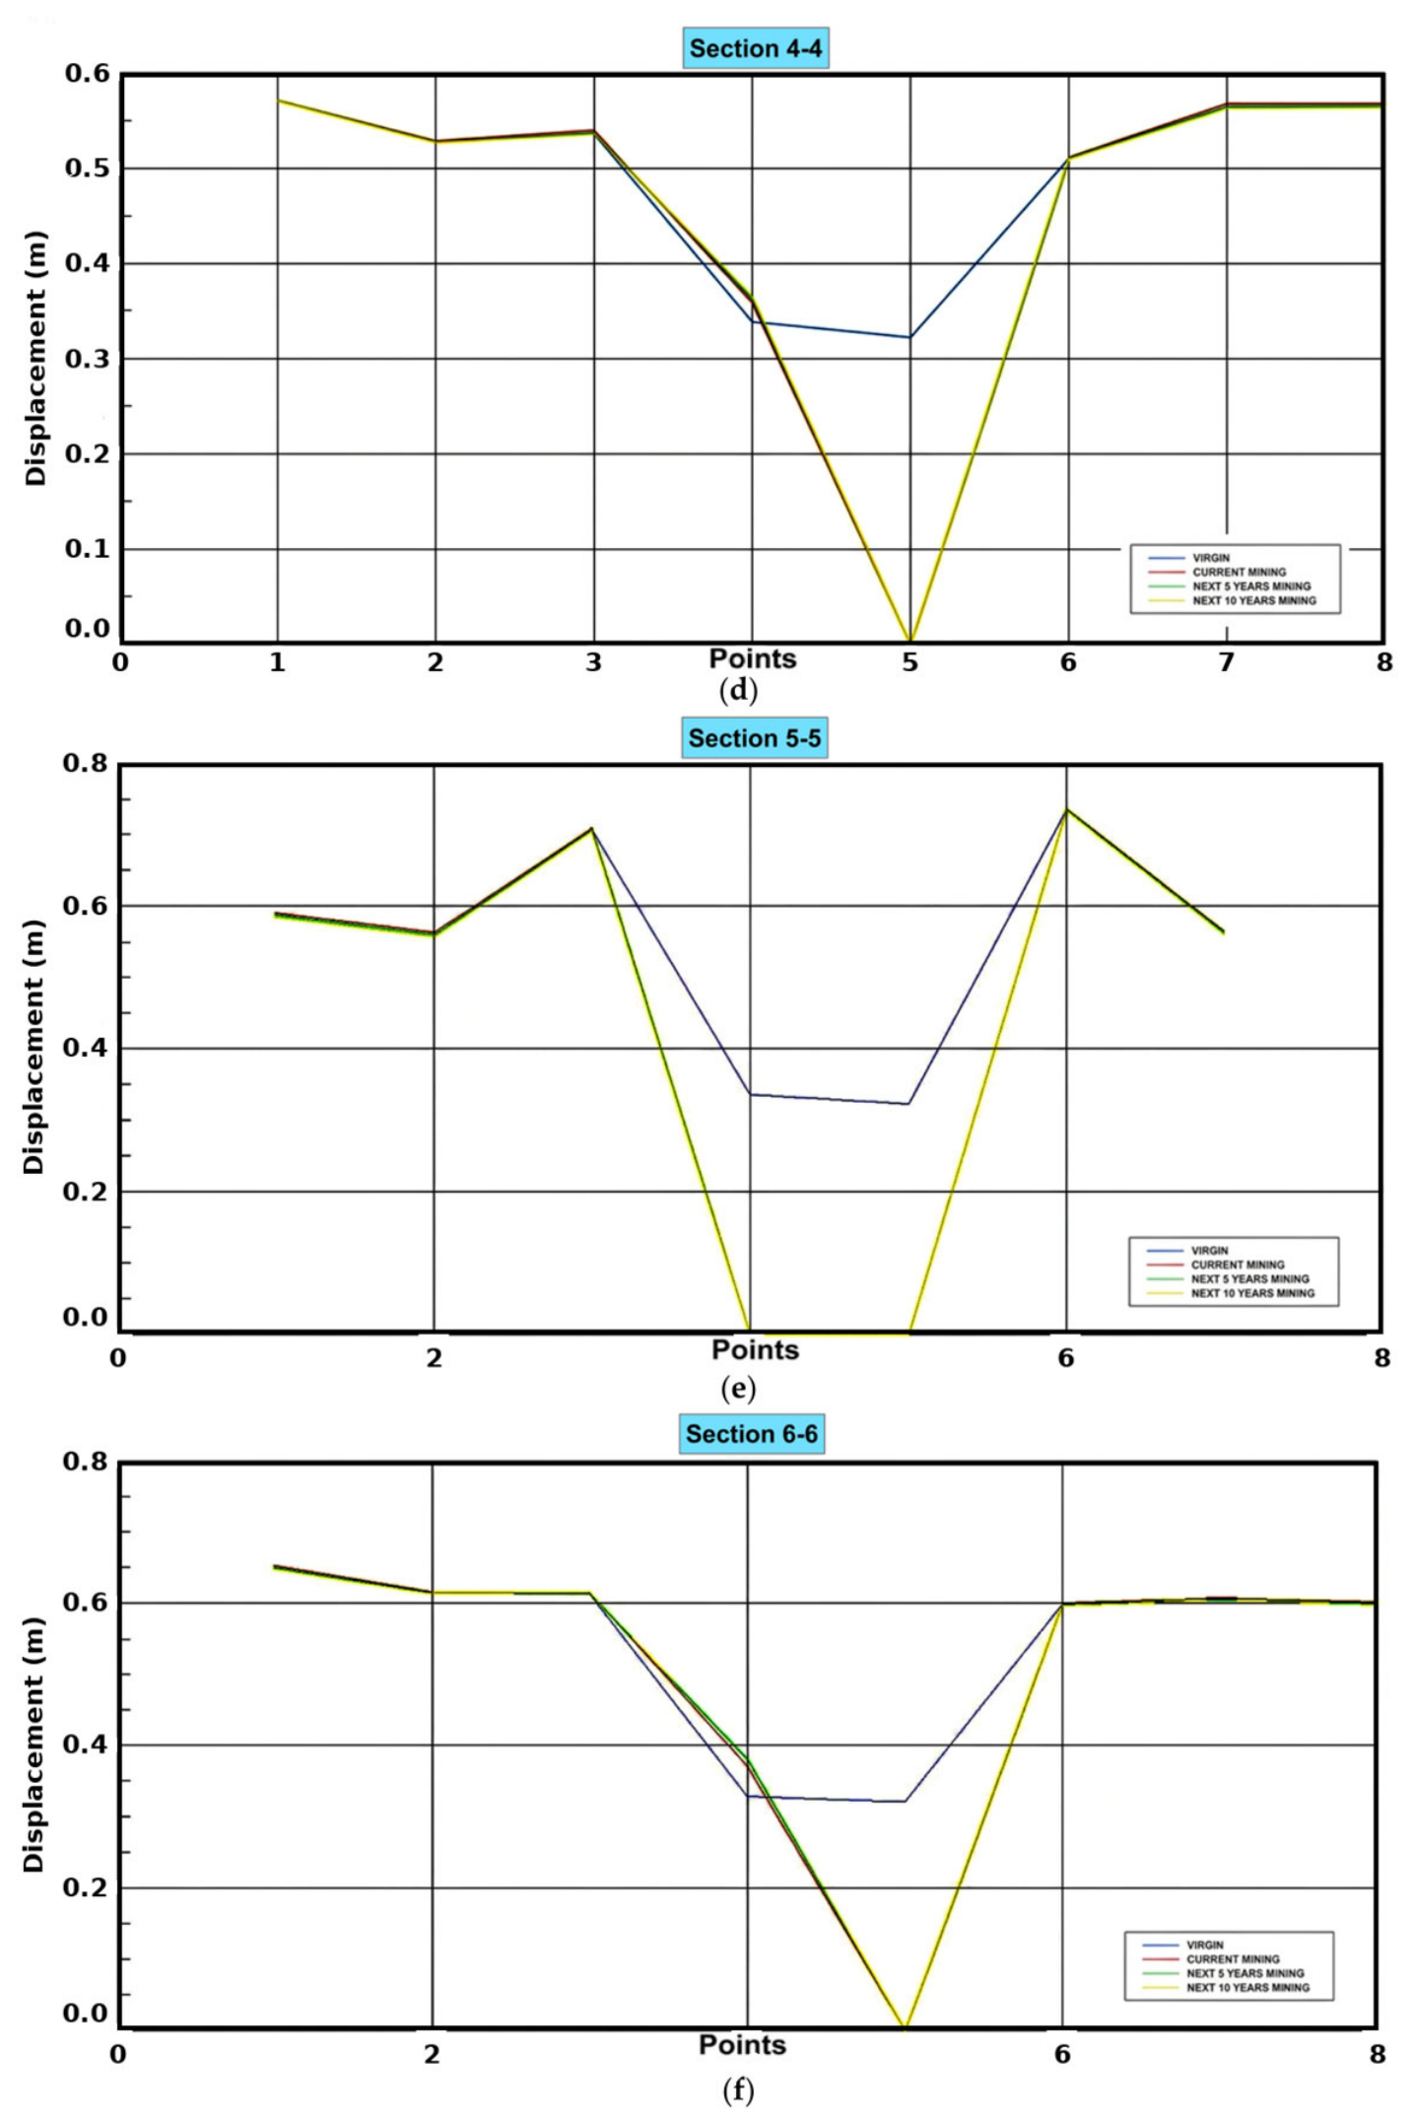
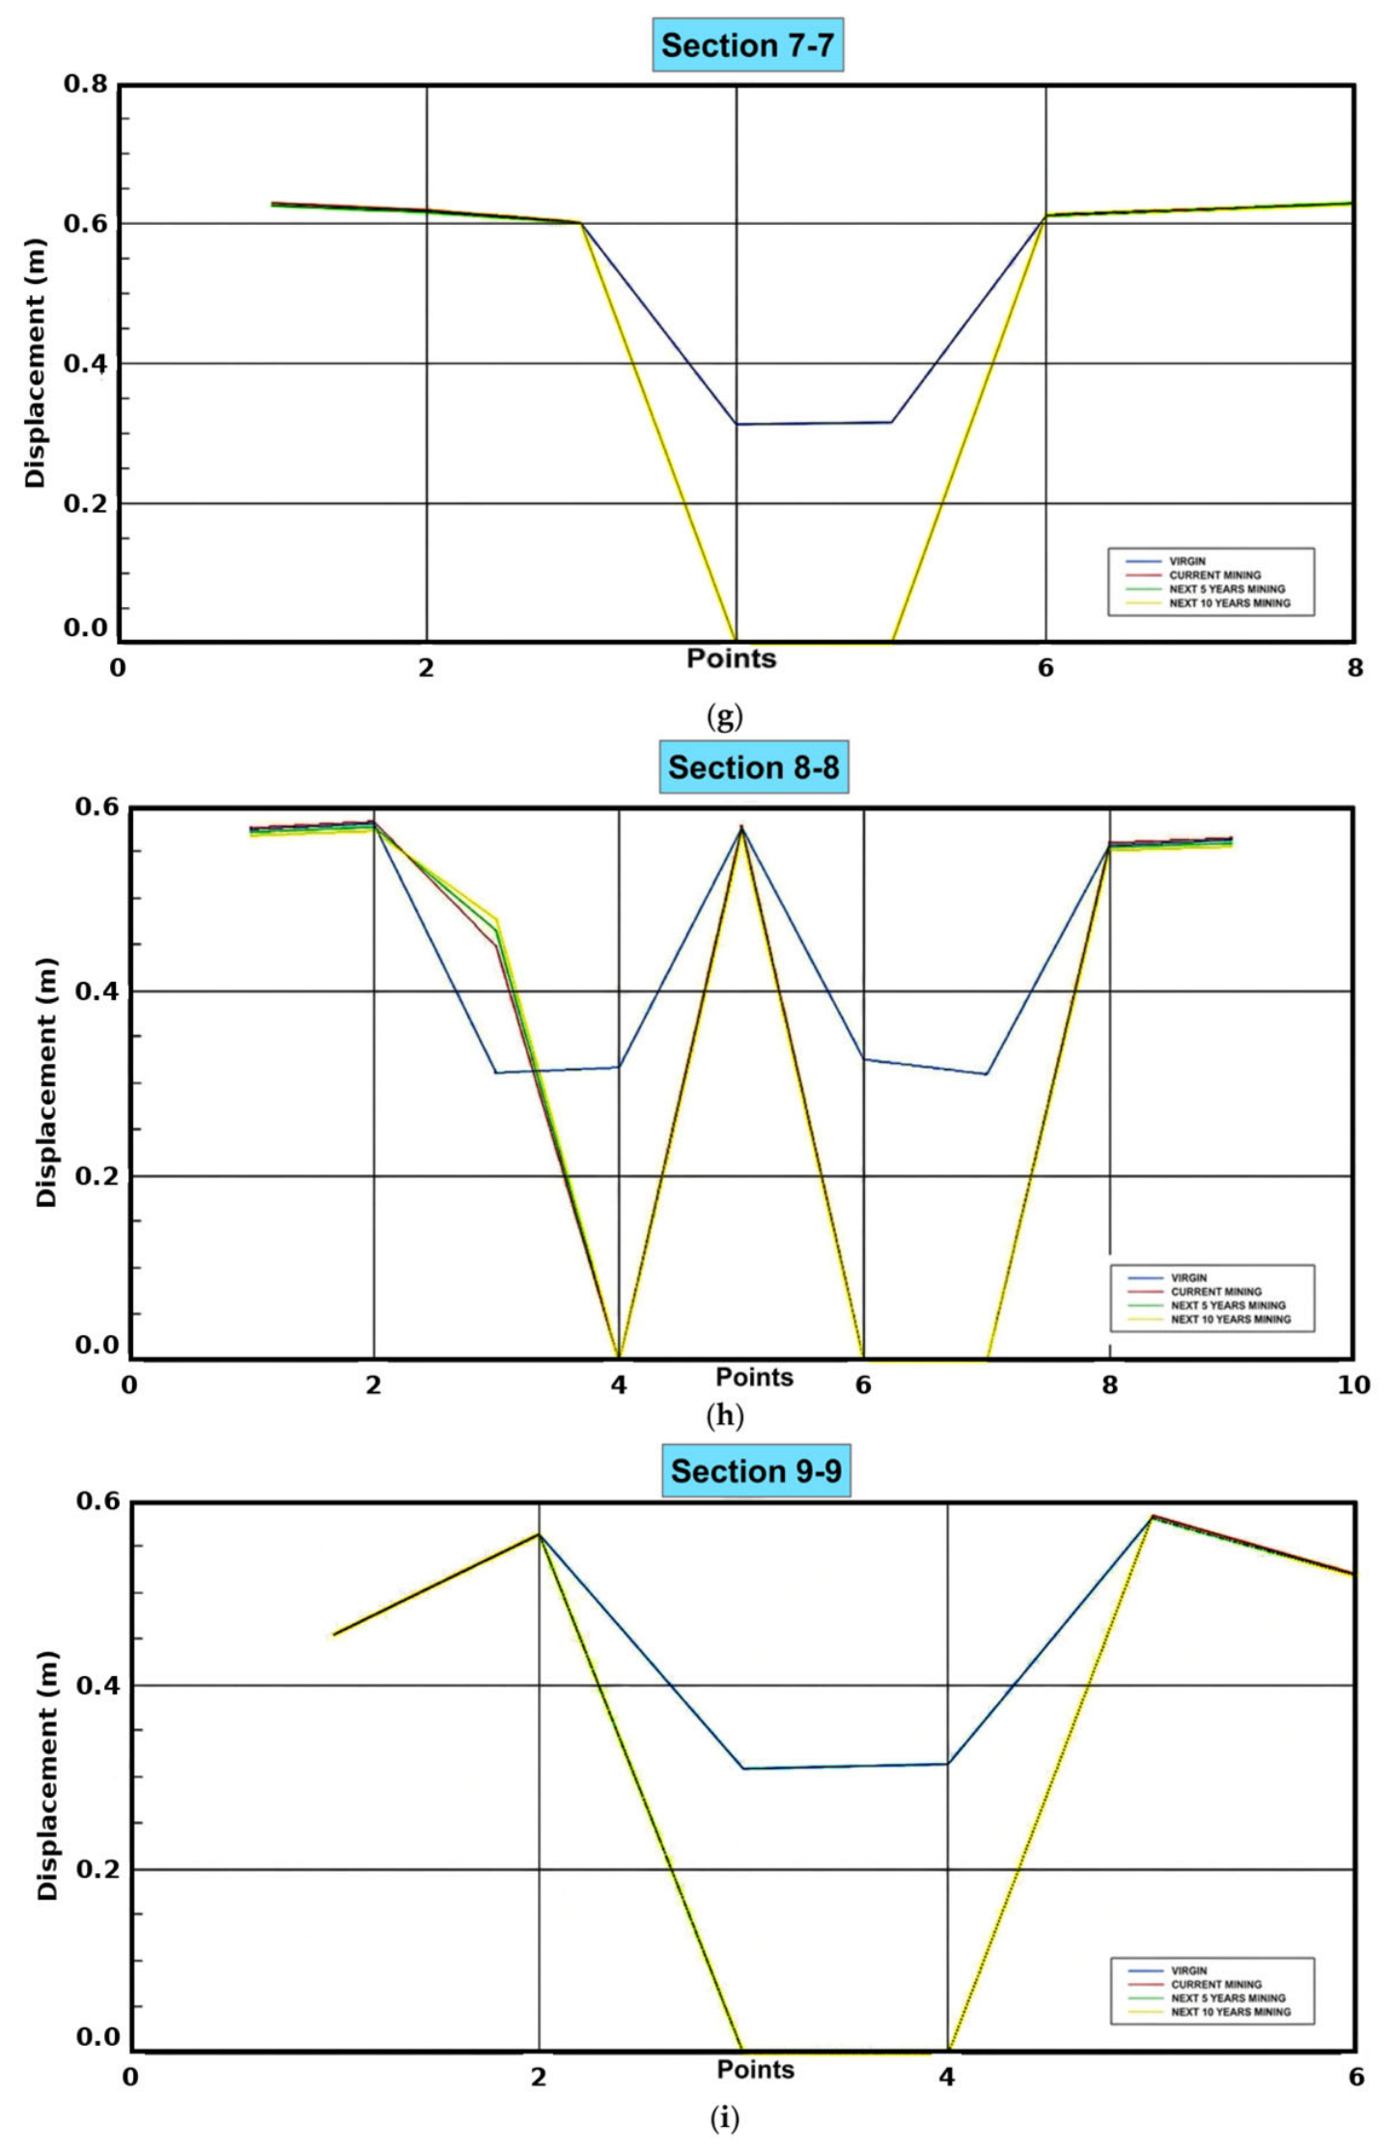
In order to analyse the displacement in z-direction, sections at suitable location were made (as shown in Figure 10). The analysis of sectional displacement profiles (Sections 1–1 to 9–9) reveals that initial displacements in the virgin stage range between 0.30 and 0.52 m, indicating moderate but uniform ground settlement, as shown in Table 9. In the current stage, maximum displacement increases slightly (up to 0.53 m), reflecting progressive development. Predictions for the next 5 and 10 years suggest stabilisation trends, with central trough regions collapsing to near-zero displacement values, while boundary displacements remain consistent (~0.49–0.51 m). This indicates that subsidence is localised around collapsed troughs, and further deformation outside these zones appears comparatively limited within the present model framework. Such findings highlight the need for slope stability monitoring around trough boundaries to mitigate long-term operational and environmental risks. From the sections, it is observed that the increase in displacement from virgin to later mining stages around the trough is comparatively small, as shown in Figure 11.
Figure 10.
Surface plan showing the locations of different sections in Google Earth Pro.
Table 9.
Summary of minimum and maximum displacement values (m) for each section under different mining stages.
Figure 11.
(a–i): Displacement in the z–direction along Sections 1–1 to 9–9 for different mining stages of Mine-A. (a): Displacement profile in the z-direction along Section 1–1 for the virgin state, current mining state, next 5 years of mining, and next 10 years of mining at Mine-A. (b): Displacement profile in the z–direction along Section 2–2 for the virgin state, current mining state, next 5 years of mining, and next 10 years of mining at Mine-A. (c): Displacement profile in the z-direction along Section 3–3 for the virgin state, current mining state, next 5 years of mining, and next 10 years of mining at Mine-A. (d): Displacement profile in the z–direction along Section 4–4 for the virgin state, current mining state, next 5 years of mining, and next 10 years of mining at Mine-A. (e): Displacement profile in the z–direction along Section 5–5 for the virgin state, current mining state, next 5 years of mining, and next 10 years of mining at Mine-A. (f): Displacement profile in the z–direction along Section 6–6 for the virgin state, current mining state, next 5 years of mining, and next 10 years of mining at Mine-A. (g): Displacement profile in the z–direction along Section 7–7 for the virgin state, current mining state, next 5 years of mining, and next 10 years of mining at Mine-A. (h): Displacement profile in the z-direction along Section 8–8 for the virgin state, current mining state, next 5 years of mining, and next 10 years of mining at Mine-A. (i): Displacement profile in the z–direction along Section 9–9 for the virgin state, current mining state, next 5 years of mining, and next 10 years of mining at Mine-A.
5.5. Practical Implications of the Validated Modelling Framework
The present FEM framework has practical value because it enables comparative assessment of deformation behaviour under different mining stages and helps identify locations requiring focused monitoring and ground-control attention. In the present case, the combined numerical and monitoring-based interpretation indicates that deformation is concentrated mainly within the mined and previously disturbed corridor rather than being uniformly distributed across the lease area. This is important for prioritising monitoring resources, slope-stability assessment, and subsidence-management planning. In addition, the model provides a basis for evaluating how future mining may influence the existing deformation zone, thereby supporting mine planning and risk-informed decision-making. Thus, the modelling framework is useful not only for predicting deformation trends, but also for guiding practical subsidence monitoring and management in active underground mining areas.
6. Conclusions
This study presents the results of a comprehensive three-dimensional analysis of mining-induced subsidence at Mine-A. Geological, geotechnical, and in situ stress data were used to develop a FEM-based 3-D numerical model that included the ore body and the surrounding rock, which were primarily composed of feldspar quartzite, amphibole quartzite, phyllite, and sericite quartzite. Results from the back-analysis were used to constrain the uncertainty in the rock mass characteristics. The main conclusions and research contributions of the study are as follows:
- •
- This study presents a site-specific three-dimensional FEM-based subsidence assessment framework for Mine-A of the Khetri Copper Belt, a structurally complex underground copper mine in metamorphic terrain that has not been previously studied using this approach. The framework integrates geological, geotechnical, and in situ stress data with stage-wise numerical modelling and field-based Total Station validation, providing a replicable methodology for subsidence assessment in similar hard-rock mining environments.
- •
- The numerical results demonstrate the capability of the FEM approach in reproducing ground-surface deformation trends under different mining stages. The results indicate that surface deformation outside the pre-existing collapsed subsidence troughs remains comparatively limited under the simulated mining scenarios.
- •
- Validation using Total Station monitoring data further confirms that the predicted deformation response is spatially concentrated within the mining-influenced corridor, although some difference remains between observed and predicted magnitudes at individual stations.
- •
- From an engineering perspective, slope instability-related issues may still arise in and around the developed and collapsed trough zones [35]. The present method of blast hole stopping in mining had an impact on the stability and safety of the rock structure and surface.
- •
- The progressive enlargement of the subsidence footprint increases pressure on land acquisition, compromises slope stability, and complicates soil conservation and mine-reclamation efforts. These trends threaten both safe, economic operations and the local environment. It is therefore recommended that comprehensive subsidence-monitoring and ground-control measures be implemented across the mined and disturbed zones.
- •
- Continued field-monitored deformation data are essential for validating and further refining the predicted subsidence response. Accordingly, mine management should maintain a systematic surface-monitoring programme to support continued validation and refinement of the numerical model.
While the specific deformation magnitudes reported in this study are site-specific to Mine-A of the Khetri Copper Belt, the modelling framework itself is transferable to other underground metal mines with comparable structural complexity. The key generalisable finding is that in hard-rock underground mines with pre-existing collapse troughs and irregular stoped geometry, future mining tends to intensify deformation within the already disturbed zone rather than produce significant outward extension of the subsidence footprint. This behaviour has implications for the subsidence monitoring strategy at similar mines specifically, in that monitoring resources should be prioritised within and around the existing disturbed corridor rather than at the periphery of the lease boundary. The structured workflow adopted here, geological model → 3-D FEM → stage-wise assessment → field validation, can be applied to any underground metal mine setting where geological and geotechnical data are available.
The present study remains subject to certain limitations that should be considered when interpreting the results. First, the model adopts an equivalent continuum representation using the Mohr–Coulomb elastoplastic constitutive model, which does not explicitly represent individual joints, faults, or lithological contacts as discrete surfaces. In reality, the Khetri Copper Belt rock mass contains structural discontinuities that may influence local stress redistribution and deformation pathways, particularly near excavation boundaries. Second, hydro-mechanical coupling is not included in the present model; therefore, any transient effects of groundwater pressure changes on effective stress and deformation behaviour are not captured. Third, input parameter calibration is semi-empirical, constrained by available laboratory test data and in situ stress measurements from NIRM reports, but not independently verified through back-analysis against a separate monitoring dataset. Fourth, time-dependent (creep) behaviour of the rock mass is not considered in the present nonlinear static solution scheme, which may be relevant over the longer mining horizons assessed. Fifth, the weathered rock zone near the surface (5–7.5 m depth) is represented through a simplified strength reduction assumption, which introduces uncertainty in near-surface deformation predictions. Despite these limitations, the continuum FEM approach adopted here is consistent with published practice for mine-scale subsidence assessment [12,17] and is considered appropriate for the comparative stage-wise evaluation objectives of the present study. Future research should focus on incorporating discrete fracture networks, hydro-mechanical coupling, and continued monitoring-supported model refinement.
Resolution of these limitations is proposed as the primary direction for future research, specifically, (i) discrete fracture network modelling using field-mapped joint data once available, (ii) coupled hydro-mechanical analysis once piezometric records are obtained, and (iii) time-dependent creep analysis once longer-term monitoring data are available for back-analysis. These represent logical extensions of the present framework rather than flaws in its current application.
Author Contributions
Conceptualization, A.S. and M.S.A.; methodology, A.S. and M.S.A.; software, A.S.; validation, A.S. and M.S.A.; formal analysis, A.S.; investigation, A.S. and M.S.A.; resources, M.S.A..; data curation, A.S. and M.S.A.; writing—original draft preparation, A.S.; writing—review and editing, A.S.; visualization, A.S.; supervision, M.S.A. All authors have read and agreed to the published version of the manuscript.
Funding
This research received no external funding.
Data Availability Statement
The original contributions presented in this study are included in the article. Further inquiries can be directed to the corresponding author.
Acknowledgments
The authors sincerely acknowledge Soyeb Alam, Dheeraj Kumar, and retired U.K. Singh, Department of Mining Engineering, IIT (ISM) Dhanbad, for their valuable guidance, support, and constructive suggestions during this research. This research paper is the outcome of PhD dissertation work of Avinash Singh under the supervision of Mohammad Soyeb Alam.
Conflicts of Interest
The authors declare no conflicts of interest.
References
- Zhao, X.; Zhu, Q. Analysis of the surface subsidence induced by sublevel caving based on GPS monitoring and numerical simulation. Nat. Hazards 2020, 103, 3063–3083. [Google Scholar] [CrossRef] [Scilit]
- Soliman, M.M. Environmental Hydrogeology; CRC Press: Boca Raton, FL, USA, 1998. [Google Scholar]
- Kratzsch, H. Mining Subsidence Engineering; Springer: Berlin/Heidelberg, Germany, 1983. [Google Scholar]
- Singh, M.M. Mine subsidence. In SME Mining Engineering Handbook, 2nd ed.; Hartman, H.L., Ed.; Society for Mining, Metallurgy, and Exploration: Littleton, CO, USA, 1992; pp. 938–971. [Google Scholar]
- Clayton, M. Development of a monitoring network for surface subsidence at New Gold’s New Afton block cave operation. In Caving 2018: Proceedings of the Fourth International Symposium on Block and Sublevel Caving; Potvin, Y., Jakubec, J., Eds.; Australian Centre for Geomechanics: Perth, Australia, 2018; pp. 689–704. [Google Scholar] [CrossRef] [Scilit]
- Alam, M.S.; Kumar, D.; Chatterjee, R.S. Improving the capability of integrated DInSAR and PSI approach for better detection, monitoring, and analysis of land surface deformation in underground mining environment. Geocarto Int. 2022, 37, 3607–3641. [Google Scholar] [CrossRef] [Scilit]
- Woo, K.S.; Eberhardt, E.; Rabus, B.; Stead, D.; Vyazmensky, A. Integration of field characterisation, mine production and InSAR monitoring data to constrain and calibrate 3-D numerical modeling of block caving-induced subsidence. Int. J. Rock. Mech. Min. Sci. 2012, 53, 166–178. [Google Scholar] [CrossRef] [Scilit]
- Huang, G.; Kulatilake, P.H.; Shreedharan, S.; Cai, S.; Song, H. 3-D discontinuum numerical modeling of subsidence incor-porating ore extraction and backfilling operations in an underground iron mine in China. Int. J. Min. Sci. Technol. 2017, 27, 191–201. [Google Scholar] [CrossRef] [Scilit]
- Shapka-Fels, T.; Elmo, D. Numerical modeling challenges in rock engineering with special consideration of open pit to un-derground mine interaction. Geosciences 2022, 12, 199. [Google Scholar] [CrossRef] [Scilit]
- Nuric, A. Numerical modeling and computer simulation of ground movement above underground mine. Int. J. Environ. Chem. Ecol. Geol. Geophys. Eng. 2012, 6, 361–369. [Google Scholar]
- Li, L. Special issue on numerical modeling in civil and mining geotechnical engineering. Processes 2022, 10, 1571. [Google Scholar] [CrossRef] [Scilit]
- Zhao, Y.; Zhao, X.; Dai, J.; Yu, W. Analysis of the surface subsidence induced by mining near-surface thick lead-zinc deposit based on numerical simulation. Processes 2021, 9, 717. [Google Scholar] [CrossRef] [Scilit]
- Whittaker, B.N.; Reddish, D.J. Subsidence: Occurrence, Prediction and Control; Elsevier: Amsterdam, The Netherlands, 1989. [Google Scholar]
- Aston, T.R.C.; Tammemagi, H.Y.; Poon, A.W. A review and evaluation of empirical and analytical subsidence prediction techniques. Min. Sci. Technol. 1987, 5, 59–69. [Google Scholar] [CrossRef] [Scilit]
- Bahuguna, P.P.; Srivastava, A.M.C.; Saxena, N.C. A critical review of mine subsidence prediction methods. Min. Sci. Technol. 1991, 13, 369–382. [Google Scholar] [CrossRef] [Scilit]
- Jing, L. A review of techniques, advances and outstanding issues in numerical modeling for rock mechanics and rock engi-neering. Int. J. Rock. Mech. Min. Sci. 2003, 40, 283–353. [Google Scholar] [CrossRef] [Scilit]
- Xu, N.; Kulatilake, P.H.; Tian, H.; Wu, X.; Nan, Y.; Wei, T. Surface subsidence prediction for the WUTONG mine using a 3-D finite difference method. Comput. Geotech. 2013, 48, 134–145. [Google Scholar] [CrossRef] [Scilit]
- Sepehri, M.; Apel, D.B.; Hall, R.A. Prediction of mining-induced surface subsidence and ground movements at a Canadian diamond mine using an elastoplastic finite element model. Int. J. Rock. Mech. Min. Sci. 2017, 100, 73–82. [Google Scholar] [CrossRef] [Scilit]
- Zhang, K.; Bai, L.; Wang, P.; Zhu, Z. Field Measurement and Numerical Modelling Study on Mining-Induced Subsidence in a Typical Underground Mining Area of Northwestern China. Adv. Civ. Eng. 2021, 2021, 5599925. [Google Scholar] [CrossRef] [Scilit]
- Li, X.; Wang, D.; Li, C.; Liu, Z. Numerical simulation of surface subsidence and backfill material movement induced by un-derground mining. Adv. Civ. Eng. 2019, 2019, 2724370. [Google Scholar] [CrossRef] [Scilit]
- Qin, Z.; Agarwal, V.; Gee, D.; Marsh, S.; Grebby, S.; Chen, Y.; Meng, N. Study of ground movement in a mining area with geological faults using FDM analysis and a stacking InSAR method. Front. Environ. Sci. 2021, 9, 787053. [Google Scholar] [CrossRef] [Scilit]
- Cao, S.; Song, W.; Deng, D.; Lei, Y.; Lan, J. Numerical simulation of land subsidence and verification of its character for an iron mine using sublevel caving. Int. J. Min. Sci. Technol. 2016, 26, 327–332. [Google Scholar] [CrossRef] [Scilit]
- Le, T.D.; Nguyen, C.K.; Tran, M.T. Longwall mining-induced weighting mechanism and its interactions with shield support and coal wall. Min. Miner. Depos. 2025, 19, 1–13. [Google Scholar] [CrossRef] [Scilit]
- Petlovanyi, M.; Sai, K. Numerical modelling of critical conditions for the onset of a limit state in the rock mass surrounding unfilled underground voids in iron ore deposits. Eng. J. Satbayev Univ. 2026, 148, 38–47. [Google Scholar] [CrossRef] [Scilit]
- Nikishkov, G.P. Introduction to the Finite Element Method; University of Aizu: Aizuwakamatsu, Japan, 2004; pp. 4–5. [Google Scholar]
- Mirsalari, S.E.; Fatehi Marji, M.; Gholamnejad, J.; Najafi, M. A boundary element/finite difference analysis of subsidence phenomenon due to underground structures. J. Min. Environ. 2017, 8, 237–253. [Google Scholar] [CrossRef] [Scilit]
- Regassa, B.; Xu, N.; Mei, G. An equivalent discontinuous modeling method of jointed rock masses for DEM simulation of mining-induced rock movements. Int. J. Rock. Mech. Min. Sci. 2018, 108, 1–14. [Google Scholar] [CrossRef] [Scilit]
- Ahmadi, H.; Sizkow, S.F. Numerical analysis of ground improvement effects on dynamic settlement of uniform sand using DEM. SN Appl. Sci. 2020, 2, 2502. [Google Scholar] [CrossRef] [Scilit]
- Elmo, D.; Rogers, S.; Beddoes, R.; Catalan, A. An integrated finite/discrete element method–discrete fracture network synthetic rock mass approach for the modeling of surface subsidence associated with panel cave mining at the Cadia East underground project. In Caving 2010: Proceedings of the Second International Symposium on Block and Sublevel Caving; Australian Centre for Geomechanics: Perth, Australia, 2010; pp. 167–179. [Google Scholar] [CrossRef] [Scilit]
- Hamdi, P.; Stead, D.; Elmo, D.; Töyrä, J. Use of an integrated finite/discrete element method-discrete fracture network approach to characterize surface subsidence associated with sub-level caving. Int. J. Rock. Mech. Min. Sci. 2018, 103, 55–67. [Google Scholar] [CrossRef] [Scilit]
- Stead, D.; Eberhardt, E.; Coggan, J.S. Developments in the characterization of complex rock slope deformation and failure using numerical modeling techniques. Eng. Geol. 2006, 83, 217–235. [Google Scholar] [CrossRef] [Scilit]
- Vyazmensky, A.; Stead, D.; Elmo, D.; Moss, A. Numerical analysis of block caving-induced instability in large open pit slopes: A finite element/discrete element approach. Rock. Mech. Rock. Eng. 2010, 43, 21–39. [Google Scholar] [CrossRef] [Scilit]
- Shnorhokian, S.; Mitri, H.S.; Thibodeau, D. A methodology for calibrating numerical models with a heterogeneous rock mass. Int. J. Rock. Mech. Min. Sci. 2014, 70, 353. [Google Scholar] [CrossRef] [Scilit]
- Lemos, J. Application of data mining techniques for the development of new geomechanical characterization models for rock masses. In Innovative Numerical Modeling in Geomechanics; CRC Press: Boca Raton, FL, USA, 2012; pp. 257–276. [Google Scholar] [CrossRef] [Scilit]
- Brummer, R.K.; Li, H.; Moss, A.; Casten, T. The transition from open pit to underground mining: An unusual slope failure mechanism at Palabora. In Proceedings of the International Symposium on Stability of Rock Slopes; The South African Institute of Mining and Metallurgy: Cape Town, South Africa, 2006. [Google Scholar]

Disclaimer/Publisher’s Note: The statements, opinions and data contained in all publications are solely those of the individual author(s) and contributor(s) and not of MDPI and/or the editor(s). MDPI and/or the editor(s) disclaim responsibility for any injury to people or property resulting from any ideas, methods, instructions or products referred to in the content. |
© 2026 by the authors. Licensee MDPI, Basel, Switzerland. This article is an open access article distributed under the terms and conditions of the Creative Commons Attribution (CC BY) license.