


Abstract
This study numerically investigates the analogy between laser shock (LS) and projectile-based hypervelocity impact (HVI) for composite and hybrid spacecraft shielding materials and proposes a methodology for determining the LS parameters corresponding to a given HVI event. Numerical HVI models were developed in LS-DYNA and validated against published experimental data for two shielding configurations: (a) a CFRP bumper and (b) an Al/CFRP/Al/CFRP/Al hybrid shield, with emphasis on crater formation and damage morphology. An LS model was subsequently calibrated through iterative adjustment of the pressure amplitude and pulse duration to reproduce the damage induced by HVI. The ablation pressure scaling laws of Grün, Dautray, Pirri, and Phipps were then inverted to estimate the laser intensity and energy required for experimental implementation. The identified loading reproduced the HVI damage state in terms of crater morphology, hole size, delamination, and damaged area. The through-thickness stress wave fields, which did not enter the identification, were also found comparable, though the correspondence established remains one of damage characteristics rather than a demonstration of equivalence of the transient response. The predicted laser intensities (310–2868 GW/cm2) and energies (18–1176 J) fall within the validated range of the Grün and Phipps scaling laws and the capabilities of existing laser facilities, indicating that the configurations examined are experimentally accessible.
1. Introduction
The rapid growth of human space exploration activities has significantly increased the threat to satellite and spacecraft operation due to the exponential rise in Micro-Meteoroid and Orbital Debris (MMOD). Space debris comprises objects of varying size and trajectory that originate either from human activities or natural extraterrestrial sources [1,2,3]. At orbital velocities, typically ranging from 1 to 15 km/s, collisions between these objects and spacecraft constitute hypervelocity impacts (HVIs), capable of causing severe structural damage or even catastrophic failure.
Spacecraft protection against MMOD generally relies on two complementary strategies: active and passive protection. Active protection includes collision avoidance maneuvers together with debris mitigation and removal techniques. Passive protection is based on shielding systems designed to protect spacecraft from meteoroids and debris particles that cannot be tracked. To reduce the risks associated with MMOD, a wide range of shielding concepts have been developed and progressively refined. Modern spacecraft shielding systems include multilayer configurations, such as double- and triple-wall shields, stuffed Whipple shields, and advanced concepts incorporating composite materials, fabrics, foams, or functionally graded layers [4,5,6]. Among these, the Whipple shield remains one of the most effective shielding concepts. It consists of a thin bumper and a rear wall separated by a standoff distance, allowing the projectile to fragment into a debris cloud that disperses the impact energy over a larger area [7]. However, in applications such as extravehicular activities, volume constraints often prevent the use of external bumpers, requiring the structural panel itself to withstand the hypervelocity impact of MMOD.
Experimental investigations of hypervelocity impacts on shielding systems have traditionally relied on projectile launch facilities, including single- and two-stage light-gas guns, powder guns, and electrostatic accelerators [8,9,10]. However, these facilities offer limited control over projectile size, impact velocity, and testing frequency, while also involving high operational costs.
Laser-induced shock (LS) has emerged as a promising alternative for reproducing the damage associated with HVI events, providing a flexible and cost-effective experimental approach for investigating material behaviour under extreme loading rates [11,12,13,14,15,16,17]. By focusing high-energy laser pulses onto a target surface, the upper micrometres of the material are rapidly vaporized, generating a plasma that expands violently and exerts a high-pressure pulse on the target.
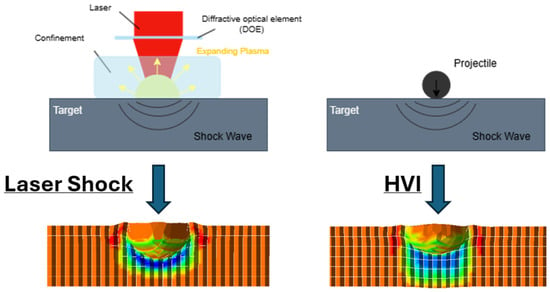
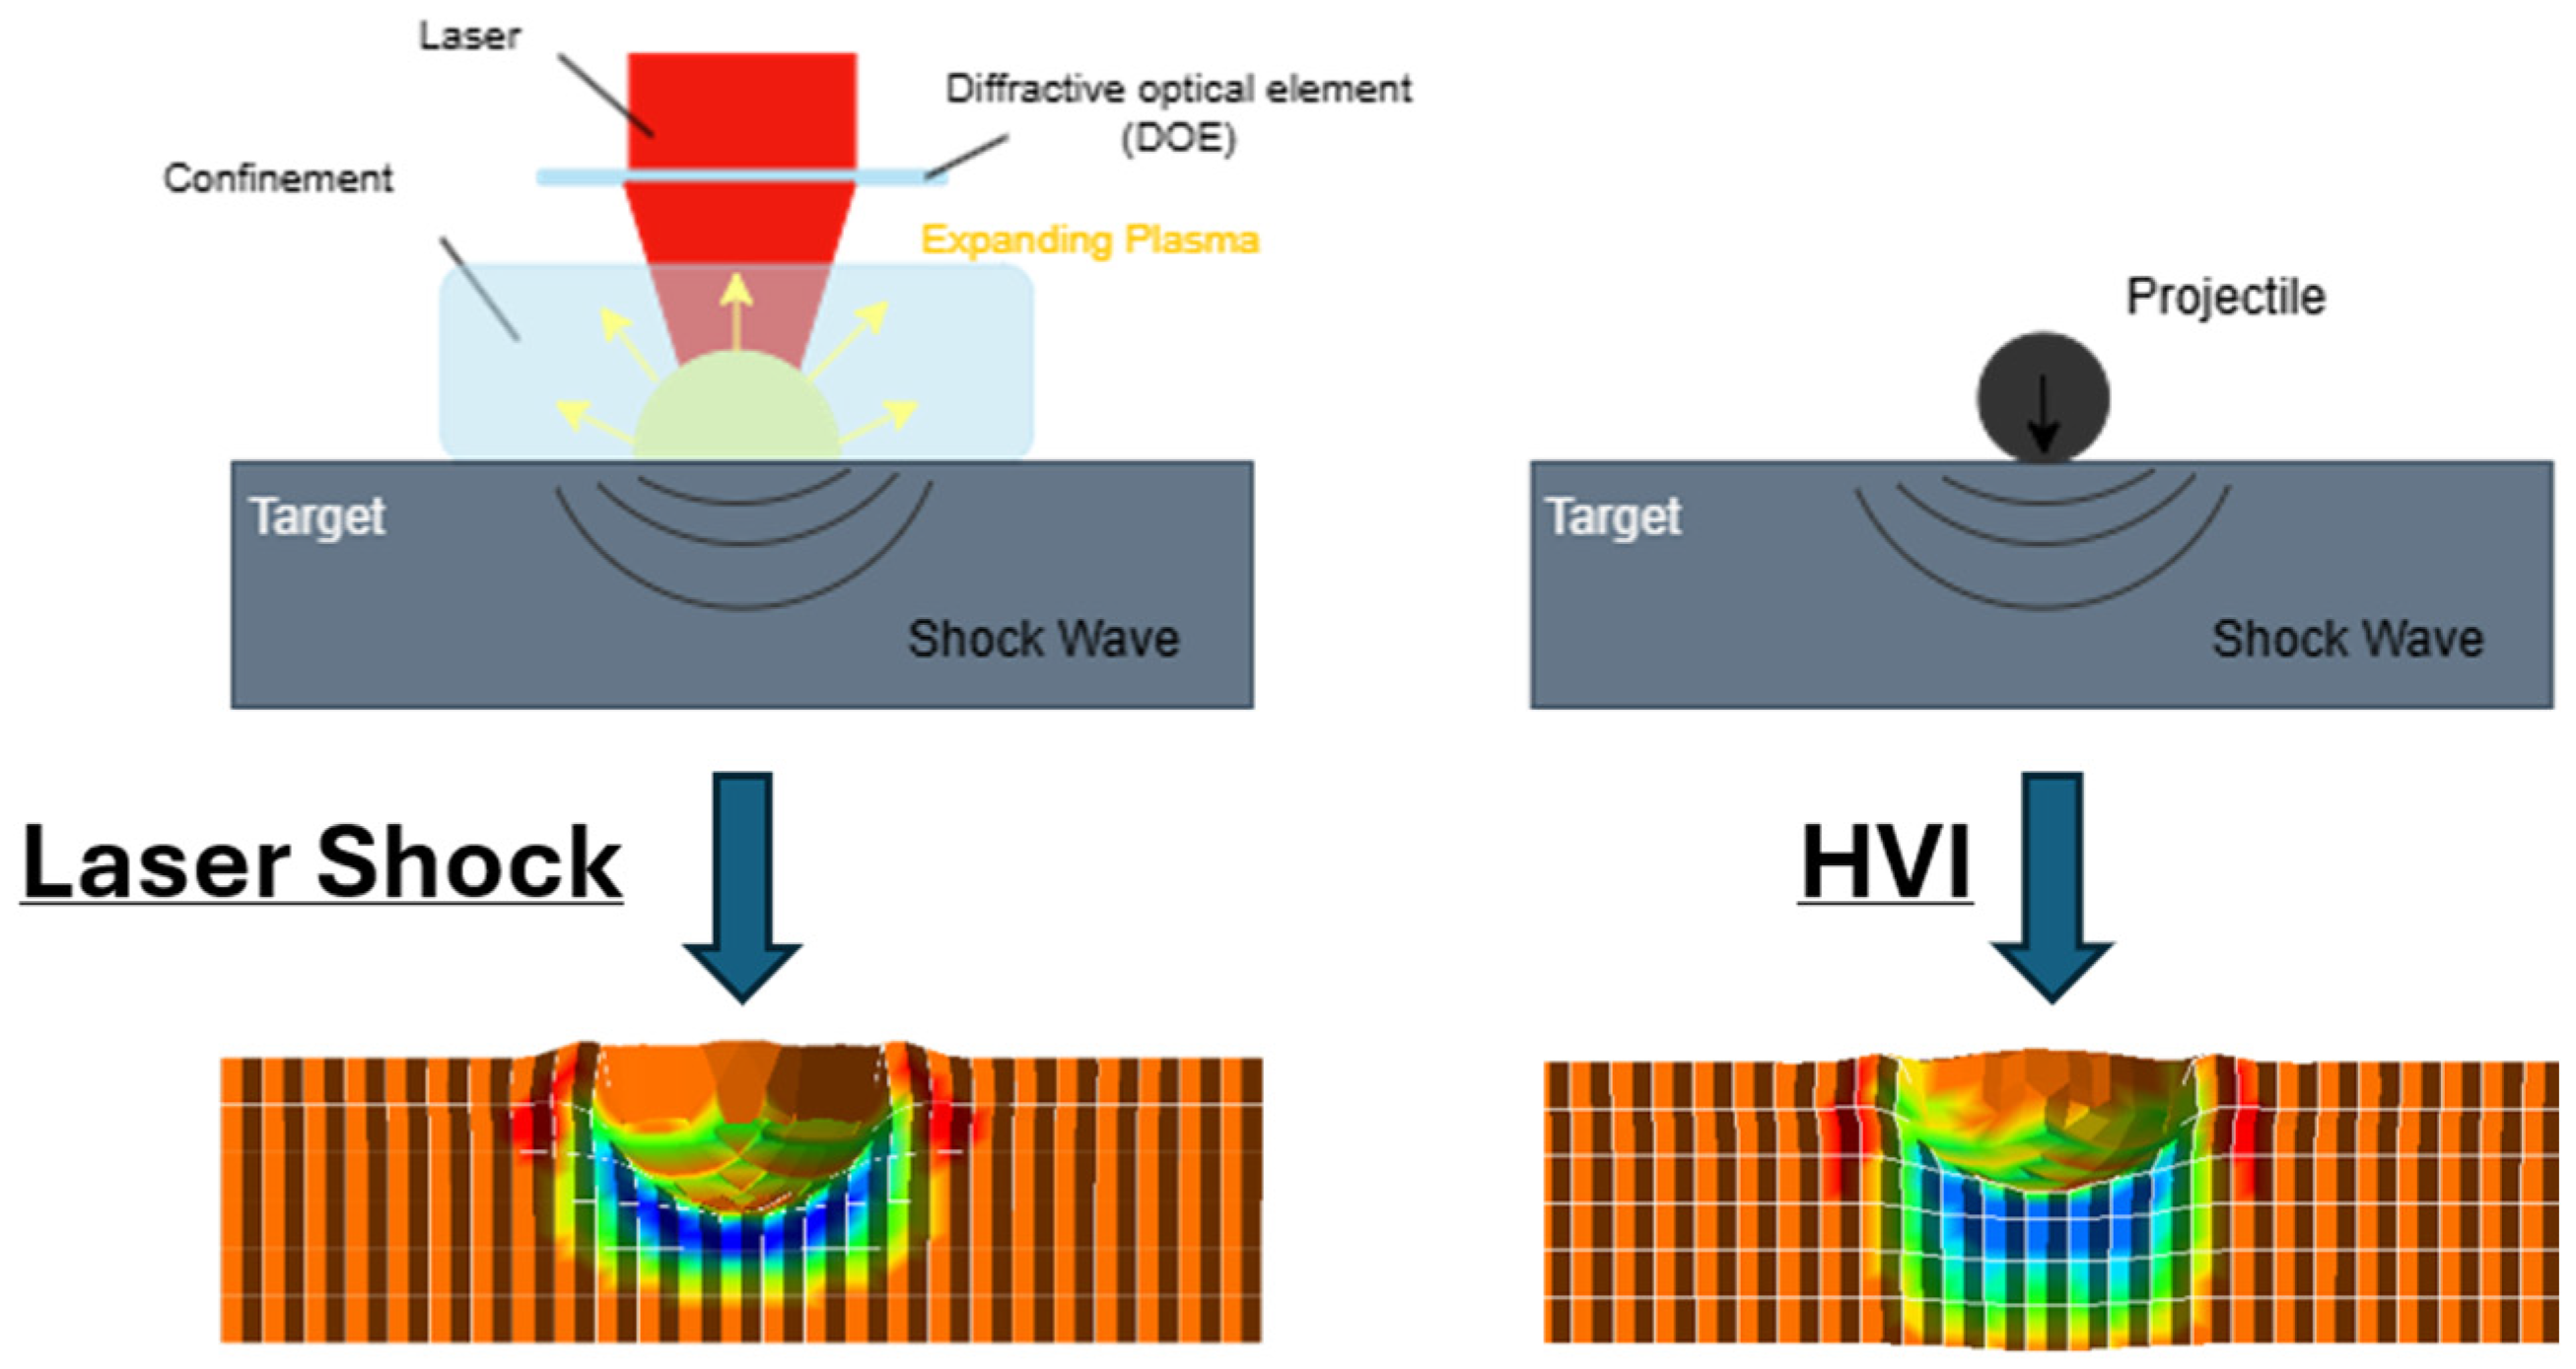
As illustrated in Figure 1, this process shares fundamental similarities with the shock-wave propagation produced during HVI events. It generates intense shock-waves with pressure amplitudes and rise times comparable to those produced during actual impacts, while offering improved experimental control, repeatability, and diagnostic accessibility.
Figure 1.
Similarity between typical laser shock and hypervelocity impact shock-wave propagation phenomenon.
The potential analogy between HVI and LS loading was first proposed by Pirri in 1977 [16]. His approach was based on the principle of late-stage equivalency, which states that when two distinct impact events generate identical flow and pressure fields before material strength and strain effects become dominant, they will produce equivalent craters. Accordingly, it was proposed that the flow and pressure conditions characteristic of a particle impact could be reproduced by applying impulsive loading to a material using a pulsed laser [17]. Subsequent theoretical and experimental studies further explored this concept, highlighting similarities in shock-wave propagation, spallation phenomena, and damage mechanisms [18,19,20]. Nevertheless, the validity and limitations of this analogy remain the subject of ongoing investigation.
Within this context, the present study numerically investigates the validity and applicability limits of the analogy between hypervelocity impact (HVI) and laser shock (LS) loading for space-related structural configurations. The analysis considers different material systems and loading conditions, with particular emphasis on spacecraft shielding applications. Specifically, two representative cases are examined: (i) an aluminum projectile impacting a carbon-fibre-reinforced polymer (CFRP) plate, and (ii) a Mylar projectile impacting an Al/CFRP/Al/CFRP/Al multilayer shield. By comparing the structural response, damage patterns, and stress wave propagation under HVI and equivalent LS loading, this study aims to determine under which conditions, and to what extent, laser-driven testing can serve as a reliable surrogate for conventional hypervelocity impact experiments.
2. Materials and Methods
2.1. Materials and Shield Configurations
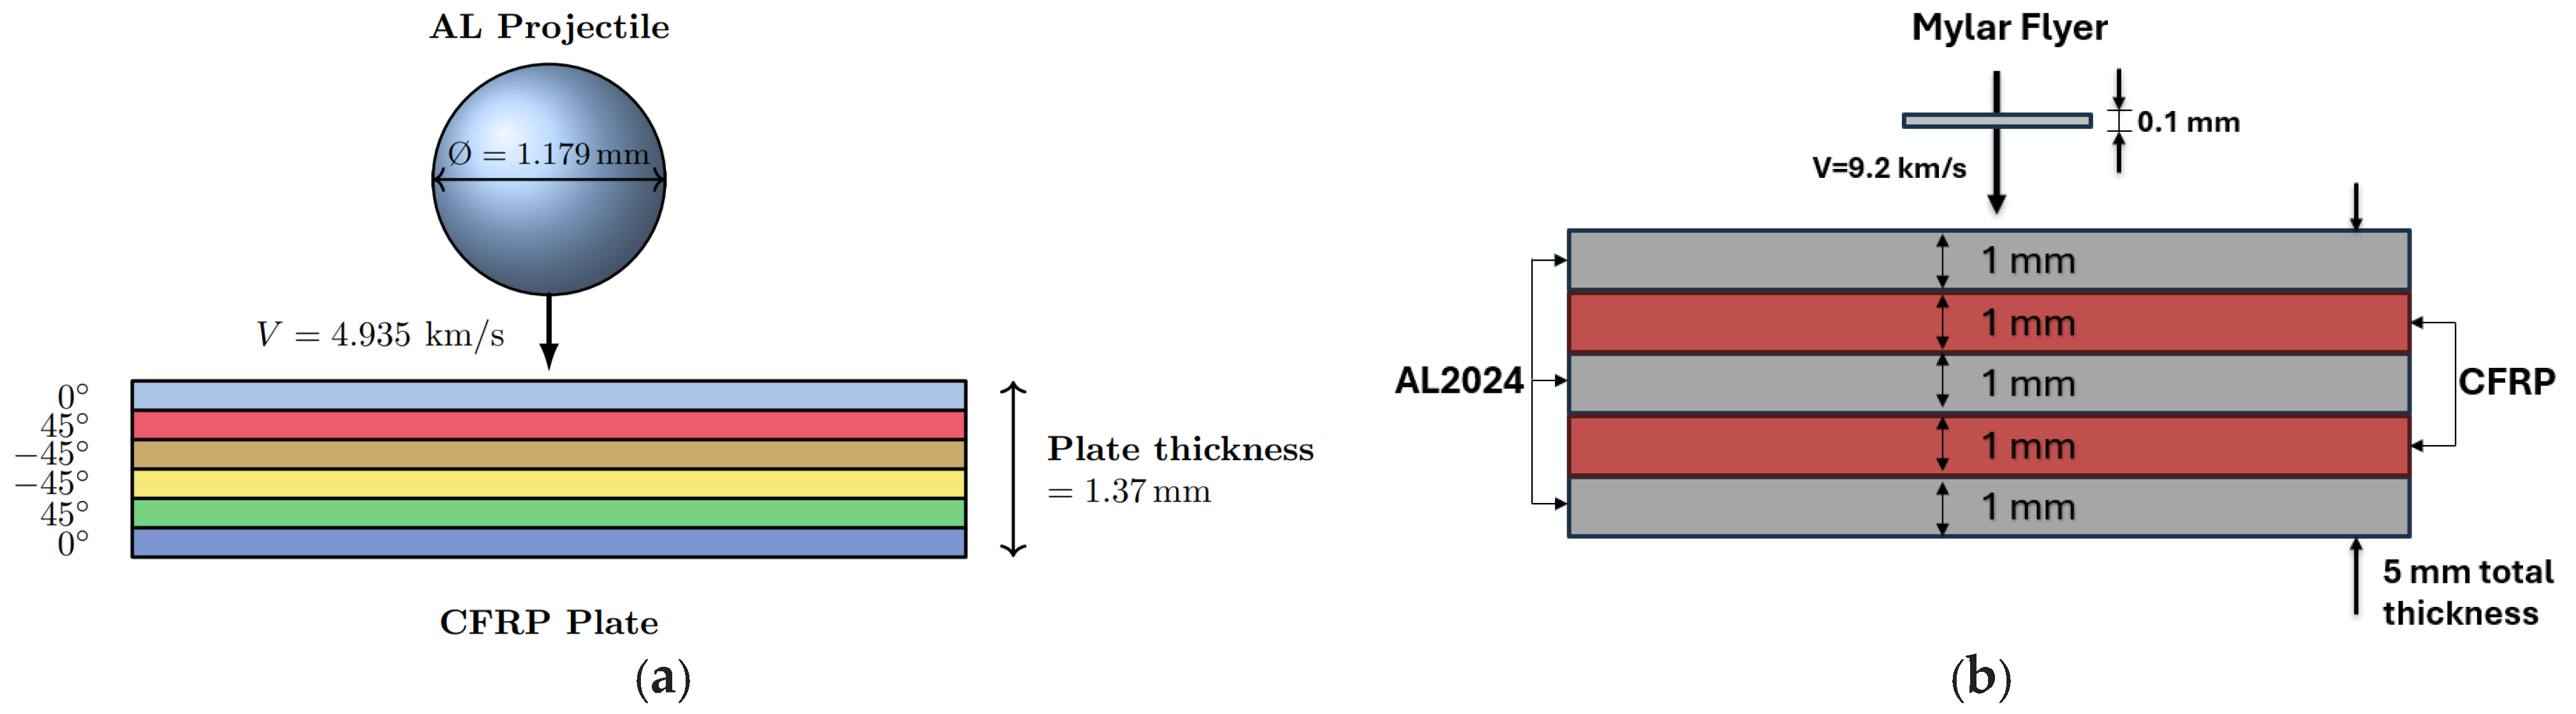
Based on the study by Wicklein et al. [21], the carbon-fibre-reinforced polymer (CFRP) used in Experiment 236 was selected as a representative material for satellite structural components. The laminate consists of Tenax UMS2526 high-performance carbon fibres (Teijin Carbon Europe GmbH, Wuppertal, Germany) embedded in a Krempel BD System 120 °C epoxy resin matrix (KREMPEL GmbH, Vaihingen an der Enz, Germany). The fibres exhibit a tensile modulus of 395 GPa and a tensile strength of 4.56 GPa, while the laminate has a fibre volume fraction of 52%. The CFRP face sheet has a total thickness of 1.37 mm and follows a symmetric stacking sequence of [0/45/−45/−45/45/0]. The analyzed impact case corresponds to a projectile velocity of 4.935 km/s. This experiment was selected as a benchmark for numerical model validation, providing ultrasonic measurements of the delamination front together with hole dimensions and post-impact photographs.
The second experimental case, reported by Wan et al. [22], investigates the shielding performance of a hybrid Al/CFRP/Al/CFRP/Al multilayer configuration. The hybrid laminate consists of a five-layer alternating stack of 2024 aluminum alloy and CFRP, which was shown to significantly reduce the peak shock pressure generated during hypervelocity impact. Each aluminum and CFRP layer has a thickness of 1 mm, resulting in a total shield thickness of 5 mm. The CFRP layers were manufactured using a vacuum-assisted resin transfer moulding (VARTM) process with Bisphenol A epoxy resin and T300 carbon fibre fabric, achieving a fibre volume fraction between 45% and 50%. The Mylar projectile has a diameter of 10 mm, a thickness of 0.1 mm, and an impact velocity of 9.2 km/s. Both configurations are presented in Figure 2.
Figure 2.
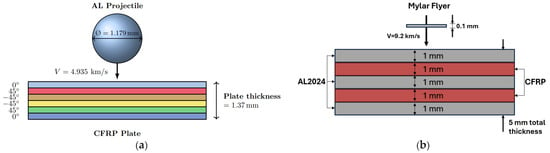
Impact configurations examined in this study. (a) Aluminum projectile impacting CFRP plate; (b) Mylar flyer impacting hybrid Al-CFRP-Al-CFRP-Al shield.
2.2. HVI-LS Analogy Framework
To enable a direct comparison with HVI, the LS loading is treated as an impulsive mechanical load, and the material response under both loading conditions is assumed to be governed by the same constitutive models, while thermal effects associated with laser irradiation are neglected.
This treatment follows the original formulations of the analogy and is supported by the physics of the interaction in the present intensity regime. Above approximately 108–109 W/cm2 the laser–matter interaction is dominated by the formation of an absorbing vapour plasma above the target surface: most of the laser energy is consumed in heating and ionizing that plasma, and only a small fraction is deposited onto the solid, the plasma being furthermore self-regulating in a manner that bounds the flux reaching the surface [16]. The laser therefore acts on the target as a recoil pressure source rather than as a thermal flux source.
Two further considerations support the use of a single set of constitutive models. First, the principle of late-stage equivalence, on which the analogy rests, states that two loadings creating the same flow and pressure fields before strength and strain effects become important will produce the same crater, so that the detailed early-time pressure history may differ without affecting the outcome [16,17]; the near-surface region in which the two processes genuinely differ is therefore precisely the region whose details this principle declares immaterial. Second, the material immediately at the loaded surface is consumed in both processes, the impact interface is melted or vaporized in HVI, and the ablation layer is removed in LS and so contributes to neither set of damage metrics. On this basis Aubert concludes, both in his doctoral thesis [23] and in the later experimental study [11], that the material affected thermally by the laser is confined to a layer negligible relative to the crater, and that the craters produced by laser irradiation may accordingly be regarded as determined entirely by the pressure law generated at the target surface. The same criterion is applied to the configurations of the present work in Section 5, and the limits of the assumption are discussed in Section 6.
The adopted procedure for identifying an equivalent laser shock loading consists of calibrating the pressure pulse parameters to reproduce the response obtained from hypervelocity impact simulations. Initially, an HVI numerical model is developed and validated against experimental data. The validated model is subsequently used as the reference case, from which key quantities, including peak pressure, stress wave propagation, delamination, and crater characteristics, are extracted. A series of LS simulations is then performed by varying the pressure amplitude and pulse duration.
An initial approximation of the equivalent laser parameters is obtained using Pirri’s one-dimensional assumptions, according to which the laser focal spot diameter is primarily related to the projectile diameter, the laser pulse duration corresponds to the projectile length, and the laser intensity is associated with the projectile velocity [16]. Because the analogy is stated as a duplication of the surface pressure–time history [16,17], the procedure is not specific to a target material or a laminate architecture. An iterative procedure is subsequently employed to adjust the LS loading parameters until comparable cross-sectional damage and crater formation are achieved. For each investigated LS loading, the discrepancy with respect to the corresponding HVI reference was quantified using the relative residual
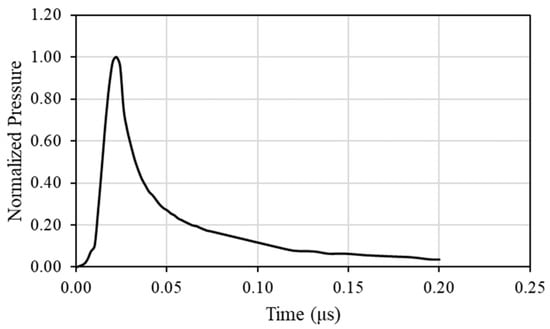
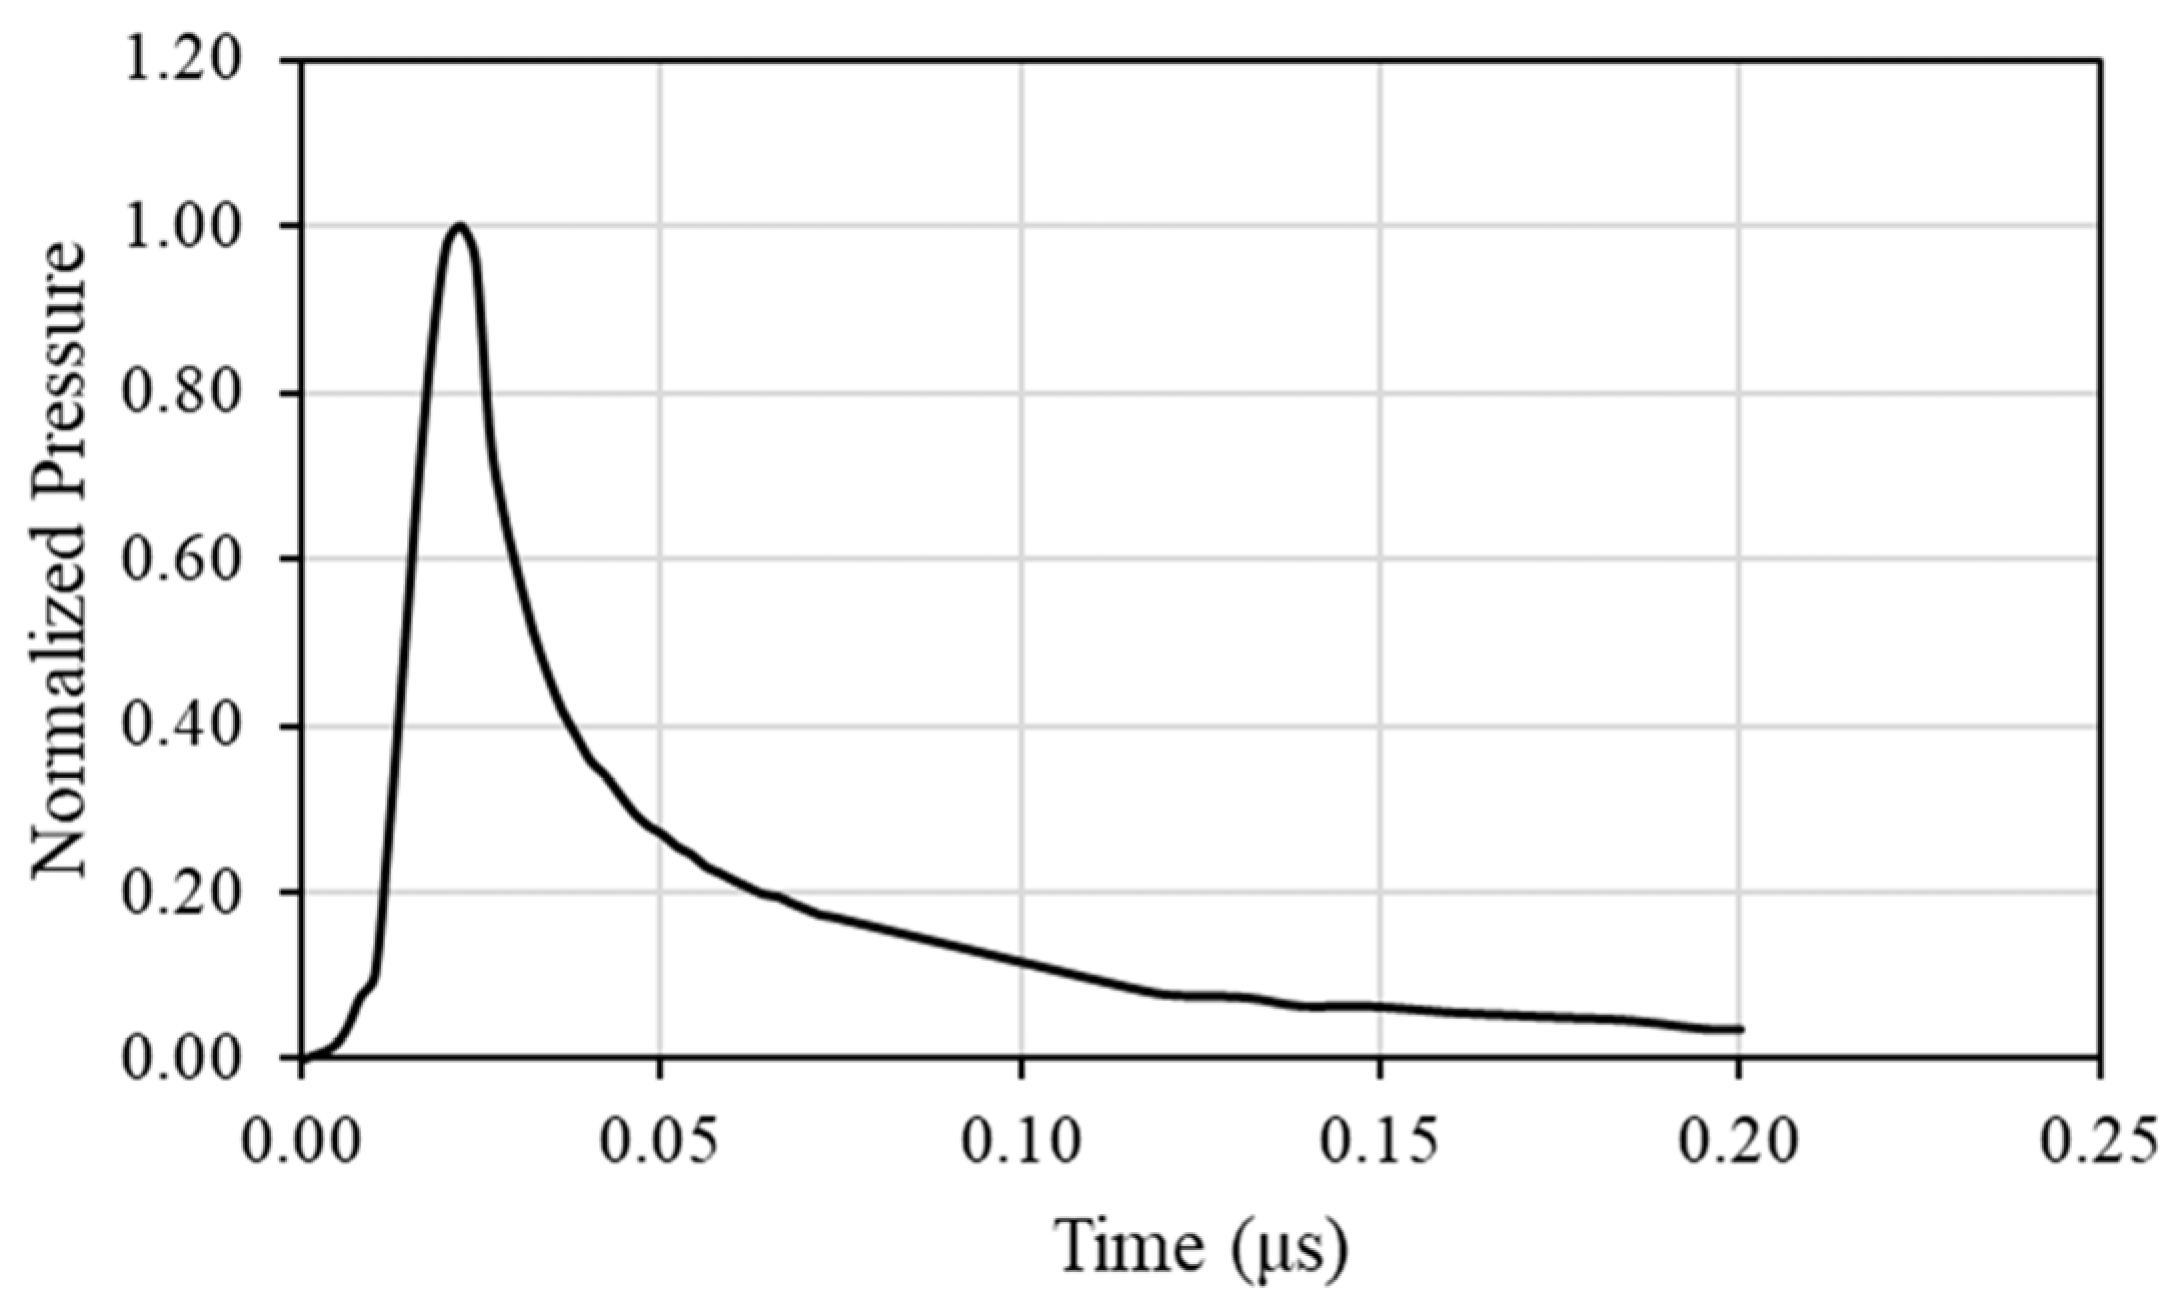
where denotes the response quantity considered in the comparison, such as damaged area, delamination area, crater/hole diameter, or back-face displacement. The identification was performed through a discrete parameter sweep, with the residuals reported in Section 4. Figure 3 illustrates the pressure profile employed in the numerical modelling of laser-driven shock-wave propagation
Figure 3.
Typical pressure loadings onto targets used for laser shock simulations [24].
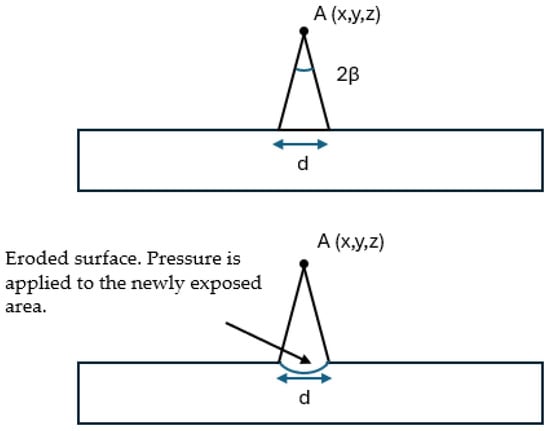
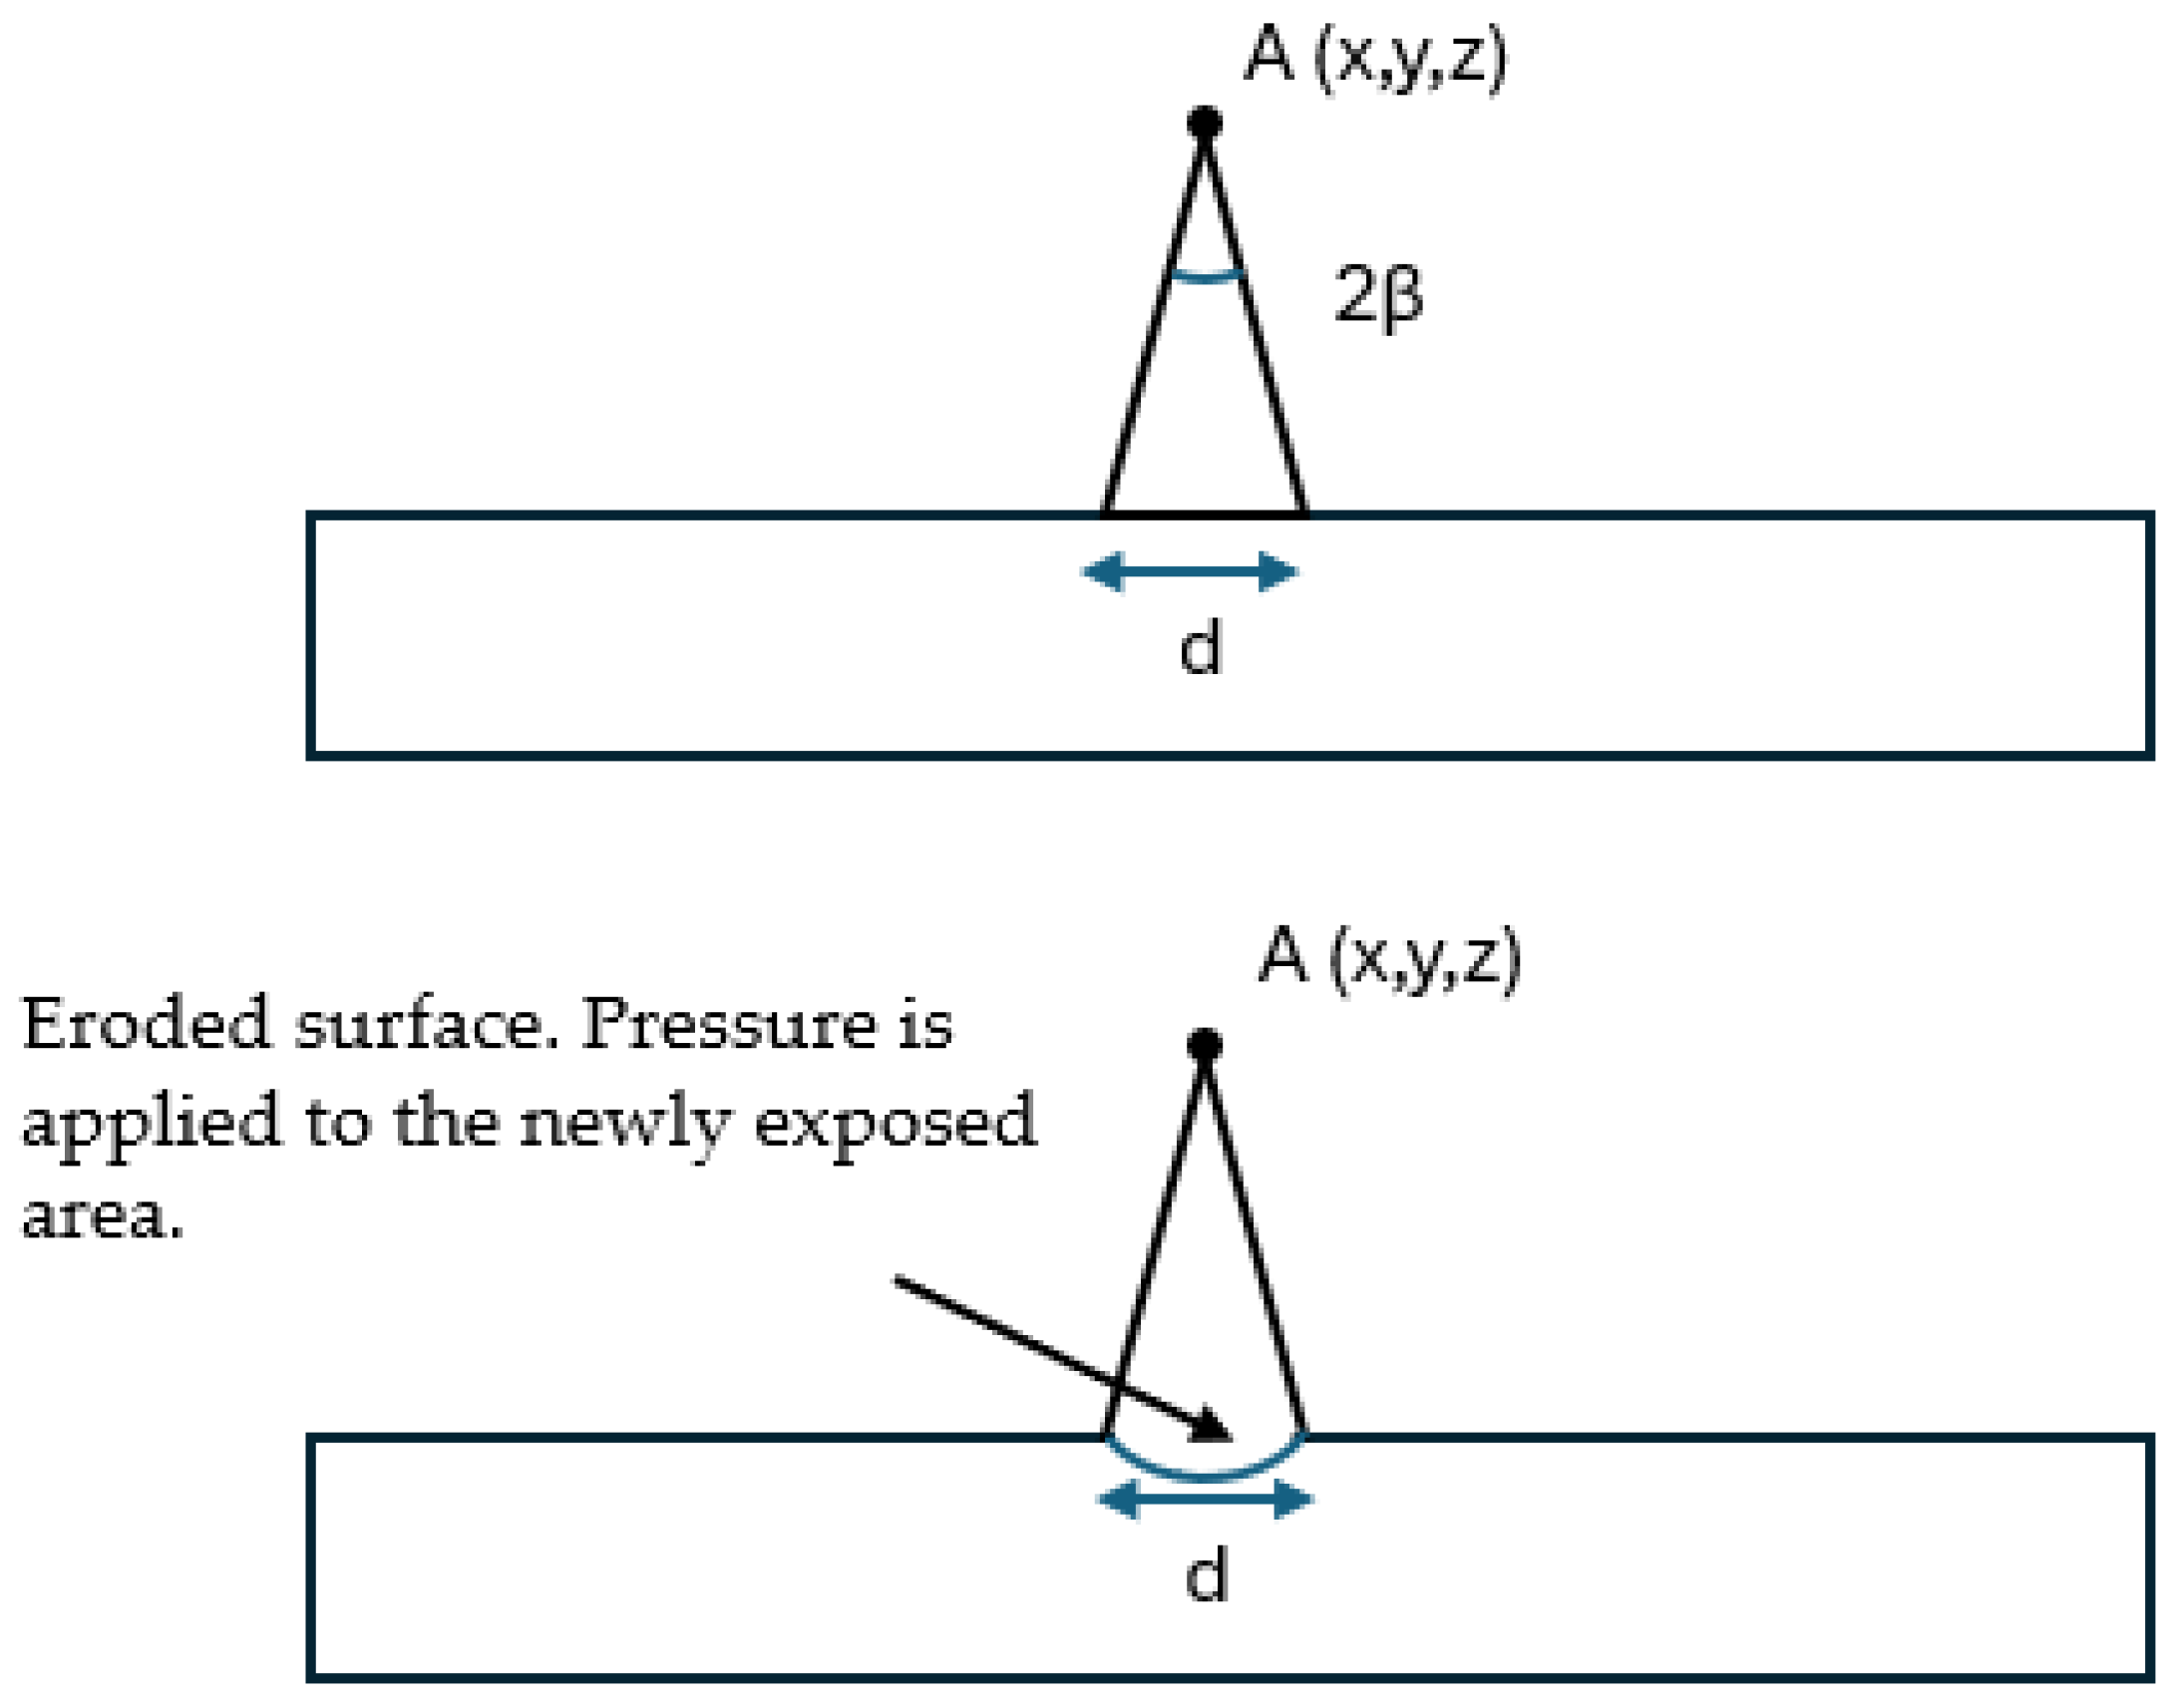
The temporal and spatial form of the applied load is specified as follows. Temporally, the pressure follows a Gaussian profile. Spatially, the pressure is applied as a flat-top distribution, uniformly and at equal amplitude over the whole circular focal area of diameter d and without radial decay, this area being obtained by projection from the point A with cone half-angle β as described below.
The ablation pressure, , generated by direct laser irradiation depends on the absorbed laser intensity, , the laser wavelength, , the pulse duration, , the focal spot radius, , and the target material properties, characterized by the atomic number, , and mass number, . Several scaling laws have been proposed in the literature to estimate the peak ablation pressure. Among the most widely used, the formulations of Grün, Dautray, Pirri, and Phipps are adopted in the present study, as summarized in Table 1.
Table 1.
Laser ablation pressure scaling laws for direct irradiation in vacuum [23].
In the present work, these formulations are used inversely to establish a numerical analogy between HVI and LS loading. The peak HVI-equivalent laser shock pressure is used as input to determine the equivalent laser intensity by rearranging each scaling law. For instance, the Grün formulation yields:
Analogous inversions are applied to the remaining three scaling laws. The use of multiple formulations provides a range of predicted intensities, reflecting the inherent uncertainty in ablation pressure estimation across different laser regimes. The Grün and Pirri formulations are generally considered reliable at moderate intensities ( ), while the Dautray formulation is better suited to ultra-high intensities ( ). The laser focal spot diameter is taken equal to the effective impact diameter obtained from the HVI simulation. The corresponding laser energy is finally obtained from
where is the laser spot area. This procedure enables the translation of HVI-induced loading conditions into equivalent, experimentally achievable laser shock parameters, ensuring consistency in peak pressure, pulse duration, and spatial extent of the applied load.
*LOAD_ERODING_PART_SET was used to reproduce the laser-induced shock in LS-DYNA, which applies the calibrated ablation pressure pulse directly onto the surfaces of the irradiated target. Unlike a conventional pressure load defined on a fixed set of segments, this keyword continues to load the newly exposed surfaces that are revealed as the outermost layer of elements is progressively eroded and deleted during the simulation.
The LS focal spot is defined geometrically by specifying a point in space together with a half-angle, , as illustrated in Figure 4. The pressure is assumed to originate from point and is projected onto the target surface, forming a circular loading area whose diameter, , is determined by the position of point relative to the surface and the cone half-angle, . As the surface progressively erodes, the pressure continues to be projected from point onto the newly exposed crater surface, thereby maintaining a physically consistent loading area throughout the duration of the applied pulse. This methodology is necessary to ensure that the loading phase delivers the full intended energy to the material. Under high pressures, early element erosion can break the boundary surface and interrupt the loading before the pulse is fully applied. One could argue that for certain loading conditions, a standard *LOAD_SEGMENT_SET may still be appropriate if only part of the boundary layer erodes. Physically, this behaviour is realistic, as the pressure generated by plasma expansion continues to act on the surface even when significant damage, of any mode, has already occurred. The influence of this choice is assessed in Section 4.2.3, where the identified case is repeated with a fixed loading surface.
Figure 4.
Schematic of the laser shock loading applied through the *LOAD_ERODING_PART_SET keyword.
It should be emphasized, however, that element deletion in the present models is governed by the mechanical failure criteria of the constitutive models employed and is not equivalent to the physical recession of the irradiated surface produced by vaporization. The approach is nonetheless appropriate for the purpose for which it is used here, as the laser load is applied as a prescribed pressure acting on the target surface, the ablation physics being condensed into that pressure history rather than resolved as a mass-removal process. This practice is consistent with laser shock simulation literature [11,16,17,23]. Additionally, the ablation layer is insignificant compared to the thickness of the target, thus thickness variation can be safely ignored.
3. Numerical Modelling
3.1. Modelling of the CFRP Plate
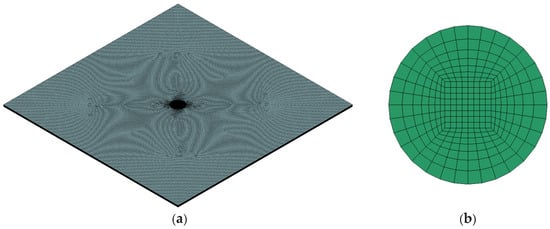
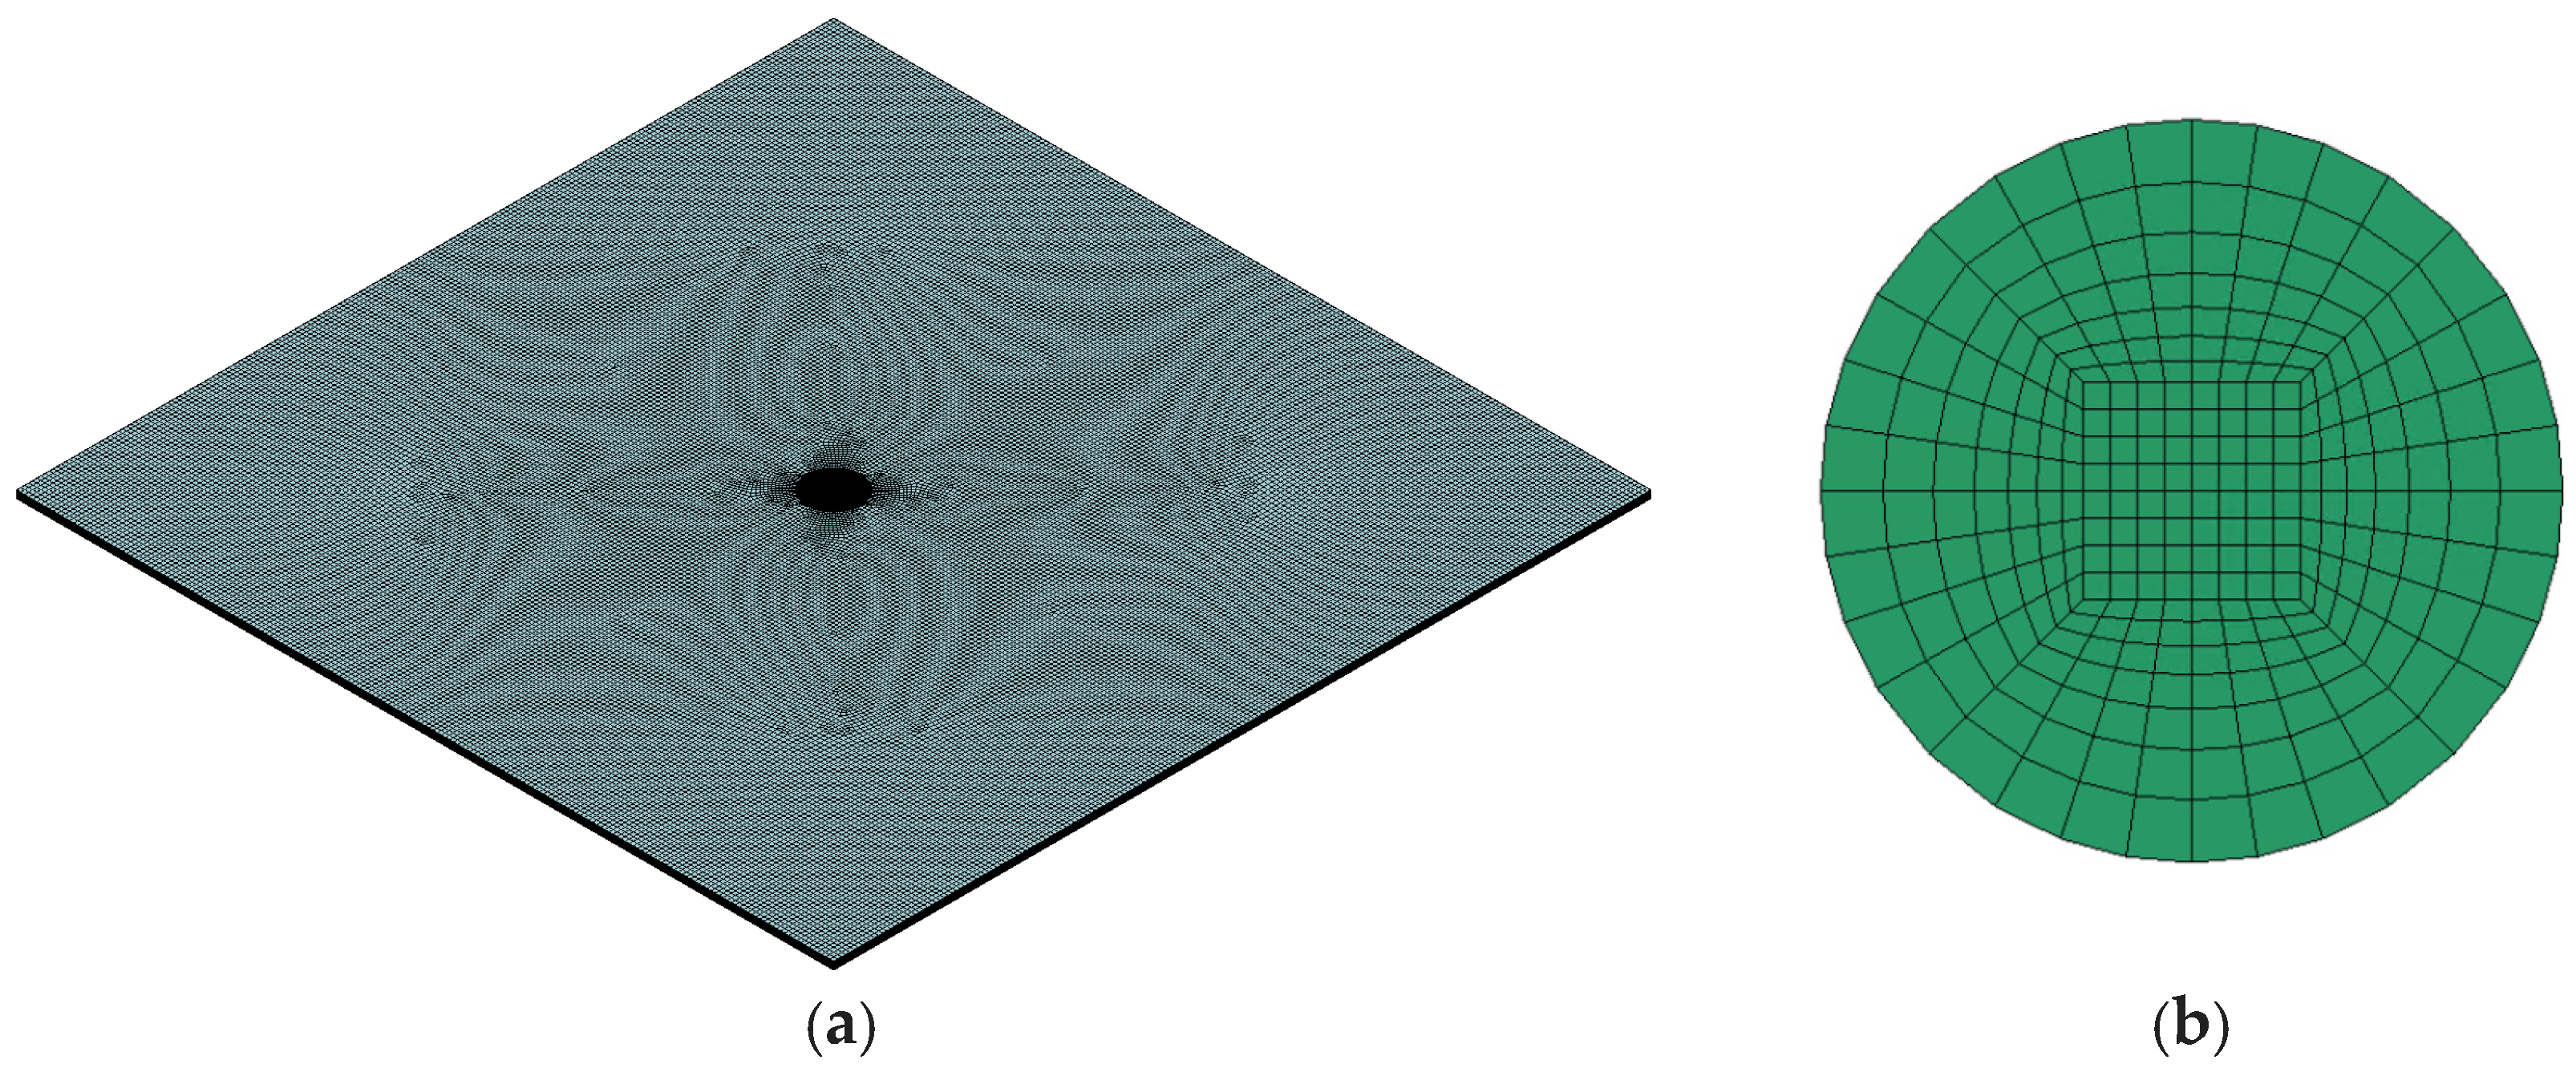
The model consists of a CFRP plate with dimensions of 150 × 150 × 1.3698 mm3 and an aluminum projectile with a diameter () of 1.179 mm. A Lagrangian Finite Element Method (FEM) was employed for both the projectile and the target using hexahedral solid elements with 3 translational DOFs per node. For the CFRP plate, a refined mesh, shown in Figure 5a, was adopted with a characteristic element size of 0.14 mm in the impact region. To support the plate, nodes at all edges were constrained in all translational directions.
Figure 5.
Numerical model: (a) plate—refined mesh isometric view; (b) projectile—spherified cube mesh cross-section view.
The projectile was modelled using a spherified cube mesh comprising 3200 elements, as shown in Figure 5b. This meshing approach provides a more uniform element distribution along the sphere radius and improved element aspect ratios around its circumference compared with the default spherical mesh available in LS-DYNA [25].
To model the interaction between the aluminum projectile and the CFRP plate, the *CONTACT_ERODING_SURFACE_TO_SURFACE keyword was employed, with the projectile defined as the master surface and the CFRP plate as the slave surface. In addition, to account for internal spallation of both the projectile and the plate, which may cause newly created internal surfaces to come into contact during material erosion, the *CONTACT_INTERIOR keyword was applied to the entire set of solid elements. This contact algorithm automatically detects and enforces contact between internal surfaces generated as elements are progressively eroded during the simulation.
To capture the anisotropic behaviour and progressive damage of the CFRP laminate, the *MAT_162_COMPOSITE_MSC_DMG material model was adopted. This constitutive model enables the simulation of damage initiation and evolution in both unidirectional (UD) and plain weave (PW) composites, allowing the representation of the principal failure mechanisms observed in CFRP laminates, including fibre fracture, matrix cracking, and delamination initiation [26]. The material properties of the CFRP laminate are summarized in Table 2.
Table 2.
Data set of CFRP material model [21].
To accurately simulate the high-strain-rate response (>105 s−1) associated with hypervelocity impact events, the aluminum projectile was modelled using the Johnson–Cook (J–C) strength model coupled with the Mie–Grüneisen equation of state (EOS).
The J–C model is an ideal rigid–plastic constitutive relationship that accounts for strain hardening, strain rate strengthening, and thermal softening, as defined by:
In this formulation, represents the initial yield strength, while and are the strain-hardening constant and exponent, respectively. The influence of the strain rate is captured by the coefficient referencing the plastic strain rate against the reference rate . Thermal softening is accounted for by the index and the homologous temperature defined as where is the ambient temperature and is the material melting point. To characterize the hydrodynamic pressure response, the Mie–Grüneisen Equation of State was implemented. For materials under compression (), the pressure is governed by:
Conversely, for expanded states (), the relationship simplifies to:
In these equations, denotes the initial material density, represents the bulk speed of sound, and is the Grüneisen coefficient. The parameters , , and correspond to the Hugoniot slope coefficients, while indicates the internal energy per unit volume. The nominal strain is defined by the ratio of current density to initial density as . The material properties of the aluminum projectile, along with the corresponding Mie–Grüneisen parameters are summarized in Table 3.
While the Johnson–Cook (J–C) model effectively captures the influence of temperature and strain rate on the yield stress, it does not account for the high-pressure hydrodynamic effects that dominate hypervelocity impact events. Therefore, the Mie–Grüneisen equation of state (EOS) was employed to describe the pressure–volume relationship under both compression and expansion. With regard to material failure, the J–C failure model was used to simulate compressive failure. However, a major challenge in modelling hypervelocity impacts is the accurate representation of spallation, which occurs when compressive stress waves reflect from free surfaces as high-amplitude tensile waves. Since the J–C failure model cannot independently capture spall failure, and the Grady–Spall model is not available in LS-DYNA, a maximum tensile stress failure criterion was implemented as an appropriate approximation [27]. Following established numerical benchmarks [28], a tensile failure threshold of 2.6 GPa was adopted to accurately reproduce the internal spallation of the aluminum projectile.
Table 3.
Johnson–Cook material model [29].
3.2. Al-CFRP-Al-CFRP-Al Shield
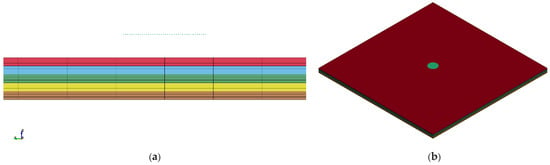
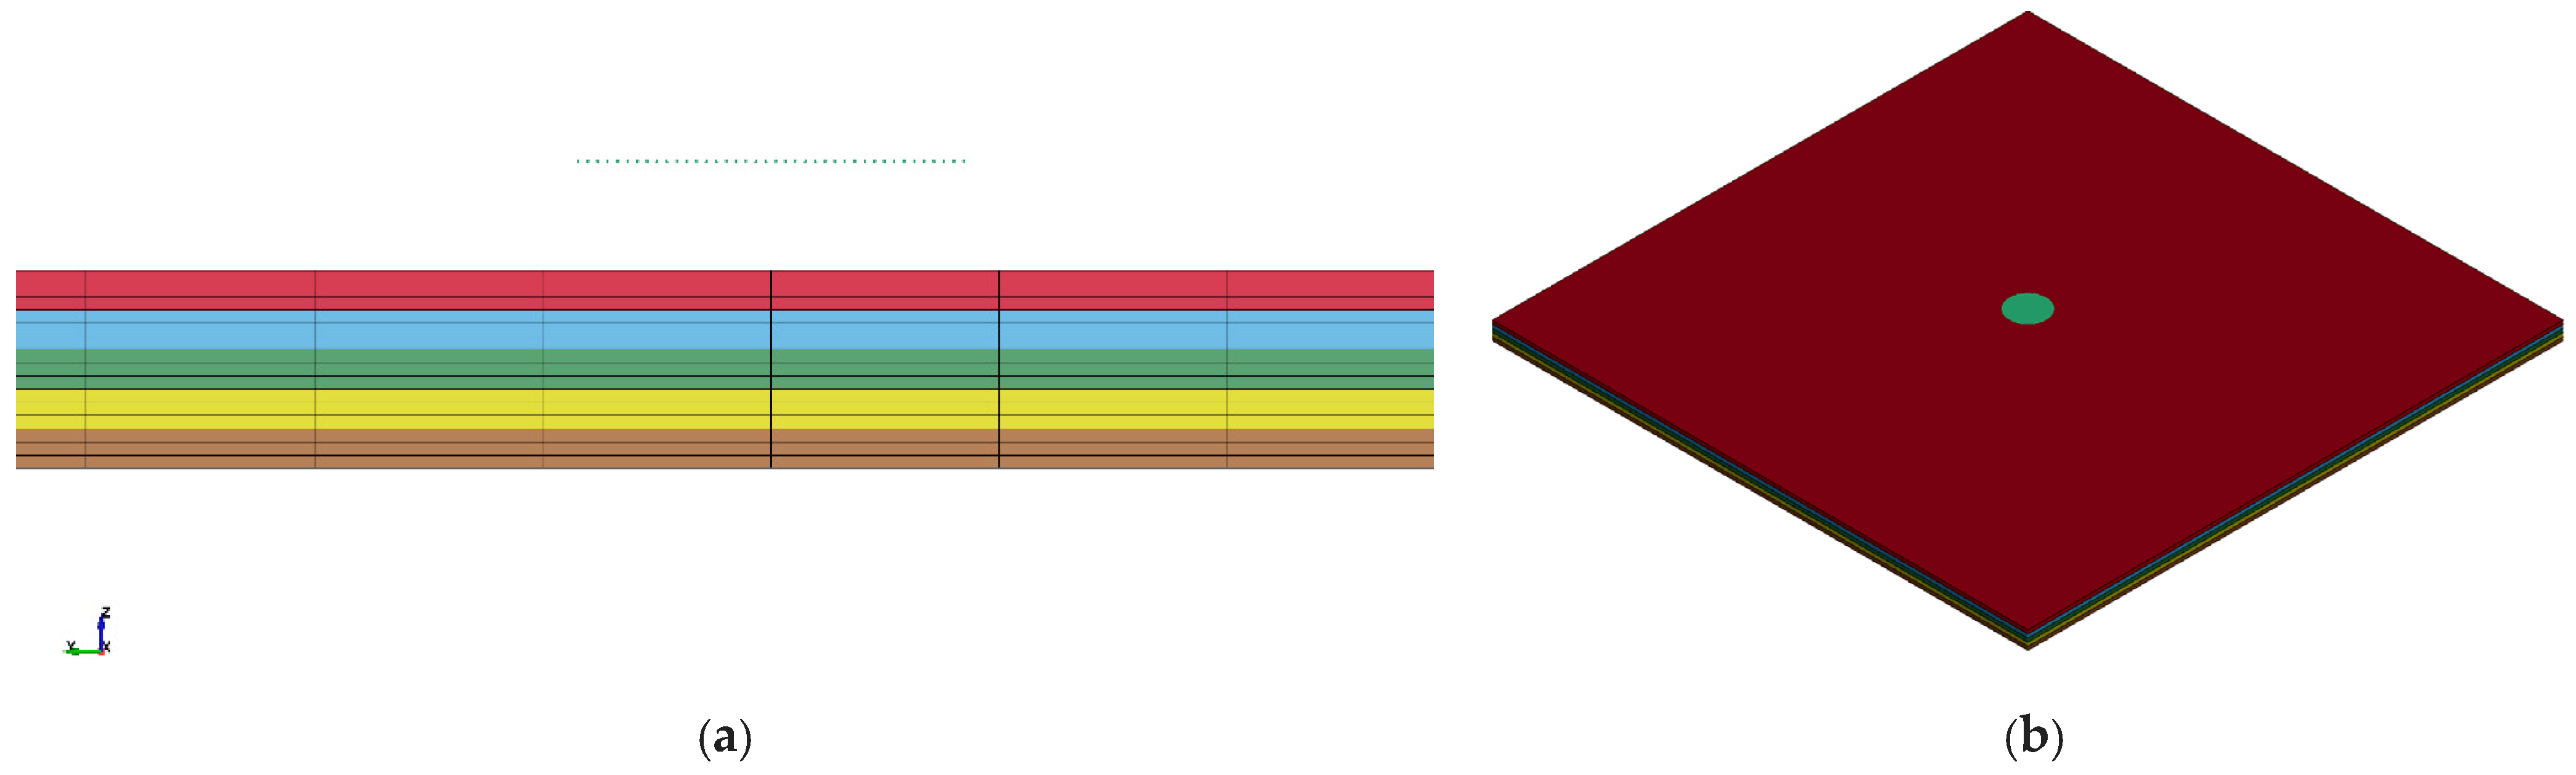
The alternating Al/CFRP/Al/CFRP/Al shield configuration is shown in side view in Figure 6a and in isometric view in Figure 6b. To accurately capture the compressible, fluid-like behaviour of the 0.1 mm-thick Mylar flyer under hypervelocity loading, a Smoothed Particle Hydrodynamics (SPH) formulation was adopted for its modelling. The multilayer shield, with dimensions of 150 mm × 150 mm and a total laminate thickness of 5 mm, was discretized using hexahedral 8-noded solid elements with three DOFs per node. Both the SPH particle spacing and the finite element characteristic length were set to 0.25 mm. For the selected 0.25 mm in-plane SPH spacing, the 10 mm diameter flyer is represented by approximately 40 × 40 particles in-plane and one particle through its 0.1 mm thickness. All nodes at the edges of the shield were constrained in all translational directions.
Figure 6.
FEM-SPH numerical model: (a) side cross-sectional view; (b) isometric view.
To model the interaction between the SPH particles and the finite element mesh, the *CONTACT_ERODING_NODES_TO_SURFACE keyword was employed using a node-to-surface erosion contact formulation. In this definition, the SPH particles, represented as single nodes, were assigned as the slave nodes, while the finite element mesh was defined as the master surface. Due to the absence of the material parameters required by *MAT_162, whose calibration would require extensive experimental characterization, *MAT_59_COMPOSITE_FAILURE_SPH_MODEL was adopted as a more practical alternative. This orthotropic composite material model in LS-DYNA captures the principal failure mechanisms relevant to hypervelocity impact, including compressive and shear, failure modes. Its constitutive formulation of the deviatoric stress–strain response, together with the associated damage criteria, provides an adequate representation of the composite behaviour without requiring an additional equation of state. The elastic properties and damage model parameters for the T300 woven CFRP are summarized in Table 4.
Table 4.
Material properties and damage model parameters of quasi-isotropic CFRP [30].
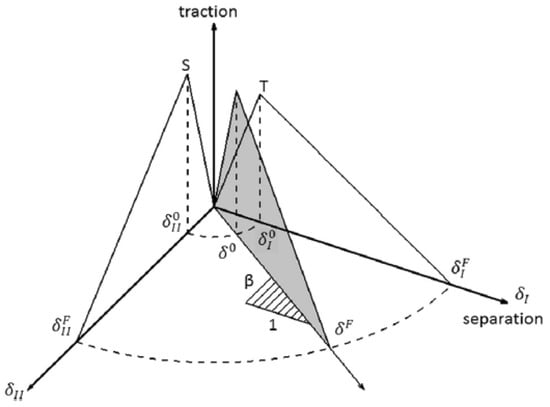
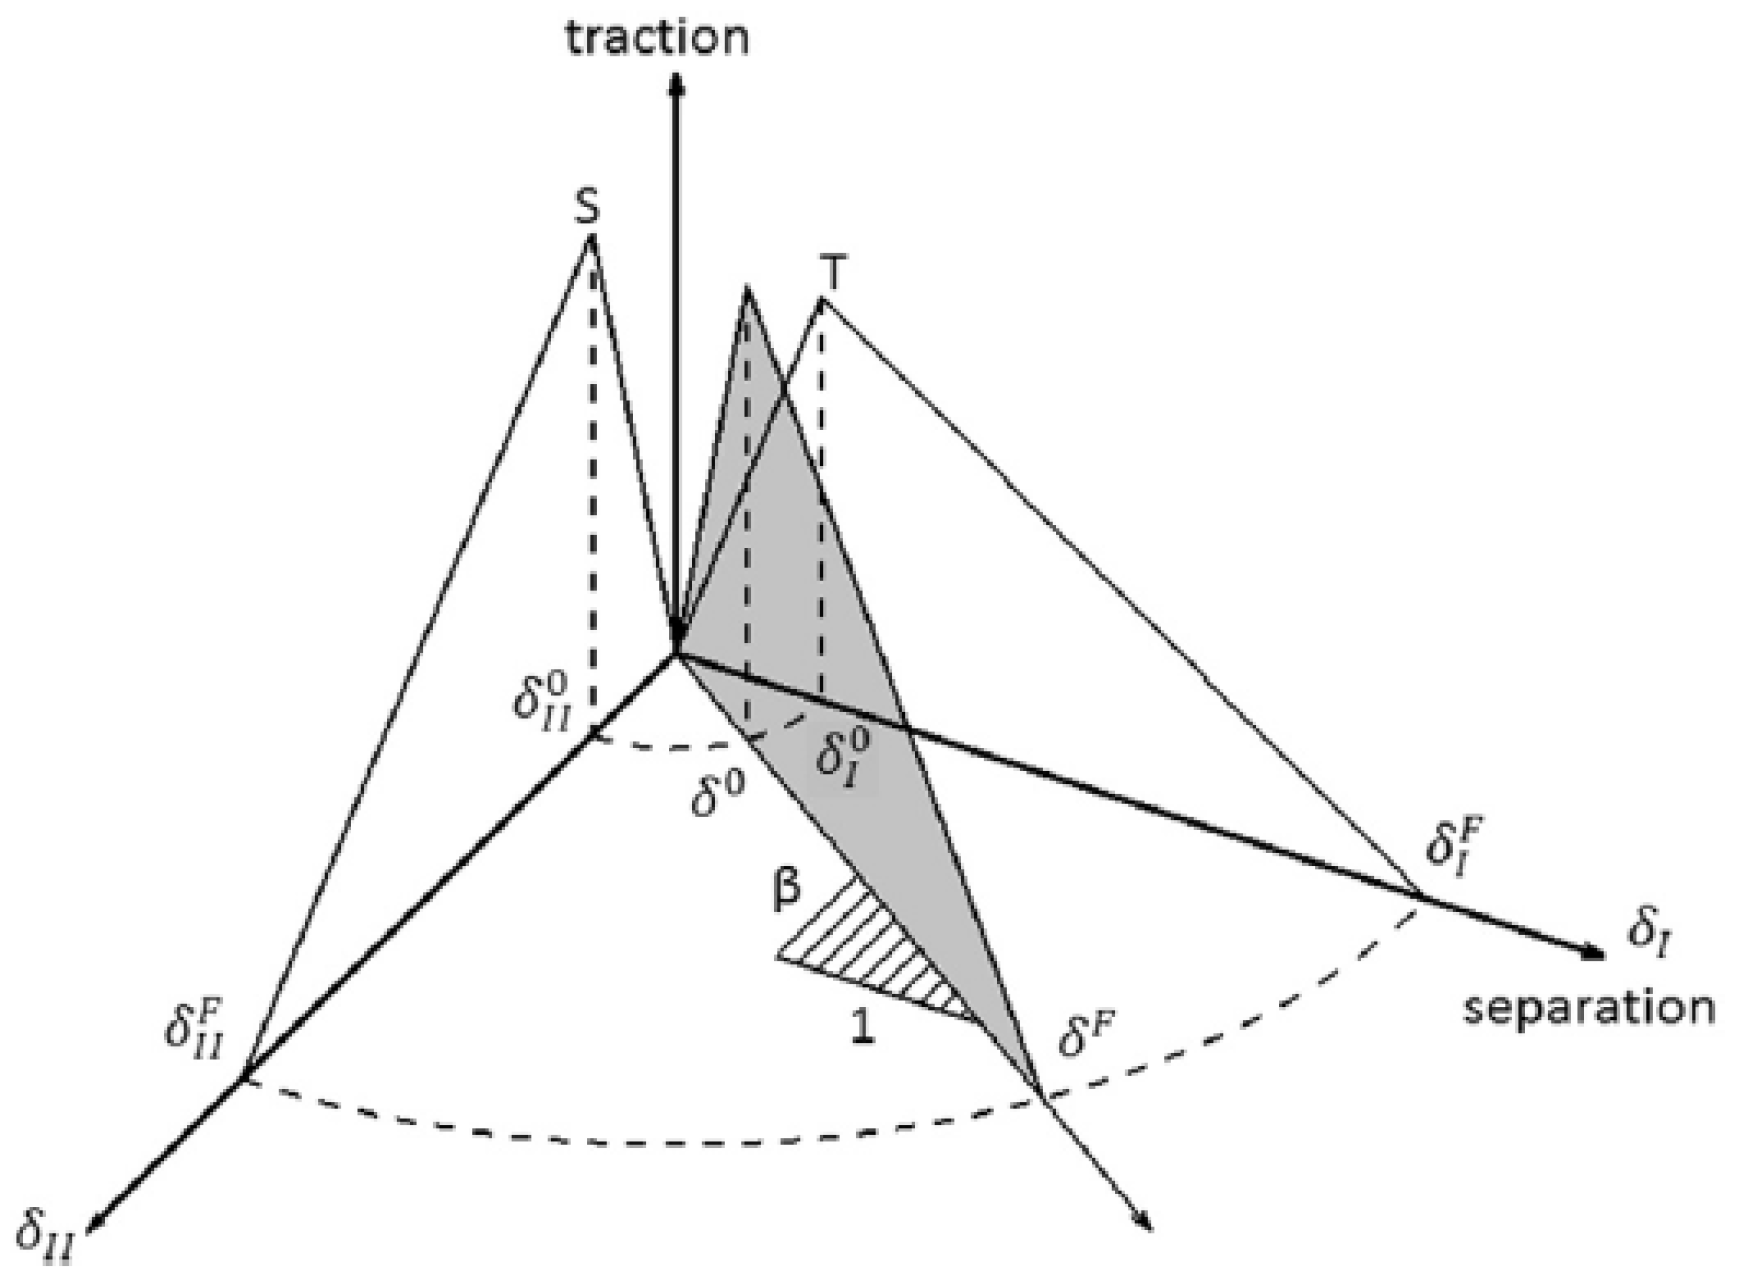
To model the delamination between adjacent CFRP and AL2024 layers, four zero-thickness cohesive interfaces were introduced using the *MAT_138_COHESIVE_MIXED_MODE material model. This model implements a bilinear traction–separation law, as illustrated in Figure 7.
Figure 7.
Schematic representation of the mixed-mode bilinear traction separation law [31].
The cohesive parameters that have been used are presented in Table 5. The ultimate mixed-mode displacement, for the power law were calculated by Equation (7)
where is the mode-mixity, is the onset relative displacement, and are the normal and in-plane cohesive stiffness, respectively, and is the exponent of the mixed-mode criterion. For the simulations = = 1 × 10⁶ N/mm and value equals 2.
Table 5.
Ply interface cohesive parameters [30,32].
The behaviour of the polymeric Mylar flyer is governed primarily by impact-induced pressure, making its mechanical properties of secondary importance. Consequently, its response can be adequately described using only an equation of state (EOS). As in the previous simulation, the Mie–Grüneisen EOS was employed to capture the evolution of pressure, internal energy, and density during shock-wave propagation. The material density was defined using the *MAT_NULL keyword in LS-DYNA. Similarly, the aluminum layers were modelled using the Johnson–Cook strength model coupled with the Mie–Grüneisen EOS to accurately represent their constitutive response under hypervelocity loading. The material properties and EOS parameters for both Mylar and aluminum are summarized in Table 6.
Table 6.
J–C constitutive law model and damage model parameters for AL2024 and Mie–Gruneisen EOS parameters of AL2024 and Mylar [30].
3.3. Explicit Methodology Controls
All simulations, both hypervelocity impact (HVI) and laser shock configurations, were solved using LS-DYNA’s explicit central-difference integration scheme. The stable time step was computed automatically according to the Courant–Friedrichs–Lewy (CFL) condition, where LS-DYNA evaluates a critical time step for each element based on its characteristic length and material wave speed,
The global time step is taken as the minimum across all elements, where is the characteristic length of the smallest element and c the speed where stress waves propagate inside the material. For all models, this solver-computed critical value is reduced by 80% to ensure stability under the extreme loading rates.
Hourglass control was applied consistently using Hourglass Type 1 (IHQ = 1), corresponding to the standard LS-DYNA viscous hourglass formulation, to suppress zero-energy deformation modes associated with reduced-integration solid elements. This method prevents hourglass distortions without adding significant numerical damping, preserving the fidelity of stress wave propagation and failure evolution in both loading regimes.
No mass scaling, time scaling, or additional numerical damping were used in any of the simulations. This ensures that inertial response, shock propagation, and failure processes evolved strictly according to the physical material properties and applied loads.
Simulation termination times were selected on a case-by-case basis according to stabilization of the relevant response quantities rather than by adopting a common fixed duration for all analyses. Each simulation was continued until the quantities used for comparison, including delamination extent, total damaged area, crater/hole dimensions, and back-face displacement, had effectively ceased to evolve. The selected duration was also sufficient for the dominant stress wave to traverse the target thickness, reflect from the rear free surface, and for the associated reflected-wave response and any resulting spallation to develop.
4. Results
4.1. CFRP Plate
4.1.1. Mesh Convergence Study
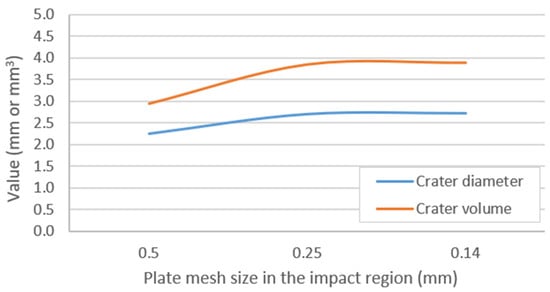
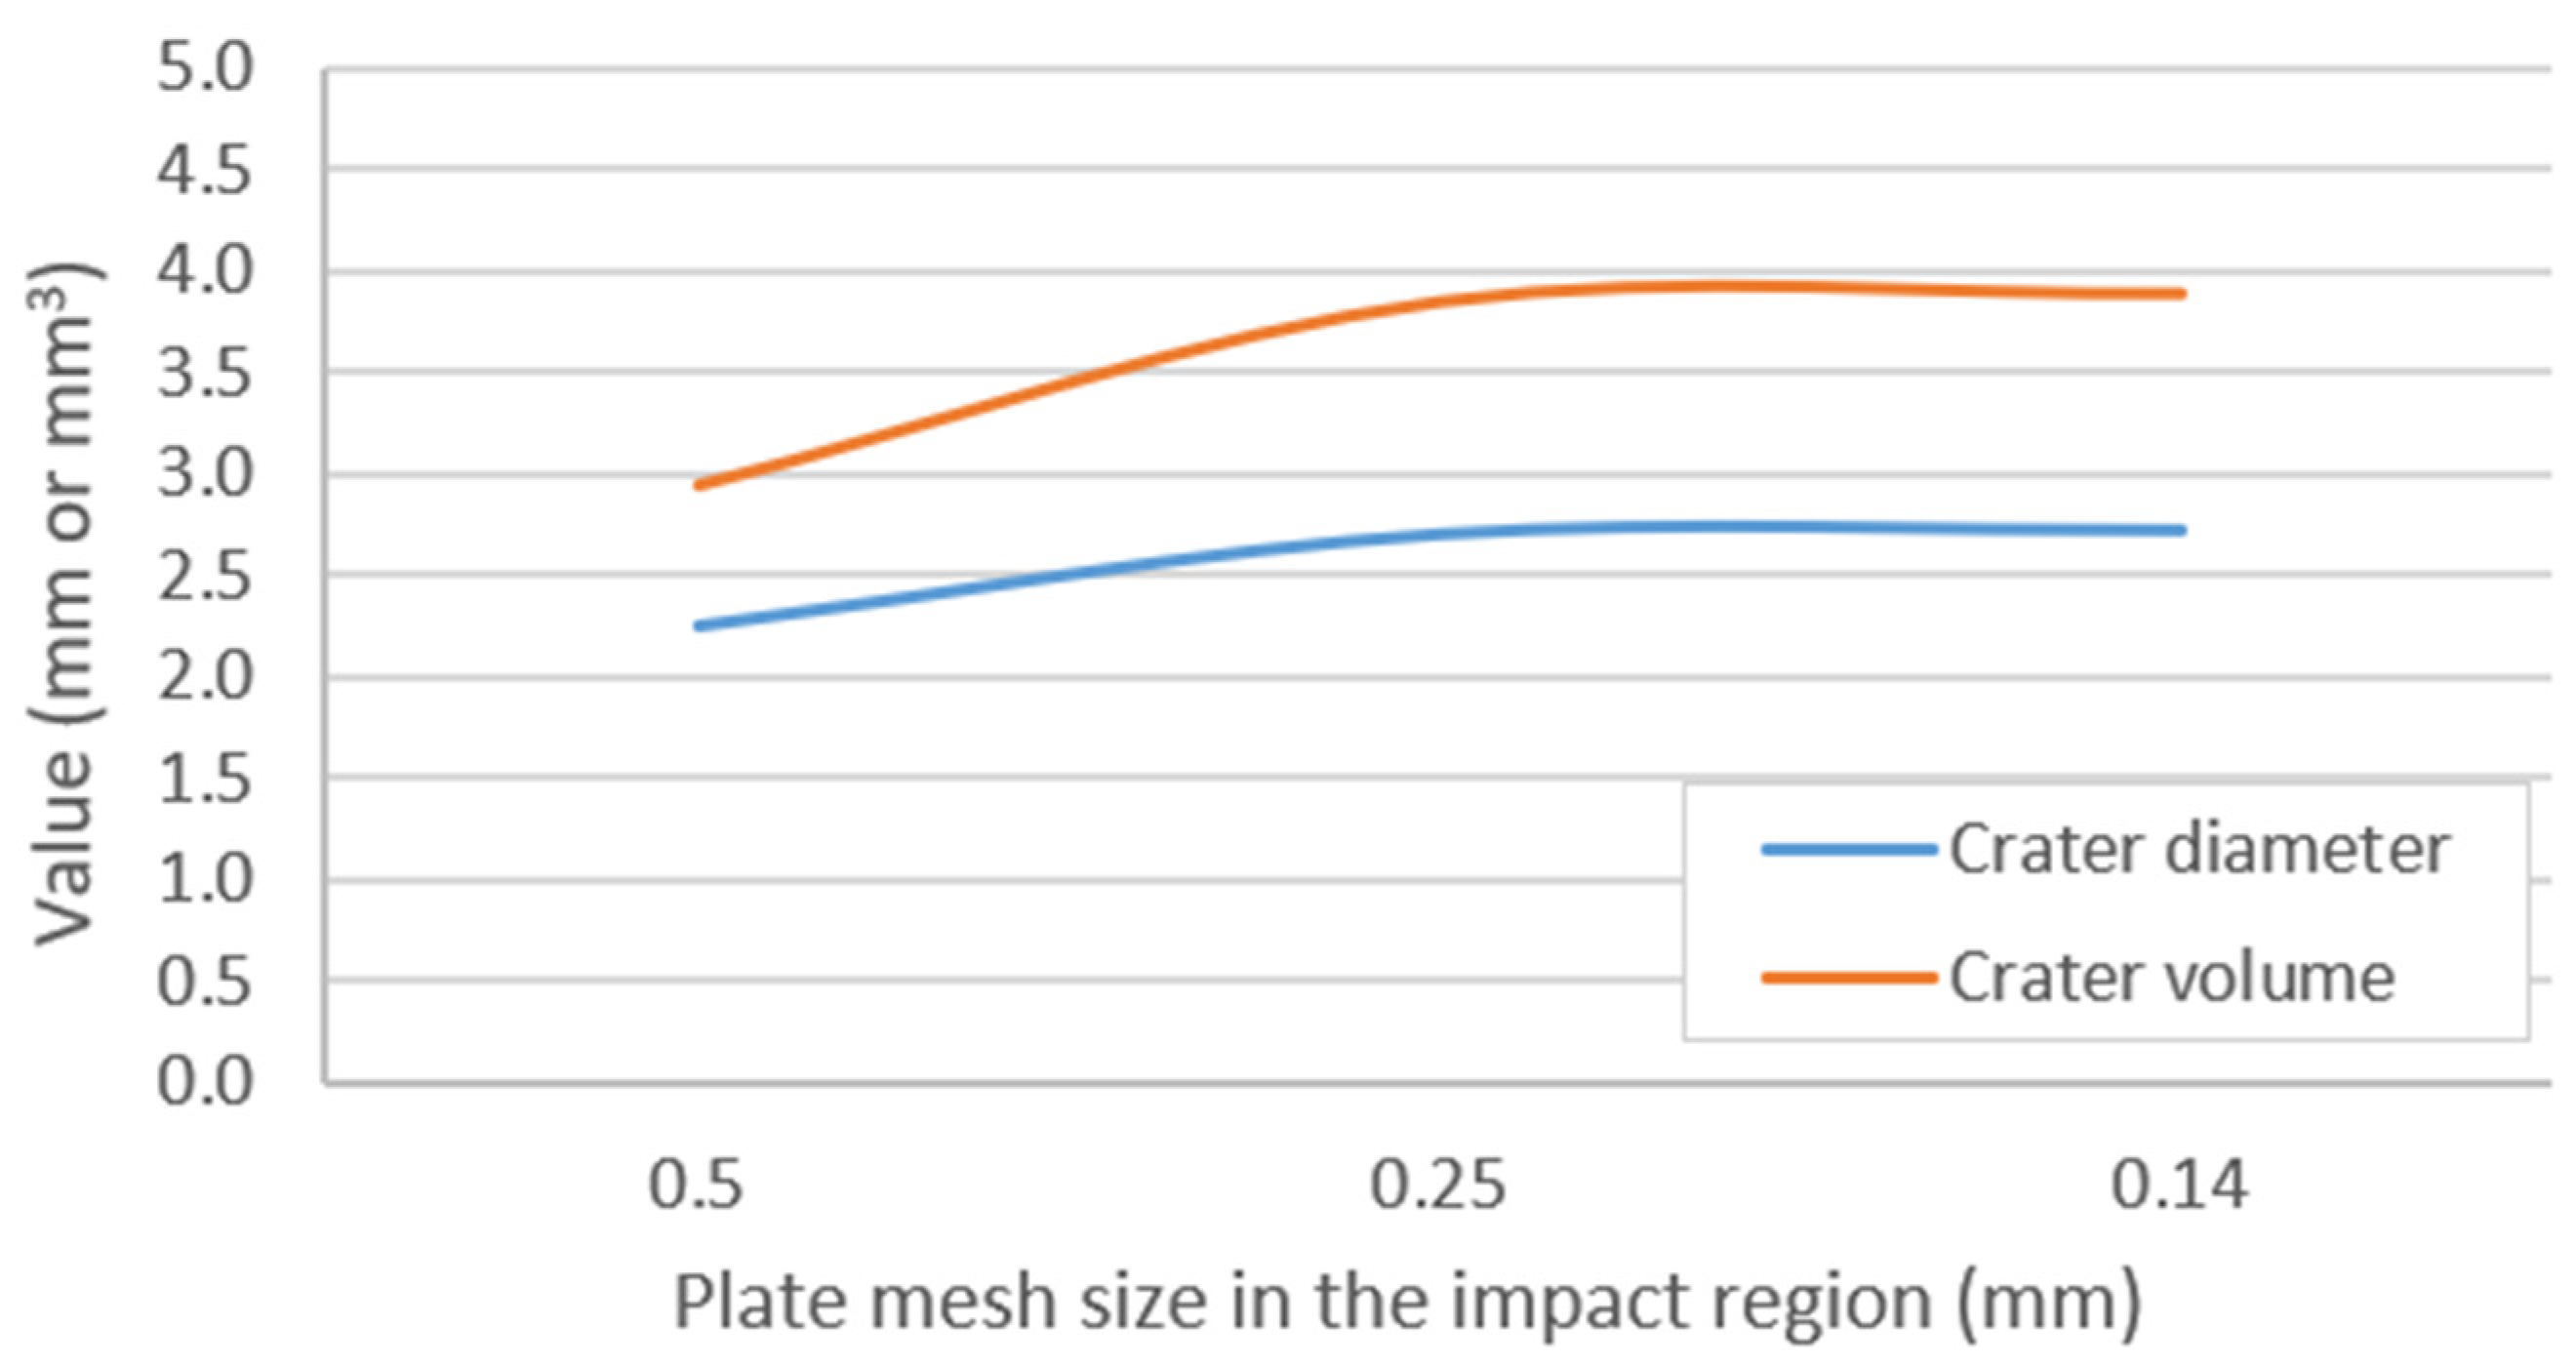
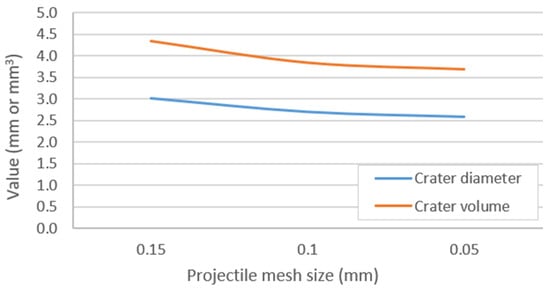
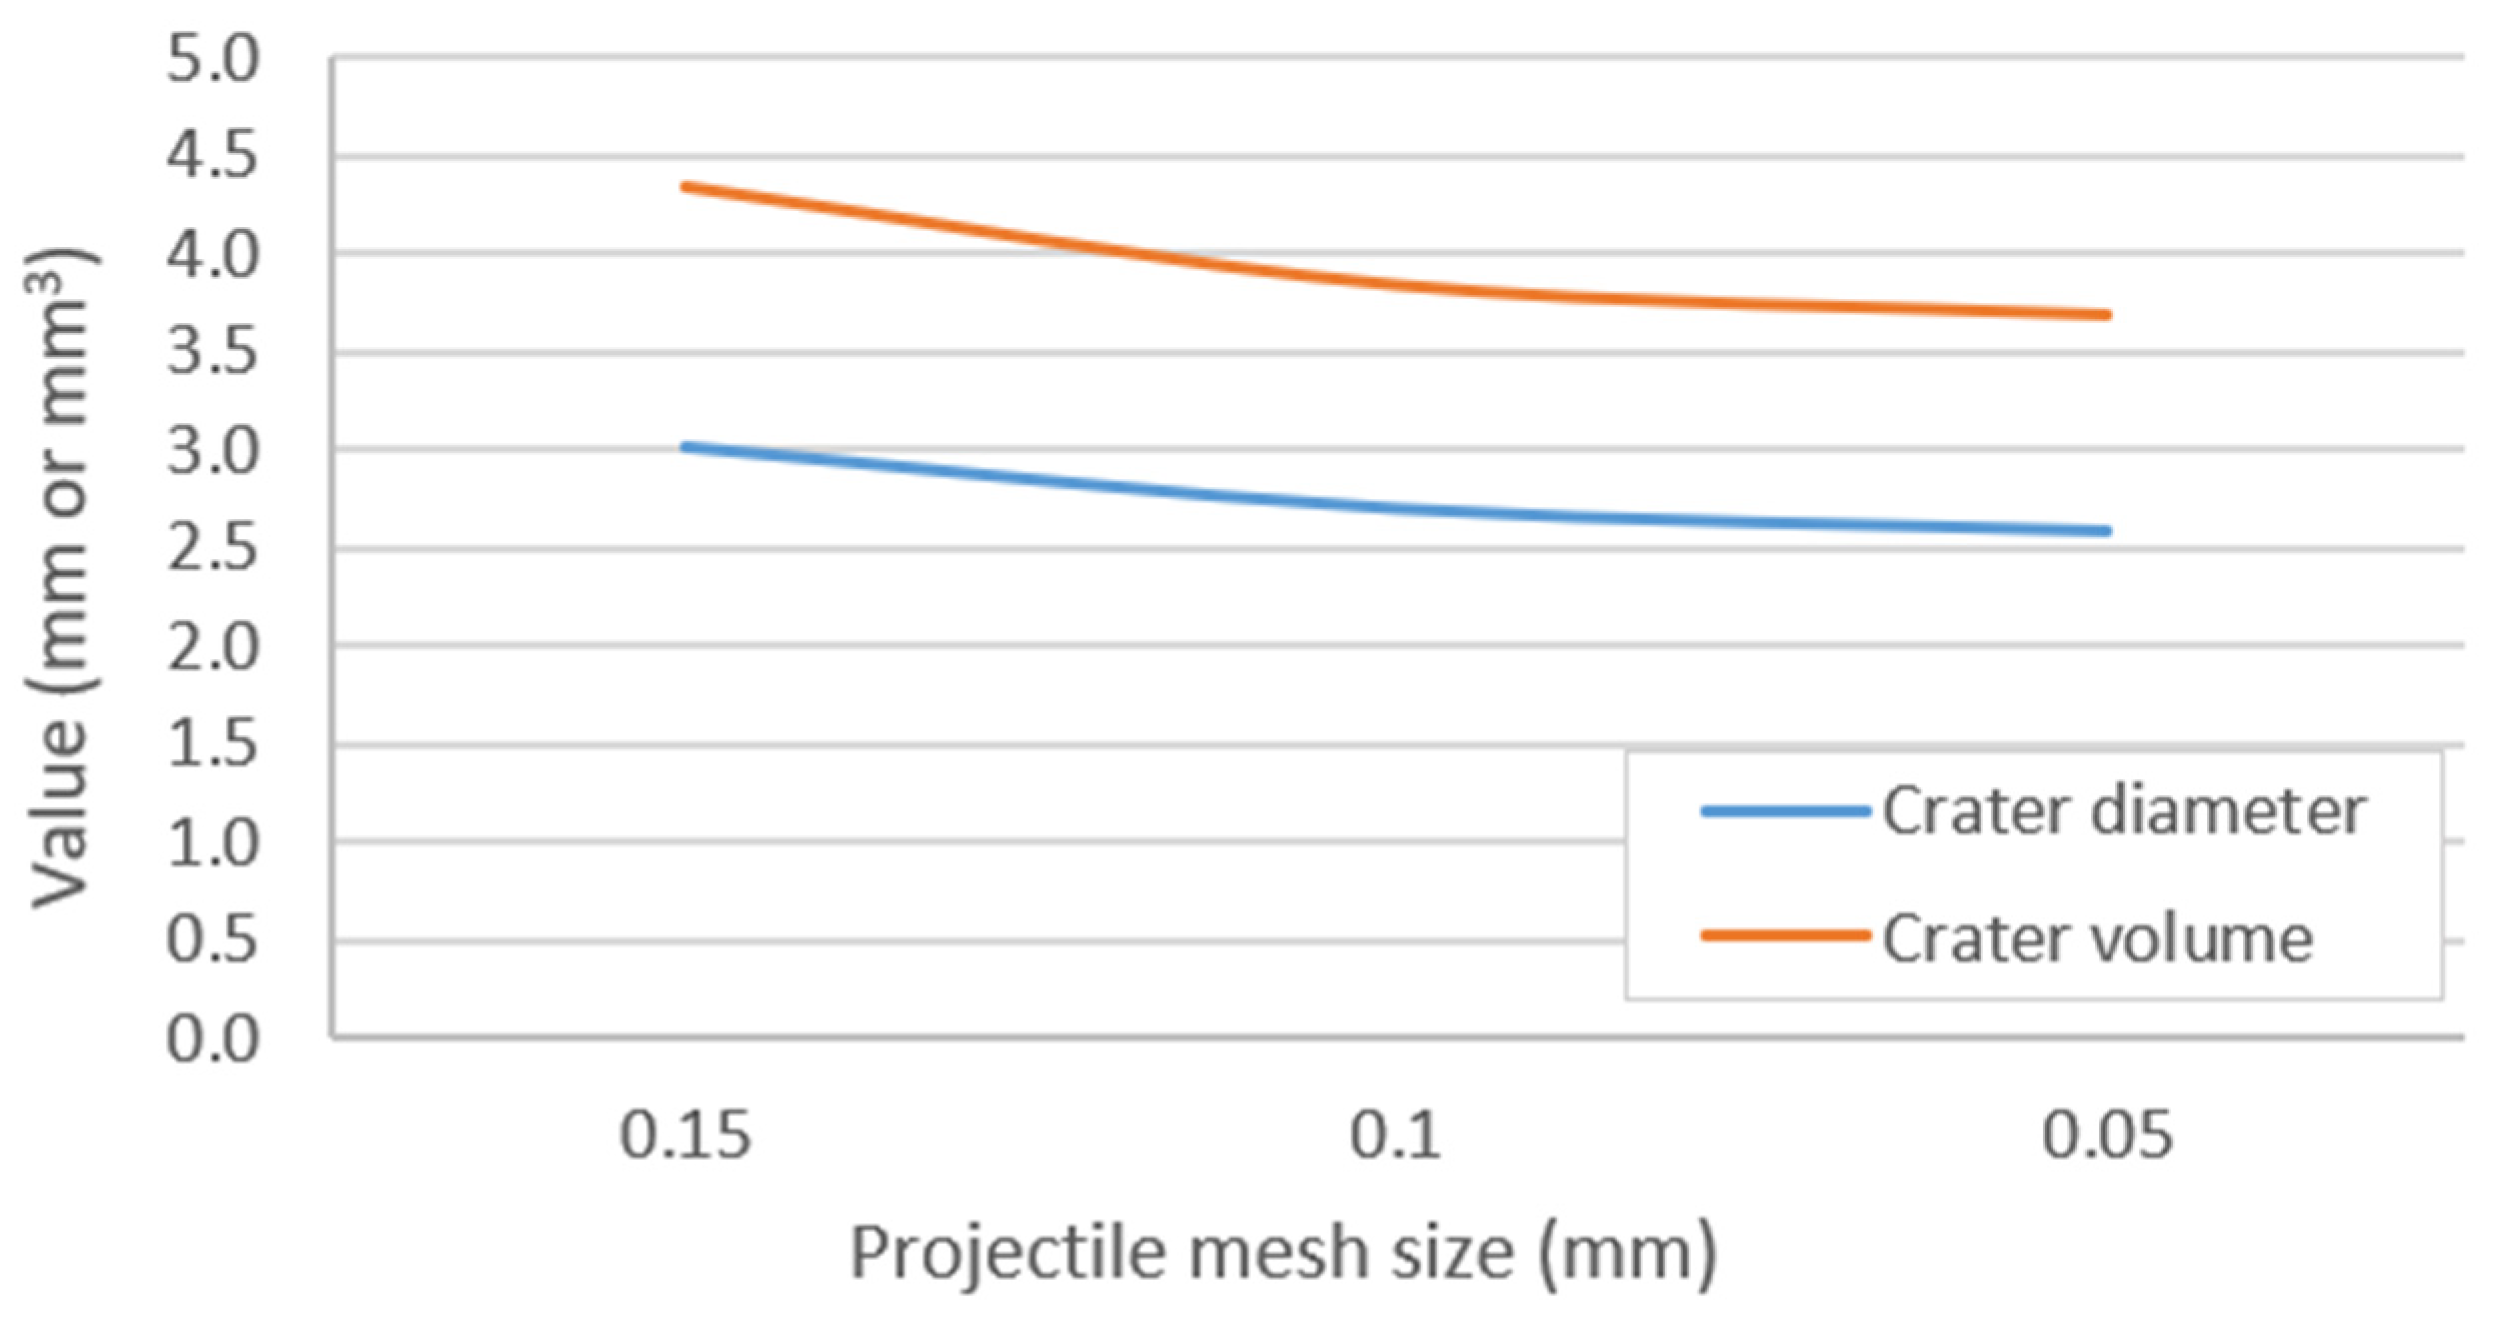
To evaluate the sensitivity of the numerical model to spatial discretization and ensure grid independence, a mesh convergence study was conducted for the plate and the projectile. For the CFRP plate, three FE models under HVI loading (described in detail in Section 3.1) were developed and discretized with three different mesh sizes with characteristic lengths of 0.5 mm, 0.25 mm, and 0.14 mm in the impact region. Similarly, the projectile was modelled using a spherified cube mesh with a characteristic length of 0.15 mm, 0.1 mm, and 0.05 mm comprising 1296, 3200, and 27,455 elements, respectively. The investigated quantities for the study were the crater diameter and the crater volume.
Figure 8 and Figure 9 along with Table 7 illustrate the evolution of the predicted crater diameter and crater volume as a function of mesh resolution of the plate and the projectile. The results demonstrate that both macro-scale damage metrics tend to converge as the mesh is refined. Specifically, the variation in crater diameter and volume between the 0.25 mm and 0.14 mm resolutions is minimal, shifting by less than 1% for diameter and approximately 1% for volume. Similarly, the mesh convergence study for the projectile confirmed that a characteristic size of 0.1 mm provides acceptable stability.
Figure 8.
Mesh convergence study showing the variation in predicted crater diameter and crater volume as a function of mesh size of the CFRP plate.
Figure 9.
Mesh convergence study showing the variation in predicted crater diameter and crater volume as a function of mesh size of the projectile.
Table 7.
Mesh convergence verification results detailing crater diameter and crater volume across different element sizes.
Due to the relatively low computational time of the HVI and LS analyses of the CFRP plate, mesh of characteristic size of 0.14 mm in the impact region was chosen. Additionally, the converged characteristic size value of 0.1 mm was chosen for the projectile.
4.1.2. Hypervelocity Impact Response and Model Validation
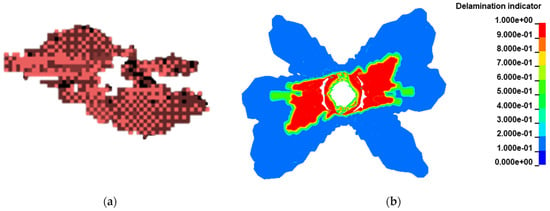
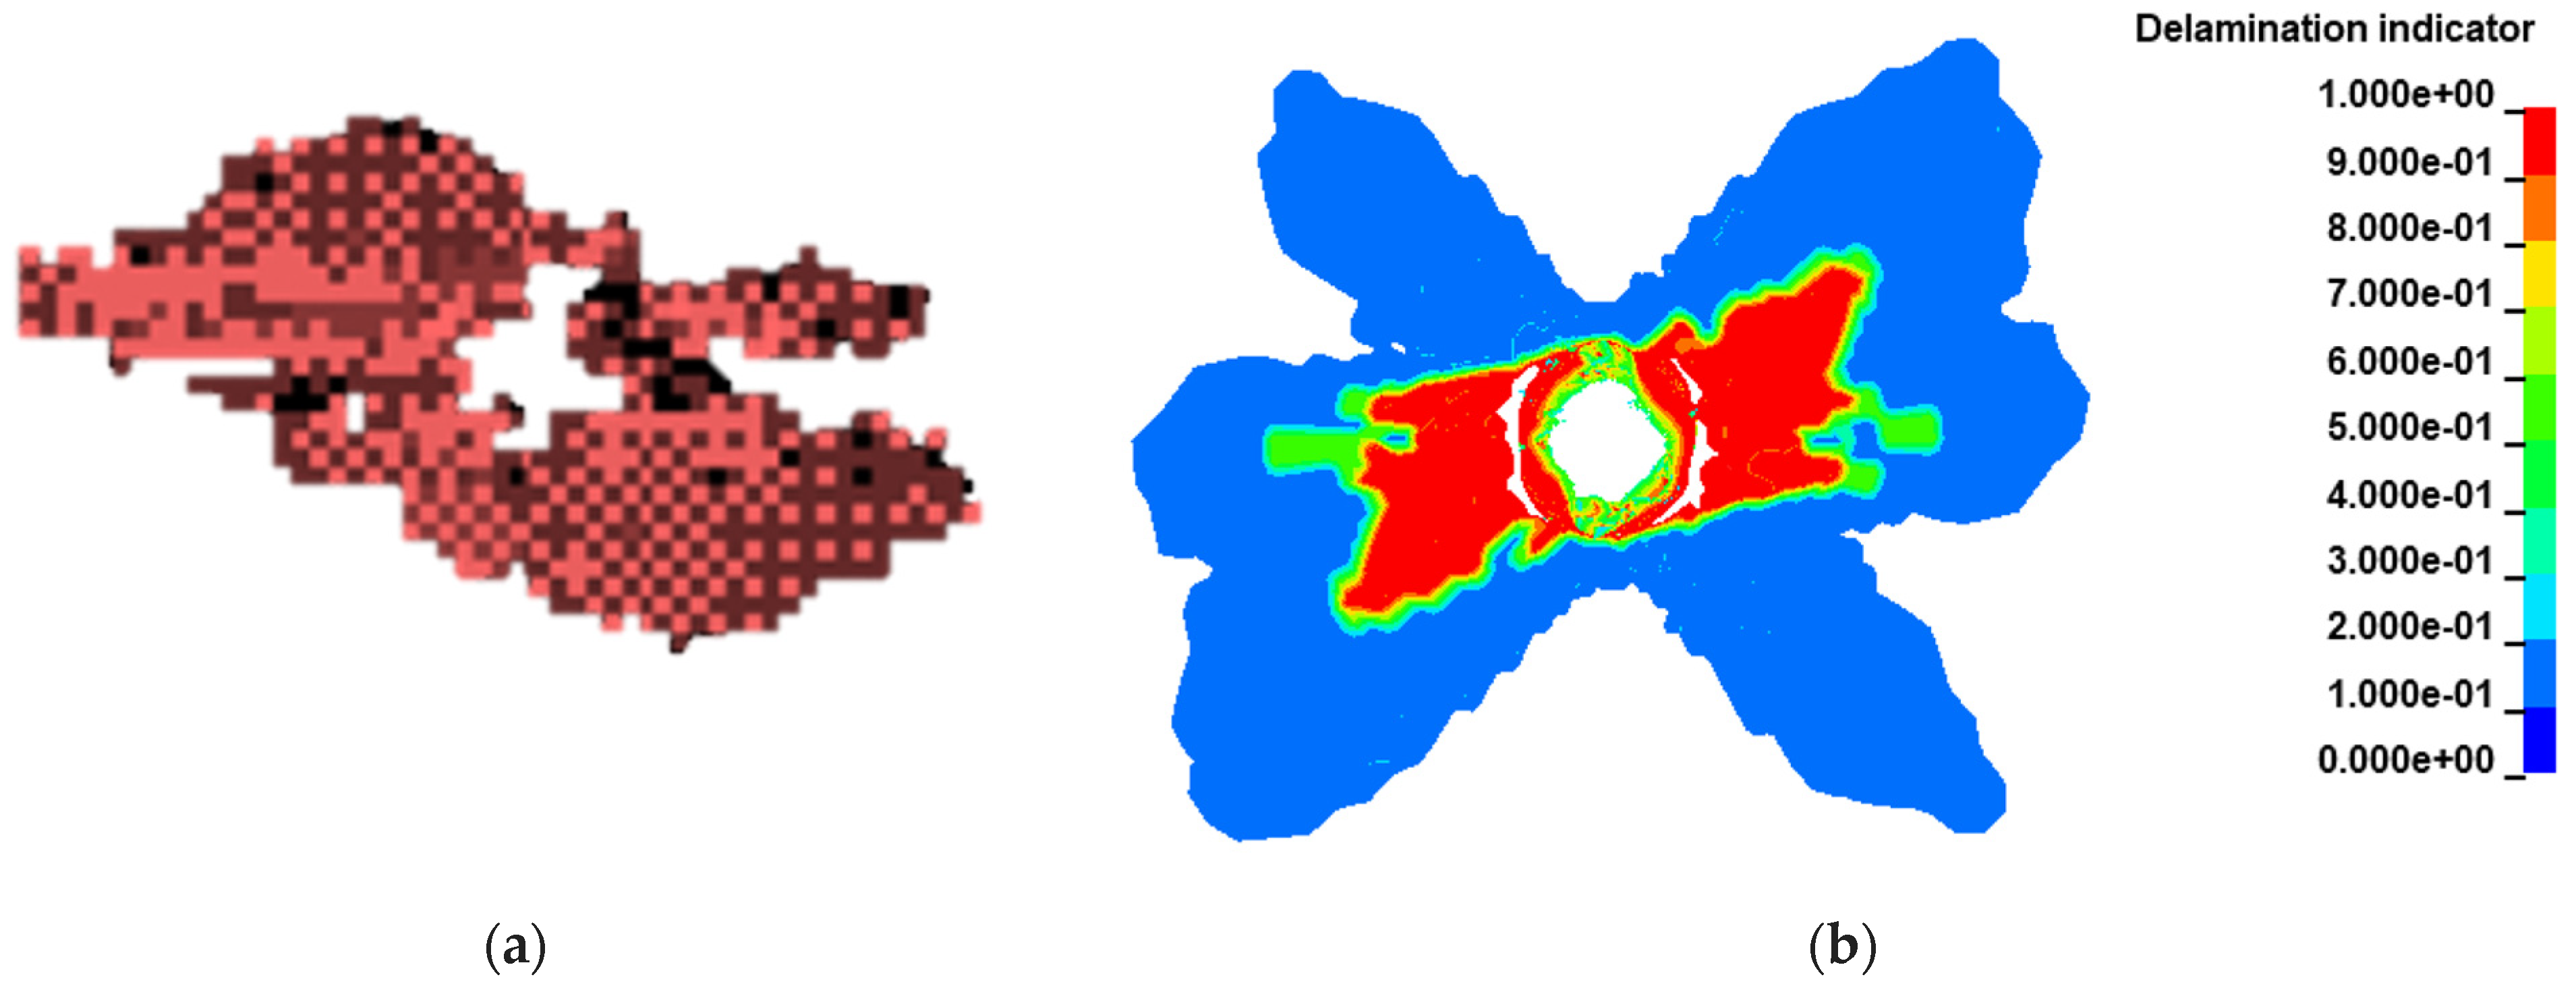
Initial model validation is performed based on two available criteria, provided in the Wicklein et al. experimental series. Those include the generated hole diameter, which is observed in the FE model as the diameter of the model’s deleted elements, and the delamination area. Since the ultrasonic non-destructive testing of the experimental result is not able to identify the delamination in a 3D space, the top view of all the layers is compared.
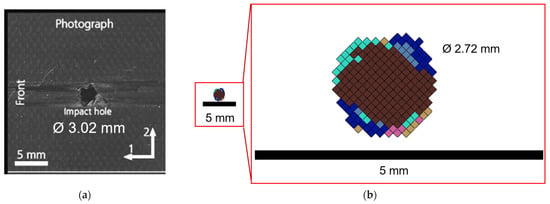
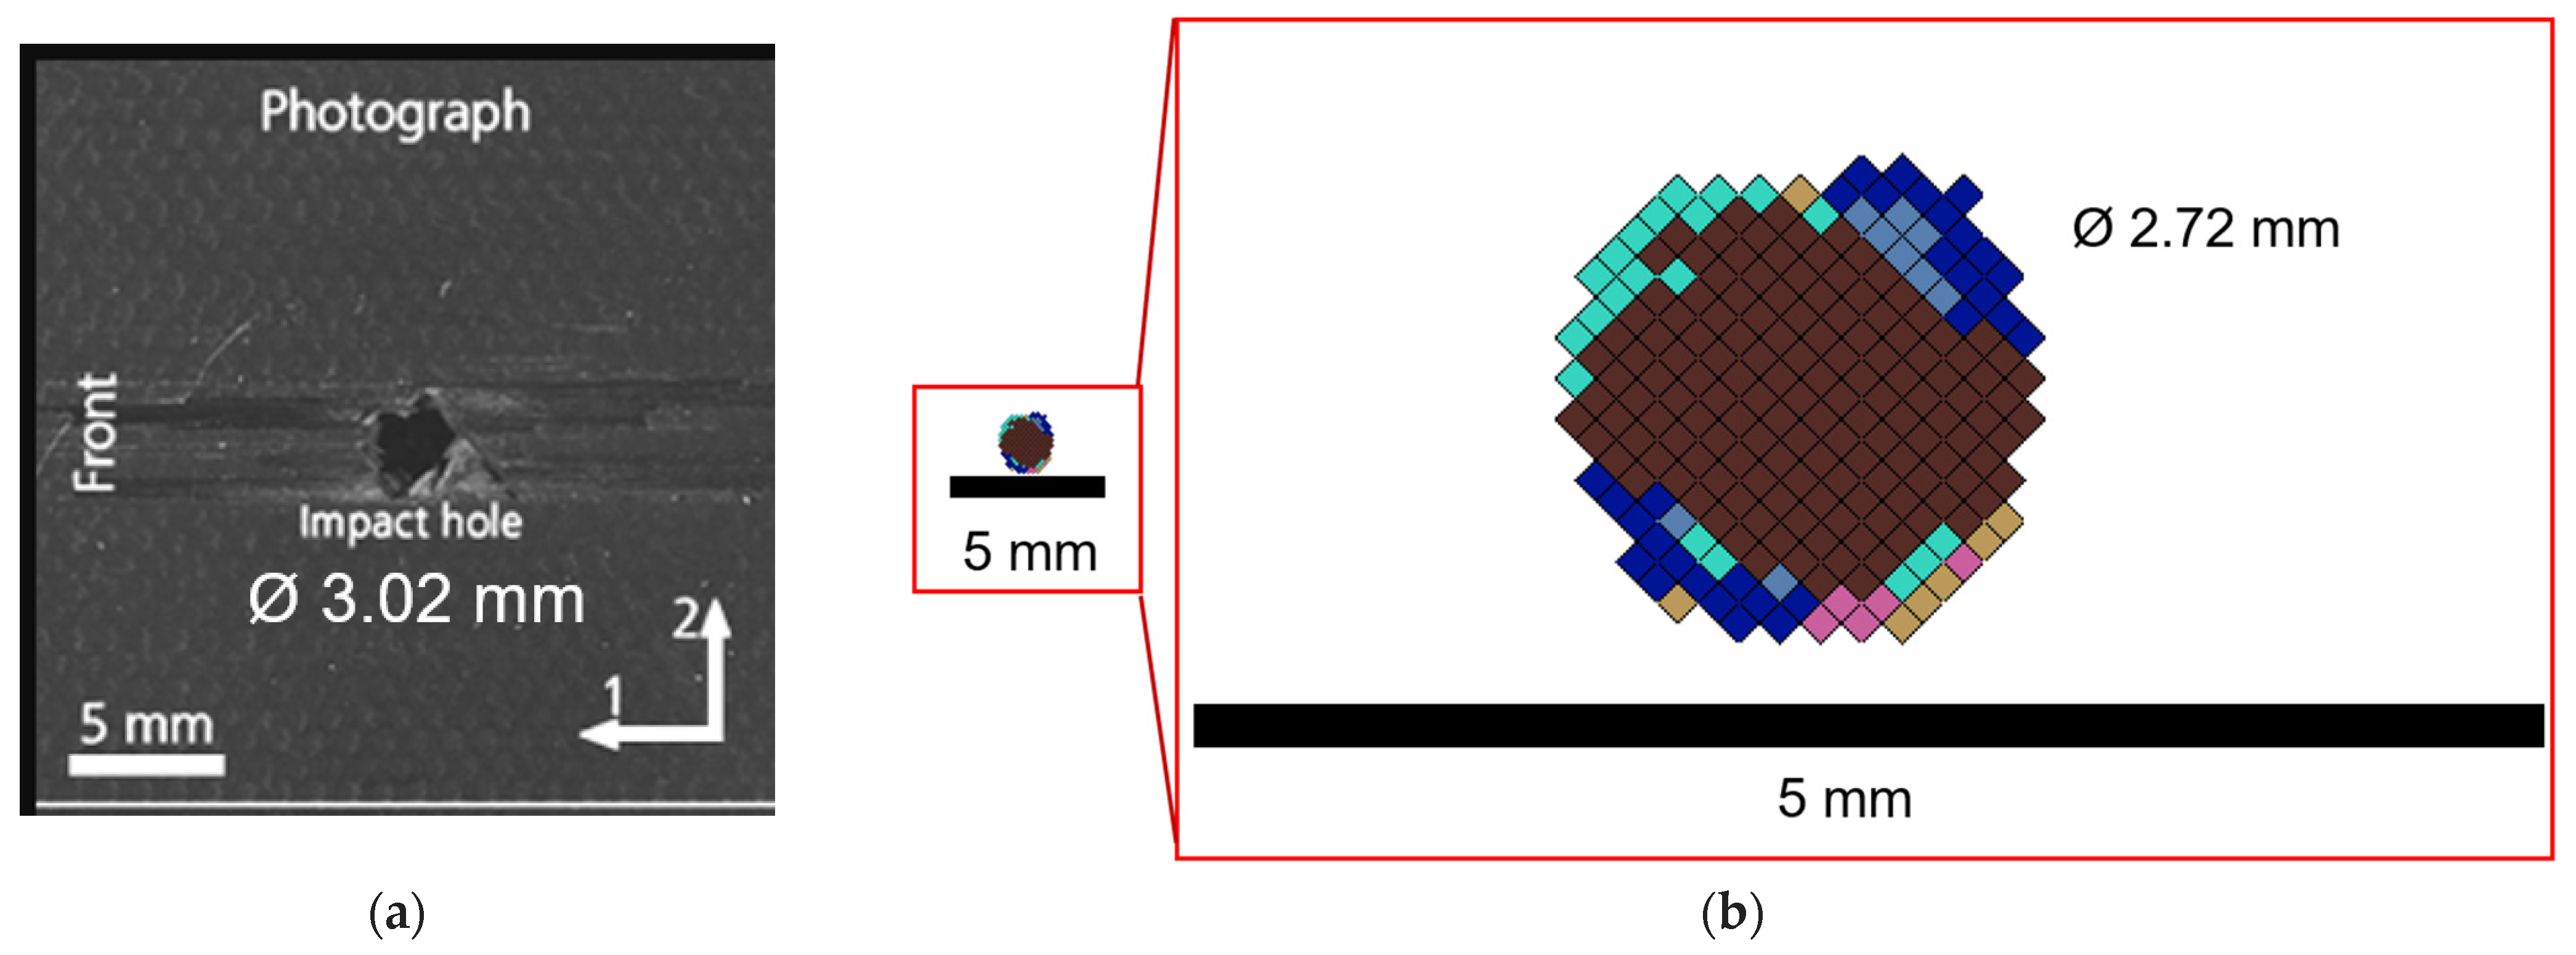
In Figure 10, the top view of the experimental delamination area is compared to the predicted delamination area bounded by isocurves. The colour graph is an index describing the percentage of damage of the elements in the interface between plies. In Figure 11, the hole that was generated by experiment 236 of Wicklein et al. [21] is compared with the predicted hole generation by visualizing the deleted elements at the point of impact. The top view is also compared; different coloured elements indicate deleted elements of different plies. The experimentally measured hole diameter for test 236 is 3.02 mm, while the LS-DYNA model predicts a hole diameter of 2.72 mm, corresponding to a relative error of 10%. The delamination area was not quantified in the study. For validation purposes, an error of 10% is considered acceptable, indicating that the developed model provides a realistic prediction of damage.
Figure 10.
Model validation in terms of delamination: (a) ultrasonic testing of the experimental impact; (b) simulation results—top view.
Figure 11.
Model validation in terms of hole generation: (a) photograph of the experimental hole [21]; (b) deleted elements of the simulation.
4.1.3. Laser Shock Response and Analogy Assessment
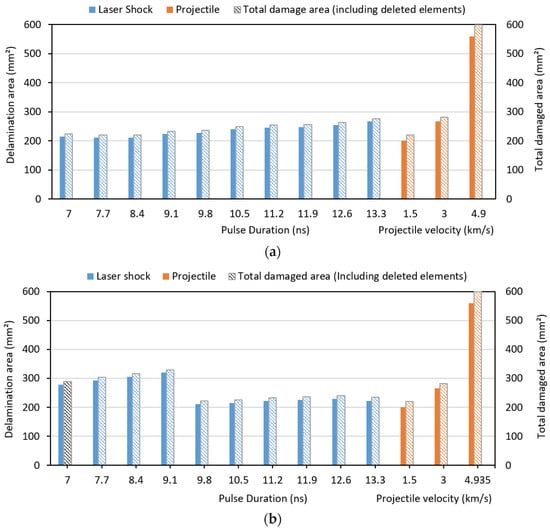
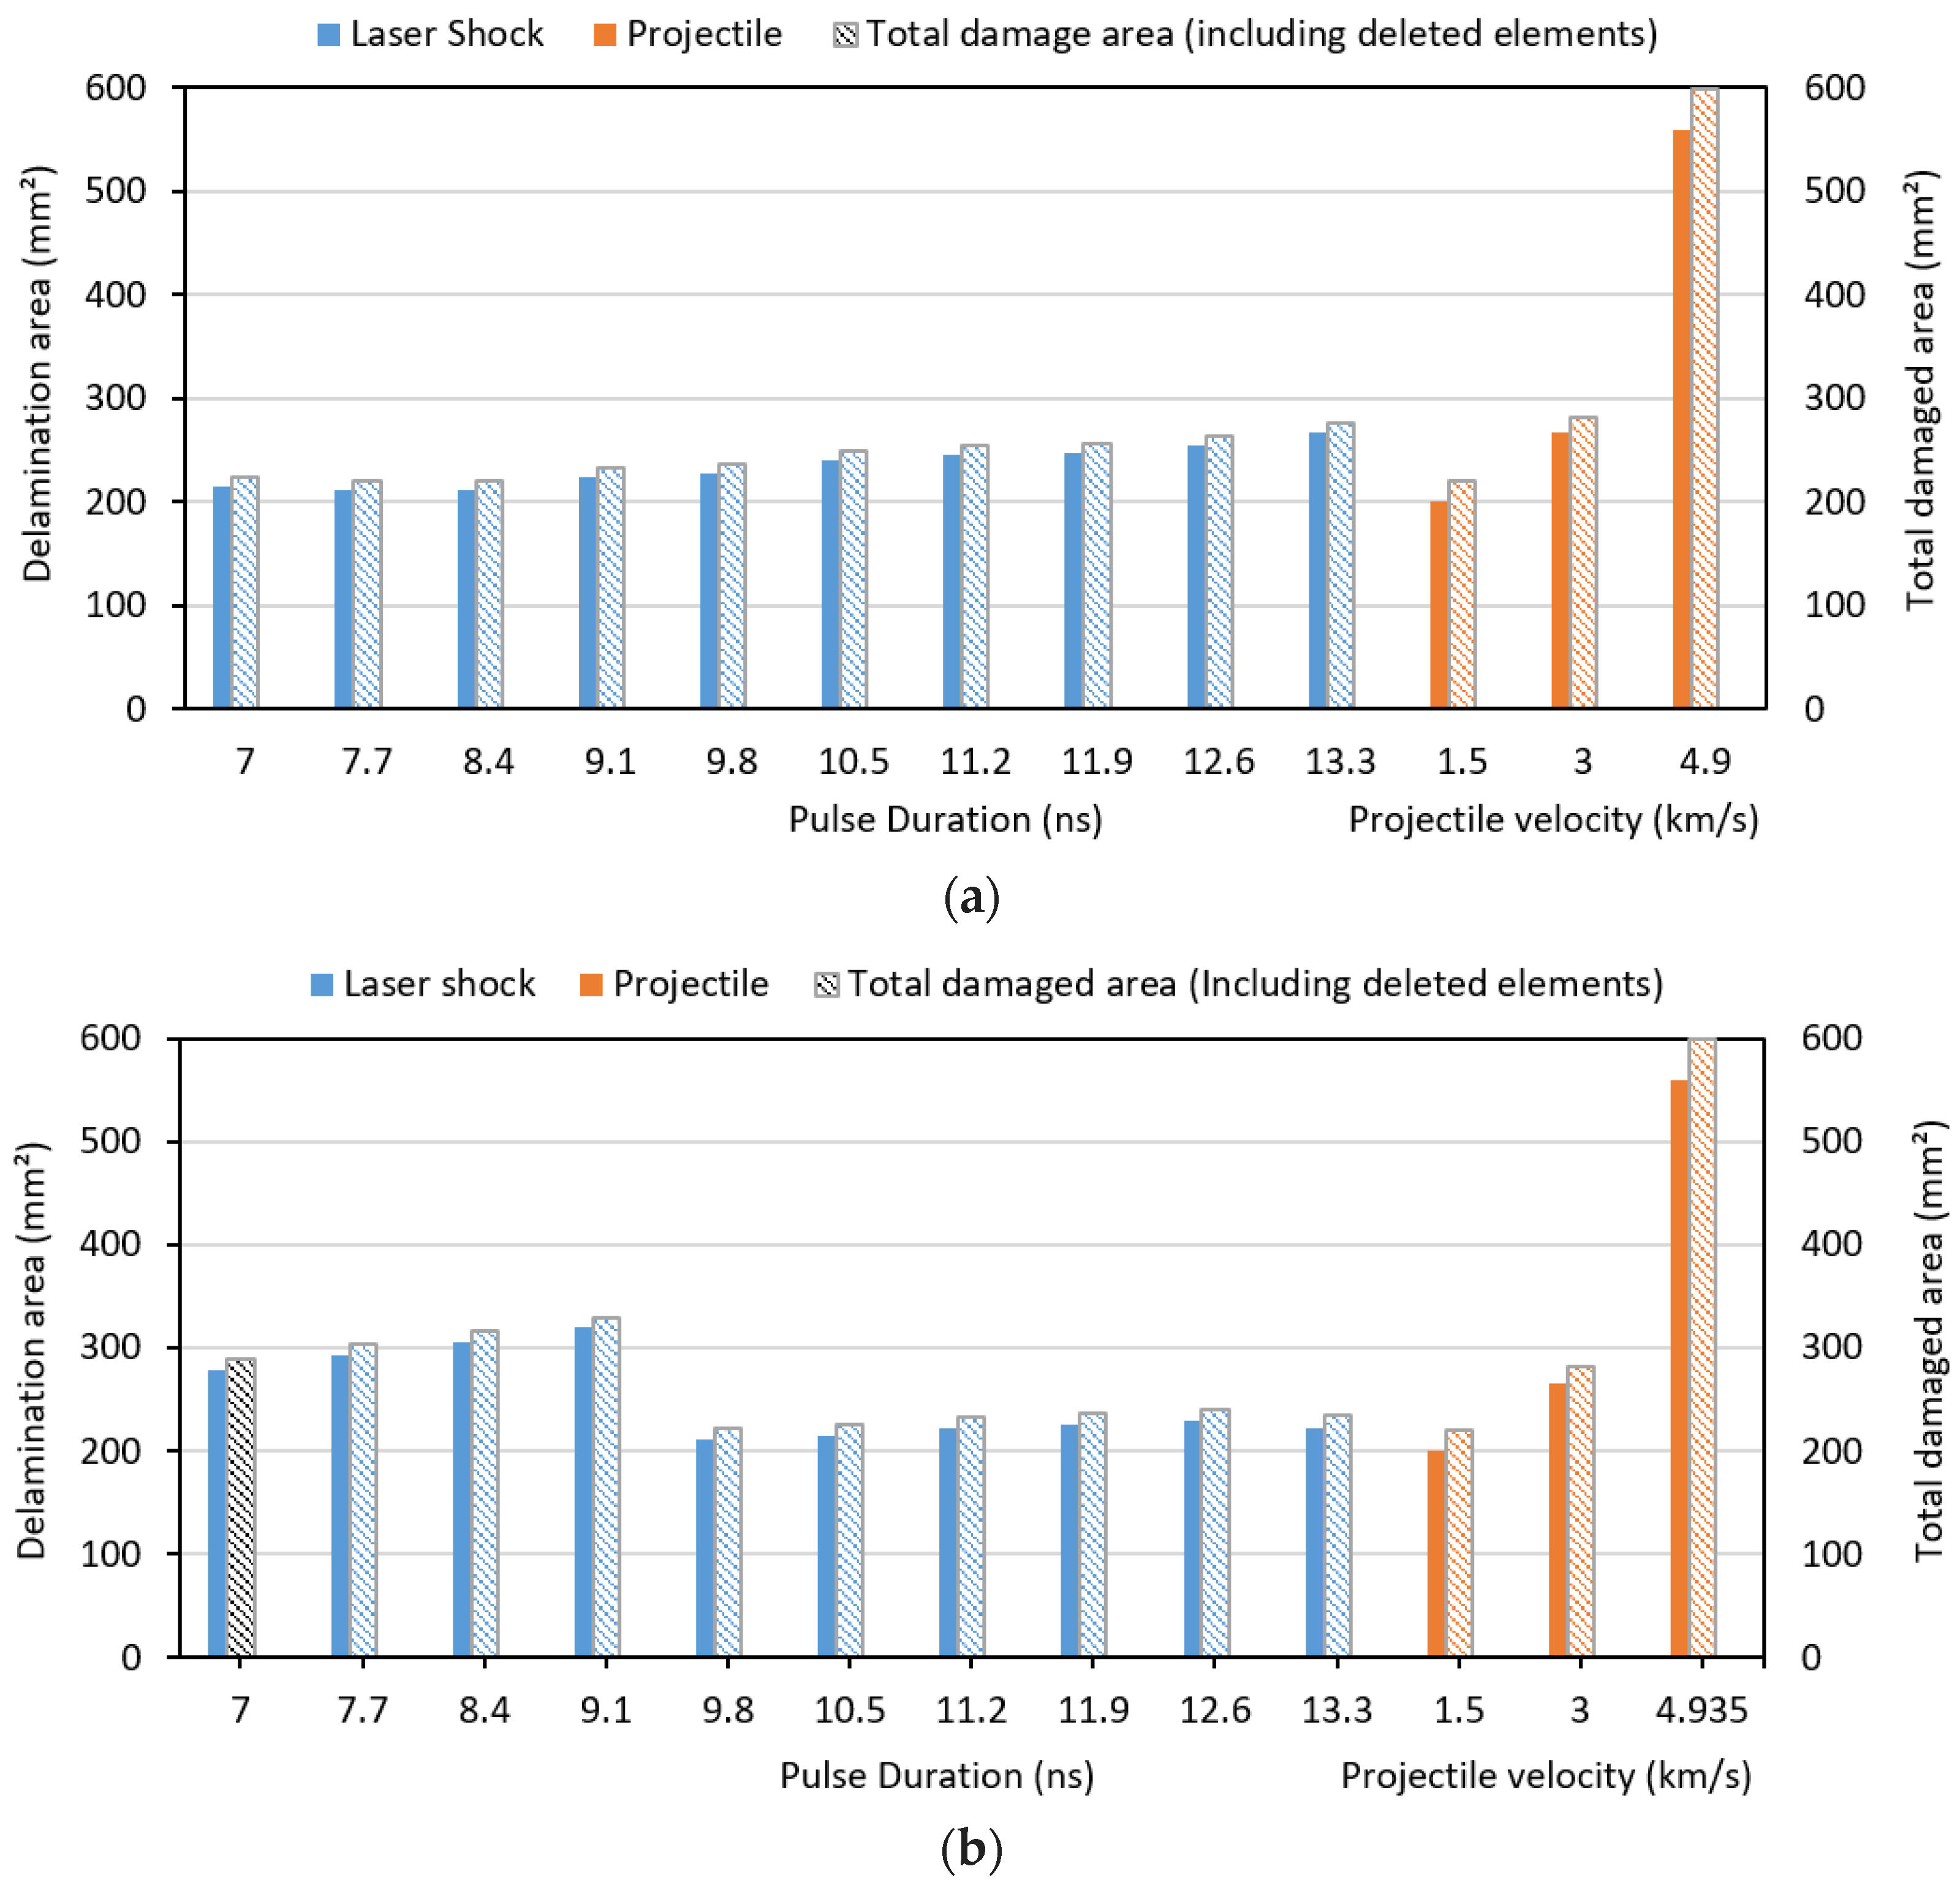
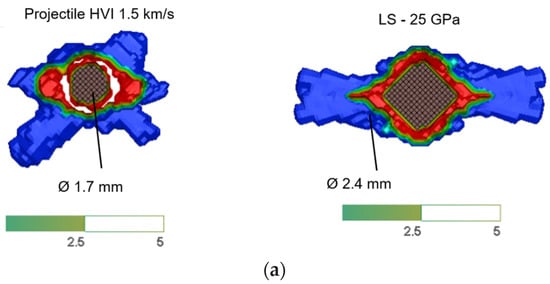
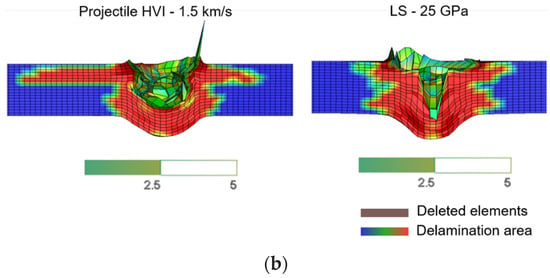
After establishing a hyper-velocity impact model that is capable of producing valid results, the same simulation is conducted for 1.5 km/s and 3 km/s creating damage area data. This extension of the model below its validation velocity is admissible on three grounds. It is downward, so the model is interpolated between the validated condition and the quasi-static regime in which its parameters were measured rather than extrapolated beyond it. All three conditions lie in the same thermodynamic regime, the peak impact pressures remaining in the GPa range with the material on a single compressive branch of the Hugoniot, which is the domain of validity of the Mie–Grüneisen description of Section 3.1. Independent support is available in the literature: Giannaros et al. [33] simulated the impact of aluminum spheres of 0.8 and 1.5 mm diameter on CFRP laminates at 1.93 to 4.96 km/s using *MAT_59, validating crater diameter and ballistic limit against experiment with a single calibration across that range. Using the same target geometry, laser shock simulations are conducted for ablation pressures of 25 GPa and 50 GPa, varying the pulse duration. Delamination area is indicated based on the total surface of inter-ply elements that predict matrix failure (the standard way that *MAT162 indicates delamination), while total damage area also includes the area of deleted elements to represent the hole generation in the comparison. Figure 12 is a bar chart representing the delamination and total damage area of each model. To identify comparable damage patterns, relative error tables are provided for both the delamination area and the total damage area under laser induced pressures of 25 GPa and 50 GPa in Table 8, Table 9, Table 10 and Table 11. A comparable damage area is apparent between an LS shot with pulse duration of 7.7 ns that results in 25 GPa ablation pressure and 1.5 km/s HVI with a relative total damage area error of 0.5%, while for a 13.3 ns pulse a comparison with 3 km/s HVI can be made with a relative total damage area error of 3.9%. Additionally, the 50 GPa using a 7 ns pulse ablation pressure simulation indicates comparative damage area to the 3 km/s HVI with a relative error of 2.5%.
Figure 12.
Damage area comparison between LS and HVI projectile simulations. Pulse duration sensitivity analysis for ablation pressure of (a) 25 GPa and (b) 50 GPa.
Table 8.
Relative Error Table: Delamination area at 25 GPa.
Table 9.
Relative Error Table: Total damaged area at 25 GPa.
Table 10.
Relative Error Table: Delamination area at 50 GPa.
Table 11.
Relative Error Table: Total damage area at 50 GPa.
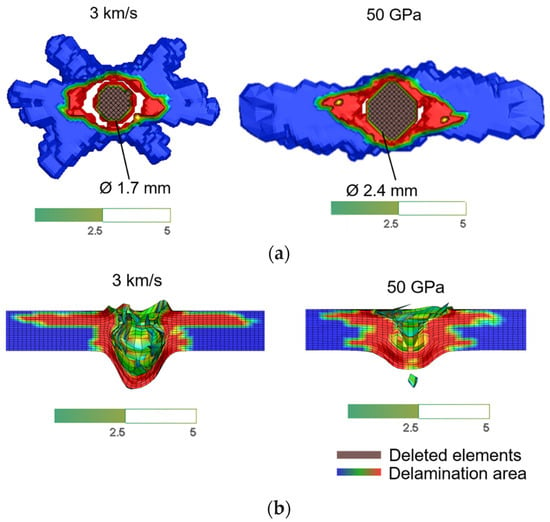
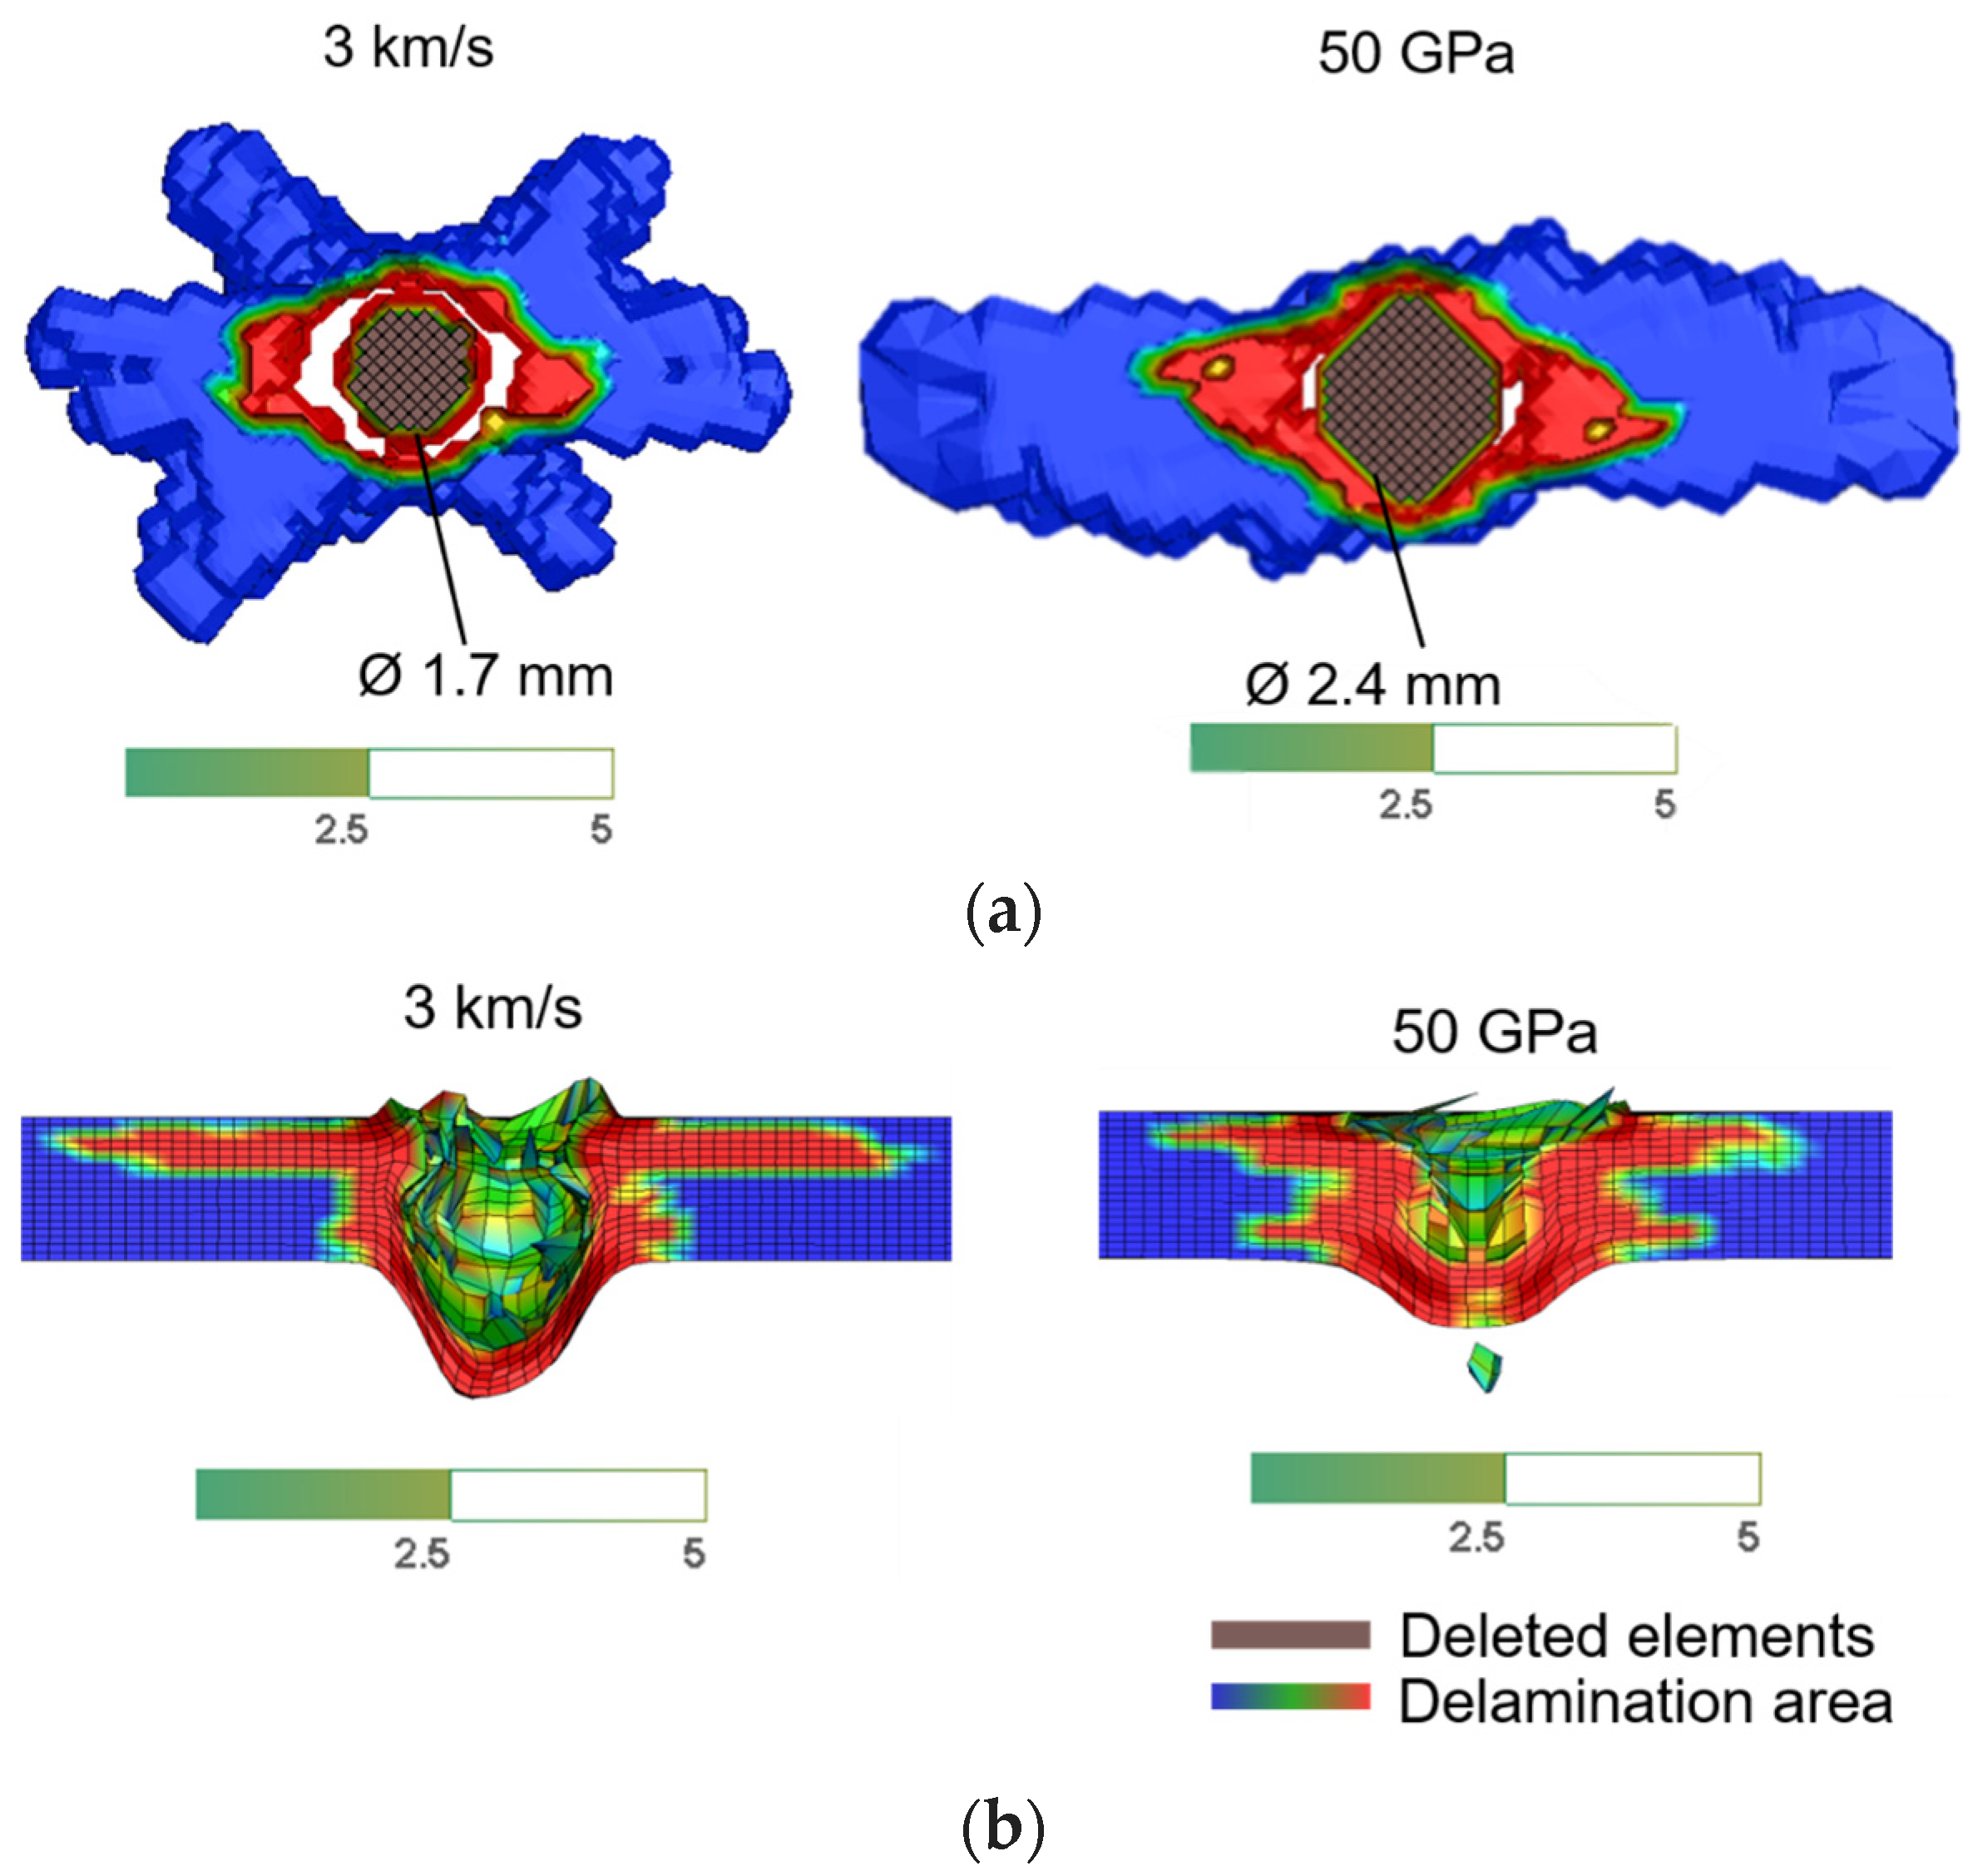
For the matching damage area analogies, delamination patterns and crater formations are compared for both a top and side cross-sectional views. Figure 13 presents the top and cross-sectional comparison of the 1.5 km/s projectile speed HVI simulation with the 25 GPa LS simulation, while Figure 14 presents the comparison of the 3 km/s projectile speed HVI simulation with the 50 GPa LS simulation.
Figure 13.
Comparison of 1.5 km/s projectile speed HVI simulation with an LS simulation using 7.7 ns pulse duration with 25 GPa ablation pressure. (a) Top view comparison showing deleted elements for comparison. (b) Side cross-sectional view for crater comparison.
Figure 14.
Comparison of 3 km/s projectile speed HVI simulation with an LS simulation using 7 ns pulse duration with 50 GPa ablation pressure. (a) Top view comparison showing deleted elements for comparison. (b) Side cross-sectional view for crater comparison.
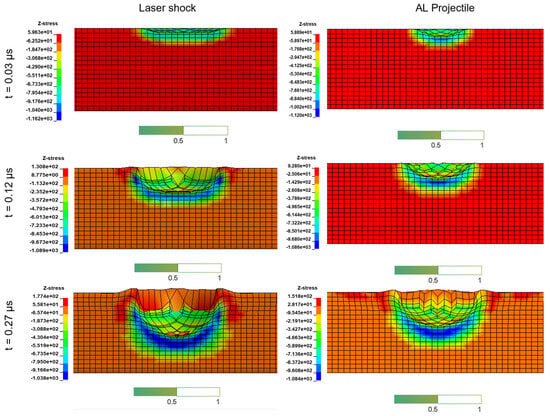
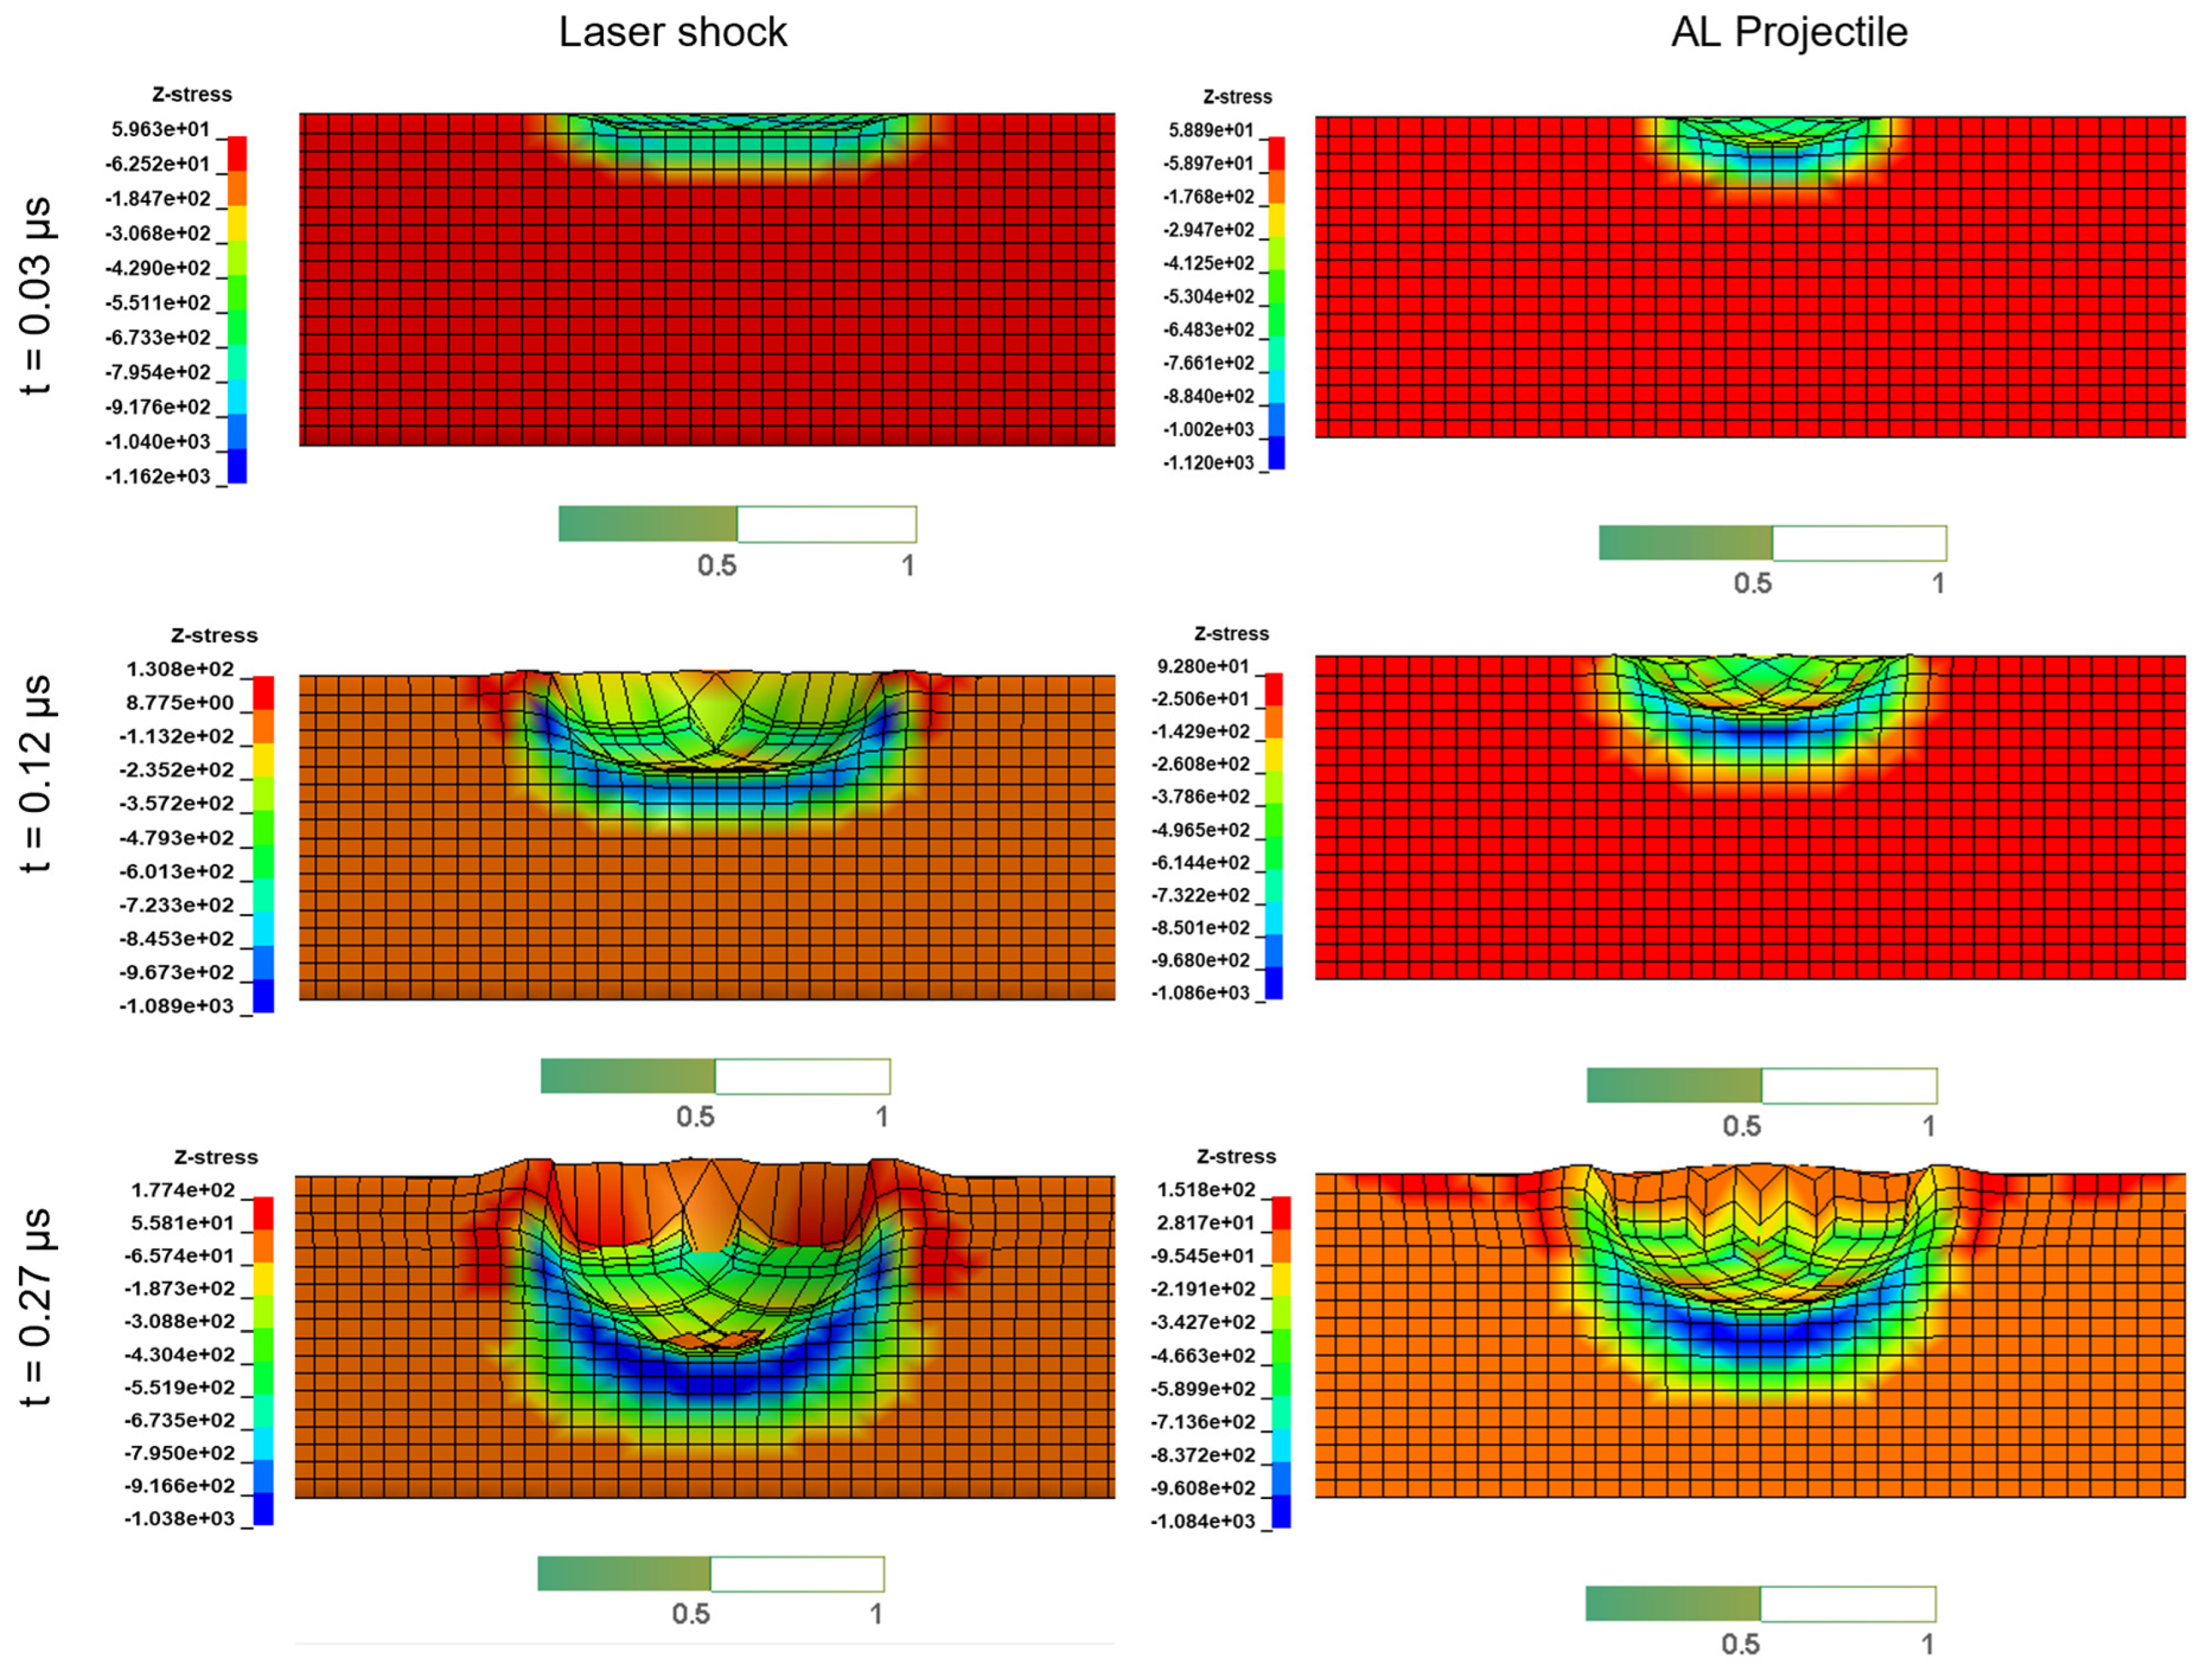
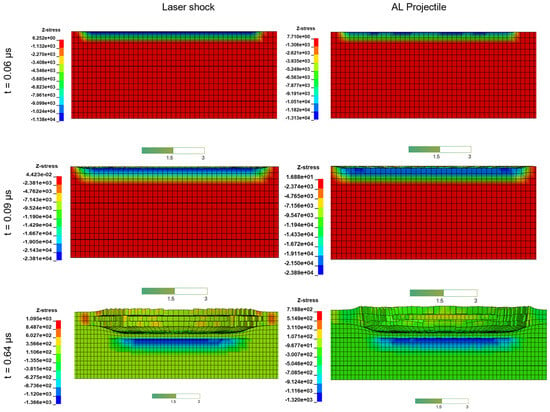
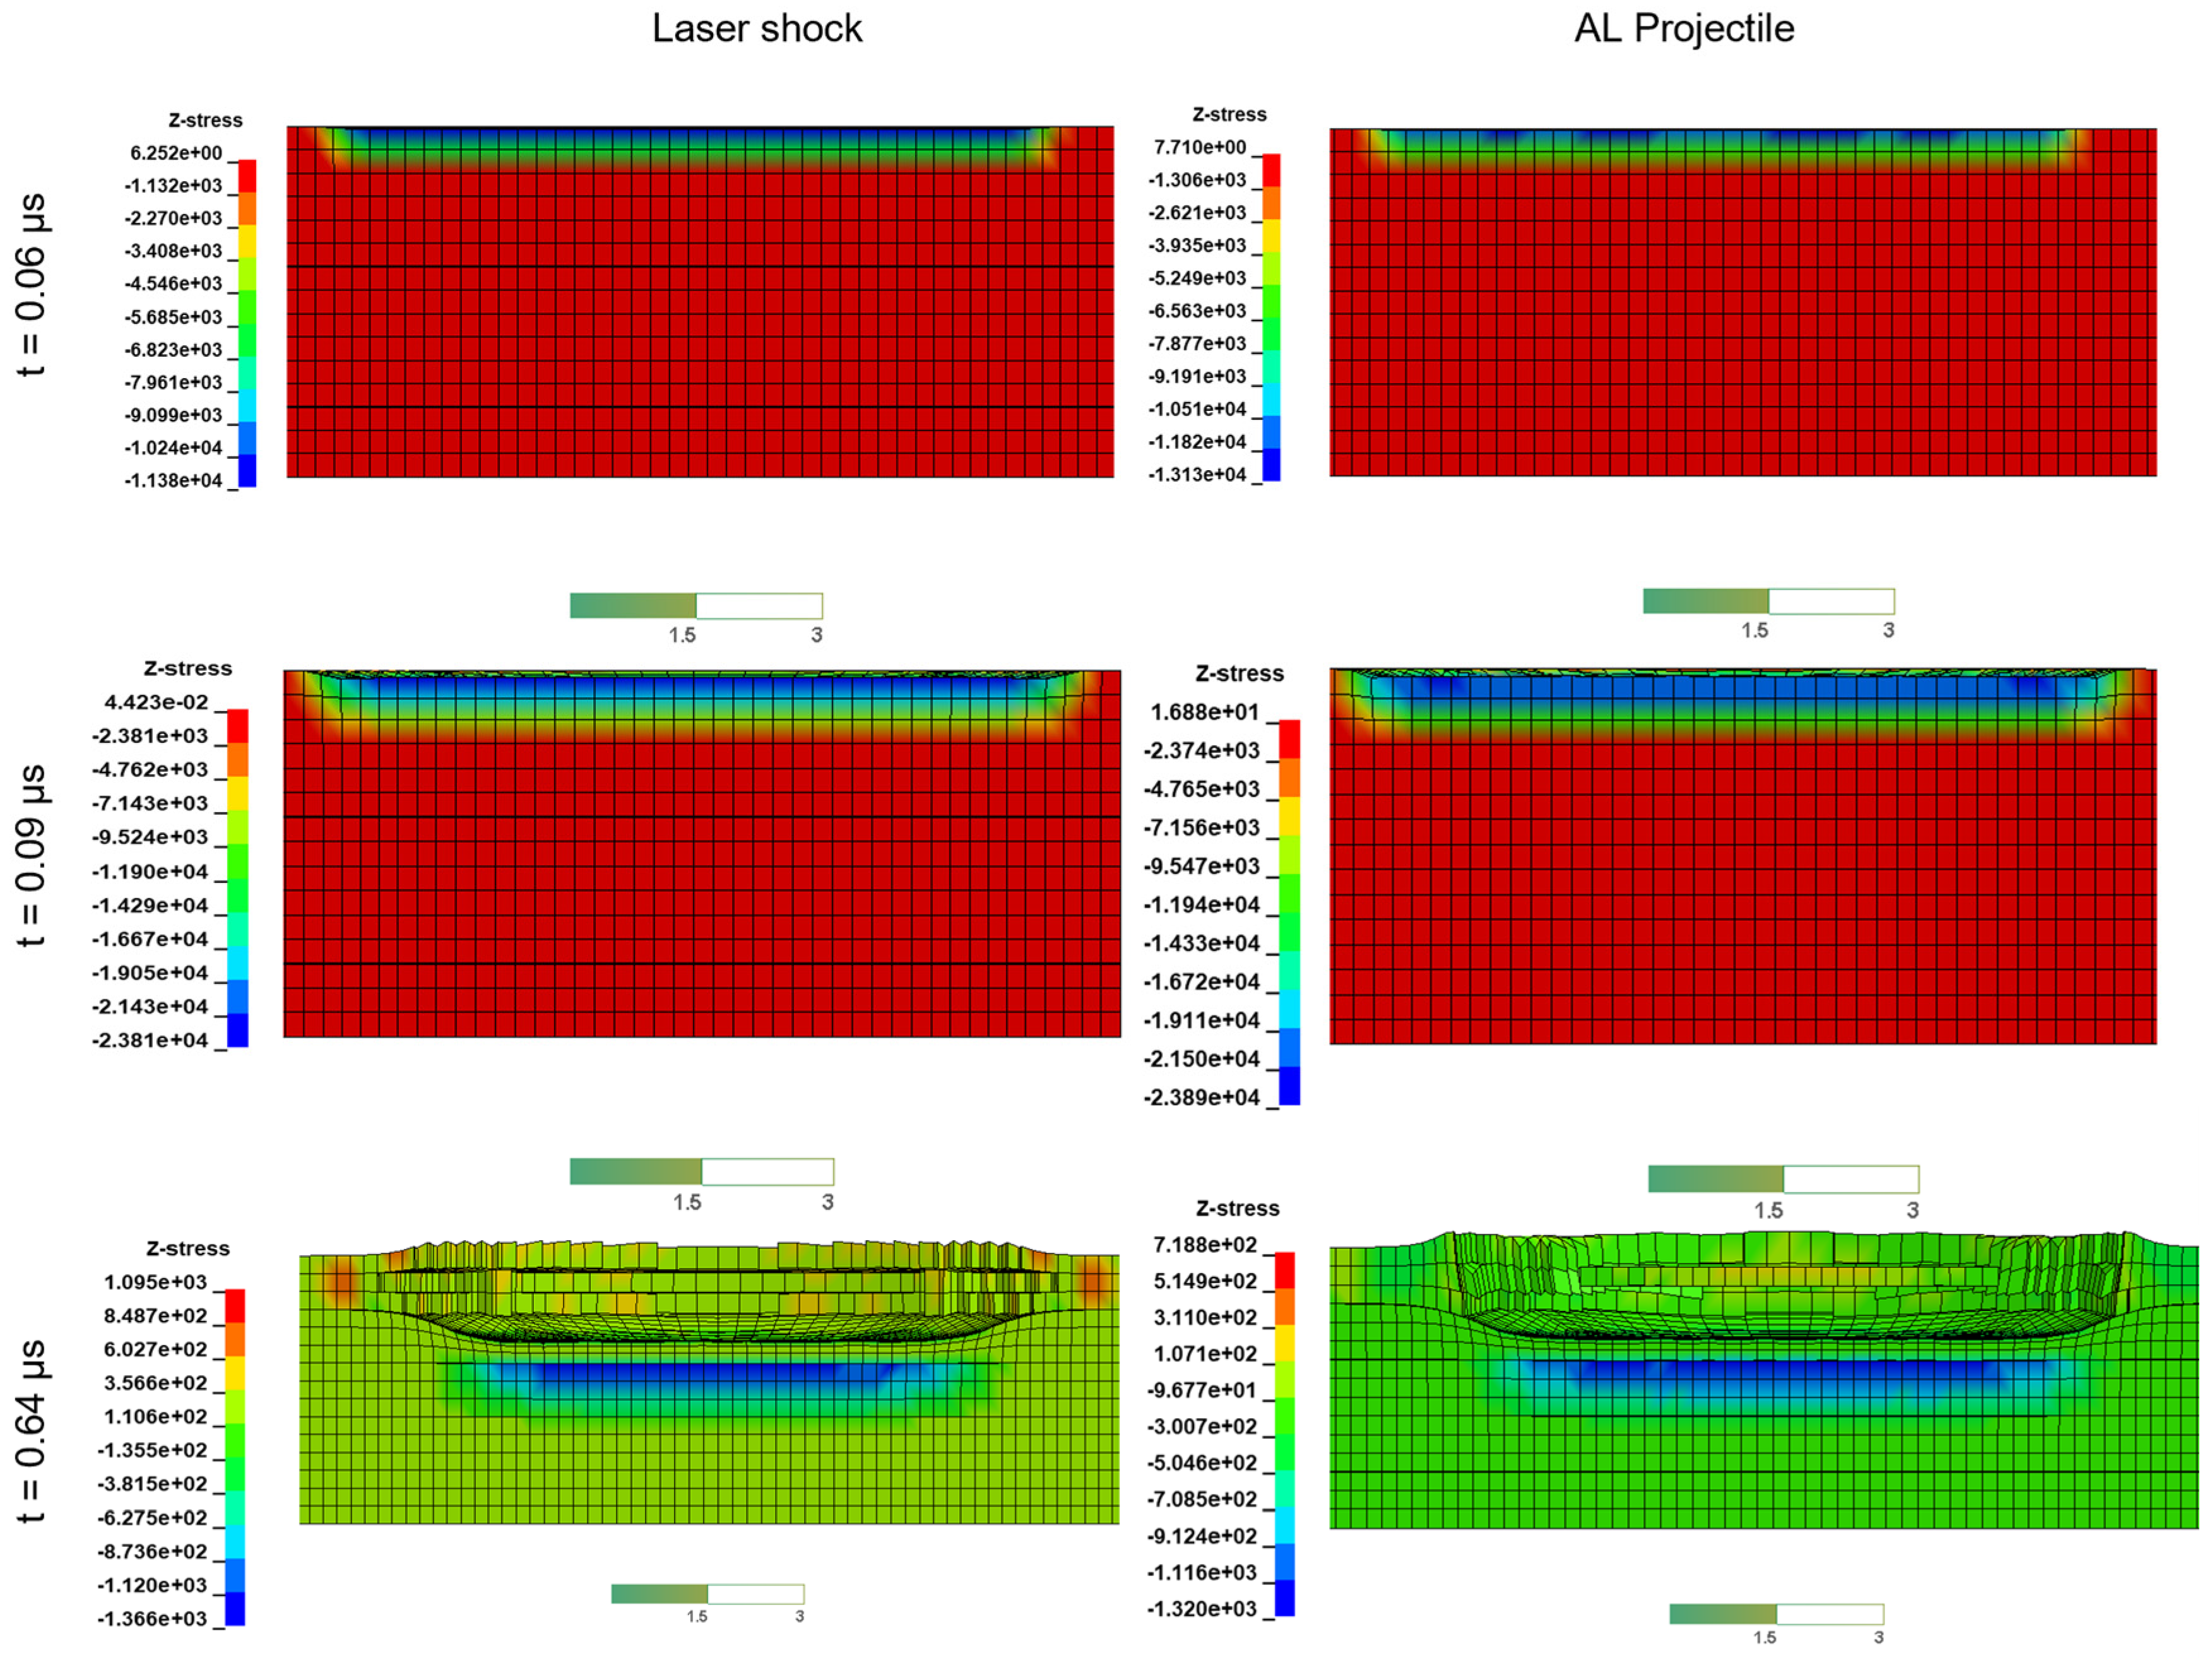
For the 3 km/s HVI model, the stress wave propagation is compared at identical time points with the 50 GPa LS case. The HVI and LS simulations show similar values of σz (MPa)and comparable wave propagation speeds. However, the LS model exhibits a flatter shock front, which is attributed to the uniform area of load application. In contrast, the spherical projectile in the HVI model gradually contacts the target, producing a steeper shock front. Figure 15 presents the LS and HVI models for identical time stamps.
Figure 15.
Stress wave comparison of 3 km/s projectile speed HVI simulation with an LS simulation using 7 ns pulse duration with 50 GPa ablation pressure. Colour graph presents the σz (MPa).
Apart from *MAT162, CFRP plate was modelled also with *MAT_59_COMPOSITE_FAILURE_MODEL. *MAT59 implements the same damage constitutive models but does not have the capacity to predict delamination. However, it does not require numerous strain rate parameters (CERATE) as inputs, which are limited in the literature and difficult to obtain experimentally. The numerical results derived from the CFRP plate modelled with *MAT59 and the comparison with *MAT162 results are presented in Table 12. Given that the relative error for crater diameter and crater volume between the two materials is 0.4% and 3.4%, respectively, *MAT59 was used to model the CFRP plates in the hybrid shield configuration, as a more practical alternative.
Table 12.
Crater diameter and crater volume numerical results derived from CFRP plate modelled with *MAT162 and *MAT59.
4.2. Hybrid Al-CFRP-Al-CFRP-Al Shield
4.2.1. Mesh Convergence Study
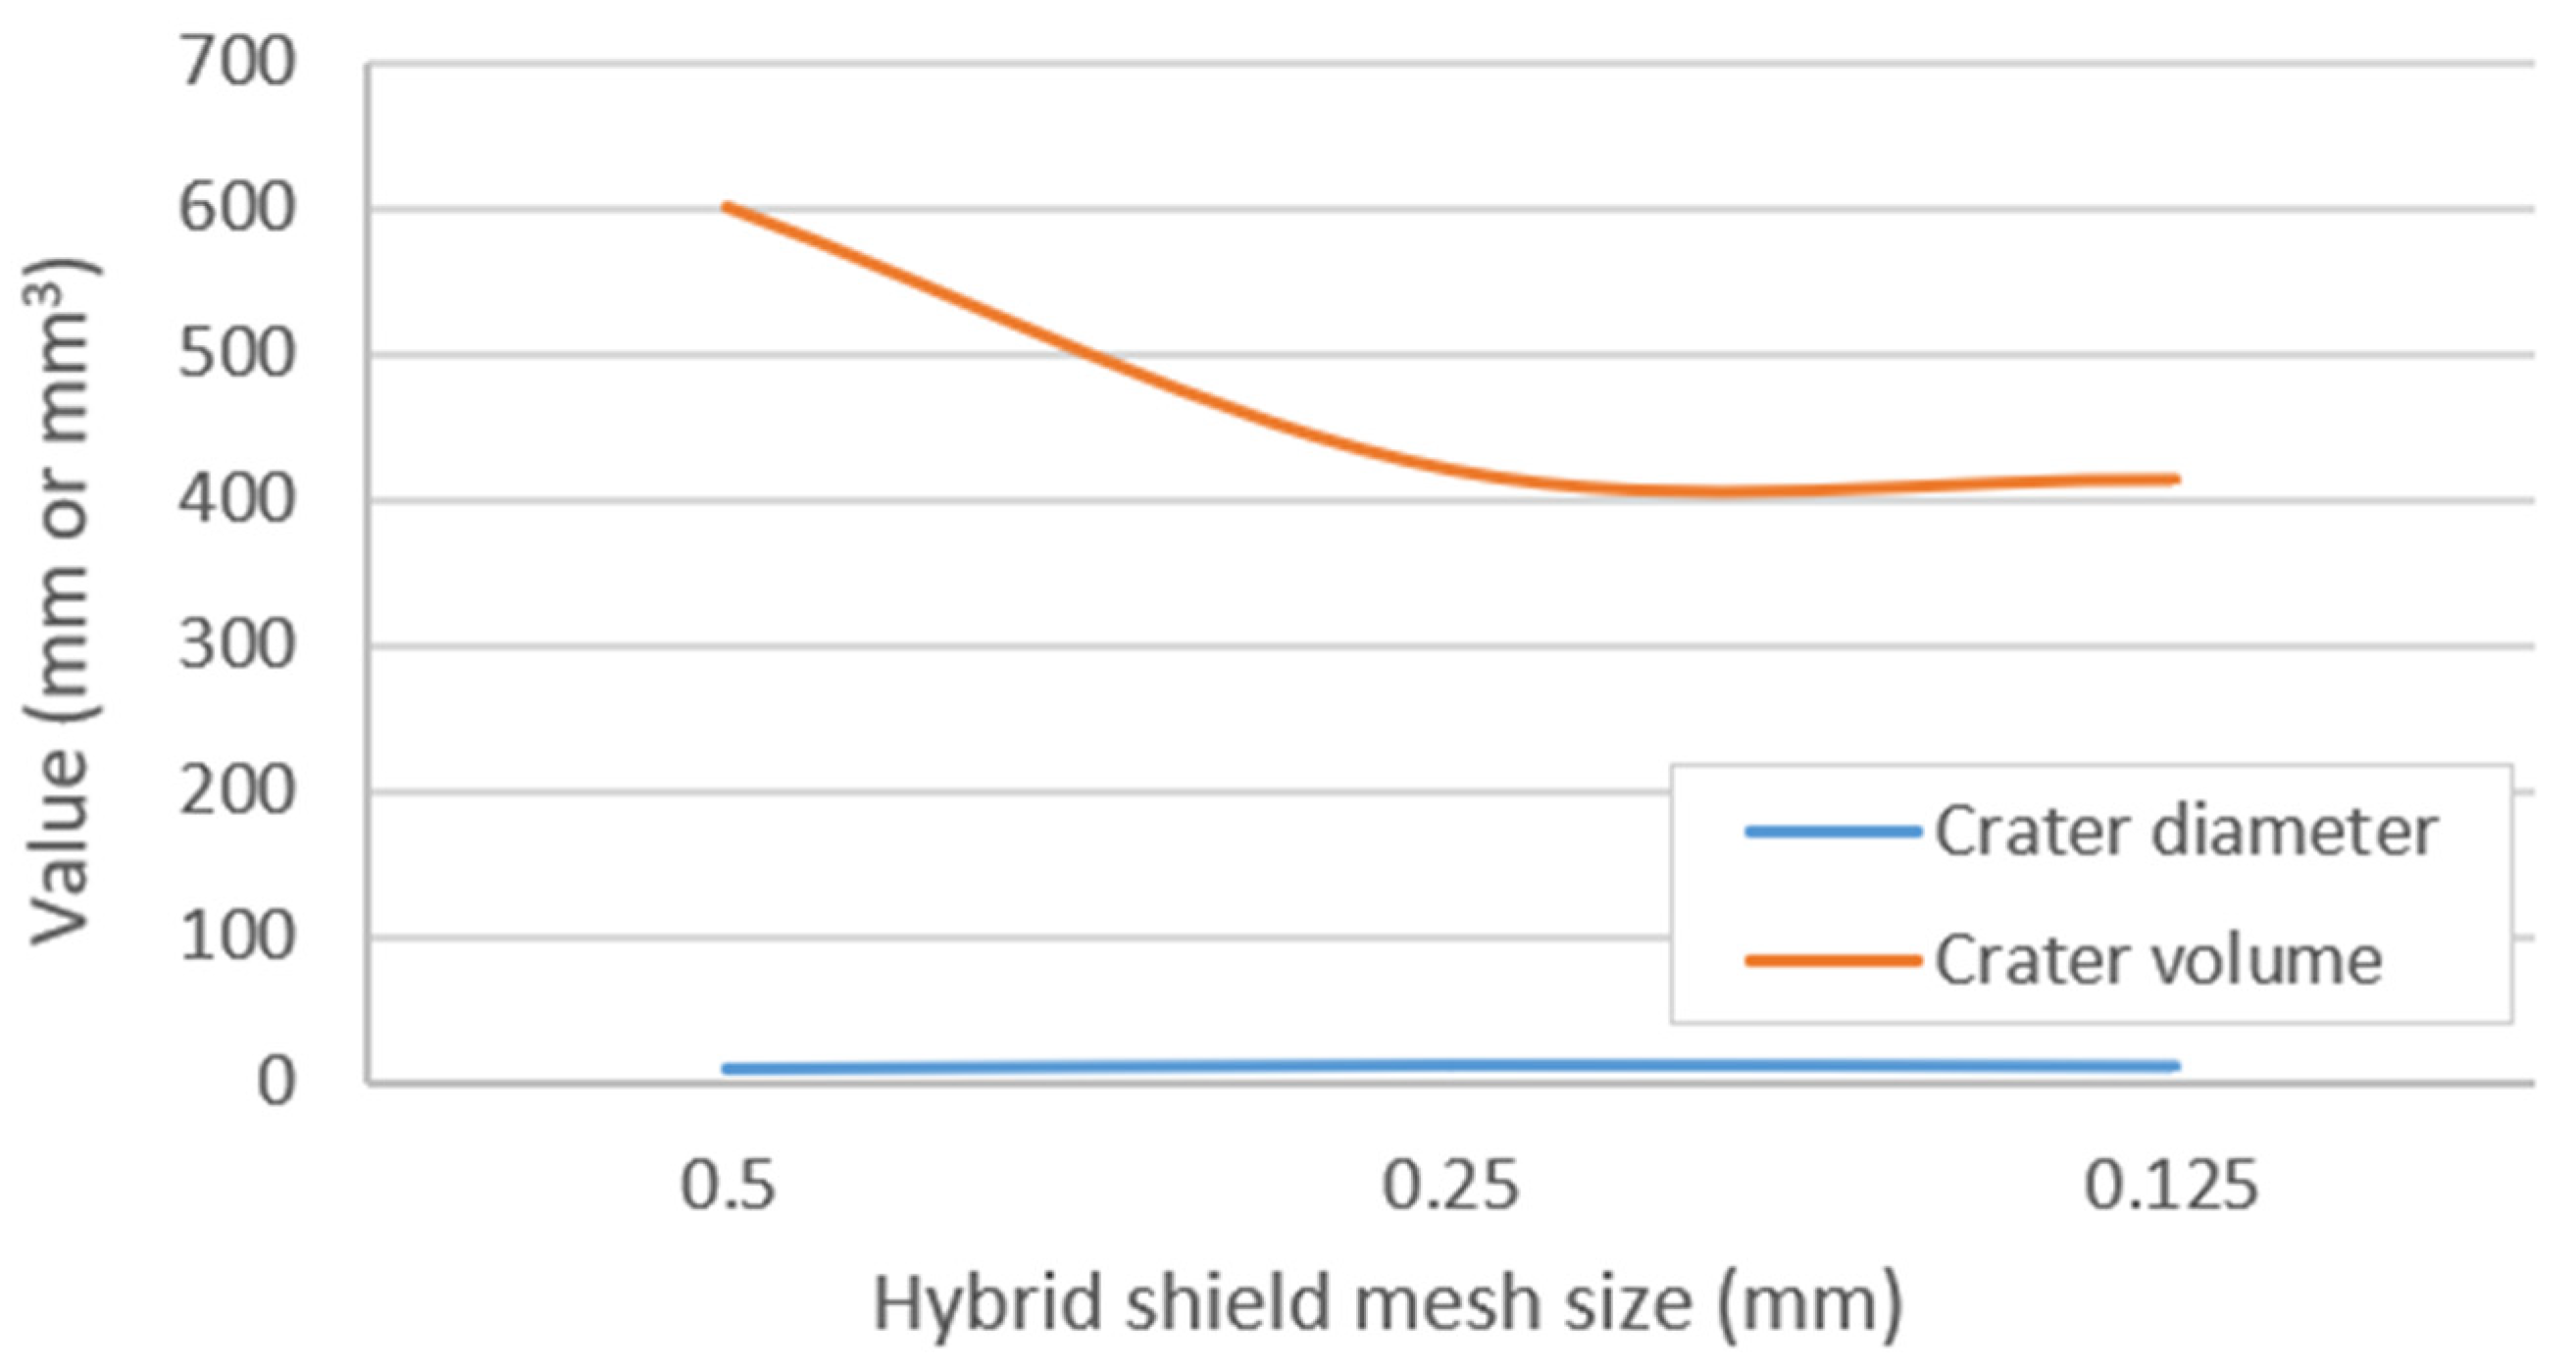
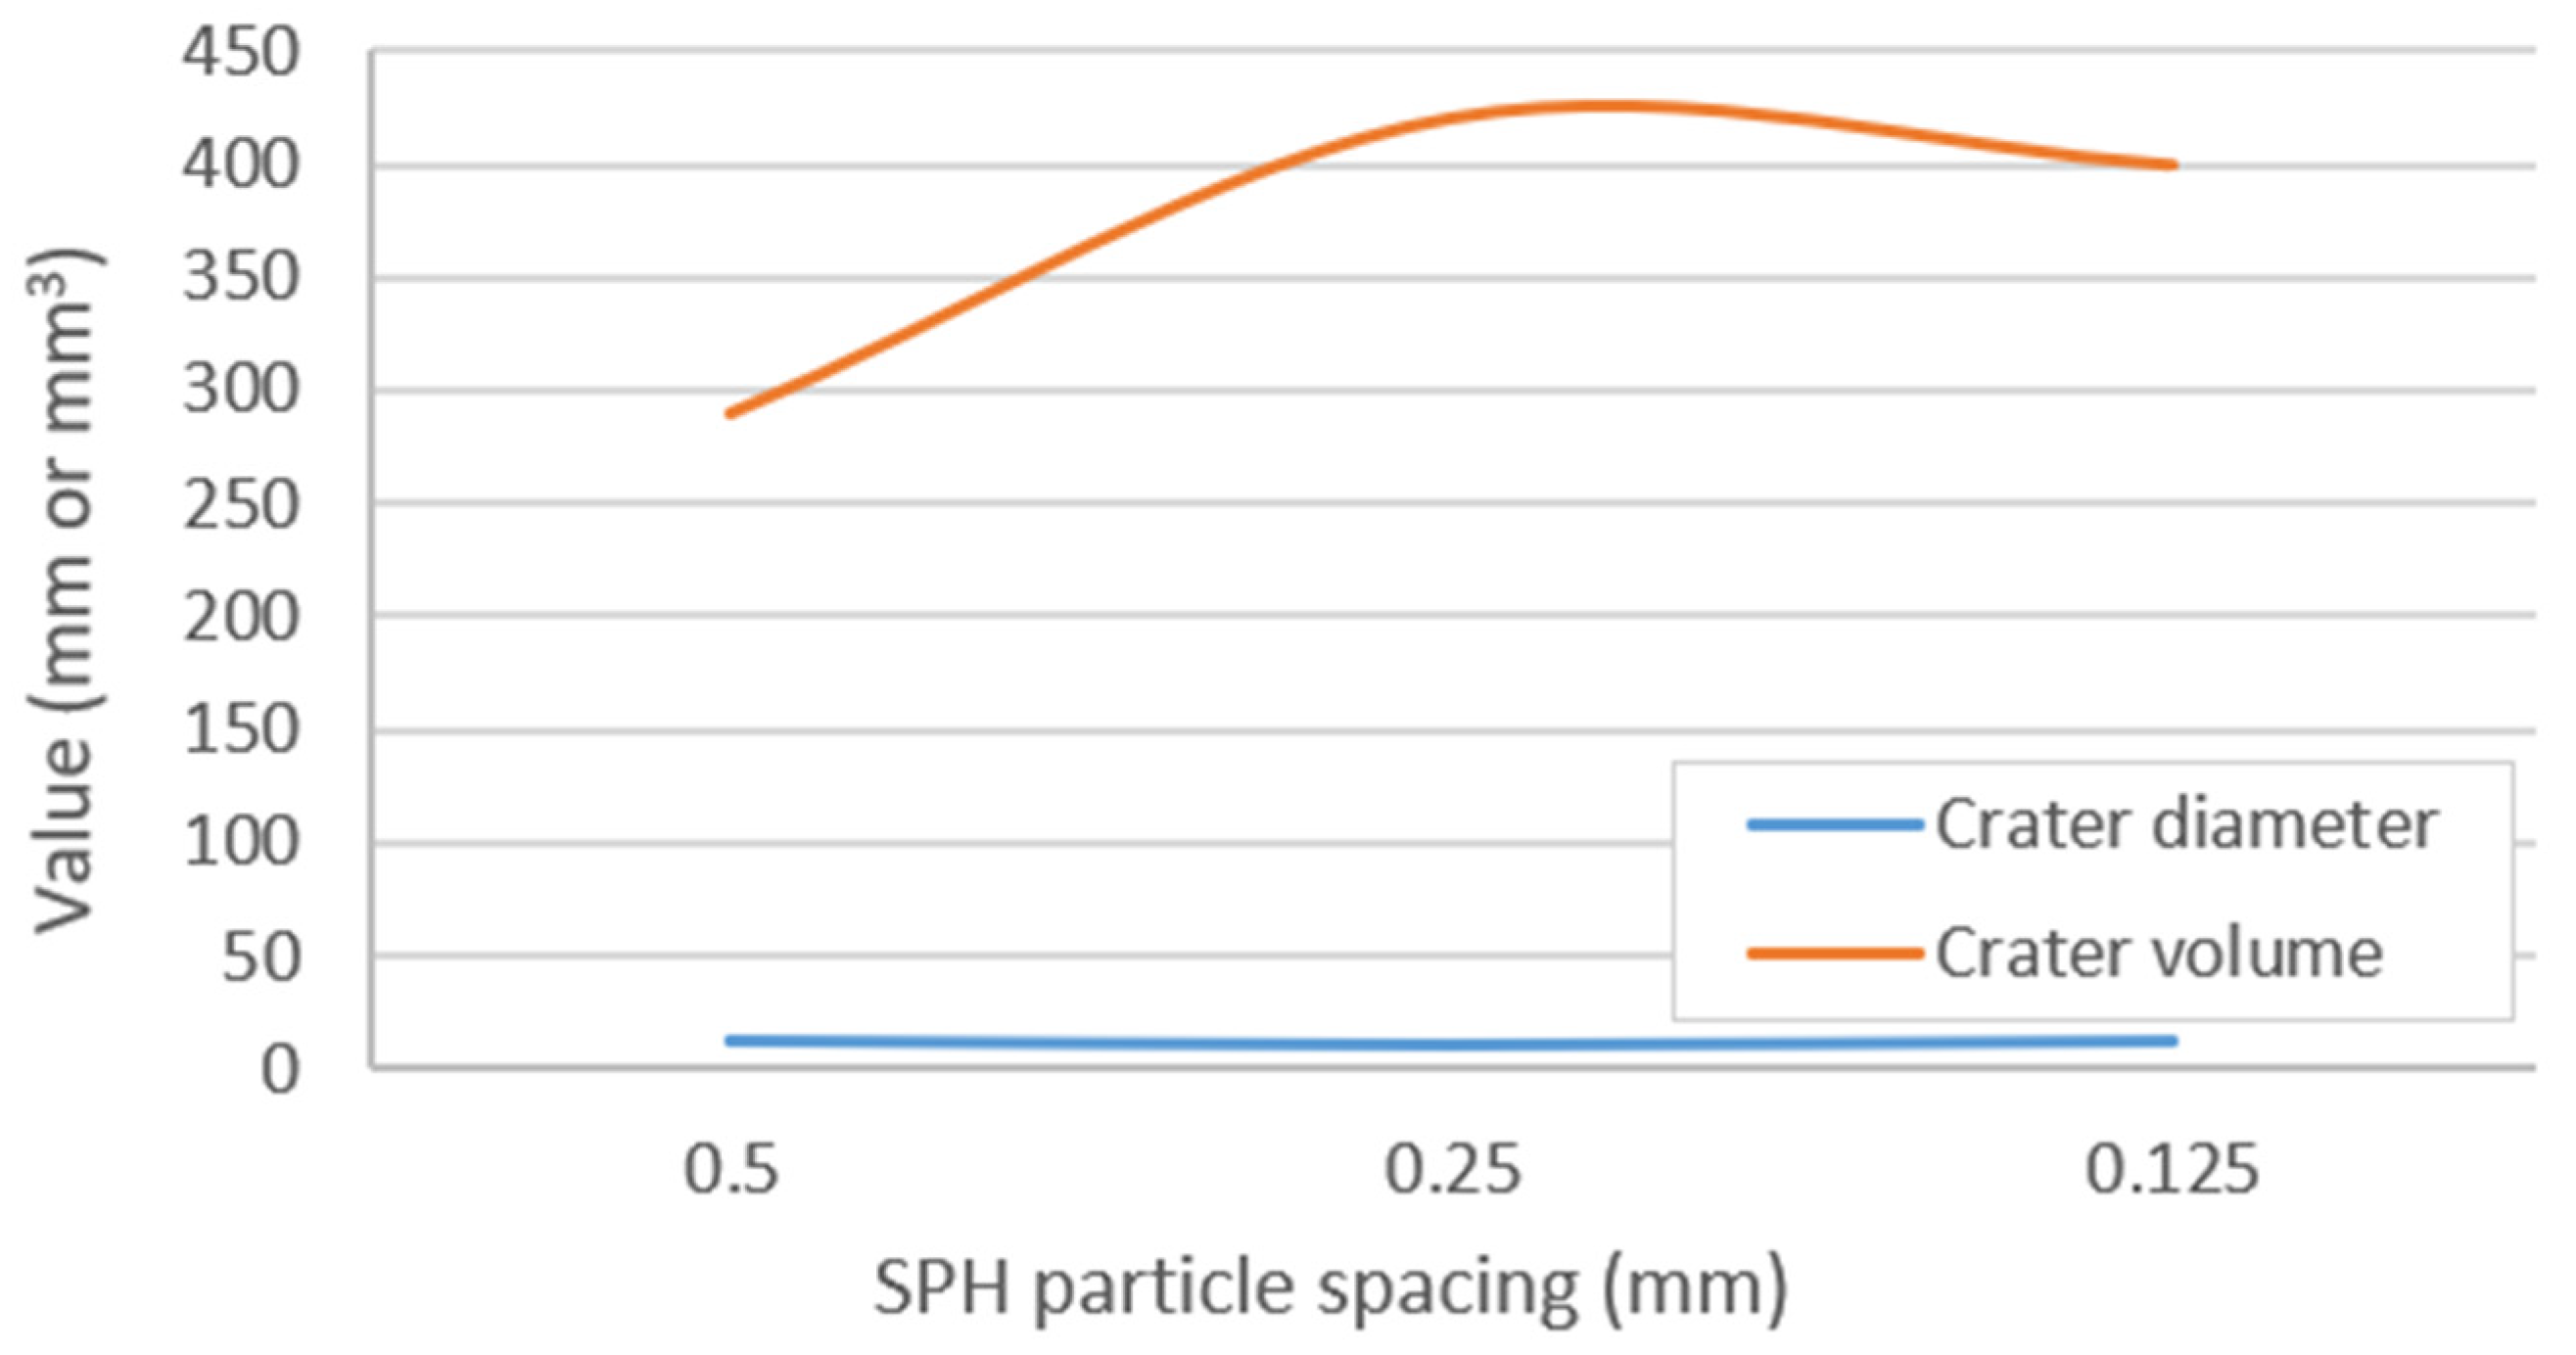
In line with the mesh convergence study for the CFRP plate and the Mylar flyer, to verify the numerical stability and ensure grid independence for the multi-layer hybrid shield configuration (Al-CFRP-Al-CFRP-Al), a dedicated mesh sensitivity analysis was performed. Three distinct discretization levels, with characteristic element sizes of 0.5 mm, 0.25 mm, and 0.125 mm in the impact zone were evaluated for the hybrid target. In parallel, the discretization of the SPH projectile was assessed using particle spacings of 0.5 mm, 0.25 mm, and 0.125 mm. Furthermore, for the 0.1 mm-thick cylinder-shaped flyer two analyses were performed with one and two particles through its thickness. The performance of each configuration was quantified by tracking the resulting crater diameter and crater volume.
The progression of these damage metrics as a function of the hybrid shield mesh size and the SPH particle resolution are depicted in Figure 16 and Figure 17. In Table 13, relative errors are also presented for all cases. The trends clearly indicate that both evaluated quantities approach convergence as the element size decreases. In particular, the deviation in crater dimensions between the 0.25 mm resolution and the finer meshes (0.125 mm for the shield and 0.125 mm for the SPH) is small and acceptable, with maximum relative error of 5.18% in crater volume. Furthermore, the through-thickness stress waves obtained with the two SPH particle resolutions at the identical time points are in close agreement, so the single-particle discretization reproduces the pressure transfer as well as the crater metrics. Based on this convergence behaviour and computational efficiency considerations, a uniform mesh size of 0.25 mm was selected for both the hybrid shield and the SPH model in all subsequent analyses. Concerning the Mylar flyer, the relative error concerning crater diameter and crater volume between one and two particles through the thickness is minimal (0.5%), so its thickness was modelled with one particle.
Figure 16.
Mesh convergence study showing the variation in predicted crater diameter and crater volume as a function of mesh size of the hybrid shield plate.
Figure 17.
Mesh convergence study showing the variation in predicted crater diameter and crater volume as a function of mesh size of the SPH particle spacing.
Table 13.
Mesh convergence verification results detailing crater diameter and crater volume across different element sizes for the hybrid shield plate, SPH particle spacing, and SPH particles through the thickness.
4.2.2. Hypervelocity Impact Response and Model Validation
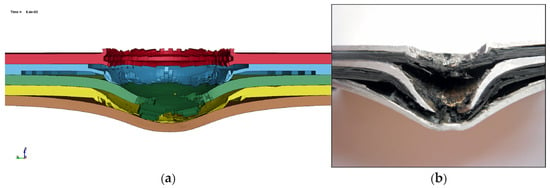
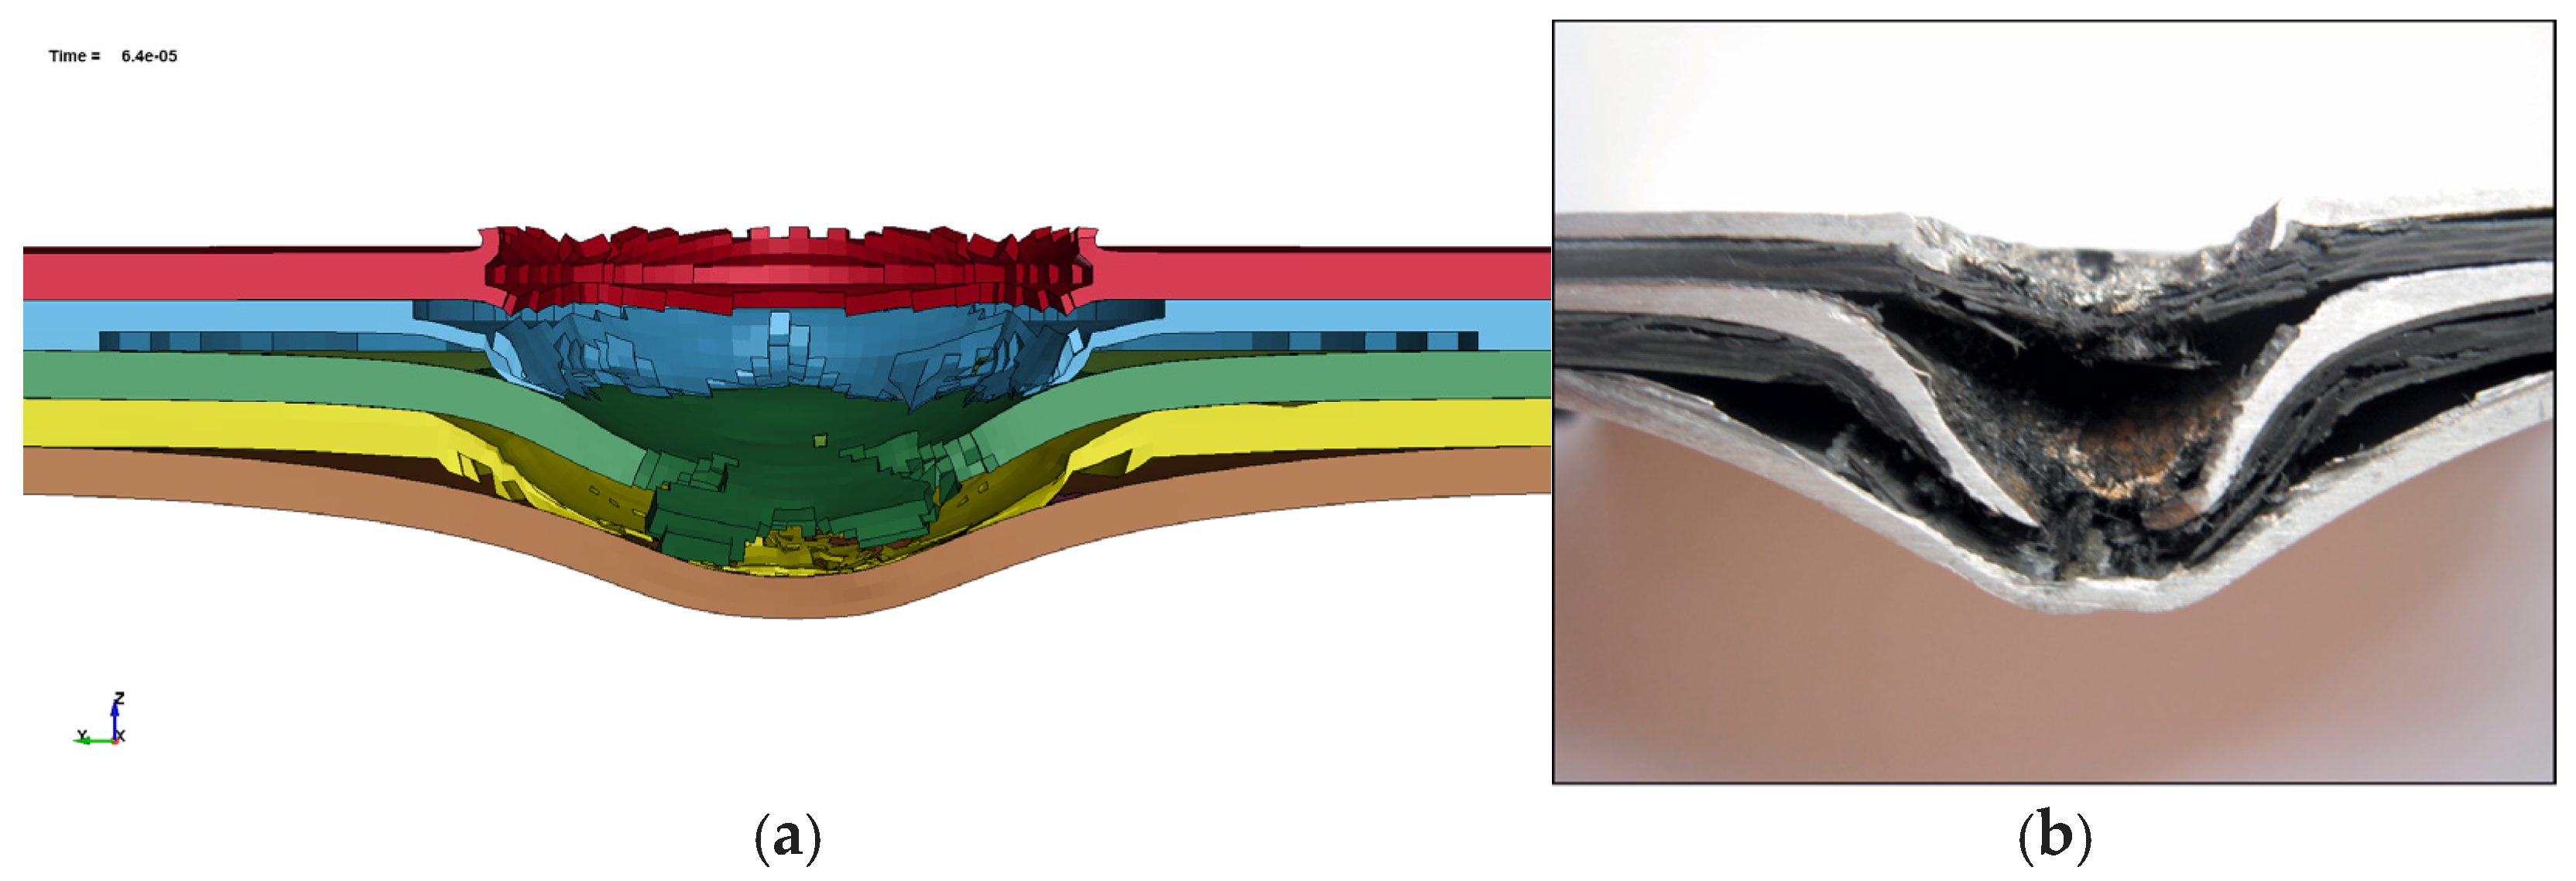
Figure 18 presents the cross-sectional damage of the hybrid shield at the end of the simulation alongside the corresponding experimental cross-section reported by Wan et al. [22]. As Wan et al. do not report quantitative measurements for this configuration, this validation is qualitative and morphological. In both cases, the first four plies are completely perforated at the impact centre. The rearmost aluminum ply undergoes plastic bulging without perforation, in good agreement with the experimental observations. Delamination between the CFRP plies and the adjacent aluminum layers is evident in both the numerical and experimental cross-sections, although the numerical model slightly underestimates the magnitude of the back-face displacement. Despite these discrepancies, the simulation successfully reproduces the principal features of the experimentally observed damage morphology and predicts a normalized crater diameter of and a back-face displacement of 3.36 mm, providing a reliable reference baseline for the subsequent laser shock analogy assessment.
Figure 18.
Comparison of cross-sectional damage in the numerical model and the experiment: (a) numerical model; (b) experiment [22].
4.2.3. Laser Shock Response and Analogy Assessment
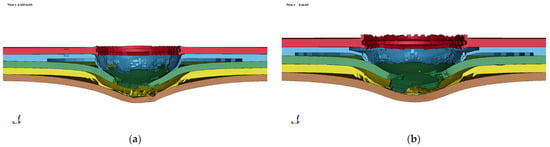
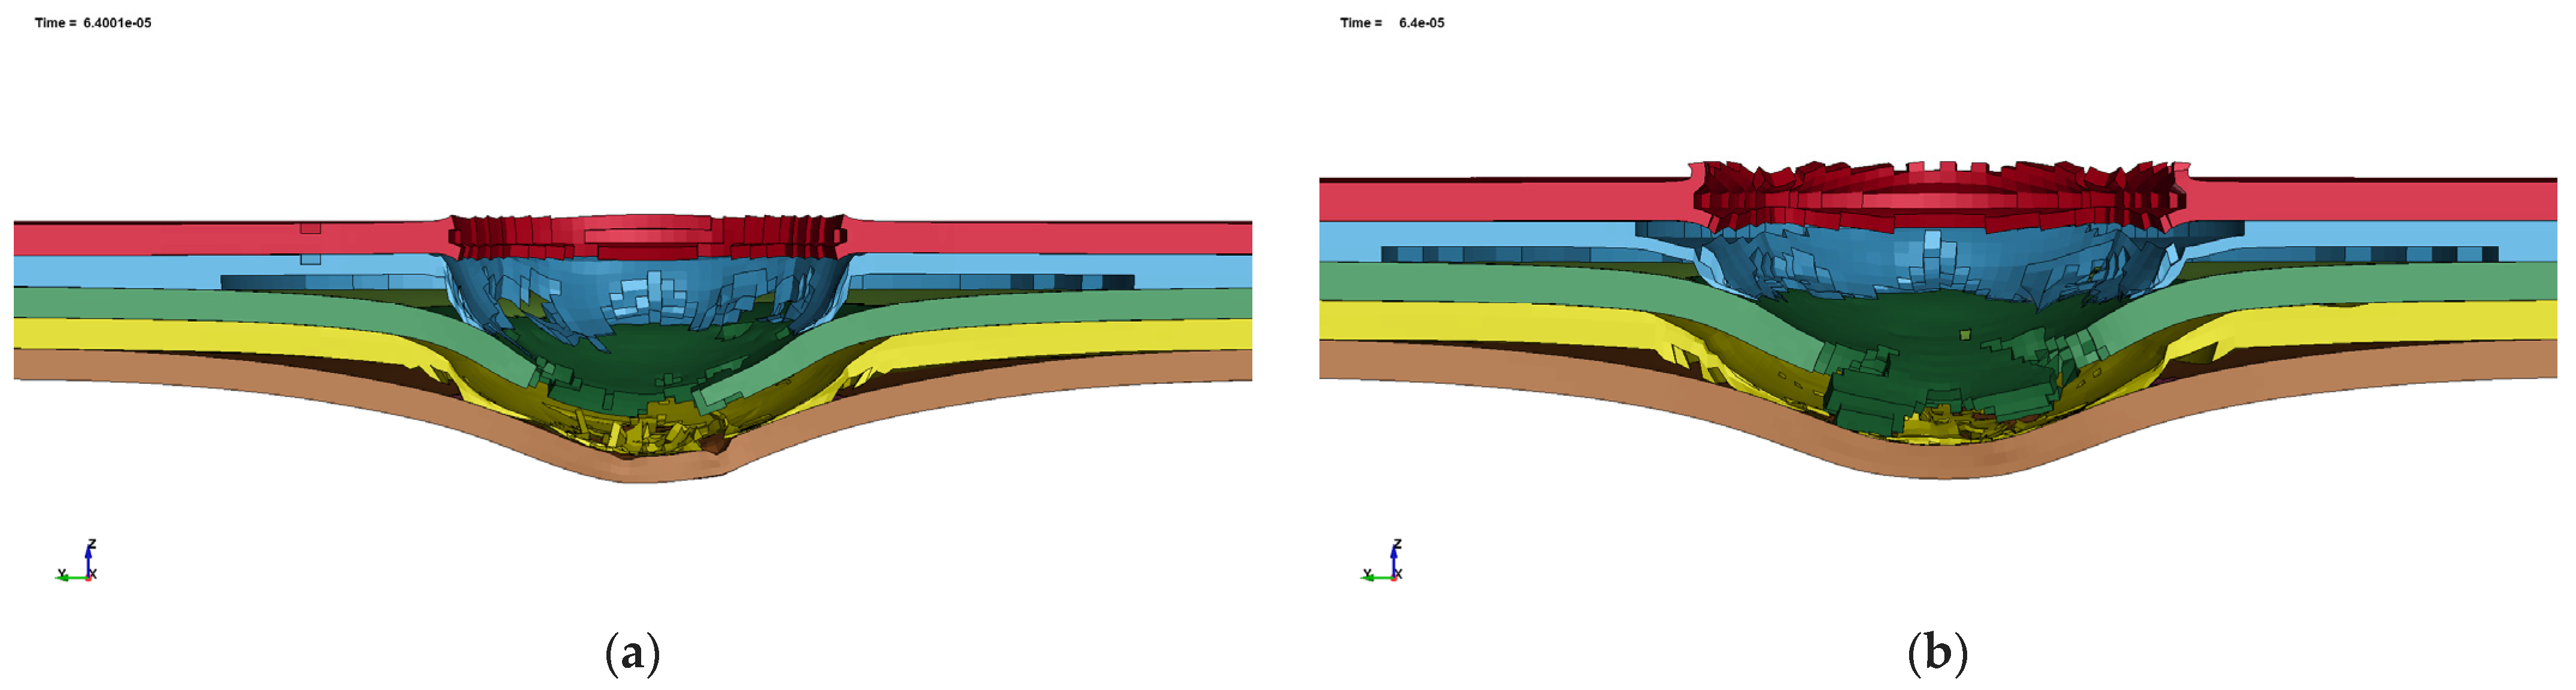
The laser shock simulation was performed using the same five-ply finite element model, with the Mylar flyer replaced by the laser shock pressure pulse shown in Figure 19. The equivalent loading was determined by evaluating the relative errors over the crater hole diameter and the rear-face displacement. At an ablation pressure of 40 GPa the pulse duration was varied between 13 and 17 ns in increments of 1 ns, and the resulting errors are given in Table 14.
Figure 19.
Cross-sectional damage comparison between (a) the laser shock simulation with 40 GPa peak pressure and 15 ns pulse duration and (b) the hypervelocity impact simulation at 9.2 km/s.
Table 14.
Relative error of the LS response with respect to the HVI baseline for the hybrid shield, at an ablation pressure of 40 GPa.
The minimum error is identified at a pulse duration of 15 ns. The resulting normalized crater diameter was and the back-face displacement was 3.48 mm. The close agreement in crater dimensions, delamination, and overall damage morphology demonstrates that the calibrated laser pressure pulse successfully reproduces the essential damage characteristics of the hypervelocity impact event in the multilayer hybrid shield. These results support the validity of the proposed HVI–LS analogy for this structural configuration.
The identified case was repeated with the *LOAD_ERODING_PART_SET definition replaced by an equivalent *LOAD_SEGMENT_SET applied to the initially exposed segments, the model being otherwise unchanged. The two formulations give the same hole diameter and the same crater morphology, with an unchanged through-thickness stress wave response, confirming that the eroding-surface treatment does not materially alter the damage metrics compared in this work.
For the 9.2 km/s HVI model, the stress wave propagation is compared at identical time points with the LS simulation using a 15 ns pulse and an ablation pressure of 40 GPa for the hybrid shield specimen. In this case, the flyer has a uniform geometry, resulting in a shock front that closely matches the laser shock front. Both the HVI and LS simulations show similar σz values (MPa) and comparable wave propagation speeds. The LS model produces a smooth and consistent shock front due to the uniform application of the laser load, while the HVI simulation demonstrates matching shock front characteristics because of the even flyer impact. Figure 20 presents the LS and HVI results at corresponding time intervals for direct comparison.
Figure 20.
Stress wave comparison of 9.2 km/s flyer speed HVI simulation with an LS simulation using 15 ns pulse duration with 40 GPa ablation pressure. Colour graph presents the (MPa).
5. Discussion
5.1. Applicability of the Methodology
A different laminate architecture or projectile material requires a different validated HVI model, not a different method: a projectile of different mass or density generates a different surface pressure field, against which the LS amplitude and pulse duration are re-identified. Projectile shape carries one constraint, since the focal spot diameter is set equal to the projectile diameter: the projectile must present a circular section normal to the impact axis, as a sphere or a cylinder does. The benchmark configurations were selected based on the availability of experimental data at 4.935 km/s for the CFRP plate and 9.2 km/s for the hybrid shield. The additional 1.5 and 3 km/s CFRP cases constitute numerical extensions of the validated CFRP model and are used to assess the HVI–LS correspondence at lower impact velocities. The method is not restricted to them, laser loading can drive pressures well above 100 GPa and has been proposed for projectiles below about 300 µm at velocities up to some 30 km/s [18,23]. What limits the present work is the reference model rather than the analogy: the Mie–Grüneisen equation of state is single-phase and valid while the peak impact pressures, which here remain in the GPa range, keep the material on a single compressive branch of the Hugoniot. At velocities where melting and partial vaporization occur, a phase-capable equation of state such as Tillotson, ANEOS or SESAME is required on the HVI side. Both configurations examined are contact-bonded. In a Whipple-type shield, the rear wall is loaded by the debris cloud rather than by the bumper crater. Reynier et al. [34] found close agreement between laser-driven and impact-driven debris clouds in ejecta categories and velocities, with differences in the ejection cone angle and an additional early-time ejecta category. Extension of the analogy to standoff configurations is therefore future work, requiring validation against debris-cloud metrics.
5.2. Experimental Feasibility
After validating the numerical models and identifying the pressure profiles required to reproduce the damage characteristics of each HVI event, the corresponding experimental laser parameters were determined to assess whether the resulting loading conditions can be achieved using existing high-power laser facilities. Table 15 summarizes the operating envelope of representative laser shock (LS) facilities.
Table 15.
Laser facilities and their operating energy capabilities.
As the millimetre-scale focal spots achievable with current laser facilities cannot match the projectile diameter considered in the shielding case, the loading diameter must be geometrically scaled down to remain within the experimentally accessible range. On the laser side, the feasibility of producing the required pressure regime at reduced focal diameters can be assessed independently of whether geometric HVI–LS similitude is preserved: Grün, Dautray, and Phipps formulations used here do not introduce an explicit focal-radius dependence in the required intensity for a prescribed loading condition; reducing the focal area therefore reduces the required energy proportionally to the irradiated area. Pirri’s formulation is an exception because it explicitly includes the focal radius and consequently predicts a moderate variation in the required intensity with spot size, as reflected by the range reported in Table 16 directly for Case 4. Hébert et al. [18] confirm this experimentally, coupling measurements at focal diameters of 0.9, 1, and 5 mm collapsing onto a single intensive law, so that the spot size enters only through the intensity. The planar loading condition is likewise preserved, the lateral rarefaction release time (47.7–238.5 ns) remaining longer than the applied pulse duration at every diameter considered ensuring essentially one-dimensional shock loading. Table 16 summarizes the required laser intensity, , and energy, , predicted by the four ablation pressure scaling laws for Cases 1–4 described in Section 2.2.
Table 16.
Required laser parameters across four impact cases of CFRP, AL-CFRP-AL-CFRP-AL, assuming λ = 1064 nm.
It can be observed that the predicted values of intensity differ considerably depending on the scaling law used as these laws were developed under distinct assumptions and originally validated over different intensity ranges. Grün’s law was fitted experimentally on planar laser-driven shocks in the range W/cm2 at with 4 ns pulses on CH disks and depends only on the ablation pressure [43].
The formula proposed by Dautray also accounts for the effects of laser wavelength and target composition and is derived within the Inertial Confinement Fusion (ICF) regime asymptotic limit, making it better suited for very high laser intensities . Therefore, in this case it underpredicts the intensity required and should be regarded as a lower-bound estimate [44].
Pirri’s law is derived analytically assuming a quasi-steady, isothermal plasma with inverse-bremsstrahlung absorption, and it introduces a spot-radius dependence () which reflects two-dimensional plasma expansion effects for finite focal spots, with only the effective plasma optical depth α calibrated to the impulse-coupling data of Gregg and Thomas [16,45]. Phipps’ law includes dependence on pulse duration, wavelength, and target atomic and mass number (, ). It was calibrated against a compiled experimental database spanning approximately 7 orders of magnitude in the parameter laser intensities from W/cm2 to W/cm2, pulse durations from 1.5 ms to 500 ps, wavelengths from 248 nm to 10.6 µm, and pulse energies from 100 mJ to 2.5 kJ, on metallic and endothermic non-metallic surface-absorbing planar targets. It applies at or above the peak-coupling intensity where dense-plasma formation mediates the laser-target interaction and assumes approximately one-dimensional plasma expansion [46]. The four cases considered in the present work ( = 25–50 GPa, = 7–15 ns, = 1064 nm) require intensities in the range 310–2868 GW/cm2, which lie fully inside the validated envelope of both Grün’s and Phipps’ laws and within the multi-facility validation range recently reported by Hebert et al. [18], who confirm the findings of Grün and Phipps. Therefore, these laws are adopted as the primary predictors of the required experimental laser parameters, and the resulting intensities and energies confirm that all four cases fall within the operating envelope of existing LS facilities.
The focal radius and the pulse duration are moreover themselves parameters of the scaling laws, appearing in Pirri’s and Phipps’ formulations, respectively, and the values required here lie inside the ranges over which those laws were validated. Both temporal and spatial profiles are controllable, the temporal one by pulse shaping and the flat-top spatial distribution assumed in Section 2.2 by diffractive optical elements or random phase plates [11,18,47]. The analogy is not tied to a particular temporal profile, the experiments of Reynier et al. [34] established it using a trapezoidal 100 ns pulse, so the Gaussian profile adopted here is one admissible choice among those a facility can deliver rather than a condition of the correspondence. The efficiency with which incident intensity is converted into surface pressure is what the scaling laws of Table 1 express. Expressed as a mechanical coupling coefficient, , the values implied by the Phipps correlation for Cases 1–4 are approximately 3.5 to 5.0 N/MW, consistent with the coupling data reported by Hébert et al. across multiple facilities [18]. Those measurements, as noted above, collapse onto a single intensive law, confirming that the spot size enters the coupling only through the intensity. The laws of Table 1 apply to direct irradiation in vacuum, which is the configuration required here. Confined ablation follows a different scaling and is in any case limited by breakdown in the confining medium to pressures below those needed in this work, while vacuum operation prevents a laser-supported detonation wave in air, as recognized in the original analogy experiments [17]. All four laws presuppose an opaque, surface-absorbing target, a condition satisfied by the carbon-based CFRP and by the aluminum front face of the hybrid shield, the Phipps correlation having been calibrated in part on carbon and graphite-epoxy targets [46].
On the impact side, a smaller projectile at the same velocity simply carries less kinetic energy and remains within the same constitutive and equation-of-state description. What does not follow is that the equivalence obtained at D0 = 10 mm may be transferred to a smaller diameter: reducing the loading diameter without scaling the shield alters the geometric ratios given in Table 17, and the lateral rarefaction argument bears on the planarity of the loading rather than on similitude of the response. The 10 mm case was adopted because it is the configuration for which experimental data were available. The appropriate course is to generate the reference HVI response at the diameter to be tested: a 2.5 mm loading on the same shield is the analogue of a 2.5 mm projectile impact, itself a representative debris threat and an easier gas-gun test than a 10 mm projectile.
Table 17.
Geometric ratios for the hybrid shield under reduction of the loading diameter alone.
5.3. Validity of the Mechanical Treatment of the Laser Load
A separate question is whether the treatment of the laser load as a purely mechanical surface pressure, adopted in Section 2.2, is quantitatively defensible for the configurations examined here. The criterion by which this is assessed in the literature is a comparison between the depth of material affected thermally by the laser and the depth of the damage under evaluation, the former being neglected when it is smaller by a sufficient margin. Aubert has applied this criterion twice, with the same outcome. In the concluding chapter of his doctoral thesis [23], having estimated the laser-induced thermal effects from coupled laser–matter interaction and hydrodynamic simulations, he concludes that the thermally affected thickness is in most cases negligible relative to the size of the craters, that it is therefore legitimate to neglect these thermal effects, and that the craters produced by laser may be taken to be entirely determined by the pressure law generated at the target surface. The subsequent experimental study [11] restates and quantifies the same conclusion: the region affected thermally by the laser is very limited, the ablated thickness being of the order of a few micrometres and the thickness subject to a significant temperature elevation, typically a few hundred Kelvin, being less than one hundred micrometres; as these thicknesses lie well below the crater depth of approximately 500 µm in that work, laser-induced thermal effects can legitimately be neglected. That comparison corresponds to a ratio of 0.20. Hébert et al. [18] independently report an energy deposition layer of typically 5 to 10 µm for the same class of configurations, consistent with the ablated thickness above. The same criterion is applied here to the present configurations. The pulses considered in this work are an order of magnitude shorter than those of [11], at 7 to 15 ns rather than 100 ns. The through-thickness thermal diffusion length √(ατ) is 0.05–0.09 µm for the CFRP (α ≈ 4.1 × 10⁻⁷ m2 s−1) and 0.86 µm for the Al 2024 layers (α ≈ 4.9 × 10⁻⁵ m2 s−1). Since pure conduction is not the only contribution to the heated depth, the more conservative course is adopted of scaling the empirical bound reported in [11] as √τ, which retains the contribution of shock heating; the resulting bounds are listed in Table 18 together with the corresponding damage features.
Table 18.
Bounds on the laser-induced thermally affected depth, compared with the nearest damage feature.
In every case the ratio of the bounded thermally affected depth to the nearest damage feature remains below the value of 0.20 already accepted as sufficient in [11], the binding case being the first ply interface of the CFRP plate. The bounded depth is furthermore smaller than the characteristic element size of the corresponding model, 0.14 mm for the CFRP plate and 0.25 mm for the hybrid shield, so that it lies below the spatial resolution of the discretization in any case. Independent experimental support is available for the conclusion that the residual temperature elevation does not influence crater formation: This is provided by Aubert et al. [11], who coupled a continuous-wave heating laser with a nanosecond shock laser to investigate the influence of bulk target temperature on laser-driven cratering. Over a broad range of investigated temperatures, the maximum crater depth and diameter remained essentially insensitive to the initial target temperature. The principal measurable change was an increase in crater volume, attributed to a more complete mechanical formation of the crater rather than to a thermal contribution to material removal. It may finally be noted that the neglect is not asymmetric between the two loading cases: the impact interface in a 4.935 km/s or 9.2 km/s hypervelocity impact is likewise melted or vaporized, so that both formulations discard a thin, fully consumed surface layer and compare the mechanically driven damage beneath it. The preceding comparison also bears on the loading formulation itself. Element deletion in the present models is governed by the mechanical failure criteria of *MAT_162 and *MAT_59, whereas physical recession of the irradiated surface is a mass-removal process driven by vaporization, and the two are not equivalent. Their divergence over the interval during which the load is applied can nevertheless be bounded. The physical ablation depth is of the order of a few micrometres [11,18], against characteristic element sizes of 140 µm for the CFRP plate and 250 µm for the hybrid shield, so that genuine ablative recession during the pulse amounts to between 2 and 4% of a single element and cannot by itself expose a new element face. The pulse duration of 7 to 15 ns likewise represents approximately 1.2–2.3% of the through-thickness shock transit time, which is 0.57 µs for the CFRP plate and 1.25 µs for the hybrid shield. The physical surface is therefore very nearly stationary while the load is applied, and any element deletion occurring within that interval is attributable to the mechanical criterion rather than to ablation. The consequence of the approximation is therefore confined to the interval over which the load is applied, during which the loaded surface would in reality have receded by a small fraction of a single element. Since the parameter identification of Section 3 is carried out against the resulting damage state rather than against the pressure history itself, the formulation is required only to deliver a self-consistent load to a surface that is, over that interval, effectively stationary. The identified pressure amplitudes should accordingly be understood as the values that reproduce the target damage state under this formulation, rather than as direct measurements of a physical ablation pressure.
6. Limitations
The analogy developed in this work should be interpreted within specific limitations. The agreement demonstrated in Section 4 is an equivalence of damage outcome, obtained by matching the pressure amplitude, pulse duration and loading diameter of the applied loading. It is not a claim of full physical equivalence between the two processes, which differ fundamentally in the mechanism by which the surface load is generated.
In this model, the laser shock loading is represented as a purely mechanical surface pressure applied to the same material models used for HVI. Even though the assumption is justified by laser shock modelling literature [11,16,17,23,24,29], it weakens when the damage approaches thermally affected regions, for longer pulses or thinner targets. Additionally, the analysis uses through-thickness diffusivity as a conservative estimate, without a full anisotropic thermal evaluation.
No laser shock experiments were performed in the present work. The laser intensities and energies reported in Section 5.2 are obtained by inverting published ablation pressure scaling laws and are shown to lie within the operating envelope of existing facilities. This establishes that the configurations examined are experimentally accessible. Experimental confirmation on a facility within the identified parameter range is a necessary next step.
The size scaling between the validation and simulated models is limited by the available experimental data and geometric consistency. Validation was based on tests at 4.935 km/s for the CFRP plate and a 10 mm projectile on the hybrid shield, while other velocities and smaller diameters rely on numerical reference cases since no experimental data exist at 1.5 or 3 km/s, nor for a reduced-diameter loading on the hybrid shield. The proposed methodology is indeed applicable for smaller scales as long as the aforementioned assumptions apply. The methodology constrains how far the loading diameter may be reduced, on both sides of the surface: within the target, the lateral rarefaction release time scales with the diameter and falls to about three times the pulse duration at the smallest spot considered, beyond which edge release would reach the loaded region before the pulse ends; above it, the lateral plasma motion becomes comparable to the spot size, so the expansion departs from the one-dimensional idealization underlying the scaling laws of Table 1. This study presents a methodology for substituting specific experimental procedures with laser shock tests derived from simulation analogy. The approach demonstrates how dynamic loading conditions can be reproduced numerically; however, the results are not universally applicable. The damage similarity established here remains valid only within the tested configurations and requires experimental validation to confirm its broader applicability.
7. Conclusions
In this study, the analogy between hypervelocity impact (HVI) and laser shock (LS) loading for spacecraft shielding materials was investigated numerically. The analysis was performed for two representative configurations: a CFRP bumper and an Al/CFRP/Al/CFRP/Al hybrid shield. A numerical methodology for modelling LS loading in LS-DYNA was developed, in which the ablation pressure pulse is applied to the target surface while the loaded area is continuously updated as the outermost material is progressively eroded. A baseline framework was also proposed for determining the experimental LS parameters required to reproduce a given HVI event. The HVI models were validated against published experimental data, and the identified LS loading reproduced the resulting damage state in terms of crater morphology, hole size, delamination, and the extent of the damaged area. The through-thickness stress wave fields, which did not enter the identification, were also found comparable, though the correspondence established remains one of damage characteristics rather than a demonstration of equivalence of the transient response. The proposed framework can also be applied in the reverse direction to determine the projectile conditions corresponding to a given laser shock experiment. Finally, the predicted laser intensity and energy requirements for all investigated cases fall within the operating envelope of contemporary high-power laser facilities, indicating that the required loading conditions are within reach of existing facilities. Since no laser shock experiments were performed in the present work, experimental validation on a facility within the identified parameter range is the necessary next step, together with extension of the identification across a wider range of impact conditions in order to establish a predictive mapping between HVI and LS loading conditions.
Author Contributions
Conceptualization, K.T.; methodology, G.F., P.K., and P.R.; software, G.F., P.K., and P.R.; validation, G.F., P.R., and P.K.; formal analysis, P.R.; writing—original draft preparation, G.F., P.K., and P.R.; writing—review and editing, K.T.; visualization, G.F., P.R., and P.K.; supervision, K.T.; project administration, G.F. All authors have read and agreed to the published version of the manuscript.
Funding
This research received no external funding.
Data Availability Statement
All data are presented in the manuscript.
Conflicts of Interest
The authors declare no conflicts of interest.
Abbreviations
The following abbreviations are used in this manuscript:
| Al | Aluminum |
| CFRP | Carbon-Fibre-Reinforced Polymer |
| EOS | Equation of State |
| FEM | Finite Element Method |
| HVI | Hypervelocity Impact |
| ICF | Inertial Confinement Fusion |
| J–C | Johnson–Cook |
| LS | Laser Shock |
| MMOD | Micro-Meteoroid and Orbital Debris |
| PW | Plain Weave |
| SPH | Smoothed Particle Hydrodynamics |
| UD | Unidirectional |
| VARTM | Vacuum-Assisted Resin Transfer Moulding |
References
- European Space Agency. Space Debris by the Numbers; European Space Agency: Darmstadt, Germany, 2023.
- Adushkin, V.V.; Aksenov, O.Y.; Veniaminov, S.S.; Kozlov, S.I.; Tyurenkova, V.V. The Small Orbital Debris Population and Its Impact on Space Activities and Ecological Safety. Acta Astronaut. 2020, 176, 591–597. [Google Scholar] [CrossRef] [Scilit]
- Piekutowski, A.J.; Poormon, K.L.; Christiansen, E.L.; Davis, B.A. Performance of Whipple Shields at Impact Velocities above 9 km/s. Int. J. Impact Eng. 2011, 38, 495–503. [Google Scholar] [CrossRef] [Scilit]
- Pai, A.; Divakaran, R.; Anand, S.; Shenoy, S.B. Advances in the Whipple Shield Design and Development: A Brief Review. J. Dyn. Behav. Mater. 2022, 8, 20–38. [Google Scholar] [CrossRef] [Scilit]
- Chen, Y.; Tang, Q.; He, Q.; Chen, L.; Chen, X. Review on Hypervelocity Impact of Advanced Space Debris Protection Shields. Thin-Walled Struct. 2024, 200, 111874. [Google Scholar] [CrossRef] [Scilit]
- Rakib, M.A.; Smith, S.T.; Tafsirojjaman, T. A Review of Shielding Systems for Protecting Off-Earth Structures from Micrometeoroid and Orbital Debris Impact. Acta Astronaut. 2024, 223, 404–425. [Google Scholar] [CrossRef] [Scilit]
- Whipple, F.L. Meteorites and Space Travel. Astron. J. 1947, 52, 131. [Google Scholar] [CrossRef] [Scilit] [PubMed]
- Rogers, J.A.; Bass, N.T.; Wiest, M.L.; Wantz, Z.; Wilkerson, J.W.; Lacy, T.E. The Pursuit of Hypervelocities: A Review of Two-Stage Light Gas Gun Aeroballistic Ranges. Int. J. Impact Eng. 2024, 185, 104861. [Google Scholar] [CrossRef] [Scilit]
- Liu, S. Ballistic Range. In Hypervelocity Launchers; Seiler, F., Igra, O., Eds.; Springer International Publishing: Cham, Switzerland, 2016; pp. 23–52. ISBN 978-3-319-26016-7. [Google Scholar]
- Veysset, D.; Lee, J.-H.; Hassani, M.; Kooi, S.E.; Thomas, E.L.; Nelson, K.A. High-Velocity Micro-Projectile Impact Testing. Appl. Phys. Rev. 2021, 8, 011319. [Google Scholar] [CrossRef] [Scilit]
- Aubert, B.; Hébert, D.; Rullier, J.L.; Lescoute, E.; Doualle, T.; Gallais, L. Two-laser experiments to reproduce hypervelocity impacts on graphite at high temperature. Int. J. Impact Eng. 2025, 204, 105375. [Google Scholar] [CrossRef] [Scilit]
- Hoffman, J. The Effect of Recoil Pressure in the Ablation of Polycrystalline Graphite by a Nanosecond Laser Pulse. J. Phys. Appl. Phys. 2015, 48, 235201. [Google Scholar] [CrossRef] [Scilit]
- Balageas, D.; Deom, A.; Devezeaux De Lavergne, D.; Demange, D. Hypervelocity Erosion of Carbon-Carbon Composites by Laser Simulation. In Proceedings of the 18th Thermophysics Conference, Montreal, QC, Canada, 1–3 July 1983. [Google Scholar]
- Jaulin, V.; Hébert, D.; Aubert, B.; Rullier, J.-L.; Malaise, F.; Lescoute, E. Laser-Induced Cratering of a 3DCC Material at Mesoscale: Experiments and Simulations. EPJ Web Conf. 2018, 183, 01028. [Google Scholar] [CrossRef] [Scilit]
- Seisson, G.; Prudhomme, G.; Frugier, P.-A.; Hébert, D.; Lescoute, E.; Sollier, A.; Videau, L.; Mercier, P.; Boustie, M.; Berthe, L. Dynamic Fragmentation of Graphite under Laser-Driven Shocks: Identification of Four Damage Regimes. Int. J. Impact Eng. 2016, 91, 68–79. [Google Scholar] [CrossRef] [Scilit]
- Pirri, A.N. Theory for Laser Simulation of Hypervelocity Impact. Phys. Fluids 1977, 20, 221–228. [Google Scholar] [CrossRef] [Scilit]
- Nebolsine, P. Laser Simulation of Hypervelocity Impact. In Proceedings of the 14th Aerospace Sciences Meeting, Washington, DC, USA, 26–28 January 1976. [Google Scholar]
- Hébert, D.; Bras, C.L.; Reynier, B.; Aubert, B.; Chevalier, J.-M.; Lescoute, E.; Boutoux, G.; Jodar, B.; Géral, T.; Loison, D.; et al. Momentum Transfer During Laser-Driven Cratering Experiments. In Proceedings of the 2024 17th Hypervelocity Impact Symposium, Tsukuba, Japan, 9–13 September 2024. [Google Scholar]
- Borodziuk, S.; Kasperczuk, A.; Pisarczyk, T.; Rohlena, K.; Ullschmied, J.; Kalal, M.; Limpouch, J.; Pisarczyk, P. Application of Laser Simulation Method for the Analysis of Crater Formation Experiment on PALS Laser. Czechoslov. J. Phys. 2003, 53, 799–810. [Google Scholar] [CrossRef] [Scilit]
- Morena, A.; Peroni, L. Numerical Simulations of Laser-Induced Shock Experiments on Graphite. Materials 2021, 14, 7079. [Google Scholar] [CrossRef] [Scilit] [PubMed]
- Wicklein, M.; Ryan, S.; White, D.M.; Clegg, R.A. Hypervelocity Impact on CFRP: Testing, Material Modelling, and Numerical Simulation. Int. J. Impact Eng. 2008, 35, 1861–1869. [Google Scholar] [CrossRef] [Scilit]
- Wan, H.; Bai, S.; Li, S.; Mo, J.; Zhao, S.; Song, Z. Shielding Performances of the Designed Hybrid Laminates Impacted by Hypervelocity Flyer. Mater. Des. 1980–2015 2013, 52, 422–428. [Google Scholar] [CrossRef] [Scilit]
- Aubert, B. Behavior of Carbon Materials Under Intense Dynamic Loading: Analogy Between Laser Irradiations and Hypervelocity Impacts. Ph.D. Thesis, ENSAM, Paris, France, 2018. [Google Scholar]
- Tserpes, K.; Papadopoulos, K.; Unaldi, S.; Berthe, L. Development of a Numerical Model to Simulate Laser-Shock Paint Stripping on Aluminum Substrates. Aerospace 2021, 8, 233. [Google Scholar] [CrossRef] [Scilit]
- Gakias, C.; Lamprou, A. ‘SFEre’, Github. 2022. Available online: https://github.com/lmemd/sFEre (accessed on 5 May 2026).
- Haque, B.; Gillespie, J., Jr. Rate Dependent Progressive Composite Damage Modeling Using MAT162 in LS-DYNA. In Proceedings of the 13th International LS-DYNA Users Conference; Livermore Software Technology Corporation: Livermore, CA, USA, 2014. [Google Scholar]
- He, Q.-G.; Chen, X.; Chen, J.-F. Finite Element-Smoothed Particle Hydrodynamics Adaptive Method in Simulating Debris Cloud. Acta Astronaut. 2020, 175, 99–117. [Google Scholar] [CrossRef] [Scilit]
- Chi, R.Q. Research and Modeling of Debris Cloud Produced by Hypervelocity Impact of Projectile with Thin Plate. Ph.D. Thesis, Harbin Institute of Technology, Harbin, China, 2010. (In Chinese) [Google Scholar]
- Papadopoulos, K.; Tserpes, K. Analytical and Numerical Modeling of Stress Field and Fracture in Aluminum/Epoxy Interface Subjected to Laser Shock Wave: Application to Paint Stripping. Materials 2022, 15, 3423. [Google Scholar] [CrossRef] [Scilit] [PubMed]
- Fowler, K.; Teixeira-Dias, F. Optimisation of Hybrid Composite Shields for Hypervelocity Micro-Meteoroid and Orbital Debris (MMOD) Impact. Adv. Space Res. 2024, 73, 6194–6208. [Google Scholar] [CrossRef] [Scilit]
- Floros, I.S.; Tserpes, K.I.; Löbel, T. Mode-I, Mode-II and Mixed-Mode I+II Fracture Behavior of Composite Bonded Joints: Experimental Characterization and Numerical Simulation. Compos. Part B Eng. 2015, 78, 459–468. [Google Scholar] [CrossRef] [Scilit]
- Al-azzawi, A.; Kawashita, L.; Featherston, C. Buckling and postbuckling behaviour of glare laminates containing splices and doublers. Part 2: Numerical modelling. Compos. Struct. 2017, 176, 1170–1187. [Google Scholar] [CrossRef] [Scilit]
- Giannaros, E.; Kotzakolios, A.; Kostopoulos, V.; Campoli, G. Hypervelocity Impact Response of CFRP Laminates Using Smoothed Particle Hydrodynamics Method: Implementation and Validation. Int. J. Impact Eng. 2019, 123, 56–69. [Google Scholar] [CrossRef] [Scilit]
- Reynier, B.; Jodar, B.; Géral, T.; Aubert, B.; Rullier, J.-L.; Lescoute, E.; Le Bras, C.; Taddei, L.; Chevalier, J.-M.; Hébert, D.; et al. Laser-Driven Cratering into Porous Graphite: Experimental Investigation on Ejecta Distribution. Int. J. Impact Eng. 2026, 207, 105476. [Google Scholar] [CrossRef] [Scilit]
- Li, Y.; Chen, L.; Chen, M.; Liu, F.; Gu, Y.; Guo, B.; Hua, J.; Huang, T.; Leng, Y.; Li, F.; et al. High-Intensity Lasers and Research Activities in China. High Power Laser Sci. Eng. 2025, 13, e12. [Google Scholar] [CrossRef] [Scilit]
- Yamanaka, C.; Kato, Y.; Mochizuki, T.; Nakatsuka, M.; Yamanaka, T.; Yoshida, K. Gekko XII system for laser fusion research. In Proceedings of the CLEO 1984, OSA Technical Digest, Anaheim, CA, USA, 19–22 June 1984. [Google Scholar]
- Jungwirth, K.; Cejnarova, A.; Juha, L.; Kralikova, B.; Krasa, J.; Krousky, E.; Krupickova, P.; Laska, L.; Masek, K.; Mocek, T.; et al. The Prague Asterix Laser System. Phys. Plasmas 2001, 8, 2495–2501. [Google Scholar] [CrossRef] [Scilit]
- Danson, C.N.; Haefner, C.; Bromage, J.; Butcher, T.; Chanteloup, J.-C.F.; Chowdhury, E.A.; Galvanauskas, A.; Gizzi, L.A.; Hein, J.; Hillier, D.I.; et al. Petawatt and Exawatt Class Lasers Worldwide. High Power Laser Sci. Eng. 2019, 7, e54. [Google Scholar] [CrossRef] [Scilit]
- Science and Technology Facilities Council. Central Laser Facility Annual Report 2020–2021; Science and Technology Facilities Council: Swindon, UK, 2021. [Google Scholar]
- Bagnoud, V.; Aurand, B.; Blazevic, A.; Borneis, S.; Bruske, C.; Ecker, B.; Eisenbarth, U.; Fils, J.; Frank, A.; Gaul, E.; et al. Commissioning and Early Experiments of the PHELIX Facility. Appl. Phys. B 2010, 100, 137–150. [Google Scholar] [CrossRef] [Scilit]
- Hopps, N.; Oades, K.; Andrew, J.; Brown, C.; Cooper, G.; Danson, C.; Daykin, S.; Duffield, S.; Edwards, R.; Egan, D.; et al. Comprehensive Description of the Orion Laser Facility. Plasma Phys. Control. Fusion 2015, 57, 064002. [Google Scholar] [CrossRef] [Scilit]
- Zhu, J.; Zhu, J.; Li, X.; Zhu, B.; Ma, W.; Lu, X.; Fan, W.; Liu, Z.; Zhou, S.; Xu, G.; et al. Status and Development of High-Power Laser Facilities at the NLHPLP. High Power Laser Sci. Eng. 2018, 6, e55. [Google Scholar] [CrossRef] [Scilit]
- Grun, J.; Decoste, R.; Ripin, B.H.; Gardner, J. Characteristics of Ablation Plasma from Planar, Laser-Driven Targets. Appl. Phys. Lett. 1981, 39, 545–547. [Google Scholar] [CrossRef] [Scilit]
- Dautray, R.; Watteau, J.-P. La Fusion Thermonucléaire Inertielle Par Laser; Commissariat à l’Energie Atomique: Paris, France, 1993; ISBN 2-7272-0170-2. [Google Scholar]
- Gregg, C.W.; Thomas, S.J. Momentum transfer produced by focused laser text radiation. J. Appl. Phys. 1966, 37, 2787–2789. [Google Scholar] [CrossRef] [Scilit]
- Phipps, C.R.; Turner, T.P.; Harrison, R.F.; York, G.W.; Osborne, W.Z.; Anderson, G.K.; Corlis, X.F.; Haynes, L.C.; Steele, H.S.; Spicochi, K.C.; et al. Impulse Coupling to Targets in Vacuum by KrF, HF, and CO2 Single-Pulse Lasers. J. Appl. Phys. 1988, 64, 1083–1096. [Google Scholar] [CrossRef] [Scilit]
- Géral, T.; Lescoute, E.; Jodar, B.; Sollier, A. GCLT: A Versatile High Power Laser Facility for High-Energy-Density (HED) Physics Applications. AIP Conf. Proc. 2024, 3066, 450002. [Google Scholar] [CrossRef] [Scilit]

Disclaimer/Publisher’s Note: The statements, opinions and data contained in all publications are solely those of the individual author(s) and contributor(s) and not of MDPI and/or the editor(s). MDPI and/or the editor(s) disclaim responsibility for any injury to people or property resulting from any ideas, methods, instructions or products referred to in the content. |
© 2026 by the authors. Licensee MDPI, Basel, Switzerland. This article is an open access article distributed under the terms and conditions of the Creative Commons Attribution (CC BY) license.