


Abstract
Telemetry data provide essential information on a spacecraft’s in-orbit operating state and its evolution, supporting system health-state awareness, assessment, and judgment. However, existing data-driven health-state modeling methods may provide unstable representations of healthy operating patterns and have difficulty distinguishing local disturbances from state deviations in complex spacecraft telemetry. To address these problems, this paper proposes a Health Prototype Memory Transformer (HPM-Former) for telemetry health-state baseline modeling. HPM-Former uses convolutional structures to extract local fluctuation features and a Transformer to model global temporal dependencies among multivariate telemetry parameters. Health-memory prototypes learn representative healthy patterns under normal operating conditions, enabling stable representations of healthy spacecraft operation. A health-consistency deviation is constructed from reconstruction deviation, health-prototype matching, and uncertainty in memory addressing to characterize input deviation from the health-state baseline, thereby supporting comprehensive state assessment. Experiments on the European Space Agency Anomalies Dataset (ESA-AD) show that HPM-Former stably represents healthy operating patterns and improves the reliability of current-state assessment against the health-state baseline. It outperforms the comparison methods in corrected event-wise and event-wise alarming precision, providing an effective data-driven approach for operational-state assessment of complex spacecraft.
1. Introduction
Complex spacecraft, such as manned spacecraft and deep-space explorers, continuously generate large-scale, high-dimensional, and structurally complex telemetry during long-term on-orbit operations. Telemetry is a primary source of information on a spacecraft’s on-orbit operational state and its evolution, and it uniquely captures the intrinsic operating patterns and fundamental characteristics of the spacecraft [1]. Continuous telemetry monitoring and analysis support real-time awareness of spacecraft operational states, early identification of anomaly-related risks, and mission-control operations. Therefore, extracting representative operating patterns from historical telemetry and constructing a health-state baseline that characterizes nominal system behavior is essential for state awareness and operational assessment of complex spacecraft systems.
Out-of-limits (OOL) alarm and expert-rule methods are widely used in engineering practice because they are simple and interpretable [2]. However, their dependence on historical experience, high manual-analysis burden, and limited ability to update rule bases as spacecraft operational states change have restricted their use in health assessment [3,4]. Data-driven health-state baseline modeling has therefore attracted increasing attention [5,6,7,8]. These methods use the mathematical relationships in historical telemetry to learn healthy operating patterns through machine-learning and deep-learning techniques, and compare the resulting baseline with current telemetry for system health assessment. In this context, health-state baseline modeling establishes a reference of nominal operation, while anomaly detection evaluates deviations from this reference.
Among data-driven approaches, deep-learning-based health-state baseline models have shown higher accuracy and better generalization [9,10,11]. These methods learn the temporal evolution and characteristics of nominal operation from historical healthy telemetry and use prediction values, reconstructions, or latent representations to quantify deviations from the health baseline. Researchers at the Jet Propulsion Laboratory of the National Aeronautics and Space Administration (NASA) used a Long Short-Term Memory (LSTM) network to predict spacecraft telemetry and identified anomalous states through nonparametric dynamic thresholding of prediction errors [12], and the European Space Agency (ESA) later included this approach in its anomaly-detection benchmark [13]. NASA’s data science group proposed a variational autoencoder (VAE)-based model that learns the distribution of nominal operation in latent space and detects state deviations from reconstruction errors [14]. Yan et al. [15] combined K-means clustering with a variational encoder to model the probability distribution of healthy telemetry under different operating modes. Jiang et al. [16] combined a Transformer with LSTM to model global variation patterns and local temporal dependencies, while Zhao et al. [17] proposed the Seasonal Decomposition Cross-Attention Transformer (SDCA-Former) for non-stationary satellite telemetry. The Korea Aerospace Research Institute (KARI) combined multivariate convolutional LSTM with mixtures of probabilistic principal component analysis (PCA) for spacecraft telemetry state monitoring [18], and Liu et al. [9] used temporal convolution and dynamic graph attention to model dependencies among variables and across time.
Despite recent progress, telemetry-based health-state baseline modeling still faces two practical difficulties. First, normal variations caused by operating-condition adjustments, short-term disturbances, or measurement noise may produce transient output errors and lead to false state-deviation responses [19]. Second, when an off-nominal pattern persists for a relatively long period or occupies most of an input window, a model with strong fitting capability may still predict or reconstruct it accurately, weakening the distinction between the current state and the health-state baseline [20]. Memory-augmented reconstruction can partly constrain the model toward representative nominal patterns; however, when memory mainly serves reconstruction, state assessment can still depend largely on output errors. Therefore, health-state baseline modeling requires not only representative healthy patterns for constrained reconstruction, but also an explicit evaluation of whether the current telemetry remains consistent with the learned healthy reference.
To address these problems, we propose the Health Prototype Memory Transformer (HPM-Former). The model combines Transformer-based temporal modeling with convolutional feature extraction, while the health-state prototype memory learns representative healthy operating patterns in latent space. Unlike using memory only as a reconstruction aid, HPM-Former treats the learned health prototypes as an explicit reference space for the current operating state: sparse prototype addressing constrains reconstruction toward representative healthy patterns, and prototype matching, query–memory discrepancy, and memory-addressing uncertainty are further used to characterize health consistency. Reconstruction deviation and health-consistency deviation are then jointly evaluated so that isolated residual excursions caused by local disturbances do not directly determine the final state assessment. During training, generic state-deviation references are generated only from nominal training telemetry to help define the health-state boundary; no real anomaly labels, fault samples, or test anomaly information are used for model training.
The main contributions of this study are summarized as follows: (1) a health-state prototype memory is introduced to learn representative healthy operating patterns and establish an explicit health-state reference space. Sparse prototype addressing constrains reconstruction toward the learned healthy patterns, helping preserve the distinction from persistent state deviations that may otherwise be fitted well by conventional reconstruction models; (2) a health-consistency deviation is constructed from the relationship between the current state and the learned health prototypes and is jointly evaluated with reconstruction deviation. This complementary decision mechanism reduces false state-deviation responses caused by local noise and short-term disturbances while retaining sensitivity to persistent departures from the health-state baseline. Experiments on ESA’s public satellite telemetry demonstrate the effectiveness of the proposed approach against statistical, reconstruction-based, prediction-based, and recent deep time-series comparison methods.
2. HPM-Former Model
2.1. Overall Architecture of HPM-Former
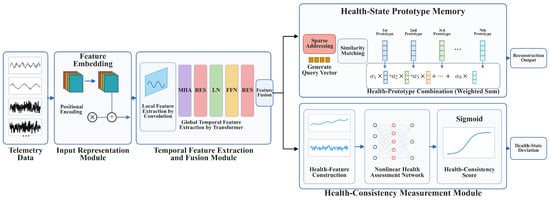
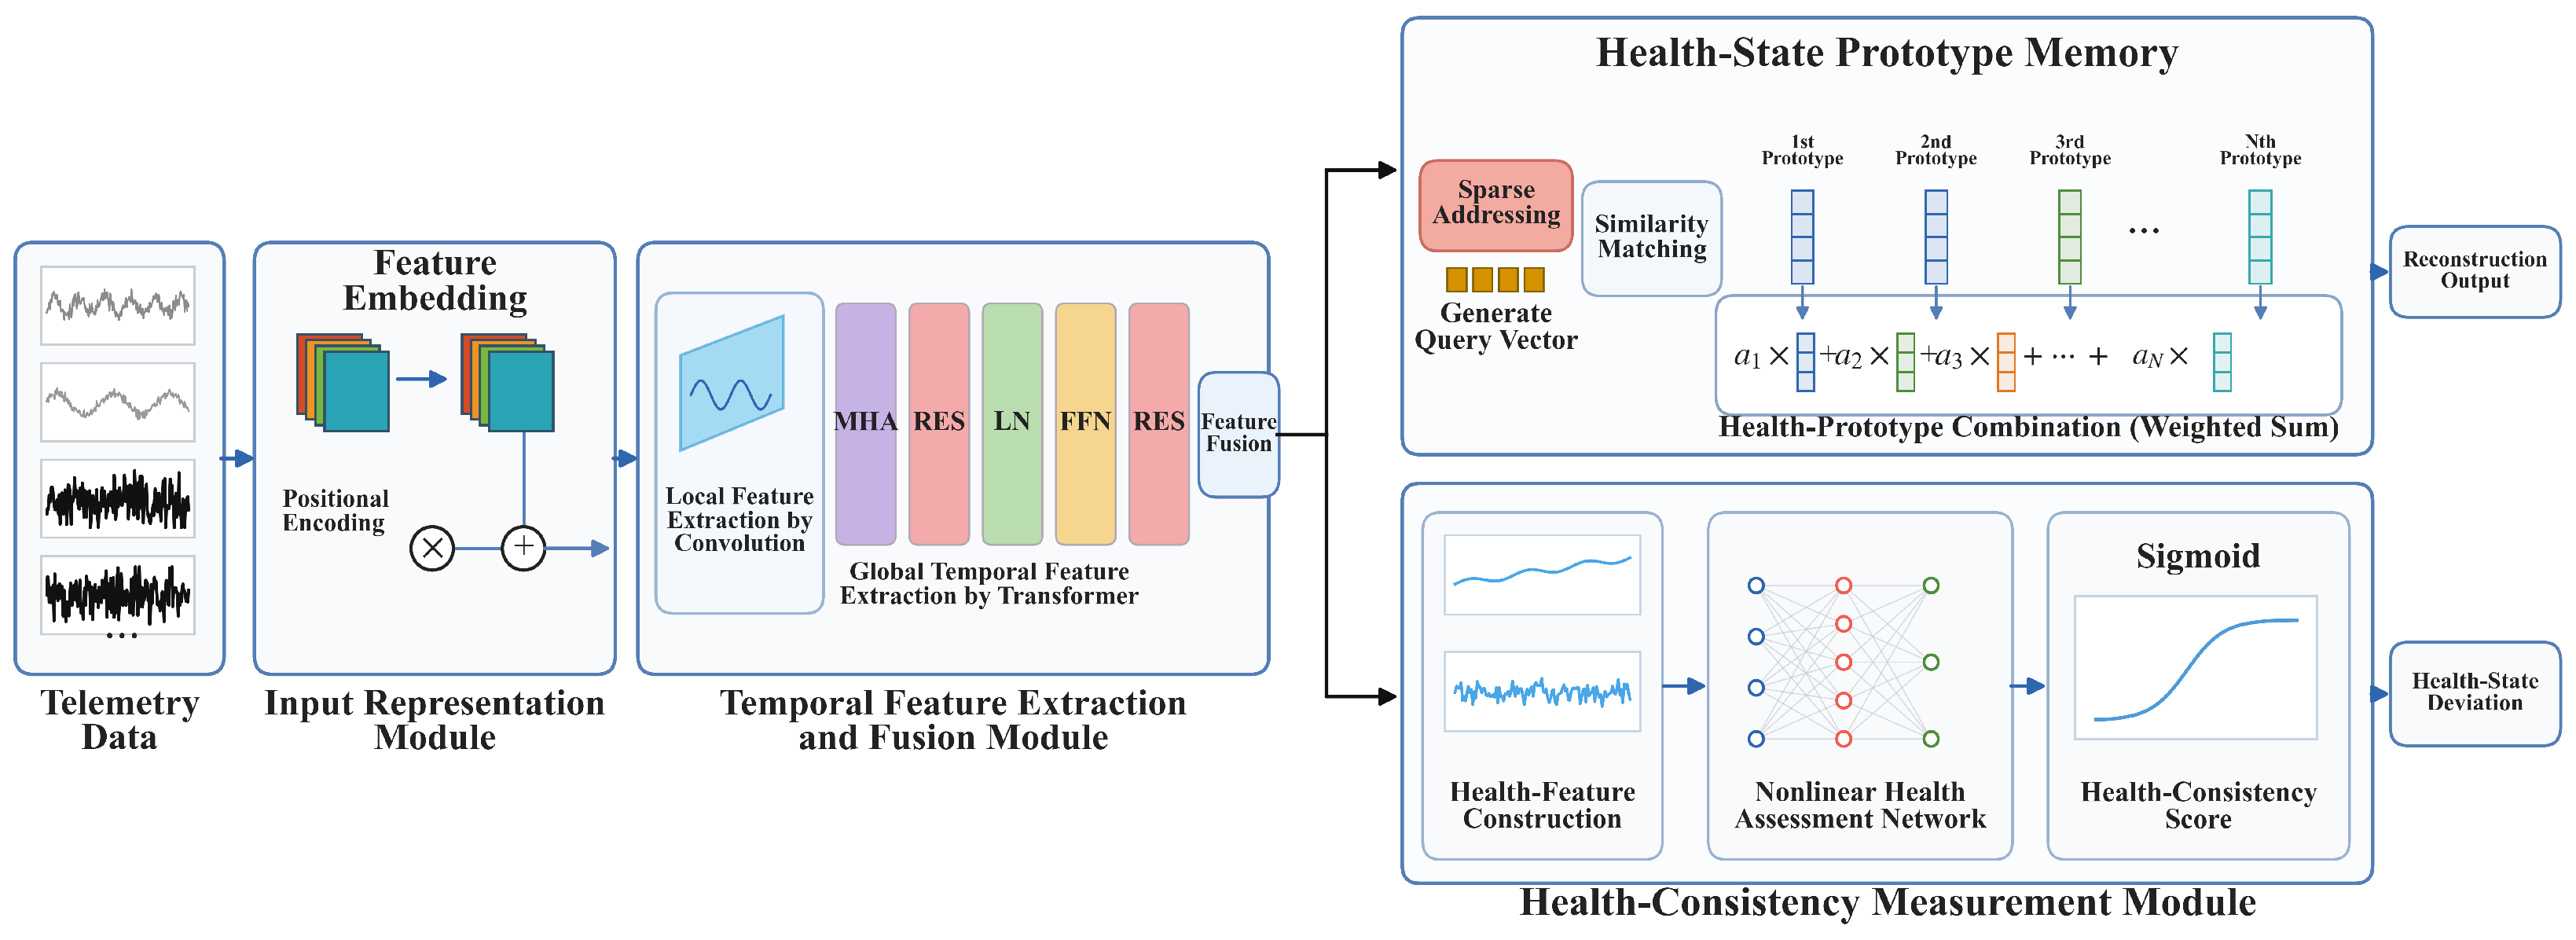
The overall architecture of HPM-Former is shown in Figure 1. It consists of an input-representation module, a temporal feature-extraction module, a health-state prototype memory module, a reconstruction-output module, and a health-consistency evaluation module. First, the input telemetry sequence is transformed by feature embedding and positional encoding into a sequence representation that preserves temporal order. The representation is then passed to a fused feature extractor composed of a Transformer temporal-modeling unit and a convolutional local-feature extractor. The Transformer learns global temporal dependencies and trend evolution in the telemetry sequence, while the convolutional structure captures short-term fluctuations and local changes. Together, they produce a latent representation of the telemetry state.
Figure 1.
Overall framework and information flow of HPM-Former. MHA, multi-head attention; RES, residual connection; LN, layer normalization; FFN, feed-forward network.
From the latent representation, the model generates a query vector and matches it against learnable health prototypes in the health-state prototype memory. Sparse addressing produces prototype-access weights, and the health prototypes most relevant to the current telemetry state are selected and combined to form a memory-augmented representation. This representation is passed to the reconstruction-output module to generate the reconstructed telemetry sequence. In parallel, the model constructs a health-consistency measure from the input sequence and its latent representation to assess how closely the current telemetry state matches nominal operating patterns. HPM-Former therefore outputs both the reconstructed telemetry and the health-consistency measure, providing complementary reconstruction-error and state-consistency evidence for subsequent health-state deviation assessment.
During training, sustained-offset samples are generated from the original telemetry training data as references outside the health-state boundary. Specifically, channels and continuous segments are randomly selected from healthy telemetry windows. A fixed offset matched to the normal fluctuation scale of the selected channel is then added to simulate a persistent state deviation. This enables the model to learn healthy operating patterns while defining the valid range of the health-state baseline.
2.2. Telemetry Input Representation
Spacecraft telemetry typically consists of multiple continuously sampled physical quantities. Different telemetry channels can differ substantially in units, value ranges, variation rates, and noise levels. For a given multivariate telemetry window, the model must represent the multichannel state at each sampling instant while preserving temporal order. HPM-Former therefore first applies a temporal representation module that maps the raw telemetry window to a common-dimensional latent sequence representation and adds positional encoding to retain temporal-location information within the window.
Let the input telemetry window be , where T is the window length, C is the number of telemetry channels, and is the multichannel telemetry observation at sampling instant t. To map observations from different channels into a common feature space, a linear embedding layer is applied to the telemetry vector at each time step:
where is the input embedding matrix, is the bias term, d is the latent feature dimension, and is the embedding at time step t. Arranging the embeddings in temporal order gives . This operation maps the original C-dimensional channel vector at each time step to a d-dimensional representation, allowing the convolution, attention, and memory modules to operate in a unified latent space.
The embedded representation E mainly describes the multivariate state at each time step but does not explicitly encode its temporal position within the window. Because telemetry health states usually evolve over time, the model further introduces learnable positional encoding. The positional-encoding matrix is defined as:
where denotes the positional vector at time step t. Unlike fixed sinusoidal positional encoding, the positional vectors are trainable model parameters and can adapt to the telemetry-window modeling task. The input embedding and positional encoding are added element-wise to obtain the output of the temporal representation module, . This representation incorporates temporal-position information and provides a common input to subsequent feature extraction and fusion.
2.3. Temporal Feature Extraction and Fusion
After the latent representation is obtained, the model extracts deeper features that characterize changes in the telemetry state. Spacecraft telemetry states exhibit different variation characteristics across multiple time scales. Local fluctuations over short periods reflect the transient responses of telemetry parameters, whereas long-term trends represent state evolution and contextual relationships. Based on this characteristic, HPM-Former fuses local convolutional features with global temporal features extracted by the Transformer. It therefore forms an operational-state representation that captures both local variations and overall evolution within the same latent space.
2.3.1. Local Feature Extraction by Convolution
The convolutional local-feature extractor captures short-term variation patterns between adjacent temporal positions. A one-dimensional convolution slides along the time axis and aggregates local-neighborhood information without disrupting temporal order. As a result, the latent representation at each time step contains variation features from both the current and neighboring time steps.
The model uses two one-dimensional convolutional layers, each followed by a Gaussian Error Linear Unit (GELU) activation. The computation is given by:
where denote the outputs of the first and second convolutional layers, respectively. The GELU activation introduces nonlinear representation capability and is defined as , where is the cumulative distribution function of the standard normal distribution. Compared with hard-threshold activation functions, GELU is smoother around zero and better preserves the influence of small state variations on subsequent feature extraction. Early health-state deviation in spacecraft telemetry may not appear as a large limit violation; instead, it can manifest as a small but persistent change. The smooth activation therefore helps preserve subtle local variations that carry state information. Through the two convolutional layers, the initial temporal representation is transformed into the local temporal feature , which provides a locally enriched input to subsequent Transformer-based temporal modeling.
2.3.2. Transformer-Based Temporal Modeling
Convolutional features are mainly based on local neighborhoods and cannot fully describe the overall correlation between different temporal positions within the current window. Based on the local temporal feature , this paper introduces the Transformer temporal modeling unit. Through the self-attention mechanism, it calculates the correlation between time positions within the window, reorganizes these local features, and enables the model to highlight the time positions and key change information that contribute more to the representation of the current state, forming an overall correlation of trend-enhanced features .
The Transformer temporal-modeling unit consists mainly of multi-head self-attention (MHA), layer normalization (LN), residual connections (RES), and a feed-forward network (FFN). HPM-Former uses a pre-layer-normalization (Pre-LN) architecture, in which layer normalization is applied before the multi-head self-attention and feed-forward sublayers. This improves the scale stability of features entering each sublayer. The input features are first normalized to reduce scale differences among latent features at different temporal positions, yielding the normalized temporal representation Z. Z is then projected into the query matrix Q, key matrix K, and value matrix V.
, , and are the corresponding linear-projection parameters. Q and K are used to compute correlations among temporal positions, while V contains the temporal features to be aggregated. The attention output is defined as:
where is the feature dimension of a single attention head. Each temporal position can thus aggregate information from other positions according to their relevance. Unlike convolution, which mainly depends on local neighborhoods, self-attention directly connects arbitrary positions in the sequence and is therefore well suited to modeling global relationships and complex temporal dependencies in telemetry.
Multi-head self-attention further extracts temporal relationships from different feature subspaces. The outputs of all attention heads are concatenated and linearly transformed to obtain the multi-head attention output:
where h is the number of attention heads and is the output projection matrix. Concatenating and transforming the heads allows the model to integrate relationships learned in different subspaces and obtain the multi-head attention feature A. The attention output is then added to the input through a residual connection. This preserves the original local temporal features and reduces the risk of losing convolution-derived local variations during the attention transformation. Dropout is used to reduce over-reliance on specific transformed features and improve robustness. A feed-forward network then performs a nonlinear transformation at each temporal position. With the residual connection, the Transformer unit outputs . This representation integrates global sequence relationships and complex temporal context while retaining the local variation information contained in .
2.3.3. Gated Residual Fusion
The final temporal latent representation is generated through learnable residual injection of Transformer-derived trend features. is used as the local-trend representation, and serves as a trend-correction term. A learnable gate controls the strength of this correction. Let G be a gating matrix with the same dimensions as , where . The fused representation is:
where is an all-ones matrix of size , ⊙ denotes element-wise multiplication, and is a learnable scalar gating coefficient. At the beginning of training, can be initialized to a small value so that the model first retains the stable convolutional representation. As training proceeds, adapts to the optimization objective and determines the contribution of Transformer-derived temporal information to the final latent representation.
2.4. Health-State Prototype Memory
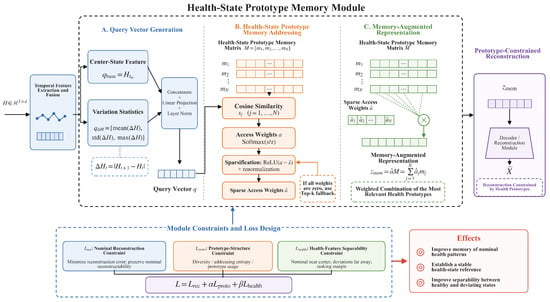
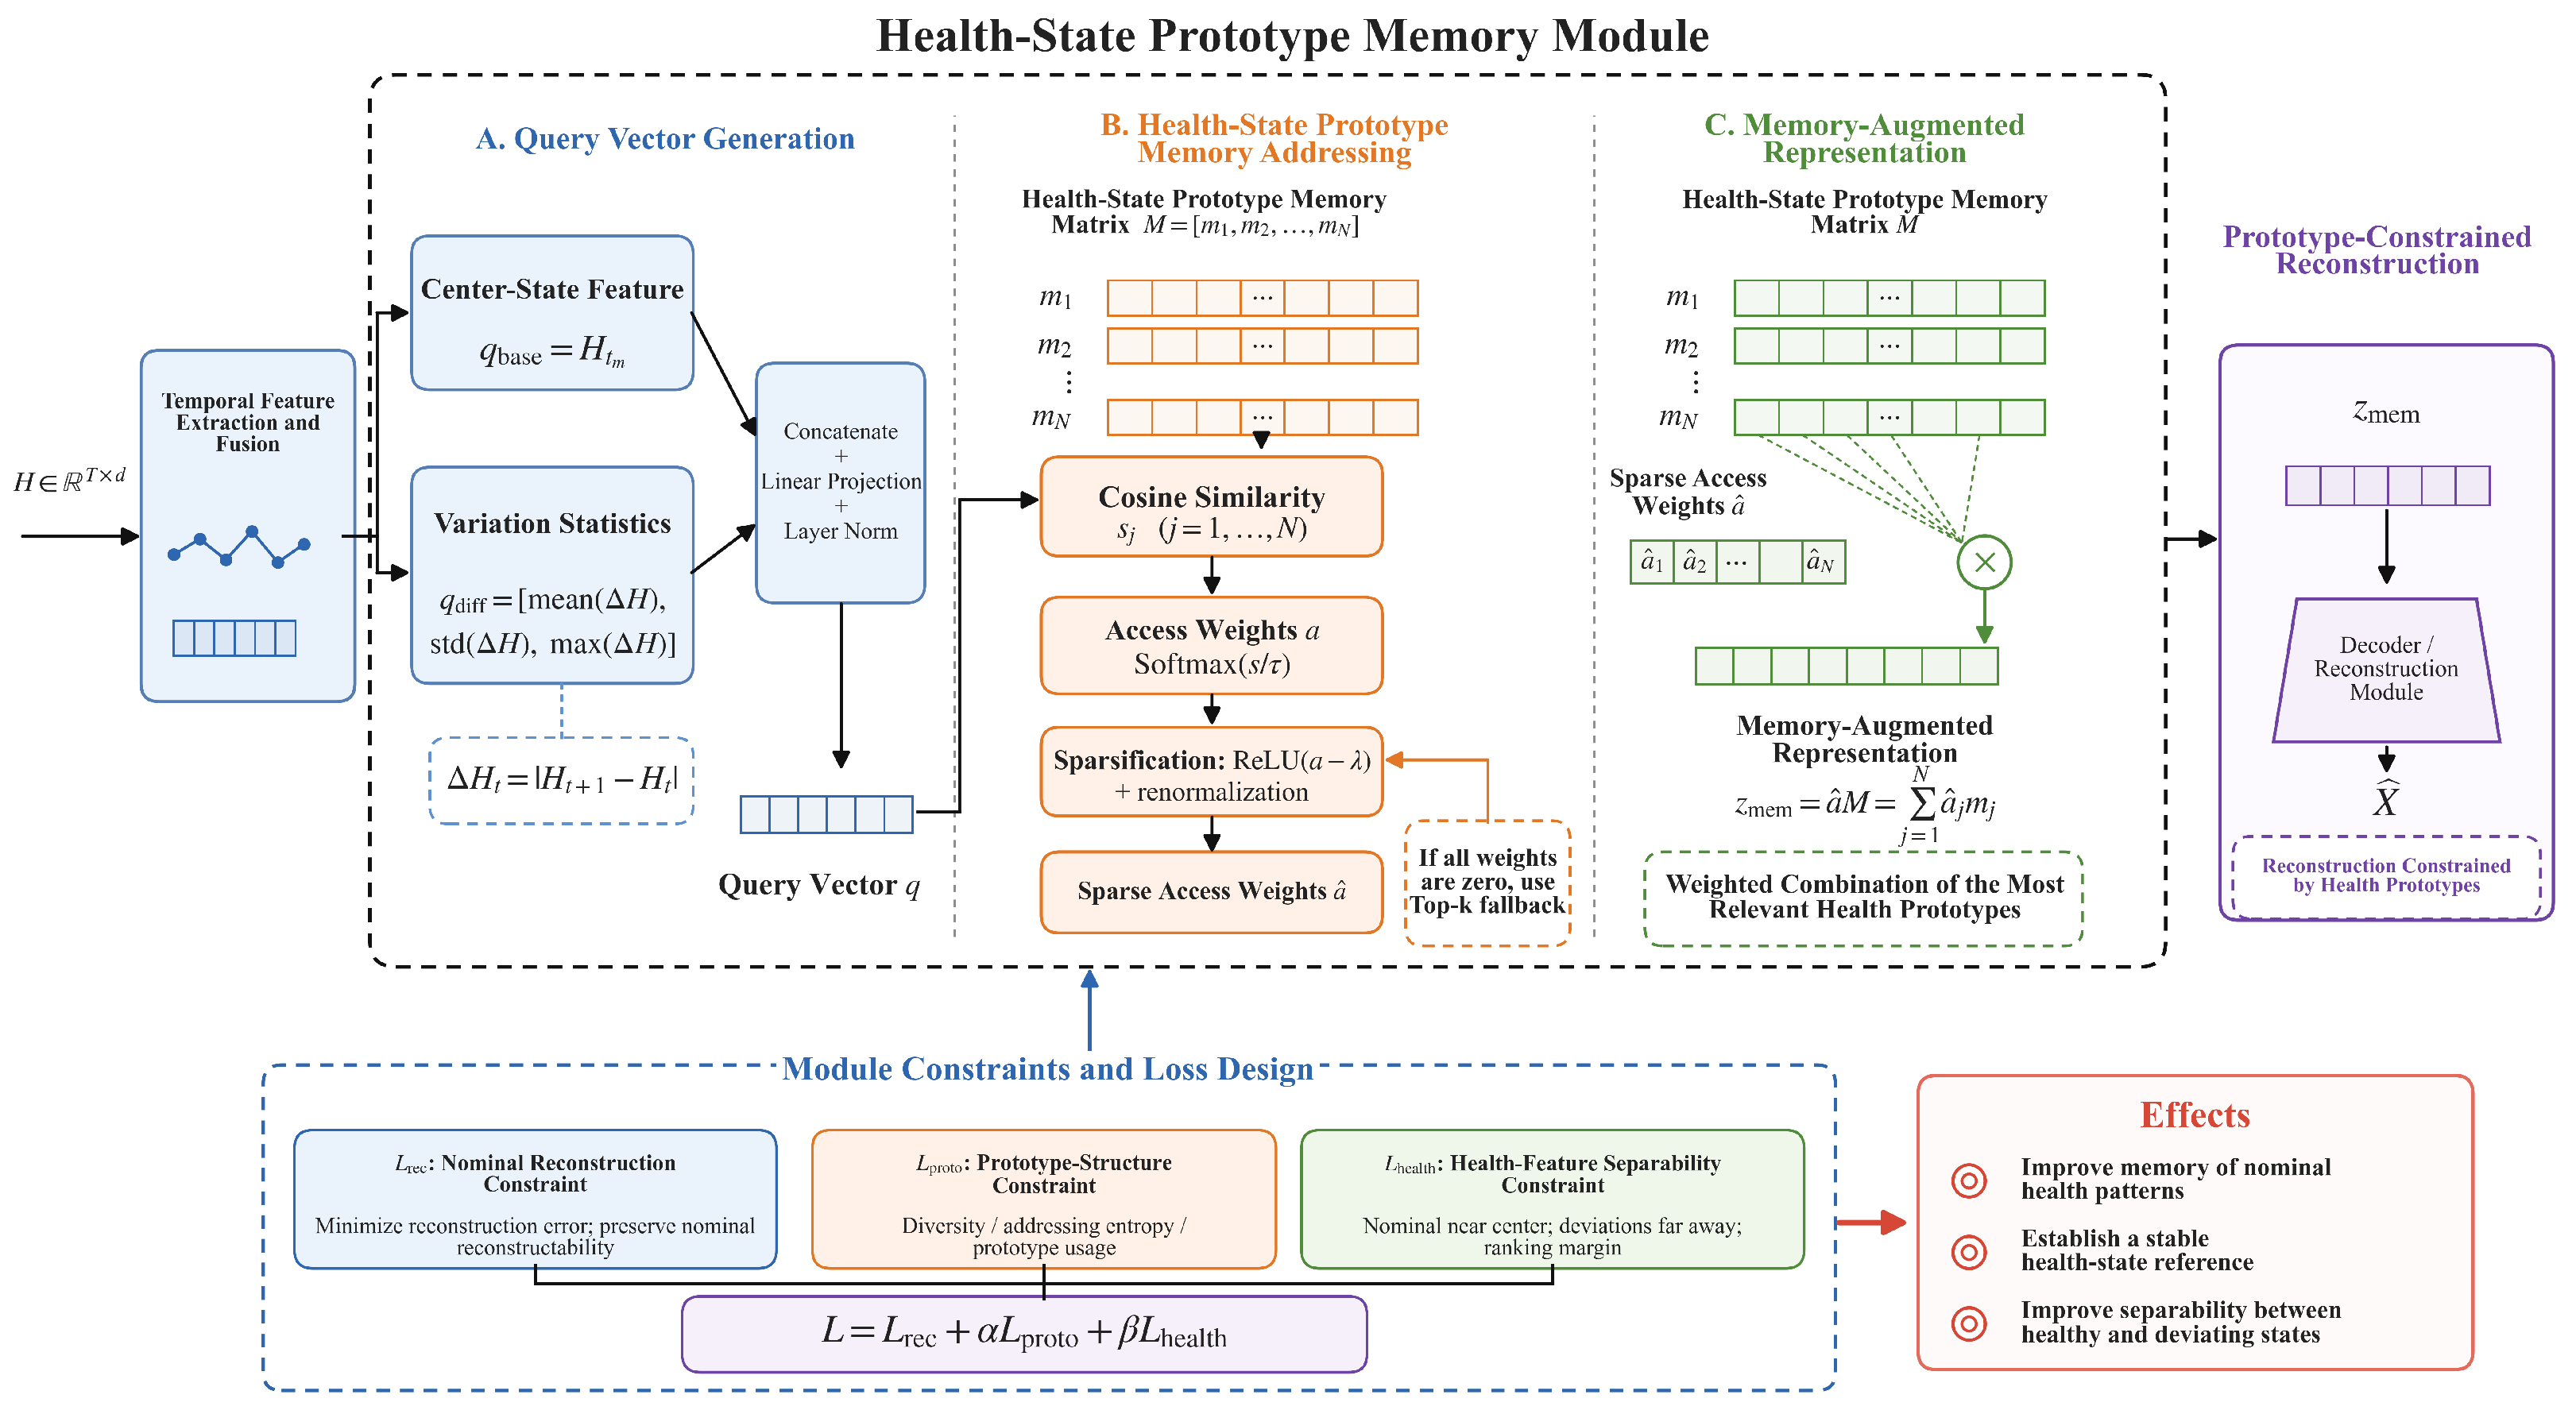
After the temporal feature-extraction and fusion module produces H, a health-state prototype memory module is introduced to store and retrieve representative health-state patterns in latent space. Healthy spacecraft operation is rarely represented by a single fixed pattern; instead, it includes multiple typical operating modes. If reconstruction relies only on the current window’s latent representation, the model may generalize strongly to locally off-nominal segments, reducing the reconstruction contrast between healthy and off-nominal states. We therefore introduce a health-state prototype memory matrix in latent space and represent healthy operating patterns as a set of addressable prototypes. Similarity matching and sparse combination generate a memory-augmented representation that constrains subsequent reconstruction, thereby improving separability between healthy and off-nominal states, as shown in Figure 2.
Figure 2.
Health-state prototype memory workflow.
The core of the health-state prototype memory is a learnable matrix . N denotes the number of health prototypes, and the j-th row of M is denoted by , representing the j-th health-state prototype. The memory matrix M is randomly initialized at the beginning of training. It is jointly optimized with the other model parameters. During training, nominal telemetry windows are mapped into the latent space and used to update the corresponding memory items. The reconstruction objective drives these memory items to retain representative characteristics of normal spacecraft operating states. As a result, the memory matrix gradually forms a set of health-state prototypes covering different nominal operating modes. Instead of reconstructing directly from the input-window representation, the model first generates a query vector for the current window, uses the query to address the health-state prototype memory, and then combines the selected prototypes by weighted summation to obtain a memory-augmented representation.
2.4.1. Query Vector Generation
Memory addressing requires a sample-level query vector that summarizes the overall state of the current telemetry window. We construct the query from both the window-center state and latent-space variation statistics. The latent feature at the center of the window represents its dominant state, while statistics of differences between adjacent time steps capture the strength of within-window changes. Let the center position be , with , and define the base-state vector as . To characterize within-window variation, the latent difference between adjacent temporal positions is computed as . Statistical pooling is then applied to to obtain the variation-statistics vector:
where mean, std, and max denote the mean, standard deviation, and maximum value statistics, respectively, and perform global statistics on both the time dimension and the latent space feature dimension. represents the center state of the current window, whereas characterizes the magnitude of within-window variation. They describe the latent state of the telemetry window from complementary perspectives. The two vectors are concatenated, linearly projected, and layer-normalized to obtain the query vector for memory addressing:
where and are the query-projection parameters, denotes layer normalization, and is the query vector for the current telemetry window. Because the query combines the center state with latent variation statistics, it more effectively represents how the current window should be matched in the health-state prototype space.
2.4.2. Health-State Prototype Memory Addressing
Given the query vector q, the model evaluates the match between the current telemetry window and each health prototype in memory matrix M. Because q and all prototypes lie in the same latent space, cosine similarity is used to measure their proximity. The similarity to the j-th prototype is defined as:
where denotes the similarity between query q and health prototype , and is the ℓ2 norm. The similarities for all prototypes form the vector . To convert similarity values into access weights for prototype retrieval, temperature scaling and Softmax are applied:
where is the temperature coefficient and is the vector of prototype-access weights. A larger indicates that the j-th health prototype is more relevant to the current window and therefore receives a higher weight during memory retrieval.
The access weights obtained solely using Softmax are typically dense, with multiple prototypes participating in the representation with relatively small weights. In a health-state prototype memory, an overly dense combination can reduce prototype selectivity and allow the current window to be explained by too many prototypes. To improve the discriminative capability of memory addressing, the access weights are sparsified. Small weights are suppressed to zero or near zero, leaving only the most relevant prototypes. The sparsification operation is:
where is the sparsity threshold and denotes the threshold-shrunk access weights. ReLU sets weights below to zero and retains only values above the threshold. The nonzero weights are then normalized:
is the sparse access weight for the j-th prototype. If threshold shrinkage removes all valid prototypes, a Top-k fallback strategy retains the k largest Softmax weights to ensure stable memory retrieval. This sparse addressing mechanism allows the model to prioritize a small set of health prototypes most relevant to the current state rather than averaging over the entire memory matrix.
After the sparse access weights are obtained, the model performs a weighted read from the health-state prototype memory matrix M to generate the memory-augmented representation:
Because has large values only for a small number of relevant prototypes, is mainly composed of health prototypes close to the current telemetry state. Thus, before entering the reconstruction-output module, the latent state of the input window is mapped into the representation space spanned by the health-state prototype memory. For a window consistent with nominal operation, the query can find nearby health prototypes and preserve its state characteristics well. For a window that deviates from nominal patterns, the query is difficult to represent adequately with a small number of health prototypes, so the subsequent reconstruction is more likely to differ from the original input. The resulting memory representation is .
2.5. Reconstruction Output and Health-Consistency Evaluation
2.5.1. Prototype-Constrained Reconstruction
After the memory-augmented representation is obtained, a decoder maps it back to the original telemetry-sequence space to generate the reconstruction. Because is a sample-level latent vector and does not directly correspond to a telemetry sequence of length T, the decoder first maps it to an initial reconstruction feature . is then repeated T times along the temporal dimension and combined with decoder positional encoding to obtain a length-T latent reconstruction sequence . Two one-dimensional convolutional layers unfold and locally reorganize the sequence features, producing the decoder feature . Finally, a linear output layer maps the latent features back to the original telemetry-parameter space:
where denotes the reconstructed telemetry window generated by the decoder, and and are the output-layer parameters. Because the decoder input is a sparse combination of health-state prototypes, the reconstruction is constrained by the learned health-prototype representation. When the input window follows nominal operating patterns, provides an effective healthy-state representation and the decoder can reconstruct the original input closely. When the input contains structures that deviate from the health pattern, cannot fully represent those structures and the reconstruction error increases. The prototype-based representation used by the decoder remains . For an original input window X, the point-wise reconstruction error is therefore defined as:
2.5.2. Modeling the Health-Consistency Deviation
Using reconstruction error alone to measure the difference between the current state and the health-state baseline is susceptible to local noise and short-term disturbances. It is also difficult to use reconstruction error to represent smooth state deviations continuously. To address this limitation, a health-consistency deviation is constructed from the health-state prototype memory. It evaluates the consistency between the current window and representative healthy operating patterns according to their matching relationships in the latent space.
If the current window is nominal, its query vector usually forms a stable match with the health prototypes and the difference between q and remains small. If the window deviates from a healthy state, prototype matching may weaken, memory-addressing uncertainty may increase, or the difference between the query and memory representation may become larger. Based on these observations, we construct features describing memory-matching deviation and addressing uncertainty.
The memory-residual feature is ; the degree of prototype mismatch is ; and the dispersion of memory-addressing weights is characterized by the attention entropy . These features are defined as follows:
The health-consistency feature vector of the current window is therefore:
To avoid excessive sensitivity of a single memory-feature threshold to complex nominal conditions, the statistical distribution parameters of the health-consistency features are estimated using nominal training windows. Specifically, let the set of health-consistency features extracted from the nominal training set be: , where denotes the number of nominal training windows. The mean vector and covariance matrix are then defined as:
To improve numerical stability when inverting the covariance matrix, a diagonal regularization term is added:
A diagonal regularization term with is added to the covariance matrix.
The health-consistency deviation of the current window is finally defined as the squared Mahalanobis distance of the health-consistency feature from the nominal healthy distribution:
where . A small indicates that the memory-matching relationship of the current window is close to that of nominal healthy windows. A large indicates deviation from the nominal distribution in health-prototype matching or memory-addressing uncertainty and therefore a higher likelihood of an abnormal health state. This modeling approach complements reconstruction deviation by evaluating the consistency of healthy patterns in the latent space. It provides a basis for quantitatively assessing the current state against the health-state baseline.
2.5.3. Joint Assessment of Reconstruction Deviation and Health Consistency
The reconstruction output module and the health-consistency deviation characterize observation-level deviations and latent-space deviations from healthy patterns, respectively. The two continuous quantities are jointly calibrated to produce a comprehensive assessment of the current window against the health-state baseline. Because telemetry channels differ in their measurement scales and normal fluctuation ranges, the reconstruction residual of each channel is first calibrated using the healthy validation set. Let the reconstruction-residual threshold of channel j be . The normalized reconstruction residual is:
To emphasize meaningful channel deviations within a window while reducing the influence of extreme values at isolated samples, we first take the maximum normalized residual across channels at each time step and then compute a high-quantile statistic over the window. The resulting window-level reconstruction-deviation score is:
where denotes the 95th percentile. If , the window contains a reconstruction deviation beyond the residual range observed in the nominal validation set.
The health-consistency deviation , computed as a squared Mahalanobis distance from the nominal health distribution, is a continuous deviation score. A health-deviation threshold is set to the 99.5th percentile of the values obtained from the nominal validation set, yielding the normalized health-deviation score:
The corresponding reconstruction-deviation decision, health-consistency decision, and final joint decision are:
where is the indicator function, equal to 1 when the condition is satisfied and 0 otherwise.
2.5.4. Module Constraints and Loss Design
The primary objective of the health-state prototype memory module is to learn representative and discriminative health-state prototypes in memory matrix M, so that the reconstruction process preferentially relies on these prototypes for state representation. To achieve this objective, the module is trained with the following constraints.
(1) Nominal reconstruction constraint. Healthy telemetry windows should be reconstructed accurately after prototype addressing and memory augmentation. This encourages the health-state prototypes to cover the main patterns of nominal operation and ensures that retains sufficient health-state information. (2) Prototype-structure constraint. Prototype diversity, memory-addressing entropy, and prototype-usage constraints are used to prevent excessive similarity among prototypes, over-concentration of access weights, and long-term inactivity of some prototypes. These constraints promote a stable and well-dispersed health-state representation in the memory matrix. (3) Health-feature separability constraint. Because the health-consistency deviation is computed from the Mahalanobis distance of memory-matching features from the nominal health distribution, the deviation score is not directly supervised as a binary probability during training. Instead, the underlying memory-feature space is constrained. Memory features of nominal windows are pulled toward the health-feature center, while those of off-nominal windows are pushed away. A ranking constraint further increases the separation between nominal and off-nominal windows in memory-feature space, improving the discriminative capability of the subsequent Mahalanobis-distance-based health-consistency deviation.
Combining these constraints, the overall training loss is:
where is the nominal reconstruction constraint, which ensures that healthy telemetry windows can be accurately reconstructed through the health-prototype memory; is the prototype-structure constraint, which improves prototype discrimination and regularizes memory addressing and prototype usage; is the health-feature separability constraint, which increases the distance between nominal and off-nominal windows in memory-feature space and improves the discriminative capability of the health-consistency deviation; and and are the corresponding weighting coefficients. With these constraints, the model jointly learns reconstructable nominal patterns, a stable health-prototype structure, and feature-level separation between healthy and off-nominal states, thereby improving the identification of telemetry health-state deviations.
3. Experimental Validation, Results and Discussion
3.1. Experimental Setup
- (1)
- Dataset
Experiments are conducted on a public spacecraft telemetry benchmark. Previous studies have reported several limitations of commonly used spacecraft telemetry datasets. The National Aeronautics and Space Administration (NASA) Soil Moisture Active Passive (SMAP) and Mars Science Laboratory (MSL) datasets have been widely used in spacecraft telemetry anomaly detection, but they exhibit several limitations, including unrealistic anomaly densities, annotation inconsistencies, anomaly-position bias, long anomalous intervals, and train–test distribution shifts. Although the European Space Agency (ESA) OPS-SAT benchmark is derived from real spacecraft telemetry, it is mainly organized as short univariate segments. Therefore, the European Space Agency Anomaly Detection Benchmark (ESA-ADB) used in this study is a public benchmark for satellite telemetry anomaly detection. Its data originate from real in-orbit ESA satellite missions and include multivariate telemetry channels and anomaly events. The events were manually annotated by spacecraft operations engineers and machine-learning experts and cross-verified using state-of-the-art algorithms. Compared with the above commonly used benchmarks, ESA-ADB provides real spacecraft telemetry together with an event-oriented evaluation framework, offering a more realistic basis for evaluating health-state baseline modeling and operational-state deviations in spacecraft telemetry. Because ESA-AD is derived from operational satellite missions, mission names, channel semantics, the true timeline, and some mission-related information are anonymized. We therefore use the anonymous channel identifiers provided by the dataset rather than assigning physical names to the selected channels.
In the ESA-ADB benchmark, Channels 41–46 are provided as the lightweight subset for algorithm evaluation. This subset is mainly intended for initial algorithm validation, lightweight models, and potential onboard applications, while still remaining challenging for anomaly-detection algorithms rather than being designed as a simplified evaluation scenario. Therefore, this study follows the official ESA-ADB lightweight-subset setting and selects Channels 41–46 as the primary experimental channels. In addition, Channels 57–60 are further included to examine the stability of HPM-Former on other telemetry channels. Across the telemetry data used in the experiments, the training, validation, and test sets contain 1,030,296, 305,400, and 918,635 samples, respectively. The selected channels retain multivariate temporal relationships while covering telemetry with different operating characteristics, providing a basis for evaluating health-state baseline modeling under realistic spacecraft operating conditions. During model training, no real anomaly labels, fault samples, or anomaly information from the test set are used. The test set is used exclusively for final performance evaluation.
- (2)
- Data Preprocessing
The raw telemetry is irregularly sampled and contains heterogeneous channel types. To remain consistent with the official ESA-AD benchmark procedure and facilitate comparison with ESA baselines such as the ESA-adapted dilated-convolutional variational autoencoder (DC-VAE-ESA) and Telemanom-ESA, we follow the benchmark’s basic preprocessing strategy. The telemetry is time-aligned, standardized by channel, and partitioned into samples.
The Mission 1 telemetry is first resampled to a common 30-s interval. Each telemetry channel is resampled using zero-order hold, which carries the latest known value forward to each new sampling instant. Let the original observation times be and the resampled time points be . Zero-order hold is defined as:
Unlike linear interpolation, zero-order hold does not create artificial intermediate states between two actual samples. It is therefore better suited to state variables, quantized measurements, and discontinuously changing signals commonly found in satellite telemetry.
Each telemetry channel is standardized independently using the mean and standard deviation estimated from nominal training samples. HPM-Former converts the continuous telemetry into overlapping windows of length with stride , and the same window definition is used during validation and testing. TimesNet, iTransformer, and PatchTST use the same input length of 250; their training windows are generated with stride 1, while inference uses stride 25 and overlap-mean aggregation to map reconstructed windows back to the original time axis.
- (3)
- Model Parameter Settings
HPM-Former, Telemanom-ESA, and DC-VAE-STD3/STD5 use TensorFlow 2.5.1. HPM-Former runs in a CUDA-enabled Docker environment, while Telemanom-ESA and DC-VAE-STD3/STD5 are evaluated with their corresponding ESA-ADB Docker implementations. TimesNet, iTransformer, and PatchTST are implemented using the Time-Series-Library anomaly-detection framework in PyTorch 2.1.0 with CUDA 12.1.All experiments are executed on the same workstation equipped with an NVIDIA GeForce RTX 4060 Ti GPU with 8 GB memory and a 12th Gen Intel Core i5-12400F CPU. HPM-Former uses random seed 42, and the Time-Series-Library models use seed 2021. The main HPM-Former parameters are listed in Table 1.
Table 1.
Main hyperparameter settings of HPM-Former.
TimesNet uses , , one encoder layer, and top-; iTransformer uses , , and three encoder layers; PatchTST uses , , two encoder layers, and eight attention heads. All three models are configured as reconstruction-based detectors, minimize mean squared reconstruction error, and use a learning rate of . Their point-level alarms are obtained from the reconstructed sequences using the same ESA-ADB evaluation framework.
3.2. Evaluation Metrics
ESA noted that, for health-state baseline modeling, evaluation should not be limited to whether individual time points are identified as anomalous. It should also examine whether the model can respond effectively to a complete state-deviation process and provide assessment results suitable for engineering analysis. Point-wise metrics alone cannot adequately determine whether a state-deviation event is identified, whether numerous redundant alarms are generated, whether the affected channels are correctly localized, or whether the response timing is appropriate. Therefore, this study adopts the hierarchical evaluation metrics proposed by ESA-ADB to evaluate the effectiveness of the constructed health-state baseline and the resulting state assessment in terms of event identification, false-alarm control, channel localization, alarm redundancy, and anomaly-interval matching.
(1) Corrected event-wise -score. This metric evaluates overall state deviation. Let , , and denote event-wise true positives, false positives, and false negatives, respectively. Let be the duration of normal operation correctly classified as normal and be the total duration of normal operation. Corrected event-wise precision, event-wise recall, and the corrected event-wise -score are defined as:
places more emphasis on precision compared to , making it suitable for scenarios where there are stringent requirements for false positive control.
(2) Channel-aware -score. This metric evaluates whether the model correctly localizes the telemetry channels affected by an anomaly. Let , , and denote channel-level true positives, false positives, and false negatives, respectively. Then:
(3) Event-wise alarming precision. This metric evaluates whether alarms are redundant or invalid and is computed as:
where is the number of valid alarms associated with real anomaly events and is the total number of alarms generated by the model.
(4) Anomaly detection timing quality curve (ADTQC). This metric evaluates the agreement between the detected start time and the true anomaly start time. Let denote the start-time difference for the k-th correctly detected event. Then:
where is the timing-quality function defined by ESA-ADB and is the number of correctly detected anomaly events. This metric measures whether an anomaly is detected within a reasonable time range.
(5) Modified affiliation-based -score. This metric evaluates the affiliation between predicted anomalous intervals and ground-truth anomalous intervals. Let and denote affiliation-based precision and recall, respectively. Then:
3.3. Experimental Results and Discussion
HPM-Former is compared with DC-VAE-STD3/STD5, Global-STD3/STD5, Telemanom-ESA, TimesNet, iTransformer, and PatchTST. These methods cover statistical thresholding, prediction-based modeling, and reconstruction-based modeling. Global-STD constructs fixed statistical boundaries from nominal telemetry; Telemanom-ESA evaluates prediction errors; DC-VAE, TimesNet, iTransformer, and PatchTST evaluate deviations between the input telemetry and their reconstructed sequences. This comparison therefore examines HPM-Former against representative methods with different health-state reference mechanisms.
To make the methodological differences explicit, Table 2 summarizes the main characteristics, advantages, limitations, and suitable applications of the evaluated methods. The two threshold settings of DC-VAE and Global-STD share the same underlying model and differ only in the decision threshold; they are listed separately because this threshold change leads to markedly different operating behavior in the experiments.
Table 2.
Comparison of the characteristics, advantages, limitations, and applications of the evaluated methods.
Table 3 summarizes the quantitative performance of HPM-Former and the comparison methods under the five ESA-ADB evaluation measures. To ensure the reliability of the comparison results, the reproduced results of the ESA-ADB benchmark methods were compared with the official benchmark results. The corrected event-wise scores reported in Supplementary Table S10 of the ESA-ADB benchmark [13] are 0.001, 0.017, and 0.786 for DC-VAE-STD3, DC-VAE-STD5, and Telemanom-ESA, respectively. The corresponding scores obtained in this study are 0.0012, 0.021, and 0.8063. Although slight numerical differences exist, the reproduced results show comparable performance levels to those reported in the ESA-ADB benchmark, supporting the reliability of the baseline implementation and evaluation procedure.
Table 3.
Experimental results.
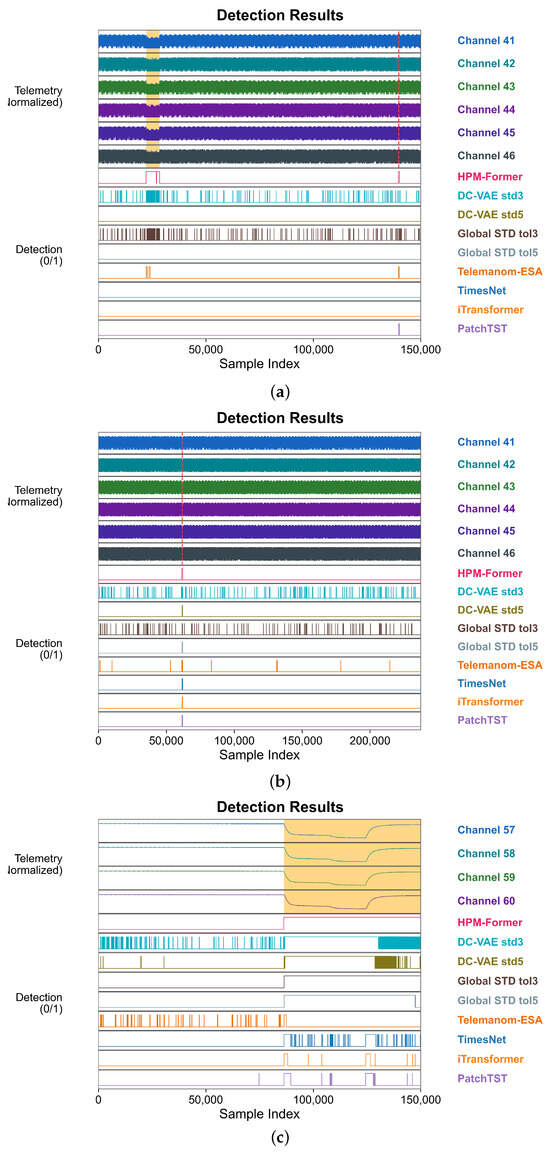
Figure 3 presents representative binary detection results for Channels 41–46 and Channels 57–60. Yellow shaded regions denote ground-truth anomalous intervals, while red dashed markers indicate short anomaly boundaries that are difficult to visualize as shaded intervals.
Figure 3.
Evaluation results of state deviation for different models: (a,b) representative results for Channels 41–46. (c) representative results for Channels 57–60.
As shown in Table 3 and Figure 3, HPM-Former provides the most balanced overall performance. Its alarms are concentrated around the annotated state-deviation intervals and remain stable across different telemetry channels. In contrast, the comparison methods tend to exhibit either scattered responses to local fluctuations or insufficient responses to sustained state changes. The statistical baselines are particularly sensitive to the choice of threshold, while the deep sequence models show that a low output error does not necessarily imply consistency with the nominal health-state baseline.
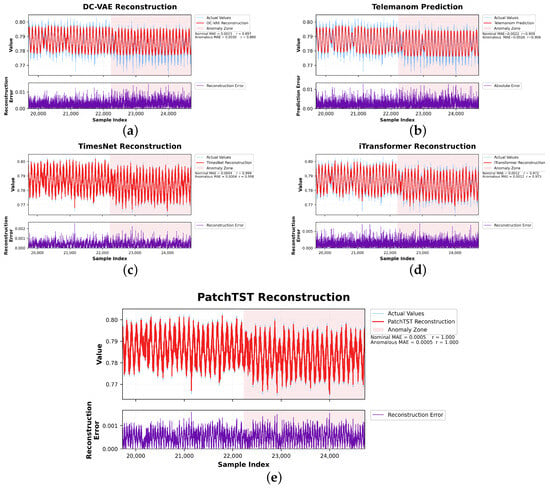
The deep-learning comparison methods exhibit a common limitation when the decision mainly depends on reconstruction or prediction error. Local noise and short-term disturbances can produce transient error increases and fragmented alarms, whereas a persistent state deviation may gradually be fitted by the model, reducing the error contrast between nominal and anomalous states. Figure 4 illustrates this common behavior across DC-VAE, Telemanom, TimesNet, iTransformer, and PatchTST. Their outputs continue to follow the dominant temporal pattern after the state changes, and the reconstruction results of TimesNet, iTransformer, and PatchTST remain close to the observations in both nominal and anomalous intervals. Consequently, when an abnormal pattern occupies a large proportion of an input window, an error-only model may reconstruct the abnormal state well and weaken the distinction from the nominal health-state reference.
Figure 4.
Output comparison of the deep-learning models: (a) reconstruction output of DC-VAE; (b) prediction output of Telemanom. (c) reconstruction output of TimesNet; (d) reconstruction output of iTransformer; (e) reconstruction output of PatchTST.
HPM-Former addresses these two problems through complementary mechanisms. The health-consistency decision prevents isolated reconstruction-error increases caused by noise or short-term disturbances from directly triggering a state-deviation alarm. Meanwhile, the health-state prototype memory constrains reconstruction to representative healthy patterns. When a state deviation persists and occupies most or all of an input window, the decoder therefore reconstructs from the learned healthy prototype space instead of directly reproducing the current abnormal pattern. This preserves the separation between the current telemetry and the health-state baseline even when conventional reconstruction models can fit the abnormal window well.
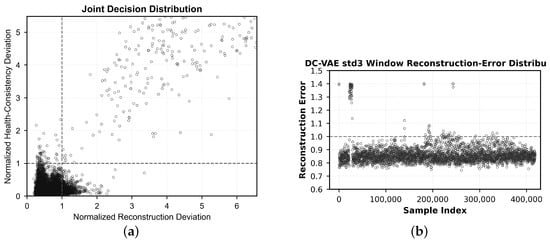
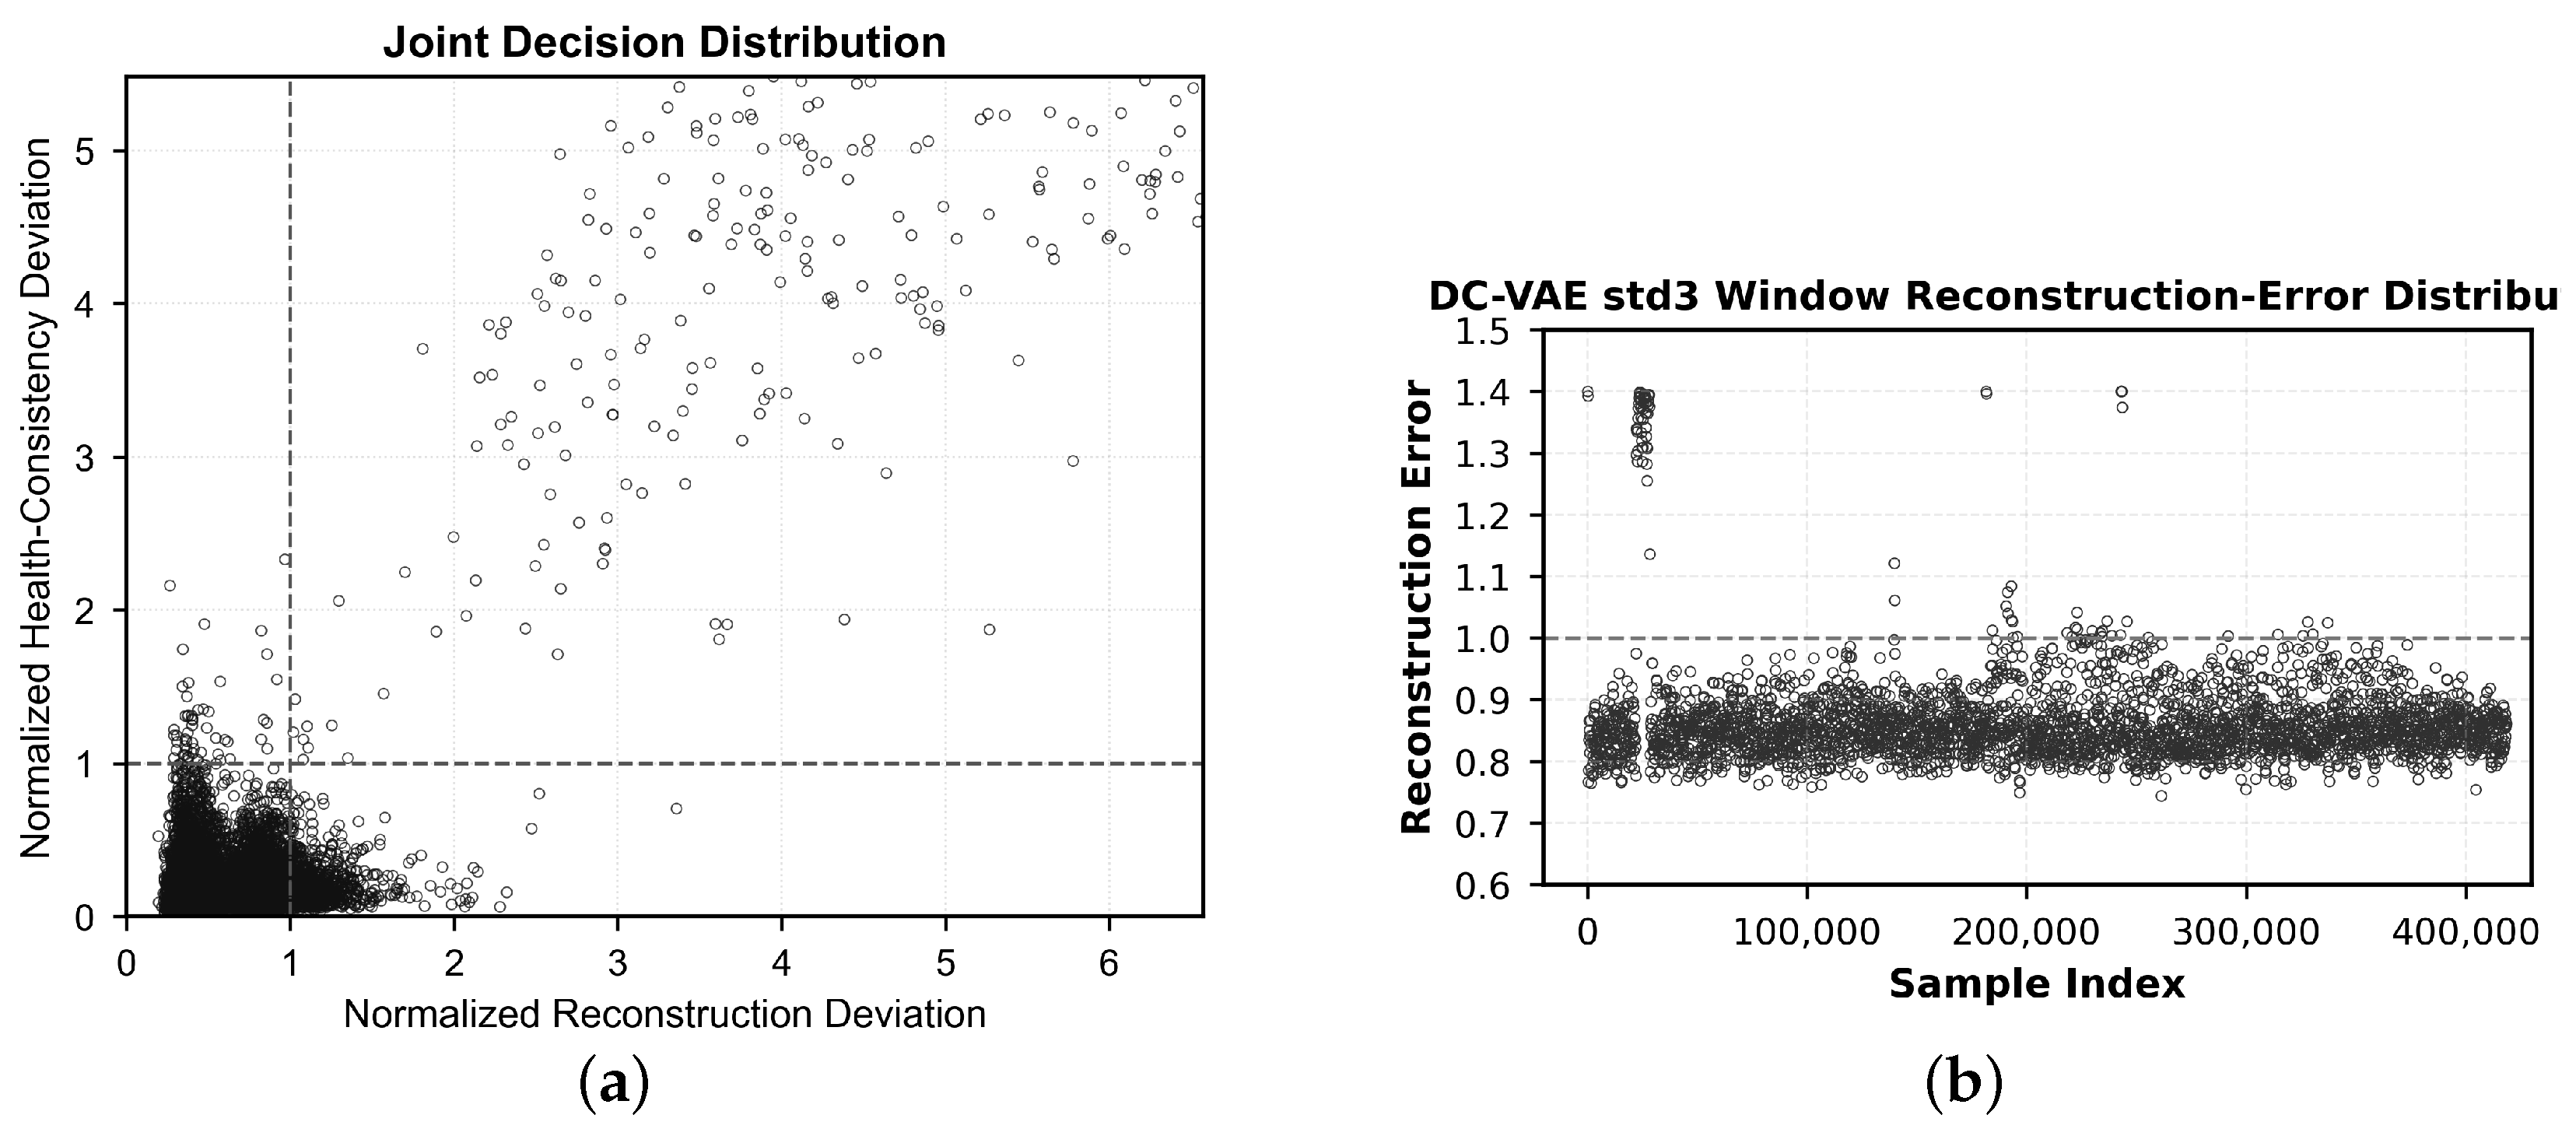
Figure 5 further illustrates the role of the joint decision mechanism. HPM-Former requires reconstruction deviation and health-consistency deviation to exceed their respective reference boundaries simultaneously, so isolated residual excursions do not directly become final alarms. In comparison, an error-only reconstruction baseline is more easily affected by local threshold exceedances caused by short-term fluctuations. This joint assessment improves the stability of state-deviation identification while retaining responses to persistent departures from the health reference.
Figure 5.
Comparison of state-deviation decision distributions across different models: (a) joint decision distribution of HPM-Former; (b) window-level reconstruction-error distribution of DC-VAE-STD3.
For the ADTQC calculation, the detected anomaly start of HPM-Former is determined from the deviation segments exceeding the threshold within the alarm window, and the original ESA-ADB timing-quality function is then applied without modification. The resulting ADTQC is 0.5714.
3.4. Computational Cost and Deployment Considerations
The computational cost of the evaluated methods was assessed under the hardware and software environment described in Section 3.1. Because the neural models are trained offline and use different optimization schedules, validation procedures, and stopping rules, wall-clock training time is not used as a cross-method comparison metric; otherwise, differences in the training protocol would be mixed with differences in model complexity. Instead, Table 4 reports deployment-oriented execution time on the evaluation dataset using fixed trained models, together with the dominant inference complexity and main computational characteristics. For each method, the reported execution time is the mean of three post-warm-up runs measured after model and data preparation, and includes model inference, scoring, thresholding, and final decision generation. Because STD3 and STD5 only change the decision threshold applied to the same model output, their execution costs are reported together.
Table 4.
Computational cost of the evaluated methods on the evaluation dataset.
Here, W denotes the number of input windows, T is the input-window length, C is the number of telemetry channels, d is the model or latent dimension, M is the number of health-state prototypes, is the convolution-kernel size, F is the convolutional feature width of DC-VAE, h is the LSTM hidden-state dimension, is the Telemanom prediction horizon, L is the number of TimesBlock or Transformer encoder layers, is the number of dominant periods retained by TimesNet, is the feed-forward dimension, P is the number of patches per channel, p is the patch length, H is the output length of the PatchTST head, and N is the number of telemetry samples processed by Global-STD. The expressions retain the dominant operations of each architecture; fixed layer counts, head counts, and kernel constants are absorbed into the big-O notation.
For HPM-Former, temporal self-attention contributes the term, while prototype matching and memory readout add operations per window. With and in the present configuration, the prototype matrix contains 8192 floating-point values, corresponding to approximately 32 KiB in float32 representation, excluding framework and optimizer states. In measured execution time, HPM-Former is substantially faster than DC-VAE-STD3/STD5 and Telemanom-ESA, but slower than the statistical baseline and the three lighter sequence-model baselines. This shows that HPM-Former is not the minimum-cost method. However, the effectiveness results in Table 3 show that HPM-Former provides markedly better corrected event-wise, channel-aware, and affiliation-based performance while retaining a lower analysis time than DC-VAE and Telemanom. The additional computation is therefore associated with the prototype-constrained reconstruction and health-consistency evaluation that improve the stability of the health-state reference.
The reported execution times correspond to full-dataset offline batch analysis on the desktop GPU workstation used in this study and should not be interpreted as on-board real-time latency. Training and baseline calibration can be completed offline before deployment. For resource-constrained spacecraft processors, the quadratic self-attention term and the additional prototype-addressing operations remain the main computational considerations; reducing the window length, latent dimension, or number of prototypes, or applying model compression, can lower this cost. Dedicated streaming-latency and memory-footprint tests on space-qualified processors are still required before claiming real-time on-board applicability.
3.5. Ablation Study
To verify the contributions of the health-state prototype memory and health-consistency assessment to baseline modeling, an ablation model without the health-state prototype memory is constructed. This model retains the reconstruction backbone and uses reconstruction deviation alone to produce the state-assessment result; prototype matching and health-consistency evaluation are removed. The ablation results are presented in Table 5.
Table 5.
Ablation study results.
The ablation model obtains an of only 0.0010, substantially lower than the 0.9983 achieved by the complete HPM-Former. Similar to the deep-learning comparison methods discussed above, the ablation model frequently responds to local fluctuations and noise in nominal segments, resulting in a large number of invalid event-level alarms. Its is only 0.0083, indicating poor alarm validity when state assessment relies primarily on reconstruction deviation. These results show that reconstruction deviation alone is highly sensitive to local residual changes and cannot provide sufficiently stable state assessment.
At the interval and channel levels, the ablation model achieves an of 0.6949, below the 0.9458 of the complete model, indicating weaker agreement between the detected intervals and the annotated state-deviation intervals. Its channel-aware is 0.7646, compared with 0.9242 for HPM-Former, showing that affected-channel localization also deteriorates when the prototype reference is removed. The ablation model obtains an ADTQC of 0.7500, higher than the 0.5714 of HPM-Former. However, this timing score is accompanied by very low alarm validity and should therefore not be interpreted in isolation as better overall state assessment.
Overall, removing the health-state prototype memory and health-consistency assessment causes the model to depend primarily on reconstruction deviation for state decisions. The complete HPM-Former instead uses representative health prototypes as a stable reference for nominal operation and evaluates the consistency between the current telemetry state and this reference. The ablation results therefore support the contribution of the prototype-based health reference and health-consistency evaluation to improving the stability and reliability of health-state baseline assessment.
4. Conclusions
This study presents HPM-Former for health-state baseline modeling of spacecraft telemetry. The central idea is to use health-state prototypes not only as a constraint on reconstruction, but also as an explicit reference for evaluating whether the current telemetry remains consistent with representative healthy operating patterns. Sparse prototype addressing restricts reconstruction to the learned health-state space, while the health-consistency deviation provides complementary evidence beyond reconstruction error. This design targets two common limitations of error-based models: transient residual increases caused by noise or short-term disturbances, and over-generalized reconstruction when a persistent off-nominal pattern occupies a large proportion of the input window. By combining reconstruction deviation with health-consistency assessment, HPM-Former establishes a health-state baseline that is less sensitive to local disturbances while retaining discrimination between healthy and persistently deviating states.
Experiments on ESA-ADB demonstrate that these mechanisms lead to consistent gains at the event, channel, and interval levels. HPM-Former achieves , compared with for the strongest comparison method on this metric, while and reach and , exceeding the best comparison results of and , respectively. More importantly, the comparative experiments show that the improvement is not limited to a single evaluation measure: statistical methods remain sensitive to threshold selection, whereas reconstruction- and prediction-based models may either react to local fluctuations or continue fitting persistent state deviations. HPM-Former reduces both effects by retaining a prototype-based healthy reference throughout reconstruction and state assessment. The results therefore support the use of health prototypes as a stable reference for spacecraft telemetry health-state modeling rather than relying solely on output error. Future work will further examine the method under additional spacecraft missions and investigate lightweight and streaming implementations for operational deployment.
Author Contributions
Conceptualization and methodology, G.Z. and S.P.; software, G.Z. and D.W.; validation, G.Z. and S.P.; formal analysis, G.Z.; investigation, S.P. and D.W.; resources, G.Z.; data curation, G.Z.; writing—original draft preparation, G.Z. and D.W.; writing—review and editing, G.Z. and D.W.; visualization, S.P.; supervision, H.Y. All authors have read and agreed to the published version of the manuscript.
Funding
This research was funded by the National Key Research and Development Program of China, grant number 2025YFB3003400.
Data Availability Statement
The ESA Anomalies Dataset (ESA-AD) analyzed in this study is publicly available in the Zenodo repository at https://doi.org/10.5281/zenodo.12528695. No new data were created in this study.
Acknowledgments
The authors would like to thank the project team members and administrative staff involved in the National Key Research and Development Program of China project for their assistance with project coordination and research support. Meanwhile, during the preparation of this manuscript, the authors used ChatGPT 5.6sol for the purposes of reviewing text. The authors have reviewed and edited the output and take full responsibility for the content of this publication.
Conflicts of Interest
The authors declare no conflicts of interest.
Abbreviations
The following abbreviations are used in this manuscript:
| ADTQC | Anomaly Detection Timing Quality Curve |
| DC-VAE | Dilated-Convolutional Variational Autoencoder |
| DC-VAE-ESA | ESA-adapted Dilated-Convolutional Variational Autoencoder |
| ESA | European Space Agency |
| ESA-AD | European Space Agency Anomalies Dataset |
| ESA-ADB | European Space Agency Anomaly Detection Benchmark |
| GELU | Gaussian Error Linear Unit |
| FFN | Feed-Forward Network |
| HPM-Former | Health Prototype Memory Transformer |
| KARI | Korea Aerospace Research Institute |
| LN | Layer Normalization |
| LSTM | Long Short-Term Memory |
| MHA | Multi-Head Attention |
| MSE | Mean Squared Error |
| MSL | Mars Science Laboratory |
| NASA | National Aeronautics and Space Administration |
| OOL | Out-of-Limits |
| PPCA | Probabilistic Principal Component Analysis |
| Pre-LN | Pre-Layer Normalization |
| ReLU | Rectified Linear Unit |
| RES | Residual Connection |
| SDCA-Former | Seasonal Decomposition Cross-Attention Transformer |
| SMAP | Soil Moisture Active Passive |
| STD3 | Three-standard-deviation threshold |
| STD5 | Five-standard-deviation threshold |
| TNR | True Negative Rate |
| VAE | Variational Autoencoder |
References
- Iino, S.; Nomoto, H.; Fukui, T.; Yagisawa, Y.; Ishizawa, S.; Hirose, T.; Michiura, Y. Towards Explainable Anomaly Detection in Safety-Critical Systems: Employing FRAM and SpecTRM in International Space Station Telemetry. Int. J. Progn. Health Manag. 2024, 15, 1–12. [Google Scholar] [CrossRef] [Scilit]
- Fejjari, A.; Delavault, A.; Camilleri, R.; Valentino, G. A Review of Anomaly Detection in Spacecraft Telemetry Data. Appl. Sci. 2025, 15, 5653. [Google Scholar] [CrossRef] [Scilit]
- Ruszczak, B.; Kotowski, K.; Evans, D.; Nalepa, J. The OPS-SAT Benchmark for Detecting Anomalies in Satellite Telemetry. Sci. Data 2025, 12, 710. [Google Scholar] [CrossRef] [Scilit] [PubMed]
- Peng, X.; Pang, J.; Peng, Y.; Liu, D. Review on Anomaly Detection of Spacecraft Telemetry Data. Chin. J. Sci. Instrum. 2016, 37, 1929–1945. (In Chinese) [Google Scholar] [CrossRef]
- Liu, Q.; Li, J.; Wang, Z.; Chen, X. Lightweight Spacecraft Anomaly Detection Based on Telemetry Data Feature Prediction. J. Astronaut. 2025, 46, 232–243. (In Chinese) [Google Scholar] [CrossRef]
- Zhang, J.; Pang, J.; Lu, X.; Song, Y. Feen-LSTM: An Optimized Online Unsupervised Anomaly Detection Method for Multi-Telemetry Parameters. Chin. J. Sci. Instrum. 2025, 46, 247–257. (In Chinese) [Google Scholar] [CrossRef]
- Yash, P.; Gundawar, S.; Kumar, N.; Rajasekaraiah, U.B.; Ganesan, K.P.; Kar, P. Multiforecast-Based Early Anomaly Detection for Spacecraft Health Monitoring. In Proceedings of the 7th Joint International Conference on Data Science and Management of Data (11th ACM IKDD CODS and 29th COMAD), Bengaluru, India, 4–7 January 2024; pp. 275–283. [Google Scholar] [CrossRef] [Scilit]
- Park, K.S.; Yun, S.T. A Data-Driven Battery Degradation Estimation Method for Low-Earth-Orbit (LEO) Satellites. Appl. Sci. 2025, 15, 2182. [Google Scholar] [CrossRef] [Scilit]
- Liu, L.; Tian, L.; Kang, Z.; Wan, T. Spacecraft Anomaly Detection with Attention Temporal Convolution Networks. Neural Comput. Appl. 2023, 35, 9753–9761. [Google Scholar] [CrossRef] [Scilit]
- Zamanzadeh Darban, Z.; Webb, G.I.; Pan, S.; Aggarwal, C.; Salehi, M. Deep Learning for Time Series Anomaly Detection: A Survey. ACM Comput. Surv. 2024, 57, 1–42. [Google Scholar] [CrossRef] [Scilit]
- Lakey, D.; Schlippe, T. A Comparison of Deep Learning Architectures for Spacecraft Anomaly Detection. In Proceedings of the 2024 IEEE Aerospace Conference, Big Sky, MT, USA, 2–9 March 2024; pp. 1–11. [Google Scholar] [CrossRef] [Scilit]
- Hundman, K.; Constantinou, V.; Laporte, C.; Colwell, I.; Soderstrom, T. Detecting Spacecraft Anomalies Using LSTMs and Nonparametric Dynamic Thresholding. In Proceedings of the 24th ACM SIGKDD International Conference on Knowledge Discovery and Data Mining, London, UK, 19–23 August 2018; pp. 387–395. [Google Scholar] [CrossRef] [Scilit]
- Kotowski, K.; Haskamp, C.; Andrzejewski, J.; Ruszczak, B.; Nalepa, J.; Lakey, D.; Collins, P.; Martinez-Heras, J.; De Canio, G. European Space Agency Dataset and Benchmark for Real-World Anomaly Detection in Spacecraft Time Series. 2026. Available online: https://openreview.net/forum?id=bbpRMoatVO (accessed on 14 August 2026).
- Memarzadeh, M.; Matthews, B.; Avrekh, I. Unsupervised Anomaly Detection in Flight Data Using Convolutional Variational Auto-Encoder. Aerospace 2020, 7, 115. [Google Scholar] [CrossRef] [Scilit]
- Yan, G.; Wang, Q.; Liu, Z.; Su, C.; Gao, R. Anomaly Detection in Multidimensional Spacecraft Telemetry via an Integrated K-Means, VAE and SVDD Model. In Proceedings of the 2024 6th International Conference on Electronic Engineering and Informatics (EEI), Chongqing, China, 28–30 June 2024; pp. 445–449. [Google Scholar] [CrossRef] [Scilit]
- Jiang, S.; Jiang, Y.; Wang, Y.; Zhang, X.; Zhang, Z. Anomaly Detection in Spacecraft Telemetry Data Based on Transformer-LSTM. In Proceedings of the 2023 International Conference on Intelligent Communication and Networking (ICN), Changzhou, China, 10–12 November 2023; pp. 271–276. [Google Scholar] [CrossRef] [Scilit]
- Zhao, H.; Qiu, S.; Yang, J.; Guo, J.; Liu, M.; Cao, X. Satellite Early Anomaly Detection Using an Advanced Transformer Architecture for Non-Stationary Telemetry Data. IEEE Trans. Consum. Electron. 2024, 70, 4213–4225. [Google Scholar] [CrossRef] [Scilit]
- Tariq, S.; Lee, S.; Shin, Y.; Lee, M.S.; Jung, O.; Chung, D.; Woo, S.S. Detecting Anomalies in Space Using Multivariate Convolutional LSTM with Mixtures of Probabilistic PCA. In Proceedings of the 25th ACM SIGKDD International Conference on Knowledge Discovery and Data Mining, Anchorage, AK, USA, 4–8 August 2019; pp. 2123–2133. [Google Scholar] [CrossRef] [Scilit]
- Sun, X.; Zhou, H.; Li, C. Multivariate Time Series Anomaly Detection with Idempotent Reconstruction. Adv. Neural Inf. Process. Syst. 2025, 38, 178665–178723. [Google Scholar] [CrossRef] [Scilit]
- Shen, K.Y. Learn Hybrid Prototypes for Multivariate Time Series Anomaly Detection. In Proceedings of the Thirteenth International Conference on Learning Representations, Singapore, 24–28 April 2025; Available online: https://openreview.net/forum?id=8TBGdH3t6a (accessed on 14 August 2026).

Disclaimer/Publisher’s Note: The statements, opinions and data contained in all publications are solely those of the individual author(s) and contributor(s) and not of MDPI and/or the editor(s). MDPI and/or the editor(s) disclaim responsibility for any injury to people or property resulting from any ideas, methods, instructions or products referred to in the content. |
© 2026 by the authors. Licensee MDPI, Basel, Switzerland. This article is an open access article distributed under the terms and conditions of the Creative Commons Attribution (CC BY) license.