Next Issue
Volume 10, February
Previous Issue
Volume 9, December


ISPRS Int. J. Geo-Inf., Volume 10, Issue 1 (January 2021) – 42 articles

Cover Story (view full-size image): 
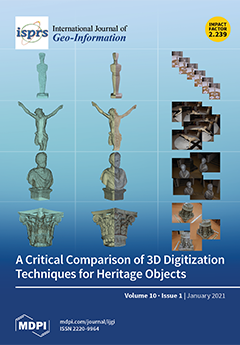
The detailed recording of tangible heritage is causally related to the ever-present needs for protection, conservation, and valorization. However, recording technologies change rapidly and allow increasingly higher automation, processing velocities, accuracy, and visual fidelity. Therefore, being up to date with the—continuously evolving—technologies for three-dimensional digitization is crucial to ensure the high quality of heritage documentation. This work offers an updated critical evaluation of imaging and scanning sensors, common capturing scenarios, and processing techniques for heritage objects’ digitization by comparing the quality of metric results. It considers a variety of photogrammetric software, as well as case studies of different geometrical characteristics, to present comprehensive conclusions. View this paper
  • Issues are regarded as officially published after their release is announced to the table of contents alert mailing list.
  • You may sign up for e-mail alerts to receive table of contents of newly released issues.
  • PDF is the official format for papers published in both, html and pdf forms. To view the papers in pdf format, click on the "PDF Full-text" link, and use the free Adobe Reader to open them.
Order results
Result details
Select all
Export citation of selected articles as:
17 pages, 4491 KiB  
Article
Comparison of Ensemble Machine Learning Methods for Soil Erosion Pin Measurements
by Kieu Anh Nguyen, Walter Chen, Bor-Shiun Lin and Uma Seeboonruang
ISPRS Int. J. Geo-Inf. 2021, 10(1), 42; https://doi.org/10.3390/ijgi10010042 - 19 Jan 2021
Cited by 25 | Viewed by 4094
Abstract
Although machine learning has been extensively used in various fields, it has only recently been applied to soil erosion pin modeling. To improve upon previous methods of quantifying soil erosion based on erosion pin measurements, this study explored the possible application of ensemble [...] Read more.
Although machine learning has been extensively used in various fields, it has only recently been applied to soil erosion pin modeling. To improve upon previous methods of quantifying soil erosion based on erosion pin measurements, this study explored the possible application of ensemble machine learning algorithms to the Shihmen Reservoir watershed in northern Taiwan. Three categories of ensemble methods were considered in this study: (a) Bagging, (b) boosting, and (c) stacking. The bagging method in this study refers to bagged multivariate adaptive regression splines (bagged MARS) and random forest (RF), and the boosting method includes Cubist and gradient boosting machine (GBM). Finally, the stacking method is an ensemble method that uses a meta-model to combine the predictions of base models. This study used RF and GBM as the meta-models, decision tree, linear regression, artificial neural network, and support vector machine as the base models. The dataset used in this study was sampled using stratified random sampling to achieve a 70/30 split for the training and test data, and the process was repeated three times. The performance of six ensemble methods in three categories was analyzed based on the average of three attempts. It was found that GBM performed the best among the ensemble models with the lowest root-mean-square error (RMSE = 1.72 mm/year), the highest Nash-Sutcliffe efficiency (NSE = 0.54), and the highest index of agreement (d = 0.81). This result was confirmed by the spatial comparison of the absolute differences (errors) between model predictions and observations using GBM and RF in the study area. In summary, the results show that as a group, the bagging method and the boosting method performed equally well, and the stacking method was third for the erosion pin dataset considered in this study. Full article
(This article belongs to the Special Issue Integrating GIS and Remote Sensing in Soil Mapping and Modeling)
Show Figures

Figure 1

21 pages, 5369 KiB  
Article
The Potential of LiDAR and UAV-Photogrammetric Data Analysis to Interpret Archaeological Sites: A Case Study of Chun Castle in South-West England
by Israa Kadhim and Fanar M. Abed
ISPRS Int. J. Geo-Inf. 2021, 10(1), 41; https://doi.org/10.3390/ijgi10010041 - 19 Jan 2021
Cited by 17 | Viewed by 5244
Abstract
With the increasing demands to use remote sensing approaches, such as aerial photography, satellite imagery, and LiDAR in archaeological applications, there is still a limited number of studies assessing the differences between remote sensing methods in extracting new archaeological finds. Therefore, this work [...] Read more.
With the increasing demands to use remote sensing approaches, such as aerial photography, satellite imagery, and LiDAR in archaeological applications, there is still a limited number of studies assessing the differences between remote sensing methods in extracting new archaeological finds. Therefore, this work aims to critically compare two types of fine-scale remotely sensed data: LiDAR and an Unmanned Aerial Vehicle (UAV) derived Structure from Motion (SfM) photogrammetry. To achieve this, aerial imagery and airborne LiDAR datasets of Chun Castle were acquired, processed, analyzed, and interpreted. Chun Castle is one of the most remarkable ancient sites in Cornwall County (Southwest England) that had not been surveyed and explored by non-destructive techniques. The work outlines the approaches that were applied to the remotely sensed data to reveal potential remains: Visualization methods (e.g., hillshade and slope raster images), ISODATA clustering, and Support Vector Machine (SVM) algorithms. The results display various archaeological remains within the study site that have been successfully identified. Applying multiple methods and algorithms have successfully improved our understanding of spatial attributes within the landscape. The outcomes demonstrate how raster derivable from inexpensive approaches can be used to identify archaeological remains and hidden monuments, which have the possibility to revolutionize archaeological understanding. Full article
(This article belongs to the Special Issue Cultural Heritage Mapping and Observation)
Show Figures

Graphical abstract

23 pages, 7886 KiB  
Article
Traffic Inequality and Relations in Maritime Silk Road: A Network Flow Analysis
by Naixia Mou, Haonan Ren, Yunhao Zheng, Jinhai Chen, Jiqiang Niu, Tengfei Yang, Lingxian Zhang and Feng Liu
ISPRS Int. J. Geo-Inf. 2021, 10(1), 40; https://doi.org/10.3390/ijgi10010040 - 19 Jan 2021
Cited by 9 | Viewed by 4152
Abstract
Maritime traffic can reflect the diverse and complex relations between countries and regions, such as economic trade and geopolitics. Based on the AIS (Automatic Identification System) trajectory data of ships, this study constructs the Maritime Silk Road traffic network. In this study, we [...] Read more.
Maritime traffic can reflect the diverse and complex relations between countries and regions, such as economic trade and geopolitics. Based on the AIS (Automatic Identification System) trajectory data of ships, this study constructs the Maritime Silk Road traffic network. In this study, we used a complex network theory along with social network analysis and network flow analysis to analyze the spatial distribution characteristics of maritime traffic flow of the Maritime Silk Road; further, we empirically demonstrate the traffic inequality in the route. On this basis, we explore the role of the country in the maritime traffic system and the resulting traffic relations. There are three main results of this study. (1) The inequality in the maritime traffic of the Maritime Silk Road has led to obvious regional differences. Europe, west Asia, northeast Asia, and southeast Asia are the dominant regions of the Maritime Silk Road. (2) Different countries play different maritime traffic roles. Italy, Singapore, and China are the core countries in the maritime traffic network of the Maritime Silk Road; Greece, Turkey, Cyprus, Lebanon, and Israel have built a structure of maritime traffic flow in the eastern Mediterranean Sea, and Saudi Arabia serves as a bridge for maritime trade between Asia and Europe. (3) The maritime traffic relations show the characteristics of regionalization; countries in west Asia and the European Mediterranean region are clearly polarized, and competition–synergy relations have become the main form of maritime traffic relations among the countries in the dominant regions. Our results can provide a scientific reference for the coordinated development of regional shipping, improvement of maritime competition, cooperation strategies for countries, and adjustments in the organizational structure of ports along the Maritime Silk Road. Full article
Show Figures

Figure 1

19 pages, 7578 KiB  
Article
FuNet: A Novel Road Extraction Network with Fusion of Location Data and Remote Sensing Imagery
by Kai Zhou, Yan Xie, Zhan Gao, Fang Miao and Lei Zhang
ISPRS Int. J. Geo-Inf. 2021, 10(1), 39; https://doi.org/10.3390/ijgi10010039 - 19 Jan 2021
Cited by 19 | Viewed by 2872
Abstract
Road semantic segmentation is unique and difficult. Road extraction from remote sensing imagery often produce fragmented road segments leading to road network disconnection due to the occlusion of trees, buildings, shadows, cloud, etc. In this paper, we propose a novel fusion network (FuNet) [...] Read more.
Road semantic segmentation is unique and difficult. Road extraction from remote sensing imagery often produce fragmented road segments leading to road network disconnection due to the occlusion of trees, buildings, shadows, cloud, etc. In this paper, we propose a novel fusion network (FuNet) with fusion of remote sensing imagery and location data, which plays an important role of location data in road connectivity reasoning. A universal iteration reinforcement (IteR) module is embedded into FuNet to enhance the ability of network learning. We designed the IteR formula to repeatedly integrate original information and prediction information and designed the reinforcement loss function to control the accuracy of road prediction output. Another contribution of this paper is the use of histogram equalization data pre-processing to enhance image contrast and improve the accuracy by nearly 1%. We take the excellent D-LinkNet as the backbone network, designing experiments based on the open dataset. The experiment result shows that our method improves over the compared advanced road extraction methods, which not only increases the accuracy of road extraction, but also improves the road topological connectivity. Full article
Show Figures

Figure 1

16 pages, 4611 KiB  
Article
Using Restaurant POI Data to Explore Regional Structure of Food Culture Based on Cuisine Preference
by Shangjing Jiang, Haiping Zhang, Haoran Wang, Lei Zhou and Guoan Tang
ISPRS Int. J. Geo-Inf. 2021, 10(1), 38; https://doi.org/10.3390/ijgi10010038 - 18 Jan 2021
Cited by 11 | Viewed by 4067
Abstract
As a result of the influence of geographical environment and historical heritage, food preference has significant regional differentiation characteristics. However, the spatial structure of food culture represented by the cuisine culture at the regional level has not yet been explored from the perspective [...] Read more.
As a result of the influence of geographical environment and historical heritage, food preference has significant regional differentiation characteristics. However, the spatial structure of food culture represented by the cuisine culture at the regional level has not yet been explored from the perspective of geography. Cultural regionalization is an important way to analyze and understand the spatial structure of food culture. It is of great significance to deeply mine intra-regional homogeneity and scientifically cognize inter-regional cultural characteristics. This study aims to explore such patterns by focusing on the restaurants of the eight most famous cuisines in Mainland China. Initially, the density based geospatial hotspot detector method is proposed to analyze and mapping the spatial quantitative characteristics of the eight major cuisines. A heuristic method for geographical regionalization based on machine learning was used to analyze spatial distribution patterns in accordance with the proportion of these cuisines in each prefecture-level city. Results show that some types of single-category cuisines have a stronger spatial concentration effect in the present, whereas others have a strong diffusion trend. In the comprehensive analysis of multicategory cuisines, the eight major cuisines formed a new structure of geographical regionalization of Chinese cuisine culture. This study is helpful to understand regional structure characteristics of food preference, and the density-based hotspot detector proposed in this paper can also be used in the analysis of other type of point of interest (POI) data. Full article
Show Figures

Figure 1

15 pages, 6297 KiB  
Article
Spatially Characterizing Major Airline Alliances: A Network Analysis
by Chun-Hsiang Chan, Tzu-How Chu, Jiun-Huei Proty Wu and Tzai-Hung Wen
ISPRS Int. J. Geo-Inf. 2021, 10(1), 37; https://doi.org/10.3390/ijgi10010037 - 15 Jan 2021
Cited by 1 | Viewed by 3458
Abstract
An airline alliance is a group of member airlines that seek to achieve the same goals through routes and airports. Hence, airports’ connectivity plays an essential role in understanding the linkage between different markets, especially the impact of neighboring airports on focal airports. [...] Read more.
An airline alliance is a group of member airlines that seek to achieve the same goals through routes and airports. Hence, airports’ connectivity plays an essential role in understanding the linkage between different markets, especially the impact of neighboring airports on focal airports. An airline alliance airport network (AAAN) comprises airports as nodes and routes as edges. It could reflect a clear collaborative proportion within AAAN and competitive routes between AAANs. Recent studies adopted an airport- or route-centric perspective to evaluate the relationship between airline alliances and their member airlines; meanwhile, they mentioned that an airport community could provide valuable air transportation information because it considers the entire network structure, including the impacts of the direct and indirect routes. The objectives are to identify spatial patterns of market region in an airline alliance and characterize the differences among airline alliances (Oneworld, Star Alliance, and SkyTeam), including regions of collaboration, competition, and dominance. Our results show that Star Alliance has the highest collaboration and international market dominance among three airline alliances. The most competitive regions are Asia-Pacific, West Asia, Europe, and North and Central America. The network approach we proposed identifies market characteristics, highlights the region of market advantages in the airline alliance, and also provides more insights for airline and airline alliances to extend their market share or service areas. Full article
Show Figures

Figure 1

18 pages, 14253 KiB  
Article
Incorporating Memory-Based Preferences and Point-of-Interest Stickiness into Recommendations in Location-Based Social Networks
by Hang Zhang, Mingxin Gan and Xi Sun
ISPRS Int. J. Geo-Inf. 2021, 10(1), 36; https://doi.org/10.3390/ijgi10010036 - 15 Jan 2021
Cited by 8 | Viewed by 2620
Abstract
In location-based social networks (LBSNs), point-of-interest (POI) recommendations facilitate access to information for people by recommending attractive locations they have not previously visited. Check-in data and various contextual factors are widely taken into consideration to obtain people’s preferences regarding POIs in existing POI [...] Read more.
In location-based social networks (LBSNs), point-of-interest (POI) recommendations facilitate access to information for people by recommending attractive locations they have not previously visited. Check-in data and various contextual factors are widely taken into consideration to obtain people’s preferences regarding POIs in existing POI recommendation methods. In psychological effect-based POI recommendations, the memory-based attenuation of people’s preferences with respect to POIs, e.g., the fact that more attention is paid to POIs that were checked in to recently than those visited earlier, is emphasized. However, the memory effect only reflects the changes in an individual’s check-in trajectory and cannot discover the important POIs that dominate their mobility patterns, which are related to the repeat-visit frequency of an individual at a POI. To solve this problem, in this paper, we developed a novel POI recommendation framework using people’s memory-based preferences and POI stickiness, named U-CF-Memory-Stickiness. First, we used the memory-based preference-attenuation mechanism to emphasize personal psychological effects and memory-based preference evolution in human mobility patterns. Second, we took the visiting frequency of POIs into consideration and introduced the concept of POI stickiness to identify the important POIs that reflect the stable interests of an individual with respect to their mobility behavior decisions. Lastly, we incorporated the influence of both memory-based preferences and POI stickiness into a user-based collaborative filtering framework to improve the performance of POI recommendations. The results of the experiments we conducted on a real LBSN dataset demonstrated that our method outperformed other methods. Full article
(This article belongs to the Special Issue Geovisualization and Social Media)
Show Figures

Figure 1

22 pages, 2985 KiB  
Article
A Blockchain Solution for Securing Real Property Transactions: A Case Study for Serbia
by Goran Sladić, Branko Milosavljević, Siniša Nikolić, Dubravka Sladić and Aleksandra Radulović
ISPRS Int. J. Geo-Inf. 2021, 10(1), 35; https://doi.org/10.3390/ijgi10010035 - 15 Jan 2021
Cited by 37 | Viewed by 6287
Abstract
The origins of digital money and blockchain technology goes back to the 1980s, but in the last decade, the blockchain technology gained large popularity in the financial sector with the appearance of cryptocurrencies such as Bitcoin. However, recently, many other fields of application [...] Read more.
The origins of digital money and blockchain technology goes back to the 1980s, but in the last decade, the blockchain technology gained large popularity in the financial sector with the appearance of cryptocurrencies such as Bitcoin. However, recently, many other fields of application have been recognized, particularly with the development of smart contracts. Among them is the possible application of blockchain technology in the domain of land administration, mostly as a tool for transparency in the developing countries and means to fight corruption. However, developed countries also find interest in launching pilot projects to test their applicability in land administration domain for reasons such as to increase the speed and reduce costs of the real property transactions through a more secure environment. In this paper, we analyse how transactions are handled in Serbian land administration and how this process may be supported by modern ledger technologies such as blockchain. In order to analyse how blockchain could be implemented to support transactions in land information systems (LIS), it is necessary to understand cadastral processes and transactions in LIS, as well as legislative and organizational aspects of LIS. Transactions in cadastre comprise many actors and utilize both alphanumeric (descriptive or legal) data and geospatial data about property boundaries on the cadastral map. Based on the determined requirements for the blockchain-based LIS, we propose a system architecture for its implementation. Such a system keeps track of transactions in LIS in an immutable and tamper-proof manner to increase the security of the system and consequently increase the speed of transactions, efficiency, and data integrity without a significant impact on the existing laws and regulations. The system is anticipated as a permissioned public blockchain implemented on top of the Ethereum network. Full article
(This article belongs to the Special Issue GIS Software and Engineering for Big Data)
Show Figures

Figure 1

27 pages, 5854 KiB  
Article
AIRSENSE-TO-ACT: A Concept Paper for COVID-19 Countermeasures Based on Artificial Intelligence Algorithms and Multi-Source Data Processing
by Alessandro Sebastianelli, Francesco Mauro, Gianluca Di Cosmo, Fabrizio Passarini, Marco Carminati and Silvia Liberata Ullo
ISPRS Int. J. Geo-Inf. 2021, 10(1), 34; https://doi.org/10.3390/ijgi10010034 - 14 Jan 2021
Cited by 8 | Viewed by 7360
Abstract
The aim of this concept paper is the description of a new tool to support institutions in the implementation of targeted countermeasures, based on quantitative and multi-scale elements, for the fight and prevention of emergencies, such as the current COVID-19 pandemic. The tool [...] Read more.
The aim of this concept paper is the description of a new tool to support institutions in the implementation of targeted countermeasures, based on quantitative and multi-scale elements, for the fight and prevention of emergencies, such as the current COVID-19 pandemic. The tool is a cloud-based centralized system; a multi-user platform that relies on artificial intelligence (AI) algorithms for the processing of heterogeneous data, which can produce as an output the level of risk. The model includes a specific neural network which is first trained to learn the correlations between selected inputs, related to the case of interest: environmental variables (chemical–physical, such as meteorological), human activity (such as traffic and crowding), level of pollution (in particular the concentration of particulate matter) and epidemiological variables related to the evolution of the contagion. The tool realized in the first phase of the project will serve later both as a decision support system (DSS) with predictive capacity, when fed by the actual measured data, and as a simulation bench performing the tuning of certain input values, to identify which of them led to a decrease in the degree of risk. In this way, we aimed to design different scenarios to compare different restrictive strategies and the actual expected benefits, to adopt measures sized to the actual needs, adapted to the specific areas of analysis and useful for safeguarding human health; and we compared the economic and social impacts of the choices. Although ours is a concept paper, some preliminary analyses have been shown, and two different case studies are presented, whose results have highlighted a correlation between NO2, mobility and COVID-19 data. However, given the complexity of the virus diffusion mechanism, linked to air pollutants but also to many other factors, these preliminary studies confirmed the need, on the one hand, to carry out more in-depth analyses, and on the other, to use AI algorithms to capture the hidden relationships among the huge amounts of data to process. Full article
(This article belongs to the Collection Spatial Components of COVID-19 Pandemic)
Show Figures

Figure 1

16 pages, 50806 KiB  
Article
Temporal and Spatial Variations in the Leaf Area Index and Its Response to Topography in the Three-River Source Region, China from 2000 to 2017
by Wenqi Zhang, Huaan Jin, Huaiyong Shao, Ainong Li, Shangzhi Li and Wenjie Fan
ISPRS Int. J. Geo-Inf. 2021, 10(1), 33; https://doi.org/10.3390/ijgi10010033 - 13 Jan 2021
Cited by 17 | Viewed by 2818
Abstract
The Three-River Source Region (TRSR) is an important area for the ecological security of China. Vegetation growth has been affected by the climate change, topography, and human activities in this area. However, few studies have focused on analyzing time series tendencies of vegetation [...] Read more.
The Three-River Source Region (TRSR) is an important area for the ecological security of China. Vegetation growth has been affected by the climate change, topography, and human activities in this area. However, few studies have focused on analyzing time series tendencies of vegetation change in various terrain conditions. To address this issue in the TRSR, this study explored vegetation stability, tendency, and sustainability with multiple methods (e.g., coefficient of variation, Theil-Sen median trend analysis, Mann-Kendall test, and Hurst index) based on the 2000–2017 Global LAnd Surface Satellite Leaf Area Index (GLASS LAI) product. The differentiation patterns of LAI variations and multiyear mean LAI value under different topographic factors were also investigated in combination with digital elevation model (DEM). The results showed that (1) the mean LAI value in the study area increased, with a linear tendency of 0.013·10 a−1; (2) LAI values decreased from southeast to northwest in terms of spatial distribution and the CV indicated LAI variations were relatively stable; (3) the trend analysis revealed that the improved area of LAI accounted for 62.72% which was larger than the degraded area (37.28%), and hurst index revealed a weak anti-sustaining effect of the current tendencies; and (4) the increasing trend was found in multiyear mean LAI value as relief amplitude and slope increased, while LAI stability improved with increasing slope. They exhibited a clear regular pattern. Moreover, significant improvement in LAI generally occurred in low-altitude and flat areas. Finally, the overall improvement and sustainability of LAI improved when moving from sunny aspects to shady aspects, but the LAI stability decreased. Note that vegetation degradation was observed in some high slope areas and was further aggravated. This study is beneficial for revealing the spatial and temporal changes of LAI and their changing rules as a function of different topographic factors in the TRSR. Meanwhile, the results of this study provide theoretical support for sustainable development of this area. Full article
Show Figures

Figure 1

32 pages, 11315 KiB  
Article
Semantics-Driven Remote Sensing Scene Understanding Framework for Grounded Spatio-Contextual Scene Descriptions
by Abhishek V. Potnis, Surya S. Durbha and Rajat C. Shinde
ISPRS Int. J. Geo-Inf. 2021, 10(1), 32; https://doi.org/10.3390/ijgi10010032 - 13 Jan 2021
Cited by 10 | Viewed by 3819
Abstract
Earth Observation data possess tremendous potential in understanding the dynamics of our planet. We propose the Semantics-driven Remote Sensing Scene Understanding (Sem-RSSU) framework for rendering comprehensive grounded spatio-contextual scene descriptions for enhanced situational awareness. To minimize the semantic gap for remote-sensing-scene understanding, the [...] Read more.
Earth Observation data possess tremendous potential in understanding the dynamics of our planet. We propose the Semantics-driven Remote Sensing Scene Understanding (Sem-RSSU) framework for rendering comprehensive grounded spatio-contextual scene descriptions for enhanced situational awareness. To minimize the semantic gap for remote-sensing-scene understanding, the framework puts forward the transformation of scenes by using semantic-web technologies to Remote Sensing Scene Knowledge Graphs (RSS-KGs). The knowledge-graph representation of scenes has been formalized through the development of a Remote Sensing Scene Ontology (RSSO)—a core ontology for an inclusive remote-sensing-scene data product. The RSS-KGs are enriched both spatially and contextually, using a deductive reasoner, by mining for implicit spatio-contextual relationships between land-cover classes in the scenes. The Sem-RSSU, at its core, constitutes novel Ontology-driven Spatio-Contextual Triple Aggregation and realization algorithms to transform KGs to render grounded natural language scene descriptions. Considering the significance of scene understanding for informed decision-making from remote sensing scenes during a flood, we selected it as a test scenario, to demonstrate the utility of this framework. In that regard, a contextual domain knowledge encompassing Flood Scene Ontology (FSO) has been developed. Extensive experimental evaluations show promising results, further validating the efficacy of this framework. Full article
(This article belongs to the Special Issue Geospatial Artificial Intelligence)
Show Figures

Figure 1

18 pages, 4908 KiB  
Article
PM2.5 Estimation and Spatial-Temporal Pattern Analysis Based on the Modified Support Vector Regression Model and the 1 km Resolution MAIAC AOD in Hubei, China
by Nengcheng Chen, Meijuan Yang, Wenying Du and Min Huang
ISPRS Int. J. Geo-Inf. 2021, 10(1), 31; https://doi.org/10.3390/ijgi10010031 - 13 Jan 2021
Cited by 12 | Viewed by 2617
Abstract
The satellite-retrieved Aerosol Optical Depth (AOD) is widely used to estimate the concentrations and analyze the spatiotemporal pattern of Particulate Matter that is less than or equal to 2.5 microns (PM2.5), also providing a way for the related research of air [...] Read more.
The satellite-retrieved Aerosol Optical Depth (AOD) is widely used to estimate the concentrations and analyze the spatiotemporal pattern of Particulate Matter that is less than or equal to 2.5 microns (PM2.5), also providing a way for the related research of air pollution. Many studies generated PM2.5 concentration networks with resolutions of 3 km or 10 km. However, the relatively coarse resolution of the satellite AOD products make it difficult to determine the fine-scale characteristics of PM2.5 distributions that are important for urban air quality analysis. In addition, the composition and chemical properties of PM2.5 are relatively complex and might be affected by many factors, such as meteorological and land cover type factors. In this paper, an AOD product with a 1 km spatial resolution derived from the Multi-Angle Implementation of Atmospheric Correction (MAIAC) algorithm, the PM2.5 measurements from ground sites and the meteorological data as the auxiliary variable, are integrated into the Modified Support Vector Regression (MSVR) model that proposed in this paper to estimate the PM2.5 concentrations and analyze the spatiotemporal pattern of PM2.5. Considering the relatively small dataset and the somewhat complex relationship between the variables, we propose a Modified Support Vector Regression (MSVR) model that based on SVR to fit and estimate the PM2.5 concentrations in Hubei province of China. In this paper, we obtained Cross Correlation Coefficient (R²) of 0.74 for the regression of independent and dependent variables, and the conventional SVR model obtained R² of 0.60 as comparison. We think our MSVR model obtained relatively good performance in spite of many complex factors that might impact the accuracy. We then utilized the optimal MSVR model to perform the PM2.5 estimating, analyze their spatiotemporal patterns, and try to explain the possible reasons for these patterns. The results showed that the PM2.5 estimations retrieved from 1 km MAIAC AOD could reflect more detailed spatial distribution characteristics of PM2.5 and have higher accuracy than that from 3 km MODIS AOD. Therefore, the proposed MSVR model can be a better method for PM2.5 estimating, especially when the dataset is relatively small. Full article
Show Figures

Figure 1

17 pages, 474 KiB  
Article
Geospatial Open Data Usage and Metadata Quality
by Alfonso Quarati, Monica De Martino and Sergio Rosim
ISPRS Int. J. Geo-Inf. 2021, 10(1), 30; https://doi.org/10.3390/ijgi10010030 - 13 Jan 2021
Cited by 24 | Viewed by 3562
Abstract
The Open Government Data portals (OGD), thanks to the presence of thousands of geo-referenced datasets, containing spatial information are of extreme interest for any analysis or process relating to the territory. For this to happen, users must be enabled to access these datasets [...] Read more.
The Open Government Data portals (OGD), thanks to the presence of thousands of geo-referenced datasets, containing spatial information are of extreme interest for any analysis or process relating to the territory. For this to happen, users must be enabled to access these datasets and reuse them. An element often considered as hindering the full dissemination of OGD data is the quality of their metadata. Starting from an experimental investigation conducted on over 160,000 geospatial datasets belonging to six national and international OGD portals, this work has as its first objective to provide an overview of the usage of these portals measured in terms of datasets views and downloads. Furthermore, to assess the possible influence of the quality of the metadata on the use of geospatial datasets, an assessment of the metadata for each dataset was carried out, and the correlation between these two variables was measured. The results obtained showed a significant underutilization of geospatial datasets and a generally poor quality of their metadata. In addition, a weak correlation was found between the use and quality of the metadata, not such as to assert with certainty that the latter is a determining factor of the former. Full article
(This article belongs to the Special Issue Geospatial Metadata)
Show Figures

Figure 1

19 pages, 2244 KiB  
Article
Rapid Evaluation and Validation Method of Above Ground Forest Biomass Estimation Using Optical Remote Sensing in Tundi Reserved Forest Area, India
by Praveen Kumar, Akhouri P. Krishna, Thorkild M. Rasmussen and Mahendra K. Pal
ISPRS Int. J. Geo-Inf. 2021, 10(1), 29; https://doi.org/10.3390/ijgi10010029 - 13 Jan 2021
Cited by 3 | Viewed by 2895
Abstract
Optical remote sensing data are freely available on a global scale. However, the satellite image processing and analysis for quick, accurate, and precise forest above ground biomass (AGB) evaluation are still challenging and difficult. This paper is aimed to develop a [...] Read more.
Optical remote sensing data are freely available on a global scale. However, the satellite image processing and analysis for quick, accurate, and precise forest above ground biomass (AGB) evaluation are still challenging and difficult. This paper is aimed to develop a novel method for precise, accurate, and quick evaluation of the forest AGB from optical remote sensing data. Typically, the ground forest AGB was calculated using an empirical model from ground data for biophysical parameters such as tree density, height, and diameter at breast height (DBH) collected from the field at different elevation strata. The ground fraction of vegetation cover (FVC) in each ground sample location was calculated. Then, the fraction of vegetation cover (FVC) from optical remote sensing imagery was calculated. In the first stage of method implementation, the relation model between the ground FVC and ground forest AGB was developed. In the second stage, the relational model was established between image FVC and ground FVC. Finally, both models were fused to derive the relational model between image FVC and forest AGB. The validation of the developed method was demonstrated utilizing Sentinel-2 imagery as test data and the Tundi reserved forest area located in the Dhanbad district of Jharkhand state in eastern India was used as the test site. The result from the developed model was ground validated and also compared with the result from a previously developed crown projected area (CPA)-based forest AGB estimation approach. The results from the developed approach demonstrated superior capabilities in precision compared to the CPA-based method. The average forest AGB estimation of the test site obtained by this approach revealed 463 tons per hectare, which matches the previous estimate from this test site. Full article
(This article belongs to the Special Issue The Use of Geo-Spatial Tools in Forestry)
Show Figures

Figure 1

17 pages, 3763 KiB  
Article
Sensitivity Assessment of Spatial Resolution Difference in DEM for Soil Erosion Estimation Based on UAV Observations: An Experiment on Agriculture Terraces in the Middle Hill of Nepal
by Chhabi Lal Chidi, Wei Zhao, Suresh Chaudhary, Donghong Xiong and Yanhong Wu
ISPRS Int. J. Geo-Inf. 2021, 10(1), 28; https://doi.org/10.3390/ijgi10010028 - 13 Jan 2021
Cited by 16 | Viewed by 3098
Abstract
Soil erosion in the agricultural area of a hill slope is a fundamental issue for crop productivity and environmental sustainability. Building terrace is a very popular way to control soil erosion, and accurate assessment of the soil erosion rate is important for sustainable [...] Read more.
Soil erosion in the agricultural area of a hill slope is a fundamental issue for crop productivity and environmental sustainability. Building terrace is a very popular way to control soil erosion, and accurate assessment of the soil erosion rate is important for sustainable agriculture and environmental management. Currently, many soil erosion estimations are mainly based on the freely available medium or coarse resolution digital elevation model (DEM) data that neglect micro topographic modification of the agriculture terraces. The development of unmanned aerial vehicle (UAV) technology enables the development of high-resolution (centimeter level) DEM to present accurate topographic features. To demonstrate the sensitivity of soil erosion estimates to DEM resolution at this high-resolution level, this study tries to evaluate soil erosion estimation in the Middle Hill agriculture terraces in Nepal based on UAV derived high-resolution (5 × 5 cm) DEM data and make a comparative study for the estimates by using the DEM data aggregated into different spatial resolutions (5 × 5 cm to 10 × 10 m). Firstly, slope gradient, slope length, and topographic factors were calculated at different resolutions. Then, the revised universal soil loss estimation (RUSLE) model was applied to estimate soil erosion rates with the derived LS factor at different resolutions. The results indicated that there was higher change rate in slope gradient, slope length, LS factor, and soil erosion rate when using DEM data with resolution from 5 × 5 cm to 2 × 2 m than using coarser DEM data. A power trend line was effectively used to present the relationship between soil erosion rate and DEM resolution. The findings indicated that soil erosion estimates are highly sensitive to DEM resolution (from 5 × 5 cm to 2 × 2 m), and the changes become relatively stable from 2 × 2 m. The use of DEM data with pixel size larger than 2 × 2 m cannot detect the micro topography. With the insights about the influencing mechanism of DEM resolution on soil erosion estimates, this study provides important suggestions for appropriate DEM data selection that should be investigated first for accurate soil erosion estimation. Full article
(This article belongs to the Special Issue Geomorphometry and Terrain Analysis)
Show Figures

Figure 1

21 pages, 8837 KiB  
Article
Torrential Flood Water Management: Rainwater Harvesting through Relation Based Dam Suitability Analysis and Quantification of Erosion Potential
by Bilal Ahmad Munir, Sajid Rashid Ahmad and Raja Rehan
ISPRS Int. J. Geo-Inf. 2021, 10(1), 27; https://doi.org/10.3390/ijgi10010027 - 12 Jan 2021
Cited by 5 | Viewed by 2828
Abstract
In this study, a relation-based dam suitability analysis (RDSA) technique is developed to identify the most suitable sites for dams. The methodology focused on a group of the most important parameters/indicators (stream order, terrain roughness index, slope, multiresolution valley bottom flatness index, closed [...] Read more.
In this study, a relation-based dam suitability analysis (RDSA) technique is developed to identify the most suitable sites for dams. The methodology focused on a group of the most important parameters/indicators (stream order, terrain roughness index, slope, multiresolution valley bottom flatness index, closed depression, valley depth, and downslope gradient difference) and their relation to the dam wall and reservoir suitability. Quantitative assessment results in an elevation-area-capacity (EAC) curve substantiating the capacity determination of selected sites. The methodology also incorporates the estimation of soil erosion (SE) using the Revised Universal Soil Loss Equation (RUSLE) model and sediment yield at the selected dam sites. The RDSA technique identifies two suitable dam sites (A and B) with a maximum collective capacity of approximately 1202 million m3. The RDSA technique was validated with the existing dam, Gomal-Zam, in the north of Sanghar catchment, where RDSA classified the Gomal-Zam Dam in a very high suitability class. The SE estimates show an average of 75 t-ha−1y−1 of soil loss occurs in the study area. The result shows approximately 298,073 and 318,000 tons of annual average sediment yield (SY) will feed the dam A and B respectively. The SE-based sediment yield substantiates the approximate life of Dam-A and Dam-B to be 87 and 90 years, respectively. The approach is dynamic and can be applied for any other location globally for dam site selection and SE estimation. Full article
Show Figures

Figure 1

24 pages, 8436 KiB  
Article
Pairwise Coarse Registration of Indoor Point Clouds Using 2D Line Features
by Zhen Li, Xiaoming Zhang, Junxiang Tan and Hua Liu
ISPRS Int. J. Geo-Inf. 2021, 10(1), 26; https://doi.org/10.3390/ijgi10010026 - 12 Jan 2021
Cited by 13 | Viewed by 2646
Abstract
Registration is essential for terrestrial LiDAR (light detection and ranging) scanning point clouds. The registration of indoor point clouds is especially challenging due to the occlusion and self-similarity of indoor structures. This paper proposes a 4 degrees of freedom (4DOF) coarse registration method [...] Read more.
Registration is essential for terrestrial LiDAR (light detection and ranging) scanning point clouds. The registration of indoor point clouds is especially challenging due to the occlusion and self-similarity of indoor structures. This paper proposes a 4 degrees of freedom (4DOF) coarse registration method that fully takes advantage of the knowledge that the equipment is levelled or the inclination compensated for by a tilt sensor in data acquisition. The method decomposes the 4DOF registration problem into two parts: (1) horizontal alignment using ortho-projected images and (2) vertical alignment. The ortho-projected images are generated using points between the floor and ceiling, and the horizontal alignment is achieved by the matching of the source and target ortho-projected images using the 2D line features detected from them. The vertical alignment is achieved by making the height of the floor and ceiling in the source and target points equivalent. Two datasets, one with five stations and the other with 20 stations, were used to evaluate the performance of the proposed method. The experimental results showed that the proposed method achieved 80% and 63% successful registration rates (SRRs) in a simple scene and a challenging scene, respectively. The SRR in the simple scene is only lower than that of the keypoint-based four-point congruent set (K4PCS) method. The SRR in the challenging scene is better than all five comparison methods. Even though the proposed method still has some limitations, the proposed method provides an alternative to solve the indoor point cloud registration problem. Full article
(This article belongs to the Special Issue 3D Indoor Mapping and Modelling)
Show Figures

Figure 1

23 pages, 3093 KiB  
Article
An Examination of People’s Privacy Concerns, Perceptions of Social Benefits, and Acceptance of COVID-19 Mitigation Measures That Harness Location Information: A Comparative Study of the U.S. and South Korea
by Junghwan Kim and Mei-Po Kwan
ISPRS Int. J. Geo-Inf. 2021, 10(1), 25; https://doi.org/10.3390/ijgi10010025 - 12 Jan 2021
Cited by 31 | Viewed by 10152
Abstract
This paper examines people’s privacy concerns, perceptions of social benefits, and acceptance of various COVID-19 control measures that harness location information using data collected through an online survey in the U.S. and South Korea. The results indicate that people have higher privacy concerns [...] Read more.
This paper examines people’s privacy concerns, perceptions of social benefits, and acceptance of various COVID-19 control measures that harness location information using data collected through an online survey in the U.S. and South Korea. The results indicate that people have higher privacy concerns for methods that use more sensitive and private information. The results also reveal that people’s perceptions of social benefits are low when their privacy concerns are high, indicating a trade-off relationship between privacy concerns and perceived social benefits. Moreover, the acceptance by South Koreans for most mitigation methods is significantly higher than that by people in the U.S. Lastly, the regression results indicate that South Koreans (compared to people in the U.S.) and people with a stronger collectivist orientation tend to have higher acceptance for the control measures because they have lower privacy concerns and perceive greater social benefits for the measures. These findings advance our understanding of the important role of geographic context and culture as well as people’s experiences of the mitigation measures applied to control a previous pandemic. Full article
Show Figures

Figure 1

29 pages, 10604 KiB  
Article
Open Community-Based Crowdsourcing Geoportal for Earth Observation Products: A Model Design and Prototype Implementation
by Mohammad H. Vahidnia and Hossein Vahidi
ISPRS Int. J. Geo-Inf. 2021, 10(1), 24; https://doi.org/10.3390/ijgi10010024 - 12 Jan 2021
Cited by 10 | Viewed by 4591
Abstract
Over the past few decades, geoportals have been considered as the key technological solutions for easy access to Earth observation (EO) products, and the implementation of spatial data infrastructure (SDI). However, less attention has been paid to developing an efficient model for crowdsourcing [...] Read more.
Over the past few decades, geoportals have been considered as the key technological solutions for easy access to Earth observation (EO) products, and the implementation of spatial data infrastructure (SDI). However, less attention has been paid to developing an efficient model for crowdsourcing EO products through geoportals. To this end, a new model called the “Open Community-Based Crowdsourcing Geoportal for Earth Observation Products” (OCCGEOP) was proposed in this study. The model was developed based on the concepts of volunteered geographic information (VGI) and community-based geoportals using the latest open technological solutions. The key contribution lies in the conceptualization of the frameworks for automated publishing of standard map services such as the Web Map Service (WMS) and the Web Coverage Service (WCS) from heterogeneous EO products prepared by volunteers as well as the communication portion to request voluntary publication of the map services and giving feedback for quality assessment and assurance. To evaluate the feasibility and performance of the proposed model, a prototype implementation was carried out by conducting a pilot study in Iran. The results showed that the OCCGEOP is compatible with the priorities of the new generations of geoportals, having some unique features and promising performance. Full article
(This article belongs to the Special Issue Citizen Science and Geospatial Capacity Building)
Show Figures

Figure 1

20 pages, 5053 KiB  
Article
Deep Learning-Based Generation of Building Stock Data from Remote Sensing for Urban Heat Demand Modeling
by Michael Wurm, Ariane Droin, Thomas Stark, Christian Geiß, Wolfgang Sulzer and Hannes Taubenböck
ISPRS Int. J. Geo-Inf. 2021, 10(1), 23; https://doi.org/10.3390/ijgi10010023 - 12 Jan 2021
Cited by 35 | Viewed by 4058
Abstract
Cities are responsible for a large share of the global energy consumption. A third of the total greenhouse gas emissions are related to the buildings sector, making it an important target for reducing urban energy consumption. Detailed data on the building stock, including [...] Read more.
Cities are responsible for a large share of the global energy consumption. A third of the total greenhouse gas emissions are related to the buildings sector, making it an important target for reducing urban energy consumption. Detailed data on the building stock, including the thermal characteristics of individual buildings, such as the construction type, construction period, and building geometries, can strongly support decision-making for local authorities to help them spatially localize buildings with high potential for thermal renovations. In this paper, we present a workflow for deep learning-based building stock modeling using aerial images at a city scale for heat demand modeling. The extracted buildings are used for bottom-up modeling of the residential building heat demand based on construction type and construction period. The results for DL-building extraction exhibit F1-accuracies of 87%, and construction types yield an overall accuracy of 96%. The modeled heat demands display a high level of agreement of R2 0.82 compared with reference data. Finally, we analyze various refurbishment scenarios for construction periods and construction types, e.g., revealing that the targeted thermal renovation of multi-family houses constructed between the 1950s and 1970s accounts for about 47% of the total heat demand in a realistic refurbishment scenario. Full article
(This article belongs to the Special Issue Geodata Science and Spatial Analysis in Urban Studies)
Show Figures

Figure 1

20 pages, 9592 KiB  
Article
Residual Multi-Attention Classification Network for A Forest Dominated Tropical Landscape Using High-Resolution Remote Sensing Imagery
by Tong Yu, Wenjin Wu, Chen Gong and Xinwu Li
ISPRS Int. J. Geo-Inf. 2021, 10(1), 22; https://doi.org/10.3390/ijgi10010022 - 11 Jan 2021
Cited by 7 | Viewed by 2294
Abstract
Tropical forests are of vital importance for maintaining biodiversity, regulating climate and material cycles while facing deforestation, agricultural reclamation, and managing various pressures. Remote sensing (RS) can support effective monitoring and mapping approaches for tropical forests, and to facilitate this we propose a [...] Read more.
Tropical forests are of vital importance for maintaining biodiversity, regulating climate and material cycles while facing deforestation, agricultural reclamation, and managing various pressures. Remote sensing (RS) can support effective monitoring and mapping approaches for tropical forests, and to facilitate this we propose a deep neural network with an encoder–decoder architecture here to classify tropical forests and their environment. To deal with the complexity of tropical landscapes, this method utilizes a multi-scale convolution neural network (CNN) to expand the receptive field and extract multi-scale features. The model refines the features with several attention modules and fuses them through an upsampling module. A two-stage training strategy is proposed to alleviate misclassifications caused by sample imbalances. A joint loss function based on cross-entropy loss and the generalized Dice loss is applied in the first stage, and the second stage used the focal loss to fine-tune the weights. As a case study, we use Hainan tropical reserves to test the performance of this model. Compared with four state-of-the-art (SOTA) semantic segmentation networks, our network achieves the best performance with two Hainan datasets (mean intersection over union (MIoU) percentages of 85.78% and 82.85%). We also apply the new model to classify a public true color dataset which has 17 semantic classes and obtain results with an 83.75% MIoU. This further demonstrates the applicability and potential of this model in complex classification tasks. Full article
Show Figures

Figure 1

19 pages, 4827 KiB  
Article
Analysis of Differences in the Spatial Distribution among Terrestrial Mammals Using Geodetector—A Case Study of China
by Yao Chi, Tianlu Qian, Caiying Sheng, Changbai Xi and Jiechen Wang
ISPRS Int. J. Geo-Inf. 2021, 10(1), 21; https://doi.org/10.3390/ijgi10010021 - 09 Jan 2021
Cited by 10 | Viewed by 2553
Abstract
The survival and distribution of animals cannot be separated from a certain environment. How patterns in mammalian species depend on the environment remain unclear. This study incorporating spatial data on climate, precipitation, topography, and vegetation quantitatively analyzed the influence of specific geographical factors [...] Read more.
The survival and distribution of animals cannot be separated from a certain environment. How patterns in mammalian species depend on the environment remain unclear. This study incorporating spatial data on climate, precipitation, topography, and vegetation quantitatively analyzed the influence of specific geographical factors on the spatial distribution of terrestrial mammalian richness using the Geodetector model. We used the spatial analysis method of geographical information systems (GIS), separating the mammalian distribution of 621 species into 10 by 10 km grids to measure spatial richness. Our results showed that there were significant spatial differences in terrestrial mammalian richness in China. There was a low richness in the east and west, but high richness in the south. Individual factor detection results showed that annual precipitation (AP) and the minimum temperature of the coldest month (MTCM) were the dominant factors affecting the spatial pattern of mammal richness in China. Patterns in the distribution of species richness had distinct characteristics for different mammalian orders and were influenced by different environmental factors. The richness distribution of most orders was mainly affected by MTCM and AP. Interactive detection results showed that interacting factors in pairs play much bigger roles in the spatial distribution of species richness than individual factors. The synergistic effect of elevation with AP and MTCM best explained the distribution differences of species richness. We found that the Geodetector model is a valuable tool, hoping to be more widely used in biogeography. Full article
(This article belongs to the Special Issue Application of GIS for Biodiversity Research)
Show Figures

Figure 1

20 pages, 10533 KiB  
Article
A Tourist Attraction Recommendation Model Fusing Spatial, Temporal, and Visual Embeddings for Flickr-Geotagged Photos
by Shanshan Han, Cuiming Liu, Keyun Chen, Dawei Gui and Qingyun Du
ISPRS Int. J. Geo-Inf. 2021, 10(1), 20; https://doi.org/10.3390/ijgi10010020 - 08 Jan 2021
Cited by 12 | Viewed by 3367
Abstract
The rapid development of social media data, including geotagged photos, has benefited the research of tourism geography; additionally, tourists’ increasing demand for personalized travel has encouraged more researchers to pay attention to tourism recommendation models. However, few studies have comprehensively considered the content [...] Read more.
The rapid development of social media data, including geotagged photos, has benefited the research of tourism geography; additionally, tourists’ increasing demand for personalized travel has encouraged more researchers to pay attention to tourism recommendation models. However, few studies have comprehensively considered the content and contextual information that may influence the recommendation accuracy, especially tourist attractions’ visual content due to redundant and noisy geotagged photos; therefore, we propose a tourist attraction recommendation model for Flickr-geotagged photos which fuses spatial, temporal, and visual embeddings (STVE). After spatial clustering and extracting visual embeddings of tourist attractions’ representative images, the spatial and temporal embeddings are modeled with the Word2Vec negative sampling strategy, and the visual embeddings are fused with Matrix Factorization and Bayesian Personalized Ranking. The combination of these two parts comprises our proposed STVE model. The experimental results demonstrate that our STVE model outperforms other baseline models. We also analyzed the parameter sensitivity and component performance to prove the performance superiority of our model. Full article
(This article belongs to the Special Issue Geovisualization and Social Media)
Show Figures

Figure 1

18 pages, 5764 KiB  
Article
Determining Cover Management Factor with Remote Sensing and Spatial Analysis for Improving Long-Term Soil Loss Estimation in Watersheds
by Fuan Tsai, Jhe-Syuan Lai, Kieu Anh Nguyen and Walter Chen
ISPRS Int. J. Geo-Inf. 2021, 10(1), 19; https://doi.org/10.3390/ijgi10010019 - 06 Jan 2021
Cited by 11 | Viewed by 3638
Abstract
The universal soil loss equation (USLE) is a widely used empirical model for estimating soil loss. Among the USLE model factors, the cover management factor (C-factor) is a critical factor that substantially impacts the estimation result. Assigning C-factor values according to a land-use/land-cover [...] Read more.
The universal soil loss equation (USLE) is a widely used empirical model for estimating soil loss. Among the USLE model factors, the cover management factor (C-factor) is a critical factor that substantially impacts the estimation result. Assigning C-factor values according to a land-use/land-cover (LULC) map from field surveys is a typical traditional approach. However, this approach may have limitations caused by the difficulty and cost in conducting field surveys and updating the LULC map regularly, thus significantly affecting the feasibility of multi-temporal analysis of soil erosion. To address this issue, this study uses data mining to build a random forest (RF) model between eight geospatial factors and the C-factor for the Shihmen Reservoir watershed in northern Taiwan for multi-temporal estimation of soil loss. The eight geospatial factors were collected or derived from remotely sensed images taken in 2004, a digital elevation model, and related digital maps. Due to the memory size limitation of the R software, only 4% of the total data points (population dataset) in each C-factor class were selected as the sample dataset (input dataset) for analysis using the stratified random sampling method. Seventy percent of the input dataset was used to train the RF model, and the other 30% was used to test the model. The results show that the RF model could capture the trend of vegetation recovery and soil loss reduction after the destructive event of Typhoon Aere in 2004 for multi-temporal analysis. Although the RF model was biased by the majority class’s large sample size (C = 0.01 class), the estimated soil erosion rate was close to the measurement obtained by the erosion pins installed in the watershed (90.6 t/ha-year). After the model’s completion, we furthered our aim to address the input dataset’s imbalanced data problem to improve the model’s classification performance. An ad-hoc down-sampling of the majority class technique was used to reduce the majority class’s sampling rate to 2%, 1%, and 0.5% while keeping the other minority classes at a 4% sample rate. The results show an improvement of the Kappa coefficient from 0.574 to 0.732, the AUC from 0.780 to 0.891, and the true positive rate of all minority classes combined from 0.43 to 0.70. However, the overall accuracy decreases from 0.952 to 0.846, and the true positive rate of the majority class declines from 0.99 to 0.94. The best average C-factor was achieved when the sampling rate of the majority class was 1%. On the other hand, the best soil erosion estimate was obtained when the sampling rate was 2%. Full article
(This article belongs to the Special Issue Geospatial Artificial Intelligence)
Show Figures

Figure 1

15 pages, 5380 KiB  
Article
The Effect of Environmental Conditions on the Quality of UAS Orthophoto-Maps in the Coastal Environment
by Michaela Doukari, Stelios Katsanevakis, Nikolaos Soulakellis and Konstantinos Topouzelis
ISPRS Int. J. Geo-Inf. 2021, 10(1), 18; https://doi.org/10.3390/ijgi10010018 - 06 Jan 2021
Cited by 8 | Viewed by 3068
Abstract
Marine conservation and management require detailed and accurate habitat mapping, which is usually produced by collecting data using remote sensing methods. In recent years, unmanned aerial systems (UAS) are used for marine data acquisition, as they provide detailed and reliable information through very [...] Read more.
Marine conservation and management require detailed and accurate habitat mapping, which is usually produced by collecting data using remote sensing methods. In recent years, unmanned aerial systems (UAS) are used for marine data acquisition, as they provide detailed and reliable information through very high-resolution orthophoto-maps. However, as for all remotely sensed data, it is important to study and understand the accuracy and reliability of the produced maps. In this study, the effect of different environmental conditions on the quality of UAS orthophoto-maps was examined through a positional and thematic accuracy assessment. Selected objects on the orthophoto-maps were also assessed as to their position, shape, and extent. The accuracy assessment results showed significant errors in the different maps and objects. The accuracy of the classified images varied between 2.1% and 27%. Seagrasses were under-classified, while the mixed substrate class was overclassified when environmental conditions were not optimal. The highest misclassifications were caused due to sunglint presence in combination with a rough sea-surface. A change detection workflow resulted in detecting misclassifications of up to 45%, on orthophoto-maps that had been generated under non-optimal environmental conditions. The results confirmed the importance of optimal conditions for the acquisition of reliable marine information using UAS. Full article
Show Figures

Figure 1

22 pages, 52790 KiB  
Article
Reconstruction of Multi-Temporal Satellite Imagery by Coupling Variational Segmentation and Radiometric Analysis
by Nicola Case and Alfonso Vitti
ISPRS Int. J. Geo-Inf. 2021, 10(1), 17; https://doi.org/10.3390/ijgi10010017 - 06 Jan 2021
Cited by 2 | Viewed by 2240
Abstract
Digital images, and in particular satellite images acquired by different sensors, may present defects due to many causes. Since 2013, the Landsat 7 mission has been affected by a well-known issue related to the malfunctioning of the Scan Line Corrector producing very characteristic [...] Read more.
Digital images, and in particular satellite images acquired by different sensors, may present defects due to many causes. Since 2013, the Landsat 7 mission has been affected by a well-known issue related to the malfunctioning of the Scan Line Corrector producing very characteristic strips of missing data in the imagery bands. Within the vast and interdisciplinary image reconstruction application field, many works have been presented in the last few decades to tackle the specific Landsat 7 gap-filling problem. This work proposes another contribution in this field presenting an original procedure based on a variational image segmentation model coupled with radiometric analysis to reconstruct damaged images acquired in a multi-temporal scenario, typical in satellite remote sensing. The key idea is to exploit some specific features of the Mumford–Shah variational model for image segmentation in order to ease the detection of homogeneous regions which will then be used to form a set of coherent data necessary for the radiometric reconstruction of damaged regions. Two reconstruction approaches are presented and applied to SLC-off Landsat 7 data. One approach is based on the well-known histogram matching transformation, the other approach is based on eigendecomposition of the bands covariance matrix and on the sampling from Gaussian distributions. The performance of the procedure is assessed by application to artificially damaged images for self-validation testing. Both of the proposed reconstruction approaches had led to remarkable results. An application to very high resolution WorldView-3 data shows how the procedure based on variational segmentation allows an effective reconstruction of images presenting a great level of geometric complexity. Full article
Show Figures

Figure 1

32 pages, 11039 KiB  
Article
Simulation of the Urban Jobs–Housing Location Selection and Spatial Relationship Using a Multi-Agent Approach
by Huihui Wang, Weihua Zeng and Ruoxin Cao
ISPRS Int. J. Geo-Inf. 2021, 10(1), 16; https://doi.org/10.3390/ijgi10010016 - 06 Jan 2021
Cited by 11 | Viewed by 3051
Abstract
The jobs–housing balance concerns the spatial relationship between the number of jobs and housing units within a given geographical area. Due to the separation of jobs and housing, spatial dislocations have occurred in large cities, which have resulted in a significant increase in [...] Read more.
The jobs–housing balance concerns the spatial relationship between the number of jobs and housing units within a given geographical area. Due to the separation of jobs and housing, spatial dislocations have occurred in large cities, which have resulted in a significant increase in commuting distance and time. These changes have ultimately led to an increase in pressure on urban traffic, and the formation of tidal traffic. In this study we introduce a multi-agent approach to examine the jobs–housing relationship under the maximum location utility of agents. The jobs/housing ratio measures the balance of the of jobs–housing relationship, as well as comparing and analyzing jobs–housing separation in Beijing by district, county, and street scales. An agent-based model was proposed to simulate spatial location selection behavior of agents by considering environmental and economical influences on residential decisions of individuals. Results show that the jobs–housing relationship imbalance in Beijing has been mainly aggravated due to rapid population growth in the 6th Ring Road. An imbalance in the jobs–housing relationship has arisen due to a mismatch with the number of households available compared to the number of jobs; the surrounding urban areas cannot provide the required volume of housing to accommodate the increase in workers. Six sets of experiments were established to examine resident agents and enterprise agents. Differences in resident agents’ income level had a greater impact on residential location decision-making, and housing price was the primary factor affecting the decision of residents to choose their residential location. The spatial distribution of jobs and housing in Beijing under the maximization of micro-agent location utility was obtained in this study. Results indicated that the imbalance in the jobs¬-housing relationship in central Beijing has improved and, compared with the initial distributions, the number of jobs–housing balance areas in Beijing has increased. Full article
Show Figures

Figure 1

23 pages, 4722 KiB  
Article
A Refined Lines/Regions and Lines/Lines Topological Relations Model Based on Whole-Whole Objects Intersection Components
by Xiaoguang Zhou, Hongyuan He, Dongyang Hou, Rui Li and Heng Zheng
ISPRS Int. J. Geo-Inf. 2021, 10(1), 15; https://doi.org/10.3390/ijgi10010015 - 06 Jan 2021
Cited by 4 | Viewed by 2229
Abstract
Refined topological relations play an important role in spatial database quality control. Currently, there is no unified and reasonable method to represent refined line/region and line/line topological relations in two-dimensional (2D) space. In addition, the existing independent line/region and line/line models have some [...] Read more.
Refined topological relations play an important role in spatial database quality control. Currently, there is no unified and reasonable method to represent refined line/region and line/line topological relations in two-dimensional (2D) space. In addition, the existing independent line/region and line/line models have some drawbacks such as incomplete type discrimination and too many topological invariants. In this paper, a refined line/region and line/line topological relations are represented uniformly by the sequence, dimension, and topological type of the intersection components. To make the relevant definitions conform to the traditional cognitions in 2D Euclidean space, the (simple) spatial object is defined based on manifold topology, and the spatial intersection components are defined based on the whole-whole object intersection set. Then the topological invariant of node degree is introduced, and the adjacent point kinds (e.g., “Null”, “On”, “In”, and “Out”) are defined to distinguish the intersection component types. Excluding impossible and symmetrical types, 29 types of intersection-lines (including 21 between lines/regions and 8 between lines/lines), and 6 types of intersection-points (including 2 between lines/regions and 4 between lines/lines) are classified. On this basis, a node degree-based whole-whole object intersection sets (N-WWIS) model for refined line/region and line/line topological relations is presented, and it can be combined with the Euler number-based whole object intersection and difference (E-WID) model (coarse level) to form a hierarchical representation method of topological relations. Furthermore, a prototype system based on the N-WWIS model for automatic topological integrity checking is developed and some evaluation experiments are conducted with OpenStreetMap (OSM) data is presented based on the classification of intersection components. The experimental results show that the N-WWIS model will enable the geographic information systems (GIS) community to develop automated topological conflict checking and dealing tools for spatial data updates and quality control. Full article
(This article belongs to the Special Issue Geodata Science and Spatial Analysis in Urban Studies)
Show Figures

Figure 1

30 pages, 4737 KiB  
Article
Understanding the Correlation between Landscape Pattern and Vertical Urban Volume by Time-Series Remote Sensing Data: A Case Study of Melbourne
by Mengyu Ge, Shenghui Fang, Yan Gong, Pengjie Tao, Guang Yang and Wenbing Gong
ISPRS Int. J. Geo-Inf. 2021, 10(1), 14; https://doi.org/10.3390/ijgi10010014 - 05 Jan 2021
Cited by 10 | Viewed by 2790
Abstract
Urbanization is changing the world’s surface pattern more and more drastically, which brings many social and ecological problems. Quantifying the changes in the landscape pattern and 3D structure of the city is important to understand these issues. This research study used Melbourne, a [...] Read more.
Urbanization is changing the world’s surface pattern more and more drastically, which brings many social and ecological problems. Quantifying the changes in the landscape pattern and 3D structure of the city is important to understand these issues. This research study used Melbourne, a compact city, as a case study, and focused on landscape patterns and vertical urban volume (volume mean (VM), volume standard deviation (VSD)) and investigate the correlation between them from the scope of different scales and functions by Remote Sensing (RS) and Geographic Information System (GIS) techniques. We found: (1) From 2000 to 2012, the landscape pattern had a trend of decreasing fragmentation and increasing patch aggregation. The growth of VM and VSD was more severe than that of landscape metrics, and presented a “high–low” situation from the city center to the surroundings, maintaining the structure of “large east and small west”. (2) Landscape pattern was found closely associated with the urban volume. In the entire study area, landscape pattern patches with low fragmentation and high aggregation were directly proportional to VM with high value, which represented high urbanization, and patches with high connectivity and fragmentation had a positive relationship with high VSD, which represented strong spatial recognition. (3) The urban volumes of different urban functional areas were affected by different landscape patterns, and the analysis based on the local development situation can explain the internal mechanism of the interaction between the landscape pattern and the urban volume. Full article
Show Figures

Figure 1

17 pages, 1933 KiB  
Review
A Review of Human Mobility Research Based on Big Data and Its Implication for Smart City Development
by Anqi Wang, Anshu Zhang, Edwin H. W. Chan, Wenzhong Shi, Xiaolin Zhou and Zhewei Liu
ISPRS Int. J. Geo-Inf. 2021, 10(1), 13; https://doi.org/10.3390/ijgi10010013 - 31 Dec 2020
Cited by 39 | Viewed by 7400
Abstract
Along with the increase of big data and the advancement of technologies, comprehensive data-driven knowledge of urban systems is becoming more attainable, yet the connection between big-data research and its application e.g., in smart city development, is not clearly articulated. Focusing on Human [...] Read more.
Along with the increase of big data and the advancement of technologies, comprehensive data-driven knowledge of urban systems is becoming more attainable, yet the connection between big-data research and its application e.g., in smart city development, is not clearly articulated. Focusing on Human Mobility, one of the most frequently investigated applications of big data analytics, a framework for linking international academic research and city-level management policy was established and applied to the case of Hong Kong. Literature regarding human mobility research using big data are reviewed. These studies contribute to (1) discovering the spatial-temporal phenomenon, (2) identifying the difference in human behaviour or spatial attributes, (3) explaining the dynamic of mobility, and (4) applying to city management. Then, the application of the research to smart city development are scrutinised based on email queries to various governmental departments in Hong Kong. The identified challenges include data isolation, data unavailability, gaming between costs and quality of data, limited knowledge derived from rich data, as well as estrangement between public and private sectors. With further improvement in the practical value of data analytics and the utilization of data sourced from multiple sectors, paths to achieve smarter cities from policymaking perspectives are highlighted. Full article
Show Figures

Figure 1

Previous Issue
Next Issue
Back to TopTop