


Abstract
Rosin- and castor-oil-derived resins provide a renewable platform for rapidly curable protective coatings, but the effects of formulation and curing route remain insufficiently resolved. Four composite formulations containing modified rosin glycerol ester (MRGE) and modified castor oil anhydride (MCOA) were cured thermally using ultraviolet irradiation or electron beam (EB) irradiation. Surface C=C conversion, thermal behavior, morphology, mechanical properties, neutral salt spray resistance, electrochemical barrier performance, and AC dielectric breakdown strength were evaluated. Among the formulations tested, F2 (MRGE/MCOA = 3:1) showed the best overall property balance under each curing route. For F2, EB curing produced a surface C=C conversion of 92 ± 2%, a glass transition temperature of 88 ± 1 °C, an 800 °C residue of 12.5 ± 0.3%, and an atomic force microscope (AFM) roughness Ra of 5.8 ± 0.5 nm. F2-EB exhibited 9H pencil hardness, 5B adhesion, an impact resistance of 55 ± 2 cm·kg, and a flexibility value of 1.0 ± 0.1 mm. After 500 h of neutral salt spray, both F2-EB and F2-UV achieved a protection rating of 10 with no measurable corrosion creep at the scribe; time-resolved photographs at 100, 300, and 500 h confirmed that F2-EB showed the least visible damage evolution among the three curing routes. After 1 day of immersion in 3.5 wt% NaCl, F2-EB exhibited the largest low-frequency impedance and the lowest fitted corrosion current density among the EB-cured formulations, indicating the strongest short-term electrolyte barrier behavior. The AC dielectric breakdown strength of F2-EB reached 21.5 ± 0.3 kV mm−1. The combined results are consistent with more extensive EB-induced network formation, although direct measurements of through-thickness conversion and crosslink density are still required. These findings demonstrate the potential of EB curing for rapidly preparing rosin/castor-oil-derived protective coatings for electrical insulation applications.
1. Introduction
Reliable insulation and surface protection are essential for the safe operation of large rotating electrical machines. During service, winding and core components may experience elevated temperature, electrical stress, vibration, moisture, and contamination. Degradation of protective or insulating layers can promote interfacial damage and ultimately increase the risk of electrical failure [1,2]. Epoxy resins and mica-based insulating materials, though technologically mature, offer limited room for further performance gains. In addition, their reliance on fossil feedstocks, the VOCs emissions of 300–600 g/L typical of solvent-borne formulations, and the energy-intensive thermal curing cycles lasting tens of hours are at odds with sustainability goals [3,4].
Bio-based polymers derived from renewable resources such as rosin and castor oil have attracted interest [5,6,7,8]. The hydrogenated phenanthrene skeleton of rosin imparts hardness and adhesion, while the long aliphatic chains of castor oil contribute flexibility and crosslinking activity [9,10,11]. By introducing unsaturated double bonds and reactive carboxyl/hydroxyl groups through chemical modification, a bio-based network that integrates rigid segments with flexible linkages can be constructed, making rosin–castor oil systems attractive candidates for replacing petroleum-derived insulating coatings.
Radiation curing has gained traction in the coatings industry because it offers curing within seconds, room temperature operation, and zero VOC emissions [12,13,14]. Electron beam (EB) curing employs high-energy electrons that penetrate the resin and generate a high instantaneous concentration of radicals throughout the film depth without requiring photoinitiators, achieving rapid and uniform crosslinking. This makes EB particularly suitable for thick films and pigmented systems [15,16,17]. Recent studies of UV-curable coatings have shown that curing efficiency and network formation depend on irradiation conditions, photoinitiator selection, and reactive modifier design [18,19,20]. Recent EB-enabled coating studies have demonstrated tunable surface wettability and ultrafast curing of PDMS-based coatings, respectively [21,22]. At larger processing scales, beam uniformity control of EB accelerators is also relevant to irradiation process control [23]. Compared with UV curing, EB radiation can penetrate beyond 100 μm, avoiding the “surface over-cure, bottom under-cure” gradient inherent to UV-triggered processes [24]. However, the effect of the resin-to-curing-agent ratio on crosslinking behavior and final coating properties remains insufficiently understood.
Patent literature further shows that rosin-based resins have been formulated for radiation-curable coatings (US 5,212,213 A), rosin-modified epoxy acrylates have been proposed as UV/EB-curable binders (WO 2001/038446 A1), and epoxidized vegetable oil oligomers have been used in radiation-curable direct-to-metal coatings (EP 2,152,796 B1). Radiation-curable aqueous polyurethane dispersions incorporating castor/soy-oil transesterification products have also been disclosed (US 9,676,894 B2). These patents demonstrate the broader industrial interest in renewable radiation-curable binders, while leaving room for systematic comparison of MRGE/MCOA ratios and curing routes for combined mechanical, corrosion barrier, and electrical performance.
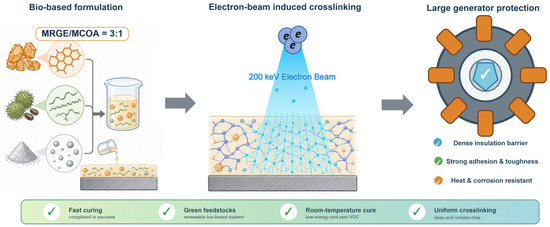
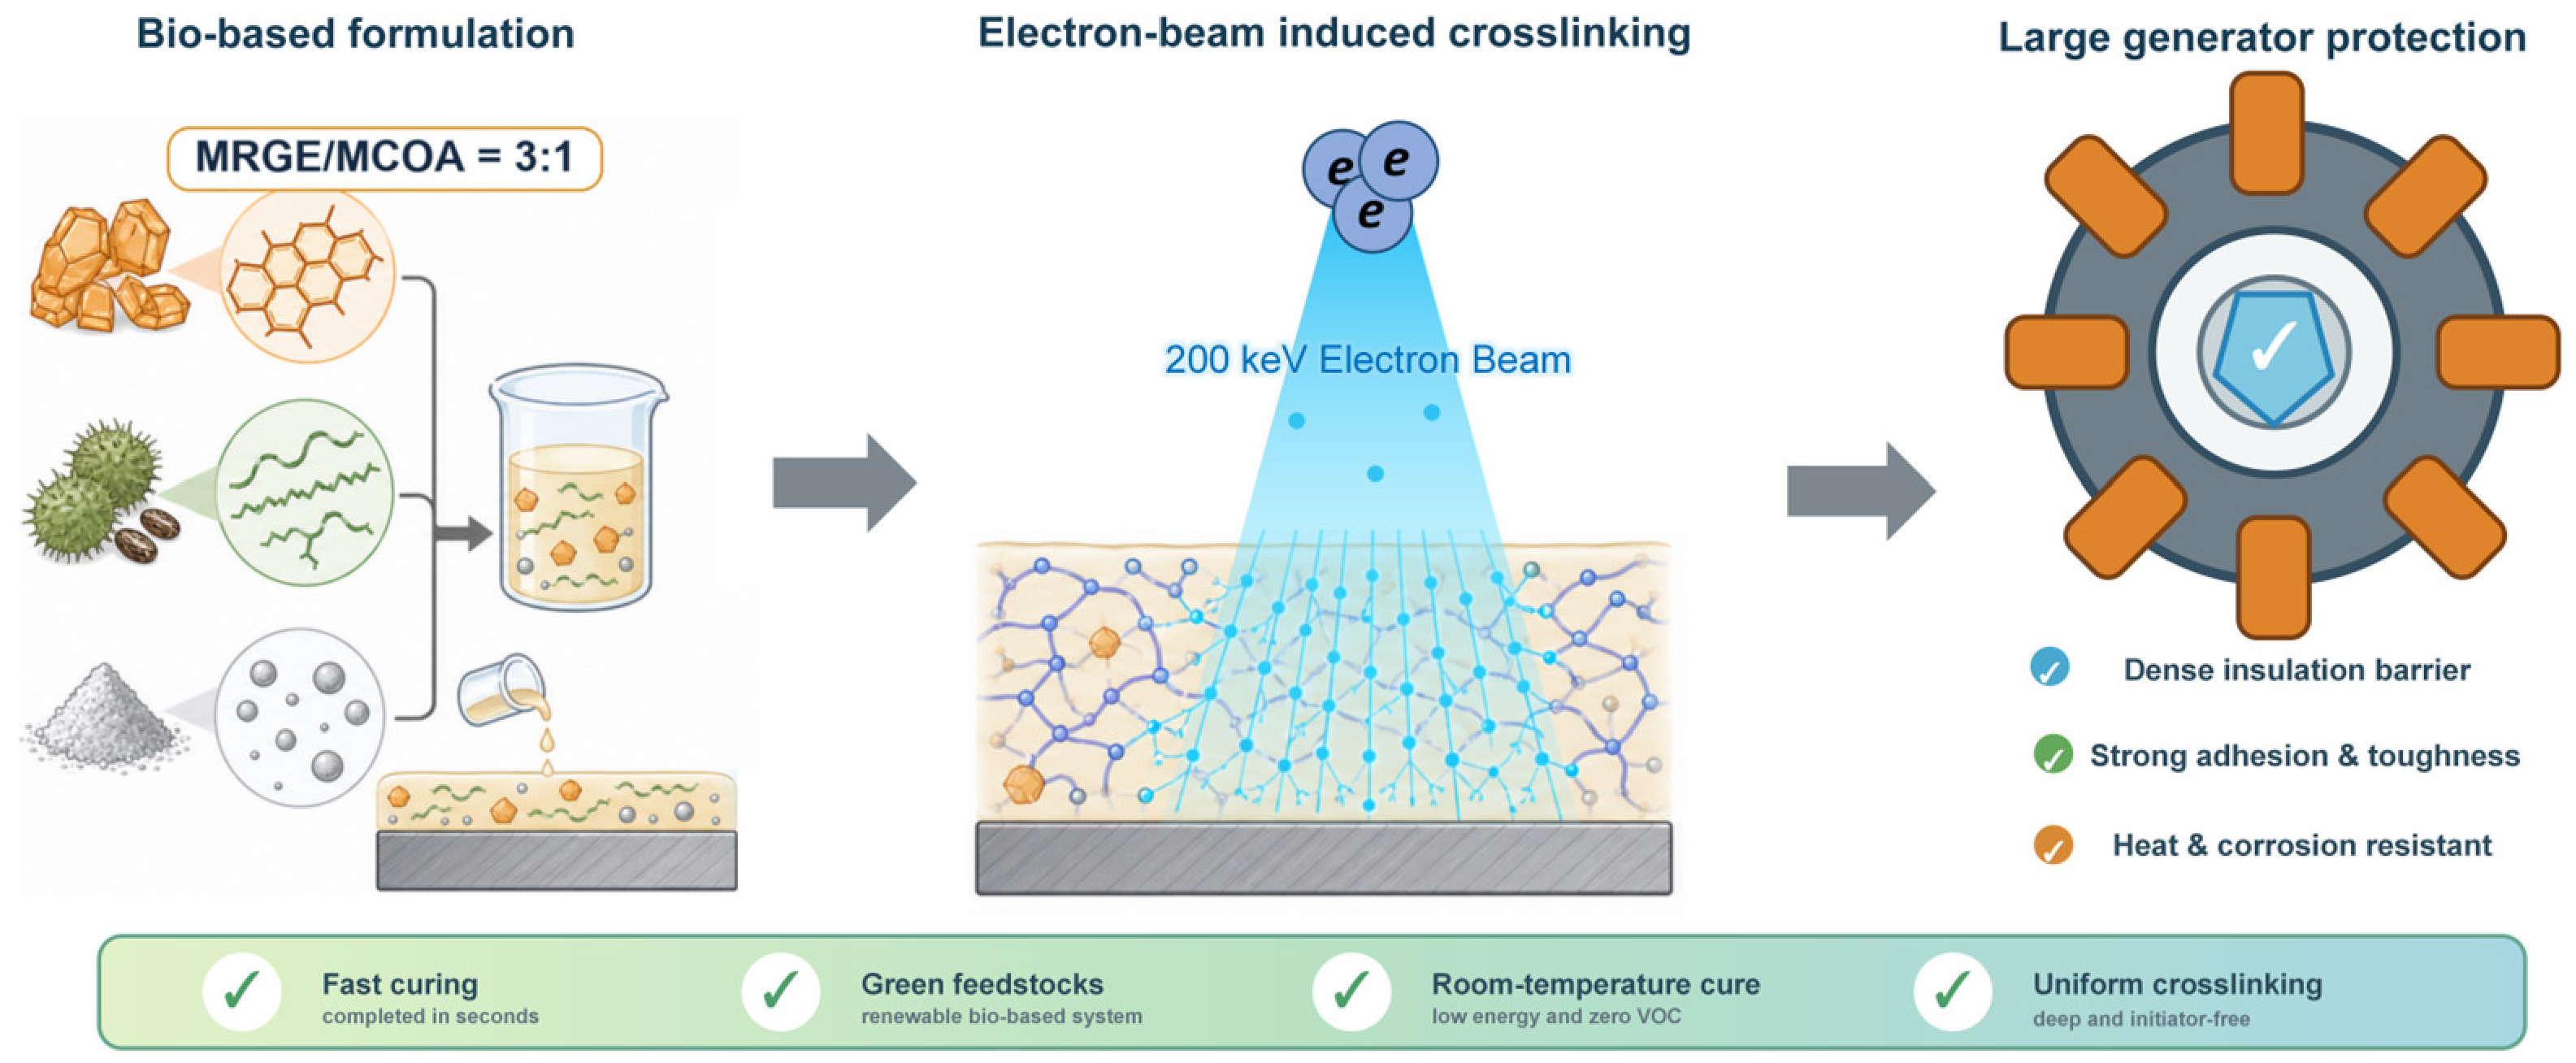
In this work, MRGE was used as the matrix resin and MCOA as the bio-based curing agent to prepare four formulations with different MRGE/MCOA mass ratios: 2:1 (F1), 3:1 (F2), 4:1 (F3), and 2.6:1 (F4)—the latter being the stoichiometric ratio derived from the carboxyl equivalent of MCOA and the hydroxyl equivalent of MRGE. Each formulation was cured using thermal, UV, and EB methods, and the crosslinking behavior and coating performance were examined through Fourier transform infrared spectroscopy (FTIR), thermogravimetric–differential scanning calorimetry (TG-DSC), AFM, and mechanical and corrosion tests. The best formulation was first identified within each curing method, and the three curing methods were then compared head-to-head on that formulation. The results highlight the potential advantages of EB curing in terms of crosslinking efficiency, mechanical integrity, and corrosion protection. Figure 1 schematically illustrates the bio-based MRGE/MCOA coating system and its electron-beam curing route for large thermal power generator protection.
Figure 1.
Schematic of the bio-based F2 coating (MRGE/MCOA = 3:1) and its electron beam curing for large thermal power generator protection.
2. Experimental Section
2.1. Raw Materials
Modified rosin glycerol ester (MRGE, acid value ≤ 8 mg KOH/g, softening point 95–105 °C, Aladdin, Shanghai, China); modified castor oil anhydride (MCOA, acid value ≥ 180 mg KOH/g, viscosity 800–1200 mPa·s, laboratory-synthesized); bio-based 1,3-propanediol (purity ≥ 99.5%, DuPont Tate & Lyle, Loudon, TN, USA); nano-titanium dioxide (TiO2, rutile type, average particle size 25 nm, specific surface area 45 m2/g, Aladdin, Shanghai, China); zinc phosphate (Zn3(PO4)2·2H2O, analytical grade, Sinopharm Chemical Reagent Co., Ltd., Shanghai, China); hydroxyethyl cellulose (HEC, viscosity 3000–5000 mPa·s, 2% aqueous solution, Aladdin, Shanghai, China); ammonium lauryl sulfate (ALS, active content 28%, Aladdin, Shanghai, China); polyoxyethylene (20) sorbitan monolaurate (Tween-20, chemically pure, Aladdin, Shanghai, China). All materials were used as received without further purification.
2.2. Coating Formulation Design
Four formulations (F1–F4) were designed with MRGE/MCOA mass ratios of 2:1, 3:1, 4:1, and 2.6:1, respectively. The 2.6:1 ratio represents the theoretical stoichiometric equivalence point, where the molar quantities of reactive carboxyl groups (from MCOA, acid value ≥ 180 mg KOH/g) and hydroxyl groups (from MRGE) are balanced. This stoichiometric balance, however, pertains to the esterification reaction between —COOH and —OH; under EB and UV curing, radical addition polymerization of C=C double bonds is the dominant crosslinking pathway, and the optimal monomer ratio for a radical-polymerized network may well differ from that prescribed by condensation stoichiometry. The functional filler content (nano-TiO2 + zinc phosphate) was held at 9–12 wt% in all formulations; rheology modifiers, stabilizers, and surfactants were adjusted to keep the application viscosity at 80–100 cP. Detailed compositions are given in Table 1.
Table 1.
Composition of the four coating formulations (F1–F4).
2.3. Coating Preparation
The coatings were prepared through a combined process of high-speed dispersion and sand milling. According to the formulations listed in Table 1, MRGE and bio-based 1,3-propanediol were accurately weighed and placed in a stainless steel dispersion tank. Pre-mixing proceeded at 25 °C under high-speed stirring at 1500 r/min for 8 min to obtain a clear and homogeneous pre-mix solution. Nano-TiO2 was then added in batches to the pre-mix and dispersed under high-shear conditions at 2500 r/min for 15 min using a high-speed disperser (Model SFJ-400, Shanghai Modern Environment Engineering Technology Co., Ltd., Shanghai, China). The dispersion was subsequently transferred to a horizontal sand mill (grinding media: 0.3–0.5 mm zirconia beads) and circulated for 30 min, with the grinding endpoint monitored using a Hegman gauge to ensure a fineness of ≤10 μm. The ground slurry was transferred to a low-speed stirring vessel (400 r/min), and MCOA, zinc phosphate, and HEC were added sequentially with continuous stirring until the system became uniform. After the addition of ALS, Tween-20 was added dropwise in portions while the viscosity was monitored in real time using a rotational viscometer (Model NDJ-8S, Shanghai Pingxuan Scientific Instrument Co., Ltd., Shanghai, China). The application viscosity was finally controlled within 80–100 cP (25 °C, No. 4 rotor, 60 r/min). The obtained coatings were filtered through a 200-mesh sieve and stored in sealed containers protected from light.
2.4. Coating Application and Sample Nomenclature
The coatings were applied using an RDS 44# wire-wound rod with a wet film setting of 80–100 μm. After curing and conditioning at 23 °C and 50% RH for 24 h, dry film thickness was measured at multiple central positions on the Q235 panels using a calibrated magnetic induction coating thickness gauge; edge and scribed regions were excluded. The F2 coatings had initial dry film thicknesses of 29–34 μm, corresponding to 32.2%–37.8% of the nominal 90 μm wet film midpoint. The measured local thickness was used for the dielectric breakdown strength calculation.
Q235 cold-rolled steel panels (150 mm × 70 mm × 1.5 mm) were selected as substrates. The panels were degreased (acetone, ultrasonic, 10 min), phosphated (zinc-based solution, 60 °C, 5 min), rinsed with deionized water, and dried with compressed air. The coatings were uniformly applied onto the substrates using a wire-wound rod coater (RDS 44#, R.D. Specialties, Webster, NY, USA) with a wet film thickness of 80–100 μm. After room temperature flash-off for 5 min, the coated panels were subjected to three different curing treatments:
Thermal curing (TC): coated panels were placed in a forced-air constant-temperature drying oven (Model DHG-9240A, Shanghai Yiheng Scientific Instrument Co., Ltd., Shanghai, China) and cured at 80 °C for 40 h.
Ultraviolet curing (UV): curing was performed using a UV curing machine (Model RW-UVA201-20, Shenzhen Runwo Electromechanical Co., Ltd., Shenzhen, China) with a main wavelength of 365 nm, irradiation power of 10 mW/cm2, irradiation time of 2 min, and a light source distance of 10 cm from the coating surface.
Electron beam curing (EB): curing used a self-shielded electron beam accelerator (Model EBLab-200, Comet, Flamatt, Switzerland) at 200 kV, 10 mA, 100 kGy, conveyor speed 5 m/min, under nitrogen (O2 ≤ 50 ppm); curing was complete in a single pass.
Samples are designated by formulation code (F1–F4) followed by a hyphen and the curing method abbreviation (T = thermal curing, UV = ultraviolet curing, EB = electron beam curing); for example, F2-EB denotes the F2 formulation cured using EB. Each of the four formulations was processed by all three curing methods, yielding 12 experimental groups, with three replicate panels per group. After curing, all panels were conditioned at 23 °C and 50% RH for 24 h before testing.
2.5. Testing and Characterization
2.5.1. Fourier Transform Infrared Spectroscopy (FTIR)
A Thermo Scientific Nicolet iS20 FTIR spectrometer (Thermo Fisher Scientific, Waltham, MA, USA) with an attenuated total reflectance (ATR) accessory (diamond crystal) was used. The scanning range was 4000–400 cm−1, the resolution was 4 cm−1, and 32 scans were accumulated. Infrared spectra of both the liquid coating and the cured coating surface were collected. The C=C double bond conversion was quantitatively calculated from the integrated area change in the characteristic C=C stretching peak at 1640 cm−1, with the ester carbonyl peak at 1735 cm−1 serving as the internal standard for normalization.
2.5.2. Thermogravimetric–Differential Scanning Calorimetry (TG-DSC)
A PerkinElmer STA 6000 simultaneous thermal analyzer (PerkinElmer, Waltham, MA, USA) was used under nitrogen atmosphere (flow rate 50 mL/min) at a heating rate of 10 °C/min over the temperature range of 30–800 °C. Coating-free film samples of 8–12 mg were placed in alumina crucibles. Thermogravimetric (TG), derivative thermogravimetric (DTG), and differential scanning calorimetry (DSC) signals were recorded simultaneously. Thermal stability was assessed from the 5% and 50% mass loss temperatures (T5% and T50%), char yield from the residual mass at 800 °C (R800), and Tg from the DSC inflection point.
2.5.3. Scanning Electron Microscopy (SEM)
A TESCAN MIRA LMS field emission scanning electron microscope (TESCAN, Brno, Czech Republic) was used to observe the surface micro-morphology of the coating samples. Cured coating panels were cut into 5 mm × 5 mm pieces and mounted on aluminum sample stubs using conductive adhesive. To eliminate charging effects from the organic coating, the sample surfaces were sputter-coated with gold (gold layer thickness approximately 10 nm). Surface cracks, pores, and filler dispersion were examined across all formulations and curing conditions.
2.5.4. Atomic Force Microscopy (AFM)
A Bruker Dimension Icon atomic force microscope (Bruker, Billerica, MA, USA) was operated in PeakForce Tapping mode using RTESPA-300 scanning probes (spring constant 40 N/m, resonant frequency 300 kHz, Bruker, Billerica, MA, USA). The scan range was 20 μm × 20 μm at a scan rate of 0.5 Hz. NanoScope Analysis 2.0 software was used to process the topography and phase images. Three random regions were scanned on each sample surface, and the arithmetic mean roughness (Ra), root mean square roughness (Rq), and maximum peak-to-valley height (Rmax) were calculated.
2.5.5. Mechanical Properties Testing
Pencil hardness was measured according to GB/T 6739-2006 using a portable pencil hardness tester (Model BYK 5800, BYK-Gardner, Geretsried, Germany) with pencil hardness grades ranging from 6B to 9H and a load of 750 g. The highest hardness grade that did not scratch the coating surface was recorded as the test result. Each sample was tested at five different positions.
Adhesion was evaluated according to ASTM D3359-17 Method B (cross-cut tape test) using a cross-cut cutter with 1 mm blade spacing (Model QFH-HG600) in combination with 3M 610 pressure-sensitive adhesive tape. The adhesion grade was rated according to the percentage of coating detachment area (0B–5B, with 5B being optimal). Each sample was tested three times.
Impact resistance was measured according to GB/T 1732-2020 using a QCJ-type film impact tester (Tianjin Shibo Weiye Instrument Co., Ltd., Tianjin, China) with an impact head diameter of 8 mm and a hammer mass of 1000 g. The result was expressed as the product of the maximum impact height and mass (cm·kg) at which the coating showed no cracking or peeling. Each sample was tested at five different positions.
Flexibility was measured according to GB/T 1731-2020 using a QTY-32 type cylindrical bending tester for paint films. The result was expressed as the minimum mandrel diameter (mm) at which the coating did not crack or flake. Each sample was tested three times.
Gel content and equilibrium swelling were measured on free films peeled from the coated panels. Free films were vacuum-dried at 60 °C for 24 h and weighed (m0), immersed in 30 mL tetrahydrofuran at 25 °C for 48 h with solvent renewal after 24 h, blotted and weighed in the swollen state (ms), and vacuum-dried to constant mass (md). The procedure was adapted from ASTM D2765-16(2024). Because TiO2 and zinc phosphate are non-extractable, gel content and swelling of the polymer fraction were corrected using the known filler mass fraction. Three independently prepared films were tested for each curing route.
AC dielectric breakdown strength was measured as an initial electrical insulation indicator. The procedure was adapted from IEC 60243-1:2013 and ASTM D149-25. After conditioning, the local dry film thickness was measured, a 6 mm spherical brass electrode was placed on the coating surface, and the steel substrate served as the plane counter-electrode. The electrode region was immersed in transformer oil to suppress surface flashover. A 50 Hz AC voltage was increased at 0.5 kV/s using a BDJC-50 kV dielectric breakdown tester (Beijing North Guang Precision Instruments, Beijing, China) until puncture. Breakdown strength was calculated as the breakdown voltage divided by the local film thickness. Five positions were tested per panel and three independently prepared panels were evaluated for each curing route.
2.5.6. Anti-Corrosion Performance Testing
Neutral salt spray testing was performed according to GB/T 1771-2007 using 5 wt% NaCl at pH 6.5–7.2 and 35 °C, with a deposition rate of 1–2 mL/(80 cm2·h). Surface appearance was recorded at 100, 300, and 500 h; the 500 h protection grade and corrosion creep width were evaluated according to GB/T 6464-2002. For electrochemical testing, the coated Q235 panel was used as the working electrode with a 1.00 cm2 exposed area, a platinum sheet as the counter electrode, and a saturated calomel electrode as the reference. After 24 h immersion and 30 min stabilization at open-circuit potential, Electrochemical impedance spectroscopy (EIS) spectra were collected from 105 to 10−2 Hz using a 10 mV rms perturbation. The spectra were fitted with Rs–(Qc||Rc)–(Qdl||Rct), consistent with the two resolved time constants. EIS was followed by polarization from −280 to +280 mV relative to OCP at 1 mV/s; the linear anodic and cathodic regions were extrapolated to obtain Ecorr and icorr.
3. Results and Discussion
3.1. FTIR Analysis and Crosslinking Mechanism
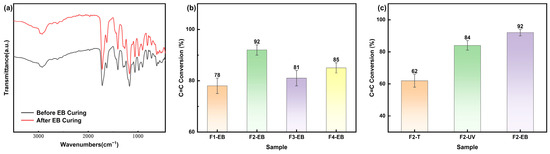
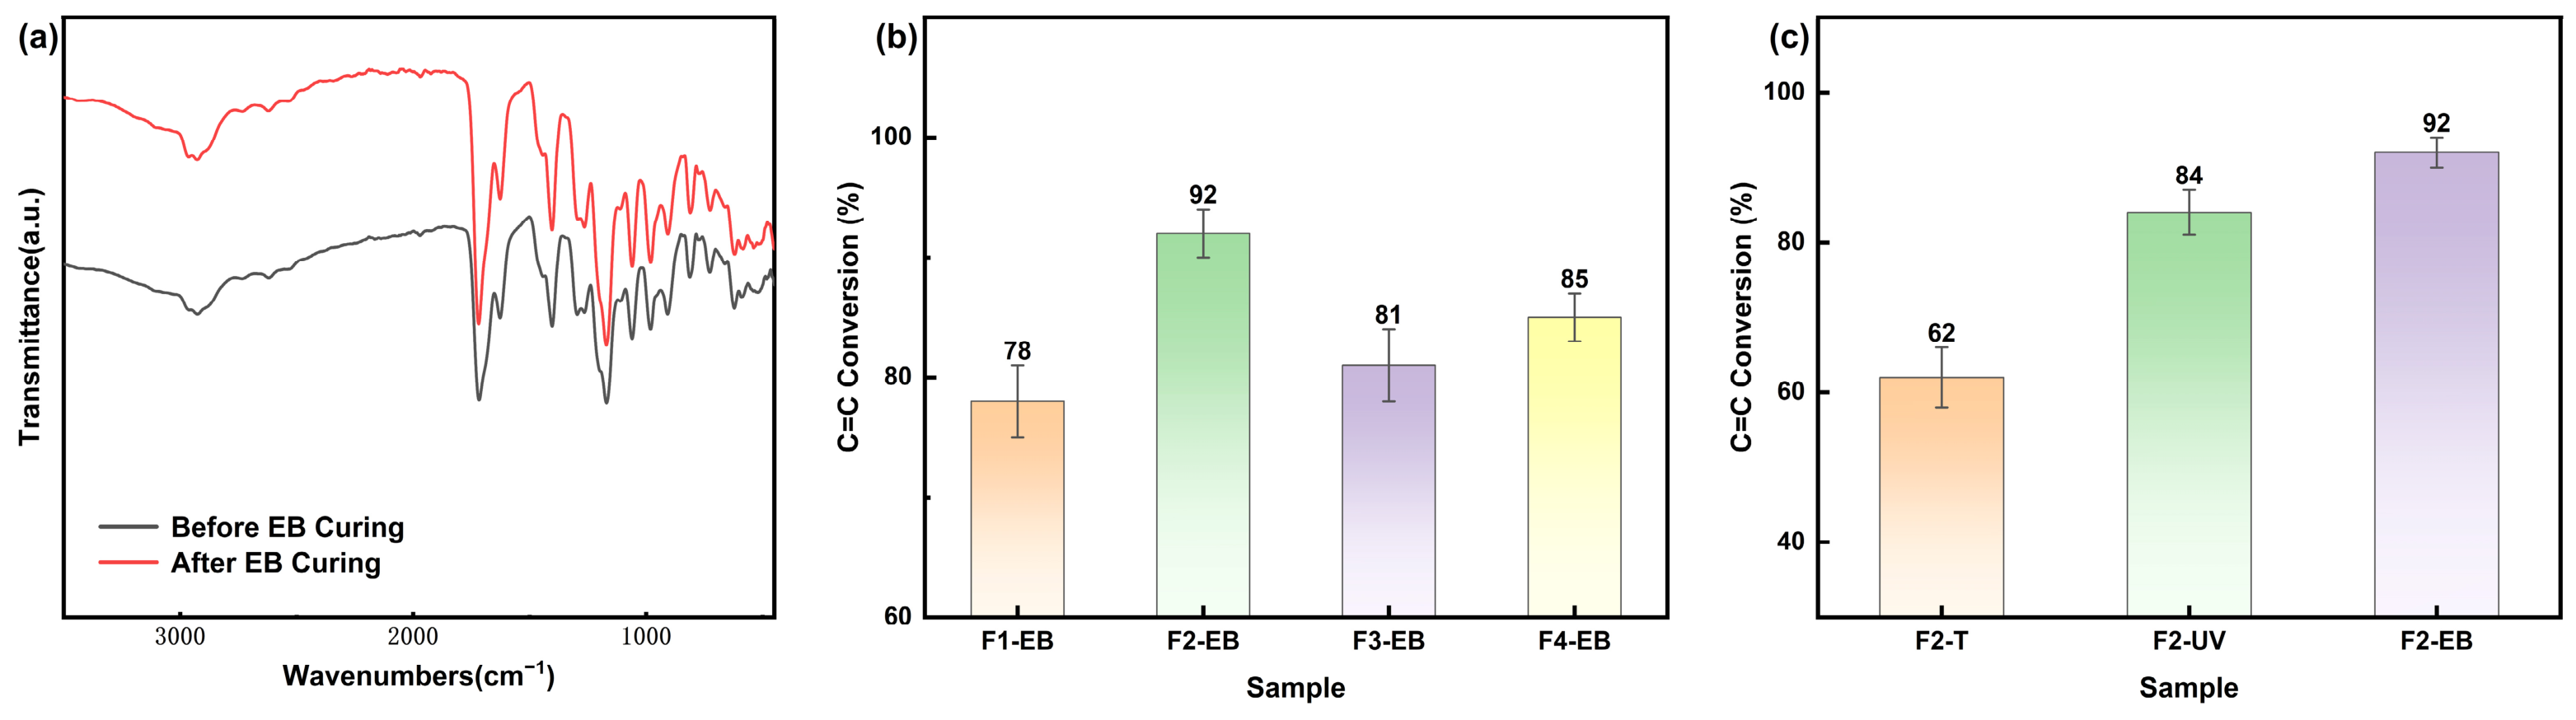
Figure 2a overlays the FTIR spectra of the F2 formulation before and after EB curing. The pre-curing spectrum contains the expected signatures: a broad —OH band near 3400–3500 cm−1, =C—H stretches at 3080 and 910 cm−1, a strong ester C=O peak at 1735 cm−1, and the C=C stretch at 1640 cm−1. After EB curing, the bands assigned to unsaturated groups at approximately 3080, 1640, 990, and 910 cm−1 decreased markedly, indicating consumption of C=C-containing species at the analyzed surface. This spectral change is consistent with radiation-induced reactions of the unsaturated groups. Changes in the 1100–1000 cm−1 region may involve overlapping C–O stretching modes; additional spectroscopic evidence would be required to assign these changes specifically to etherification.
Figure 2.
(a) FTIR spectra comparison of F2-EB before and after curing; (b) C=C double bond conversion rates of the four formulations after EB curing; (c) C=C conversion rate comparison of F2 formulation under three curing methods.
Using the ester carbonyl peak at 1735 cm−1 as an internal reference, the C=C conversion was quantified from the normalized area of the 1640 cm−1 band. Figure 2b shows the conversion for all four formulations after EB curing. F2 (MRGE/MCOA = 3:1) gave the highest conversion, 92 ± 2%, followed by F4 (2.6:1) at 85 ± 2%, F3 (4:1) at 81 ± 3%, and F1 (2:1) at 78 ± 3%. In F1, excess MCOA raises the system acid value, and some C=C bonds undergo side reactions in the acidic micro-environment, lowering the effective polymerization conversion. In F3, insufficient curing agent limits the number of crosslinking sites and raises the probability of radical termination. F4, whose 2.6:1 ratio falls between those of F1 (2:1) and F2 (3:1), gave an intermediate conversion. Notably, F4 did not yield the highest C=C conversion despite corresponding to the COOH/OH stoichiometric equivalence point. Under EB-initiated curing, therefore, C=C radical addition polymerization—not esterification—is the rate-determining crosslinking reaction, and the C=C bond concentration and radical mobility at the F2 ratio prove more favorable than those at the stoichiometric F4 ratio.
Figure 2c compares the C=C conversion of the F2 formulation across the three curing methods: EB (92%) > UV (84%) > thermal (62%). During EB curing, the 200 keV electrons cleave C=C bonds (bond energy ~6.3 eV) directly, producing high radical concentrations throughout the full coating thickness (>100 μm penetration). UV curing is constrained by the limited penetration depth of 365 nm light (<30 μm) and the absorption efficiency of the chromophores, leaving the lower portion of the film insufficiently crosslinked. Thermal curing, governed by Arrhenius kinetics with a sizable activation energy, still leaves considerable unreacted double bonds even after 40 h.
3.2. Formulation Optimization Within Each Curing Method
Mechanical properties of the four formulations were first compared within each curing method to identify the best formulation for that method. The results are collected in Table 2. In every curing method, F2 (MRGE/MCOA = 3:1) consistently gave the best overall mechanical properties, indicating that this ratio provides the optimal balance of strength and toughness.
Table 2.
Comparison of mechanical properties of coatings with different formulations under each curing method.
3.2.1. Formulation Optimization for Thermal Curing
Under thermal curing (Table 2), F2-T delivered pencil hardness 7H, adhesion 4B, impact resistance 38 cm·kg, and flexibility 3.0 mm—the best values within the thermal group. F1-T and F3-T gave hardness of 5H and 6H, adhesion of 3B, impact resistance of 30 and 25 cm·kg, and flexibility of 4.0 and 5.0 mm, respectively. F4-T fell between F1-T and F2-T. These differences reflect how the stoichiometric ratio controls the extent of esterification: at the F2 ratio, the molar balance of hydroxyl groups (from MRGE) and carboxyl/anhydride groups (from MCOA) is closest to equivalence, enabling the esterification reaction to approach completion. In F1, residual unreacted acidic groups from the excess curing agent weaken the cohesive strength; in F3, the deficiency of curing agent depresses the crosslinking density. F2 is thus the optimal formulation for the thermal curing system.
3.2.2. Formulation Optimization for UV Curing
Under UV curing (Table 2), F2-UV gave pencil hardness 9H, adhesion 5B, impact resistance 52 cm·kg, and flexibility 1.5 mm, markedly better than the thermal curing system. F1-UV, F3-UV, and F4-UV gave hardness 7H, 8H, and 8H; adhesion 4B, 4B, and 5B; and impact resistance 42, 38, and 48 cm·kg, respectively. The gain over thermal curing comes from UV-initiated radical polymerization of C=C bonds: UV light excites carbonyl chromophores in MRGE and aromatic conjugated systems in MCOA, generating radicals and producing a network far denser than esterification crosslinking alone can deliver. Still, the off-stoichiometric formulations F1-UV and F3-UV do not reach the crosslinking efficiency of F2. F2 is likewise the optimal formulation for UV curing.
3.2.3. Formulation Optimization for EB Curing
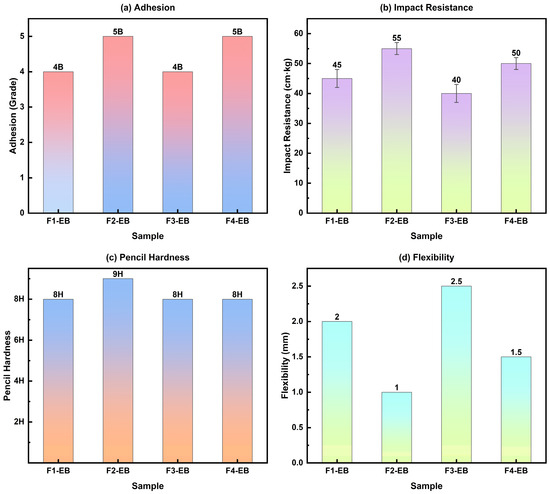
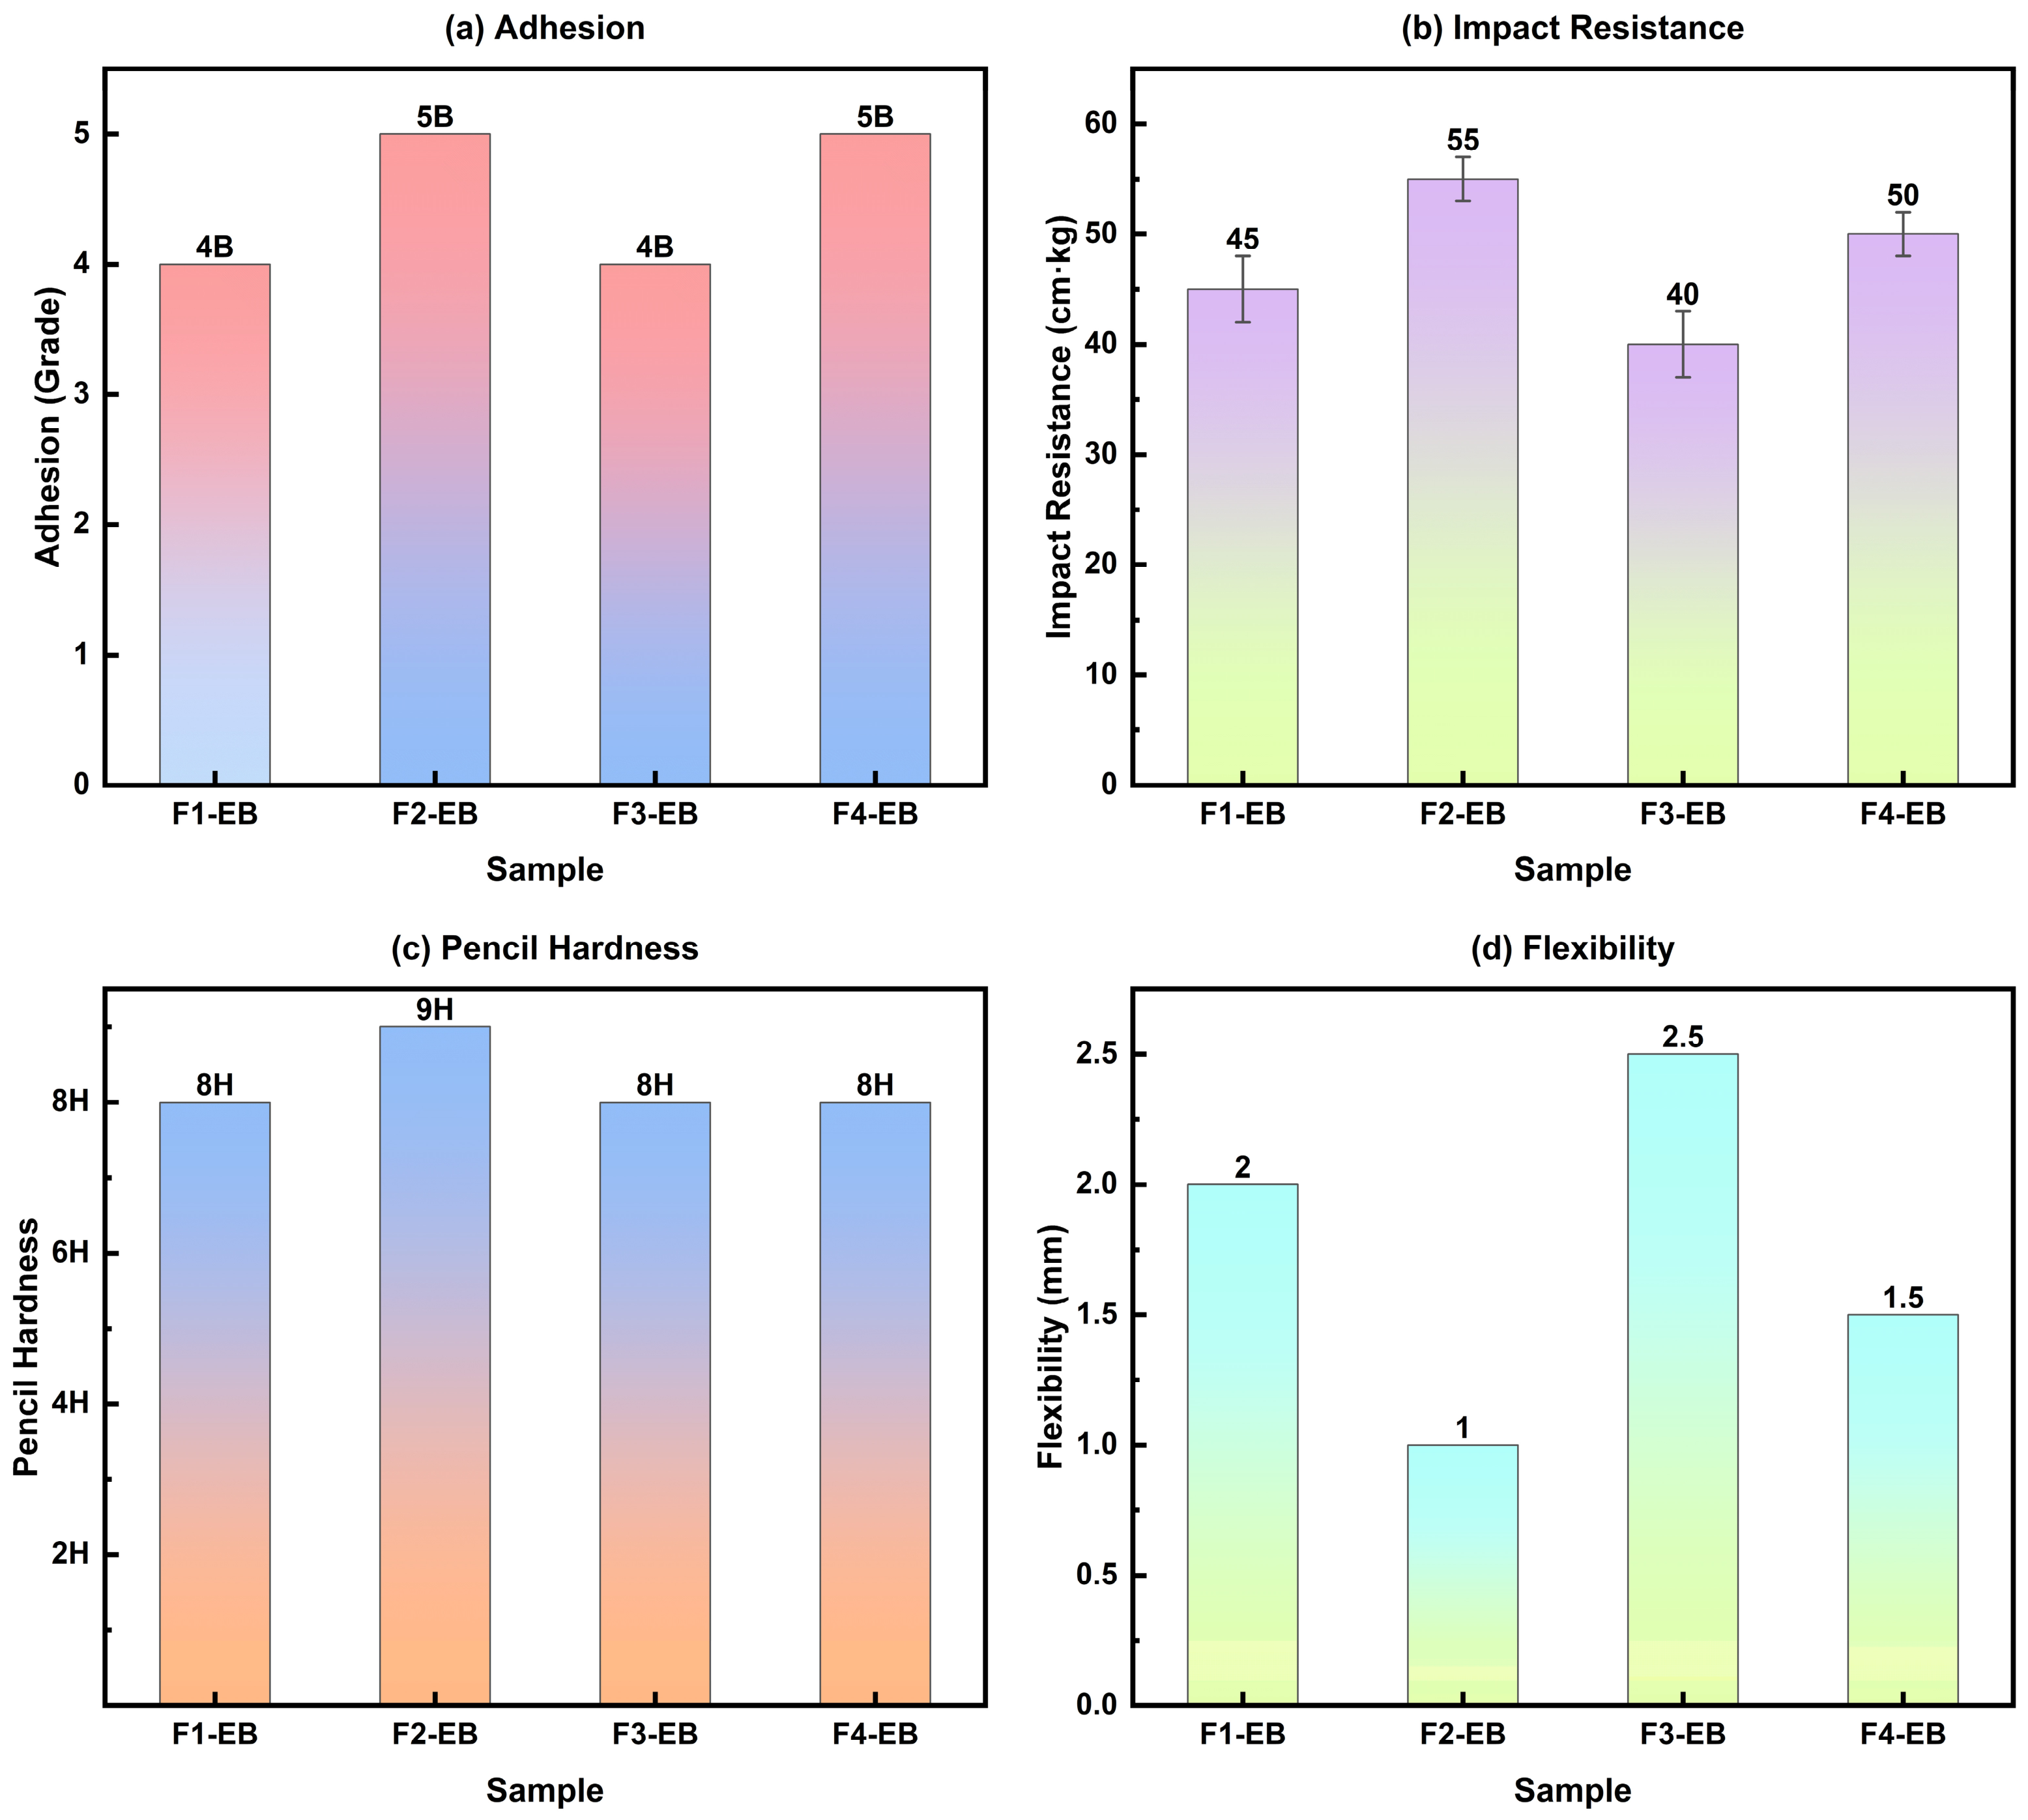
Under EB curing (Table 2), F2-EB stood out with pencil hardness 9H, adhesion 5B, impact resistance 55 cm·kg, and flexibility 1.0 mm—the highest values across all 12 groups. F1-EB (8H/4B/45 cm·kg/2.0 mm), F3-EB (8H/4B/40 cm·kg/2.5 mm), and F4-EB (8H/5B/50 cm·kg/1.5 mm) ranked in the same order as the C=C conversion data. Figure 3 highlights the property differences among the four EB-cured formulations. The performance ranking—F2 > F4 > F1 ≈ F3—is instructive because F4 (2.6:1), not F2, is the COOH/OH stoichiometric equivalence point. Three factors converge at the F2 ratio. First, the higher MRGE content in F2 supplies a greater concentration of C=C double bonds, the primary crosslinking sites under EB radiation; higher C=C density yields higher crosslink density after radical polymerization. Second, although F4 provides more COOH groups, these groups promote esterification, which is kinetically frozen on the seconds-long EB curing time scale and contributes negligibly to the network. Excess COOH groups can also consume radicals through hydrogen abstraction, acting as a competitive side reaction that reduces the effective radical population available for C=C addition. Third, the C=C-derived radicals in F2 find a sufficient—but not excessive—number of neighboring COOH groups to serve as hydrogen-bonding anchor sites at the growing chain ends; this moderate COOH concentration suppresses radical termination through diffusion–collision without the radical quenching penalty incurred at the higher COOH loading of F4. F2 thus achieves the highest crosslinking density and the best mechanical properties despite deviating from classical condensation stoichiometry and is the optimal formulation for EB curing.
Figure 3.
Comparison of mechanical properties of EB-cured coatings with different formulations: (a) adhesion, (b) impact resistance, (c) pencil hardness, (d) flexibility.
3.3. Cross-Curing Method Comparison: Performance Study of the Optimal F2 Formulation
3.3.1. Thermal Stability Analysis
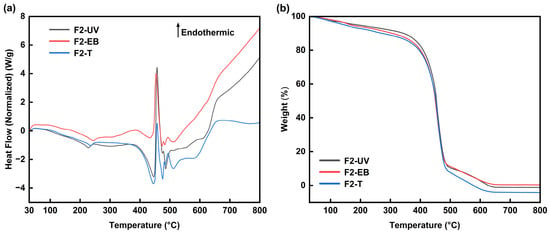
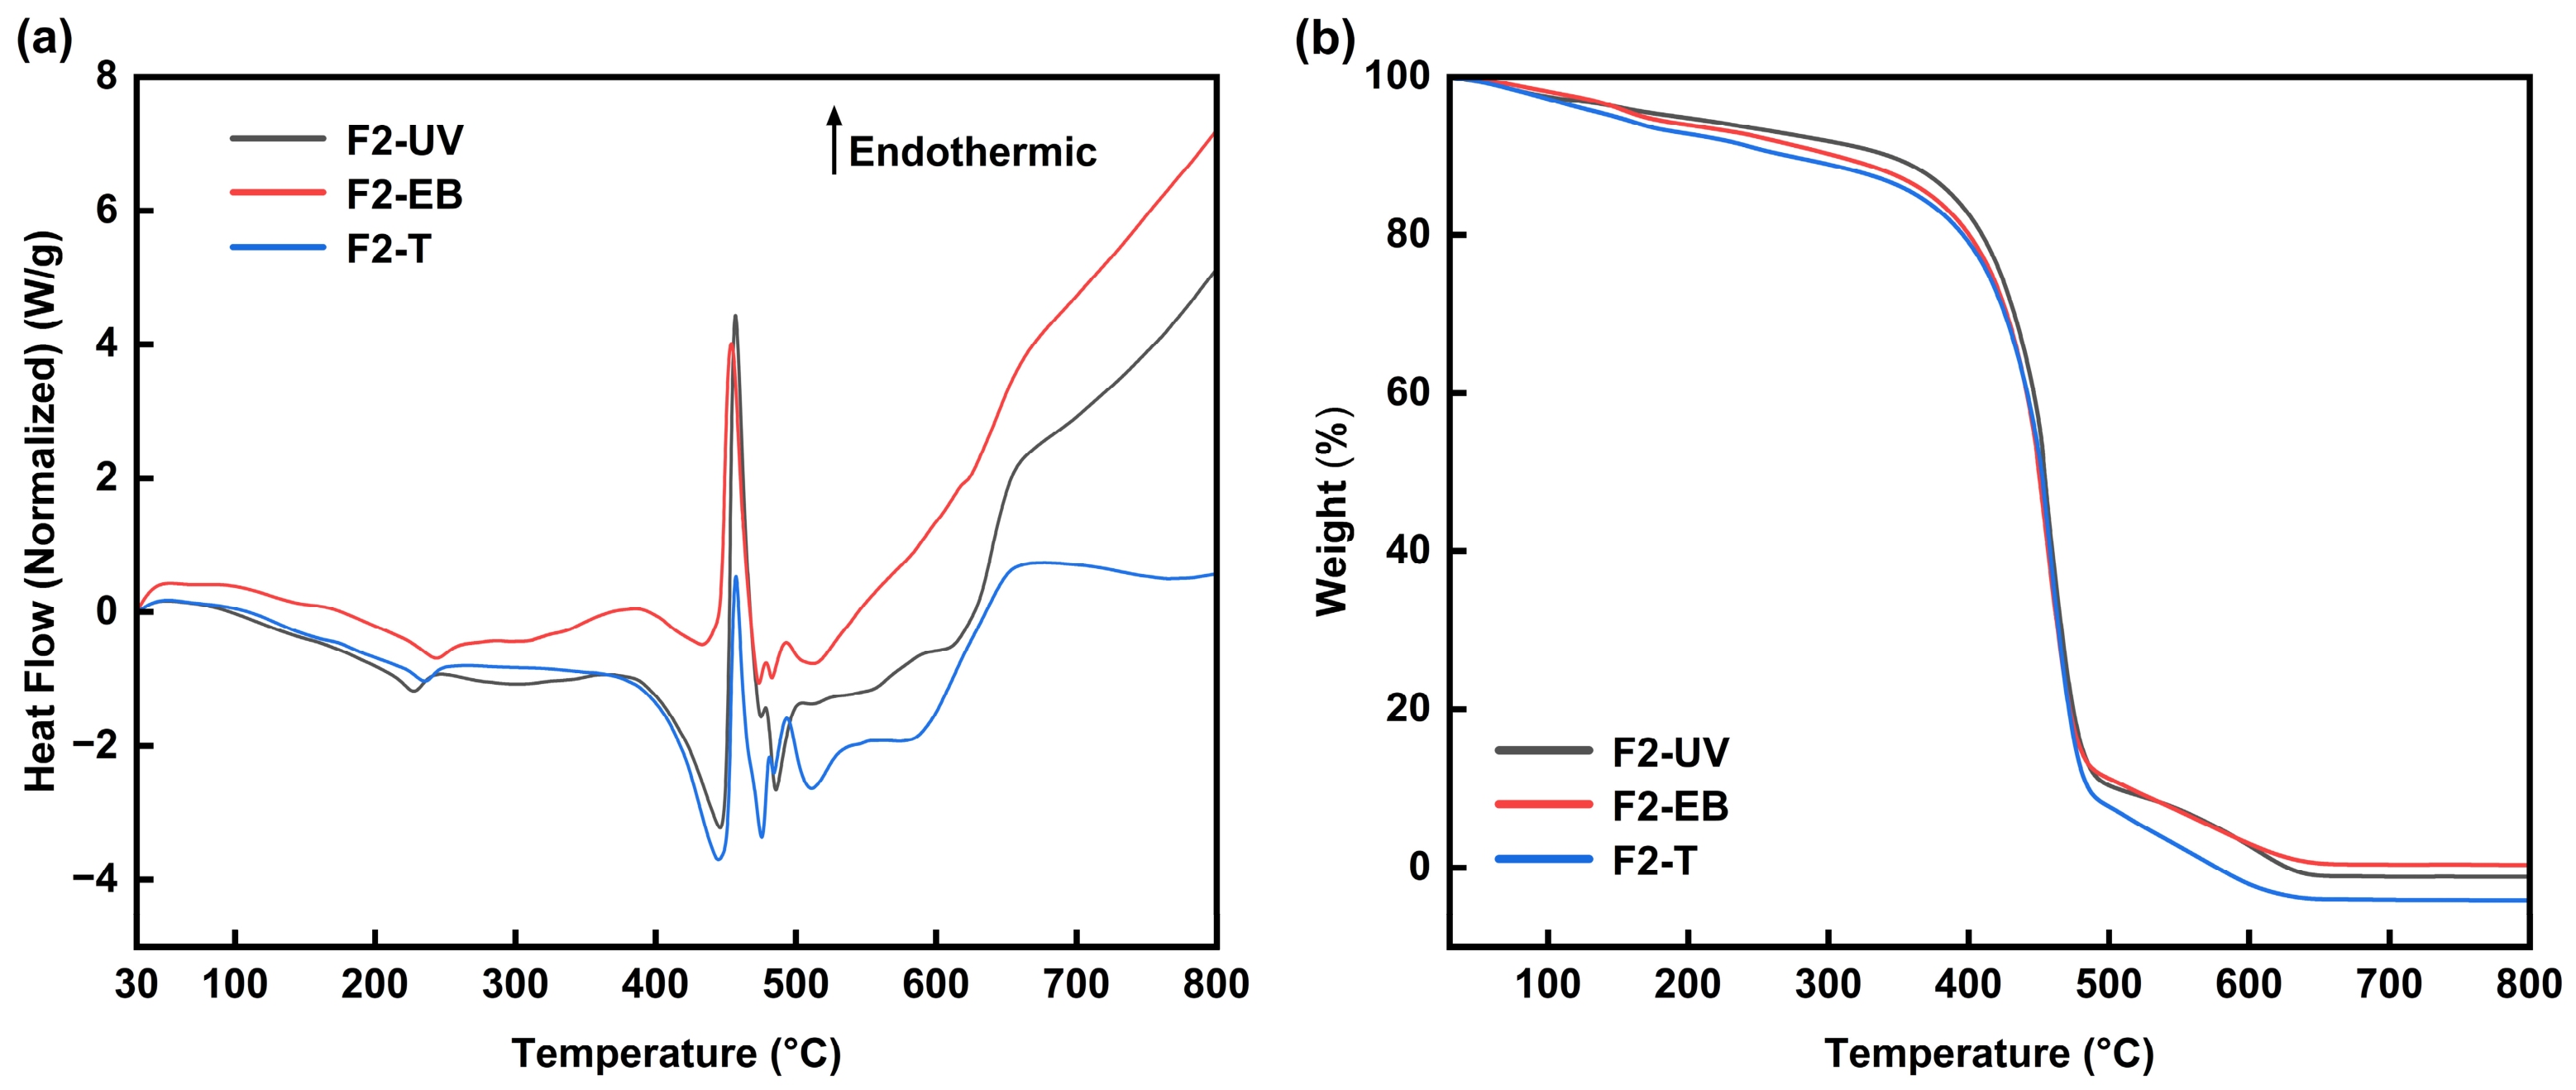
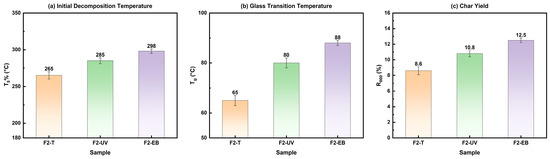
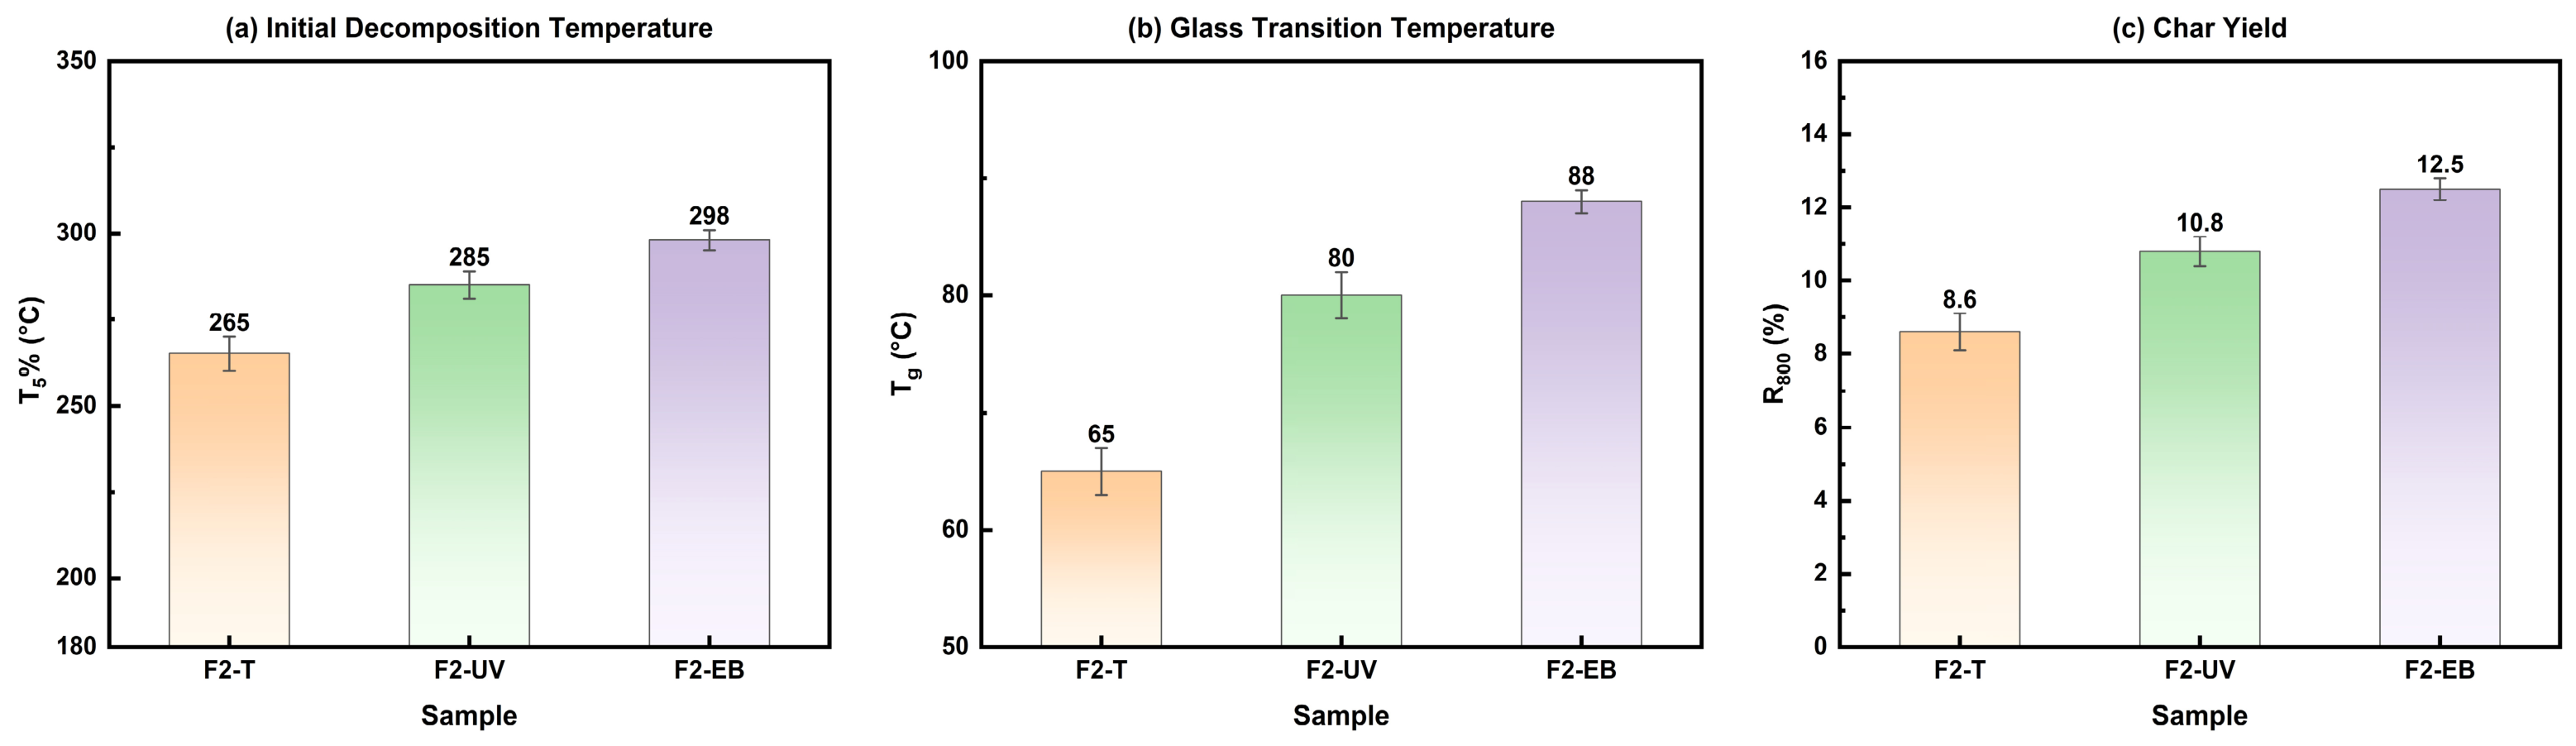
With F2 (MRGE/MCOA = 3:1) as the best formulation common to all three curing methods, the three routes are compared below on thermal stability, morphology, mechanical properties, and anti-corrosion performance. Key TG-DSC parameters for the three F2 coatings are listed in Table 3, and the corresponding TG-DSC curves are shown in Figure 4. The initial decomposition temperature T5% of F2-EB (298 °C) exceeded that of F2-UV (285 °C) by 13 °C and that of F2-T (268 °C) by 30 °C. The 50% mass loss temperature followed the same trend: F2-EB (425 °C) > F2-UV (408 °C) > F2-T (375 °C). The 800 °C char residue R800 likewise decreased from F2-EB (12.5%) to F2-UV (10.8%) to F2-T (8.6%). The glass transition temperature Tg was highest for F2-EB (88 °C), followed by F2-UV (80 °C) and F2-T (65 °C). While this Tg lies below the maximum conductor temperature (150 °C), insulating coatings are not structural materials and need not remain glassy in service; the critical thermal threshold for an insulating coating is chemical degradation, not the glass transition. With T5% approaching 300 °C, F2-EB offers a wide safety margin against thermal decomposition, and the high crosslink density preserves coating integrity and barrier function well above Tg. The higher Tg of F2-EB relative to F2-T (88 vs. 65 °C) further reduces the modulus drop across the Tg→service-temperature interval, which mitigates thermal fatigue stress from differential expansion between the copper conductor and the steel stator core.
Table 3.
Comparison of thermal performance parameters of f2 formulation coatings under three curing methods (n = 3).
Figure 4.
TG-DSC curves of F2 coatings under different curing methods: (a) DSC curves, (b) TG curves.
Figure 5 compares the thermal properties of the three F2 coatings. These thermal stability differences directly reflect the crosslinking density hierarchy among the three methods. EB radiation penetrates the full film thickness and cleaves C=C bonds directly, sustaining the highest radical concentration and the longest-lived active centers and produces the densest, most uniform three-dimensional network. UV curing is limited by the penetration depth of 365 nm light (<50 μm), leaving a vertical crosslinking gradient and under-cured regions near the substrate. Thermal curing relies solely on esterification, a thermally activated process; the high activation barrier leaves a significant fraction of chains uncrosslinked even after 40 h.
Figure 5.
Comparison of thermal properties of F2 formulation coatings under three curing methods: (a) initial decomposition temperature, (b) glass transition temperature, (c) 800 °C char residue.
These thermal data are best understood in the context of generator insulation practice. The widely used epoxy–mica insulation systems in large generators typically have Tg values in the 80–120 °C range [25], and their decades of reliable service demonstrate that a coating need not be glassy at the operating temperature to function effectively as an insulator and barrier. In fact, operation slightly above Tg can be beneficial: it imparts controlled viscoelasticity that absorbs the cyclic thermal strain arising from the mismatch in the coefficient of thermal expansion between copper windings (∼17 × 10−6 K−1) and the steel stator core (∼12 × 10−6 K−1). The key material attributes for this application are therefore not merely a high Tg but a combination of high thermal decomposition resistance, sufficient crosslink density to maintain barrier integrity, and enough chain mobility to accommodate thermal cycling without cracking. F2-EB satisfies all three requirements: T5% = 298 °C, Tg = 88 °C with the highest crosslink density among the three curing methods, and the flexible castor-oil-derived aliphatic segments that remain mobile above Tg and prevent brittle fracture during thermal transients.
The 150 °C/1 h value is reported as volatile mass loss rather than polymer decomposition. Because 150 °C is well below T5% for all three cured films, the loss is assigned to the combined release of retained moisture and residual low molecular weight or extractable species, which may include unreacted 1,3-propanediol, surfactant carrier, and extractable bio-based oligomers. The present TG data do not permit these contributions to be quantified separately. The order F2-T > F2-UV > F2-EB is consistent with progressively less solvent-accessible network material, in agreement with the gel content and swelling results.
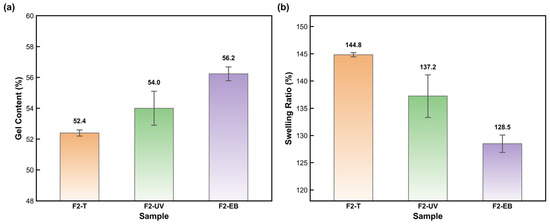
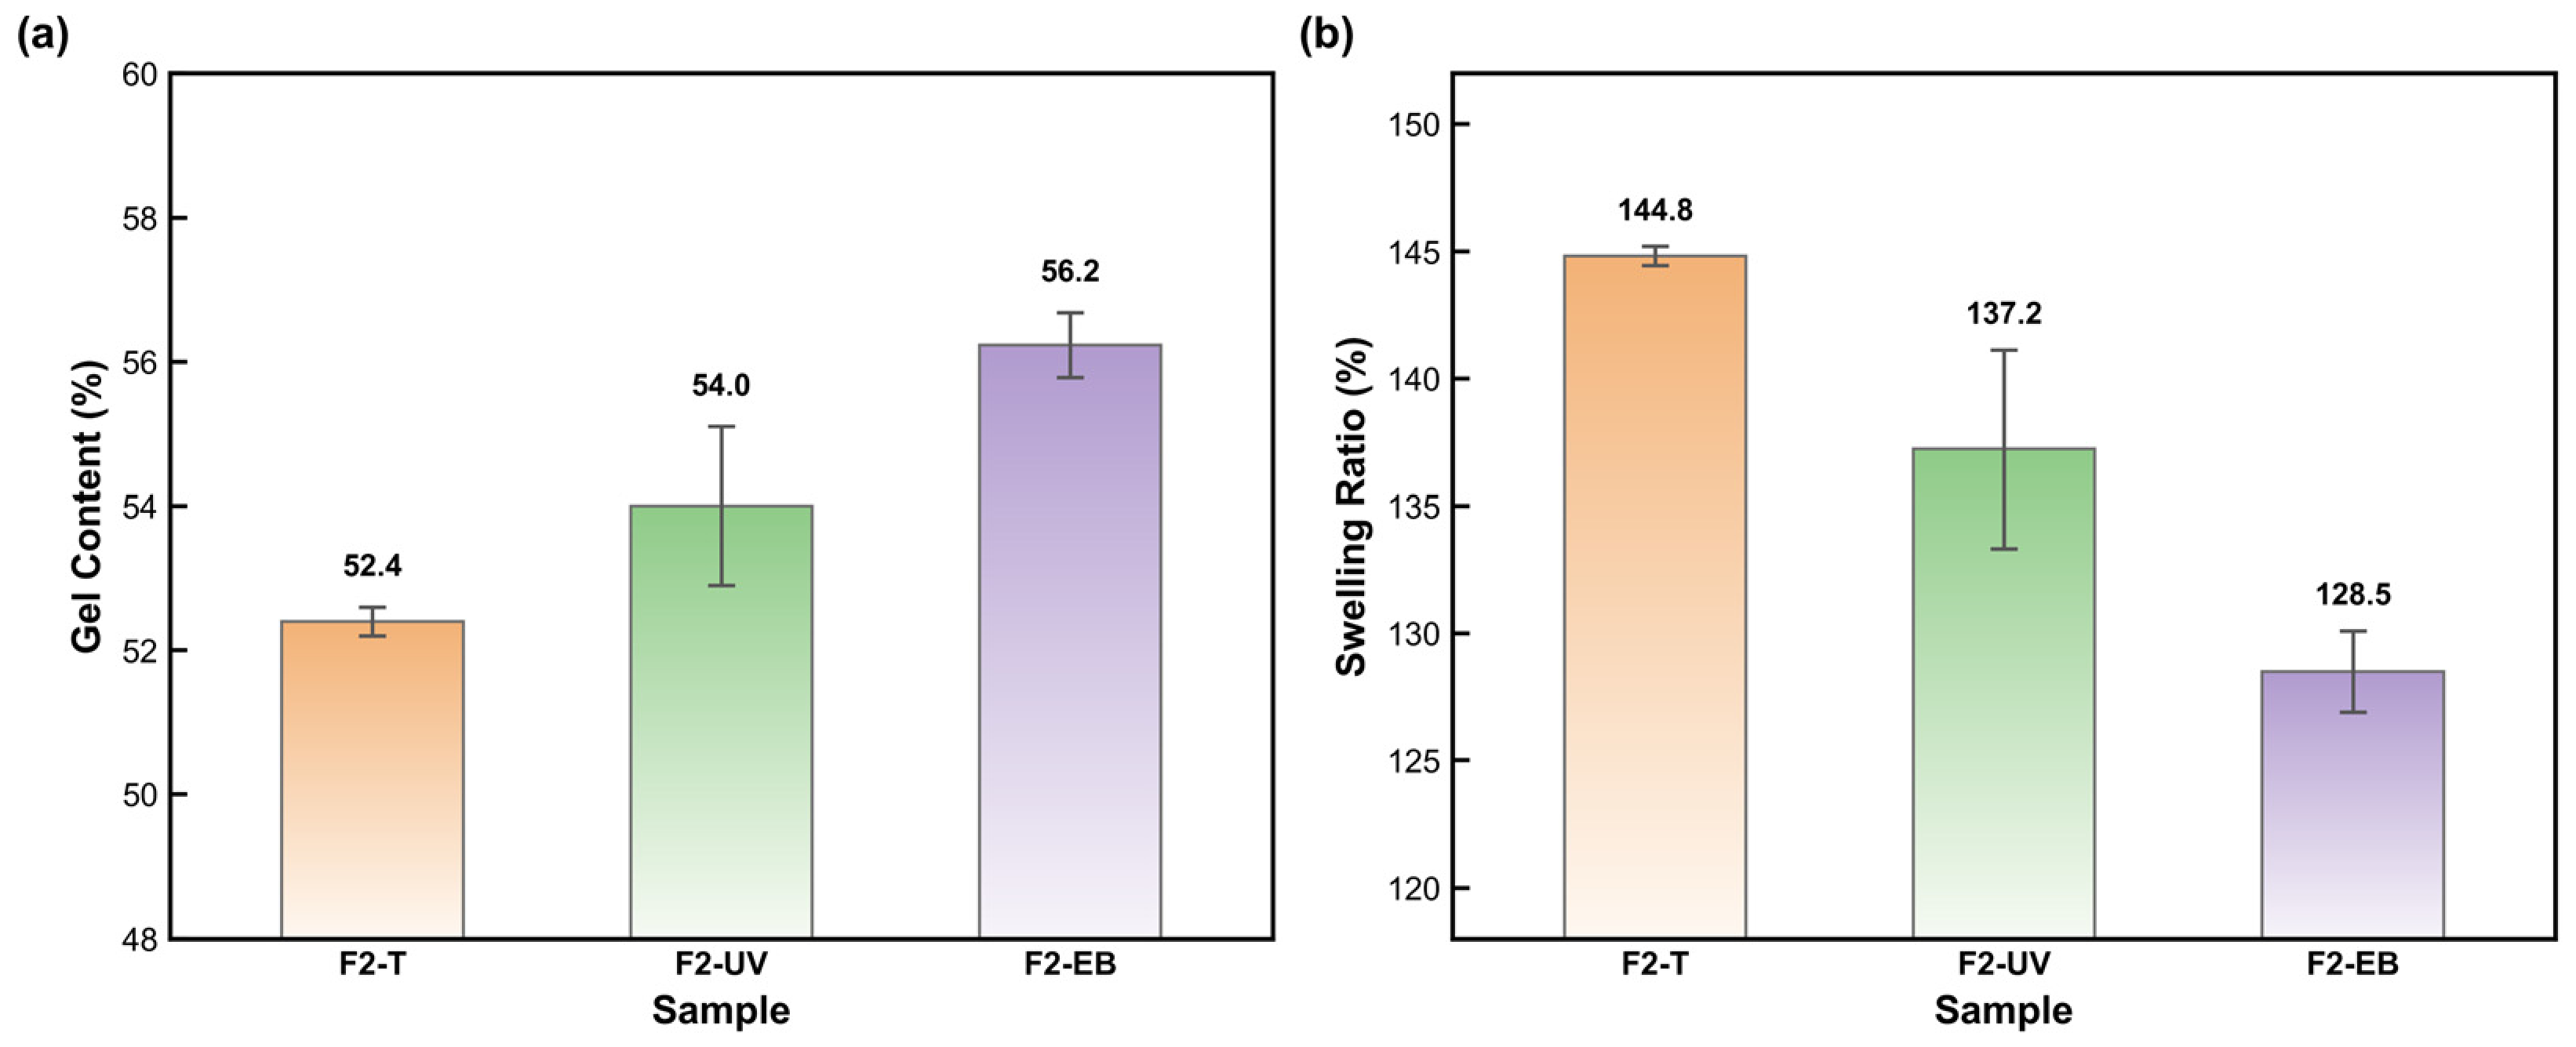
As shown in Figure 6, gel content increased modestly from 52.4 ± 0.2% for F2-T to 54.0 ± 1.1% for F2-UV and 56.2 ± 0.5% for F2-EB. In parallel, the swelling ratio decreased from 144.8 ± 0.4% to 137.2 ± 3.9% and 128.5 ± 1.6%, respectively. These paired trends indicate a progressively larger insoluble fraction and lower solvent accessibility, supporting more extensive network formation after EB curing. The larger scatter for F2-UV is consistent with greater spatial variability in conversion, but it is not treated as direct proof of a through-thickness gradient.
Figure 6.
Network-related solvent extraction results for F2-T, F2-UV, and F2-EB: (a) gel content and (b) swelling ratio (mean ± SD, n = 3).
3.3.2. SEM Surface Morphology Analysis
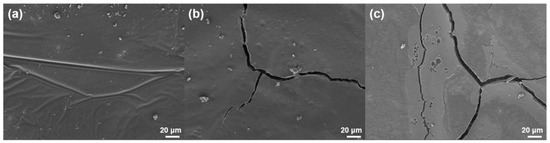
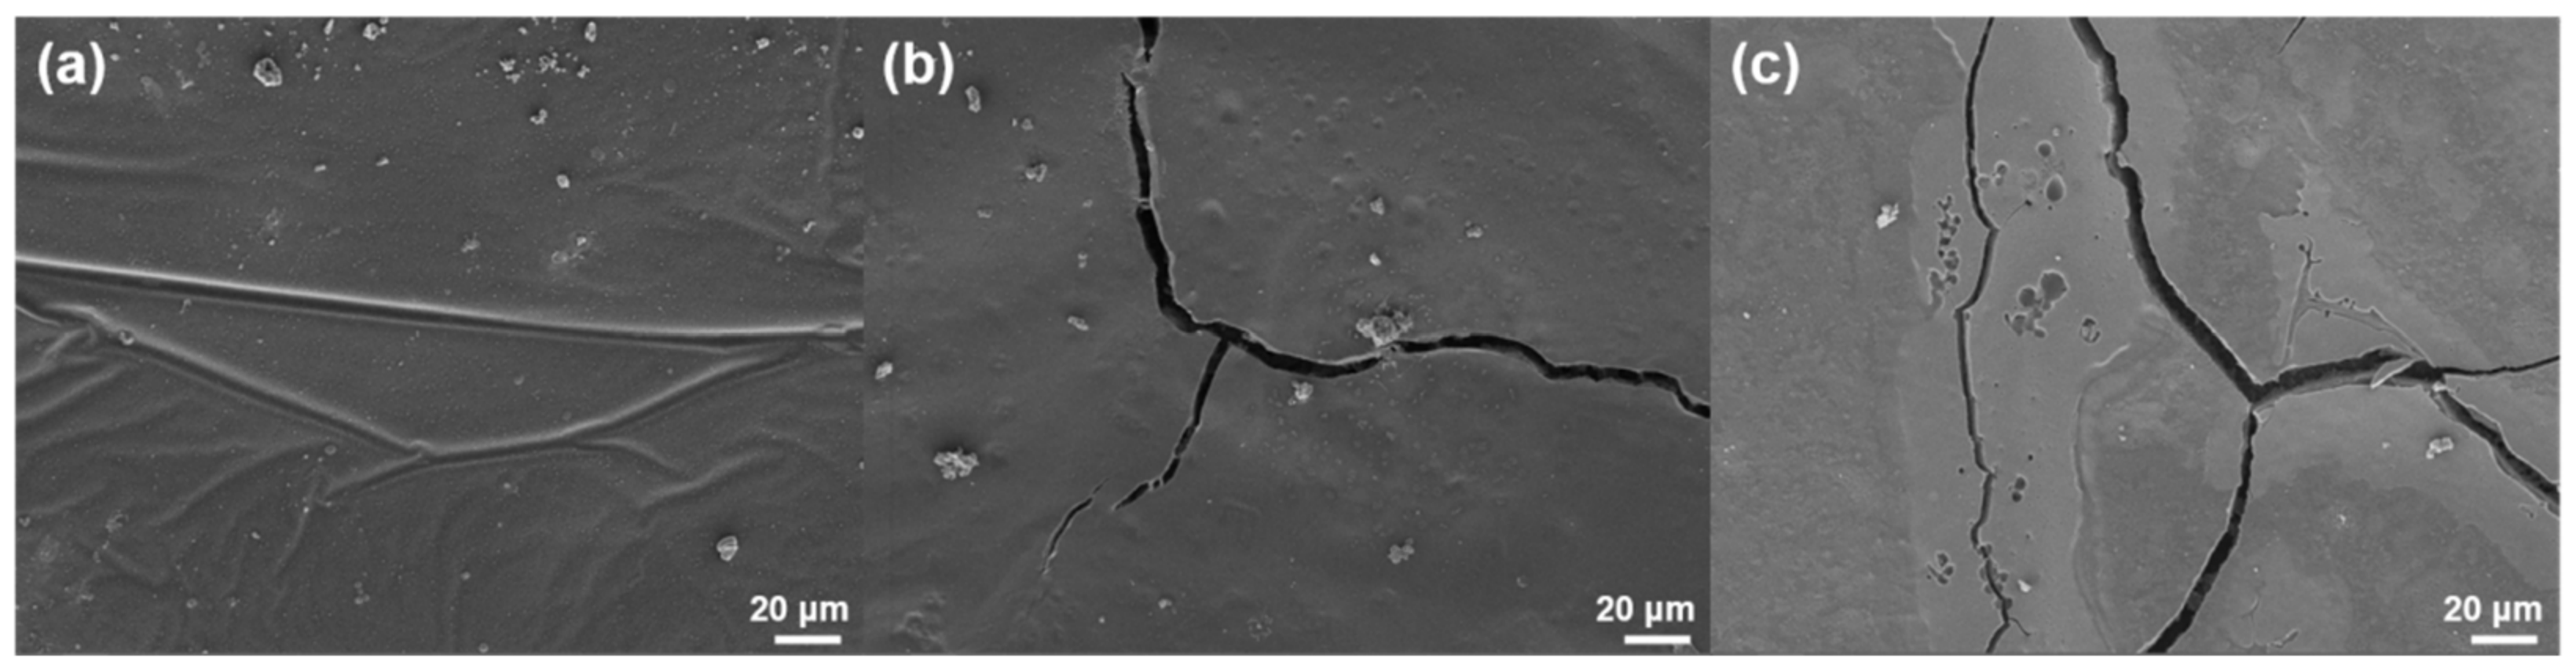
The F2-EB surface (Figure 7a) is flat and dense across the 20 μm field of view. No cracks or pores are visible; only a few uniformly dispersed nanoscale bright spots (the nano-TiO2 and zinc phosphate fillers) and faint preparation scratches appear. During EB curing, 200 keV electrons penetrate the entire film and initiate radical polymerization at all depths simultaneously. Crosslinking therefore proceeds uniformly, and shrinkage stress is dissipated isotropically, preventing stress concentration cracking.
Figure 7.
SEM images of F2 formulation coatings under three curing methods: (a) F2-EB, (b) F2-UV, (c) F2-T.
The F2-UV surface (Figure 7b) shows penetrating cracks ~1–2 μm wide with localized micro-crack branching. The observed cracks may result from a combination of nonuniform curing, shrinkage stress, volatile loss, and phase separation. Limited UV penetration is retained only as a possible contributor; cross-sectional SEM and depth-resolved micro-FTIR or Raman mapping would be required to resolve a through-thickness conversion profile. The predominantly dense matrix is interrupted by these micron-scale surface cracks, but no macroporous network was observed.
The F2-T surface (Figure 7c) displays a crack network and localized void-like defects; however, the available surface images do not establish a through-thickness open macroporous structure. Post-cure SEM and AFM show that F2-T contains the most extensive crack network, F2-UV contains narrower surface cracks, and F2-EB remains continuous within the observed fields. Because these measurements were performed after curing, they do not establish the time of crack initiation. The cracks are therefore attributed cautiously to curing-induced shrinkage stress and volatile redistribution during film formation. Possible local incompatibility between rigid MRGE-rich and flexible MCOA-rich regions may contribute, but phase separation was not directly demonstrated and is not presented as the primary cause.
The F2-EB coating presents a dense, continuous and non-macroporous surface within the SEM observation limit. F2-UV remains predominantly dense but contains micron-scale surface cracks. F2-T contains a crack network and localized void-like defects; however, the available surface images do not establish a through-thickness open macroporous structure. These classifications are deliberately limited to the observed surface and do not imply a quantitative through-thickness porosity measurement.
3.3.3. AFM Surface Morphology Analysis
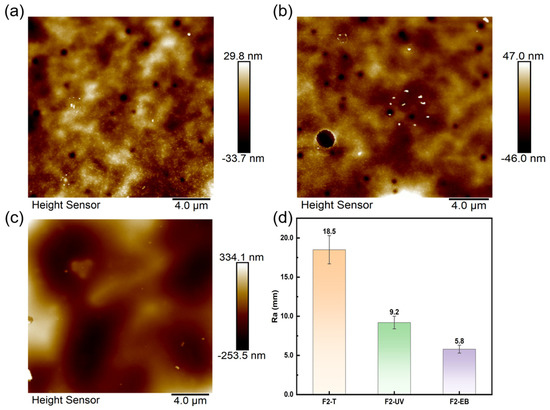
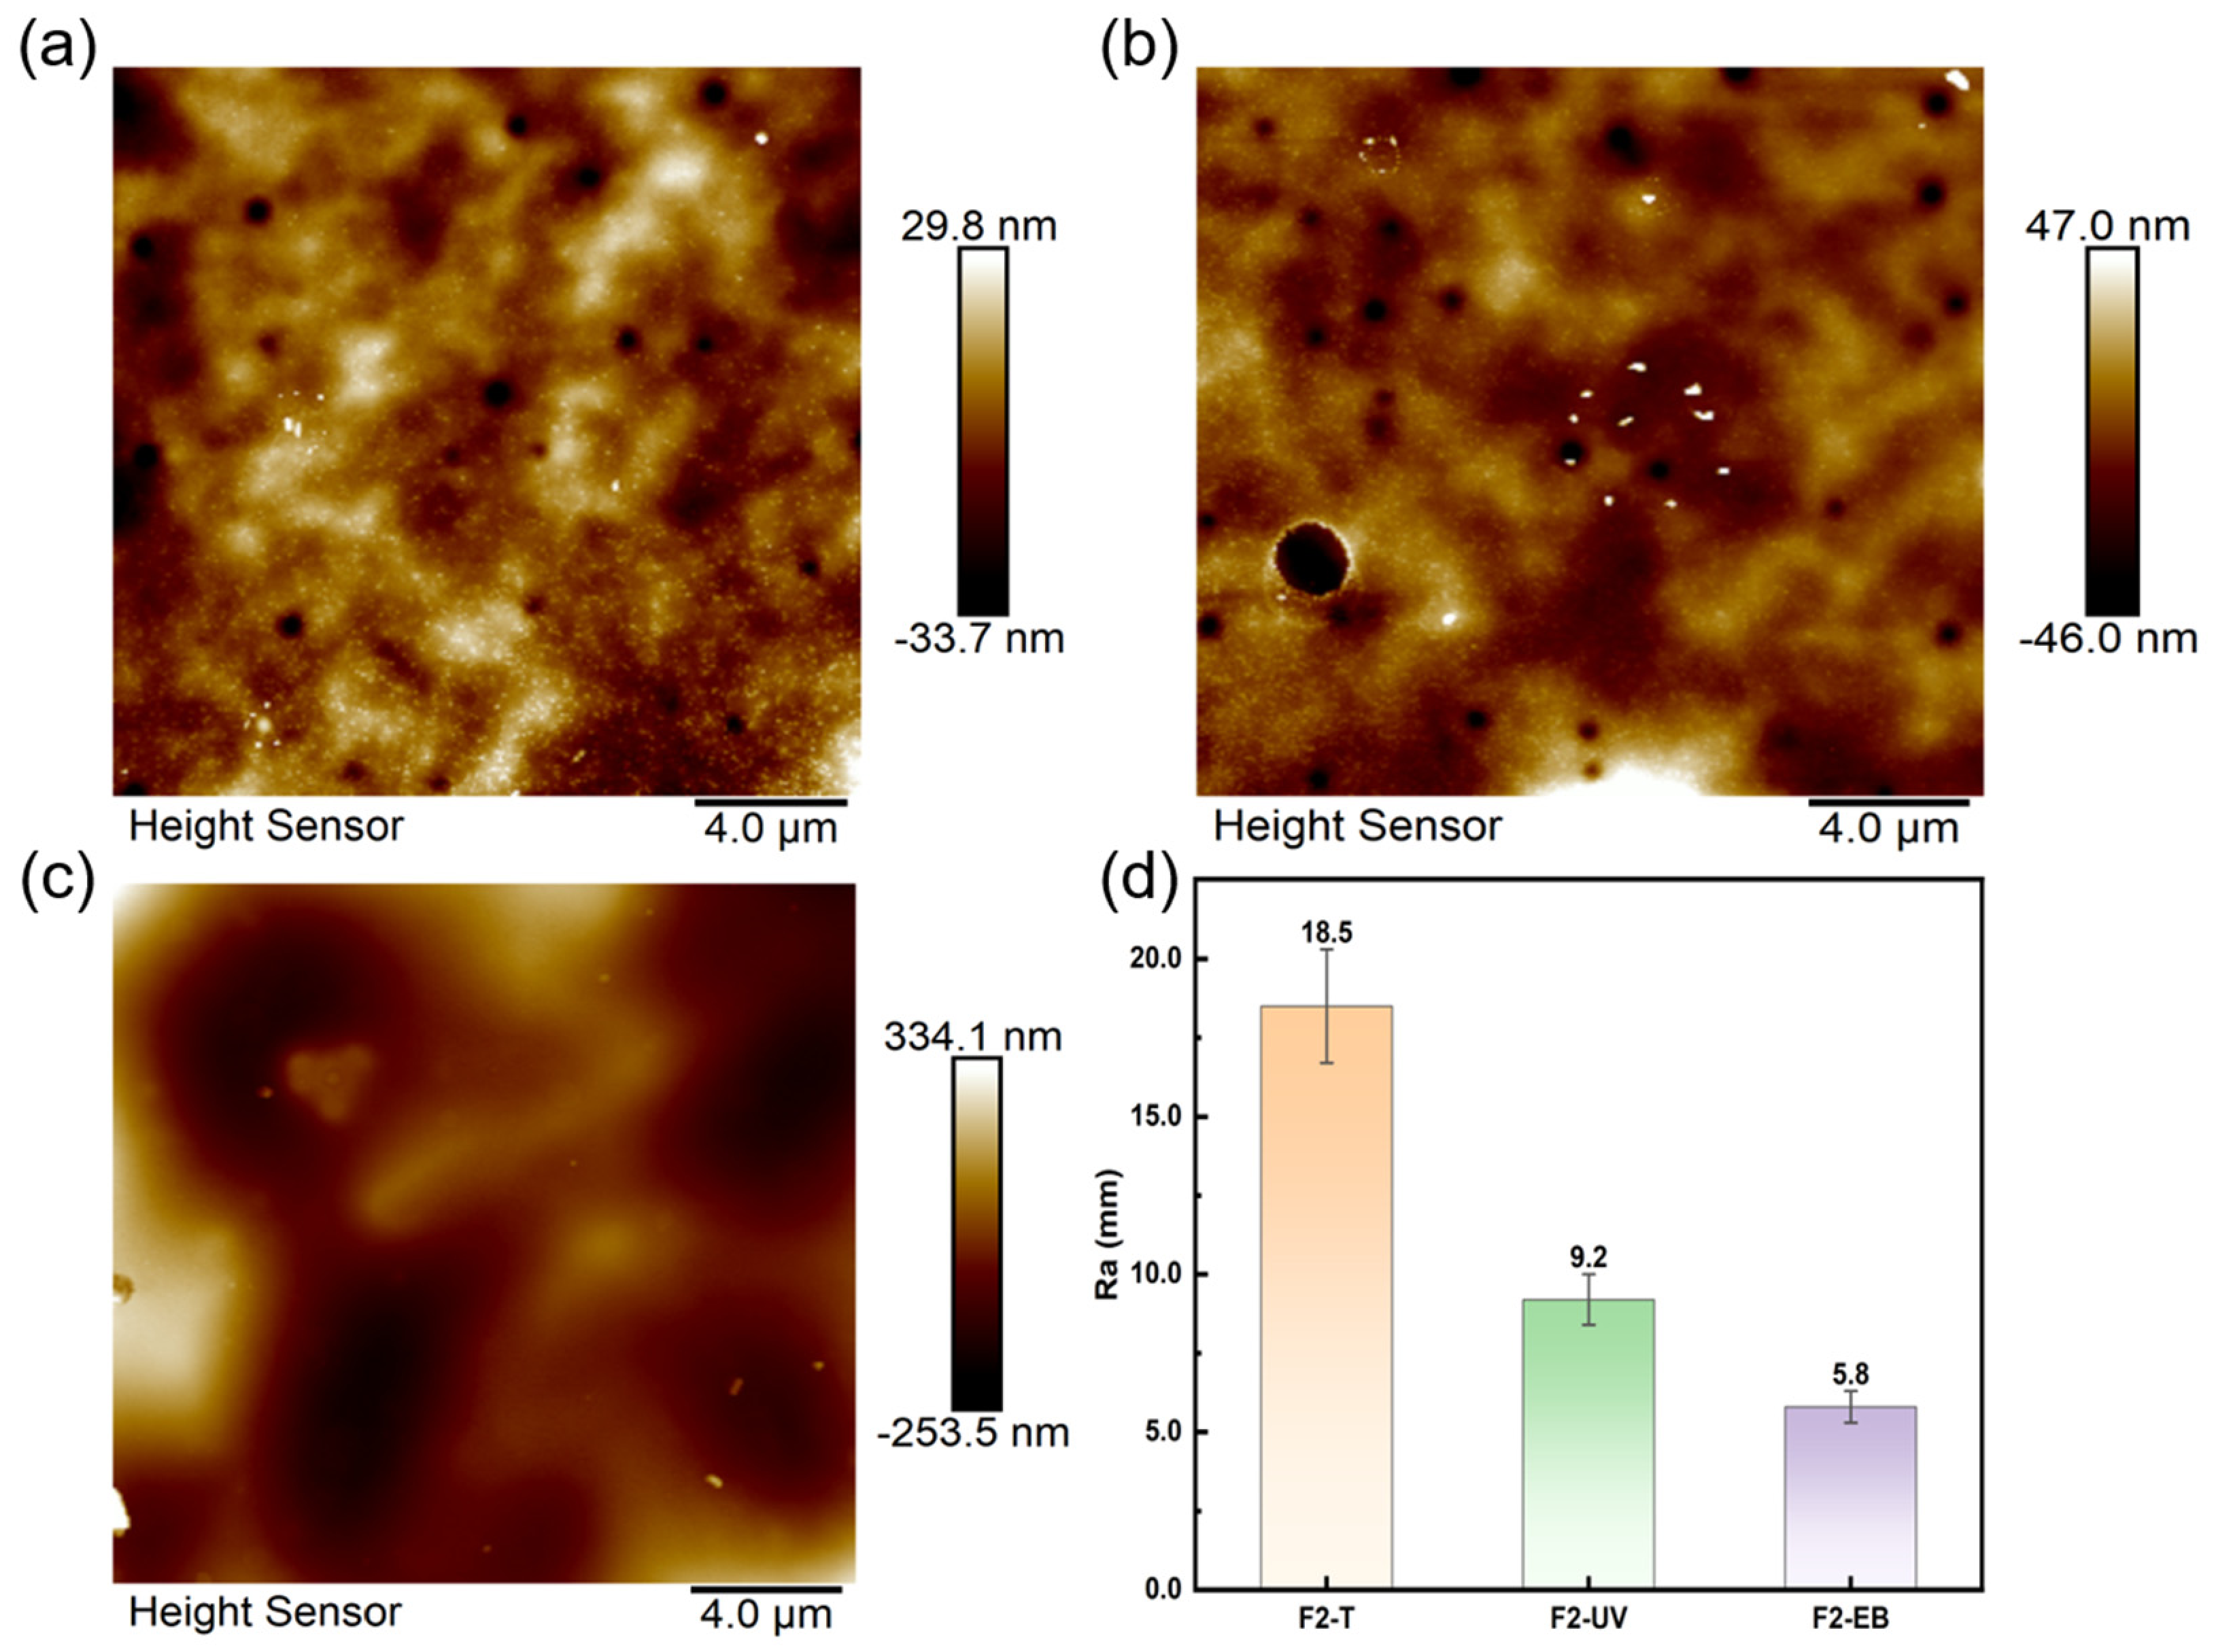
AFM roughness parameters are summarized in Table 4. The F2-EB surface is notably flat: Ra = 5.8 nm, Rq = 7.4 nm, Rmax = 45.3 nm. F2-UV shows Ra = 9.2 nm and Rmax = 68.2 nm. F2-T gives Ra = 18.5 nm and Rmax = 125.6 nm—roughly 3.2× and 2.8× the corresponding F2-EB values, respectively.
Table 4.
AFM surface roughness parameters of F2 formulation coatings under three curing methods.
Figure 8 shows representative AFM height images. F2-EB (Figure 7a) has the lowest roughness and a uniformly flat texture, consistent with Ra = 5.8 nm. F2-UV (Figure 7b) is moderately rougher with micron-scale undulations (Ra = 9.2 nm). F2-T (Figure 7c) shows pronounced height variations and a heterogeneous surface texture (Ra = 18.5 nm).
Figure 8.
AFM topographic images of F2 formulation coatings under three curing methods: (a) F2-EB, (b) F2-UV, (c) F2-T; (d) comparison of AFM surface roughness Ra of F2 formulation coatings under three curing methods.
3.3.4. Mechanical Properties Comparison
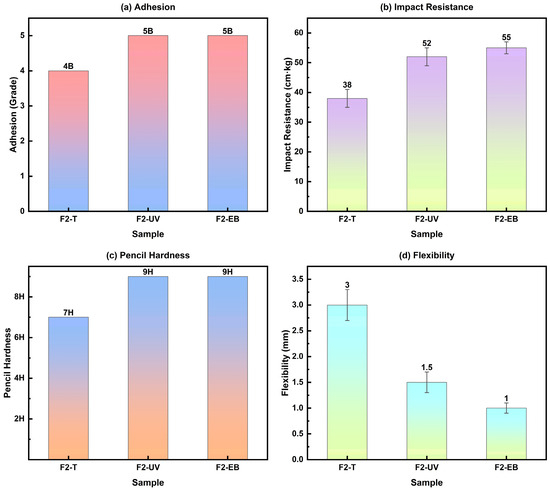
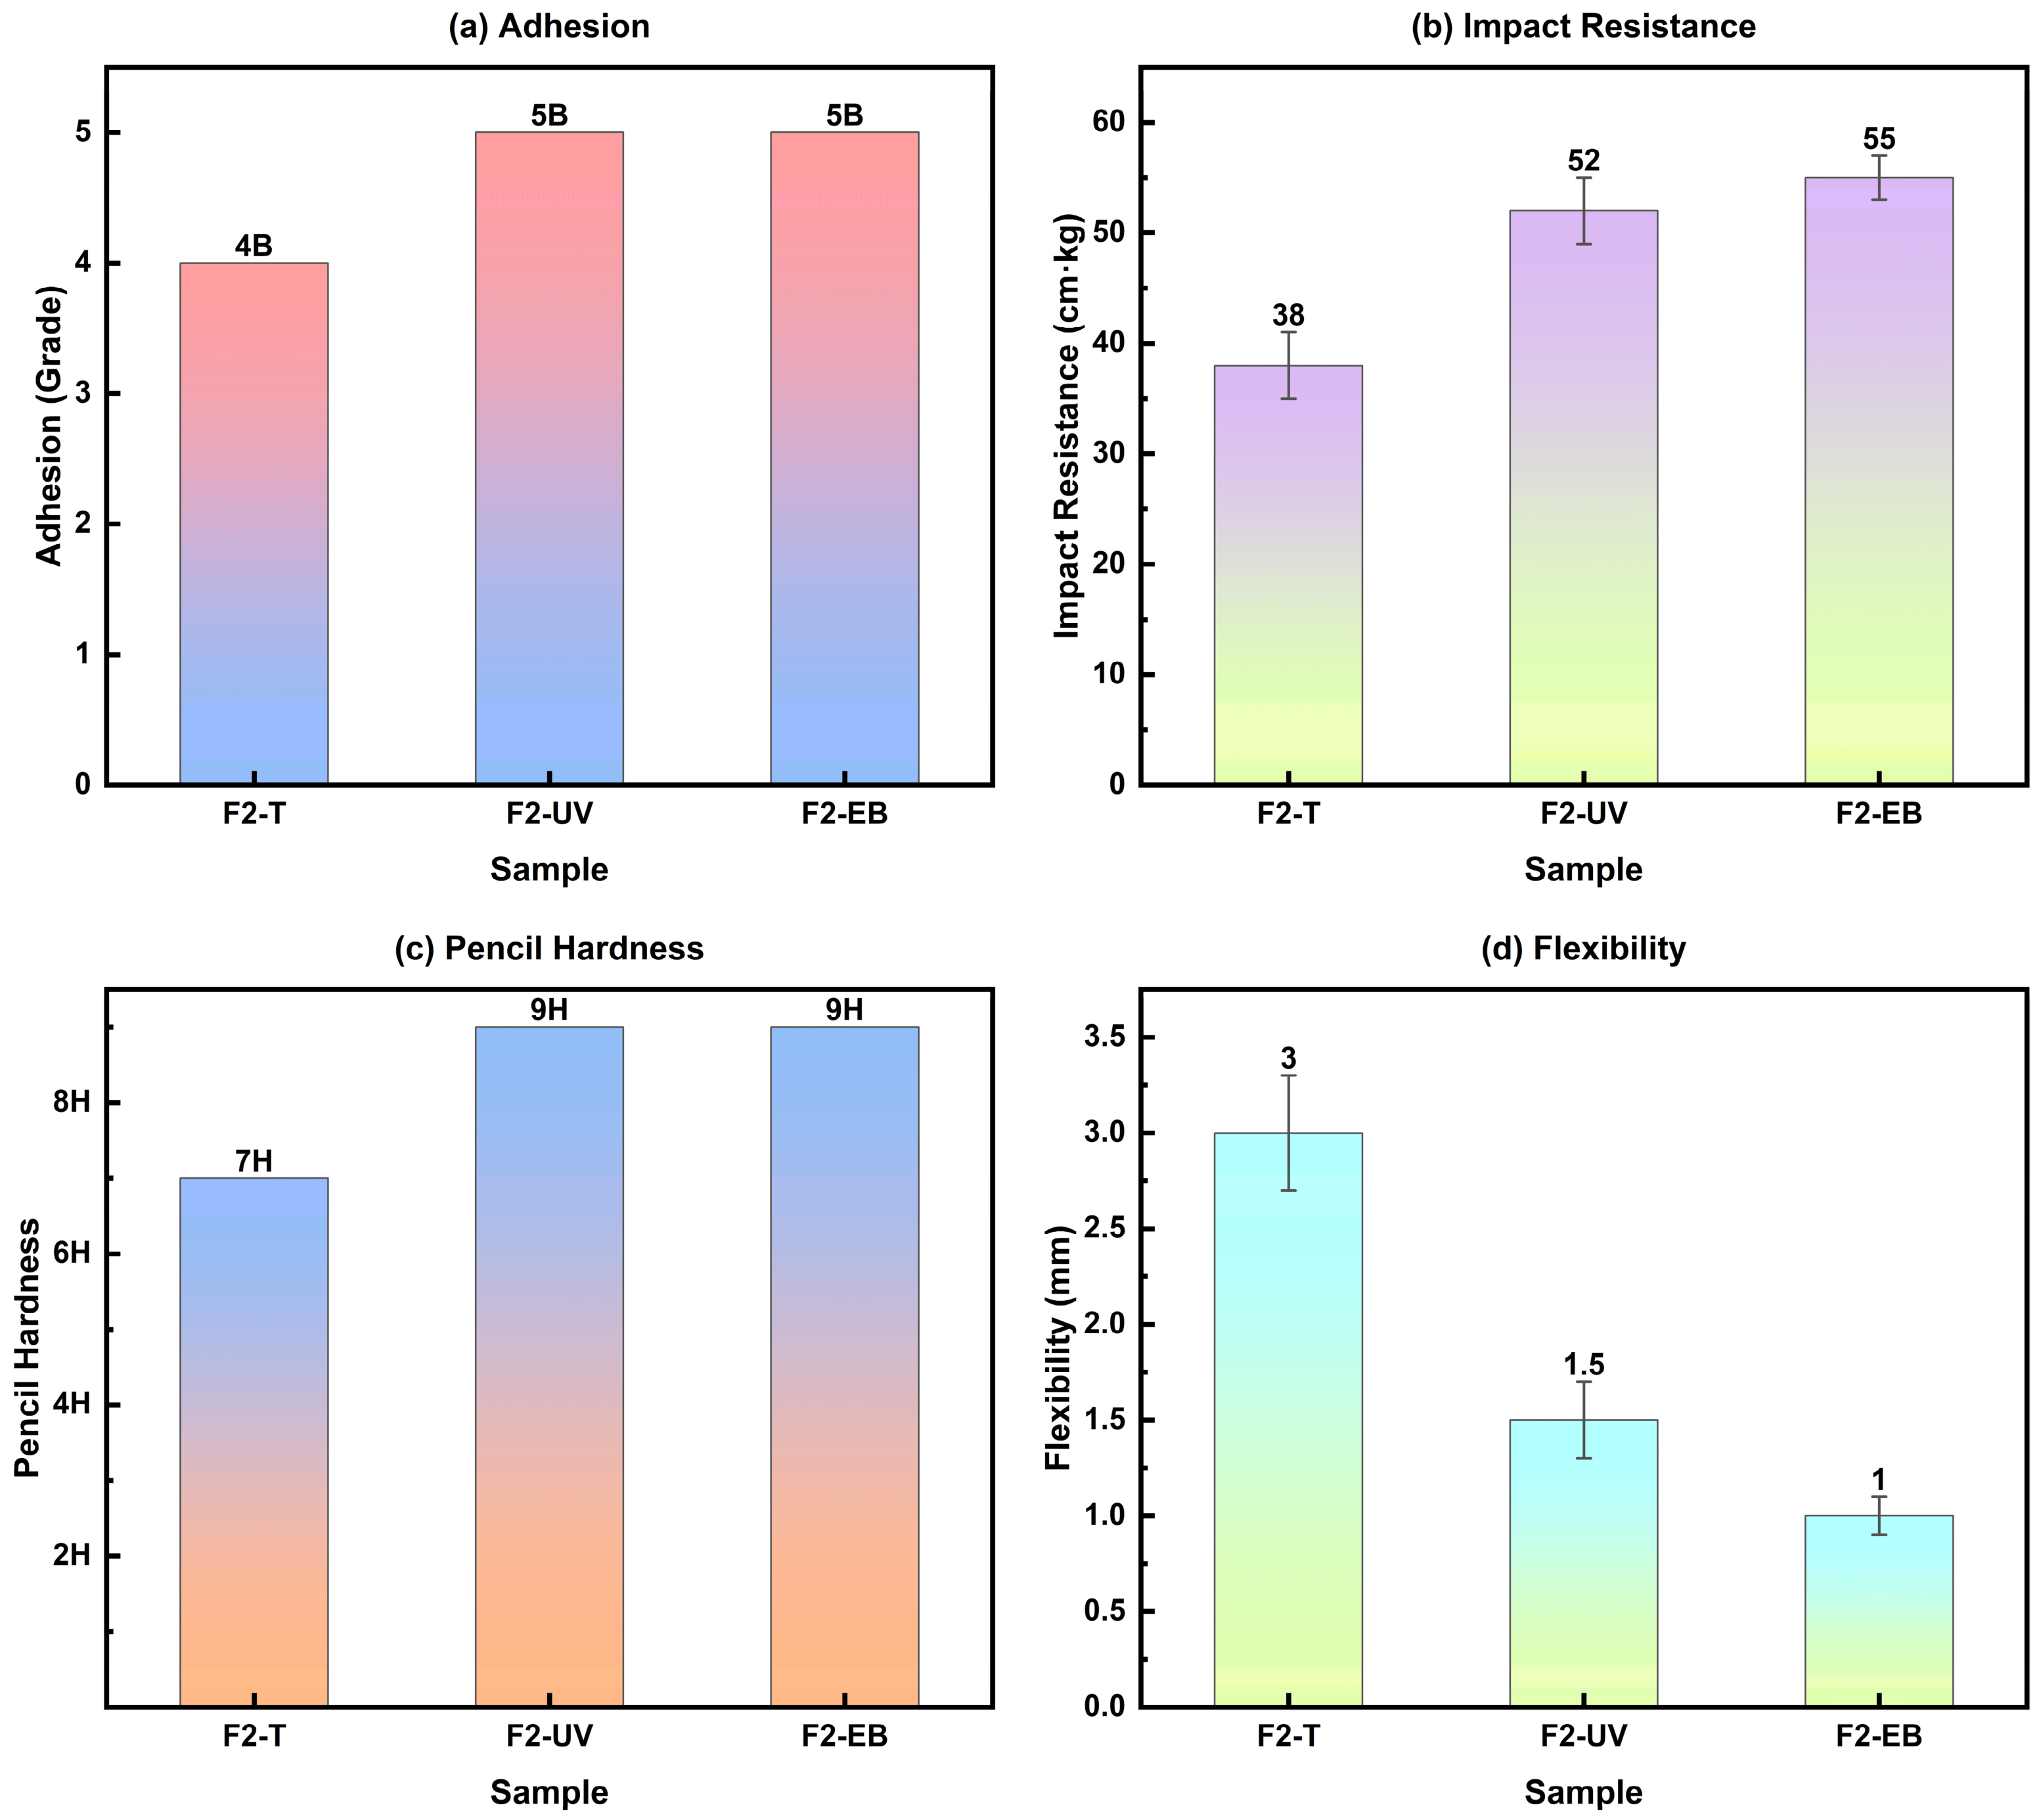
Table 5 and Figure 9 compare the mechanical properties of the three F2 coatings. F2-EB leads in every category: pencil hardness 9H (tied with F2-UV; F2-T = 7H), adhesion 5B (tied with F2-UV; F2-T = 4B), impact resistance 55 cm·kg (F2-UV = 52 cm·kg, +6%; F2-T = 38 cm·kg, +45%), and flexibility 1.0 mm (F2-UV = 1.5 mm; F2-T = 3.0 mm).
Table 5.
Comparison of mechanical properties of F2 formulation coatings under three curing methods.
Figure 9.
Comparison of mechanical properties of F2 formulation coatings under three curing methods: (a) adhesion, (b) impact resistance, (c) pencil hardness, (d) flexibility.
The 5B adhesion of F2-EB stems from two cooperating factors: residual carboxyl and hydroxyl groups on the MRGE rosin skeleton form strong hydrogen bonds with the phosphated steel surface, and the full-thickness uniform crosslinking keeps curing shrinkage to a minimum, preventing self-debonding from shrinkage stress concentration. F2-T, by contrast, suffers from slow, non-uniform shrinkage during the 40 h thermal cycle and drops to 4B. The impact resistance of F2-EB (55 cm·kg) is 45% higher than that of F2-T (38 cm·kg). Impact resistance integrates strength and toughness: the high crosslinking density from EB curing supplies strength, while the flexible aliphatic chains from the castor oil component supply ductility. At the F2 ratio, these two contributions are optimally balanced. F2-UV, despite a relatively high crosslinking density, develops a vertical crosslinking gradient whose weakly crosslinked layers act as crack initiation sites under impact, slightly lowering the impact resistance relative to F2-EB. The mechanical property set of F2-EB—9H hardness, 5B adhesion, 55 cm·kg impact resistance, and 1.0 mm flexibility—ranks among the best reported for bio-based coating systems and matches or surpasses the performance of commercial petroleum-based insulating coatings.
3.3.5. Anti-Corrosion Performance Comparison
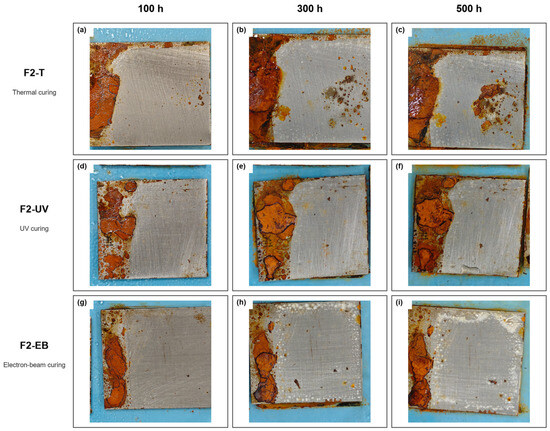
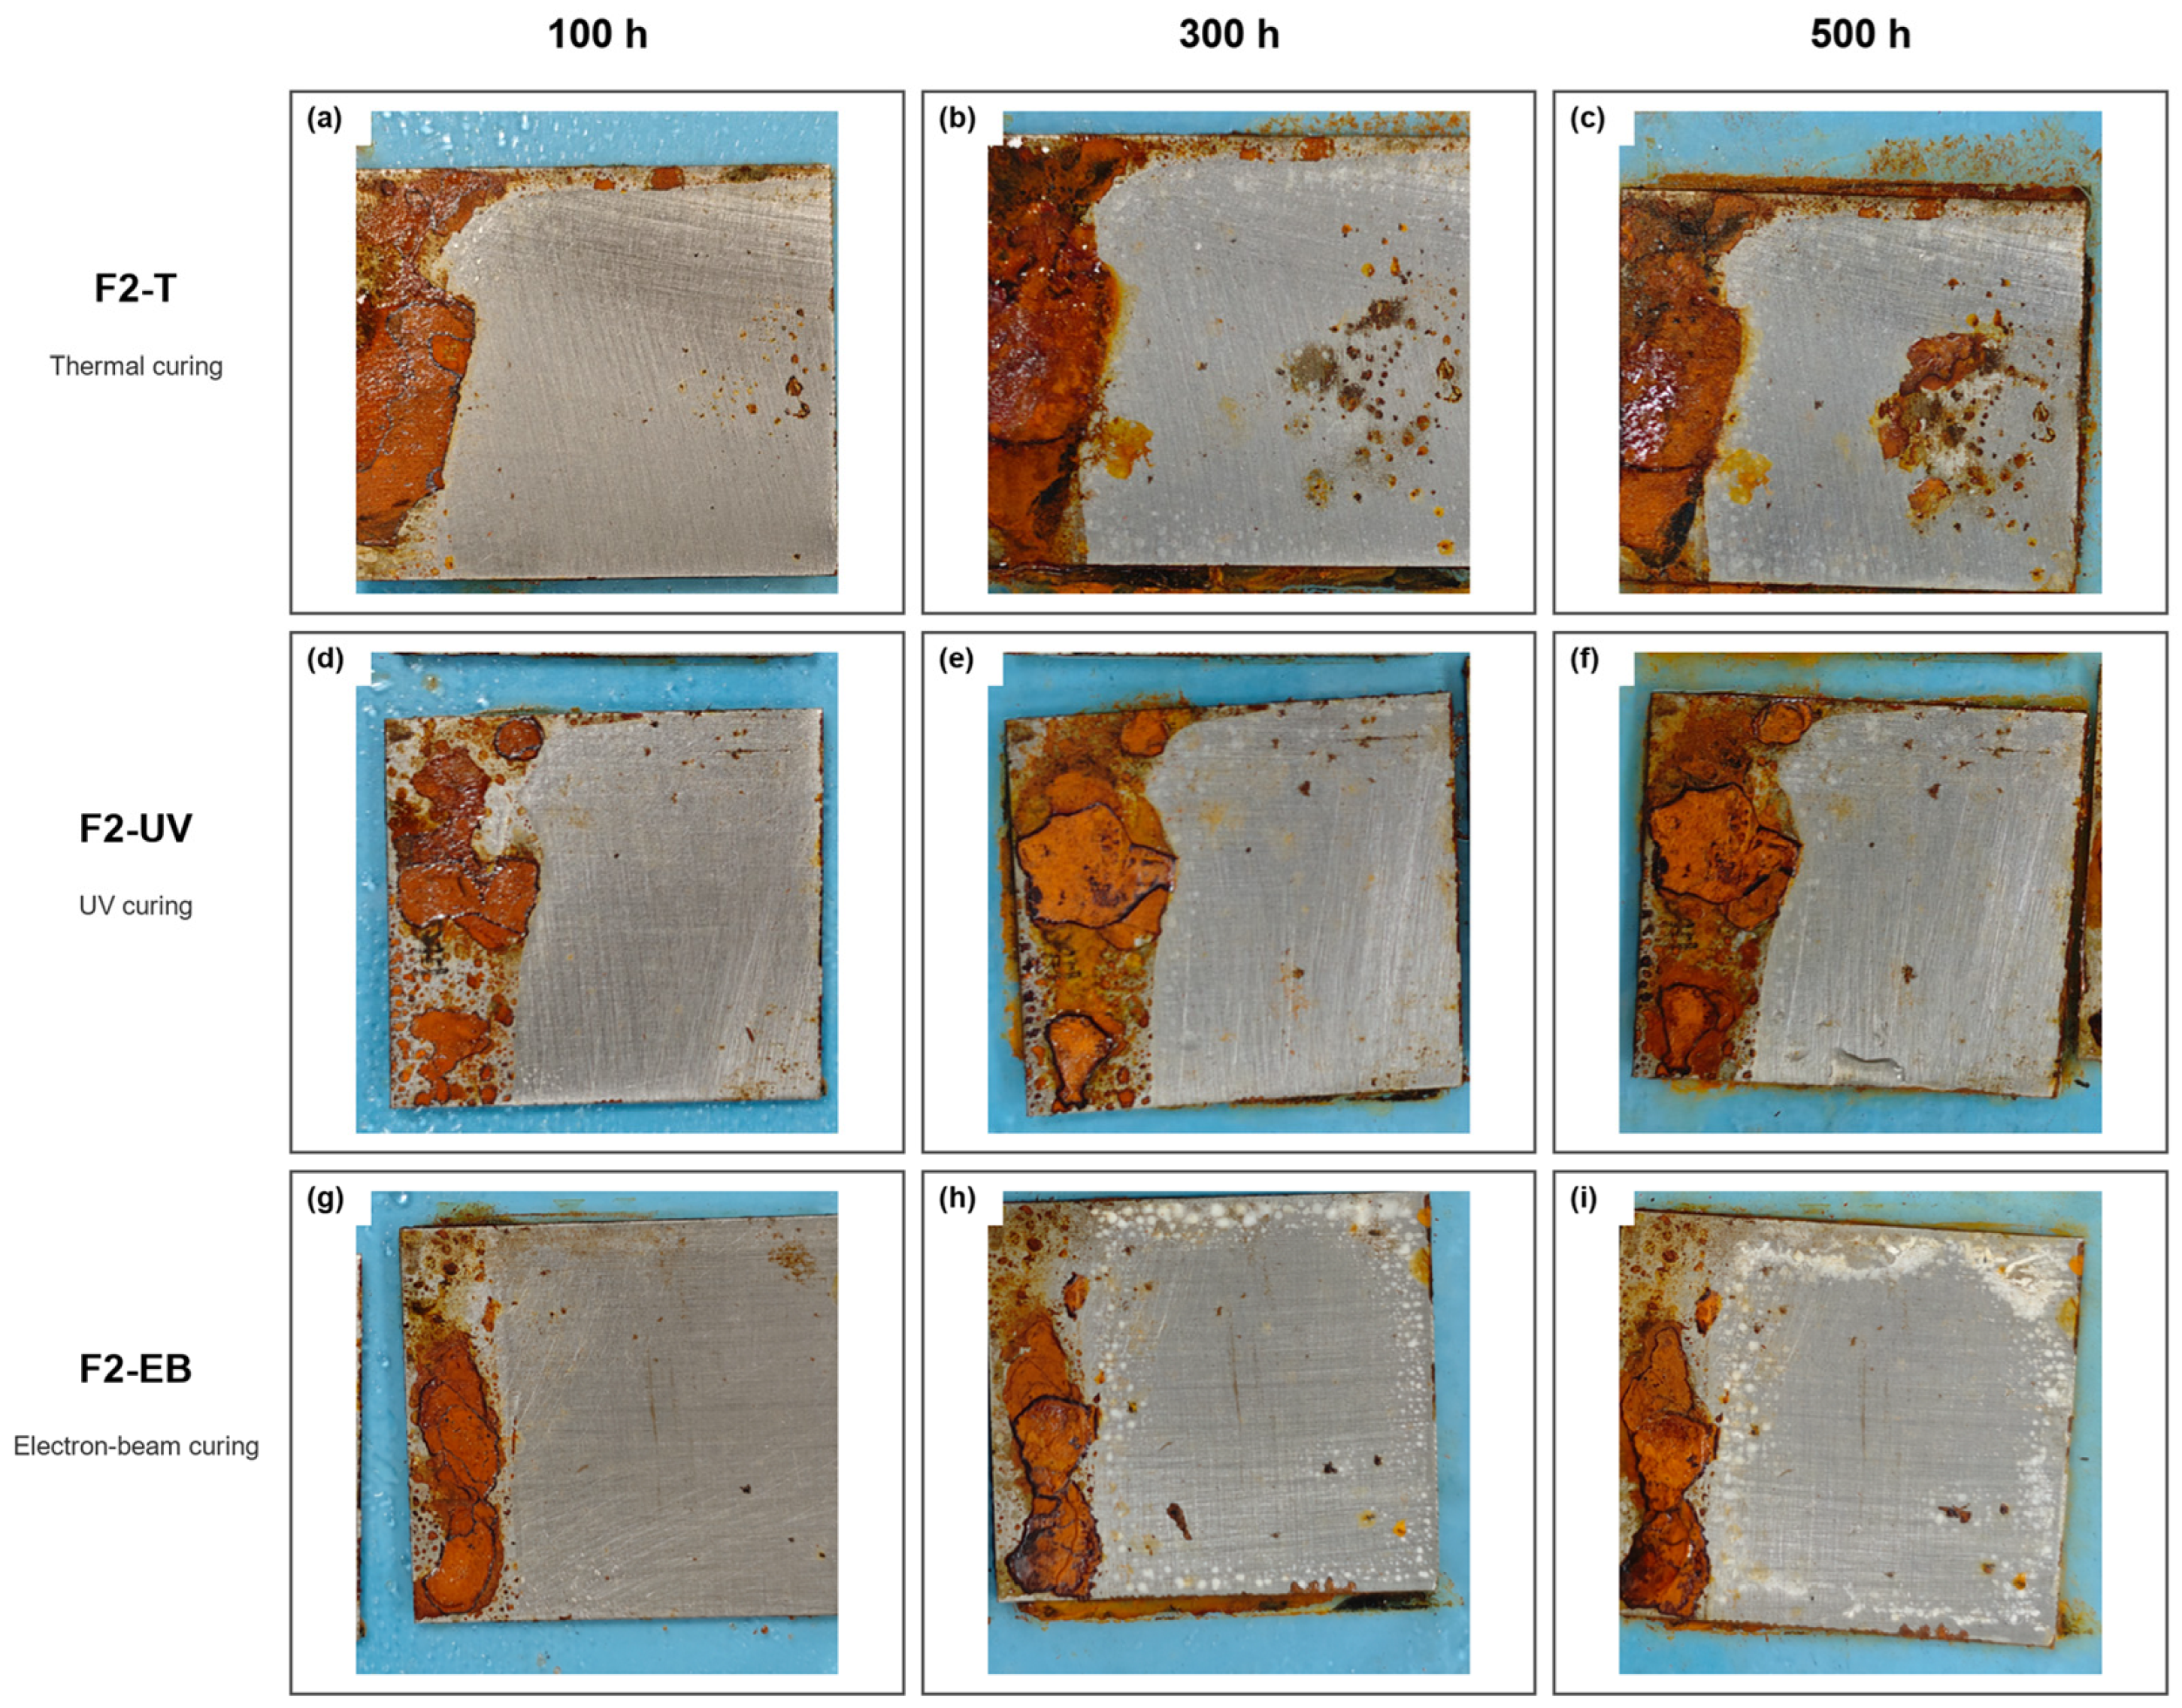
To complement the endpoint salt spray ratings, Figure 10 shows the time-resolved photographs at 100, 300, and 500 h recorded for F2-T, F2-UV, and F2-EB. The same physical panel was followed across all three intervals for each curing route; the photographs are used for qualitative comparison of damage evolution. F2-T shows the clearest propagation from the panel edge into the coated field together with localized face corrosion. F2-UV retains a largely continuous central region, but the edge-localized attack is more evident. F2-EB shows the least change in the assessed central coating region through 500 h; visible changes remain concentrated near the same panel edge and the central film remains visually continuous. This qualitative order agrees with the endpoint protection-grade and corrosion creep evaluations.
Figure 10.
Time-resolved neutral salt spray appearance of F2 coatings at 100, 300, and 500 h: (a–c) F2-T; (d–f) F2-UV; and (g–i) F2-EB. The same representative panel is followed across all three intervals for each curing route; the photographs are used for qualitative comparison of damage evolution.
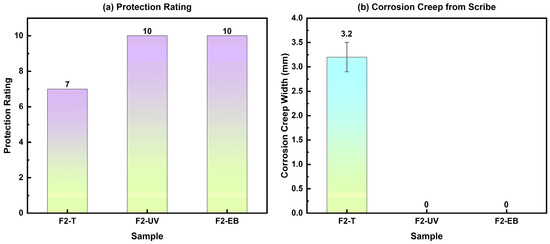
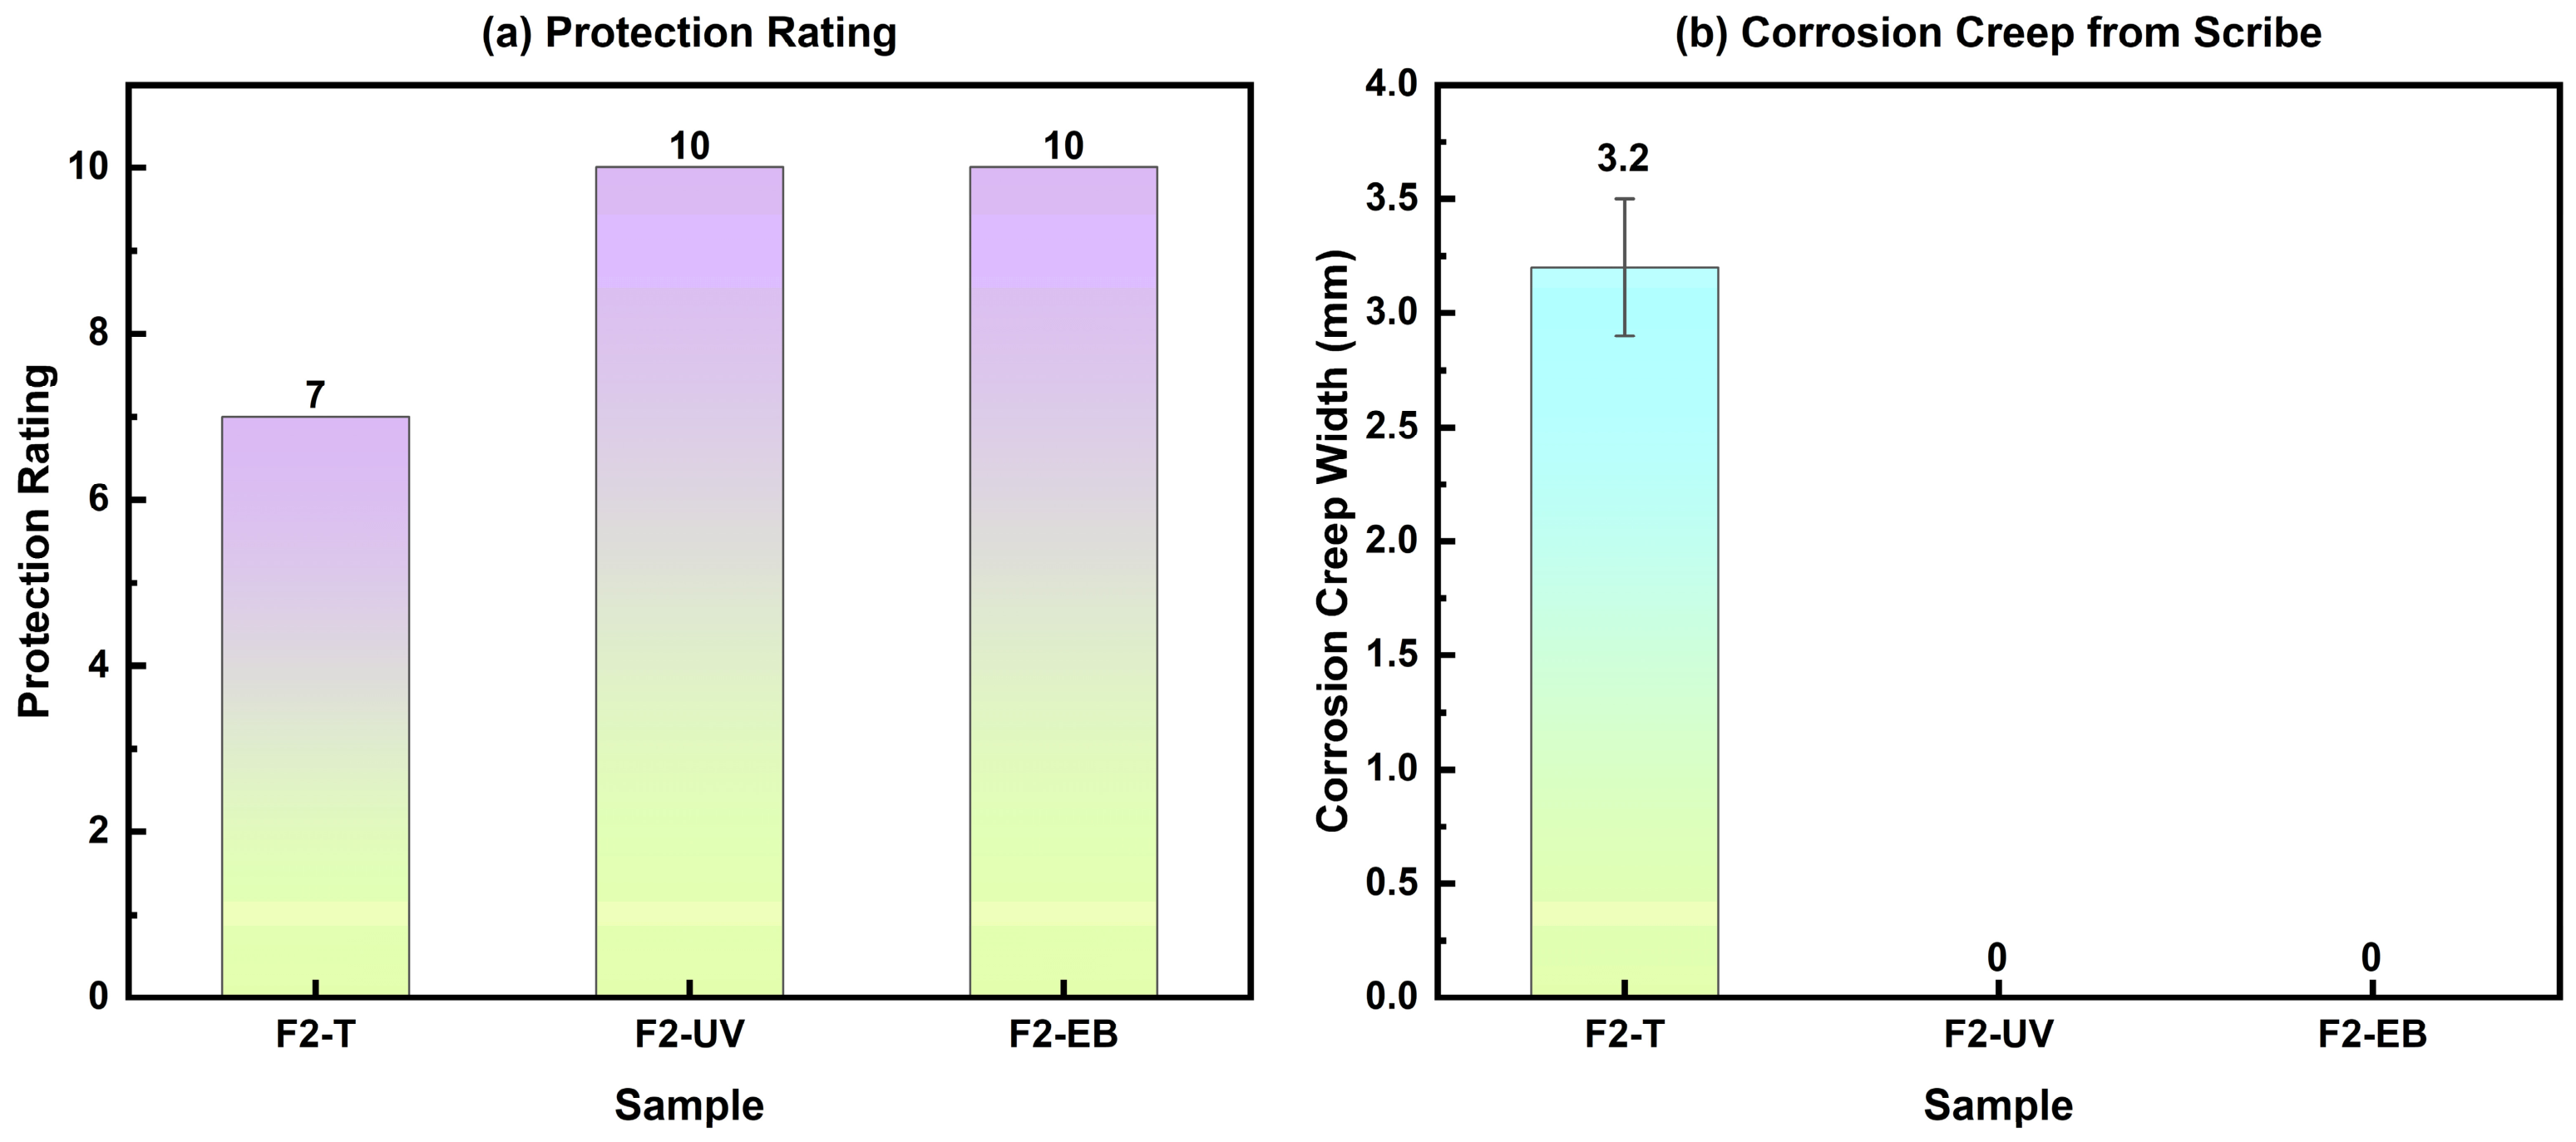
Table 6 and Figure 11 present the results after 500 h of neutral salt spray. Both F2-EB and F2-UV achieved a protection rating of 10, with no blistering, rusting, or peeling, and zero corrosion creep at the scribe. F2-T managed only a rating of 7, with 3.2 mm creep, 2.0% blistering area, and 5.5% rusting area.
Table 6.
Comparison of anti-corrosion performance of F2 formulation coatings after 500 h of salt spray testing (n = 3).
Figure 11.
Comparison of anti-corrosion performance of F2 formulation coatings after 500 h of salt spray testing: (a) protection grade, (b) corrosion creep width.
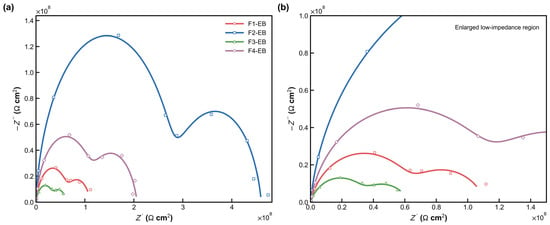
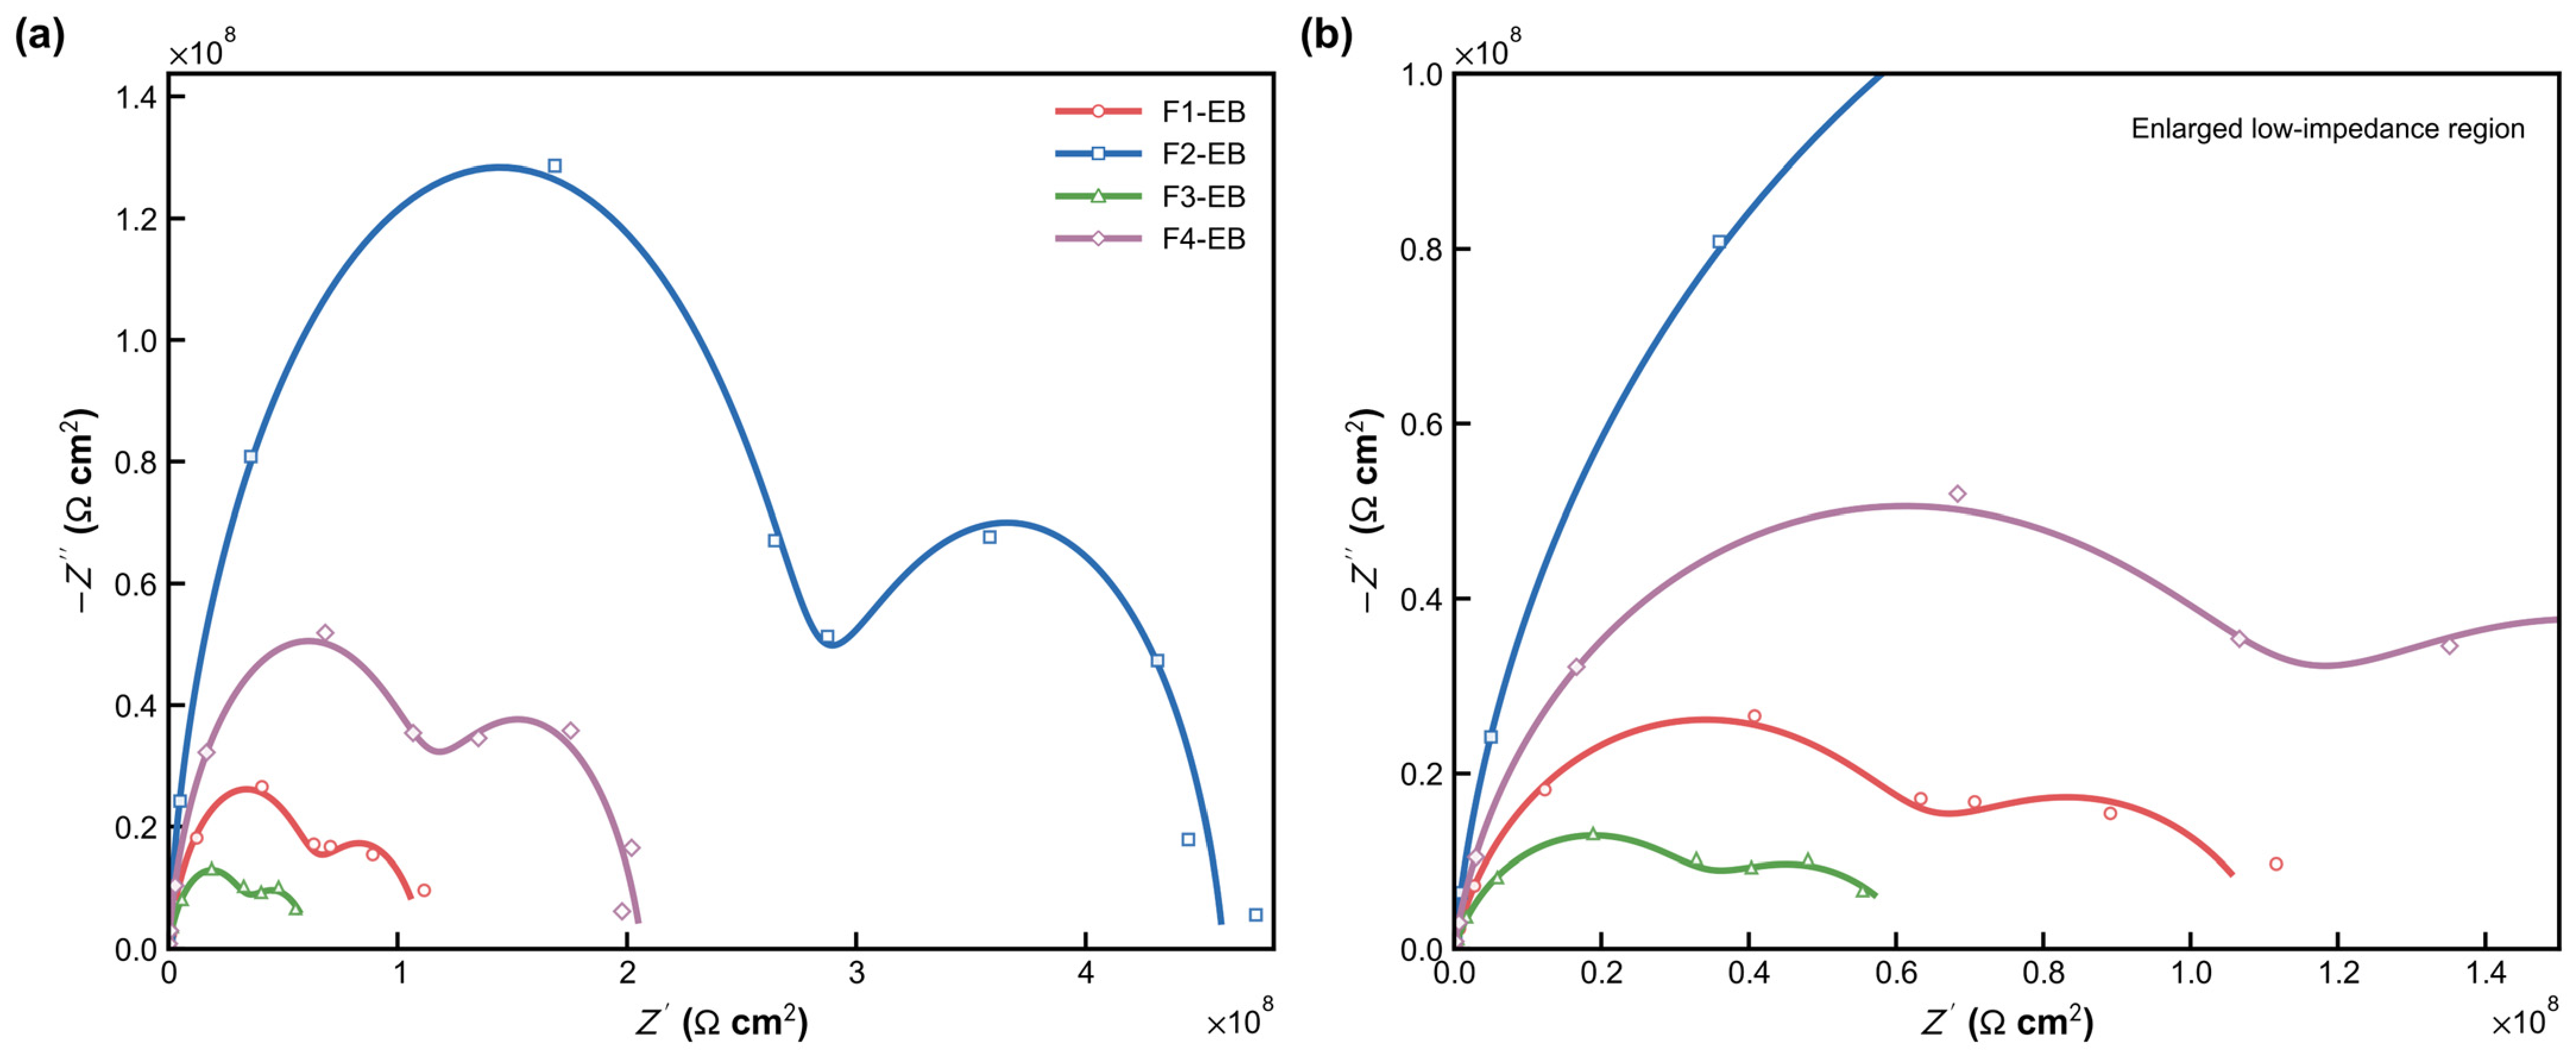
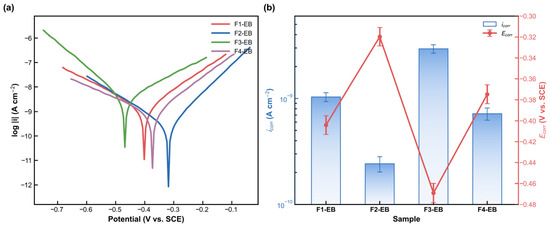
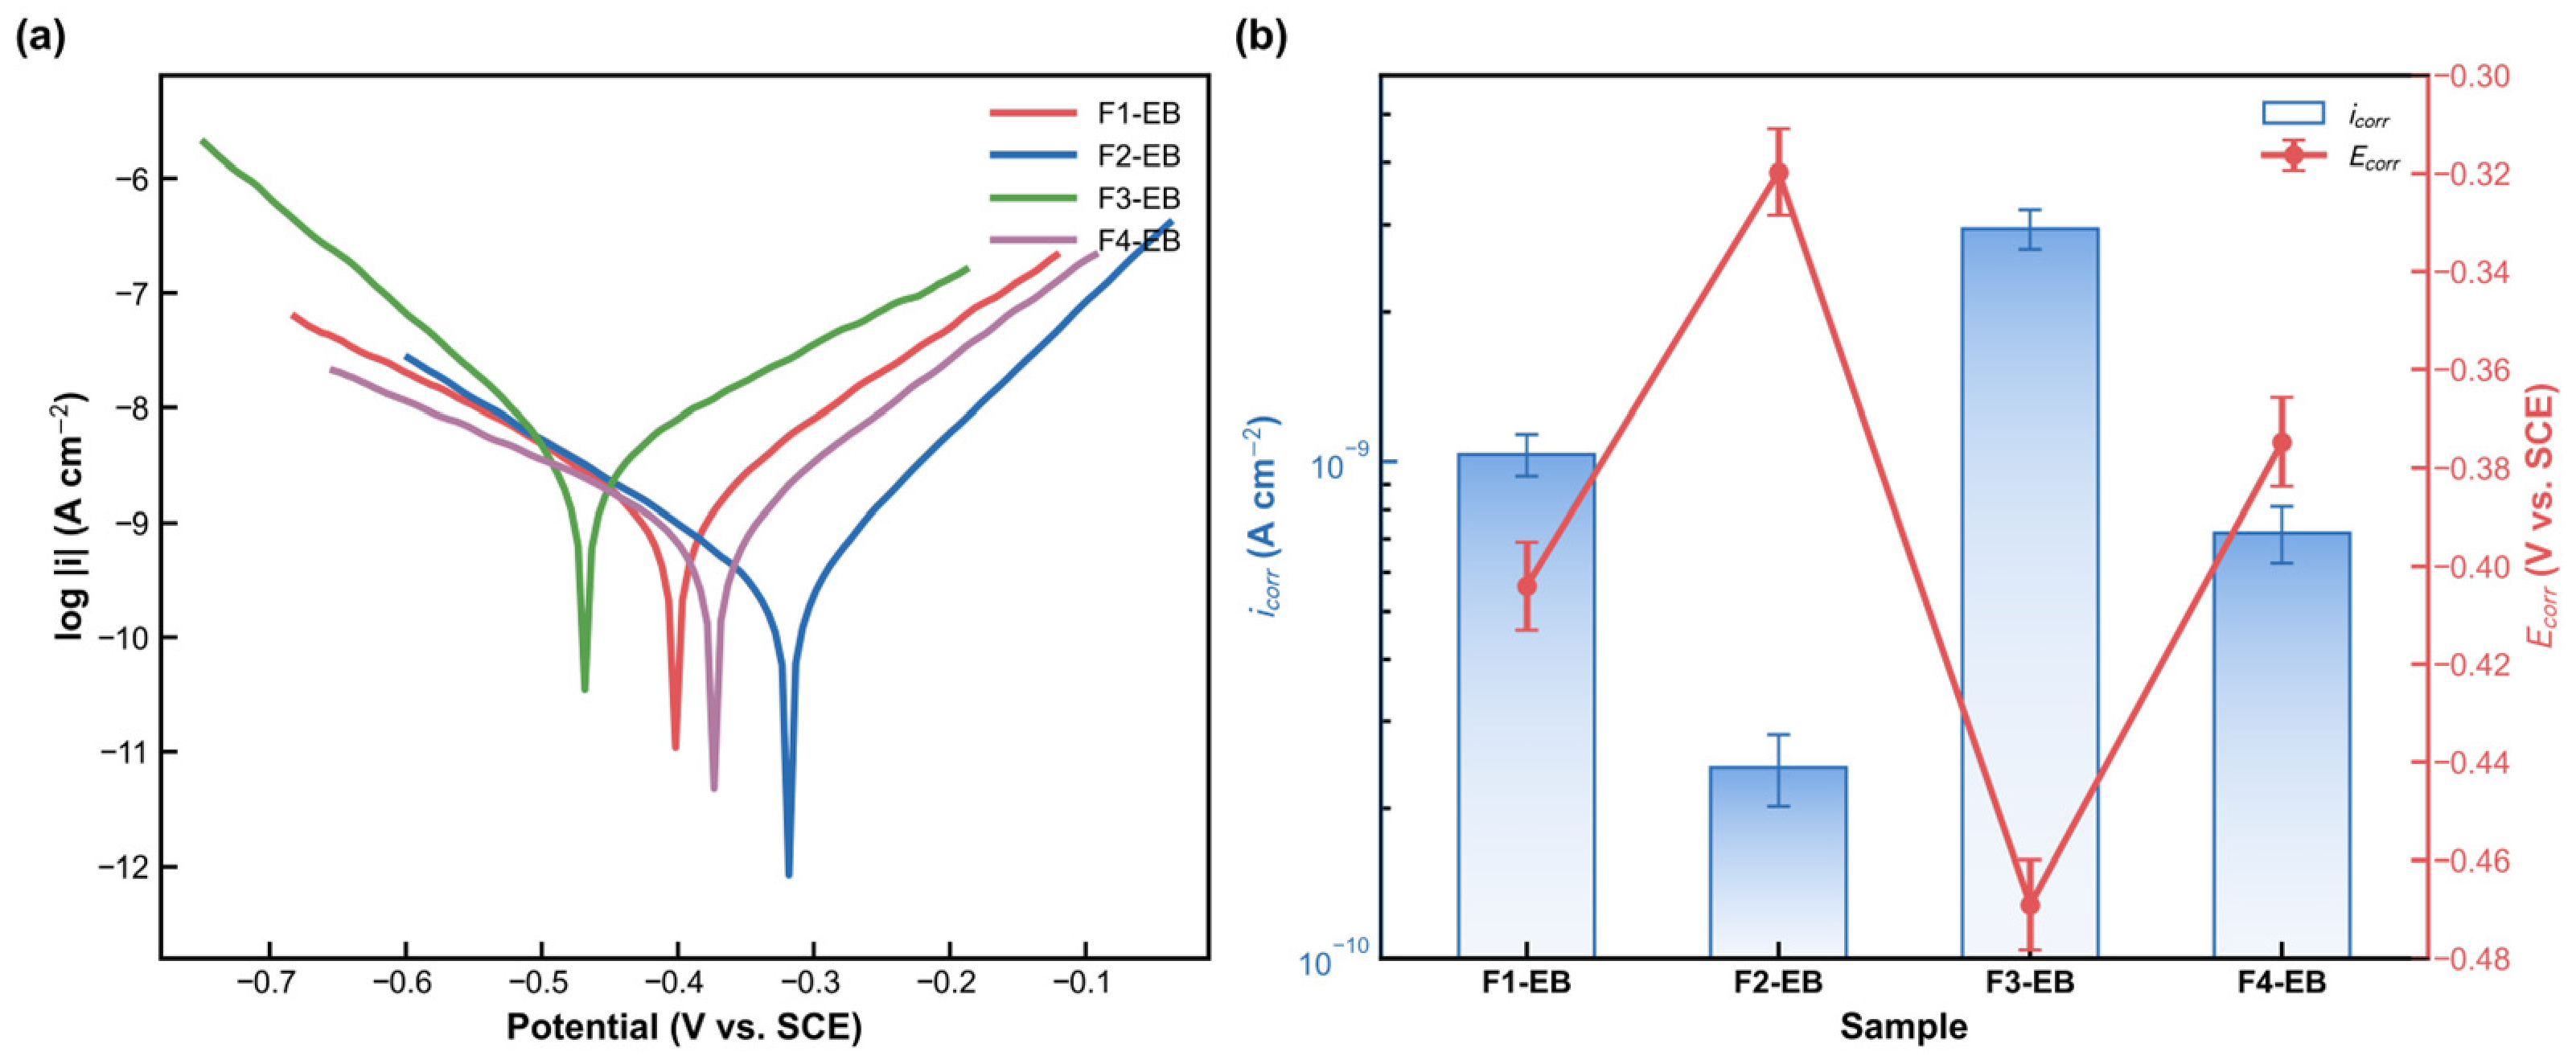
EIS and potentiodynamic polarization were performed after 1 day of immersion in 3.5 wt% NaCl for the four EB-cured formulations (F1-EB, F2-EB, F3-EB, and F4-EB; n = 3) to provide complementary short-term barrier and corrosion information. Figure 12 shows the Nyquist plots, and Figure 13 presents the Tafel curves and fitted corrosion parameters. F2-EB exhibits the largest low-frequency impedance response, the lowest fitted corrosion current density, and the most positive corrosion potential among the EB-cured formulations, indicating the strongest short-term electrolyte barrier behavior. It is explicitly stated that neither the 1 day electrochemical test nor the 500 h neutral salt spray test alone constitutes service life qualification.
Figure 12.
Nyquist plots of F1-EB, F2-EB, F3-EB, and F4-EB after 1 day of immersion in 3.5 wt% NaCl: (a) full impedance range and (b) enlarged low-impedance region. Symbols show mean data and solid lines show fitted responses (n = 3).
Figure 13.
Potentiodynamic polarization after 1 day of immersion in 3.5 wt% NaCl: (a) representative Tafel curves and (b) fitted corrosion current density and corrosion potential (mean ± SD, n = 3).
Three cooperating mechanisms account for the anti-corrosion performance of F2-EB. First, the densely crosslinked network constitutes a nearly impermeable physical barrier: according to the free volume theory, higher crosslinking density sharply reduces the diffusion and permeation coefficients of water, dissolved oxygen, and chloride ions within the film [26]. Similar synergistic barrier/inhibitor concepts have been used to improve the corrosion protection of waterborne coatings [27]. Second, zinc phosphate in the formulation hydrolyzes to release PO43−, which reacts with Fe2+ from the steel substrate to deposit insoluble iron phosphate passivation films (Fe3(PO4)2·8H2O and FePO4·2H2O), creating a secondary protective layer at the coating/substrate interface (chemical passivation). Third, phosphate hydrolysis buffers the interfacial pH to a neutral-to-slightly-alkaline range (pH 7–9), stabilizing the corrosion potential of steel in the passive region. Although F2-T has the same formulation composition, its lightly crosslinked network contains ample free-volume and micro-channels that cannot block the ingress of corrosive species, and its anti-corrosion performance degrades accordingly. The sharp contrast between F2-EB and F2-T—same chemistry, different crosslinking density—shows that crosslinking density, rather than formulation composition alone, determines long-term barrier performance.
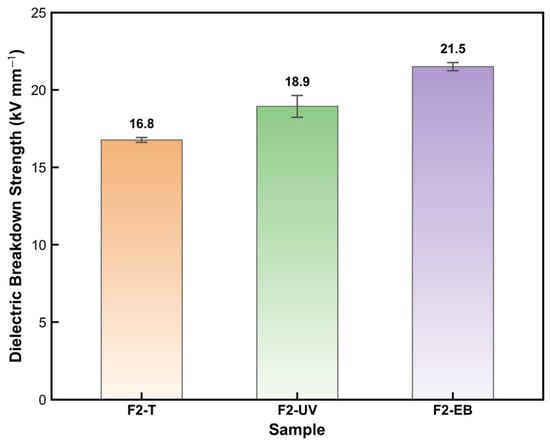
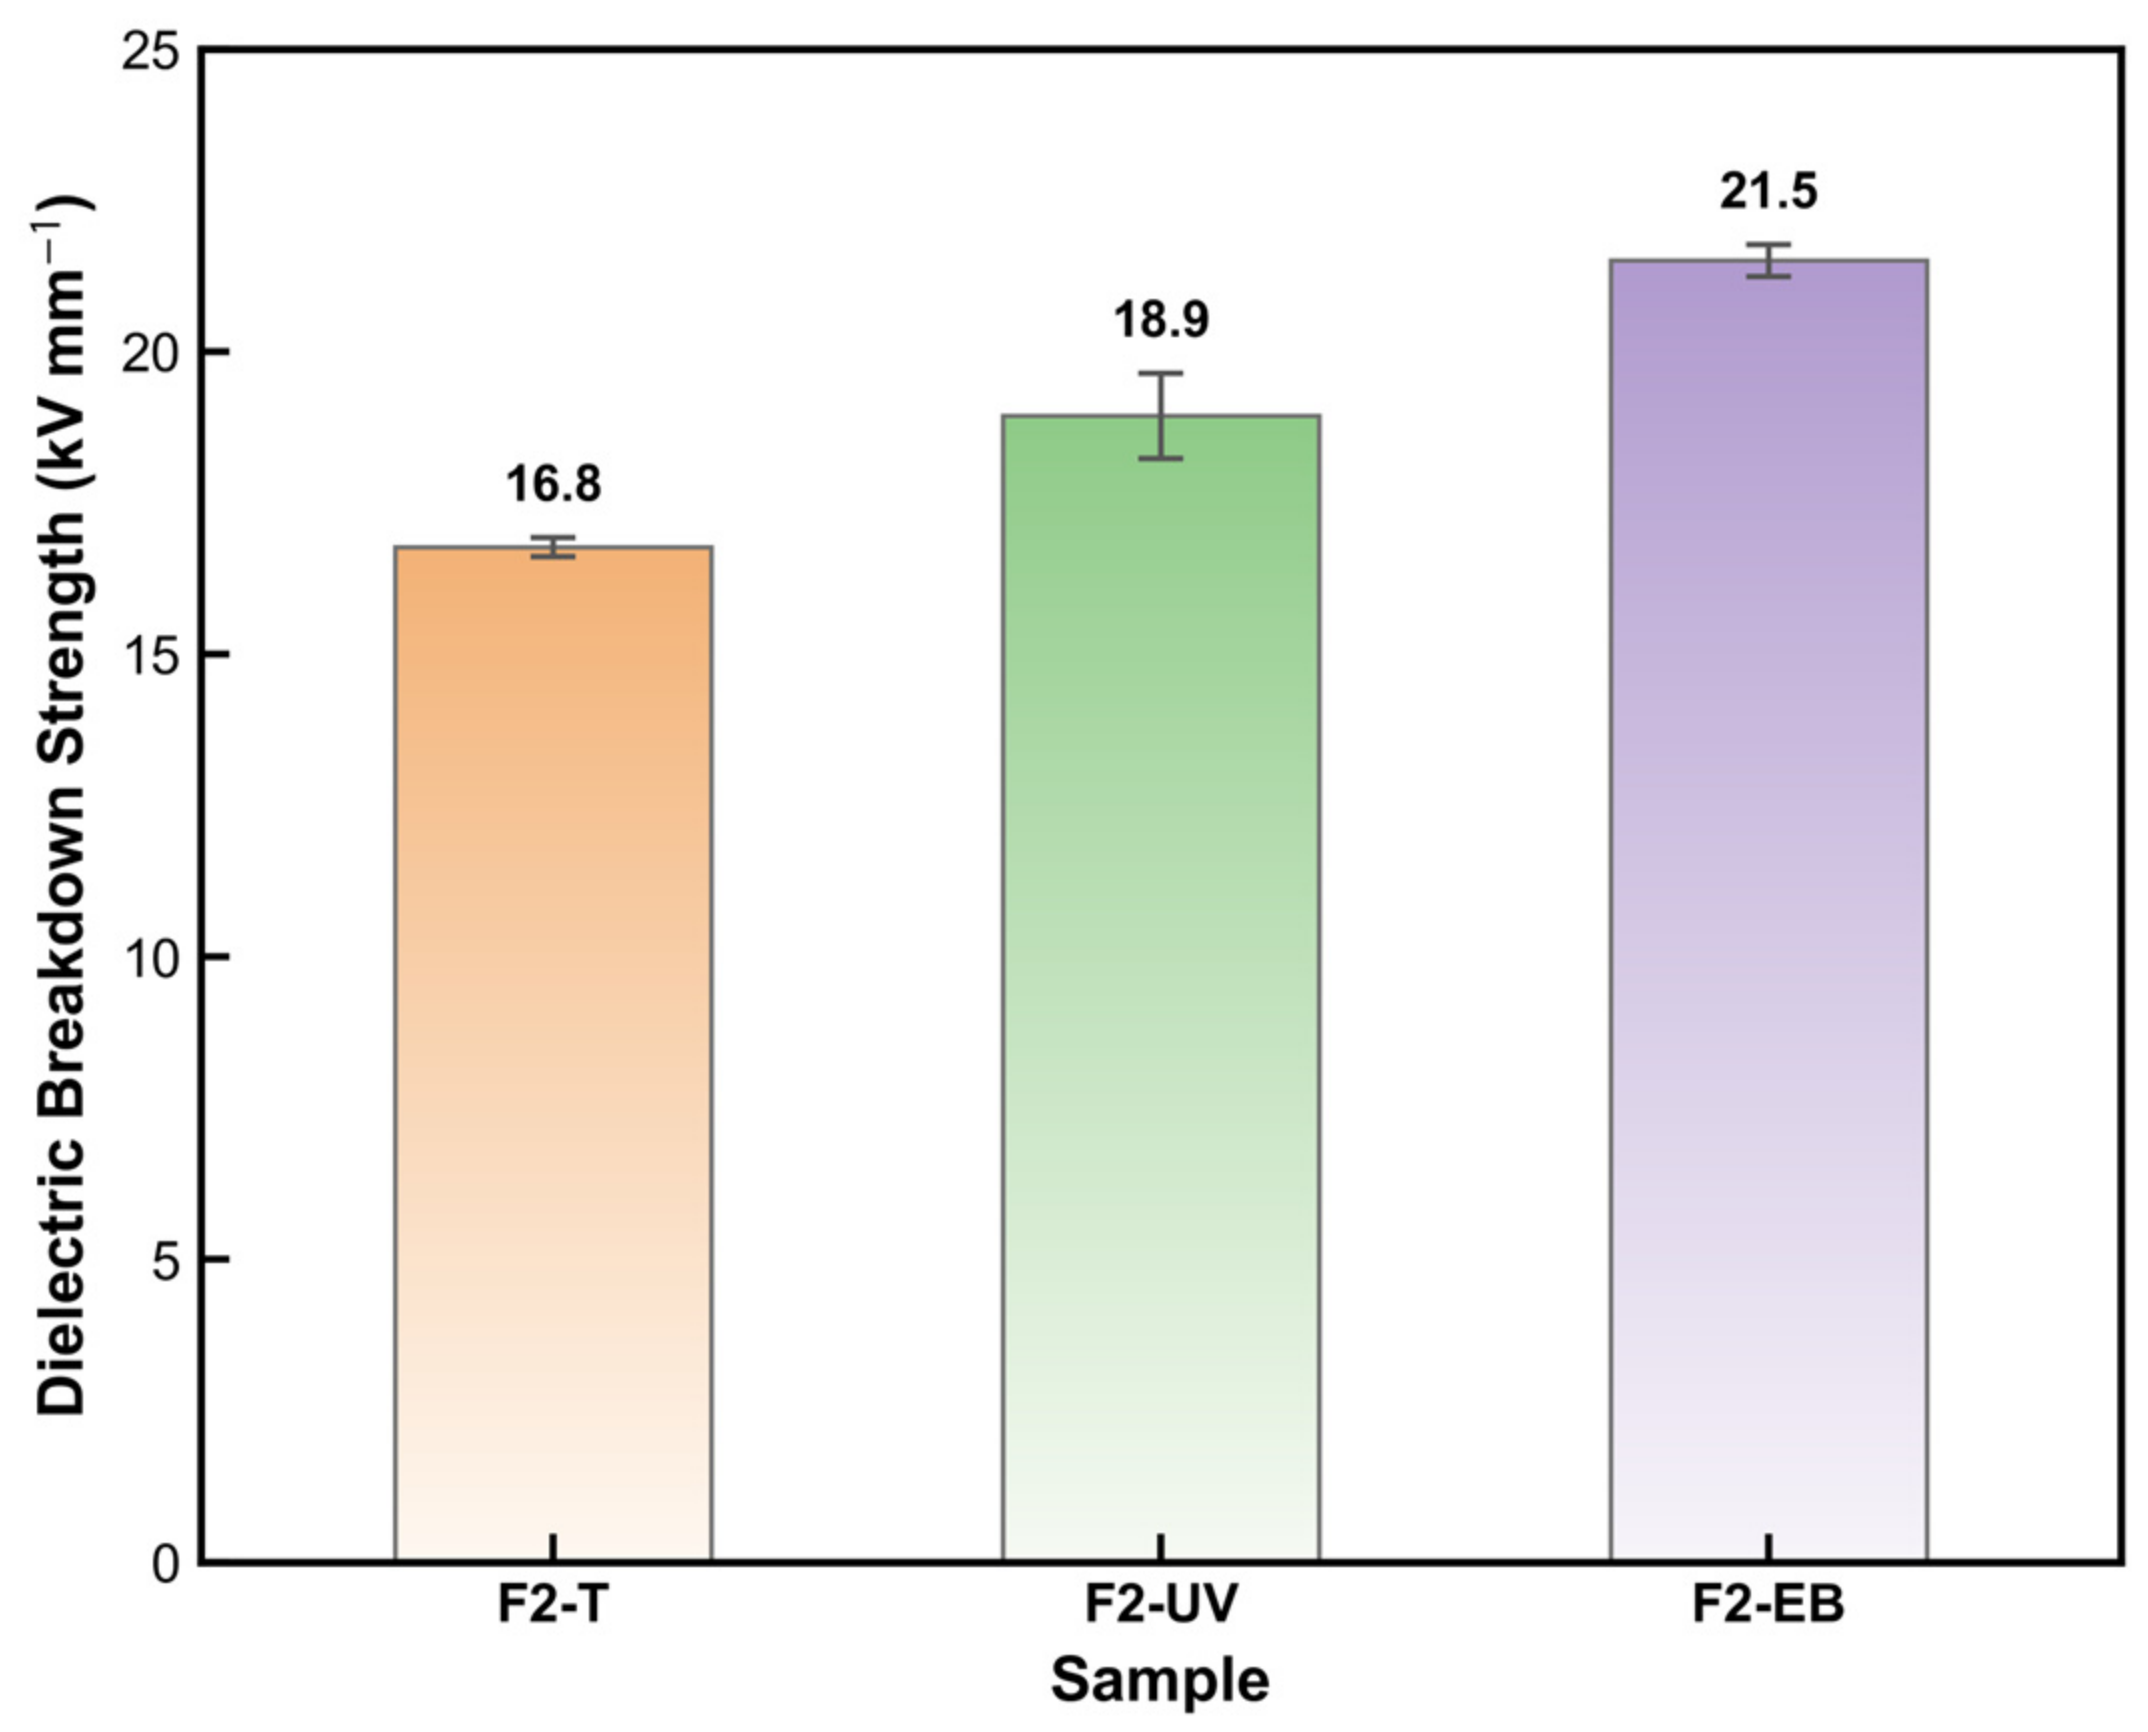
Figure 14 presents the AC dielectric breakdown strength of the three F2 coatings. AC dielectric breakdown strength increased from 16.8 ± 0.2 kV mm−1 for F2-T to 18.9 ± 0.7 kV mm−1 for F2-UV and 21.5 ± 0.3 kV mm−1 for F2-EB. The moderate increase for F2-EB is consistent with fewer electrically weak defects and a more continuous network. The larger variation for F2-UV is discussed in relation to local differences in conversion and film thickness. Volume resistivity, dielectric constant, dielectric loss, partial discharge resistance, and coupled electrical–thermal aging remain necessary for application qualification.
Figure 14.
AC dielectric breakdown strength of F2-T, F2-UV, and F2-EB coatings (mean ± SD, n = 3).
Overall, EB curing produced the highest surface C=C conversion, thermal parameters, and numerical impact resistance for the F2 formulation, while several mechanical and salt spray metrics were comparable to those of UV curing. Three features may contribute to the observed response: (1) high-energy electron irradiation generates reactive species through ionization and excitation without requiring a conventional photoinitiator; (2) the deposited dose can be delivered rapidly under an oxygen-controlled atmosphere; and (3) the optimum complete formulation under EB irradiation need not coincide with the COOH/OH ratio calculated for a thermally activated condensation reaction.
EB curing outperforms UV and thermal curing in crosslinking efficiency, thermal stability, mechanical properties, and anti-corrosion barrier function. The differences in functional group concentration, local mobility, and network development may contribute to the observed formulation dependence. EB radiation penetrates the full film thickness and generates radicals directly, sustaining a more extensive insoluble network formation. Direct verification of the radical-level mechanisms would require time-resolved radical detection, for example electron paramagnetic resonance with appropriate spin trapping, together with controlled functional group or scavenger experiments.
Relative to representative commercial insulating coatings, F2-EB achieves competitive surface hardness and cross-cut adhesion, but its dielectric breakdown strength remains lower than published commercial values for Cerakote H-900, WEG Lacktherm 1319/17H, and Sprayon EL600. Accordingly, the present coating is considered a promising renewable, rapidly cured candidate rather than a fully qualified replacement. The present advantages are the renewable MRGE/MCOA feedstock and rapid, low-temperature EB cure; the electrical performance gap and the lack of long-term qualification are now stated explicitly. Direct testing against a commercial control under identical thickness, electrode, humidity, and aging conditions is required before application-level equivalence can be claimed.
4. Conclusions
A fully bio-based radiation-curable coating was developed from modified rosin glycerol ester (MRGE) and modified castor oil anhydride (MCOA). Four MRGE/MCOA mass ratios were examined, and each formulation was cured by thermal, UV, and electron beam (EB) methods. Gel content, swelling, EIS, potentiodynamic polarization, and AC dielectric breakdown measurements were added to provide direct network-level, electrochemical barrier, and electrical insulation evidence.
(1) The F2 formulation (MRGE/MCOA = 3:1) was the best-performing composition under all three curing methods, outperforming F4 (2.6:1) despite the latter corresponding to the COOH/OH stoichiometric equivalence point. In radiation-cured systems, therefore, the optimal monomer ratio is dictated by the kinetics of C=C radical addition polymerization rather than by condensation stoichiometry, and a moderate excess of the C=C-bearing resin component relative to the stoichiometric point may be beneficial for maximizing crosslinking density and coating performance.
(2) FTIR gave a C=C conversion of ~92% for F2-EB, compared with ~84% for F2-UV and ~62% for F2-T. Consistent with this, TG-DSC gave F2-EB the highest thermal stability: T5% = 298 °C, Tg = 88 ± 1 °C, and 800 °C char residue of 20.8%. Gel content increased from 52.4 ± 0.2% for F2-T to 56.2 ± 0.5% for F2-EB, and the swelling ratio decreased from 144.8 ± 0.4% to 128.5 ± 1.6%, supporting more extensive insoluble network formation after EB curing.
(3) AFM measurements showed that F2-EB had a Ra of only 5.8 nm, substantially lower than F2-UV (9.2 nm) and F2-T (18.5 nm), because EB-induced deep, uniform crosslinking suppresses surface micro-defects and phase separation.
(4) F2-EB combined 9H hardness, 5B adhesion, 55 cm·kg impact resistance, and 1.0 mm flexibility—an attractive strength–toughness balance. After 500 h of neutral salt spray, it maintained a protection rating of 10 with zero corrosion creep. EIS after 1 day of immersion showed the largest low-frequency impedance and lowest corrosion current density among the EB-cured formulations. AC dielectric breakdown strength reached 21.5 ± 0.3 kV mm−1, indicating initial electrical insulation potential.
(5) The properties of F2-EB offer environmental and process advantages stemming from a fully bio-based formulation, lower VOCs emissions, and curing within seconds. This system is a promising candidate for generator insulation coatings. Remaining limitations include that EIS and polarization cover only 1 day of immersion; the 500 h salt spray test does not reproduce all generator-service environments; gel content and swelling do not provide absolute crosslink density; through-thickness conversion and cross-sectional morphology remain unmeasured; only one electrical insulation indicator has been evaluated; and pilot-scale EB process stability has not yet been demonstrated.
Author Contributions
Conceptualization, K.S.; software, N.L.; validation, H.L. (Haozhe Li), J.G. and G.L.; investigation, H.L. (Haozhe Li), J.G., H.W. and H.L. (Huijuan Liu); resources, K.S., Z.L., J.G., H.L. (Huijuan Liu), Z.Z., D.M. and J.H.; data curation, H.L. (Haozhe Li), N.L. and G.L.; writing—original draft, K.S.; writing—review and editing, K.S., H.L. (Haozhe Li), and N.L.; visualization, H.L. (Haozhe Li), and N.L.; supervision, K.D., C.F., G.L., Z.Z., D.M. and J.H. All authors have read and agreed to the published version of the manuscript.
Funding
This work was supported by the National Key Research and Development Program of China (Grant No. 2022YFB4100803), Youth Fund Project of Jiangxi Provincial Natural Science Foundation (Grant No. 20252BAC200003) and Early-Career Young Scientists and Technologists Project of Jiangxi Province (Grant No. 20252BEJ730179).
Institutional Review Board Statement
Not applicable.
Informed Consent Statement
Not applicable.
Data Availability Statement
The data presented in this study are not publicly available due to privacy and confidentiality restrictions. The raw data supporting the conclusions of this article are available from the corresponding author upon reasonable request.
Conflicts of Interest
Author Keyan Sheng, Zhijun Li, Jianxiong Guo, Kanglin Dai, Chongyang Feng, Gaotai Lv, Huaixiang Wang, Huijuan Liu, and Dangguo Ma were employed by Huadian Electric Power Research Institute Co., Ltd. The remaining authors declare that the research was conducted in the absence of any commercial or financial relationships that could be construed as a potential conflict of interest.
References
- Chattopadhyay, D.K.; Raju, K.V.S.N. Structural engineering of polyurethane coatings for high performance applications. Prog. Polym. Sci. 2007, 32, 352–418. [Google Scholar] [CrossRef] [Scilit]
- Zheng, S.; Li, J. Inorganic–organic sol-gel hybrid coatings for corrosion protection of metals. J. Sol-Gel Sci. Technol. 2010, 54, 174–187. [Google Scholar] [CrossRef] [Scilit]
- Sharmin, E.; Zafar, F.; Akram, D.; Alam, M.; Ahmad, S. Recent advances in vegetable oils based environment friendly coatings: A review. Ind. Crops Prod. 2015, 76, 215–229. [Google Scholar] [CrossRef] [Scilit]
- Wicks, Z.W., Jr.; Jones, F.N.; Pappas, S.P.; Wicks, D.A. Organic Coatings: Science and Technology, 3rd ed.; John Wiley & Sons: Hoboken, NJ, USA, 2007. [Google Scholar]
- Gandini, A.; Lacerda, T.M.; Carvalho, A.J.F.; Trovatti, E. Progress of polymers from renewable resources: Furans, vegetable oils, and polysaccharides. Chem. Rev. 2016, 116, 1637–1669. [Google Scholar] [CrossRef] [Scilit] [PubMed]
- Zhang, C.; Garrison, T.F.; Madbouly, S.A.; Kessler, M.R. Recent advances in vegetable oil-based polymers and their composites. Prog. Polym. Sci. 2017, 71, 91–143. [Google Scholar] [CrossRef] [Scilit]
- Ma, S.; Li, T.; Liu, X.; Zhu, J. Research progress on bio-based thermosetting resins. Polym. Int. 2016, 65, 164–173. [Google Scholar] [CrossRef] [Scilit]
- De Smet, D.; Uyttendaele, W.; Vanneste, M. Bio-based 2K PU coating for durable textile applications. Coatings 2022, 12, 169. [Google Scholar] [CrossRef] [Scilit]
- Wilbon, P.A.; Chu, F.; Tang, C. Progress in renewable polymers from natural terpenes, terpenoids, and rosin. Macromol. Rapid Commun. 2013, 34, 8–37. [Google Scholar] [CrossRef] [Scilit] [PubMed]
- Wang, J.; Yao, K.; Korich, A.L.; Li, S.; Ma, S.; Ploehn, H.J.; Iovine, P.M.; Wang, C.; Chu, F.; Tang, C. Combining renewable gum rosin and lignin: Towards hydrophobic polymer composites by controlled polymerization. J. Polym. Sci. Part A Polym. Chem. 2011, 49, 3728–3738. [Google Scholar] [CrossRef] [Scilit]
- Mutlu, H.; Meier, M.A.R. Castor oil as a renewable resource for the chemical industry. Eur. J. Lipid Sci. Technol. 2010, 112, 10–30. [Google Scholar] [CrossRef] [Scilit]
- Decker, C. The use of UV irradiation in polymerization. Polym. Int. 1998, 45, 133–141. [Google Scholar] [CrossRef] [Scilit]
- Yagci, Y.; Jockusch, S.; Turro, N.J. Photoinitiated polymerization: Advances, challenges, and opportunities. Macromolecules 2010, 43, 6245–6260. [Google Scholar] [CrossRef] [Scilit]
- Fouassier, J.P.; Lalevée, J. Photoinitiators for Polymer Synthesis: Scope, Reactivity, and Efficiency; Wiley-VCH: Weinheim, Germany, 2012. [Google Scholar] [CrossRef] [Scilit]
- Cleland, M.R.; Parks, L.A.; Cheng, S. Applications for radiation processing of materials. Nucl. Instrum. Methods Phys. Res. Sect. B 2003, 208, 66–73. [Google Scholar] [CrossRef] [Scilit]
- Singh, A.; Silverman, J. Radiation Processing of Polymers; Hanser Publishers: Munich, Germany, 1992. [Google Scholar]
- Drobny, J.G. Radiation Technology for Polymers, 2nd ed.; CRC Press: Boca Raton, FL, USA, 2010. [Google Scholar] [CrossRef] [Scilit]
- Landry, V.; Blanchet, P.; Boivin, G.; Bouffard, J.-F.; Vlad, M. UV-LED curing efficiency of wood coatings. Coatings 2015, 5, 1019–1033. [Google Scholar] [CrossRef] [Scilit]
- Wang, Y.; Cao, Z.; Wang, Z.; Ma, A. Synthesis of trivinylisooctyl POSS and its application in UV-curing of polyurethane acrylate coatings. Coatings 2022, 12, 1036. [Google Scholar] [CrossRef] [Scilit]
- Zhang, D.; Song, K. Effects of photoinitiators on curing performance of wood wax oil coating on wood. Coatings 2024, 14, 2. [Google Scholar] [CrossRef] [Scilit]
- Li, H.; Sheng, K.; Chen, Z.; Hao, S.; Zhou, Z.; Zhang, Z.; Liu, X.; Xiong, M.; Gu, Y.; Huang, J. An electron beam irradiation-assisted coating method for the regulation of hydrophilicity and hydrophobicity. Ind. Chem. Mater. 2024, 2, 458–468. [Google Scholar] [CrossRef] [Scilit]
- Sheng, K.; Dong, X.; Li, H.; Zhou, Z.; Zhou, W.; Zeng, T.; Liu, X.; Chen, Z.; Xiong, M.; Zhang, Z.; et al. Electron beam in-situ ultrafast curing of loadable primer-free polydimethylsiloxane coatings for composite insulators. Appl. Surf. Sci. 2023, 621, 156830. [Google Scholar] [CrossRef] [Scilit]
- Zhou, Z.; Li, H.; Xing, J.; Lin, C.; Zhang, Z.; Xiong, M.; Huang, J. Engineering implementation of permanent magnet uniform spreading system for 3 MeV electron beam accelerator. Nucl. Eng. Technol. 2025, 57, 103240. [Google Scholar] [CrossRef] [Scilit]
- Clough, R.L. High-energy radiation and polymers: A review of commercial processes and emerging applications. Nucl. Instrum. Methods Phys. Res. Sect. B 2001, 185, 8–33. [Google Scholar] [CrossRef] [Scilit]
- Stone, G.C.; Boulter, E.A.; Culbert, I.; Dhirani, H. Electrical Insulation for Rotating Machines: Design, Evaluation, Aging, Testing, and Repair, 2nd ed.; Wiley: Hoboken, NJ, USA, 2014. [Google Scholar] [CrossRef] [Scilit]
- Chmielewski, A.G.; Haji-Saeid, M.; Ahmed, S. Progress in radiation processing of polymers. Nucl. Instrum. Methods Phys. Res. Sect. B 2005, 236, 44–54. [Google Scholar] [CrossRef] [Scilit]
- Ress, J.; Martin, U.; Bastidas, D.M. Improved corrosion protection of acrylic waterborne coating by doping with microencapsulated corrosion inhibitors. Coatings 2021, 11, 1134. [Google Scholar] [CrossRef] [Scilit]

Disclaimer/Publisher’s Note: The statements, opinions and data contained in all publications are solely those of the individual author(s) and contributor(s) and not of MDPI and/or the editor(s). MDPI and/or the editor(s) disclaim responsibility for any injury to people or property resulting from any ideas, methods, instructions or products referred to in the content. |
© 2026 by the authors. Licensee MDPI, Basel, Switzerland. This article is an open access article distributed under the terms and conditions of the Creative Commons Attribution (CC BY) license.