


Abstract
To reveal the degradation mechanism and the formation mechanism of multiple power peaks in photovoltaic modules under irregular shading conditions, this study investigated the performance of full-cell photovoltaic modules through a combination of experimental and simulation approaches. First, the I–V and P–V characteristics of photovoltaic modules under partial and complete shading of photovoltaic cells at different locations were analyzed. The results show that, under local partial shading conditions, the photovoltaic module characteristics are mainly determined by the shaded area, whereas under complete cell shading conditions, the performance degradation primarily depends on the number of bypassed cell strings. A single-diode photovoltaic module simulation model was developed, and the coupling effects of representative partial shading ratios and the number of participating cell strings were analyzed on the MATLAB/Simulink platform. The results indicate that the characteristics of photovoltaic modules under partial shading conditions are jointly governed by the coupling effects of shading ratio and cell-string participation. As the shaded area increases, the degree of electrical mismatch among cells becomes more pronounced, causing the P–V characteristics to evolve from a single-peak profile to a multi-peak profile, accompanied by reduced peak differences and increasingly blurred characteristic boundaries. Through a comprehensive analysis of the simulation and experimental results, it is found that complex shading conditions enhance the multi-peak characteristics of power while causing the peak values to converge. These accompanying features increase the likelihood of multi-peak power points, thereby posing greater challenges to inverter operation and maximum power point tracking techniques in photovoltaic arrays. It is of great significance for optimizing the configuration of photovoltaic arrays and designing high-precision maximum power point tracking strategies.
1. Introduction
With the rapid deployment of distributed photovoltaic systems on building rooftops, urban microgrids, and other complex outdoor installations, the operating environment of photovoltaic (PV) modules has become increasingly challenging. Factors such as cloud movement, building shadows, tree canopies, bird droppings, and dust accumulation often cause non-uniform irradiance distribution across module surfaces, giving rise to partial shading conditions (PSCs) [1]. Existing studies indicate that partial shading not only reduces the power of PV modules but also induces current mismatch, hotspot formation, and frequent bypass-diode activation, thereby adversely affecting both the operational reliability and energy yield of PV power plants [2].
Since PV cells within a module are typically connected in series, a reduction in the current generated by shaded cells limits the operating current of the entire series circuit, causing unshaded cells to deviate from their optimal operating conditions [3,4]. Under severe PSCs, shaded substrings may be subjected to substantial reverse-bias voltages, triggering bypass-diode conduction and electrically bypassing the affected substrings. Consequently, the equivalent circuit topology of the module is modified, and its voltage exhibits a stepwise reduction behavior [4,5]. Kim et al. [6] reported that partial shading can induce hotspot formation, resulting in a rapid increase in module local temperature. In severe cases, this effect accelerates the degradation of encapsulation materials and may ultimately lead to cell failure. Ko et al. [7] further demonstrated that prolonged operation of bypass diodes under frequent conduction conditions significantly deteriorates the internal thermal distribution of PV modules and promotes the accumulation of localized thermal stresses.
Partial shading also leads to significant distortions in the I–V and P–V characteristics of PV modules. Existing studies indicate that, under different PSCs, the characteristics may evolve from a conventional single-peak profile to a multi-peak profile containing multiple local maxima, thereby substantially increasing the complexity of maximum power point tracking (MPPT) [8]. Lu et al. [9] reported that the emergence of multi-peak characteristics is closely related to the degree of current mismatch and the conduction sequence of bypass diodes. In essence, these characteristics result from the nonlinear interactions among different substrings as they alternately operate in current-limiting and bypass states. Hou et al. [10] further demonstrated that conventional local-search-based MPPT algorithms are susceptible to convergence at local optimum points under complex PSCs.
To mitigate the adverse effects of irregular partial shading, extensive research has been conducted on PV array reconfiguration, bypass-diode characteristics, and MPPT enhancement strategies [8,11,12]. Kermadi et al. [13] presented a comprehensive review of MPPT techniques under PSCs and highlighted that improvements in both array configuration and control strategies can substantially reduce shading-induced power losses. Bhattacharya et al. [14] investigated the performance of series–parallel (SP), total cross-tied (TCT), and hybrid PV array topologies under PSCs, revealing that array topology significantly influences the power extraction capability of PV systems. Niazi et al. [15] further assessed several mismatch mitigation approaches using field-operational data from PV power plants and found that DC power optimizers and differential power processing (DPP) architectures can effectively reduce mismatch losses and enhance energy yield under PSCs. Nevertheless, these solutions often involve additional hardware requirements, resulting in increased system complexity and cost.
Most existing studies have been conducted under regular or predefined shading scenarios, whereas the shaded regions and illuminated areas in practical operating environments often exhibit representative variations. Oufettoul et al. [16] pointed out that PSCs are commonly simplified using fixed shading regions or uniform irradiance attenuation approaches. However, in actual operating environments, shading caused by factors such as leaves, dust accumulation, and building shadows often exhibits pronounced representativeness and spatial non-uniformity, and different shading locations and distribution patterns can have significantly different impacts on the characteristics of PV modules. Song et al. [17] conducted full-scale experimental investigations and found that different shadow distribution patterns lead to substantial differences in the characteristics of PV arrays. Compared with regular shading scenarios, the behavior of PV modules under representative shading conditions exhibits stronger nonlinear characteristics, making it difficult for conventional uniform-irradiance models to accurately describe real operating conditions.
Furthermore, existing research has focused primarily on array-level topology optimization, power recovery, and MPPT control strategies [18], whereas studies on the degradation characteristics of individual PV modules under different shading patterns remain relatively limited. Existing studies have shown that, under PSCs, the spatial distribution of shading directly affects the current redistribution within the module and the conduction behavior of bypass diodes, thereby resulting in distinctly different degradation characteristics of module performance [19]. In particular, when substrings located at different positions within a module are shaded, the equivalent circuit topology of the module undergoes dynamic reconfiguration as the bypass states change, which further alters the stepwise characteristics of the I–V curve and the peak distribution of the P–V curve [15].
At present, most related studies are conducted under regular shading scenarios or focus on a single shading factor [2,5,20,21]. However, studies investigating the internal mismatch behavior and degradation characteristics of PV modules under multiple-point and representative shading patterns remain scarce. Moreover, research on the conduction behavior of bypass diodes, current distribution characteristics, and the equivalent circuit reconfiguration process of PV modules is still highly limited. The intrinsic relationships among these phenomena and their underlying mechanisms have not yet been systematically investigated.
However, under practical representative shading conditions, the shading ratio and the number of participating substrings often vary simultaneously, and their coupling effect further increases the complexity of PV module characteristics. Existing studies have shown that, under complex non-uniform shading conditions, multiple local power peaks may appear in the P–V characteristics of PV modules, and the distribution characteristics of these peaks can change significantly with variations in shading conditions [22,23]. In some cases, multiple local peaks may exhibit comparable power levels, making conventional MPPT methods more susceptible to convergence at local optimum points [22]. Therefore, the influence of the coupling effect between shading ratio and substring participation on the evolution of current mismatch and the formation mechanism of multi-peak characteristics under representative shading conditions remains to be further elucidated.
Motivated by the above research gaps, this study focuses on a full-cell PV module and systematically conducts experimental investigations under representative shading locations and representative shading areas. The differences in characteristics between local incomplete shading and complete shading of individual cells within module substrings are analyzed, and the corresponding degradation patterns are identified. A single-diode equivalent model of the PV cell is developed, and a MATLAB/Simulink R2022a (MathWorks, Natick, MA, USA) [24] model of the PV module is established to examine the influence of the multi-factor effect, resulting from the interaction between shading ratio and substring participation, on module characteristics under representative shading conditions. In addition, by considering the physical evolution of current mismatch and the conduction behavior of bypass diodes, a comprehensive modeling and simulation framework is employed to investigate the formation mechanism of multi-peak characteristics under complex shading conditions. The results of this work provide theoretical support for the optimization of PV module performance and the development of advanced MPPT strategies in complex shading environments.
2. Experimental Methods
2.1. PV Module Structure and Parameters
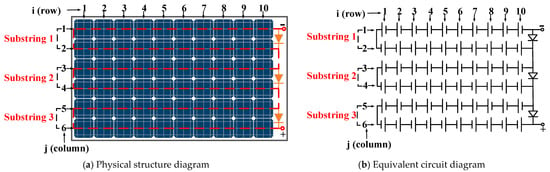
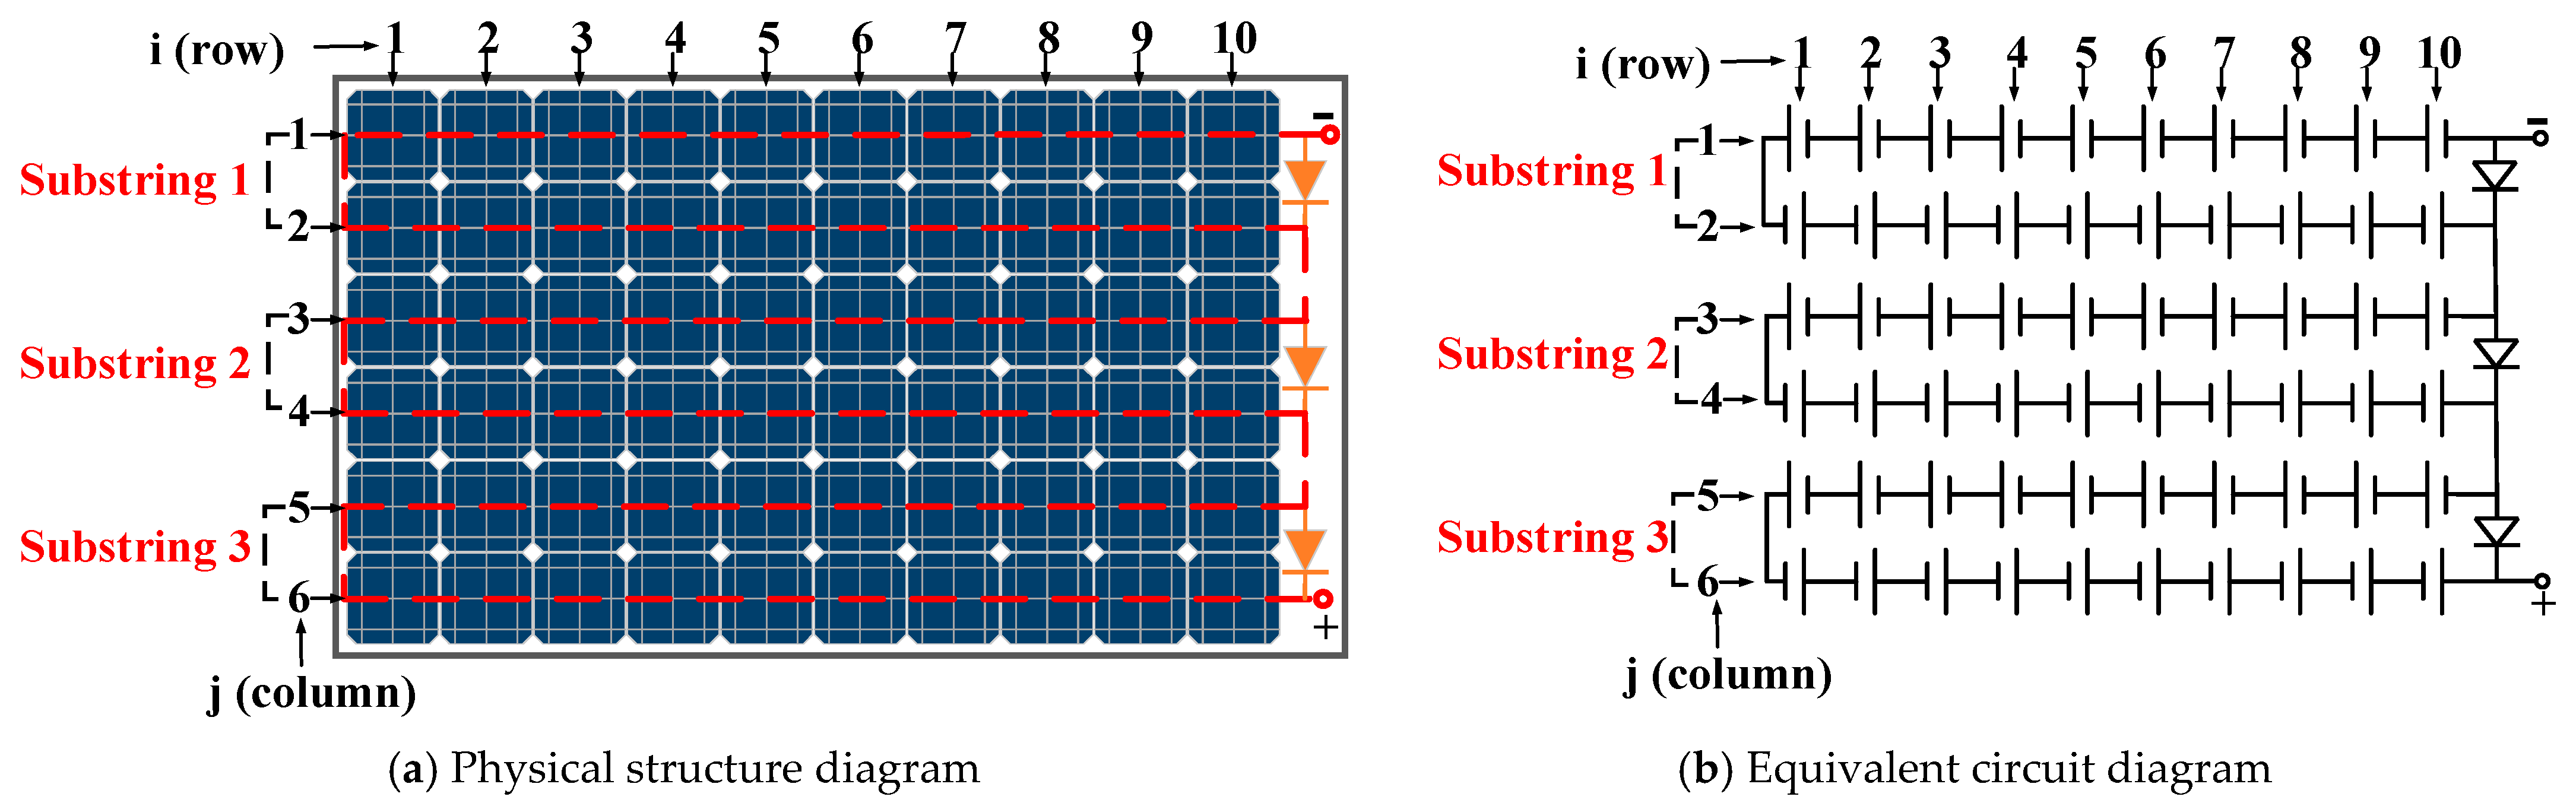
The PV module used in this study consisted of a standard full-cell monocrystalline silicon PERC module composed of 60 solar cells. Each cell had a nominal size of 156 mm × 156 mm, resulting in an effective module area of approximately 1.6 m2. The module featured a series configuration of three substrings, with three bypass diodes installed between them, as illustrated in Figure 1, where Figure 1a shows the physical structure of the PV module and Figure 1b presents its equivalent electrical circuit.
Figure 1.
Electrical connection topology of the PV module. The PV array is discretized into a 6 × 10 matrix, where i and j denote the row and column indices, respectively, with i = 1–6 and j = 1–10.
Under standard test conditions (STC), the module exhibited a rated maximum power output of 316.8 W, with a maximum power point voltage (Vm) of 33.13 V and a corresponding current (Im) of 9.56 A. The open-circuit voltage (Voc) and short-circuit current (Isc) were 40.72 V and 10.03 A, respectively. In addition, the module had a conversion efficiency of 19.20% and a fill factor of 77.40%.
The use and configuration of bypass diodes take into account various factors, including the feasibility of module manufacturing and the safety and reliability of the module structure, and therefore represent a compromise optimization scheme. The incorporation of bypass diodes effectively reduces hotspot formation and power losses under PSCs, while decreasing the frequency of module power fluctuations under practical operating conditions. By analyzing the structure of the series-connected module and the conduction characteristics of bypass diodes, the variation patterns of module characteristics under different shading conditions can be further investigated. The main electrical parameters of the tested PV module under STC are listed in Table 1.
Table 1.
Electrical parameters of the PV module under STC.
2.2. Experimental Setup and Testing Procedures
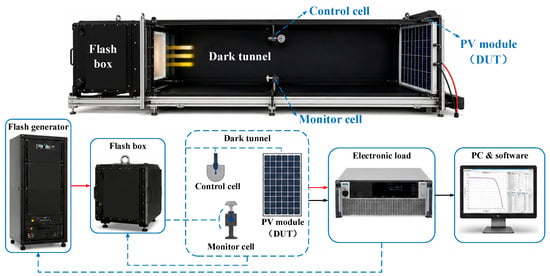
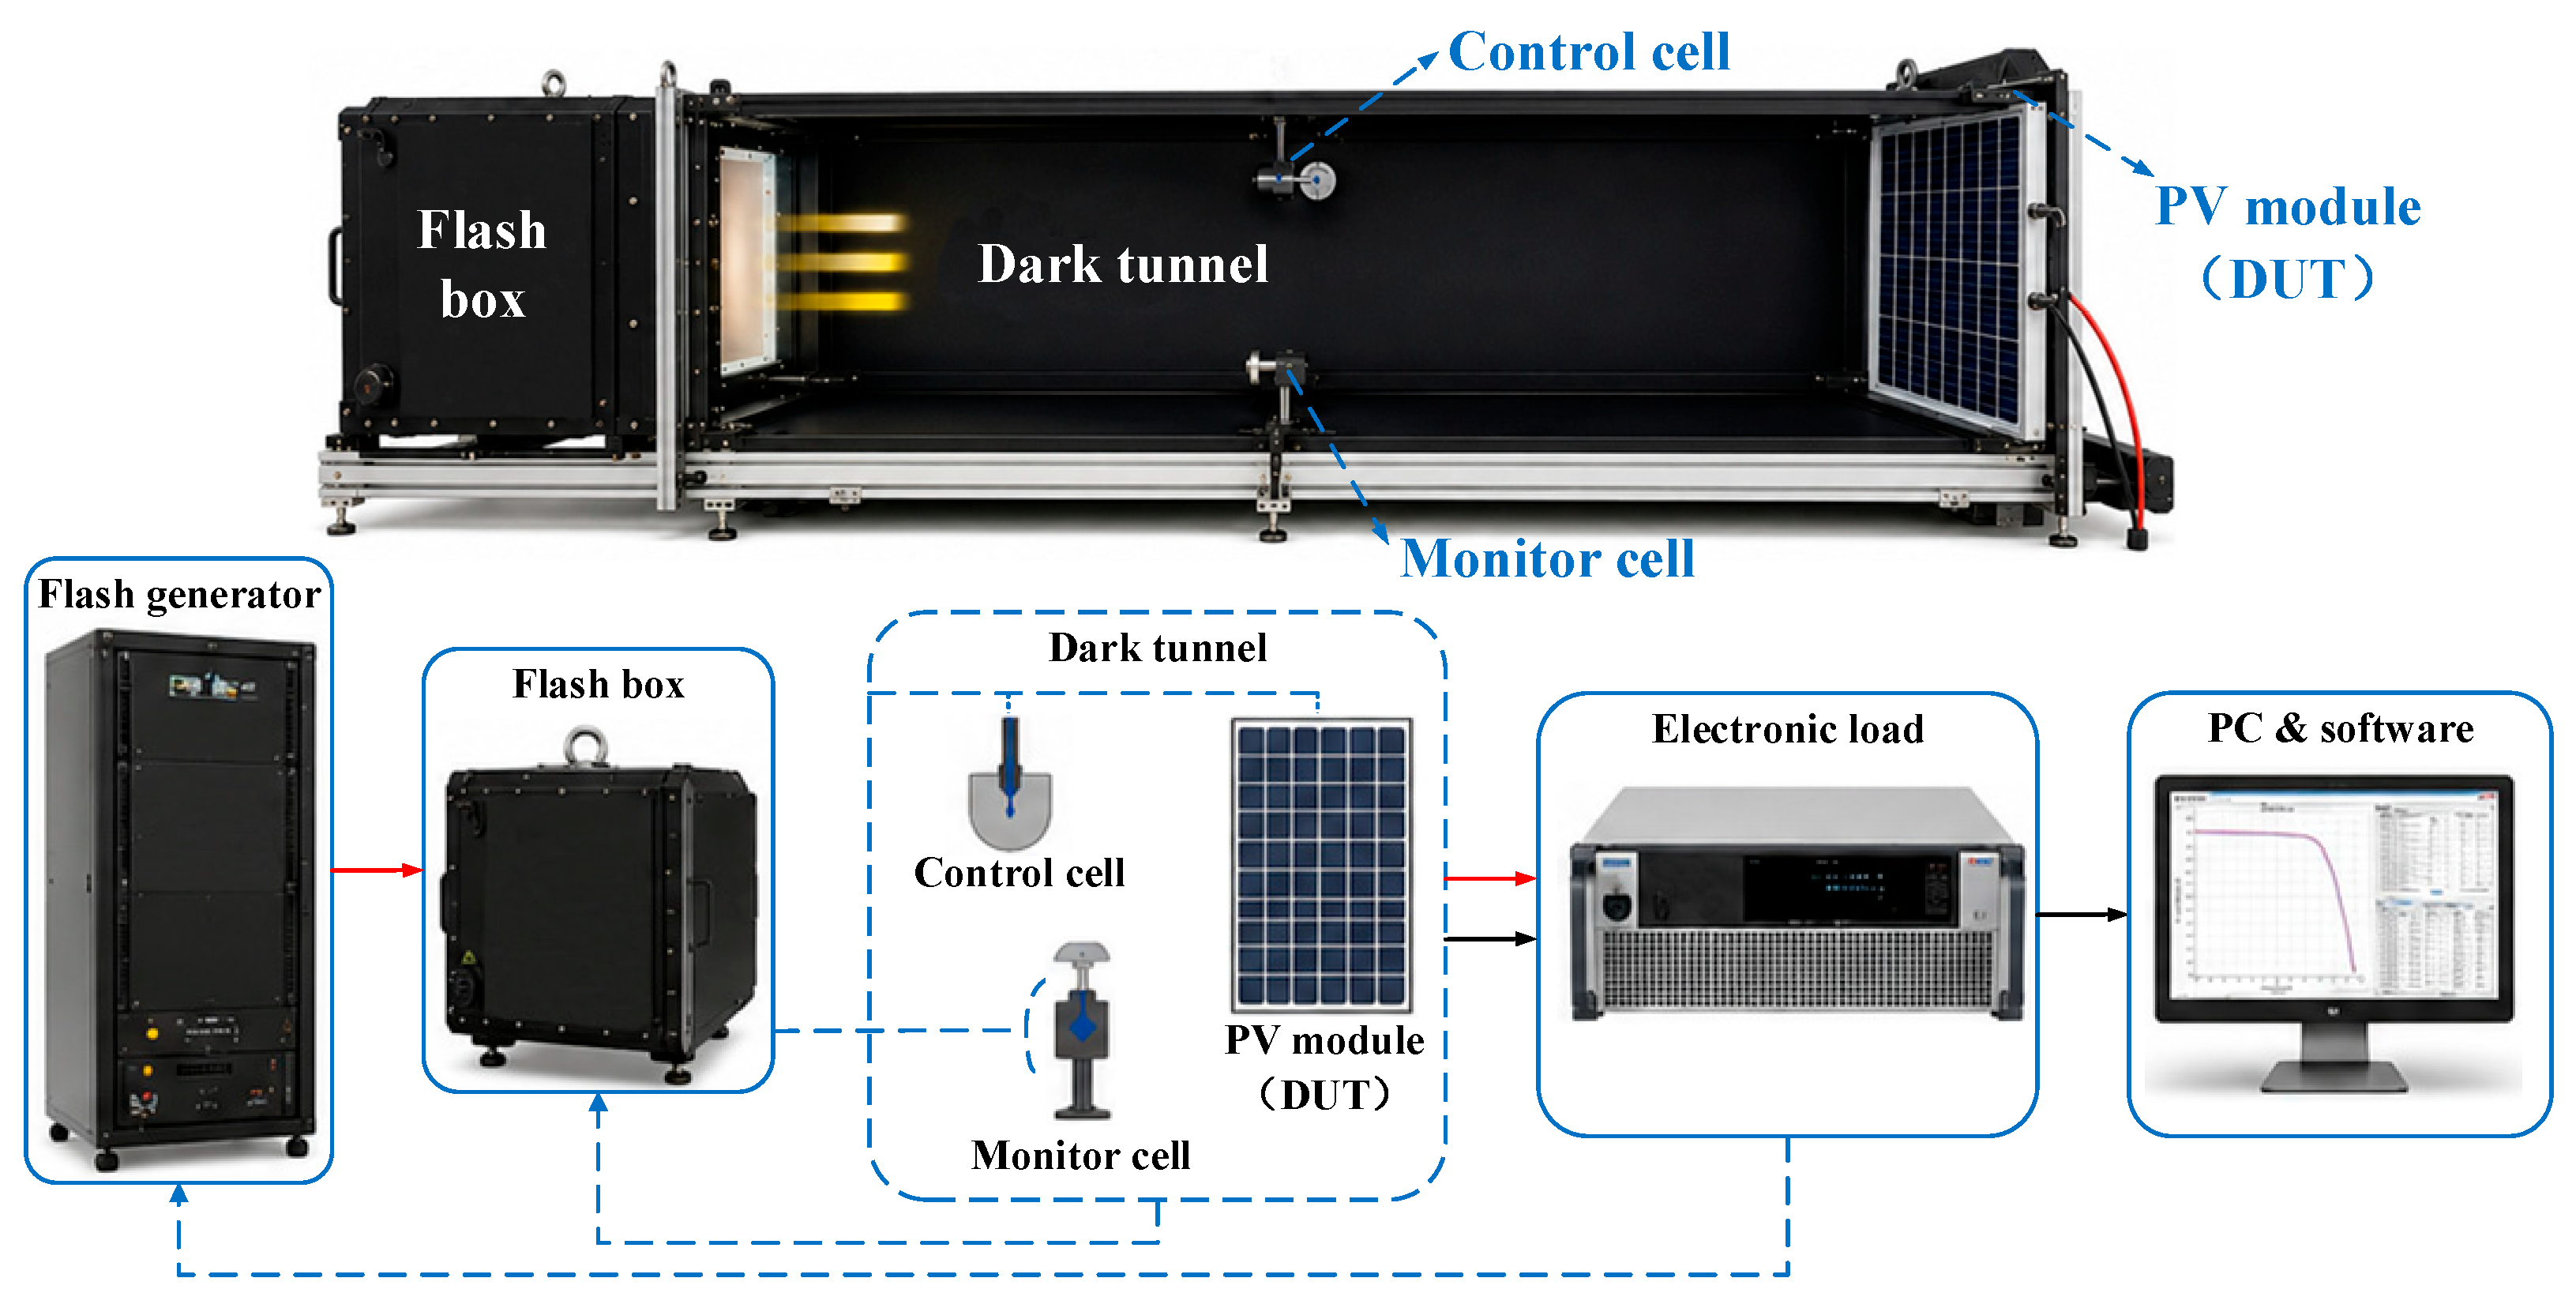
The experimental setup employed in this study is a PASAN High LIGHT pulsed solar simulator testing system (Meyer Burger AG, Neuchâtel, Switzerland), and its configuration is shown in Figure 2. The performance characterization and shading experiments of the PV module are conducted under STC, defined as an irradiance of 1000 W/m2, a cell temperature of 25 °C, a wind speed of 0 m/s, and an AM1.5 spectrum. The system mainly consists of a xenon flash light source (Flash Box), a pulse power supply and control unit (Flash Generator), a horizontal dark tunnel, an electronic load, an irradiance monitoring unit, and a host computer for data acquisition.
Figure 2.
Configuration of the experimental setup.
The experimental setup adopts a lateral pulsed-illumination configuration, in which the xenon flash light source is positioned on one side of the dark tunnel, while the PV module under test (device under test, DUT) is installed on the opposite side. A control cell and a monitor cell are incorporated into the system for irradiance feedback regulation and real-time irradiance monitoring, respectively, thereby ensuring illumination stability and measurement accuracy throughout the testing process. The Flash Generator provides high-voltage pulse energy and pulse modulation control for the xenon flash source. The Electronic Load performs voltage sweeping while simultaneously acquiring the output parameters of the PV module, enabling rapid characterization of the I–V and P–V characteristics as well as the maximum power point (MPP) parameters. The entire system is centrally controlled by host computer software, which performs flash synchronization, data acquisition, parameter calculation, data storage, and processing. Partial shading conditions were implemented by using opaque shading plates with the same size as the PV cells, ensuring controllable and repeatable shading configurations during the experiments.
2.3. Experimental Results and Analysis Under Different Shading Conditions
2.3.1. Representative Partial Shading Scenarios and Characteristics
The PV module consists of 60 series-connected PV cells, which are identified using the notation Xij, where i = 1–6 and j = 1–10. The cell interconnection and layout are illustrated in Figure 1. Shading area ratios of 6.25%, 25%, and 50% are selected as the test conditions, with the shaded cell locations Xij representative and distributed. A set of representative experimental cases is presented as Cases 1–3 in Table 2, and the corresponding maximum powers, Pmax (W), are also listed.
Table 2.
Shading distribution of individual cells and power under irregular PSCs.
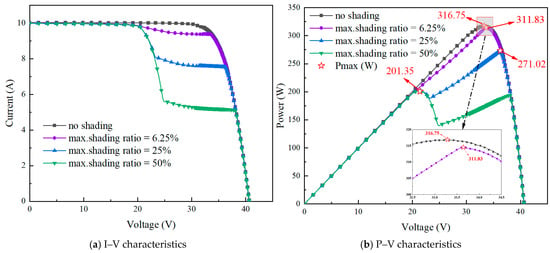
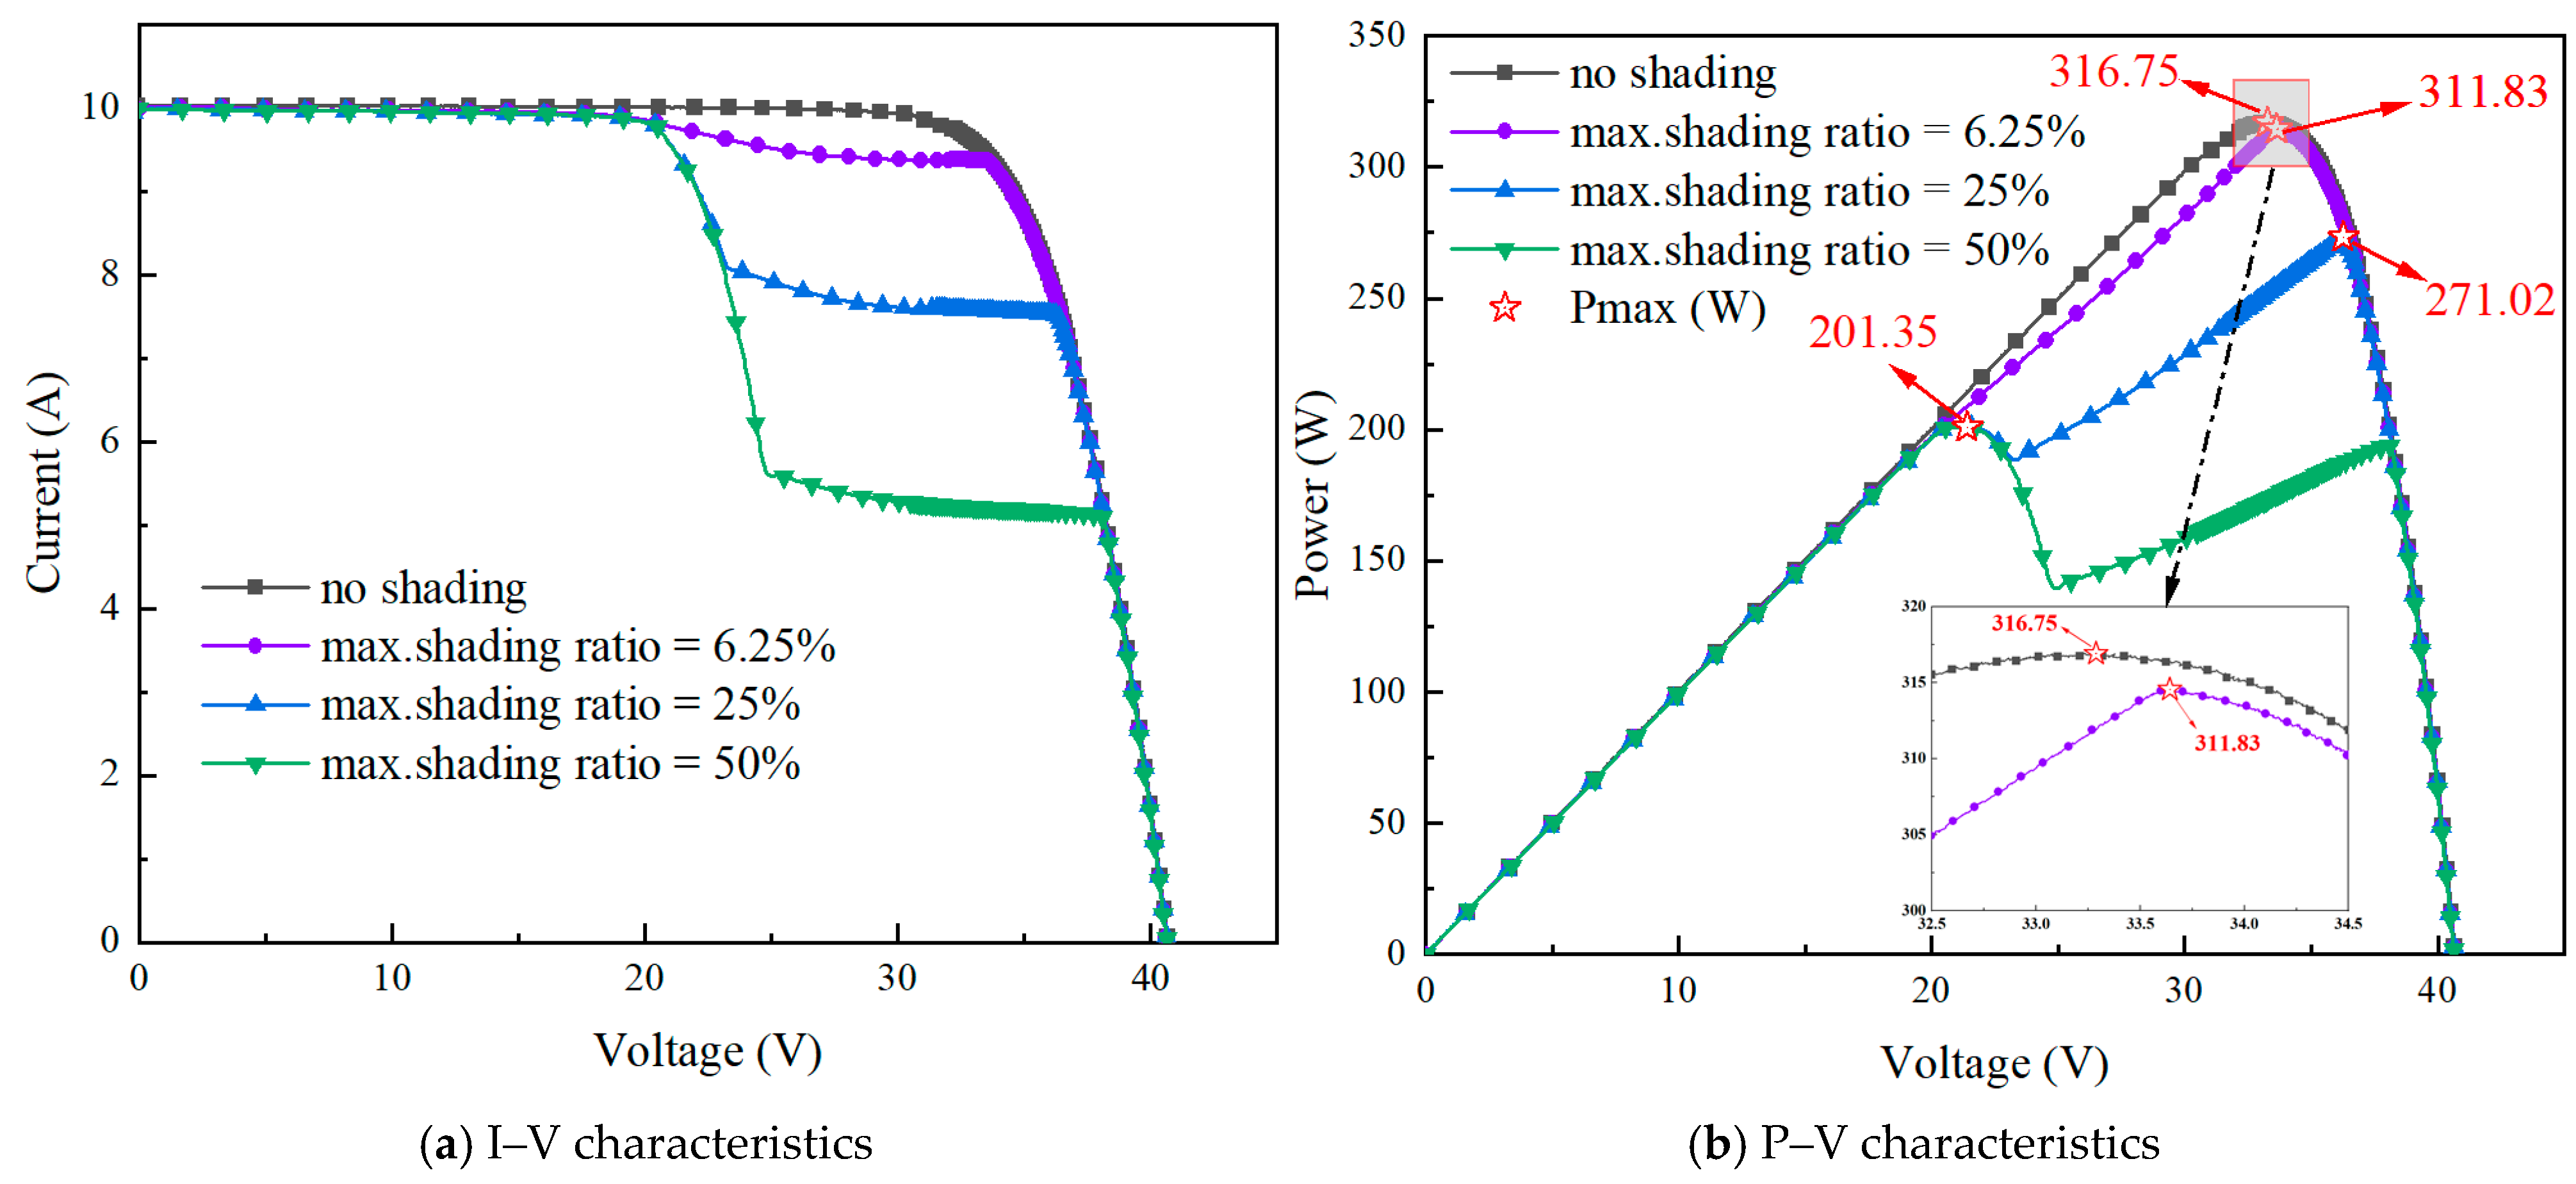
As shown in Table 2, the maximum power decreases with an increase in the shading area ratio. For the 50% shading condition, multiple shading combinations are considered, and the total shaded area varies among different cases. Nevertheless, the measured maximum power remains nearly unchanged at approximately 201.35 W among these tested shading configurations.
Figure 3 presents the I–V and P–V characteristics under four different shading combinations. The results indicate that, for the tested irregular partial shading scenarios, the I–V and P–V curves exhibit similar characteristics and nearly overlap when the maximum shading area ratio is identical. These results suggest that, under the investigated local incomplete shading conditions, the maximum power output of the PV module is mainly influenced by the maximum shaded area, while the effect of shaded-cell location is relatively limited within the tested configurations.
Figure 3.
Comparison of PV module characteristics under different irregular PSCs.
2.3.2. Shading Experiments and Characteristics Under Complete Cell Shading Conditions
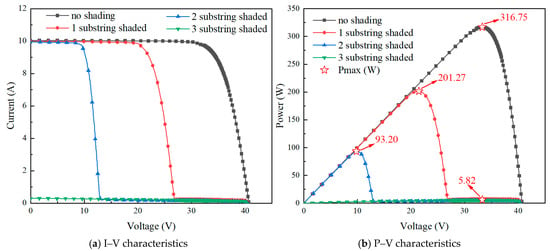
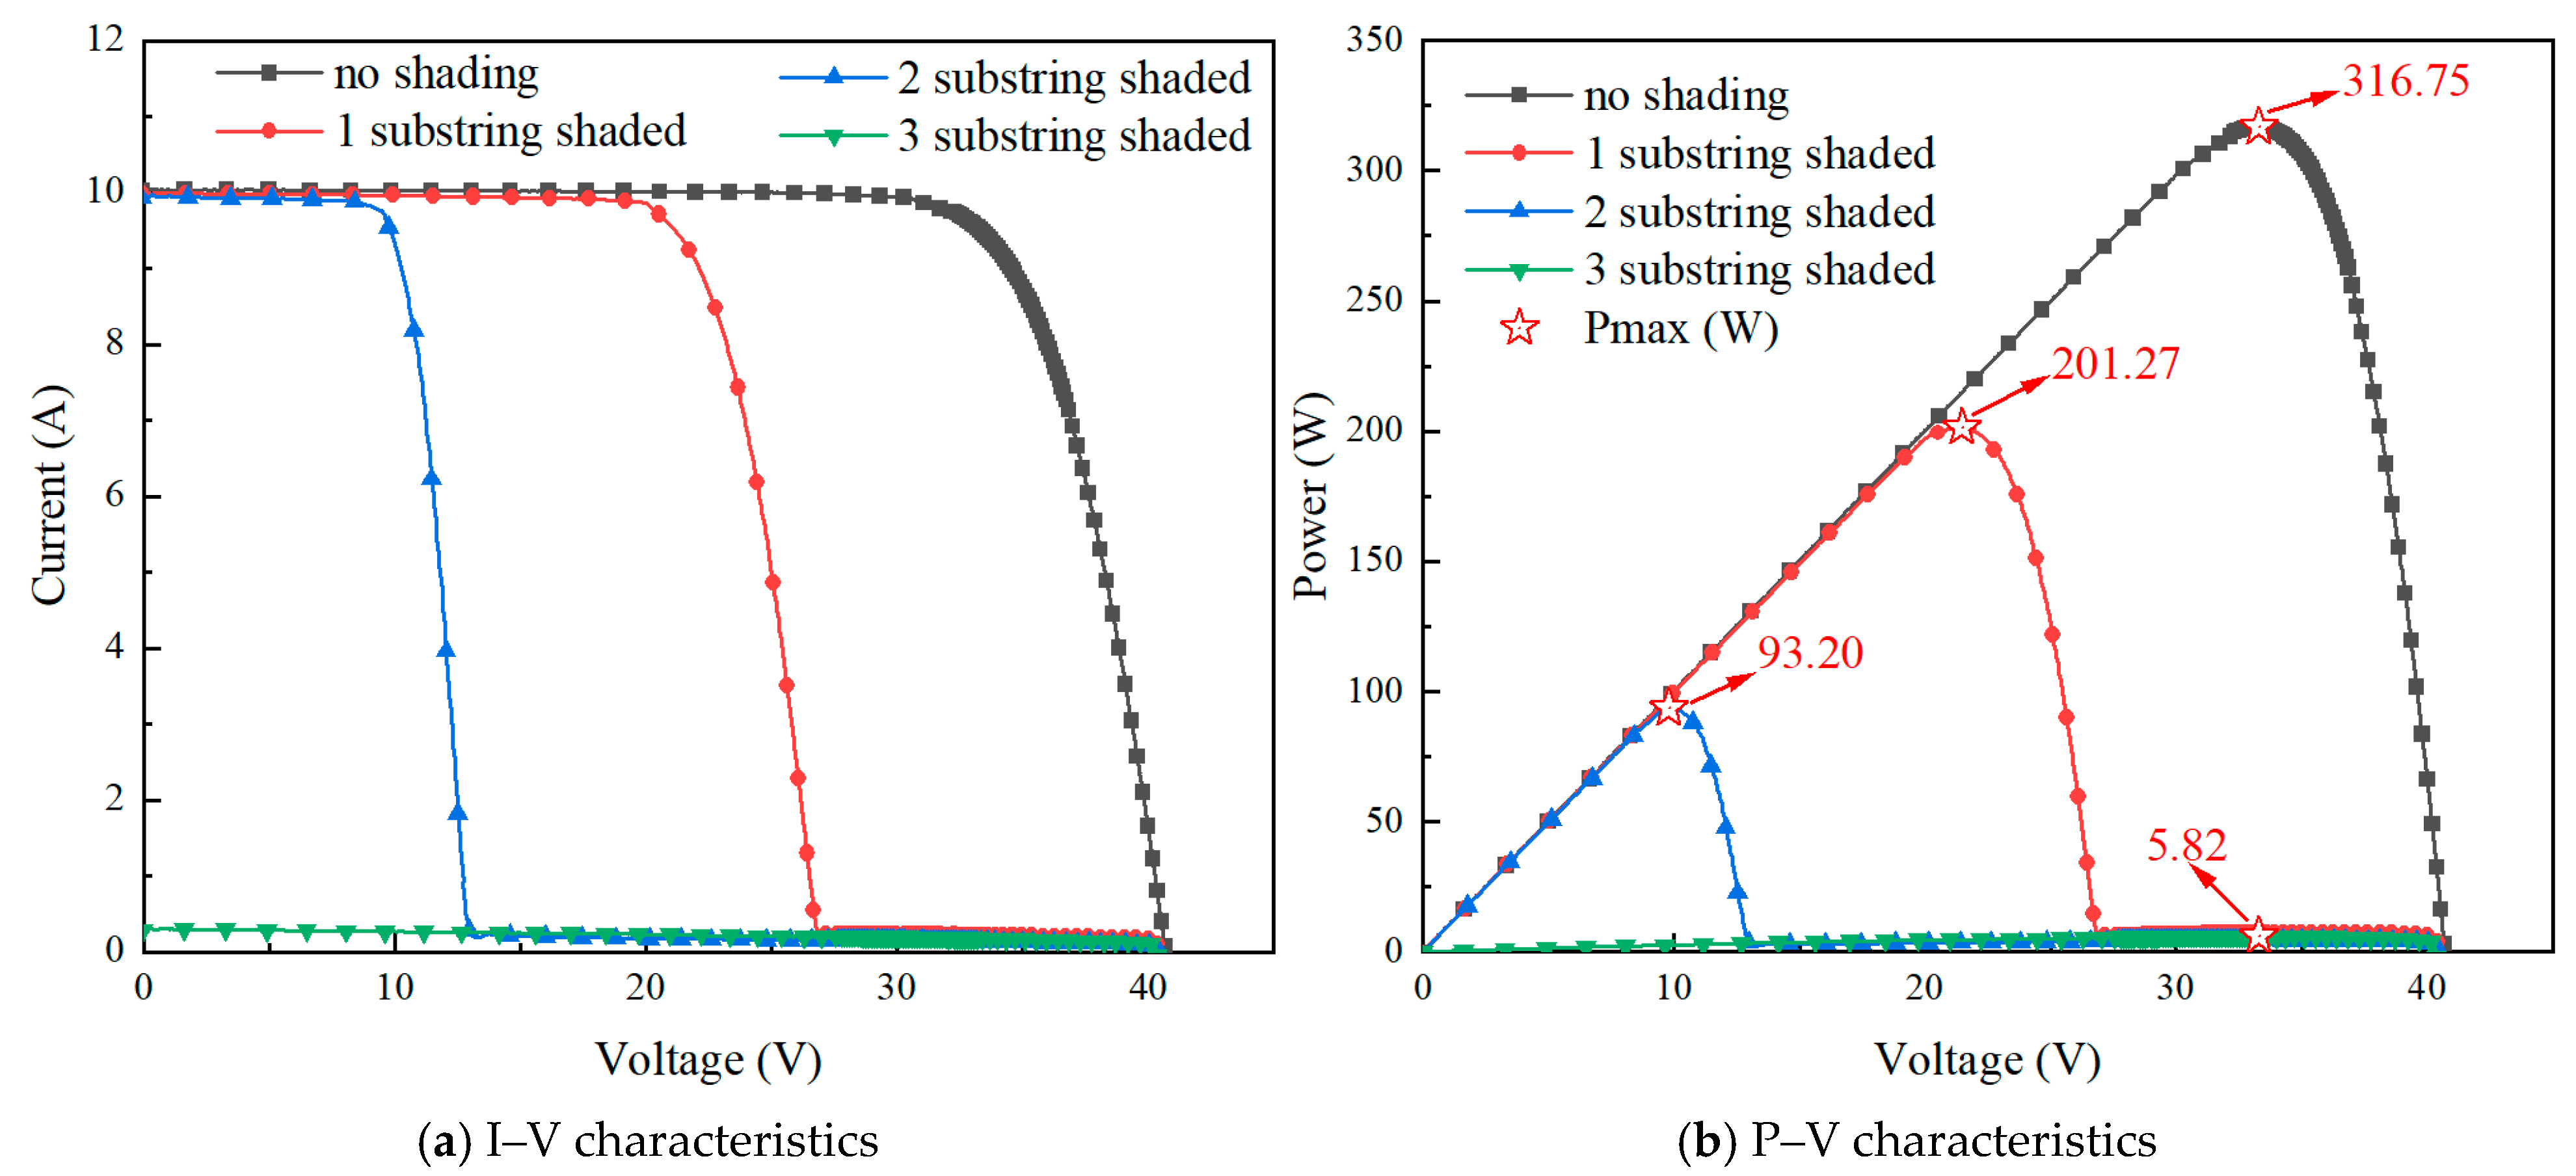
Assuming that a PV cell within the module is completely shaded, corresponding to the extreme case of 100% shading, the experimental results of the module characteristics are summarized in Table 3 and Figure 4. When only one substring is affected by complete shading (e.g., X1j,1–3 and X1j,2j), the module Voc and Pmax decrease to approximately two-thirds of their values under STC, while the Isc exhibits only a minor variation. This indicates that the characteristics of the module are independent of the number of shaded cells within the same substring. When two substrings are simultaneously affected by complete shading (X1j,3–6j), Voc and Pmax decrease to approximately one-third of their STC values. When all three substrings contain completely shaded cells (X1j,3j,5j), the module Voc decreases to 0 V and Pmax is only 5.82 W, indicating that the power of the module is nearly zero.
Table 3.
Effects of Substring Shading Configurations on PV Module Parameters under Complete Cell Shading Conditions.
Figure 4.
Characteristics of the PV module under complete cell shading conditions.
Under these extreme shading conditions, one or more substrings are electrically bypassed, resulting in pronounced stepwise characteristics. The results of these extreme shading experiments clearly demonstrate that the performance degradation of the PV module is primarily determined by the number of bypassed substrings rather than the specific number of shaded cells within an individual substring.
3. PV Module Modeling and Simulation Analysis
3.1. Mathematical Model
Based on the aforementioned experimental analysis, it can be observed that the degradation mechanisms of PV modules exhibit distinct behaviors under different shading scenarios. Under PSCs with incomplete local shading, the module characteristics are primarily influenced by the maximum shaded area. In contrast, under complete cell shading, the performance degradation of the module is mainly determined by the number of bypassed substrings. However, in practical operation, representative shading often occurs simultaneously with variations in shading ratios and involvement of multiple substrings. Their coupling effect further alters the internal current distribution and the conduction states of bypass diodes, resulting in more complex nonlinear variations in the characteristics. Particularly, when multiple substrings are involved and the shaded areas of cells at different positions vary, the module may exhibit multiple local power peaks, and the competitive interactions among these peaks directly affect the maximum power point tracking behavior.
Therefore, it is challenging to fully elucidate the evolution of current mismatch and the mechanism of multiple power peak formation under different shading combinations based solely on experimental observations. To further analyze the effects of the number of module substrings, shading ratios, and their coupling on the characteristics of PV modules under representative PSCs, a single-diode physical model of the PV cell was developed, and a simulation model of the PV module characteristics was established. The characteristics of the PV module are expressed by Equation (1) [25]:
where V is the voltage of the PV module (V); I is the current of the PV module (A); IL is the photocurrent (A); I0 is the diode reverse saturation current (A); Rs is the series resistance (Ω); Rsh is the shunt resistance (Ω); VT is the diode thermal voltage, given by VT = KTc/q; n is the diode ideality factor; q is the elementary charge, equal to 1.602 × 10⁻¹⁹ C; K is the Boltzmann constant, equal to 1.381 × 10⁻²³ J/K; Tc is the PV cell temperature (K); and Ns is the number of series-connected PV cells in the module.
Under representative PSCs, the irradiance received by PV cells at different positions Xij exhibits significant variations, which in turn causes changes in internal parameters of the module, such as the photocurrent IL. The series resistance under PSCs is calculated using Equation (2) [26]:
Due to the fact that photons cannot reach the p-n junction in shaded PV cells, light absorption cannot generate photocurrent carriers, leading to a reduction in the photocurrent of the affected cells. Under PSCs, it is assumed in this study that the unshaded region remains under uniform irradiance. The reduction in the illuminated area caused by shading is equivalently represented as a decrease in cell irradiance, which facilitates the direct implementation of the simulation model and simplifies the analysis. The equivalent irradiance of the PV cell, Gs, is given by Equation (3) [27]:
Meanwhile, the shunt resistance Rsh varies with irradiance, and its relationship can be expressed as follows:
The photocurrent IL is highly sensitive to environmental conditions, and its magnitude is primarily influenced by both irradiance and temperature. It can be expressed by Equation (5) [27]:
The reverse saturation current I0 exhibits a strong temperature dependence, and its relationship with the junction temperature can be expressed as follows [23]:
where Gref is the irradiance under STC, taken as 1000 W/m2; Gs is the equivalent irradiance of the PV cell under PSCs; Rsref and Rshref are the series resistance and shunt resistance under STC, respectively (Ω); A is the total illuminated area (m2); As is the shaded area (m2); ꞷ% represents the percentage of As relative to A, corresponding to the shading area ratio of PV cells listed in Table 2; Tcref is the cell temperature under STC, taken as 298.15 K.; ILref and I0ref are the photocurrent and reverse saturation current under STC, respectively; Ki is the temperature coefficient, taken as 5 × 10⁻⁴ A/K; Eg is the bandgap energy of the PV material, and Egref under STC is 1.121 eV; β is taken as 0.217, and α is −2.677 × 10⁻⁴ eV/K.
3.2. Simulation Model Development and Operating Condition Design
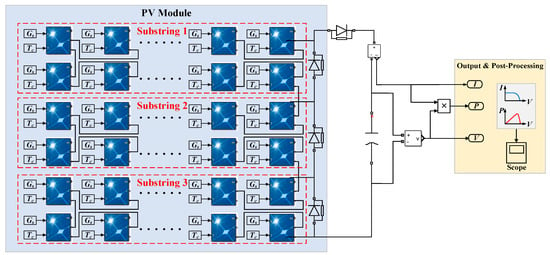
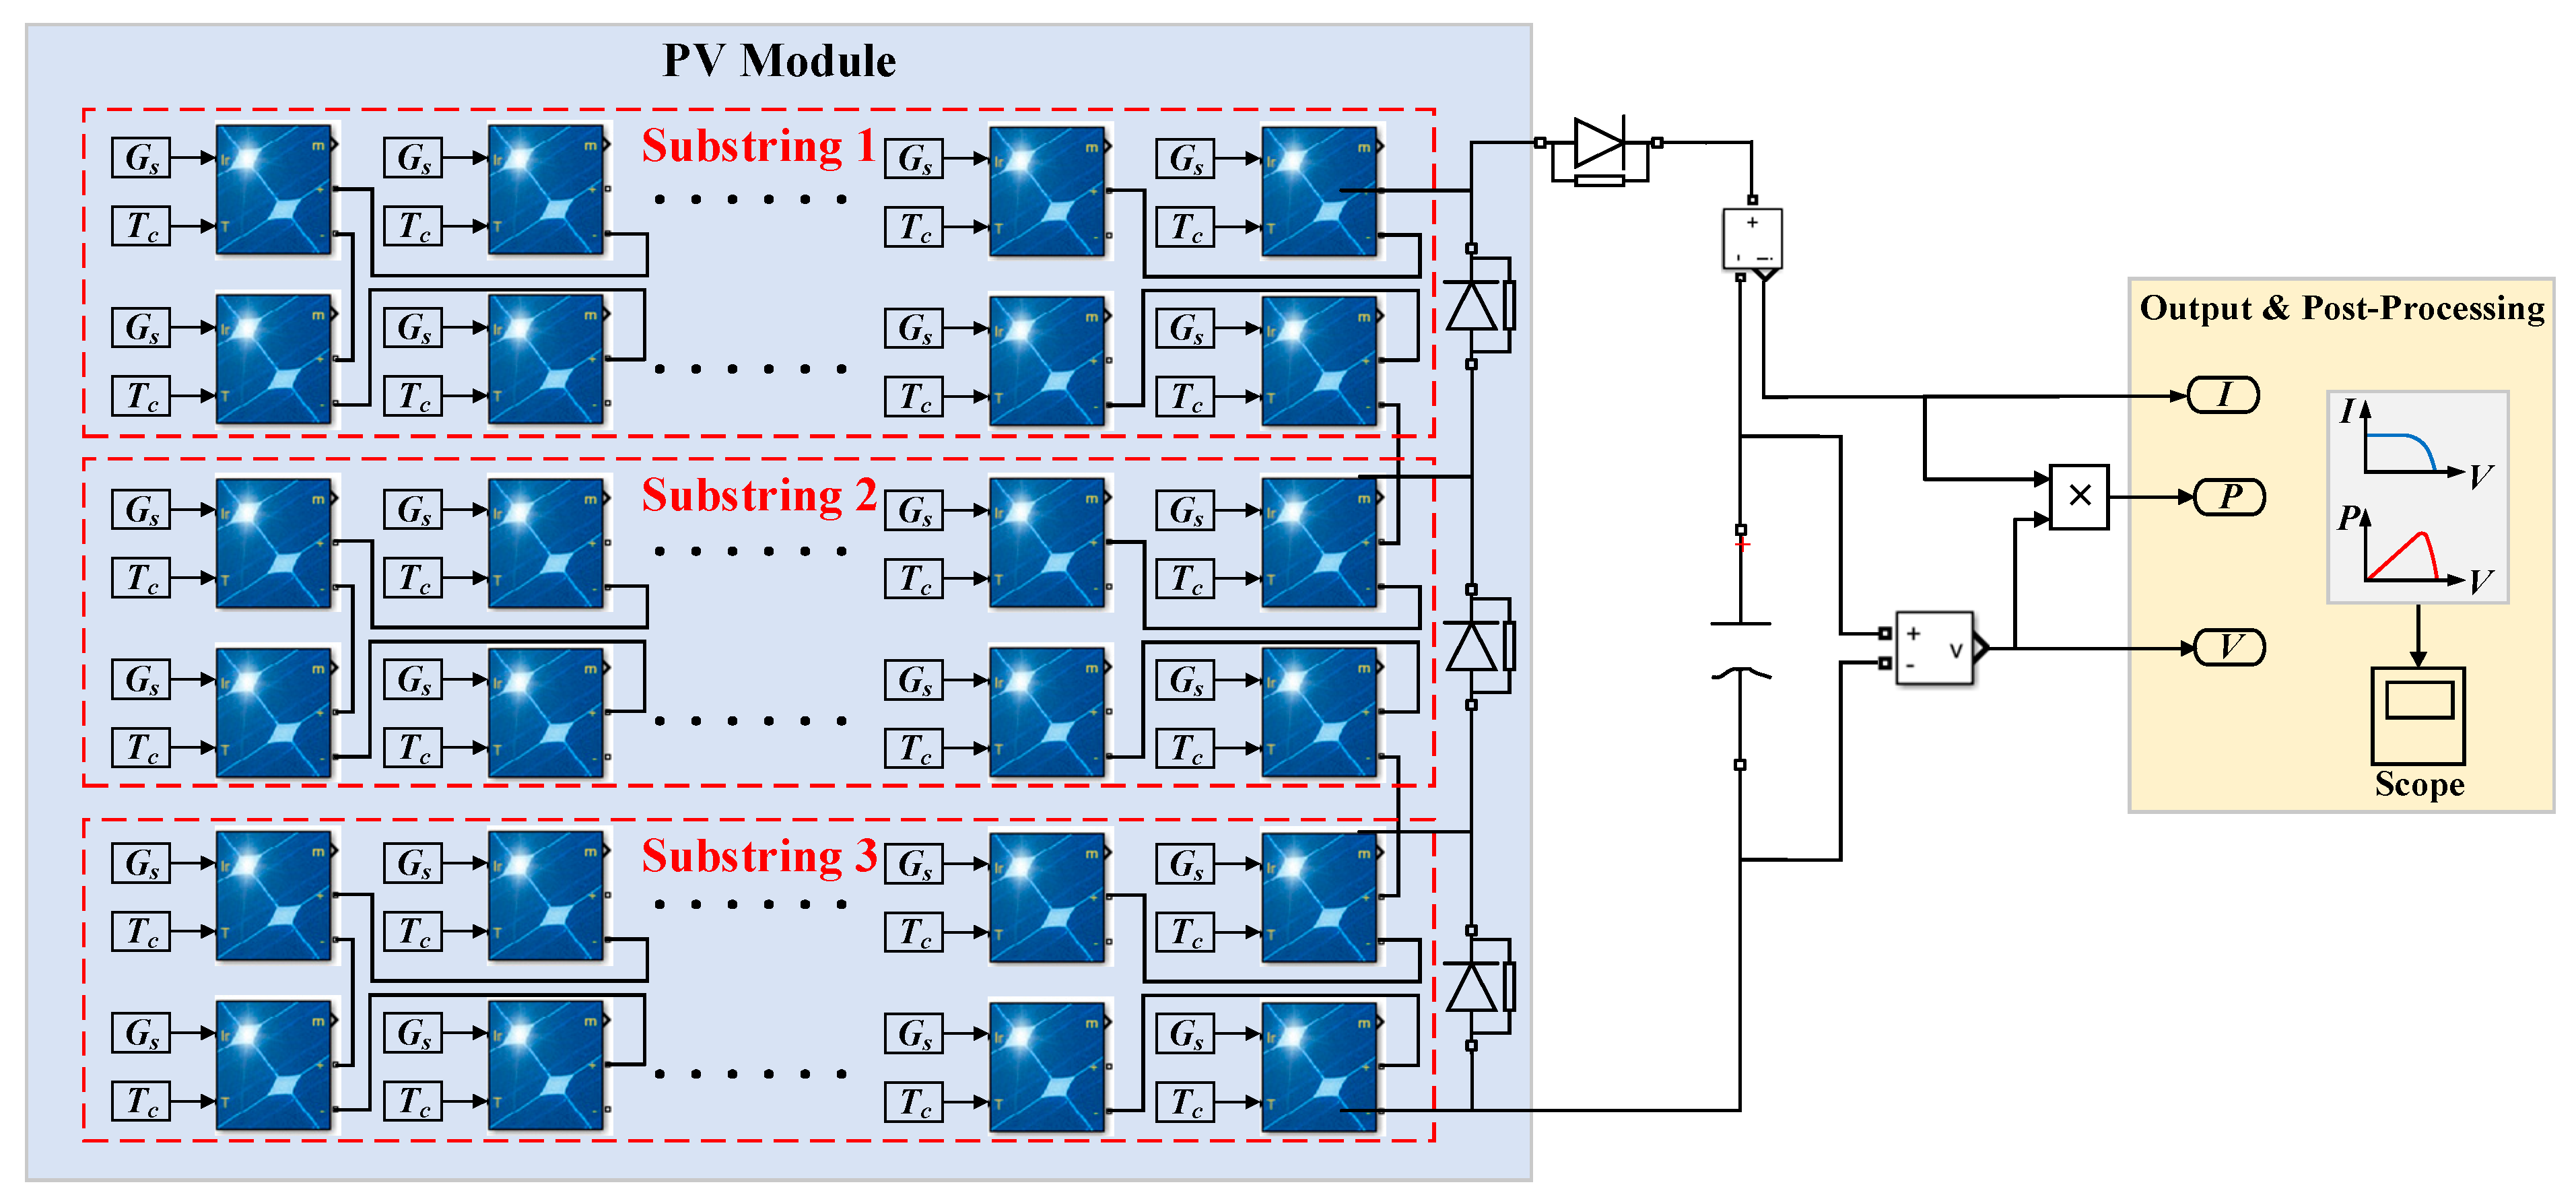
Based on the mathematical model presented in Section 3.1, a PV module simulation model under partial shading conditions is developed using the MATLAB/Simulink R2022a platform, as shown in Figure 5. The developed model mainly consists of three parts: the PV substring modeling module, the output module, and the post-processing module. The parameter calculation is implemented using the built-in PV Array block in Simulink, where the electrical parameters of the PV module under STCs listed in Table 1 are directly adopted for model initialization. In this implementation, the PV Array block incorporates an internal five-parameter extraction mechanism to determine the key parameters of the single-diode model, including the photocurrent, diode reverse saturation current, series resistance, shunt resistance, and diode ideality factor. The calculated parameters of each cell model are summarized in Table 4. The solver is configured as a variable-step ode23tb solver, with the relative tolerance set to 1 × 10⁻⁵ and the maximum step size limited to 1 × 10⁻⁴ s.
Figure 5.
Simulation model.
Table 4.
Five extracted parameters of individual PV cell models under STCs.
In the PV module modeling section, the module consists of 60 solar cells configured into three series-connected substrings, with a bypass diode connected in parallel to each substring to represent the actual electrical topology of the module. It is assumed that the temperature of all cells is uniformly distributed and remains constant, neglecting the effect of local temperature variations on parameter dynamics. Meanwhile, the line resistance and additional packaging losses are ignored to highlight the influence of partial shading and bypass diode effects on the output characteristics.
Under partial shading conditions, a normalized shading coefficient is introduced to modify the equivalent irradiance of individual PV cells (as defined in Equation (3)), thereby enabling non-uniform irradiance inputs under different shading patterns. The shading coefficient ꞷ% is defined within the range of 0–1, representing the shading ratio of the corresponding cell surface. For example, when the maximum shading ratio of a PV cell is 50%, ꞷ% is set to 0.5, whereas ꞷ% is set to 0 for an unshaded cell. Based on the modified equivalent irradiance, the photocurrent is further adjusted to characterize the non-uniform photocurrent distribution inside the PV module under partial shading conditions. The bypass diodes are modeled using ideal diode models, and the forward conduction voltage of each bypass diode is set to 0.7 V. When the current provided by a shaded substring is insufficient to maintain normal operation, the corresponding bypass diode is automatically activated, enabling substring bypassing and current path reconstruction.;
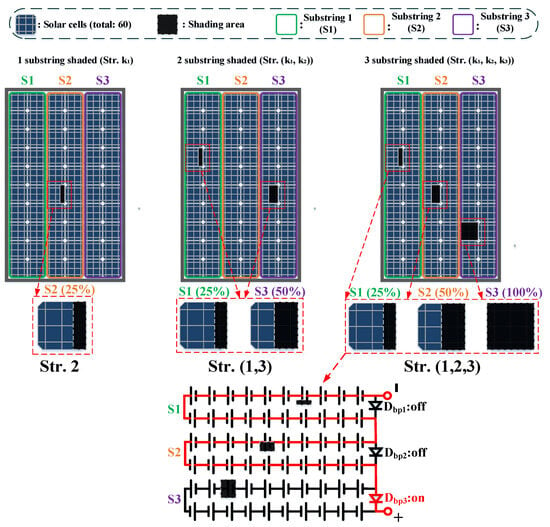
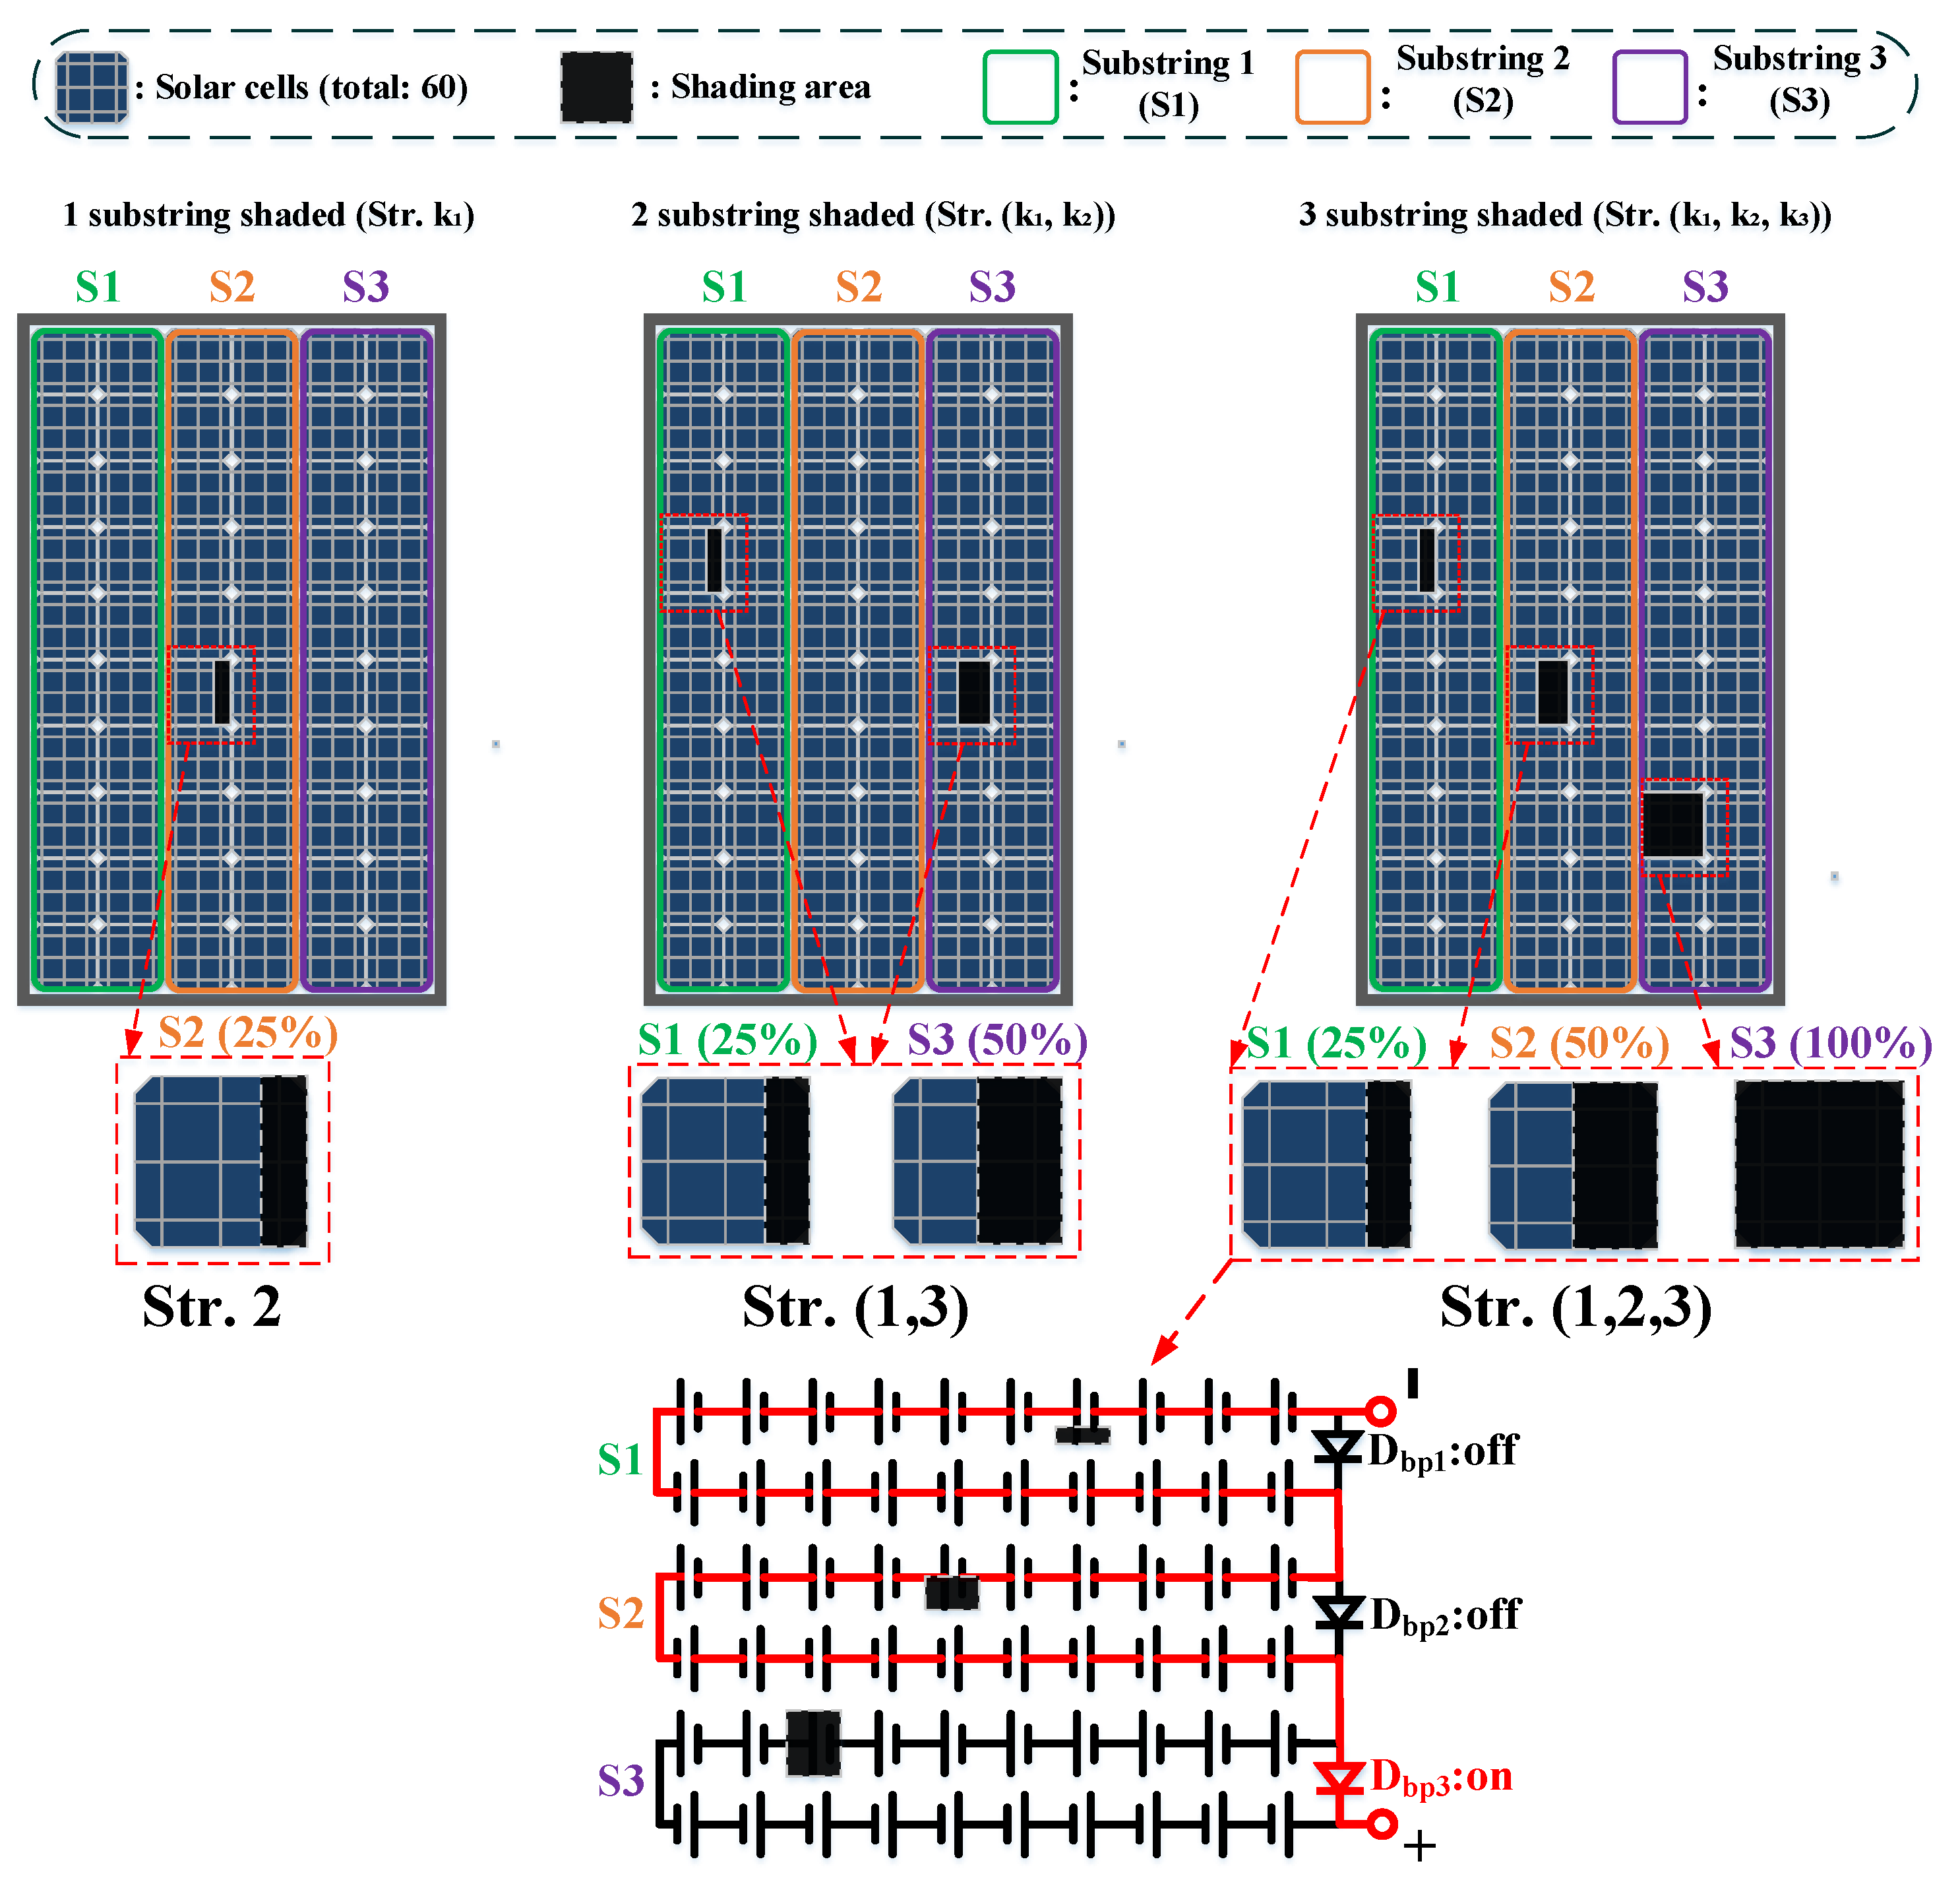
The representative PSCs under different combinations of substring numbers and shading ratios are summarized in Table 5. By constructing multiple typical scenarios involving 1 substring shaded, 2 substrings shaded, and 3 substrings shaded conditions, the characteristics of the PV module under different shading distributions are analyzed through simulation, and the corresponding global maximum power points (GMPPs) and local maximum power points (LMPPs) are extracted. Figure 6 shows the schematic diagram of the typical spatial distribution of the PV module under the representative shading scenarios listed in Table 5. Three representative shading levels (Str. 25%, 50%, and 100%) are selected to demonstrate the substring participation, bypass diode conduction behavior, and equivalent circuit reconfiguration process. Red lines denote current conduction paths, whereas black lines indicate non-conducting paths.
Table 5.
Substring shading conditions under representative partial PSCs.
Figure 6.
Schematic diagram of the spatial distribution of representative PSCs in the PV module.
3.3. Results and Discussion
3.3.1. Model Validation
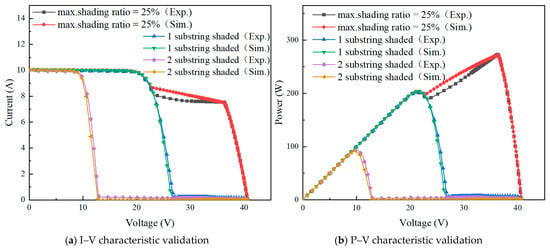
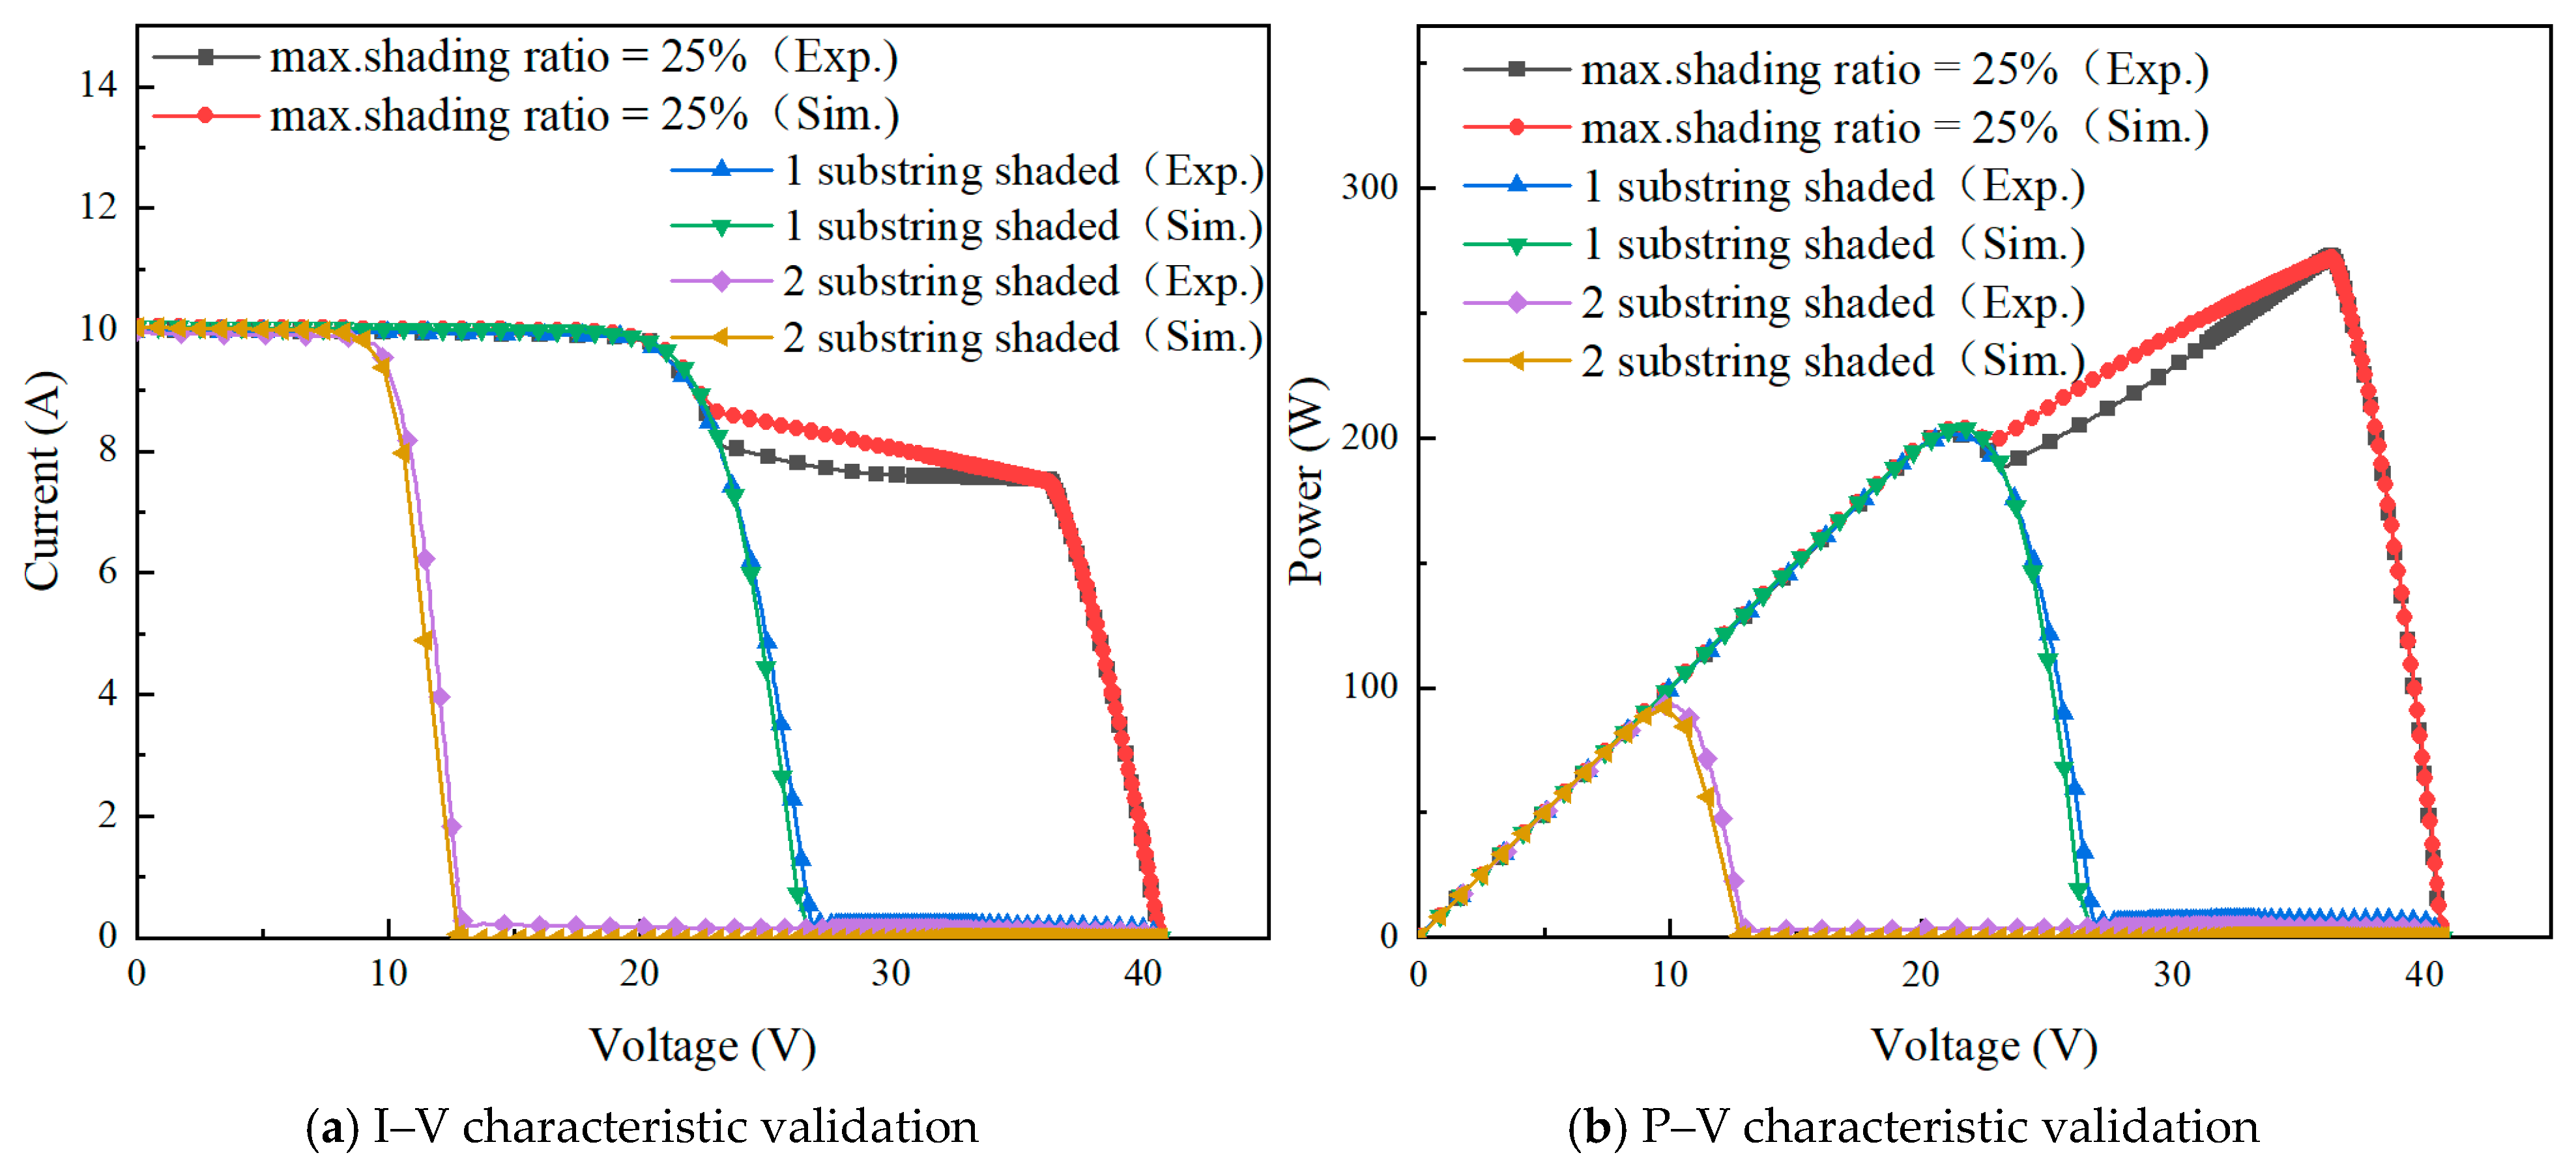
The conditions selected for model validation were the maximum shading area ratio of 25% from Table 2 and the scenario in which the cells of any substring in Table 3 were fully shaded. The validation results are presented in Figure 7.
Figure 7.
Validation of the simulation model.
As shown in Figure 7a, the I–V curve obtained from the simulation model exhibits good overall agreement with the experimental results in terms of the general trend. High consistency is observed in the short-circuit current region, the knee region, and the vicinity of the open-circuit voltage, indicating that the developed equivalent shading model can accurately describe the fundamental relationship between the current and terminal voltage of the PV module under partial shading conditions. As shown in Figure 7b, the simulated P–V curve is also in good agreement with the experimental results in terms of both peak locations and overall variation trends, effectively capturing the multi-peak power characteristics and the distribution of MPP of the PV module under PSCs. As shown in Table 6, the key electrical parameters, including Voc, Isc, and Pmax, obtained from both experiments and simulations are compared. The results indicate that the simulated values are in good overall agreement with the experimental data, with a maximum relative error of less than 1.36%, demonstrating that the proposed model can accurately capture the electrical characteristics of the PV module under different shading conditions.
Table 6.
Comparison of key PV performance parameters obtained from experiment and simulation.
As shown in Figure 7, the PV module characteristics under complete shading of a single substring exhibit very close agreement between the simulation and experimental results. However, under PSCs, the simulated results are slightly higher than the experimental measurements in the medium-to-high voltage range (approximately 25–35 V). This deviation is mainly attributed to non-ideal effects caused by the reconstruction of internal current conduction paths within the PV cells under local PSCs. Under partial shading, the grid structure of the shaded cells, including the main and finger electrodes, does not represent an optimal configuration, leading to an increase in the equivalent series resistance and additional local voltage losses.
This discrepancy is directly related to the equivalent modeling approach adopted in the simulation, where the reduction in illuminated area caused by shading is simplified as a decrease in irradiance. However, this approach does not fully account for the shading-induced reconstruction of current flow paths within the grid structure and the non-uniform variation in contact resistance. As a result, a certain degree of power overestimation occurs in the medium-to-high voltage operating region.
Despite these local deviations, the short-circuit current, open-circuit voltage, and maximum power point remain in good agreement with the experimental results, indicating that the model is reliable and provides high accuracy for the key characteristic parameters of the PV module.
3.3.2. Characteristics Analysis
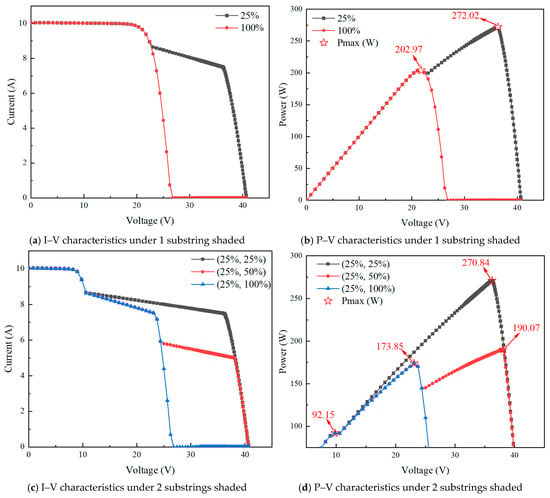
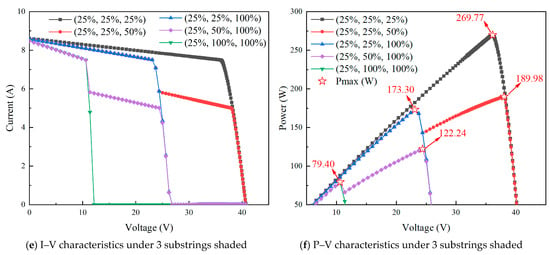
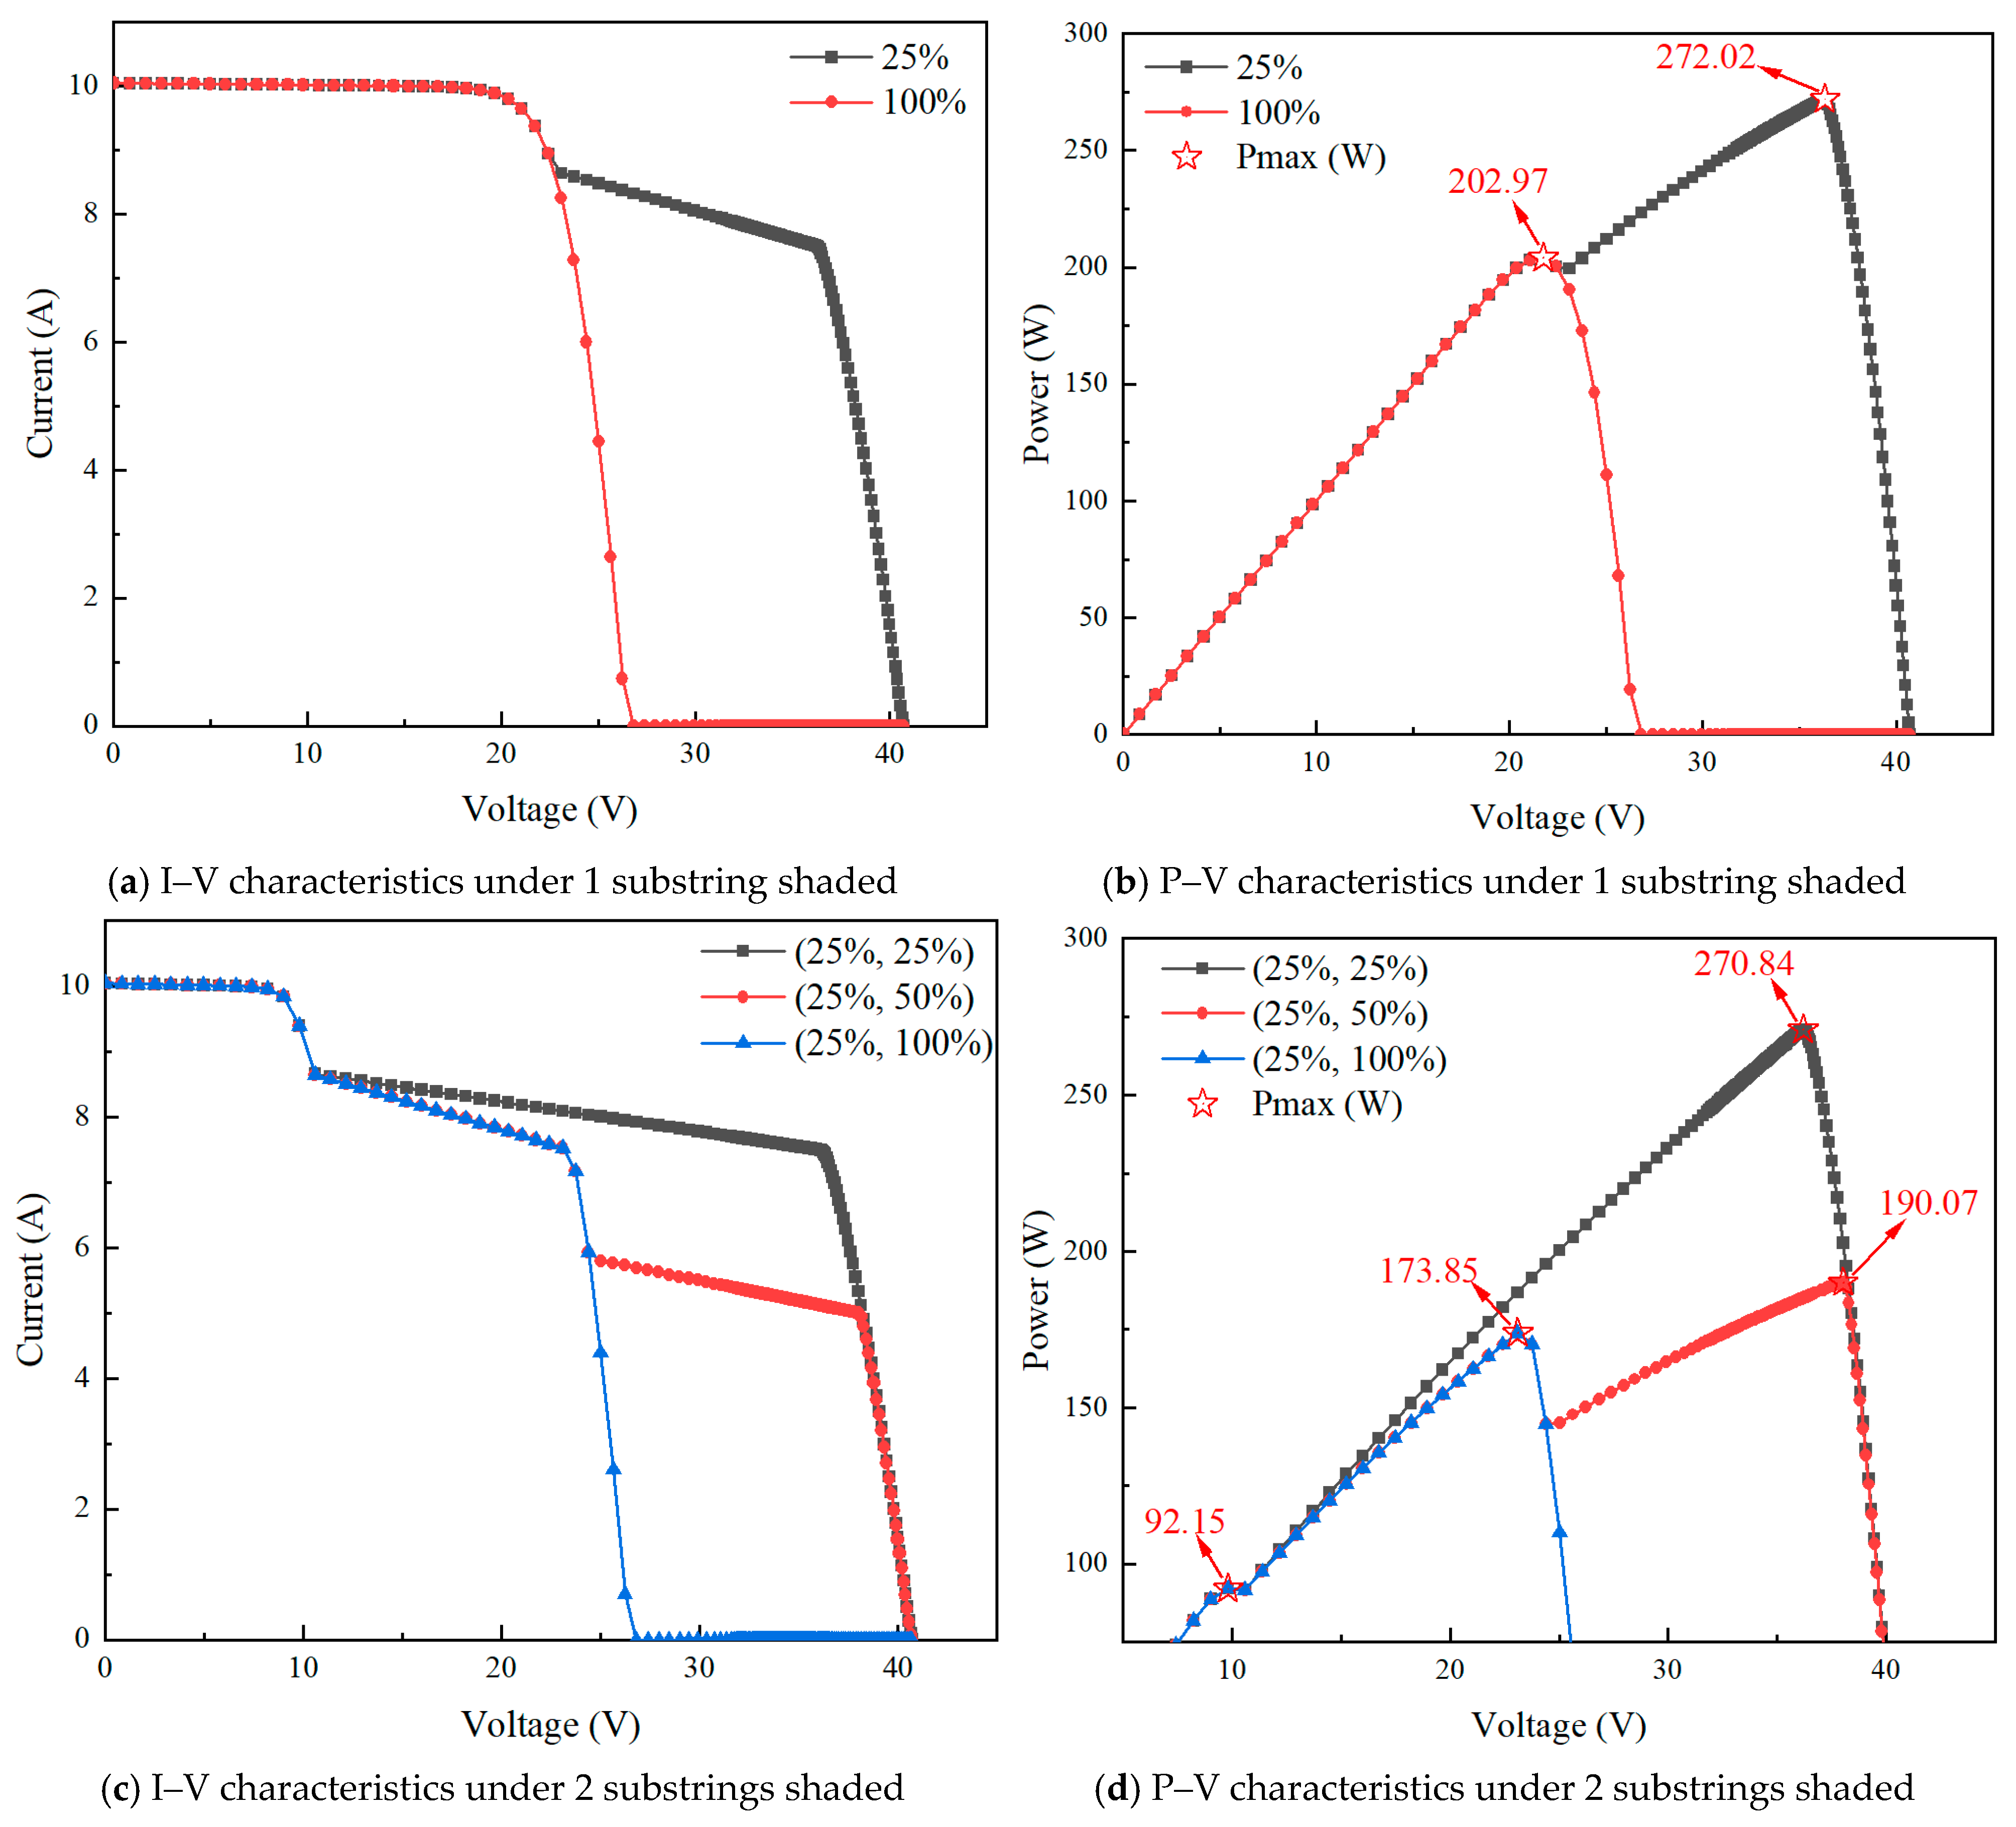
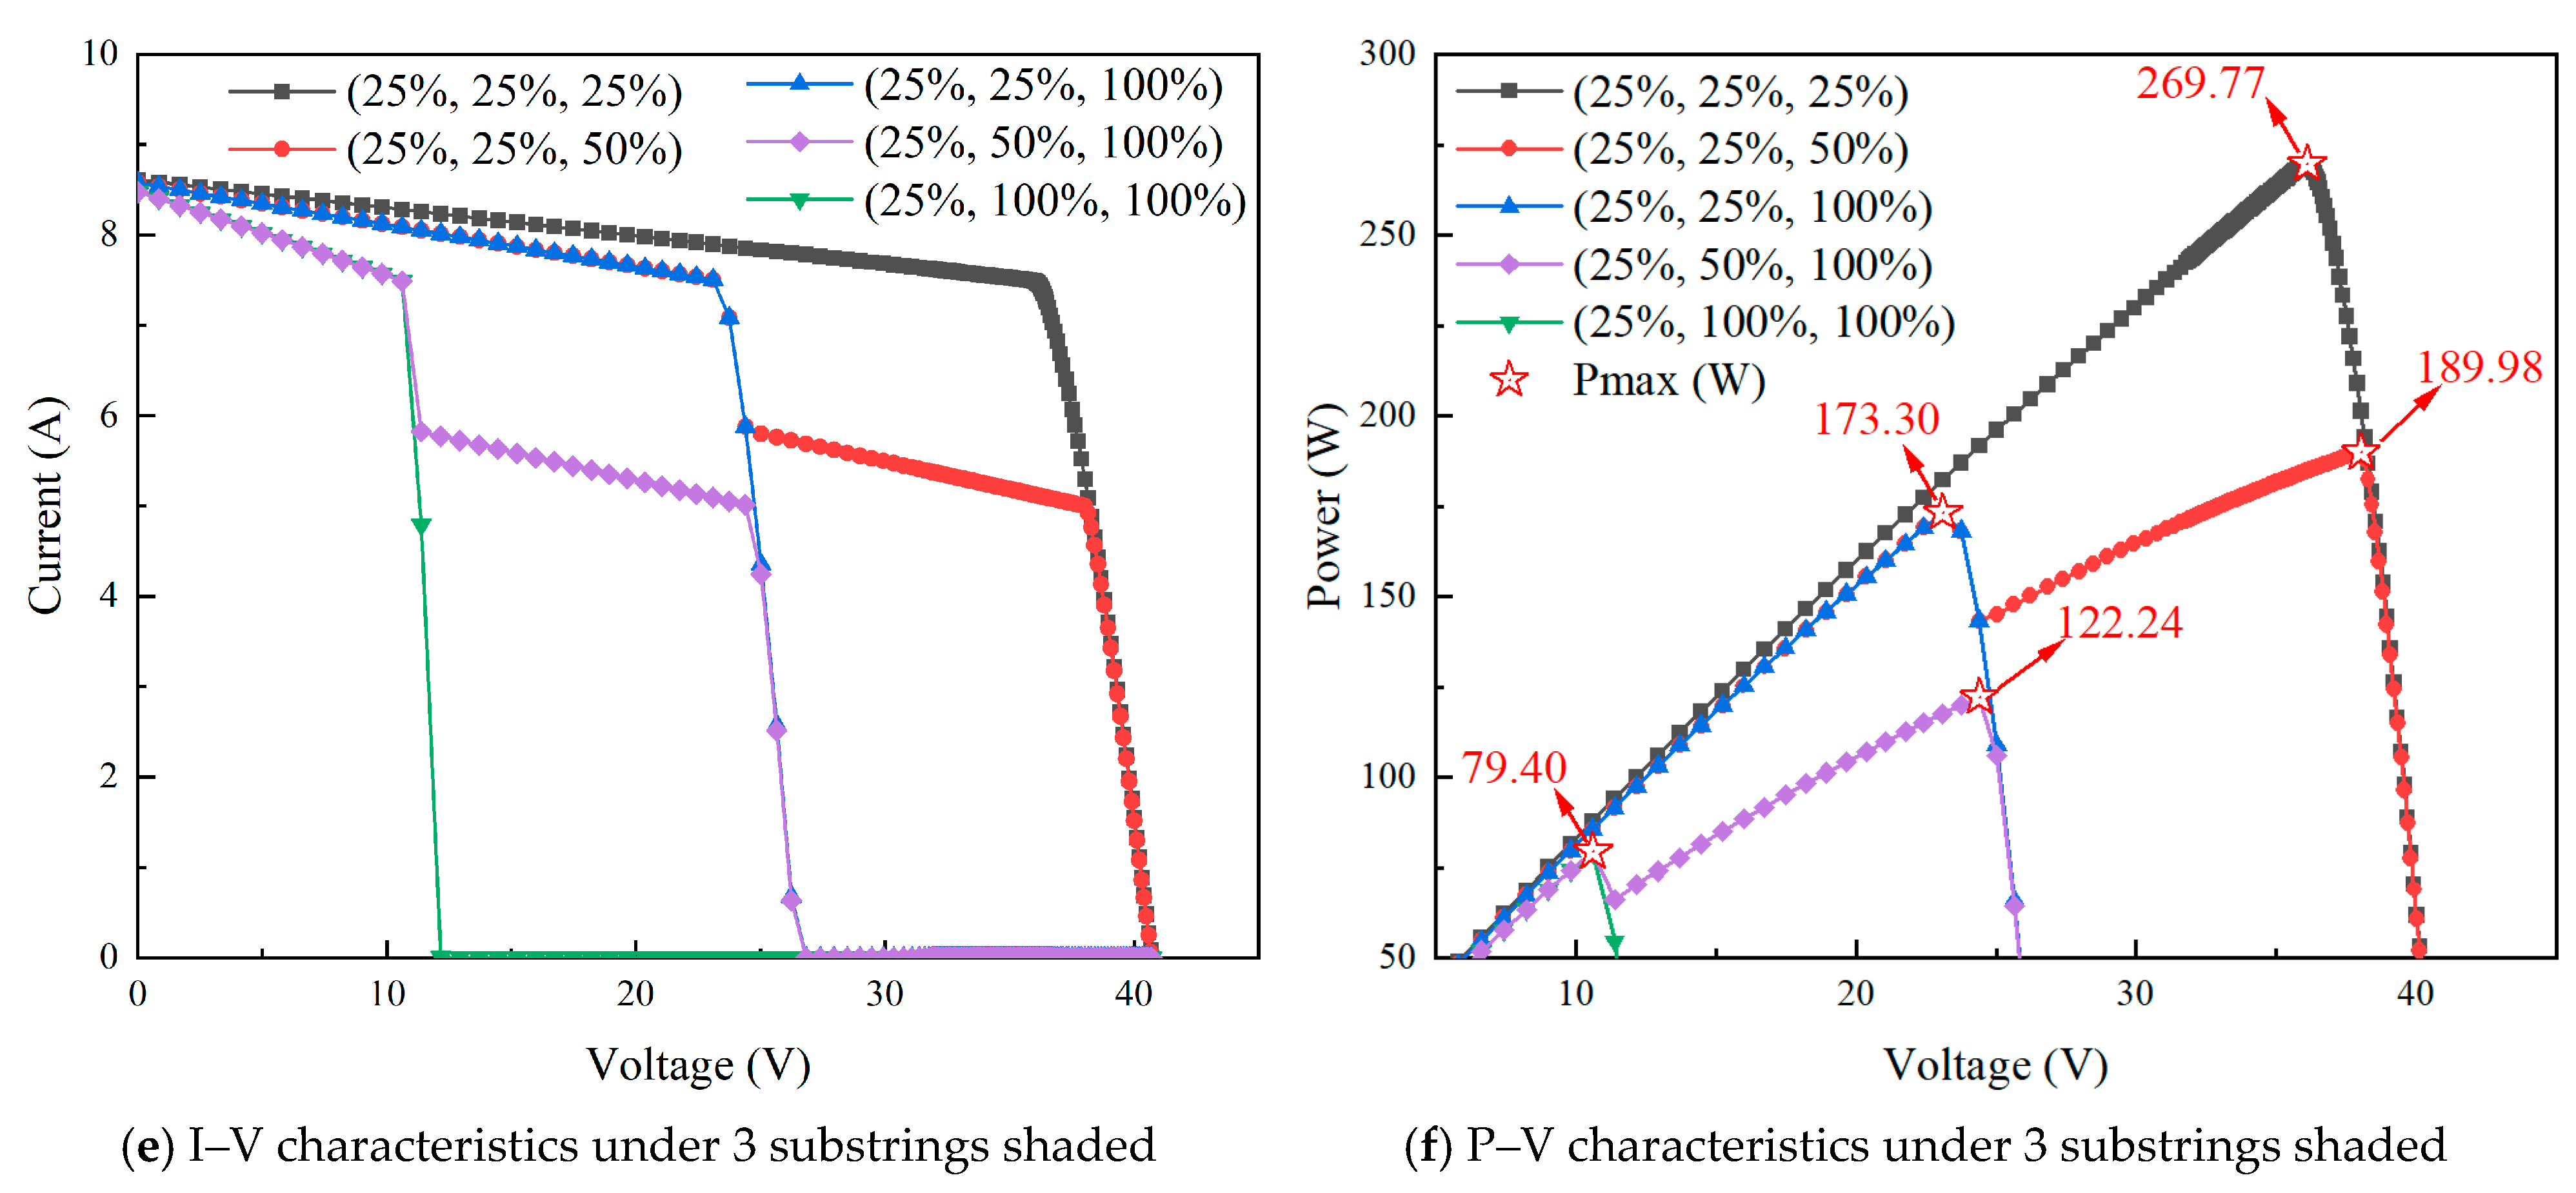
Simulation was conducted for different typical shading scenarios listed in Table 4, and the corresponding characteristics under different shading distributions are shown in Figure 8.
Figure 8.
Characteristics of the PV module under different substring shading conditions.
According to the characteristics shown in Figure 8, the combined influence of the number of shaded substrings and shading ratio significantly affects the electrical behavior of the PV module, and the variation patterns are more complex than those described in conventional understanding. Under one substring shaded condition (Str.k1) in Figure 8a,b, when the maximum shading ratio is 25%, the P–V curve already exhibits a double-peak characteristic, with two power peaks of 272.02 W and 202.97 W. However, the first peak corresponds to a relatively smooth inflection region and is not clearly reflected as a distinct current transition in the I–V curve. This indicates that even when only one substring is subjected to moderate shading, the current mismatch within the substring is sufficient to trigger premature conduction of the bypass diode, thereby forming two distinct power response regions at different voltage ranges. Nevertheless, since the unshaded substring still dominates the overall behavior, the first local peak is not pronounced. As the shading level increases to 100%, the shaded substring is almost fully bypassed, and the equivalent structure of the PV module tends to simplify. The P–V curve then returns to a predominantly single-peak characteristic, with the maximum power stabilizing at 202.97 W, indicating that the output of the system is mainly governed by the unshaded substring. In the high-voltage region, the I–V curve exhibits a pronounced decline, and the knee point gradually shifts toward the lower-voltage region with increasing maximum shading ratio. This knee point generally corresponds to the region near the MPP. This phenomenon is mainly attributed to the current mismatch among the series-connected substrings caused by partial shading. As the operating voltage increases, the shaded substrings gradually enter the reverse-bias state due to the reduced photocurrent. When the reverse voltage exceeds the turn-on threshold of the bypass diode, the corresponding bypass diode is activated, bypassing the affected substring and reducing the number of effective series-connected units in the module, which leads to a rapid decrease in the output current. With the increase in the maximum shading ratio, the current limitation effect of the shaded substrings becomes more significant, causing the bypass diodes to be triggered at lower voltages. Consequently, the knee point of the I–V curve shifts toward lower voltages, resulting in a corresponding shift in the MPP.
As shown in Figure 8c,d, when shading extends to two substrings (Str. (k1, k2)), the current mismatch evolves from a local effect to a multi-substring coupling effect. Different substrings alternately enter the current-limited or bypass state at different voltage ranges, resulting in a more pronounced segmented, stepwise feature in the I–V curve and a more complex multi-peak structure in the corresponding P–V curve. For instance, under the (25%, 25%) condition, two power peaks of 270.84 W and 92.15 W appear; under the (25%, 50%) condition, the curve further evolves into three peaks of 190.07 W, 173.85 W, and 92.15 W; while under the (25%, 100%) condition, it degenerates into two peaks of 173.85 W and 92.15 W. It can be observed that as the shading discrepancy increases, both the number and positions of the peaks are reconfigured, but the power differences between local peaks gradually decrease, making it more difficult to distinguish between the GMPP and LMPPs. Consequently, the system output becomes significantly more sensitive to the choice of operating point.
As shown in Figure 8e,f, when shading further extends to all three substrings simultaneously (Str. (k1, k2, k3)), all substrings participate in the current-limiting process, and the bypass diodes alternately conduct over a wider voltage range. This results in a more pronounced segmental superposition in the I–V curve, while the P–V curve exhibits a complex pattern characterized by the coexistence of multi-peak reconfiguration and partial merging. Under the (25%, 25%, 25%) condition, the shading levels of the three substrings are identical, enhancing the system’s effective symmetry, and the P–V curve presents a single peak of 269.77 W. When the shading combination becomes (25%, 25%, 50%), system asymmetry increases, producing two peaks at 189.98 W and 173.30 W. For the (25%, 25%, 100%) condition, the curve degenerates again into a single peak of 173.30 W. Under more strongly unbalanced shading, such as (25%, 50%, 100%), two peaks appear at 122.24 W and 79.40 W, and when the condition is (25%, 100%, 100%), the system further decreases, leaving only a single peak at 79.40 W. Overall, under high shading ratios or extreme unbalanced conditions, multiple PV substrings are effectively bypassed, leading to a sharp decline in module capability, significant reduction in the maximum power, and progressive entry of the system into a severely derated operating state.
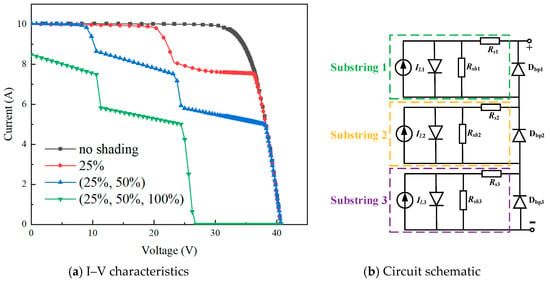
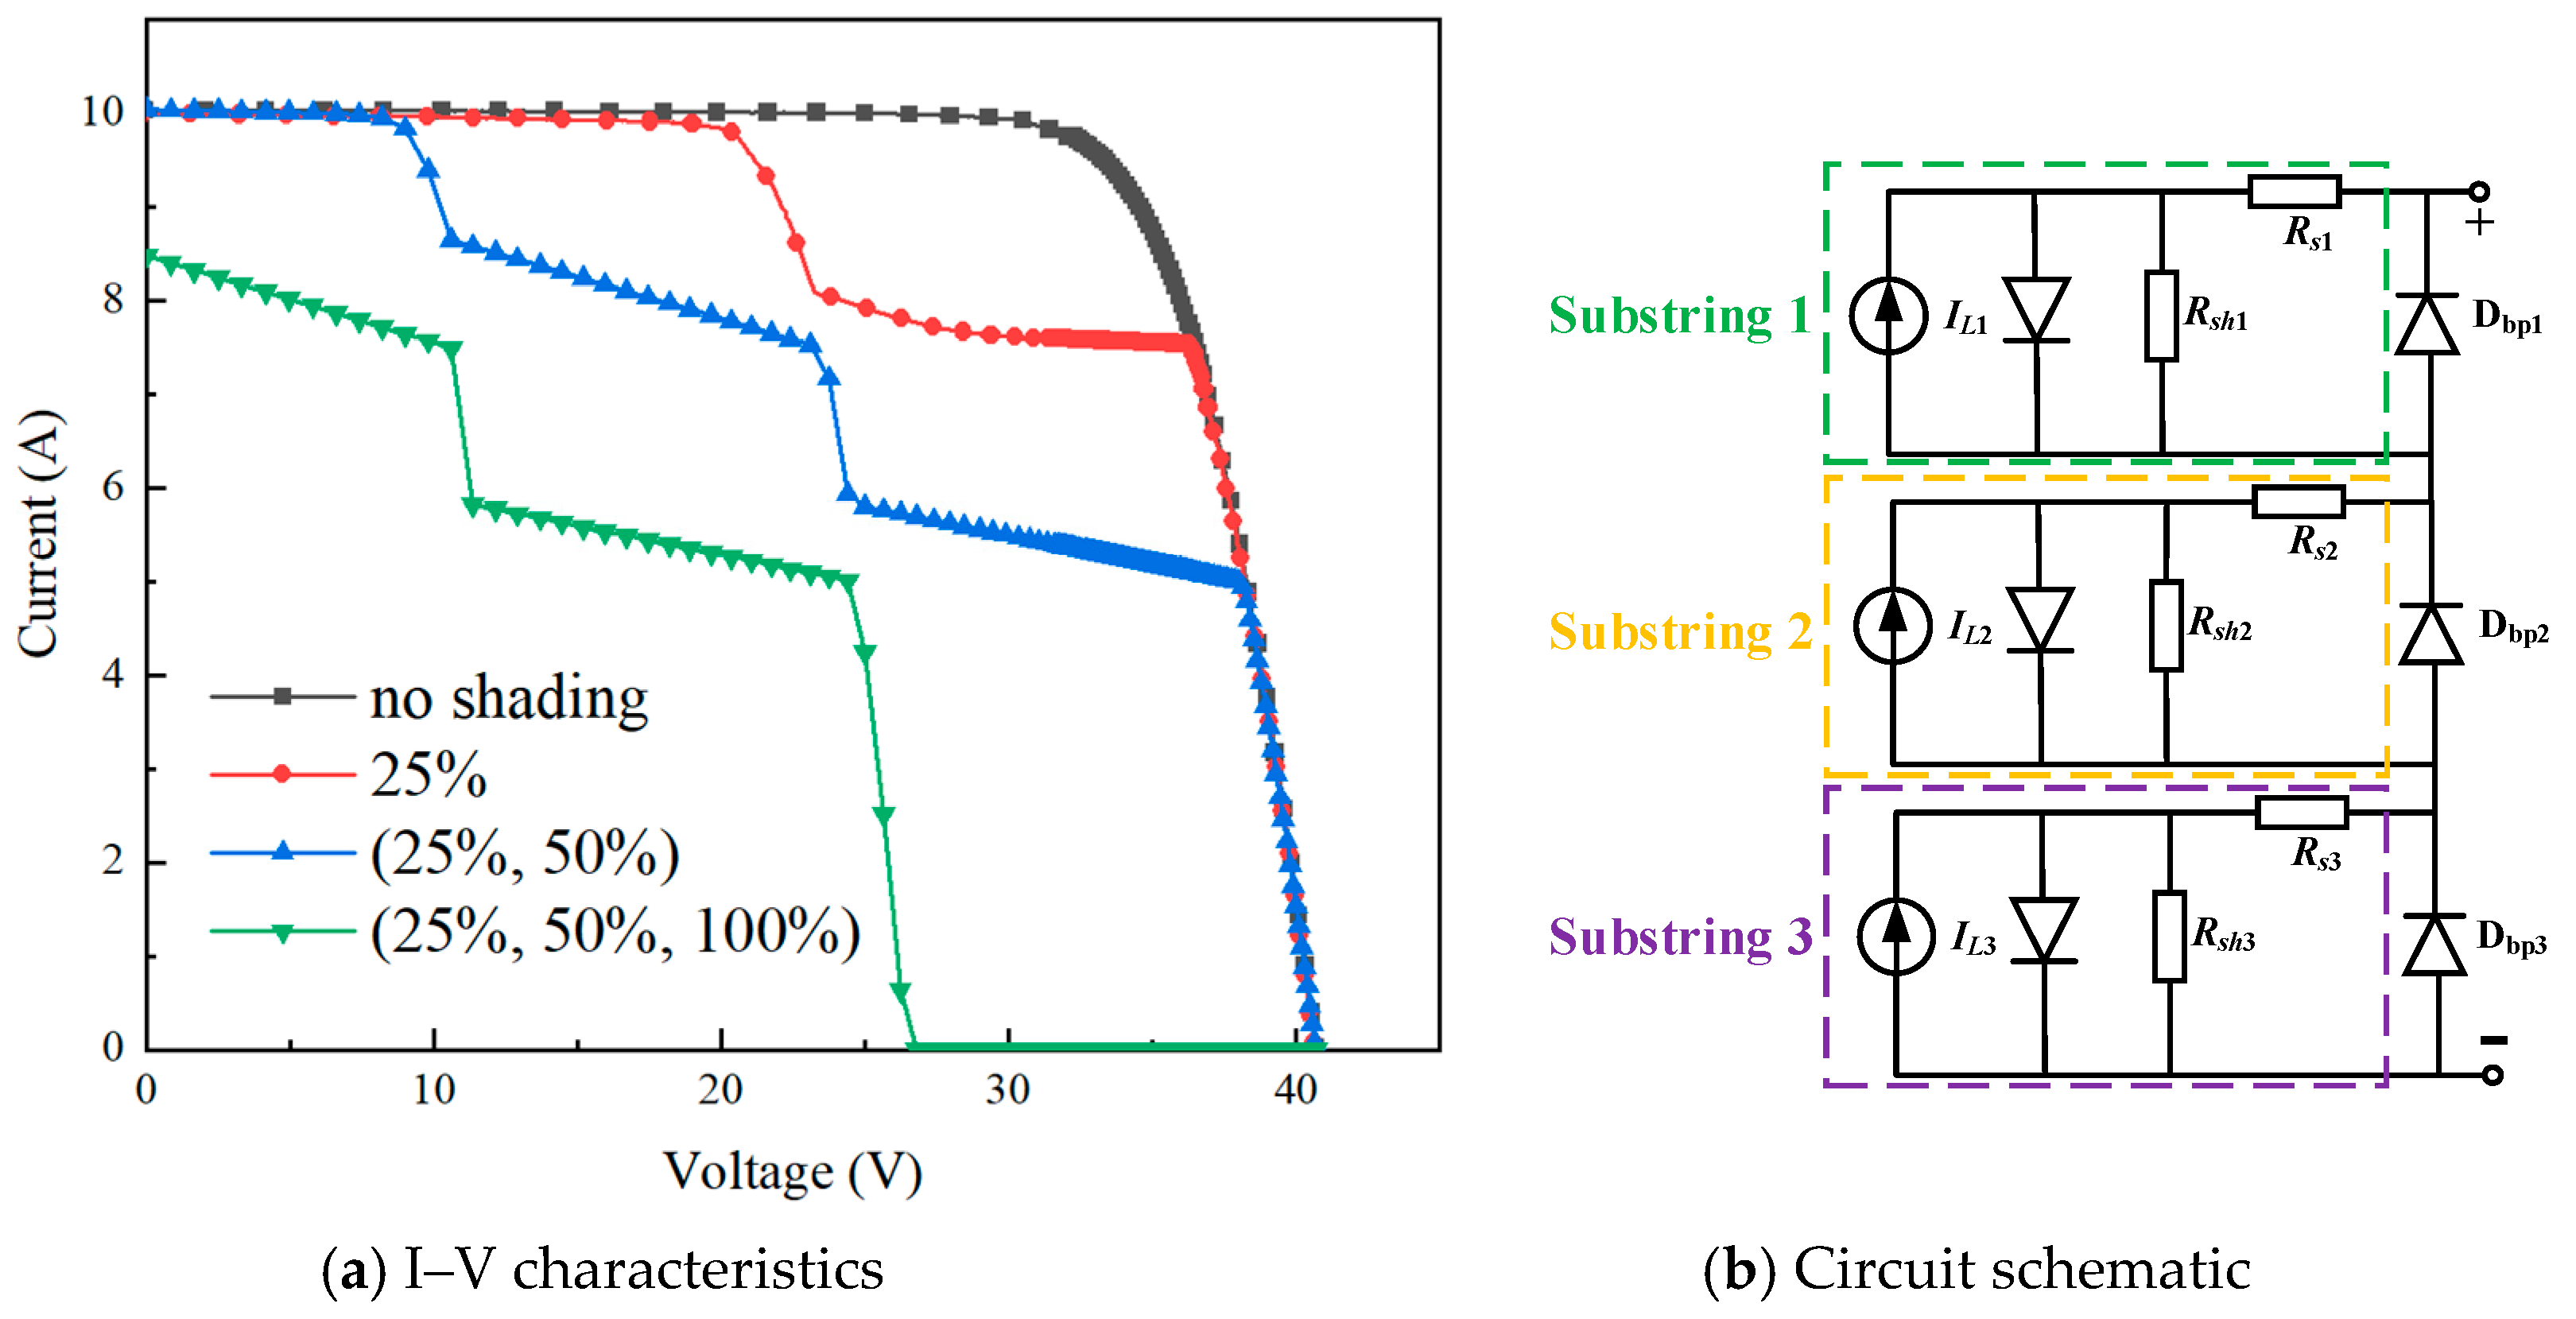
To further reveal the internal electrical reconfiguration process of PV modules under partial shading conditions, three typical shading scenarios selected from Figure 6 are compared with the unshaded case, and the corresponding I–V characteristics are presented in Figure 9a. The equivalent circuit configuration of the PV module is illustrated in Figure 9b. Under unshaded conditions, the three substrings are exposed to the same irradiance level, resulting in identical photocurrents. Therefore, all bypass diodes remain in the blocking state (R → ∞), and all substrings participate in power generation, leading to a continuous single-region I–V characteristic.
Figure 9.
Schematic illustration of the shading-induced reconfiguration in PV modules.
When partial shading is introduced, the photocurrent of the shaded substring decreases, resulting in current mismatch among the series-connected substrings. As the output voltage increases, the affected substring gradually becomes reverse-biased. Once the reverse voltage reaches the forward conduction threshold of the bypass diode, the bypass diode switches from the blocking state to the conducting state (R → 0), bypassing the affected substring and changing the number of electrically active substrings in the PV module. This transition is governed by the interaction of multiple factors, including the shading severity, the number of affected substrings, and the electrical characteristics of individual cells. Consequently, the I–V curves exhibit slope-dependent segmented characteristics in different voltage regions, where the slope is mainly determined by the equivalent internal resistance of the PV cells.
The above results indicate that, under representative PSCs, the characteristics of PV modules cannot be fully described solely by either the number of shaded substrings or the shading ratio. Instead, they are primarily governed by the coupling effect of these two factors, which induces current mismatch and determines the conduction sequence of bypass diodes. Under one-substring light or moderate shading conditions, small-amplitude local peaks already appear in the P–V curves, indicating the existence of multiple operating regions. Although such weak multi-peak characteristics are not pronounced, they may still interfere with the identification of the MPP.
With the increase in the number of shaded substrings and the enhancement of shading non-uniformity, the current mismatch gradually evolves from a local effect to a multi-substring coupling effect. The P–V curve further develops from a dual-peak characteristic into a multi-peak structure, while the power differences among individual peaks progressively decrease, leading to increasingly blurred boundaries between different power regions. Under symmetric multi-substring or high-ratio shading conditions, some substrings are bypassed, leading to the reconfiguration of the equivalent circuit structure of the PV module. Consequently, the P–V curve may return to a single-peak characteristic, although the corresponding maximum power is significantly reduced.
Thus, the above behavior can be identified as a “multi-factor effect”, which refers to a coupled mechanism in which the shading ratio and the number of affected substrings jointly interact through current mismatch and the sequential activation of bypass diodes, leading to a multi-peak reconstruction of the output characteristics of the PV module.
Overall, under complex shading conditions, the enhancement of multi-peak behavior and the reduction in peak-to-peak differences make it increasingly difficult to distinguish between the GMPP and LMPPs. This is also one of the primary reasons why traditional MPPT methods based on single-peak assumptions or local search strategies suffer from performance limitations under such operating conditions.
4. Conclusions
This study systematically investigated the characteristics and their variation trends of PV modules under representative PSCs through a combination of experiments and simulations. The experimental results indicate that, under the investigated incomplete local shading conditions, the module characteristics are mainly influenced by the maximum shaded area, while the effect of shading position is relatively limited for the tested configurations. When one or multiple cells within a substring are fully shaded, the performance degradation of the module is primarily associated with the number of bypassed substrings, and the P–V characteristics exhibit a pronounced stepwise behavior. The simulation results further demonstrate that, under representative PSCs, the electrical characteristics of PV modules are affected by the combined influence of shading ratio, the number of affected substrings, and bypass diode operating state, which are fundamentally dominated by current mismatch and the operating behavior of bypass diodes. With increasing current mismatch, the P–V characteristics gradually evolve from single-peak to multi-peak behavior, accompanied by reduced differences among individual peaks and increased overlap between characteristic regions. Under complex shading conditions, the enhancement of multi-peak structures together with the convergence of peak values may increase the difficulty of distinguishing between global and local maximum power points.
Author Contributions
Conceptualization, J.Z. (Jicheng Zhou); methodology, J.Z. (Jicheng Zhou) and X.Z.; software, X.Z.; validation, L.H. and J.Z. (Jianyong Zhan); formal analysis, L.H. and J.Z. (Jianyong Zhan); investigation, J.Z. (Jicheng Zhou); resources, J.Z. (Jicheng Zhou).; data curation, X.Z.; writing—original draft preparation, X.Z.; writing—review and editing, J.Z. (Jicheng Zhou) and X.Z.; supervision, J.Z. (Jicheng Zhou); project administration, J.Z. (Jicheng Zhou); funding acquisition, J.Z. (Jicheng Zhou), X.Z. All authors have read and agreed to the published version of the manuscript.
Funding
This work was supported by Dongguan Science and Technology of Social Development Program (Grant no. 20231800940252) and by Natural Science Project of Guangdong University of Science and Technology (Grant no. GKY-2025BSQDK-28, GKY-2024KYZDK-4, GKY-2024KYNK-10).
Institutional Review Board Statement
Not applicable.
Informed Consent Statement
Not applicable.
Data Availability Statement
The data that support the findings of this study are available from the corresponding author upon reasonable request.
Conflicts of Interest
The authors declare no conflicts of interest.
References
- Mehedi, I.M.; Salam, Z.; Ramli, M.Z.; Chin, V.; Bassi, H.; Rawa, M.; Abdullah, M. Critical evaluation and review of partial shading mitigation methods for grid-connected. PV system using hardware solutions: The module-level and array-level approaches. Renew. Sustain. Energy Rev. 2021, 146, 111138. [Google Scholar] [CrossRef] [Scilit]
- Lee, C.G.; Shin, W.G.; Lim, J.R.; Kang, G.H.; Ju, Y.C.; Hwang, H.M.; Chang, H.S.; Ko, S.W. Analysis of electrical and thermal characteristics of PV array under mismatching conditions caused by partial shading and short circuit failure of bypass diodes. Energy 2021, 218, 119480. [Google Scholar] [CrossRef] [Scilit]
- Kuznetsov, P.; Yuferev, L.; Voronin, D.; Panchenko, V.A.; Jasiński, M.; Najafi, A.; Leonowicz, Z.; Bolshev, V.; Martirano, L. Methods improving energy efficiency of photovoltaic systems operating under partial shading. Appl. Sci. 2021, 11, 10696. [Google Scholar] [CrossRef] [Scilit]
- Nunes, H.G.G.; Morais, F.A.L.; Pombo, J.A.N.; Mariano, S.J.P.S.; Calado, M.R.A. Bypass diode effect and photovoltaic parameter estimation under partial shading using a hill climbing neural network algorithm. Front. Energy Res. 2022, 10, 837540. [Google Scholar] [CrossRef] [Scilit]
- Hao, L.; Zhu, X.; Yuetikuer, A.; Zhan, J.; Ye, X.; Zhong, G.; Zhou, J. Thin-Layer Dust Accumulation Effects on Photovoltaic Modules and Design Optimization for the Module Structure. Coatings 2025, 15, 1442. [Google Scholar] [CrossRef] [Scilit]
- Kim, K.A.; Krein, P.T. Reexamination of photovoltaic hot spotting to show inadequacy of the bypass diode. IEEE J. Photovolt. 2015, 5, 1435–1441. [Google Scholar] [CrossRef] [Scilit]
- Ko, J.; Kim, C.; Lee, C.G.; Lee, D.; Ko, M.-G.; Ko, S.-W.; Song, H.-J. Improvement in the Reliability of Bypass Diode at Photovoltaic Modules Through an Intelligent Cooling System. Trans. Korean Inst. Electr. Eng. 2021, 70, 1870–1878. [Google Scholar] [CrossRef] [Scilit]
- Ren, H.; Han, P. Necessity analysis of bypass diode for ac module under partial shading condition. Energies 2021, 14, 4778. [Google Scholar] [CrossRef] [Scilit]
- Lu, Y.; Wang, L.; Wang, J.; Liu, P.; Rafee, R.; Rashidi, S.; Li, G. Effect of partial shading on the performance of concentrated photovoltaics: A simulation and experimental study based on the double-diode model. Energy 2026, 348, 140571. [Google Scholar] [CrossRef] [Scilit]
- Hou, G.; Guo, Z. Maximum power point tracking of solar photovoltaic under partial shading conditions based on improved salp swarm algorithm. Electr. Power Syst. Res. 2025, 241, 111316. [Google Scholar] [CrossRef] [Scilit]
- Ye, C.E.; Tai, C.C.; Huang, Y.P. Disperse partial shading effect of photovoltaic array by means of the modified complementary SuDoKu puzzle topology. Energies 2023, 16, 4910. [Google Scholar] [CrossRef] [Scilit]
- Siddique, M.A.B.; Zhao, D.; Rehman, A.U.; Ouahada, K.; Hamam, H. An adapted model predictive control MPPT for validation of optimum GMPP tracking under partial shading conditions. Sci. Rep. 2024, 14, 9462. [Google Scholar] [CrossRef] [Scilit] [PubMed]
- Kermadi, M.; Salam, Z.; Eltamaly, A.M.; Ahmed, J.; Mekhilef, S.; Larbes, C.; Berkouk, E.M. Recent developments of MPPT techniques for PV systems under partial shading conditions: A critical review and performance evaluation. IET Renew. Power Gener. 2020, 14, 3401–3417. [Google Scholar] [CrossRef] [Scilit]
- Bhattacharya, S.; Sadhu, P.K.; Sarkar, D. Performance evaluation of building integrated photovoltaic system arrays (SP TT, QT, and TCT) to improve maximum power with low mismatch loss under partial shading. Microsyst. Technol. 2024, 30, 583–597. [Google Scholar]
- Niazi, K.A.K.; Kerekes, T.; Dolara, A.; Yang, Y.; Leva, S. Performance assessment of mismatch mitigation methodologies using field data in solar photovoltaic systems. Electronics 2022, 11, 1938. [Google Scholar] [CrossRef] [Scilit]
- Oufettoul, H.; Lamdihine, N.; Motahhir, S.; Lamrini, N.; Abdelmoula, I.A.; Aniba, G. Comparative performance analysis of PV module positions in a solar PV array under partial shading conditions. IEEE Access 2023, 11, 12176–12194. [Google Scholar] [CrossRef] [Scilit]
- Song, Z.; Huang, L.; Dong, Q.; Zhang, G.; Chew, M.Y.L.; Setunge, S.; Shi, L. Impacts of shadow conditions on solar PV array performance: A full-scale experimental and empirical study. Energy 2025, 320, 135219. [Google Scholar] [CrossRef] [Scilit]
- Yang, B.; Ye, H.; Wang, J.; Li, J.; Wu, S.; Li, Y.; Shu, H.; Ren, Y.; Ye, H. PV arrays reconfiguration for partial shading mitigation: Recent advances challenges and perspectives. Energy Convers. Manag. 2021, 247, 114738. [Google Scholar] [CrossRef] [Scilit]
- Shao, C.; Migan-Dubois, A.; Diallo, D. Performance of PV array configurations under dynamic partial shadings. EPJ Photovolt. 2023, 14, 21. [Google Scholar] [CrossRef] [Scilit]
- Ko, S.W.; Ju, Y.C.; Hwang, H.M.; So, J.H.; Jung, Y.-S.; Song, H.-J.; Song, H.-E.; Kim, S.-H.; Kang, G.H. Electric and thermal characteristics of photovoltaic modules under partial shading and with a damaged bypass diode. Energy 2017, 128, 232–243. [Google Scholar] [CrossRef] [Scilit]
- Shen, Y.; He, Z.; Xu, Z.; Wang, Y.; Li, C.; Zhang, J.; Zhang, K.; Wei, H. Modeling of photovoltaic modules under common shading conditions. Energy 2022, 256, 124618. [Google Scholar] [CrossRef] [Scilit]
- Satpathy, P.R.; Bhowmik, P.; Babu, T.S.; Sain, C.; Sharma, R.; Alhelou, H.H. Performance and reliability improvement of partially shaded PV arrays by one-time electrical reconfiguration. IEEE Access 2022, 10, 46911–46935. [Google Scholar] [CrossRef] [Scilit]
- Ali, M.H.; Zakaria, M.; El-Tawab, S. A comprehensive study of recent maximum power point tracking techniques for photovoltaic systems. Sci. Rep. 2025, 15, 14269. [Google Scholar] [CrossRef] [Scilit] [PubMed]
- MathWorks. MATLAB and Simulink Release 2022a; The MathWorks, Inc.: Natick, MA, USA, 2022. [Google Scholar]
- Yadav, A.S.; Mukherjee, V. Conventional and advanced PV array configurations to extract maximum power under partial shading conditions: A review. Renew. Energy 2021, 178, 977–1005. [Google Scholar] [CrossRef] [Scilit]
- Wang, G.; Zhao, K.; Shi, J.; Chen, W.; Zhang, H.; Yang, X.; Zhao, Y. An iterative approach for modeling photovoltaic modules without implicit equations. Appl. Energy 2017, 202, 189–198. [Google Scholar] [CrossRef] [Scilit]
- Zhu, L.; Li, Q.; Chen, M.; Cao, K.; Sun, Y. A simplified mathematical model for power output predicting of Building Integrated Photovoltaic under partial shading conditions. Energy Convers. Manag. 2019, 180, 831–843. [Google Scholar] [CrossRef] [Scilit]

Disclaimer/Publisher’s Note: The statements, opinions and data contained in all publications are solely those of the individual author(s) and contributor(s) and not of MDPI and/or the editor(s). MDPI and/or the editor(s) disclaim responsibility for any injury to people or property resulting from any ideas, methods, instructions or products referred to in the content. |
© 2026 by the authors. Licensee MDPI, Basel, Switzerland. This article is an open access article distributed under the terms and conditions of the Creative Commons Attribution (CC BY) license.