


Highlights
What are the main findings?
- Optical methods have the broadest evidence base for thermographic inspection of TBCs.
- Thermal contrast alone does not establish defect depth, residual adhesion or remaining life.
- Thermographic defect detection in multifunctional TBCs still requires direct validation.
What are the implications of the main findings?
- Select excitation according to the defect type and coating architecture.
- Validate on realistic TBC damage and quantify uncertainty and probability of detection.
- Distinguish damage signals from intended material heterogeneity and ageing effects.
Abstract
Thermal barrier coatings (TBCs) require nondestructive inspection because cracking and interfacial separation can compromise thermal protection. This review critically examines active infrared thermography for defect detection and characterization in conventional TBCs and evaluates prospects for multifunctional coatings. Excitation approaches are organized into four practical groups: external optical heating, internal mechanical heating, internal electromagnetic heating, and material-enabled or embedded excitation. The reviewed studies address interfacial debonds and delaminations, surface microcracks, top coat thickness and overthickness, ageing-related changes in thermal diffusivity, CMAS-induced failure and substrate cracks beneath the coating. Optical thermography has the most established evidence base, with debonds of about 1–2 mm beneath 0.2–0.5 mm top coats, surface cracks about 10 µm wide and top coat thickness within a few percent reported under laboratory conditions, while mechanical and induction excitation offer complementary sensitivity to contacting cracks, debonds and substrate cracks. Detection and localization must therefore be distinguished from validated sizing, depth estimation and assessment of residual adhesion or remaining life. Direct thermographic validation of multifunctional TBCs remains limited in the reviewed literature, despite demonstrated embedded sensing and functional material integration. Research priorities include validation on representative damage, independent measurements, uncertainty assessment and probability of detection studies.
1. Introduction
Thermal barrier coatings (TBCs) protect metallic components in aircraft and industrial gas turbines by limiting heat flow into the substrate. Their use in conjunction with component cooling supports higher gas temperatures while maintaining accep metal temperatures [1,2]. TBCs were first used routinely on combustor liners and, from the late 1980s, also on rotating turbine blades [2,3]. Thermally sprayed abradable seal coatings on the casing side additionally reduce the clearance between the blade tips and the casing and must withstand high-speed scraping by the blades [4].
Conventional systems comprise a ceramic topcoat, commonly yttria-stabilized zirconia (YSZ) with 6–8 wt.% Y2O3 and a thickness of about 100–600 µm, a metallic MCrAlY or aluminide bond coat of about 75–150 µm and a thermally grown oxide, predominantly α-Al2O3, that develops during exposure and typically remains below about 10 µm [1,2,3,5,6,7,8]. Rotating aero-engine parts typically carry 100–250 µm top coats, compared with 250–500 µm on stationary components [3]. The performance of this layered system depends on thermal insulation, mechanical compliance and interfacial integrity. Assessing coating condition is therefore an integral part of evaluating the durability of the protected component [2].
Thermomechanical loading and oxidation promote cracking and interfacial separation, which can develop before extensive spallation becomes visible [9,10]. Environmental attack further complicates degradation. Infiltration by molten calcia magnesia alumino silicate (CMAS), for example, can alter the thermal and mechanical properties of the topcoat and promote delamination [11]. These mechanisms create a need for nondestructive inspection that can identify damage within an evolving multilayer system. Such inspection must distinguish harmful discontinuities from the pores, column gaps and microcracks that contribute to thermal insulation or strain accommodation in the original coating microstructure [2].
Several nondestructive methods have been applied to TBCs, and their main characteristics are compared in Table 1. Ultrasonic testing can detect delamination and characterise elastic properties [12], but attenuation in porous sprayed ceramics and the need for coupling limit its use [13,14,15]. Eddy current testing estimates the top coat thickness through lift-off and the thickness and conductivity of the bond coat, which indicate delamination and degradation [16], but it does not image separations within the ceramic. Terahertz time-domain spectroscopy and microwave techniques penetrate the ceramic top coat and have been used to measure its thickness [13,17,18,19], while impedance spectroscopy tracks growth of the interfacial oxide but requires electrodes [20]. Spectroscopic methods add information on phases and stresses. Raman spectroscopy reveals phase changes in zirconia during thermal cycling [21], and photoluminescence piezospectroscopy of Cr3+ in the TGO measures oxide stresses through the top coat [2]. Luminescent sensing layers additionally enable temperature and delamination measurements [22,23]. These methods are mostly point measurements or require scanning, whereas active infrared thermography provides contactless, full-field and rapid inspection of large areas, at the cost of a sensitivity that decreases with depth and depends on the optical properties of the ceramic [24,25].
Table 1.
Comparison of active infrared thermography with alternative nondestructive methods for TBC inspection.
Infrared cameras are used across engineering and medicine, including nondestructive inspection of aerospace components [24] and assessment of skin temperature patterns in inflammatory and peripheral vascular conditions [38,39]. Focal plane array cameras became common in the 1990s and substantially improved the spatial resolution and sensitivity of infrared imaging [38,40]. Current cooled cameras provide, for example, 640 × 480 pixels with a thermal sensitivity of about 20 mK [28], and macro lenses allow spatial sampling of about 25 µm per pixel [41]. Photothermal and thermographic techniques have been applied to TBCs for about three decades [25]. For the inspection of TBCs, active infrared thermography records the spatial and temporal radiative response of the coating system to controlled energy input. Heat may be supplied at the surface or generated within the system, and defects may influence either local energy dissipation or subsequent heat transfer. Infrared imaging provides spatially resolved, noncontact readout, although the excitation arrangement may itself require contact [24]. Investigations of conventional TBCs have established thermography as a means of examining adhesion defects and thermophysical changes, including inspection of turbine components [25]. Its diagnostic value depends on matching the excitation and analysis to the physical interaction between the defect and the layered structure.
A detected thermal anomaly does not uniquely identify a defect. Optical absorption governs energy deposition during optical excitation, while emissivity and infrared semitransparency affect the radiance recorded by the camera. In unpainted TBCs, discolouration can create misleading contrast, whereas semitransparency can impair disbond identification [32]. Coating overthickness can also resemble an adhesion defect in thermographic data [42]. Detection and localization must consequently be distinguished from quantitative estimates of lateral size or depth. Thermal spreading influences the apparent boundary of an indication, and quantitative interpretation requires a validated relationship between the measured response and the coating properties and geometry, established through calibration, modelling or both. Neither a thermal indication nor its estimated dimensions independently establish residual adhesion or remaining service life [25].
The development of multifunctional TBCs introduces a further diagnostic challenge. In this review, multifunctionality denotes a deliberately incorporated capability, such as temperature sensing or autonomous crack repair, that supplements the thermal protection provided by the coating. Reduced thermal conductivity or a more complex layer architecture alone does not establish this additional functionality. Research on self-healing TBCs and demonstrations of embedded thermocouples provide examples of the relevant material and sensing developments [43,44]. Their significance for defect inspection requires separate assessment. Demonstrating a sensing or healing function does not, by itself, validate active infrared thermography for detecting damage or evaluating functional recovery in the same coating.
Additional phases and embedded elements may modify optical absorption, infrared emission and heat transport. Under electrical excitation, they may also alter the distribution of deposited power. These changes make multifunctionality relevant both to the generation of thermal contrast and to its interpretation. A designed heterogeneity may produce a thermal indication even in an intact coating, while ageing of a functional constituent may alter the reference response. Conversely, an embedded conductor could provide a controllable internal heat source. This remains a prospective inspection route distinct from the embedded temperature sensing demonstrated in TBCs [44]. The resulting research question is how additional functionality can improve defect observability while preserving thermal protection and avoiding ambiguity between damage and changes in material properties.
Existing reviews provide substantial foundations for TBC thermography [25,29] and for active infrared techniques applied to aerospace materials [24]. The present review connects these diagnostic principles with the architecture, degradation and evolving functionality of TBCs. It critically compares the evidence for defect detection and characterization using four practical groups: external optical heating, internal defect-selective mechanical heating, internal electromagnetic heating, and material-enabled or embedded thermography. The final group emphasises the role of functional constituents and embedded elements in thermographic excitation and can overlap with the other groups. Excitation mechanisms are considered separately from the processing methods applied to the recorded thermal sequences. Comparisons focus on defect type, coating structure, measurement conditions and the level of quantitative validation achieved.
The review distinguishes direct experimental evidence for TBCs from demonstrations in other materials and from proposed extensions to multifunctional coatings. Particular attention is given to the difference between detecting an indication and establishing its dimensions, depth or significance for coating integrity. This distinction provides the basis for identifying research priorities in representative damage validation, measurement uncertainty and interpretation informed by coating physics. Section 2 introduces the coating architectures and functional developments needed for this analysis, and Section 3 discusses the relevant degradation mechanisms. Section 4 evaluates the thermographic approaches within the four groups and summarises examples for TBCs in different conditions. Section 5 examines the current status and prospects of multifunctional TBCs from the perspective of defect inspection, and Section 6 presents the conclusions.
2. Thermal Barrier Coatings (TBCs)
2.1. TBCs—Characteristics and Coating Techniques
Thermal Barrier Coatings (TBCs) are ceramic multilayer protective systems designed to shield metallic components from severe thermal conditions encountered in applications such as aircraft engines, stationary gas turbines, power generation and automotive exhaust systems. By providing effective thermal insulation and maintaining a pronounced temperature difference between the hot gas flow and the underlying load-bearing superalloy, TBCs enable turbine components to operate at temperatures that can approach or even surpass the melting temperature of the substrate material [45].
A standard TBC is not a single material but a specialized system composed of three distinct functional layers: Top Coat (1), Thermally Grown Oxide (2) and Bond Coat (3). Top Coat (TC) is an outer ceramic coating (most commonly yttrium-stabilized zirconia—YSZ), ranging from 100 to 600 µm, with very low thermal conductivity and a high melting point [1,2]. It directly faces the hot gas and provides the primary thermal insulation. This coating can be applied via a variety of techniques, such as Atmospheric Plasma Spraying (APS) or Electron Beam Physical Vapor Deposition (EB-PVD). Thermally Grown Oxide (TGO) is a thin, native layer (mostly α-Al2O3) that automatically develops at the interface between the top coat and bond coat during high-temperature operation (this layer is not deposited; instead, it grows) [5,6]. To prevent premature failure, the TGO thickness must not exceed 10 µm. Bond Coat (BC) is a metallic layer (typically an MCrAlY alloy where M = Ni and/or Co) with a thickness of approximately 100 µm (usually in the 75–150 µm range), which protects the substrate from oxidation and corrosion and ensures adhesion for subsequent layers [7]. BC is applied directly to the superalloy substrate. It serves as an oxygen barrier and anchors the ceramic top coat to the metal. The superalloy substrate is most commonly nickel- or cobalt-based superalloys, used to manufacture components such as turbine blades. Figure 1 shows the TBC layer structure.
Figure 1.
Structure of a conventional TBC system with typical layer materials and thicknesses (layer thicknesses not to scale).
Top coats are predominantly deposited via either Atmospheric Plasma Spraying (APS) or Electron Beam Physical Vapor Deposition (EB-PVD) [3,43,46]. In the APS process, the coating material is melted within a plasma jet and accelerated toward the substrate, where particles flatten upon impact to form characteristic “splats” (microscopic plates or flakes). This disrupts the continuous paths to the superalloy substrate. As a result, APS coatings exhibit lower thermal conductivity and significantly restrict oxygen transport through the top coat. EB-PVD utilizes an electron beam to evaporate an ingot under vacuum conditions, directing vaporized particles onto the substrate. Other viable deposition methods for top coats include Suspension Plasma Spraying (SPS), High-Velocity Oxygen-Fuel (HVOF) spraying, and Plasma Spray Physical Vapor Deposition (PS-PVD) [47]. The microstructure and resultant properties of the top coat depend heavily on the deposition method. EB-PVD coatings typically exhibit a columnar microstructure characterized by nano-scale intra-columnar porosity [48]. This columnar morphology provides excellent strain tolerance, allowing the top coat to accommodate thermal expansion mismatches without premature failure. However, these column boundaries slightly increase thermal conductivity and offer negligible resistance to oxygen penetration. Consequently, when paired with an EB-PVD top coat, the underlying bond coat must be exceptionally robust to facilitate the growth of a protective, dense thermally grown oxide (TGO).
Bond coat layer can be applied via APS, Chemical Vapor Deposition (CVD), or electroplating and aluminizing. CVD is among the most prevalent techniques for bond coat fabrication. EB-PVD typically produces a columnar top coat with nanoscale intra- and intercolumnar porosity [49,50,51], whereas APS produces a lamellar microstructure of flattened splats with pores, microcracks and inter-splat boundaries [52,53]. For thermographic analysis, the deposition route matters mainly because it determines the top coat thickness, the thermal diffusivity and the optical scattering that governs the translucency of YSZ [26,32]. For example, a thermal diffusivity of about 3.2 × 10⁻⁷ m2/s and a thermal conductivity of 0.9 W/(m K) were used for a 400 µm sprayed top coat [54], and a conductivity of 1.36 W/(m K) for a sprayed zirconia coating [55]. Figure 2 illustrates the microstructural differences between coatings produced using different deposition techniques.
Figure 2.
Columnar YSZ coating and lamellar YSZ coating resulting from the application of different coating techniques.
2.2. TBC Applications
In modern materials engineering, Thermal Barrier Coatings (TBCs) serve as a critical technology enabling machinery to operate under extreme temperature regimes. Their primary function is to provide thermal insulation to metallic substrates, effectively reducing the base metal temperature by 100 °C to 300 °C. This substantial temperature drop allows the combustion gases to exceed the melting point of the superalloys themselves, pushing the boundaries of thermodynamic efficiency.
2.2.1. Aerospace and Gas Turbine Engines
Thermal barrier coatings are used on turbine blades, combustors, and other hot-section parts to insulate them from extreme heat, often accompanied by substantial mechanical stresses, oxidation, and cyclic temperature variations [1,56]. In aero engines, combustor liners were the first components to use APS TBCs routinely, whereas turbine blades are coated by EB-PVD, and coatings on rotating parts are typically 100–250 µm thick compared with 250–500 µm on shrouds, nozzles and combustor parts [3]. Helicopter engines operating in desert environments are particularly exposed to sand ingestion, and substantial performance deterioration caused by glassy deposits on high-pressure turbine vanes was reported for military helicopters in the 1990s [11]. These differences in duty cycle and particulate exposure between civil, military and rotorcraft engines therefore determine which damage mode dominates, and hence which defects inspection must detect.
2.2.2. Industrial and Power-Generation Gas Turbines
TBCs are also important in stationary gas turbines used for electricity generation and industrial power production. Thermal barrier coatings protect nozzles, shrouds, buckets, combustor liners, and other turbine components from heat, oxidation, and hot corrosion [57]. Larger power generation components, such as combustors, nozzles and buckets, are predominantly coated by APS because of their size [3]. The benefits achieved in practice depend on the operating cycle, cooling strategy, fuel composition and environmental conditions [1,47]. Industrial turbines operate for extended periods, for example 20,000 h, during which the metastable t′ phase of YSZ can transform into the monoclinic phase [3]. Deposits formed from ingested particles are discussed in Section 3.3.
2.2.3. Internal Combustion Engines and Automotive Systems
Another area of research is the application of TBCs to internal combustion engines, particularly diesel engines. Potential coating locations include piston crowns, cylinder heads, valves, and selected exhaust-system components exposed to elevated temperatures. Thermal insulation at these locations may influence heat transfer between combustion gases and engine components, potentially affecting thermal efficiency, combustion behaviour, exhaust-gas energy, and component durability [5,58]. Reported coatings differ from turbine systems in both material and thickness. For example, a 400 µm plasma-sprayed blend of YSZ and aluminosilicate on a 100 µm NiCrAl bond coat was applied to diesel piston crowns [58], whereas thin thermal swing coatings of 50–70 µm produced by plasma electrolytic oxidation have been tested on pistons [59]. However, the outcome depends strongly on engine design, coating properties, and operating conditions. A reduction in heat loss does not automatically translate into an overall efficiency improvement [59]. Unlike gas turbine components, engine parts may experience complex combinations of cyclic thermal loading, impact, abrasion, and contact stresses. Coatings must therefore withstand repeated heating and cooling while maintaining sufficient adhesion and mechanical integrity. Accordingly, although TBCs have potential in selected automotive applications, their suitability must be established for each component and service environment rather than assumed from their performance in gas turbines.
2.3. Multifunctional Coating Systems
Thermal barrier coatings (TBCs) have traditionally been developed to minimise heat transfer to metallic components and mitigate material degradation under severe thermal conditions. The growing demands placed on modern gas turbines and other high-temperature energy systems have highlighted the need for coating technologies that provide thermal insulation while addressing several environmental and operational challenges simultaneously. Consequently, current research increasingly focuses on integrating complementary protective functions into advanced TBC architectures [1,11,43]. The term multifunctional thermal barrier coatings refers to coating systems designed to combine their primary heat-insulating role with additional properties that improve component protection or performance. This broad usage includes coatings whose composition or architecture is modified to improve thermal insulation or resistance to a particular degradation mechanism. In this review, such coatings are termed modified TBCs, and the term multifunctional TBCs is reserved for coatings with a distinct additional function, such as temperature or damage sensing or autonomous crack healing, as defined in Section 1. Accordingly, multilayer, graded and CMAS-resistant coatings are treated as modified TBCs unless an additional function is explicitly identified. Such systems may incorporate multiple functional layers, modified ceramic compositions, secondary phases, or deliberately engineered microstructures. The distribution of these features throughout the coating can be tailored to meet specific service requirements, allowing different regions of the system to contribute to thermal management, environmental protection, and mechanical durability. A multifunctional coating is not limited to passive protection; it is designed to respond to triggers such as temperature, pH, moisture, damage, or light, and then provide one or more additional functions beyond barrier protection [60]. Depending on the operating environment and material design, additional functions may include resistance to oxidation, hot corrosion, erosion, and mechanical wear, as well as protection against deposits containing calcium, magnesium, aluminum, and silicon oxides, collectively referred to as CMAS (Section 3.3). Other possible functionalities include limiting the transport of oxygen and water vapour, suppressing high-temperature sintering, enabling self-healing of cracks, controlling radiative heat transfer, and tailoring surface characteristics for particular applications [11,60]. Several material-design approaches can be employed to achieve these combined effects. In multilayer architectures, individual coatings can be selected to fulfil distinct but complementary roles, such as providing thermal resistance, stabilising the underlying material against oxidation, or limiting the penetration of corrosive species. Functionally graded systems offer a different approach, in which the chemical composition or microstructure varies progressively through the coating thickness. Such transitions can help manage differences in thermomechanical properties between adjacent regions. A further possibility involves modifying a single ceramic layer through the incorporation of selected additives or the introduction of specific structural features, thereby improving more than one performance characteristic without necessarily increasing the number of layers [7,48]. The simultaneous optimisation of several coating functions presents important materials-engineering challenges. Changes intended to improve one property may compromise another. For instance, reducing open porosity can restrict the penetration of molten deposits, but may also increase effective thermal conductivity and reduce the coating’s ability to accommodate strain. Likewise, introducing additional phases may enhance chemical stability or resistance to environmental attack, while changing thermal expansion behaviour, fracture resistance, or interfacial compatibility. In self-healing systems, the healing reaction must also proceed under relevant service conditions without causing unacceptable changes in the coating’s microstructure or thermal properties. These competing requirements make the selection of constituent materials, layer arrangement, and processing conditions essential to the development of reliable multifunctional TBCs [61].
3. Failure Mechanisms of TBCs
Thermal barrier coatings (TBCs) are exposed to demanding operating conditions that can progressively impair their thermal insulation capability, mechanical integrity, and adhesion to the underlying substrate. Their degradation is governed by a combination of thermal, mechanical, chemical, and environmental factors, including repeated temperature fluctuations, oxidation, microstructural evolution, and interaction with molten contaminants. Depending on the coating composition, deposition technique, architecture, and service environment, damage may initiate within the ceramic top coat, at the interfaces between individual layers, or in the metallic bond coat [62]. Although individual degradation processes can be distinguished for analytical purposes, they frequently occur simultaneously and influence one another. Their cumulative effects may ultimately lead to cracking, delamination, and spallation, exposing the metallic component to substantially higher thermal loads [1,2,3]. The failure mechanisms of TBC structures are presented in Figure 3. The principal failure mechanisms of TBCs include thermally induced cracking, oxidation and TGO growth, sintering, chemical and phase instability, CMAS infiltration, erosion, interfacial delamination, and spallation. Their combined effects determine the long-term effectiveness of the coating system. Improving TBC durability therefore requires coordinated optimization of ceramic composition, microstructure, bond coat properties, interface integrity, and resistance to environmental attack.
Figure 3.
Failure mechanisms of TBCs.
3.1. Thermal Fatigue and Thermomechanical Stresses
Thermal fatigue is one of the principal mechanisms responsible for the deterioration of TBC systems during repeated heating and cooling. Temperature fluctuations generate cyclic stresses because the ceramic top coat, metallic bond coat, thermally grown oxide and substrate respond differently to changes in temperature. Differences in thermal expansion, together with temperature gradients across the coating thickness, produce non-uniform deformation and localized stress concentrations [9,21]. Typical coefficients of thermal expansion are about 11–13 × 10−6 K−1 for the YSZ top coat, 8–9 × 10⁻⁶ K−1 for the α-Al2O3 TGO and 13–16 × 10−6 K−1 for the bond coat and nickel-based substrate [5]. The lamellar APS and columnar EB-PVD microstructures also make the elastic modulus of the top coat direction-dependent, with different values parallel and perpendicular to the coating plane [56]. These effects become particularly significant during rapid thermal transients, when different layers cannot respond uniformly to changing thermal conditions. The resulting stress distribution is strongly influenced by coating architecture. In atmospheric plasma-sprayed (APS) coatings, the lamellar microstructure contains pores, microcracks, and boundaries between flattened splats. These features can accommodate some deformation, but they may also act as preferential locations for crack initiation and propagation. In contrast, electron-beam physical vapour deposition (EB-PVD) typically produces a columnar structure in which gaps between adjacent columns provide a degree of compliance during thermal cycling. Nevertheless, repeated exposure to severe temperature gradients can damage either architecture, particularly when defects accumulate or the coating becomes less compliant during service. Damage generally develops progressively rather than through a single event. Small cracks may initially form within the ceramic layer or near interfaces and subsequently extend under repeated thermomechanical loading. Changes in the microstructure, oxidation-induced stresses, and local variations in adhesion can further accelerate crack growth. When cracks connect to form a continuous separation path, the coating may lose contact with the underlying layers, eventually resulting in local detachment or extensive spallation. Consequently, thermal fatigue resistance depends not only on the intrinsic properties of the ceramic but also on the interaction between microstructure, interface integrity, and the thermal history of the component [1,2].
3.2. Oxidation and Thermally Grown Oxide Formation
Oxidation at the bond coat–ceramic interface is an important factor controlling the service life of many TBC systems. At elevated temperatures, oxygen can migrate through the ceramic layer and react with elements in the metallic bond coat. In systems designed to form a protective alumina scale, this process produces a thermally grown oxide composed predominantly of α-Al2O3. A thin, adherent TGO can limit further oxidation; however, continued oxide growth and changes in its morphology may progressively increase the likelihood of coating failure [10,63]. As the oxide thickens, growth-related stresses develop within the interfacial region. During subsequent cooling, thermal expansion mismatch between the TGO, ceramic coating, and metallic layers generates additional stresses. Local variations in oxide thickness, interfacial roughness, and bond coat composition can intensify these effects [64]. The combined stress field may initiate cracks within the oxide or adjacent materials or promote their propagation along the interface. Oxidation-related degradation is therefore not simply a consequence of the presence of an oxide layer. Its severity depends on oxide growth kinetics, scale adherence, bond coat chemistry, and the interaction between oxidation and thermal cycling. Excessive TGO growth can contribute to interfacial delamination and ceramic spallation, particularly after prolonged high-temperature exposure. Controlling the formation and stability of the oxide scale is consequently a central objective in the design of durable TBC systems [1,3].
3.3. CMAS Infiltration and Environmental Attack
Calcium–magnesium–aluminosilicate (CMAS) attack is a particularly important environmental degradation mechanism for gas turbine coatings exposed to airborne mineral contaminants. Dust, sand, and volcanic ash may enter the turbine, accumulate on hot surfaces, and form deposits containing calcium, magnesium, aluminum, and silicon oxides. At sufficiently high temperatures, these deposits can soften or melt and penetrate accessible pores, cracks, and intercolumnar gaps within the ceramic top coat [65,66]. Infiltration can substantially modify the mechanical response of the coating. When the molten deposit enters the porous ceramic and subsequently solidifies, it may restrict the deformation mechanisms that normally allow the coating to accommodate thermally induced strain. The infiltrated regions can become locally stiffer, changing the stress distribution during cooling and subsequent heating. This loss of compliance, combined with thermal expansion mismatch between the deposit and ceramic, can promote crack initiation and propagation. CMAS attack may also involve chemical reactions with the coating material. In yttria-stabilized zirconia (YSZ), interactions with the molten deposit can dissolve parts of the ceramic and alter its local composition. Subsequent reprecipitation produces yttria-depleted zirconia, which transforms from the metastable tetragonal t′ phase into the monoclinic phase with a volume increase of about 3%–5% [11,65,66]. Depending on deposit composition and temperature, crystalline reaction products such as anorthite, diopside, wollastonite, apatite and calcia-stabilized zirconia can also form [65,67]. The resulting chemical and microstructural changes can further weaken the coating’s ability to tolerate thermal cycling. The severity of CMAS damage depends on deposit composition, exposure temperature, residence time, infiltration depth, and the architecture and chemistry of the ceramic layer. These dependencies have motivated the development of modified ceramic compositions, protective surface layers, and multilayer structures designed to limit infiltration or promote the formation of reaction products that impede further penetration. Such approaches must be assessed carefully because improved environmental resistance may come at the expense of thermal conductivity, strain tolerance, or other properties essential to coating performance [11,61].
3.4. Sintering and Microstructural Changes
Sintering is a high-temperature aging mechanism that progressively densifies the ceramic top coat and reduces its strain tolerance [68]. Prolonged exposure to elevated temperatures can cause sintering within porous ceramic coatings. This process changes particle contacts, grain boundaries, and pore structures, potentially reducing the compliance required to accommodate thermomechanical deformation. In APS coatings, the strengthening of contacts between adjacent splats and the reduction or closure of fine pores and microcracks may increase stiffness and alter thermal conductivity. As a result, a coating that initially combines low heat transfer with effective strain accommodation may gradually lose some of these advantages. The rate and extent of sintering depend on temperature, exposure duration, ceramic composition, and the initial microstructure. Although increased cohesion may be beneficial in some respects, excessive microstructural densification can make the coating more susceptible to stresses generated during thermal cycling. Sintering is therefore an important long-term degradation process, particularly for conventional YSZ coatings operating under sustained high-temperature conditions [2,3].
3.5. Chemical Degradation and Phase Instability
Chemical degradation extends beyond simple oxidation thickness growth. CMAS attack (Section 3.3) is itself a form of chemical corrosion, but it is treated separately because it combines melt infiltration, stiffening and dissolution–reprecipitation reactions. This section addresses chemical and phase changes that originate within the coating system or from the gaseous environment. In the bond coat, Al depletion, beta-to-gamma-prime transformation, martensitic transformation, and mixed-oxide formation alter both chemistry and mechanics, weakening the interface and promoting rumpling and crack nucleation [8]. Chemical and phase-related changes can compromise the stability of the ceramic top coat even when extensive mechanical damage is not initially apparent. The performance of YSZ depends on maintaining a suitable zirconia phase assemblage through the addition of yttria. Under particular thermal and chemical conditions, changes in composition or phase stability may promote undesirable transformations, potentially accompanied by local volume changes and the development of additional stresses. The susceptibility to such degradation depends on temperature, exposure time, composition, and interactions with the surrounding environment. In the top coat, prolonged exposure can destabilize the metastable t′ phase, as observed after long operation of power generation turbines [3], and CMAS-induced yttria depletion adds a further route (Section 3.3) [66]. Water vapour can also promote the tetragonal to monoclinic transformation of yttria-stabilized zirconia at comparatively low temperatures, a hydrothermal ageing process in which species derived from water are incorporated into the oxygen vacancy lattice and destabilize the tetragonal phase [69]. These concerns are especially relevant when evaluating alternative ceramic materials intended to provide lower thermal conductivity or improved resistance to high-temperature degradation. Material selection must therefore account for long-term chemical and phase stability, rather than relying solely on initial thermal properties.
3.6. Erosion and Mechanical Damage
TBCs may also deteriorate through the impact of ingested particles and the abrasive action of high-velocity gas streams. These processes are particularly relevant to gas turbine components exposed to dust, sand, combustion-related particles, and other entrained debris. Depending on particle characteristics and impact conditions, material may be removed from the ceramic surface, local defects may develop, or existing cracks may extend. Repeated impacts can progressively reduce coating thickness and expose regions of the underlying protective system [67]. The response to erosion depends on the coating’s porosity, microstructural architecture, cohesive strength, fracture resistance, and particle-impact conditions. A columnar coating may be vulnerable to the removal or damage of individual columns, while a lamellar coating can undergo cracking or detachment along weakly bonded splat boundaries. Mechanical damage may also interact with thermal fatigue and oxidation: erosion can remove protective material, while cracks and surface defects can provide pathways for oxygen or molten deposits to penetrate the coating. This coupling of mechanisms can accelerate degradation compared with the effects of any single process acting independently [3]. Coatings on blade tips and abradable seal coatings on the casing are additionally exposed to high-speed scraping during rub events [4]. Such events combine high strain rates with intense local frictional heating and may produce microstructural and phase changes that differ from those caused by thermal cycling.
3.7. Interfacial Delamination and Spallation
Delamination and spallation are critical failure events in which the coating loses adhesion locally or detaches from the underlying structure. Delamination involves the development and propagation of cracks along or near an interface, whereas spallation refers to the detachment of coating material. These events may follow the accumulation of thermomechanical stresses, excessive TGO growth, CMAS infiltration, or progressive weakening of the ceramic microstructure. Crack propagation is governed by the local stress field, interface adhesion, fracture resistance, and the distribution of pre-existing defects. Once a crack reaches a critical size or connects with neighbouring defects, separation can extend across a larger region of the coating. The resulting loss of the ceramic layer is particularly detrimental because it removes the thermal protection and increases the heat transferred to the metallic substrate. Depending on the component and operating conditions, this exposure can accelerate further oxidation and thermal damage, potentially shortening component service life substantially [1,2,70].
3.8. Interactions Between Failure Mechanisms
In practical service environments, TBC degradation is best understood as a coupled process rather than a sequence of entirely independent events. For example, oxidation can modify interfacial stresses, while thermal cycling promotes the propagation of cracks associated with oxide growth. Sintering can reduce strain tolerance, making the coating more susceptible to damage during subsequent thermal transients. Similarly, CMAS infiltration may stiffen the ceramic layer and accelerate crack growth during cooling, while erosion can remove material and create defects that facilitate further environmental attack. The relative importance of these mechanisms varies with the coating deposition process, composition, component geometry, operating temperature, thermal gradients, and environmental exposure. As a result, assessing durability requires consideration of both individual degradation processes and their interactions. Experimental evaluation under representative thermal cycling, oxidation, erosion, and deposit-exposure conditions, supported where appropriate by microstructural and mechanical characterization, can help identify the dominant damage mechanisms and improve lifetime predictions.
4. Active Thermography Methods for Defect Detection in Thermal Barrier Coatings (TBCs)
Active thermography evaluates thermal barrier coatings, TBCs, by imposing a controlled energy input and recording the resulting infrared response. Its diagnostic information depends on where heat is generated, how it propagates through the coating system and how the camera observes the resulting radiation. The classification adopted here distinguishes four categories (Figure 4):
Figure 4.
Classification of Active Infrared Thermography (AIRT) for Thermal Barrier Coatings (TBCs). Methods in dashed frames have not yet been applied to defect detection in TBCs and are included as prospective routes.
- External optical heating;
- Internal mechanical heating;
- Internal electromagnetic heating;
- Material-enabled or embedded excitation.
These methods provide complementary routes to interrogating the ceramic topcoat, metallic bond coat, substrate and their interfaces, including the thermally grown oxide where present. Optical methods have the longest documented history of TBC inspection, including work on turbine components, but their established detection capability should be distinguished from quantitative reconstruction and prediction of remaining coating life [24,25].
The first three groups primarily classify the mechanism of energy delivery. The last group additionally describes an architecture in which an electrically active constituent or embedded device provides excitation or complementary sensing. The categories therefore have a practical boundary rather than absolute exclusivity. An embedded conductor supplied with current through electrical terminals belongs to the last group (Figure 4), whereas heating the same conductor by induction combines an embedded architecture with internal electromagnetic excitation. Likewise, a laser source specifies the illumination technology, whereas pulsed, step, periodic and frequency-modulated protocols specify its temporal operation.
The classification is intended to cover the physically distinct routes of heat delivery, not only those already applied to TBCs. Methods were therefore included if they had been demonstrated on TBCs, or if they had been demonstrated in other materials and a physically justified route to their use in TBCs, particularly multifunctional TBCs, could be identified. Nonlinear ultrasonic stimulated thermography, microwave thermography, direct Joule heating and the CNT-, metal-, and SMA-based concepts belong to the second category, because no study applying them to defect detection in TBCs was identified in the reviewed literature. They are marked with dashed frames in Figure 4, and the corresponding sections state this status explicitly. Their inclusion reflects the prospects addressed by this review, since several of these routes become applicable only when a coating contains conductive, electromagnetically absorbing or otherwise functional constituents.
The literature was identified by searching Scopus, Web of Science, Science Direct and Google Scholar for publications up to 2026, without a lower date limit, using combinations of the keywords thermal barrier coating, TBC, YSZ, active thermography, infrared thermography, pulsed, long pulse, step heating, lock-in, frequency-modulated, laser, vibrothermography, ultrasonic stimulated, local defect resonance, eddy current, induction, microwave, Joule heating, embedded sensor, self-healing and multifunctional coating. The reference lists of the retrieved reviews [24,25,29] were also screened. Peer-reviewed journal articles, conference proceedings and book chapters were included if they reported experimental or numerical results on infrared defect detection or characterisation, or on functional constituents relevant to excitation. Each study was then assigned to one of three evidence classes. Direct TBC evidence denotes infrared defect detection or characterisation performed on a ceramic TBC system. Evidence from other materials denotes the same excitation demonstrated on other coatings, composites or metals. Proposed applications denote combinations for which no infrared defect study on TBCs was found and which are suggested in this review. A statement that no TBC study was identified refers to this search.
After energy conversion, the measured transient is governed by layer thicknesses, thermal properties, interface conductance and lateral heat spreading. Thermal diffusivity determines the rate of temperature redistribution, while effusivity governs transient heat exchange between adjoining materials. The characteristic diffusion time across a layer scales with the square of its thickness divided by its diffusivity
where t—time at which the maximum thermal contrast occurs, s; L—thickness of the ceramic coating layer, m; and α—thermal diffusivity of the coating material, m2/s.
Equation (1) is a scaling relation, and its prefactor depends on the heating geometry and on the quantity evaluated. For sprayed zirconia, thermal diffusivities of approximately 3.2 × 10⁻⁷ to 3.4 × 10⁻⁷ m2/s follow from the properties used in [54,55]. With α = 3.3 × 10⁻⁷ m2/s, L2/α is approximately 0.12 s for L = 200 µm and 0.76 s for L = 500 µm. The half-rise time of the one-dimensional flash solution, t1/2 = 0.139 L2/α [71], gives approximately 17 ms and 0.1 s for the same thicknesses, and about 4 ms for L = 100 µm if the same diffusivity is assumed. Characteristic contrast times therefore range from a few milliseconds to about one hundred milliseconds. Sampling these transients with several frames requires approximately 50–100 Hz for 300–500 µm coatings [25], but more than 1 kHz for coatings thinner than about 100 µm, consistent with the 2000 Hz acquisition used for 40–120 µm EB-PVD coatings [72]. These values are approximate because semitransparency, interface resistance and the substrate modify the observed transient.
An interface separation changes this transfer path, but the sign of its thermal indication depends on the source location and observation time. A gap can retain optically deposited heat near the surface or obstruct heat arriving from an internally heated metal. Neither a hot region nor a cold region is therefore a unique signature of one defect type [25].
Infrared measurements also require an optical interpretation. The camera initially records radiometric intensity, whose conversion to temperature depends on emissivity, reflected radiation and the spectral behaviour of the coating. Zirconia can be semitransparent, allowing both excitation radiation and emitted infrared radiation to interact with material below the outer surface. Optical penetration during heating and transparency in the camera band are distinct effects [26,32]. Across all four groups, the experimental description should state the actual excitation waveform, acquisition timing, camera band, frame rate, spatial sampling and thermal sensitivity. Nominal generator ratings must be distinguished from the power delivered to the specimen.
Detection, localization, lateral sizing, burial depth, coating thickness and interfacial gap opening are separate outcomes. A known interface depth is not an independently reconstructed depth, and a segmented thermal footprint is not automatically the physical defect boundary. Representative calibration is particularly important because open holes with flat bottoms can produce stronger contrast than interfacial disbonds of the same diameter. Ptaszek et al. demonstrated this difference and proposed plugged defects that better reproduced a buried air gap [33]. The following sections consequently retain the specimen architecture and defect representation when discussing performance.
4.1. External Optical Heating
External optical excitation deposits radiant energy using flash lamps, controlled lamps or lasers. In an opaque coating, absorption is concentrated near the illuminated surface. In a semitransparent ceramic, scattering and penetration can distribute heat through the topcoat and permit energy deposition in the underlying metal, as shown in Figure 5. Subsequent heat flow interrogates the coating thickness and interfaces, with a separation commonly producing a warmer surface region when it impedes heat removal into the substrate. Thickness variation, distributed cracking and changes in porosity or sintering can also alter the effective thermal response [25,33].
Figure 5.
Optical absorption in an opaque body and a semitransparent TBC. Adapted from Ref. [32].
The usual arrangement places the optical source and infrared camera on the accessible coating side, with synchronized control and image acquisition. Broad area sources provide rapid coverage, whereas a spot or line requires beam shaping and positioning. Symmetric illumination, source shielding and suitable spectral filtering help reduce background gradients and reflected source radiation. Long-wavelength detection can support examination of unpainted zirconia, which matters when an absorbing paint would contaminate a porous coating [32]. Acquisition must resolve the relevant coating transient. The 50 to 100 Hz range discussed for delamination imaging in conventional sprayed coatings of approximately 300 to 500 µm thickness is an example, rather than a universal camera requirement [25].
The principal advantages are contactless excitation, flexible spatial coverage and substantial TBC experience. The main limitations are variable absorption, source afterglow, curvature and the coupling of thickness, diffusivity and interface resistance in the inverse problem. Broad illumination predominantly supports interfacial defect and thickness assessment. Localized heating additionally creates lateral heat flow, which is useful for surface crack detection. Optical thermography is consequently the most established group in the reviewed TBC literature, although quantitative accuracy remains dependent on the particular coating, calibration and measurement protocol [24,25].
- Broad area optical excitation
4.1.1. Pulsed and Flash Thermography, PT
Pulsed thermography, PT, delivers a short optical burst and records the subsequent cooling transient. Flash lamps are common, although a laser pulse can implement the same temporal principle. Pulse duration should be short relative to the response being interpreted, or its finite waveform must be included in the model. Pulse energy, illumination uniformity, integration time, acquisition rate and the cooling window are the main protocol parameters. A single transient contains information over several thermal timescales, making PT attractive for rapid screening [25,26]. Figure 6 shows the principle of Pulsed Thermography (PT). Panel (a) presents the input signal, which is a short, high-power flash pulse lasting on the order of milliseconds. Panel (b) shows the surface temperature rise in the sound area (blue line) and the area above a defect (red line). After the pulse, the surface cools as heat diffuses into the coating and the substrate. A defect acts as a thermal barrier and slows this cooling, so the defect area remains warmer. The shaded region represents the thermal contrast. Panel (c) presents the thermal contrast ∆T(t) = Td(t) − Ts(t), where Td and Ts are the temperature rises in the defect and sound areas, respectively. The contrast reaches its maximum ∆Tmax at time tmax, which is used to detect the defect and to estimate its depth.
Figure 6.
The principle of Pulsed Thermography (PT). The curves are illustrative and do not represent measured data. Symbols: Td and Ts—temperature rise in the defect and sound area, ΔT—thermal contrast, ΔTmax—maximum contrast reached at time tmax. Prepared based on [13,24,25,73,74].
Processing includes temperature contrast, thermographic signal reconstruction, TSR, logarithmic derivatives, apparent effusivity and principal component analysis, PCA. Pulse phase thermography, PPT, transforms transient data into Fourier amplitude and phase images and is a processing route rather than a separate excitation mechanism [73]. Marinetti et al. [42] used the temporal evolution of apparent effusivity to distinguish excess coating thickness from adhesion defects, including measurements on turbine components. Figure 7 presents the apparent thermal effusivity derived from the image data as a function of time on a log–log scale. A homogeneous semi-infinite material produces a horizontal trace. In a two-layer system, the early-time data follow a line determined by the thermal effusivity of the first layer, whereas the late-time data follow a line determined by the effusivity of the underlying material. Between these regimes, the response gradually shifts from one line to the other, as illustrated by the blue curve in Figure 7. The transition time depends on the thickness of the first layer; however, curves for different coating thicknesses have similar shapes and are shifted along the time axis (green: L = 200 µm; blue: L = 300 µm). In the presence of a defect, the response moves toward the parallel line associated with air, which is typically positioned opposite the substrate-related line, before approaching the substrate response (red curves). This transition produces a minimum in the apparent effusivity. Accordingly, the apparent effusivity at pixels corresponding to defects reaches a minimum after the flash, whereas in sound or locally thicker regions, its lowest value occurs at the time of the flash. Mapping the time at which the minimum occurs for each pixel therefore enables visual identification of defects and their automatic discrimination from regions with excess coating thickness.
Figure 7.
Qualitative schematic of apparent-effusivity evolution for well-bonded coatings of different thicknesses (green and blue) and a coating containing an interfacial air gap (red family). L denotes the thickness of the ceramic top coat (first layer), and crack thickness denotes the opening of the interfacial air gap. The curves and logarithmic coordinates are illustrative, not measured or independently recalculated data. The 1–40 µm labels denote the illustrated gap-opening range and do not constitute a validated sizing calibration. Conceptually adapted from Refs. [25,42].
Shepard et al. examined nominal coating thicknesses from approximately 254 to 1143 µm with a long-wavelength camera at 180 Hz. TSR derivative features supported thickness measurements within a few percent for their specimens when translucence and the appropriate cooling model were considered [26]. For artificial disbonds beneath a 0.4 mm yttria-stabilized zirconia, YSZ, coating, Guo et al. obtained better width estimates from first derivative images than from conventional temperature profiles, with reduced improvement for the smallest features [75]. PT therefore supports calibrated thickness and lateral size measurements, but short acquisition requires adequate absorbed energy and temporal resolution. Thermal blurring and uncertainty in layer properties constrain reconstruction of unknown defect depth or gap opening.
4.1.2. Long Pulse Thermography, LPT
Long pulse thermography, LPT, applies a finite heating interval that is appreciable relative to the relevant thermal response and commonly analyses the subsequent cooling. Halogen lamps provide convenient excitation at lower instantaneous power than flash systems. Heating duration, absorbed flux, switch-off behaviour and the cooling window determine the initial temperature field for analysis [76,77].
Figure 8 shows the principle of Long Pulse Thermography (LPT). Panel (a) presents the input signal, which is a rectangular heating pulse of duration th. Panel (b) shows the surface temperature rise in the sound area (blue line) and the defect area (red line). The temperature increases during heating and decreases after the heating is switched off. The defect area is warmer than the sound area, and the shaded region represents the thermal contrast. Panel (c) presents the thermal contrast ∆T(t) = Td(t) − Ts(t). In this example the contrast reaches its maximum ∆Tmax at time tmax, after the end of heating.
Figure 8.
The principle of Long Pulse Thermography (LPT). The curves are illustrative and do not represent measured data. Symbols: th—heating duration, Td and Ts—temperature rise in the defect and sound area, ΔT—thermal contrast, ΔT(tmax)—maximum contrast reached at time tmax. Prepared based on [14,15,76,78].
Wei et al. used 6 s of lamp heating and acquisition at 30 Hz on specimens carrying a 200 µm YSZ coating [15]. Background subtraction and PCA were applied to the first 3 s of cooling, followed by fitting of spatial thermal profiles with a heat conduction model. Nominal defect diameters of 3, 5 and 7 mm were reconstructed as approximately 3.15, 4.72 and 7.22 mm. These results establish conditional lateral sizing for fabricated interfacial gaps, rather than equivalent accuracy for gap opening or natural damage.
Huang et al. related coating thickness to a minimum in the second logarithmic derivative and reported errors within 5% when sampling was sufficient. Their validation used alumina plates coupled to steel, including ceramic thicknesses greater than those of many turbine TBCs [14]. Zarezadeh Mehrizi et al. found better detectability with LPT than PT on YSZ specimens with artificial holes, but the configurations also differed in nominal excitation energy, including 20 kJ for LPT and 2 kJ for PT, and in observation duration [78]. The comparison supports an advantage under those conditions rather than a universal ranking. LPT can strengthen weak signals, at the cost of greater lateral spreading, heat loss sensitivity and possible residual lamp radiation.
4.1.3. Step Heating Thermography, SHT
Step heating thermography, SHT, evaluates temperature rise after approximately constant optical heating is switched on [25,74]. In some applications, the subsequent cooling phase is also analyzed, but this represents an extended acquisition sequence rather than the basic detection principle [79]. The ideal surface response of an opaque homogeneous semi-infinite body increases with the square root of time (Equation (2)), while interfaces and thermal barriers disturb that evolution [74,80].
where F—constant absorbed surface heat flux, W/m2; t—time, s; k—thermal conductivity, W/(mK); ρ—density of the material, kg/m3; c—specific heat capacity, J/(kgK); and —thermal effusivity, .
Its characteristic parameters are heat flux, source rise time, heating duration, sampling rate and permissible temperature increase. Temperature rise, derivatives and contrast can be processed by reconstruction or inverse heat conduction. Unlike LPT cooling analysis, the useful SHT signal is acquired while illumination remains active, which makes spatially uneven heating particularly consequential [24,25].
Figure 9 shows the principle of Step Heating Thermography (SHT). Panel (a) presents the input signal, which is a step in heating power. Constant power is applied until the end of the measurement window, tend. Panel (b) shows the surface temperature rise in the sound area (blue line) and the defect area (red line) during heating. The defect area heats up faster, and the shaded region, representing the thermal contrast, increases with time. Panel (c) presents the thermal contrast ∆T(t) = Td(t) − Ts(t). The time ton is the moment at which the contrast first exceeds a detection threshold (0.5 K in this illustrative example). This time increases with defect depth, because the heat needs more time to reach the surface from a deeper defect. The contrast at the end of heating is denoted ∆T(tmax).
Figure 9.
The principle of Step Heating Thermography (SHT). The curves are illustrative and do not represent measured data. Symbols: tend—end of the measurement window, ton—time at which ΔT first exceeds the detection threshold, Td and Ts—temperature rise in the defect and sound area, ΔTtmax—thermal contrast at the end of heating. Prepared based on [24,81,82,83].
The TBC retrospective records detection of delamination during stepwise heating, but the primary studies reviewed here provide less extensive quantitative validation for complete TBC stacks [25]. Zhuo et al. reconstructed subsurface virtual heat flux with Tikhonov regularization using a 5 mm alumina slab containing a hole with a flat bottom. Lateral sizing improved, while defect depth remained an input to the model [81]. Chen et al. combined a slowly varying heating component with periodic modulation and normalized the former by oscillation amplitude. Their maximum thickness error of 7.9% concerned epoxy coatings from 100 to 400 µm [82]. These developments offer useful analysis strategies, but they do not establish the same sizing or depth performance for sprayed zirconia. SHT offers simple sustained excitation and information during heating, with interpretation limited by the changing illumination background and thermal spreading.
4.1.4. Lock-In Thermography, LIT
Lock-in thermography, LIT, applies periodic optical heating and extracts the synchronized temperature oscillation. Amplitude and phase are obtained by Fourier analysis or synchronous correlation. The characteristic thermal diffusion length increases with diffusivity and decreases with modulation frequency. Lower frequencies therefore provide a greater characteristic probing distance, but require longer acquisition and increase lateral spreading. In a multilayer coating, this distance guides experimental design rather than directly specifying defect depth [25]. Figure 10 shows the principle of Lock-in Thermography (LIT). Panel (a) presents the input signal, which is sinusoidal heating at the modulation frequency fL (1/fL is the modulation period). Panel (b) shows the surface temperature rise in the sound area (blue line) and the defect area (red line). In the initial transient stage (light blue region), the mean temperature increases, and the response gradually approaches a steady oscillation. The defect area has a larger amplitude and a smaller phase delay than the sound area. The shaded region represents the thermal contrast. The dotted vertical lines mark the temperature maxima, and the distance between them corresponds to the phase contrast ∆φ. Panel (c) presents the instantaneous phase delay φ(t), calculated as the difference between the phase of the input and output signals using the Hilbert transform of the output signal after removal of the slow mean temperature rise. After the transient stage φ(t) becomes constant, and the phase contrast ∆φ = φs − φd, where φs and φd are the phase delays of the sound and defect areas, is used for defect detection.
Figure 10.
The principle of Lock-in Thermography (LIT). The curves are illustrative and do not represent measured data. Symbols: fL—modulation frequency, φ(t)—instantaneous phase delay, φs and φd—phase delay of the sound and defect area, Δφ—phase contrast. Prepared based on [24,25,30,40,84,85].
Modulation frequency and depth, mean power, cycle count, sampling rate and phase synchronization are the principal parameters. Phase can reduce sensitivity to multiplicative intensity variations, but remains vulnerable to drift, reflection and changes in optical penetration. Cernuschi and Bison report turbine blade delamination imaging at 0.1 Hz [25]. Shrestha and Kim examined plasma-sprayed coating thicknesses from 0.1 to 0.6 mm using frequencies from 2 to 0.01 Hz. They identified 0.02 Hz as suitable for their specimens, while PT was faster and more accurate in that thickness comparison [86]. Luo et al. subsequently combined transient lock-in processing, phase fusion across frequencies and clustering to enhance artificial TBC defect recognition [87].
LIT provides selective extraction of weak periodic signals and adjustable sensitivity to layer response. Frequency-dependent modelling and spatial calibration can support thickness assessment and lateral sizing. Its characteristic limitations are acquisition duration, weak contrast at particular frequencies and reduced spatial definition at low frequencies. The cited enhancement studies do not establish a universal uncertainty for interface depth or gap thickness. However, related studies of defect depth in a titanium alloy using analytical models and finite element simulations demonstrated the influence of lateral heat conduction on errors in depth estimation. At a small ratio of defect radius to depth (r/h = 0.5), the depth was underestimated by as much as 20.7%. Accounting for lateral heat conduction reduced the error to within ±5%. For r/h > 3, the error associated with the phase-difference method became negligible [88].
4.1.5. Frequency-Modulated Thermography, FMT
Frequency-modulated thermography, FMT, sweeps the instantaneous modulation frequency during acquisition. Linear and nonlinear chirps distribute excitation time differently across the chosen spectrum. Frequency limits, sweep duration, modulation law, source bandwidth and sampling define the protocol. Fourier analysis, PCA and correlation with a reference waveform extract thermal features, while matched filtering produces pulse compression peaks, delays and phase information [24,54,89]. Unlike conventional LIT at one fixed frequency, FMT interrogates several temporal scales within one record. FMT can therefore be regarded as a generalisation of LIT in which a band of modulation frequencies replaces the single lock-in frequency, while pulse compression of the chirped response yields time-domain features comparable with those of PT [90,91]. Figure 11 shows the principle of Frequency-Modulated Thermography (FMT). Panel (a) presents the input signal, which is sinusoidal heating whose frequency increases linearly (chirp) from f1 to f2. Panel (b) shows the surface temperature rise in the sound area (blue line) and the defect area (red line). As the frequency increases, the amplitude of the thermal response decreases because the thermal diffusion length becomes shorter. The shaded region represents the difference between the responses of the defect and sound areas, and the dotted line marks the reference frequency fc. Panel (c) presents the instantaneous phase delay φ(t) of the response of the sound area (blue line) and the defect area (red line). The phase delay increases with time because the modulation frequency increases during the sweep. The phase contrast ∆φ(fc) = φs − φd at the reference frequency fc is used for defect detection.
Figure 11.
The principle of Frequency-Modulated Thermography (FMT). The curves are illustrative and do not represent measured data. Symbols: f1 and f2—initial and final chirp frequency, fc—reference frequency, ∆φ(fc)—phase contrast at the reference frequency fc, φs and φd—phase values in the sound and defective areas, respectively. Prepared based on [54,90,91,92,93,94].
Using a zirconia TBC specimen and a non-linear frequency modulation infrared thermography system, the authors of [89] showed that, at constant coating thickness, the temperature difference increases with defect diameter and excitation power, and decreases with increasing initial and terminal modulation frequencies. Increasing the excitation power and lowering the modulation frequency therefore made debonding defects more distinct and improved their detection. A comparison of image sequence processing methods, namely principal component analysis (PCA), discrete Fourier transform (DFT), and total harmonic distortion (THD), showed that PCA yielded the highest signal-to-noise ratio (SNR) and was thus the most effective of the three. Figure 12 shows the reference area for the SNR calculation with the defects marked. Figure 13 shows the SNR as a function of defect diameter for the different processing methods (PCA, DFT, THD) [89].
Figure 12.
Reference area for the SNR calculation with the defects marked. Reprinted from Ref. [89].
Figure 13.
The SNR as a function of defect diameter for the different processing methods (PCA, DFT, THD). Reprinted from Ref. [89].
Luo et al. used a shaped laser beam and a nonlinear chirp from 0.01 to 0.1 Hz over 100 s, with matched filtering, clustering and a model incorporating volumetric absorption. A 6 mm artificial feature was detected at a reported burial distance of 1.2 mm beneath a specimen carrying a 100 µm ceramic layer [54]. The feature was a hole in the coated metal, so that distance included remaining substrate material and was not an unknown TBC interface depth recovered by inversion. FMT offers flexible spectral allocation and correlation gain, while requiring accurate waveform control and separation of the slow thermal background. Delay features remain diffusion-dependent rather than direct measures of travel distance.
- Localized and scanning optical excitation
4.1.6. Laser Spot Thermography, LST
Laser spot thermography, LST, heats a small stationary or moving region and observes perturbations of its evolving temperature field. A surface crack obstructs lateral diffusion, producing asymmetry or a sharp gradient that can be weak under broad-area heating. Relevant parameters include wavelength, absorbed power, spot diameter, dwell time, scan speed, scan spacing and camera magnification. Background normalization, spatial gradients and reconstruction from successive frames reveal the crack trajectory [24,27]. Figure 14 shows a schematic of Laser Spot Thermography (LST) for inspecting a TBC on a metallic substrate. A laser beam is directed onto scanning (galvo) mirrors, which steer a focused laser spot over the surface of the TBC. The spot follows a raster scan path and locally heats the coating, leaving a warm trace behind it. The resulting surface temperature distribution is recorded by an infrared (IR) camera, whose field of view covers the scanned area. A controller drives the laser and the galvo mirrors and is connected to a computer (PC). The PC synchronises laser scanning with image recording, acquires the thermograms from the IR camera and processes them.
Figure 14.
General schematic illustration of Laser Spot Thermography (LST) applied to the inspection of a thermal barrier coating (TBC) on a metallic substrate. The studies in [30,95] employed laser excitation at a wavelength of 808 nm. This wavelength is reported here as an example from the literature and should not be regarded as a universal requirement of LST.
Jiao et al. combined rapid line screening with a finer spot scan on plasma-sprayed TBC specimens. The spot stage detected a surface crack approximately 9.5 µm wide, with its opening independently verified by microscopy [27]. This demonstrates sensitivity to a narrow crack, not direct infrared measurement of its opening with micrometre resolution. Calibrated traces can support crack length estimation, but the study did not establish general crack depth reconstruction. Concentrated excitation provides useful local sensitivity, while scan direction, limited coverage and excessive local heating constrain the operating window [95].
4.1.7. Laser Line Thermography, LLT
Laser line thermography, LLT, scans an elongated heat source across the surface and covers a wider transverse region than LST. Line dimensions, power distribution, scan velocity and the delay between heating and observation govern the response. Processing must suppress the moving thermal background while preserving crack trails or buried defect contrast. In the line stage of Jiao et al., cracks approximately 20 µm wide or larger were detected before the finer spot inspection [27]. Figure 15 shows schematic of Laser Line Thermography (LLT) for inspecting a TBC on a metallic substrate. A laser beam passes through a cylindrical lens (line optics), which spreads it into a fan and produces a laser line across the surface of the TBC. The line is moved over the sample by relative motion between the sample and the laser head, realised with a linear stage (scan path, blue arrow). The resulting surface temperature distribution is recorded by an infrared (IR) camera, whose field of view covers the scanned area. A controller drives the laser and the stage and is connected to a computer. The PC synchronises the scanning with image recording, acquires the thermograms from the IR camera and processes them.
Figure 15.
General schematic illustration of Laser Line Thermography (LLT) applied to the inspection of a thermal barrier coating (TBC) on a metallic substrate. The studies in [72,96] employed laser excitation at a wavelength of 1064 nm. This wavelength is reported here as an example from the literature and should not be regarded as a universal requirement of LLT.
Liu et al. combined linear laser scanning with oriented background removal, temporal windowing and edge filtering. They detected holes with flat bottoms of 1 mm diameter and artificial interfacial disbonds of 2 mm diameter, demonstrating different sensitivity to the two defect representations [97]. Jiao et al. further combined a line source, window-averaged background correction and projected thermal fringes to locate debonding on curved blade surfaces [98]. The associated reconstruction of component morphology registers defects in three-dimensional surface coordinates, rather than measuring their burial depth. LLT is attractive for rapid crack tracing and debond localization, but scanning orientation, curvature and thermal spreading complicate quantitative transfer between specimens.
4.1.8. Laser-Based Pulsed and Lock-In Variants
Laser excitation can also implement PT or LIT without scanning. These variants combine a controlled spatial footprint with the corresponding temporal protocol, adding wavelength, beam uniformity and alignment to the measurement parameters.
Yang et al. used 1.064 µm excitation with 15 ns pulses and a diffractive beam homogenizer on unpainted coatings deposited by electron beam physical vapour deposition [72]. Nominal ceramic thicknesses from 40 to 120 µm were assessed using a fitted parameter from a model incorporating volumetric absorption, emission within the coating and multiple reflections, with acquisition at 2000 Hz. For a specimen whose nominal thickness was not provided, a fitted estimate of 48 µm differed by approximately 14% from the microscopy value of 42 µm. The authors demonstrated that beam shaping produces a uniform energy distribution, reducing lateral heat flow and improving the repeatability and sensitivity of the method. The authors related coating thickness to the parameter b, which represents the thermal relaxation time and increases with coating thickness. This allows thickness to be determined indirectly from the decay of the IR signal. The authors demonstrated effective characterization of thin TBC layers using laser thermography, while the detection of interfacial debonding was presented as a potential capability of the method rather than a fully validated, separate result.
Wang et al. used an 808 nm laser with periodic excitation and fused features from several modulation frequencies through PCA [30]. A nominal 1 mm debonding feature was extracted beneath a 0.2 mm ceramic coating. Retractable inserts created an approximately 1 mm gap, which is substantially different from a tight interface separation. Improved edge definition supports localization, without establishing a corresponding uncertainty for depth or gap opening. Laser variants offer rapid temporal control and wavelength selection, but beam nonuniformity, absorption changes and optical alignment remain significant. Defect size can be estimated directly from thermographic images, although thermal diffusion may distort the apparent boundaries. Reliable depth estimation generally requires a heat transfer model or empirical calibration.
4.2. Internal Defect-Selective Mechanical Heating
Optical methods primarily reveal defects through their influence on heat transport. Mechanical excitation adds a different possibility by generating heat at a dissipative crack or interface itself. Direct TBC evidence includes artificial coating debonds activated by a piezoceramic transducer [55].
In vibrothermography, heat generated locally at a subsurface defect diffuses towards the observed surface. In reflection mode optical thermography, by contrast, surface heating must first influence the defect region before the resulting disturbance becomes detectable at the surface. For a defect at the same depth, heat therefore travels only from the defect to the surface, whereas in reflection mode optical thermography it travels from the surface to the defect and back, so that the propagation distance is approximately halved [99]. This is a qualitative geometric argument rather than a quantitative estimate, because the actual gain depends on the amount and location of the dissipated heat, on lateral diffusion and on the layer properties, and it has not been quantified for TBCs. Local heat generation can therefore enable a rapid response and, under suitable conditions, shorter inspection times than pulsed thermography. Typical VT experiments last from a fraction of a second to several seconds [99,100].
Frictional sliding between contacting asperities is an important heat source. Intermittent opening and closing can enable rubbing or dissipative impacts, while hysteresis and local inelastic deformation can also contribute. Renshaw et al. showed that crack closure determines which asperities remain mobile enough to generate heat [101]. Fully separated faces cannot heat by mutual rubbing, and strongly compressed faces can remain locked. Mechanical existence of a defect therefore does not guarantee thermal activation. Heat can originate in the ceramic, at an interface or in a substrate crack beneath an intact coating. The last case was demonstrated on turbine blades by Mevissen and Meo and must be distinguished from coating debond detection [28].
An experiment combines a waveform generator, amplifier, actuator, controlled fixture and infrared camera, with optional acoustic reception or laser vibrometry (Figure 16). Mechanical coupling and contact force are central to reproducibility. Wei et al. used a piezoceramic actuator coupled to the coated surface with wax, whereas the blade study transmitted vibration through a mounting device [28,55]. In configurations involving direct horn contact, prolonged excitation can increase local heating at the contact interface and the risk of specimen damage. The contact pressure between the horn and the specimen also strongly influences the measured thermal response [99,100]. The electrical supply to the actuator does not make the specimen heating electromagnetic, since energy reaches the inspected structure as vibration.
Figure 16.
Schematic of the measurement setup for thermographic inspection of a turbine blade with a thermal barrier coating (TBC) using internal defect-selective mechanical heat.
Layer stiffness, residual stress, interface roughness and coating thickness govern vibration transmission and local compliance. The generated heat must then diffuse to the observed surface, so mechanical activation and thermal transfer jointly determine contrast. This offers sensitivity to some tight cracks and buried interfaces without requiring uniform optical illumination. Conversely, actuator position, coupling, vibration nodes and heating at supports can create incomplete coverage or misleading backgrounds. Holland et al., using 63 titanium and 63 Inconel specimens tested at three sites, showed that heating depends jointly on crack size and local vibrational stress [102]. Generator voltage alone is consequently an inadequate transferable measure of inspection severity.
Mechanical thermography has demonstrated TBC feasibility on coated coupons and selected turbine blades, particularly for contacting cracks and partial debonds. Its maturity is lower than that of established optical screening, with limited evidence for quantitative depth reconstruction or reliability across service-aged coating populations [28,55]. The following discussion distinguishes excitation approaches by how they activate the defect, while retaining a common infrared observation principle.
4.2.1. Vibrothermography and Ultrasonic Stimulated Thermography, VT/UST
Vibrothermography, VT, and ultrasonic stimulated thermography, UST, constitute the general family of mechanically excited thermographic methods. VT encompasses applied vibration, whereas UST specifies ultrasonic excitation. Local defect resonance and nonlinear ultrasonic stimulation represent related excitation strategies within this family and may be used together. In conventional VT/UST, bursts, sustained sinusoidal excitation or amplitude modulation can be used. Excitation can exploit a component resonance or an effective frequency selected empirically without a separate nonlinear acoustic criterion. Acoustic frequency, local vibration amplitude or stress, excitation duration, coupling force and fixture stiffness are the principal parameters. The camera resolves the thermal envelope rather than individual ultrasonic cycles. Background subtraction, temperature difference images, temporal profiles and, under modulation, Fourier amplitude and phase provide defect indications [28,55,102].
Mevissen and Meo examined twelve blades from a 10 MW industrial gas turbine, exploring excitation up to 100 kHz in successive 5 kHz bands [28]. Their infrared detector had 640 × 480 pixels and a reported thermal sensitivity of 20 mK. Strong responses commonly occurred between approximately 30 and 50 kHz, although the effective frequency varied with the crack. A previously unrecognized crack beneath the TBC was detected in blade B189. This is relevant component evidence for access to substrate damage through a ceramic layer, rather than quantitative characterization of an interfacial coating separation.
The same work showed that thermal maxima occupied only parts of the physical cracks. Crack closure experiments likewise identified inactive regions near crack tips [28,101]. Apparent thermal length can therefore underestimate physical extent, and calibrated thermal images alone do not establish crack depth. Supporting sprayed coating evidence comes from Piau et al., who detected cracks through tungsten carbide and cobalt coatings approximately 100 to 200 µm thick using excitation near 20 kHz and a macro lens providing about 25 µm per pixel [41]. Shallower cracks were not reliably detected. However, this study concerned tungsten carbide protective coatings rather than thermal barrier coatings, so its results provide supporting evidence for vibrothermography rather than direct validation for TBC inspection. Conventional VT and UST are the strongest detection methods for mechanically active cracks. Increasing amplitude may improve visibility but also change contact behaviour, so repeatable activation and preservation of the defect must be established together.
4.2.2. Vibrothermography Based on Local Defect Resonance, LDR
Local defect resonance, LDR, concentrates vibration near a compliant damaged region. A debonded coating segment can behave approximately as a flexural plate, allowing a local mode to amplify displacement and dissipation without equally amplifying the entire component. Solodov et al. established this distinction experimentally in a glass fibre composite, comparing a defect resonance near 20 kHz with a specimen resonance near 6.8 kHz [103]. Resonance frequency and bandwidth, drive amplitude, dwell time and local mode shape are the main parameters. Modal modelling and laser vibrometry can identify a useful band, but resonance alone cannot uniquely determine size and depth when stiffness and contact conditions are uncertain.
Figure 17 shows the principle of vibrothermography based on local defect resonance (LDR). Panel (a) presents the input signal, which is an ultrasonic burst of drive amplitude U0 and dwell time tdwell, with a frequency tuned to the local defect resonance frequency fLDR (the carrier is not drawn to scale). Panel (b) shows the surface temperature rise in the sound area (blue line) and the area above a debonded coating segment (red line), recorded with an infrared camera. The debonded segment behaves approximately as a flexural plate, so the local mode amplifies the displacement and the dissipation near the defect without equally amplifying the entire component. As a result, the defect area heats up much more than the sound area; the shaded region represents the thermal contrast, whose maximum ∆Tmax occurs at time tmax. Panel (c) presents the vibration amplitude measured as a function of frequency, e.g., by laser vibrometry. Both areas show the resonance of the specimen at fsp, whereas only the defect area shows an additional, narrow resonance at fLDR, characterized by its frequency and bandwidth ∆f. Such a measurement, together with modal modelling, can identify a useful excitation band. However, the resonance alone cannot uniquely determine the size and depth of the defect when the stiffness and contact conditions are uncertain.
Figure 17.
The principle of Vibrothermography based on local defect resonance, LDR. The curves are illustrative and do not represent measured data. Symbols: U0—drive amplitude, tdwell—dwell time, fLDR—local defect resonance frequency, fsp—specimen resonance frequency, Δf—resonance bandwidth, ΔTmax—maximum contrast reached at time tmax. Prepared based on [24,29,104,105].
Wei et al. modelled a zirconia-coated steel disc with a structural resonance at 38.7 kHz and a mode concentrated around a circular debond at 40.4 kHz [55]. Their artificial gaps had nominal diameters from 1 to 5 mm. Excitation was investigated from 35 to 45 kHz and selected near 40 kHz, using a piezoceramic system with stated electrical output power of 100 W and infrared acquisition at 30 Hz. The sequence comprised 5 s of reference recording, 30 s of stimulation and 20 s of cooling. Defects from 2 to 5 mm became distinguishable after 5 s of stimulation, while the 1 mm feature remained unresolved. The paper reports 0.3 mm coating thickness in specimen preparation but 0.5 mm in the abstract and conclusion. This discrepancy prevents use of the result as an unambiguous depth-specific detection limit.
TSR reduced noise, but derivative images performed poorly for that dataset. The first principal component provided the clearest defect representation, and Fourier amplitude was more effective than phase at the investigated thermal frequencies [55]. Those frequencies, including 0.08, 0.28 and 0.4 Hz, describe the thermal sequence rather than the approximately 40 kHz mechanical excitation. PCA followed by Otsu thresholding, median filtering and correction for oblique viewing produced relative projected area errors of 5.3%, 11.0% and 11.9% for the 5, 3 and 2 mm defects. The 4 mm defect gave a larger error of 38.6%, attributed to preparation imperfections. No unknown defect depth was reconstructed.
Unknown or narrow resonances can make a fixed frequency inspection incomplete. Rahammer and Kreutzbruck used repeated sweeps, including a 7 to 50 kHz band, on carbon fibre reinforced polymer, CFRP, specimens and extracted the resulting periodic thermal activation by Fourier analysis [105]. A 10 s sweep period generated a thermal analysis frequency of 0.1 Hz. Its phase partly reflects when the sweep crosses resonance, rather than defect burial depth. LDR offers efficient local activation, and sweeping broadens resonance coverage, but small or stiff defects can remain outside the actuator bandwidth. Its direct TBC evidence supports localization and conditional projected area estimation on engineered gaps, with further validation needed for service damage.
4.2.3. Nonlinear Ultrasonic Stimulated Thermography, NUST
Nonlinear ultrasonic stimulated thermography, NUST, is a variant of UST that combines infrared imaging with acoustic measures of nonlinear defect response. Asymmetric opening, closing and sliding can generate harmonics of the imposed vibration. A frequency interval with a strong nonlinear response can therefore guide excitation selection, providing information beyond maximum linear displacement. LDR and NUST may be combined because resonance can amplify both motion and nonlinear contact. In NUST, nonlinearity refers to the acoustic response of the material or defect to ultrasonic excitation, rather than solely to the numerical processing of thermal images [106]. Figure 18 shows the principle of nonlinear ultrasonic stimulated thermography (NUST). Panel (a) presents the input signal, which consists of two stages. In stage 1, a low-amplitude frequency scan of duration tscan is used to find the frequency interval ∆fNL in which the defect shows a strong nonlinear response; the shaded band marks the corresponding time interval ∆tNL. In stage 2, an ultrasonic burst of dwell time tdwell is applied at the selected frequency fsel (the carrier is not drawn to scale). Panel (b) shows the surface temperature rise in the sound area (blue line) and the defect area (red line), recorded with an infrared camera. During the scan only a small temperature increase is observed, whereas during the burst at fsel the defect area heats up much more than the sound area, because asymmetric opening, closing and sliding of the defect surfaces dissipate energy; the shaded region represents the thermal contrast, whose maximum ∆Tmax occurs at time tmax. Panel (c) presents the acoustic nonlinearity index NL = A2f/Af, defined as the ratio of the second harmonic amplitude to the fundamental amplitude, as a function of frequency. The defect area shows a pronounced maximum within ∆fNL, which guides the selection of the excitation frequency and provides information beyond the maximum linear displacement. The sound area exhibits only a low background level, which may result from the nonlinearity of the actuator, the coupling and the coating microstructure.
Figure 18.
The principle of Nonlinear Ultrasonic Stimulated Thermography, NUST. The curves are illustrative and do not represent measured data. Symbols: tscan—scan duration, ΔfNL and ΔtNL—frequency and time interval of strong nonlinear response, fsel—selected excitation frequency, tdwell—burst duration, NL = A2f/Af—nonlinearity index, ΔTmax—maximum contrast reached at time tmax. Prepared based on [24,29,106,107].
Malfense Fierro et al. studied barely visible impact damage in a stiffened CFRP panel using a fundamental sweep from 20 to 30 kHz and a corresponding second harmonic range from 40 to 60 kHz [106]. Third harmonic behaviour was also examined. A cooled infrared camera operated from 3 to 5 µm with 320 × 256 pixels and reported thermal sensitivity of 30 mK. Experiments included 200 V drive and three sweeps of 45 s, giving 135 s of excitation. Harmonic spectra, background-corrected thermal histories and their frequency dependence guided a narrow sweep strategy. Comparing acoustic response with amplifier output helped identify harmonics introduced by the excitation chain, while vibrometry and phased array ultrasound provided complementary checks. Excitation location and stiffeners affected which damaged regions were activated, and a large harmonic response did not itself quantify heat dissipation or defect dimensions [106]. The narrow sweep strategy was reported to be more reproducible than classical thermosonics with horn excitation [106], and NUST has also been applied to delamination fatigue damage in aluminium and impact damage in composites [24,107]. No study applying NUST to TBCs was identified in the reviewed literature. For TBCs, partially contacting cracks and interfaces are plausible targets, but this composite experiment supplies no ceramic coating detection threshold, sizing accuracy or depth results. NUST remains a prospective TBC extension whose advantages in frequency selection must be weighed against additional acoustic instrumentation and nonlinearity from the actuator, coupling and coating microstructure.
4.3. Internal Electromagnetic Heating
Electromagnetic excitation supplies internal heat without requiring mechanically mobile crack faces. An alternating magnetic field can induce currents and Joule dissipation in conducting layers, while microwave fields can deposit energy through dielectric and magnetic losses. In conventional TBCs, the metal substrate and conducting bond coat are possible induction heat sources, with their relative contributions governed by conductivity, permeability, thickness, frequency and field geometry. A bond coat should not be omitted from the heating model solely because the substrate is more conducting. Induction studies have demonstrated thermal detection of coating debonds, including tests on blade geometry [31,108].
With heat generated below the ceramic, a separation can reduce heat arrival at the surface and appear relatively cold during heating. A crack in the metal can also alter the current distribution and hence the source itself. Electrical skin depth describes current penetration, whereas thermal diffusion length describes propagation of the temperature disturbance. The induction carrier frequency and the much lower frequency of power modulation therefore control different processes [109]. These distinctions are important for separating source redistribution from thermal resistance and for avoiding assignment of electrical skin depth to a detected interface.
Induction equipment comprises a controlled supply, coil, positioning arrangement, often coil cooling, and synchronized infrared imaging. A magnetic yoke can concentrate flux while preserving camera access. Microwave equipment instead uses a generator with an antenna or resonant cavity. In addition to common acquisition parameters, field frequency, coil current or delivered power, source distance, orientation, polarization where relevant and specimen geometry determine energy deposition [31,108,110]. These methods reduce dependence on external optical absorption, but retain the radiometric limitations of infrared observation and introduce nonuniform coupling, edge effects and sensitivity to electromagnetic properties.
The evidence is strongest for induction detection of artificial TBC debonds. Microwave thermographic demonstrations concern absorbing coating systems and remain an adjacent basis for TBC development [110,111]. Microwave inspection without infrared imaging must be kept separate. For example, Sayar et al. assessed degraded TBC layer thickness using microwave reflection in the K and W bands, rather than a thermally generated infrared sequence [17]. Similarly, Mustapha et al. estimated TBC thickness in the range of 100 to 550 µm with a varactor-tuned resonant probe, reporting a 95% confidence interval of ±22.4 µm, again without infrared imaging [18].
4.3.1. Eddy Current and Electromagnetic Induced Thermography, ECT/ECST
Eddy current thermography, ECT, also called eddy current stimulated thermography, ECST, uses induction heating in conducting constituents. Finite bursts generate transient temperature fields, while periodic power modulation supports thermal amplitude and phase extraction. Coil geometry, current, carrier frequency, heating duration, clearance and modulation define the source. Transient contrast, spatial background correction, thermal derivatives and Fourier processing are used according to the waveform [31,108,109]. Figure 19 shows the principle of eddy current thermography (ECT), also called eddy current stimulated thermography (ECST). Panel (a) presents the input signal, which is an induction-coil current burst with a carrier frequency find and a heating time th (the carrier is not drawn to scale). Panel (b) shows the surface temperature rise in the sound area (blue line) and the area above a coating separation (red line), recorded with an infrared camera. The heat is generated by induced currents below the ceramic layer, in the metal substrate and in the conducting bond coat, so a separation can reduce the heat arrival at the surface and make it appear relatively cold during heating. The shaded region represents the thermal contrast. Panel (c) presents the thermal contrast ∆T(t) = Td(t) − Ts(t), where Td and Ts are the temperature rises in the defect and sound areas, respectively. In this example the contrast is negative and reaches its extreme value ∆Tmin at time tmin. The curves are illustrative and do not represent measured data.
Figure 19.
The principle of eddy current thermography (ECT/ECST). The curves are illustrative and do not represent measured data. Symbols: find—induction carrier frequency, th—heating time, ΔTmin—extreme (negative) contrast reached at time tmin. Prepared based on [24,29,34,108,112].
Zhu et al. placed the coil behind the metal and viewed the ceramic surface in transmission geometry [108]. Coupons included a 0.4 mm ceramic coating on a 2 mm nickel alloy substrate, with artificial interfacial separations of 2 and 3 mm. The equipment rating was 15 kW at 100 kHz, which should not be equated with the power actually deposited during each measurement. Four-second sequences were recorded with a camera operating from 10 to 14 µm and capable of 50 Hz, without black paint. Their adaptive carrier algorithm estimated the slowly varying image background using spatial filtering, followed by subtraction, temporal averaging and spatial derivatives. Here, carrier denotes an image background rather than the electromagnetic frequency.
The processing improved visibility of artificial 2 and 3 mm defects on a turbine blade [108]. Its filter scale must exceed the defect scale, which limits transfer to substantially larger separations. The approximately 0.5 mm feature reported elsewhere in the paper was a blind hole in metal with about 0.1 mm remaining thickness, not a 0.5 mm interfacial TBC debond. The experimental evidence supports localization and outline enhancement, without establishing general reconstruction of interface depth or gap thickness.
Li et al. used a magnetic yoke and salt dissolution to produce nominal 1, 2 and 3 mm separations between ceramic and bond coat, with a prescribed gap of 0.05 mm [31]. Their accompanying model contained 0.3 mm YSZ, a 0.1 mm MCrAlY layer and a 3 mm Inconel substrate. Experimental excitation used 384 A at 167 kHz for 2 s, with acquisition at 30 Hz. Yoke spans of 40, 35 and 30 mm were compared, and the 30 mm span gave the clearest response for the smallest defects. A nominal 1 mm debond became visible after 0.8 s within that excitation sequence. The results establish fast visualization under the tested conditions, while the image and line profile analysis did not independently reconstruct unknown diameter, depth or gap opening.
Complementary electromagnetic measurements can address ambiguity between coating debonds and metal cracks. Li et al. combined induction thermography with an eddy current pickup probe and reported detection of a 0.7 mm debond after 0.2 s [34]. The debond specimen comprised sprayed 0.3 mm YSZ and 0.1 mm MCrAlY on a 3 mm Inconel substrate, with salt dissolution generating a 0.05 mm gap. Thermal and electromagnetic signals were acquired sequentially using an integrated system. Their different sensitivities supported defect classification, since a ceramic interface separation mainly affected heat transport while a metal crack also disturbed the electromagnetic response.
The same publication reported 96.8% quantification accuracy for a coexisting defect example, using electromagnetic inversion for the crack and object detection followed by segmentation for the separated thermal indication [34]. Crucially, that combined defect specimen used stainless steel, adhesive tape and aerogel as a simplified coating analogue. The crack dimensions were obtained from electromagnetic inversion, while the thermal processing supplied the debond contour. This result must not be described as thermographic depth reconstruction in a complete sprayed TBC. It nevertheless provides a useful route for combining complementary signals rather than forcing one temperature field to identify several unknown defects.
ECT has therefore progressed to rapid TBC demonstrations and conditional dimensional assessment through signal fusion. Remaining limitations include electromagnetic coupling around complex geometry, access for the coil or yoke and calibration of image boundaries. Reliability data from bare metals cannot substitute for TBC qualification. Weekes et al. obtained a 1.50 mm crack length at 90% probability of detection with 95% confidence in Waspaloy fatigue specimens, but that result does not describe ceramic interface separations [113].
4.3.2. Microwave Thermography, MWT/AMT
Microwave thermography, MWT, also termed active microwave thermography, AMT, generates heat in electromagnetically absorbing constituents. Complex permittivity and permeability, frequency, polarization, antenna pattern, specimen distance and power modulation control absorption. Penetration alone does not ensure useful heating. The dissipated power per unit volume is proportional to the frequency, the dielectric loss factor and the square of the local electric field, so the heating rate depends on electrical as well as thermal properties [24]. In a mixture, constituents with higher loss factors are heated preferentially [114]. In a coating that absorbs microwave energy, an interface separation can retain heat and produce a warmer indication, unlike the common cold indication during heating from the underlying metal. Reflection from that metal also modifies the local electromagnetic field [110].
Figure 20 shows the principle of microwave thermography (MWT), also termed active microwave thermography (AMT). Panel (a) presents the input signal, which is a microwave field burst with a frequency fMW and a heating time th (the carrier is not drawn to scale). Panel (b) shows the surface temperature rise in the sound area (blue line) and the area above a separation (red line), recorded with an infrared camera. The heat is generated by dielectric and magnetic losses in the electromagnetically absorbing coating. In such a coating an interface separation can retain heat and produce a warmer indication, unlike the common cold indication observed during heating from the underlying metal. The shaded region represents the thermal contrast. Panel (c) presents the thermal contrast ∆T(t) = Td(t) − Ts(t), where Td and Ts are the temperature rises in the defect and sound areas, respectively. In this example the contrast is positive and reaches its maximum ∆Tmax at time tmax.
Figure 20.
The principle of microwave thermography (MWT/AMT). The curves are illustrative and do not represent measured data. Symbols: fMW—microwave frequency, th—heating time, ΔTmax—maximum contrast reached at time tmax. Prepared based on [24,29,110,115,116,117,118].
Tu et al. examined a 1.8 mm radar absorbing material, RAM, on aluminium with artificial interface defects from 3 to 10 mm [110]. A horn antenna supplied nominally 20 W at 5.8 GHz. Long pulse operation used 60 s of heating and 60 s of cooling, while microwave lock-in measurements used a 60 s modulation period and 50% duty cycle. The 5.8 GHz carrier must be distinguished from the thermal modulation frequency of 1/60 Hz. Direct contrast, Fourier phase and PCA were compared. The first principal component revealed all five defects, including the 3 mm feature at a reported signal-to-noise ratio of 5.64 dB, whereas its Fourier phase indication remained weak. The result concerns RAM rather than conventional ceramic TBCs and provides detection rather than validated depth reconstruction.
Wilcox et al. incorporated heating and cooling into active microwave thermographic signal reconstruction with adaptive polynomial regression [111]. Their specimen contained a 2 mm absorbing layer and five CFRP layers of 0.8 mm each, with 40 mm circular openings in selected layers. Excitation at 2.45 GHz lasted 180 s, followed by 180 s of cooling recorded at 15 frames per second. Pixel-dependent polynomial fitting, derivative analysis and segmentation produced area errors below 15% for the examined defects. This is a sizing result for that absorbing composite architecture. A good polynomial fit does not by itself validate the physical boundary or establish depth accuracy in a TBC.
He et al. used a resonant cavity at 217.5 W for 40 s, then removed the RAM and CFRP specimens and recorded fan-assisted cooling at 5 Hz for 394 s [118]. PCA, Fourier analysis and independent component analysis enhanced indications. The study also documented bubbles generated during heating, showing why excitation must be qualified against changes to the inspected material. MWT offers controllable internal deposition when suitable losses are present, but field nonuniformity and uncertain absorption are major constraints. No infrared thermographic study of microwave-heated TBCs was identified in the reviewed literature, and high-power excitation may itself endanger the integrity of the inspected component [24]. Deliberately incorporating an absorbing constituent, such as the CNT or graphene phases already incorporated into TBC ceramics [119,120], would link electromagnetic excitation to the material design considerations associated with the last group, which encompasses material-enabled or embedded excitation.
4.4. Material-Enabled/Embedded Thermography
Material-enabled thermography integrates the excitation path with the inspected structure. Heat may be generated by current injected through an existing conducting component or through wires, tracks and networks introduced for heating, sensing or reinforcement. The three categories considered below overlap because direct Joule excitation describes the conversion mechanism, embedded heaters describe placement, and carbon nanotube, metal and shape memory alloy concepts describe material choices. Composite demonstrations show that embedded conductors can supply thermal contrast at damage, while TBC studies demonstrate integration of metallic temperature sensors [44,121,122]. These achievements provide complementary building blocks rather than a validated common TBC inspection system.
Electrical resistance converts current to heat at the conducting constituent and its contacts. At fixed current, increasing resistance increases total power, whereas at fixed voltage it reduces power. Local redistribution is more complex and depends on network geometry. A crack or separation can therefore change both source strength and heat transfer, while conductor damage can resemble a host material defect. Typical experiments combine accessible electrodes, a controlled supply, simultaneous current and voltage recording, infrared imaging and, where available, local temperature or resistance sensing [121,122,123]. The position of the conducting path relative to the ceramic, bond coat and interfaces determines which separations interrupt heat flow.
The attraction is a repeatable source location and the possibility of combining inspection with another coating function. The corresponding constraints are electrical access, insulation, contact stability, conductor continuity and preservation of thermal protection. Embedded elements can also alter local stiffness, expansion mismatch and thermal conductivity. A thermocouple voltage or resistance map provides complementary information but is not an infrared thermogram. In the reviewed literature, direct TBC evidence concerns embedded sensing and modified coating materials, whereas the strongest defect thermography demonstrations use uncoated metals or polymer composites. The group is consequently an emerging design route for TBCs rather than an established inspection practice.
4.4.1. Direct Joule and Self-Heating Approaches
Direct Joule thermography drives current through the conducting specimen itself. Unlike ECT, current enters through terminals rather than electromagnetic induction. Current or voltage control, electrode arrangement, contact resistance, electrical resistance, heating duration and temperature rise determine the experiment. Infrared contrast, background subtraction, spatial profiles and their derivatives can reveal disruption of heat generation or diffusion. No separate heating insert is required, although a low-resistance substrate may demand a high current [123].
Sakagami and Ogura introduced two variants of this approach [124]. In the singular method, current concentrated at crack tips produced local heating that revealed through-thickness and surface cracks in steel plates. In the insulation method, a delamination obstructed the heat generated in the conducting layers, so that artificial delaminations formed by 25 µm polyimide films in CFRP appeared as cooler regions. Defects were identified most clearly in the early transient stage. The authors suggested the insulation method for near-surface delaminations in film-coated materials, although coatings were not tested. High currents of approximately 20 to 40 A were required, and direct electrical connections can introduce thermomechanical stresses [24,124].
Defanti et al. examined artificial defects in uncoated Ti6Al4V parts produced by electron beam powder bed fusion [123]. A final protocol used approximately 1 V and 200 A for 5 s, with infrared acquisition at 30 Hz and spatial sampling of about 40 µm per pixel. Three-term Gaussian fitting and extrema of the first spatial derivative were used to estimate defect diameter, with computed tomography supplying independent dimensions. An actual diameter of approximately 1.11 mm was detected at a known depth of 1.42 mm for the favourable surface produced against the build platform. Accuracy varied substantially with roughness and geometry, and known tomographic depths were not thermographically reconstructed.
For TBCs, directly heating the conductive substrate could interrogate ceramic interfaces through outward heat flow, but induction results cannot establish equivalent performance under terminal current injection. Electrode heating and current spreading require separate control, and cracks in the metal may perturb both electrical dissipation and heat transport. No study applying direct Joule thermography to TBCs was identified in the reviewed literature. The insulation method suggests a possible configuration in which the conductive bond coat or substrate acts as the heat source and an interfacial separation as the insulating defect [124]. Electrically conductive constituents could also be introduced into the coating itself, for example CNT or graphene phases [119,120,125] or metallic MAX phase borides proposed for TBCs on the basis of density functional theory calculations [126].
4.4.2. Embedded Conductive Heaters and Sensors
Embedded heaters place the source at a designed location using wires, filaments or deposited tracks. Their spacing, dimensions, resistance, insulation, burial position and thermal contact become essential parameters alongside electrical input and camera timing. Surface temperature histories may be analysed together with local sensor readings to constrain source behaviour. Spatial coverage depends on conductor layout and diffusion, while a failed heater must be distinguished from damaged material. Embedded temperature measurement alone does not demonstrate operation as a heater for defect thermography [44,121,122].
Zhang et al. laser clad chromel and alumel tracks onto a 200 µm sprayed YSZ layer on aluminium and covered the tracks with approximately 50 µm of additional YSZ [44]. Figure 21 shows a schematic of the manufacturing process. The alumel track was approximately 184 µm high and 305 µm wide, while chromel was approximately 211 µm high and 191 µm wide. These dimensions are comparable to the ceramic thickness and show why sensor integration can substantially perturb the coating geometry.
Figure 21.
Schematic of laser cladding process. Reprinted from Ref. [44].
The resulting type K thermocouple was tested from ambient temperature to approximately 450 °C in argon. Fitted Seebeck coefficients were 41.2 µV/K before covering and 40.9 µV/K after embedding, with an initially delayed thermal response after overcoating [44]. Excessive fabrication heat input caused densification, cracking or partial delamination, while adjusted cladding conditions reduced damage. This is direct TBC evidence for sensor fabrication and temperature response, without demonstrated electrical heating followed by infrared defect imaging. It supplies no minimum defect size or depth reconstruction result and does not establish durability in turbine service. Operation of such tracks as controlled resistive sources remains a prospective extension.
4.4.3. Concepts Based on CNTs, Metals and SMAs
Carbon nanotubes, CNTs, could provide distributed conductive networks whose resistance also responds to damage. Connectivity, dispersion, electrode contact and stability after processing would govern the excitation. Kim et al. localized damage using electrical resistance tomography in CNT-coated paper with sixteen peripheral electrodes [127]. Their approximately 0.6 mm damage indication was an electrical conductivity reconstruction, not infrared thermography or a TBC result. It supports a sensing concept without establishing thermal source uniformity or temperature capability in a ceramic coating.
TBC material studies nevertheless provide evidence that carbon constituents can be incorporated into relevant ceramics. Thakare et al. produced plasma-sprayed YSZ and alumina coatings with 1% and 3% CNT additions on NiCrAlY-coated steel [119]. Porosity decreased and thermal conductivity changed, reaching approximately 0.9 W/(m K) within the modified series compared with about 0.4 W/(m K) for conventional YSZ. The comparison also involved alumina content and microstructure, so it cannot isolate an intrinsic CNT effect. Electrochemical impedance measurements in that study did not establish an electronically conducting heater network.
Singh et al. deposited lanthanum cerate reinforced with 1 wt% graphene nanoplatelets and 0.5 wt% CNTs on Inconel, reporting mechanical and thermal shock behaviour rather than electrical defect imaging [120]. Wiśniewska et al. used aerosol-deposited 8YSZ to shield 3YSZ/CNT composites during thermal exposure [125]. A specimen with a 550 µm coating delaminated after approximately 12 min of flame testing, although the protected substrate showed no visible CNT oxidation. These studies demonstrate material integration opportunities and protection constraints, but neither validates self-heating thermography for TBC defect sizing. Conductive continuity, controlled dissipation and preservation of thermal protection must be demonstrated independently.
Metallic tracks offer a defined conductor geometry, with chromel and alumel providing the direct TBC integration example above [44]. Shape memory alloys, SMAs, can additionally combine reinforcement, electrical sensing and actuation. Their heat source remains Joule dissipation, while phase-dependent resistance and deformation can complicate interpretation. Pinto et al. embedded NiTi wires of 350 µm diameter in CFRP, including a grid with 10 mm spacing, and supplied 1 A [121]. Infrared images were recorded every 0.01 s over a sequence containing a background interval, approximately 2 s of heating and subsequent cooling. Background-corrected camera digital levels revealed artificial polytetrafluoroethylene, PTFE, inserts, with wire spacing permitting a rough estimate of a 10 mm by 10 mm feature. Inserts at known depths of 0.575 and 1.25 mm were detected, without reconstruction of unknown depth.
Khor et al. used 0.13 mm NiTi filaments tufted through carbon and epoxy joints, with spacings of 3.44, 4.3 and 5.16 mm [122]. Currents from 0.1 to 0.33 A per wire produced a sequence of 3 s before heating, 3 s during heating and 4 s of cooling, recorded at 62.5 frames per second. Background subtraction, spatial averaging and PCA revealed weaker heating and delayed release in delaminated regions, with optical fractography supporting loss of wire and matrix coupling. Figure 22 presents results that demonstrate the effectiveness of thermography for detecting defects in materials containing tufted bundles of shape memory alloy (SMA). Resistance also correlated with delamination opening over a limited range, but that electrical relationship was not thermographic depth measurement.
Figure 22.
PCA−processed intensity of the composite during the (a) unheated, (b) heating, and (c) cooling processes, with indicators for tuft positions. Comparison is shown in (d). Blue triangles illustrate the locations of SMA tufts. Reprinted from Ref. [122].
The specific appeal of SMA concepts is multifunctionality within the same element. Their limitations include conductor damage, electrical interaction between neighbouring wires, contact degradation and possible changes in phase or shape. The demonstrated host materials were polymer composites. Transfer to TBCs requires compatible integration dimensions, oxidation resistance and temperature capability, together with defect contrast that can be separated from heater deterioration. CNT concentration or metal incorporation alone cannot define an inspection method. No thermographic defect detection study using CNT-, metal- or SMA-based excitation in a TBC was identified, and these concepts are therefore marked as prospective in Figure 4.
4.5. Examples for TBCs in Different Conditions
The studies discussed above can also be organised according to the condition of the inspected coating. This view illustrates what active thermography reveals at different stages of coating life and which reference data are still missing.
As-manufactured coatings. Flash thermography is used during manufacture and maintenance to detect delamination and contamination [26], and pulsed thermography has been applied to quality control of as-sprayed APS coatings, with relative thickness errors below 10% for most 150–300 µm coatings [128]. In defect-free coatings, the main sources of indications are thickness variation and overthickness, which can resemble adhesion defects unless the temporal evolution of the response is analysed [42].
Coatings with engineered defects. Most quantitative results were obtained on coupons with flat bottom holes, plugged gaps or salt dissolution debonds. Debonds of about 1–2 mm beneath 0.2–0.5 mm ceramic layers were detected [15,30,31,55], and sizing errors were mostly between about 3% and 12% [15,55], with one larger error of 38.6% attributed to imperfect specimen preparation [55]. These specimens establish detectability, but open flat-bottom holes overestimate contrast relative to natural disbonds [33].
Aged coatings. During furnace cycling to failure, the apparent thermal diffusivity of APS coatings first increased because of sintering and then decreased after 200–300 cycles as interfacial cracks developed, which allowed the cracked fraction of the interface to be estimated before spallation [36]. Pulsed thermography combined with machine learning classified isothermally heat-treated coatings with an accuracy of 89.2% [129], thickness degradation of service-aged coatings agreed with terahertz measurements [13], and real-time infrared imaging followed CMAS-induced failure of APS coatings during thermal shock [130].
Coated components. On coated turbine blades, the temporal evolution of apparent effusivity discriminated adhesion defects from coating overthickness [42], and pulsed thermal imaging has been proposed for evaluating hot gas path coatings of gas turbines [131]. Ultrasonically stimulated thermography revealed a previously unrecognised crack in the substrate beneath the TBC of a blade from a 10 MW industrial gas turbine [28].
End-of-life coatings combine sintered regions, microcrack networks, partial delamination and deposit infiltration, whose thermal signatures overlap. No study was identified that inspected new, aged and end-of-life components from the same engine with one thermographic protocol and destructive verification. Such a series would provide the reference examples that are currently missing for interpreting thermograms of service-exposed TBCs.
5. Current Status and Future Prospects of Multifunctional TBCs
5.1. Scope and Evidence
In this review, multifunctional TBCs are coatings designed to retain thermal insulation while providing a distinct additional function, such as temperature sensing or autonomous crack repair. A change in composition, a multilayer architecture or improved thermal performance alone is not sufficient to establish multifunctionality. The diagnostic question is whether an added function improves defect observability or instead creates additional ambiguity in the measured thermal response.
Table 2 summarises the active thermography methods discussed in the previous section in terms of the type of evidence, the detection and quantification demonstrated under specified test conditions, their main limitations and the additional function addressed in multifunctional coatings. Figure 23 complements the table by mapping types of experimental evidence and proposed applications for each combination of coating system and method. The two should be read together: the table states what has been measured and under which conditions, whereas the map shows on which type of object the evidence was obtained and where it is missing.
Figure 23.
Evidence map of active thermography methods applied to different coating systems. For group II, the additional function is given in brackets, and rows II-1 and II-6 are modified TBCs without a distinct additional function (Section 2.3). Codes: I—components or industrial representative parts, R—real damage produced by service, ageing, cycling or loading, M—model specimens with artificial defects, X—related coatings or other materials, P—combination proposed in this review, NT—measurement on TBCs without infrared thermography, S—sensing function integrated in a TBC with non-infrared (electrical or luminescence) readout and without infrared defect detection, blank—no study identified. Numbers in the cells are the supporting references. Dashed headers mark methods not yet applied to defect detection in TBCs (see Figure 4).
The available evidence is concentrated in conventional TBCs. Pulsed thermography has been applied to coupons with artificial defects, coatings with ageing damage and turbine components [25,32,33,36]. Component inspection does not itself demonstrate validation on service-induced coating damage. For example, ultrasonically stimulated thermography has detected substrate cracks beneath a coating [28], whereas vibrothermography has also detected artificial coating debonds [55]. A statistically established detection limit for TBCs cannot be inferred from these demonstrations. The crack length of 1.50 mm detected with 90% probability at 95% confidence reported for eddy current thermography refers specifically to fatigue cracks in uncoated Waspaloy, not to TBCs [113]. The smallest reported defects therefore describe individual experiments and cannot be compared directly unless defect type, layer dimensions, excitation energy and acquisition time agree.
Direct infrared defect detection in multifunctional coatings remains insufficiently validated in the sources assessed here. Embedded thermocouples [44,132] and luminescent sensing layers [37,133] demonstrate sensing functions integrated into TBCs, including temperature measurement during engine operation in the phosphor-based system [37]. These sensing functions use electrical or luminescence readout and do not demonstrate active infrared defect detection. Crack healing has been observed in an air plasma-sprayed TBC containing MoSi2 particles [134], but this is not a thermographic validation of healing or recovered adhesion. For multilayer, graded, CMAS-resistant, self-healing, and carbon-modified coatings, proposed combinations in Figure 23 should be distinguished from demonstrations. The nonlinear ultrasonic stimulated thermography, microwave thermography and direct Joule heating studies cited here concern polymer composites, absorbing layers and uncoated metals, respectively [106,110,123]. Their applicability to multifunctional TBCs requires separate validation.
5.2. Interpretation of the Thermographic Response
Functionalisation changes both the material being inspected and the transfer of information from that material to the camera. Optical absorption determines where excitation energy is deposited, whereas emissivity and semitransparency in the detection band determine which temperatures contribute to measured radiance. Reflected background radiation can also affect the recorded signal. In conventional unpainted TBCs, Ptaszek et al. showed that discolouration can create misleading contrast and that infrared semitransparency impairs disbond identification [32]. This evidence makes spectral characterisation important when dopants, reaction layers or conductive particles are introduced. Their effects cannot be assumed to follow those of unmodified YSZ. Conversely, optical access that enables a buried phosphor sensor is not evidence that an infrared camera resolves that layer [37,133].
Thermal properties introduce a second source of ambiguity. In zirconia and MoSi2 model ceramics, Cernuschi et al. measured composition-dependent thermal transport using flash techniques and examined the influence of porosity and conducting phase connectivity [135]. These were material characterisation experiments on sintered composites, rather than defect inspections of operating TBCs. Nevertheless, they demonstrate why a calibration established for conventional YSZ cannot automatically be transferred to a coating containing healing particles. Conductivity governs heat flow, while diffusivity and effusivity also depend on volumetric heat capacity. Changes in any of these quantities can modify a thermal transient without a new crack or delamination.
The resulting ambiguity also evolves during exposure. For conventional TBCs, Cernuschi et al. showed that sintering and interfacial cracking influence apparent diffusivity in opposing directions [36]. By inference, in a healing coating, crack filling, particle oxidation and matrix evolution could produce competing thermal changes [36,134,135]. A reduction in defect contrast would therefore require independent evidence before being interpreted as restoration of adhesion or load transfer. Likewise, an intentionally graded composition requires a spatially varying reference response rather than comparison with one nominally intact pixel.
Electrical functionality presents an analogous issue. Embedded thermocouples establish electrical integration [132], but do not demonstrate that the surrounding ceramic forms a controllable heating network. Thermophysical measurements on MoSi2 composites also do not establish usable electrical connectivity [135]. For resistive or inductive excitation involving added phases, current distribution and its evolution would need separate verification. A thermal anomaly could then arise from disrupted heat flow, altered electrical resistance or redistribution of power. This distinction is central to attributing contrast to damage.
Layer thickness and interface resistance must also be considered together with composition. In conventional TBCs, coating overthickness and adhesion defects can produce similar thermal indications [42]. Lateral defect dimensions may be estimated from calibrated images, but thermal spreading and segmentation affect the apparent boundary. Depth estimation additionally requires a validated relation between the transient response and the layer properties and geometry. Neither a thermal anomaly nor a size estimate establishes residual adhesion or remaining life. Lifetime correlations established for a specific coating microstructure and thermal cycling regime require validation before they can be used to predict the lifetime of coatings with different microstructures or under different cycling conditions [24].
5.3. Priorities for Validation
The functional constituents themselves, namely conductive or electromagnetically absorbing phases and embedded conductors, may provide additional inspection routes, but this remains a proposal for the TBC systems considered here. Carbon-modified coating studies demonstrate changes in material properties [119], while embedded thermocouples establish a sensing function [44,132]. Neither result demonstrates a stable heating network for infrared defect detection. Such a network would require separate validation of power distribution, electrical continuity, thermal insulation and durability during thermal cycling.
A practical next step is to compare intact and damaged specimens with the same functional phase or layer, using repeated measurements before and after controlled ageing. Excitation conditions, camera spectral band, surface state and viewing geometry should be recorded so that changes in contrast can be attributed to damage rather than to changes in the measurement. Interpretation should use coating-specific thermal and, where relevant, radiative or electrical models with measured input properties and reported uncertainty. Integrating an embedded temperature sensor with infrared imaging could help constrain the thermal boundary conditions, but simultaneous heating and sensing would need to be validated. Temperature sensing during engine operation [37] does not establish active infrared defect monitoring under operating conditions. That extension would require controlled excitation, optical access and separation of the imposed transient from changing operating loads.
Establishing reliable defect monitoring under realistic service conditions also requires a quantitative assessment of inspection reliability. However, the probability-of-detection data currently available for active thermography are largely derived from studies of fatigue cracks in uncoated metals [113] or from vibrothermographic inspection of metallic specimens at multiple sites [102,136]. A conceptual protocol for TBC disbonds could comprise the following elements. First, defect simulators should include plugged interface gaps of controlled diameter and opening, which reproduce a buried air gap better than open flat-bottom holes [33], together with natural delaminations produced by thermal cycling or indentation and verified by sectioning [36,137]. Second, diameters should span the transition from non-detection to reliable detection, for example 0.5–5 mm, at several top coat thicknesses representative of the application. Third, because YSZ is translucent, specimens should be inspected unpainted in the camera band intended for service, with surface condition, discolouration and spectral band recorded as controlled variables, and nominally identical coatings in different optical states should be included as nuisance cases [26,32]. Fourth, the number of flawed and unflawed sites should satisfy the statistical model chosen, hit/miss or signal response, which typically requires several tens of independent flaws distributed over specimens from more than one spray batch [102,113,136]. Finally, repeated inspections on different days or by different operators, blind allocation of specimens, predefined decision thresholds and destructive verification of all flaws should be used, and the results should be reported as a90 and a90,95 for each coating architecture and inspection configuration rather than as the smallest visible defect [113].
Table 2.
Active thermography methods for NDT of TBCs: evidence, demonstrated detection and quantification, main limitations and relevance to multifunctional TBCs.
6. Conclusions
The four groups distinguish how excitation is supplied to or generated within the coating system. Broad optical transients provide an established basis for TBC screening, while localised lasers add sensitivity to surface cracks. Mechanical methods interrogate dissipative contact and can expose damage concealed beneath a coating, but depend on successful activation. Induction provides heating of conductive layers and can supply complementary electromagnetic information [25,28,34,54,55]. Microwave and embedded electrical concepts extend the possible source locations, although their validation for TBC defect detection remains limited in the assessed literature [44,110,123].
Method selection should therefore begin with the defect and coating architecture rather than a universal ranking. Interface separation, substrate cracking, surface cracking and thickness variation interact differently with optical absorption, mechanical contact, current flow and thermal resistance. Reported minimum diameters cannot be compared meaningfully without matching defect morphology, layer dimensions, excitation energy, acquisition time and the definition of successful detection. Likewise, a visible early frame does not represent the complete inspection duration, and successful segmentation does not by itself establish depth, adhesion strength or remaining coating life.
The following research priorities follow from these limitations:
Validation should extend beyond artificial defect geometries. Open flat-bottom holes can overestimate contrast relative to realistic interfacial disbonds, while appropriately designed plugged gaps provide closer surrogates [33]. Validation should additionally address damage produced by representative thermal cycling, ageing or service exposure and be verified by independent characterisation, including sectioning where appropriate.
Probability of detection studies on representative TBC populations are needed before a statistically supported detection limit can be assigned to a method and inspection configuration. Repeated measurements should quantify variability and uncertainty rather than report only the smallest visible defect.
Multifunctional coatings require reference specimens containing the added functional layer or phase both with and without damage, so that intended material contrast can be separated from defect contrast. This comparison is essential before claims of quantitative damage assessment or monitoring during operation can be justified. A conceptual protocol for such studies is outlined in Section 5.3.
Author Contributions
Conceptualization: A.S. and M.K.; Formal analysis: A.S.; Funding acquisition: A.S., M.K., B.Z.-K.; Investigation: A.S., M.K., B.Z.-K.; Methodology: A.S.; Project administration: A.S.; Resources: A.S., M.K., B.Z.-K.; Supervision: A.S.; Visualization: A.S. and M.K.; Writing—original draft: A.S. and M.K.; Writing—review & editing: A.S., M.K., B.Z.-K. All authors have read and agreed to the published version of the manuscript.
Funding
This work was supported by Ministry of Science and Higher Education (AGH grant no. 16.16.110.663/501.00-110000-10000). Research project partly supported by program “Excellence initiative—research university” for AGH University of Krakow, Action D21.
Institutional Review Board Statement
Not applicable.
Informed Consent Statement
Not applicable.
Data Availability Statement
No new data were created or analyzed in this study. Data sharing is not applicable to this article.
Acknowledgments
Conflicts of Interest
The authors declare no conflict of interest.
References
- Padture, N.P.; Gell, M.; Jordan, E.H. Thermal Barrier Coatings for Gas-Turbine Engine Applications. Science 2002, 296, 280–284. [Google Scholar] [CrossRef] [Scilit] [PubMed]
- Clarke, D.R.; Oechsner, M.; Padture, N.P. Thermal-Barrier Coatings for More Efficient Gas-Turbine Engines. MRS Bull. 2012, 37, 891–898. [Google Scholar] [CrossRef] [Scilit]
- Darolia, R. Thermal Barrier Coatings Technology: Critical Review, Progress Update, Remaining Challenges and Prospects. Int. Mater. Rev. 2013, 58, 315–348. [Google Scholar] [CrossRef] [Scilit]
- Lin, E.; Wang, H.; Dong, L.; Piao, Z.; Yang, J.; Xing, Z.; Cai, D. Surface Crack Detection of the Abradable Seal Coating by Laser Bidirectional Scanning Thermography. Infrared Phys. Technol. 2023, 128, 104498. [Google Scholar] [CrossRef] [Scilit]
- Bogdan, M.; Peter, I. A Comprehensive Understanding of Thermal Barrier Coatings (TBCs): Applications, Materials, Coating Design and Failure Mechanisms. Metals 2024, 14, 575. [Google Scholar] [CrossRef] [Scilit]
- Vaßen, R.; Jarligo, M.O.; Steinke, T.; Mack, D.E.; Stöver, D. Overview on Advanced Thermal Barrier Coatings. Surf. Coat. Technol. 2010, 205, 938–942. [Google Scholar] [CrossRef] [Scilit]
- Liu, M.; Zhang, G.; Lu, Y.; Han, J.; Li, G.; Li, C.; Li, C.; Yang, G. Plasma Spray–Physical Vapor Deposition toward Advanced Thermal Barrier Coatings: A Review. Rare Met. 2020, 39, 479–497. [Google Scholar] [CrossRef] [Scilit]
- Xu, Z.; Wang, Z.; Huang, G.; Mu, R.; He, L. Thermal Cycling Behavior of EB-PVD TBCs on CVD Platinum Modified Aluminide Coatings. J. Alloys Compd. 2015, 637, 226–233. [Google Scholar] [CrossRef] [Scilit]
- Tzimas, E.; Müllejans, H.; Peteves, S.D.; Bressers, J.; Stamm, W. Failure of Thermal Barrier Coating Systems under Cyclic Thermomechanical Loading. Acta Mater. 2000, 48, 4699–4707. [Google Scholar] [CrossRef] [Scilit]
- Evans, H.E. Oxidation Failure of TBC Systems: An Assessment of Mechanisms. Surf. Coat. Technol. 2011, 206, 1512–1521. [Google Scholar] [CrossRef] [Scilit]
- Nair, R.B.; Brabazon, D. Calcia Magnesia Alumino Silicate (CMAS) Corrosion Attack on Thermally Sprayed Thermal Barrier Coatings: A Comprehensive Review. npj Mater. Degrad. 2024, 8, 44. [Google Scholar] [CrossRef] [Scilit] [PubMed]
- Chen, H.-L.R.; Zhang, B.; Alvin, M.A.; Lin, Y. Ultrasonic Detection of Delamination and Material Characterization of Thermal Barrier Coatings. J. Therm. Spray Technol. 2012, 21, 1184–1194. [Google Scholar] [CrossRef] [Scilit]
- Unnikrishnakurup, S.; Dash, J.; Ray, S.; Pesala, B.; Balasubramaniam, K. Nondestructive Evaluation of Thermal Barrier Coating Thickness Degradation Using Pulsed IR Thermography and THz-TDS Measurements: A Comparative Study. NDT E Int. 2020, 116, 102367. [Google Scholar] [CrossRef] [Scilit]
- Huang, Z.; Zhu, J.; Zhuo, L.; Li, C.; Liu, C.; Hao, W.; Xie, W. Non-Destructive Evaluation of Uneven Coating Thickness Based on Active Long Pulse Thermography. NDT E Int. 2022, 130, 102672. [Google Scholar] [CrossRef] [Scilit]
- Wei, J.; Xu, G.; Liu, G.; Guo, J.; Zhu, W.; Ma, Z. Quantitative Characterization of Interfacial Defects in Thermal Barrier Coatings by Long Pulse Thermography. Coatings 2022, 12, 1829. [Google Scholar] [CrossRef] [Scilit]
- Yong, L.; Chen, Z.; Mao, Y.; Yong, Q. Quantitative Evaluation of Thermal Barrier Coating Based on Eddy Current Technique. NDT E Int. 2012, 50, 29–35. [Google Scholar] [CrossRef] [Scilit]
- Sayar, M.; Seo, D.; Ogawa, K. Non-Destructive Microwave Detection of Layer Thickness in Degraded Thermal Barrier Coatings Using K- and W-Band Frequency Range. NDT E Int. 2009, 42, 398–403. [Google Scholar] [CrossRef] [Scilit]
- Mustapha, A.A.; Hassan, O.S.; Alteneiji, S.; Abou-Khousa, M.A. Thickness Measurement of Thermal Barrier Coating Using Varactor Tuned Resonant Probe. NDT E Int. 2026, 157, 103525. [Google Scholar] [CrossRef] [Scilit]
- Purayil, S.K.K.; Aroliveetil, S.; Chaturvedi, A.; Balasubramaniam, K. Simulation-Assisted Multimodal Deep Learning (Sim-MDL) Fusion Models for the Evaluation of Thermal Barrier Coatings Using Infrared Thermography and Terahertz Imaging. Sci. Rep. 2025, 16, 1540. [Google Scholar] [CrossRef] [Scilit] [PubMed]
- Ogawa, K.; Minkov, D.; Shoji, T.; Sato, M.; Hashimoto, H. NDE of Degradation of Thermal Barrier Coating by Means of Impedance Spectroscopy. NDT E Int. 1999, 32, 177–185. [Google Scholar] [CrossRef] [Scilit]
- Bolelli, G.; Righi, M.G.; Mughal, M.Z.; Moscatelli, R.; Ligabue, O.; Antolotti, N.; Sebastiani, M.; Lusvarghi, L.; Bemporad, E. Damage Progression in Thermal Barrier Coating Systems during Thermal Cycling: A Nano-Mechanical Assessment. Mater. Des. 2019, 166, 107615. [Google Scholar] [CrossRef] [Scilit]
- Fouliard, Q.; Ghosh, R.; Raghavan, S. Quantifying Thermal Barrier Coating Delamination through Luminescence Modeling. Surf. Coat. Technol. 2020, 399, 126153. [Google Scholar] [CrossRef] [Scilit]
- Abou Nada, F.; Lantz, A.; Larfeldt, J.; Markocsan, N.; Aldén, M.; Richter, M. Remote Temperature Sensing on and beneath Atmospheric Plasma Sprayed Thermal Barrier Coatings Using Thermographic Phosphors. Surf. Coat. Technol. 2016, 302, 359–367. [Google Scholar] [CrossRef] [Scilit]
- Ciampa, F.; Mahmoodi, P.; Pinto, F.; Meo, M. Recent Advances in Active Infrared Thermography for Non-Destructive Testing of Aerospace Components. Sensors 2018, 18, 609. [Google Scholar] [CrossRef] [Scilit] [PubMed]
- Cernuschi, F.; Bison, P. Thirty Years of Thermal Barrier Coatings (TBC), Photothermal and Thermographic Techniques: Best Practices and Lessons Learned. J. Therm. Spray Technol. 2022, 31, 716–744. [Google Scholar] [CrossRef] [Scilit]
- Shepard, S.M.; Hou, Y.L.; Lhota, J.R.; Wang, D.; Ahmed, T. Thermographic Measurement of Thermal Barrier Coating Thickness. Proc. SPIE 2005, 5782, 407–410. [Google Scholar] [CrossRef] [Scilit]
- Jiao, D.; Shi, W.; Liu, Z.; Xie, H. Laser Multi-Mode Scanning Thermography Method for Fast Inspection of Micro-Cracks in TBCs Surface. J. Nondestruct. Eval. 2018, 37, 30. [Google Scholar] [CrossRef] [Scilit]
- Mevissen, F.; Meo, M. Ultrasonically Stimulated Thermography for Crack Detection of Turbine Blades. Infrared Phys. Technol. 2022, 122, 104061. [Google Scholar] [CrossRef] [Scilit]
- Zhu, J.; Mao, Z.; Wu, D.; Zhou, J.; Jiao, D.; Shi, W.; Zhu, W.; Liu, Z. Progress and Trends in Non-Destructive Testing for Thermal Barrier Coatings Based on Infrared Thermography: A Review. J. Nondestruct. Eval. 2022, 41, 49. [Google Scholar] [CrossRef] [Scilit]
- Wang, H.; Zhang, G.; Li, W.; Dong, L.; Cai, D.; Wang, H.; Liu, H. Interface Debonding Defect Detection of Thermal Barrier Coatings with Laser Lock-in Thermography Based on Edge Sharpness Optimization. Infrared Phys. Technol. 2025, 146, 105744. [Google Scholar] [CrossRef] [Scilit]
- Li, J.; Jia, C.; Liu, H.; Li, X.; Xu, N.; Li, J.; Li, Y.; Chen, H.-E.; Chen, Z.; Tong, Z.; et al. Electromagnetic Induced Infrared Thermography for Fast Detection of Interfacial Debonding in Coating-Metal Multilayer Structure. Compos. Struct. 2026, 388, 120357. [Google Scholar] [CrossRef] [Scilit]
- Ptaszek, G.; Cawley, P.; Almond, D.; Pickering, S. Transient Thermography Testing of Unpainted Thermal Barrier Coating (TBC) Systems. NDT E Int. 2013, 59, 48–56. [Google Scholar] [CrossRef] [Scilit]
- Ptaszek, G.; Cawley, P.; Almond, D.; Pickering, S. Artificial Disbonds for Calibration of Transient Thermography Inspection of Thermal Barrier Coating Systems. NDT E Int. 2012, 45, 71–78. [Google Scholar] [CrossRef] [Scilit]
- Li, J.; Tong, Z.; Yang, Q.; Wang, J.; Jia, C.; Guo, W.; Zhang, Y.; Jiang, P.; Qiu, W.; Uchimoto, T.; et al. Non-Destructive Evaluation of Defects in Thermal Barrier Coating System Using Combined Electromagnetic and Thermographic Signals. Nat. Commun. 2025, 16, 8697. [Google Scholar] [CrossRef] [Scilit] [PubMed]
- Yang, Q.; Qiu, Y.; Liu, J.; Xu, Y.; Zhao, Y.; Wu, X. Delamination Defect Detection in Thermal Barrier Coatings Based on Hemispherical Near-Field Focused Annular Slit Leakage Wave (ASLW) Antennas. In Proceedings of the 2024 4th International Conference on Computational Modeling, Simulation and Data Analysis; Association for Computing Machinery: New York, NY, USA, 2025; pp. 1098–1103. [Google Scholar] [CrossRef] [Scilit]
- Cernuschi, F.; Capelli, S.; Bison, P.; Marinetti, S.; Lorenzoni, L.; Campagnoli, E.; Giolli, C. Non-Destructive Thermographic Monitoring of Crack Evolution of Thermal Barrier Coating Coupons during Cyclic Oxidation Aging. Acta Mater. 2011, 59, 6351–6361. [Google Scholar] [CrossRef] [Scilit]
- Yañez Gonzalez, A.; Pilgrim, C.C.; Feist, J.P.; Sollazzo, P.Y.; Beyrau, F.; Heyes, A.L. On-Line Temperature Measurement Inside a Thermal Barrier Sensor Coating During Engine Operation. J. Turbomach. 2015, 137, 101004. [Google Scholar] [CrossRef] [Scilit]
- Ring, E.F.J.; Ammer, K. Infrared Thermal Imaging in Medicine. Physiol. Meas. 2012, 33, R33–R46. [Google Scholar] [CrossRef] [Scilit] [PubMed]
- Matyja, M.; Kuźnia, M.; Szajding, A.; Habrat, B.; Kawa, I.; Kapusta, D.; Major, P. Influence of BMI on the Stabilization Time Required for Infrared Thermal Imaging in Medicine. Biomed. Signal Process. Control 2026, 125, 110833. [Google Scholar] [CrossRef] [Scilit]
- Breitenstein, O.; Warta, W.; Schubert, M.C. Lock-in Thermography: Basics and Use for Evaluating Electronic Devices and Materials; Springer Series in Advanced Microelectronics; Springer International Publishing: Cham, Switzerland, 2018; Volume 10, ISBN 978-3-319-99824-4. [Google Scholar]
- Piau, J.-M.; Bendada, A.; Maldague, X.; Legoux, J.-G. Nondestructive Inspection of Open Micro-Cracks in Thermally Sprayed Coatings Using Ultrasound Excited Vibrothermography. Proc. SPIE 2007, 6541, 654112. [Google Scholar] [CrossRef] [Scilit]
- Marinetti, S.; Robba, D.; Cernuschi, F.; Bison, P.G.; Grinzato, E. Thermographic Inspection of TBC Coated Gas Turbine Blades: Discrimination between Coating over-Thicknesses and Adhesion Defects. Infrared Phys. Technol. 2007, 49, 281–285. [Google Scholar] [CrossRef] [Scilit]
- Liu, B.; Zhou, J.; Wang, L.; Wang, Y. Research Progress of Self-Healing Thermal Barrier Coatings: A Review. Coatings 2022, 12, 1724. [Google Scholar] [CrossRef] [Scilit]
- Zhang, Y.; Mack, D.; Mauer, G.; Vaßen, R. Laser Cladding of Embedded Sensors for Thermal Barrier Coating Applications. Coatings 2018, 8, 176. [Google Scholar] [CrossRef] [Scilit]
- Hosseini, S.; Asgharian, S.; Soltani, R. Thermomechanical Properties of Conventional TBC Coatings Compared with Thick Segmented-Crack TBCs. Results Surf. Interfaces 2026, 25, 100962. [Google Scholar] [CrossRef] [Scilit]
- Evans, A.G.; He, M.Y.; Hutchinson, J.W. Mechanics-Based Scaling Laws for the Durability of Thermal Barrier Coatings. Prog. Mater. Sci. 2001, 46, 249–271. [Google Scholar] [CrossRef] [Scilit]
- Lashmi, P.G.; Ananthapadmanabhan, P.V.; Unnikrishnan, G.; Aruna, S.T. Present Status and Future Prospects of Plasma Sprayed Multilayered Thermal Barrier Coating Systems. J. Eur. Ceram. Soc. 2020, 40, 2731–2745. [Google Scholar] [CrossRef] [Scilit]
- Mauer, G.; Vaßen, R. Coatings with Columnar Microstructures for Thermal Barrier Applications. Adv. Eng. Mater. 2020, 22, 1900988. [Google Scholar] [CrossRef] [Scilit]
- Schulz, U.; Schmücker, M. Microstructure of ZrO2 Thermal Barrier Coatings Applied by EB-PVD. Mater. Sci. Eng. A 2000, 276, 1–8. [Google Scholar] [CrossRef] [Scilit]
- Qiu, S.-Y.; Wu, C.-W.; Huang, C.-G.; Ma, Y.; Guo, H.-B. Microstructure Dependence of Effective Thermal Conductivity of EB-PVD TBCs. Materials 2021, 14, 1838. [Google Scholar] [CrossRef] [Scilit] [PubMed]
- Huo, K.; Xu, C.; Huang, Z.; Xia, J.; Zhang, L.; Zhang, X.; Li, T. Effects of Oxygen Gas Flow During Deposition on the Thermal Shock Life of YSZ Thermal Barrier Coatings Prepared by Electron Beam Physical Vapor Deposition. Coatings 2025, 15, 928. [Google Scholar] [CrossRef] [Scilit]
- Friis, M.; Persson, C.; Wigren, J. Influence of Particle In-Flight Characteristics on the Microstructure of Atmospheric Plasma Sprayed Yttria Stabilized ZrO2. Surf. Coat. Technol. 2001, 141, 115–127. [Google Scholar] [CrossRef] [Scilit]
- Saremi, M.; Afrasiabi, A.; Kobayashi, A. Microstructural Analysis of YSZ and YSZ/Al2O3 Plasma Sprayed Thermal Barrier Coatings after High Temperature Oxidation. Surf. Coat. Technol. 2008, 202, 3233–3238. [Google Scholar] [CrossRef] [Scilit]
- Luo, Z.; Chen, F.; Zheng, E.; Shen, P.; Zhang, H. Automatic High Depth-Resolvability Inspection of TBC Debonding Defects Using Nonlinear Frequency Modulation Photothermal Radar. NDT E Int. 2024, 141, 102971. [Google Scholar] [CrossRef] [Scilit]
- Wei, Q.; Huang, J.; Zhu, J.; Zhuo, L.; Li, C. Experimental Investigation on Detection of Coating Debonds in Thermal Barrier Coatings Using Vibrothermography with a Piezoceramic Actuator. NDT E Int. 2023, 137, 102859. [Google Scholar] [CrossRef] [Scilit]
- Barwinska, I.; Kopec, M.; Kukla, D.; Senderowski, C.; Kowalewski, Z. Thermal Barrier Coatings for High-Temperature Performance of Nickel-Based Superalloys: A Synthetic Review. Coatings 2023, 13, 769. [Google Scholar] [CrossRef] [Scilit]
- Nelson, W.A.; Orenstein, R.M. TBC Experience in Land-Based Gas Turbines. J. Therm. Spray Technol. 1997, 6, 176–180. [Google Scholar] [CrossRef] [Scilit]
- Ramasamy, N.; Kalam, M.A.; Varman, M.; Teoh, Y.H. Effect of Thermal Barrier Coating on the Performance and Emissions of Diesel Engine Operated with Conventional Diesel and Palm Oil Biodiesel. Coatings 2021, 11, 692. [Google Scholar] [CrossRef] [Scilit]
- Hegab, A.; Dahuwa, K.; Islam, R.; Cairns, A.; Khurana, A.; Shrestha, S.; Francis, R. Plasma Electrolytic Oxidation Thermal Barrier Coating for Reduced Heat Losses in IC Engines. Appl. Therm. Eng. 2021, 196, 117316. [Google Scholar] [CrossRef] [Scilit]
- Sanyal, S.; Park, S.; Chelliah, R.; Yeon, S.-J.; Barathikannan, K.; Vijayalakshmi, S.; Jeong, Y.-J.; Rubab, M.; Oh, D.H. Emerging Trends in Smart Self-Healing Coatings: A Focus on Micro/Nanocontainer Technologies for Enhanced Corrosion Protection. Coatings 2024, 14, 324. [Google Scholar] [CrossRef] [Scilit]
- Nieto, A.; Agrawal, R.; Bravo, L.; Hofmeister-Mock, C.; Pepi, M.; Ghoshal, A. Calcia–Magnesia–Alumina–Silicate (CMAS) Attack Mechanisms and Roadmap towards Sandphobic Thermal and Environmental Barrier Coatings. Int. Mater. Rev. 2021, 66, 451–492. [Google Scholar] [CrossRef] [Scilit]
- Li, H.; Yang, S.; Li, X.; Li, W. Failure Mechanisms and Surface Treatment Processes of Thermal Barrier Coatings: Review. Chin. J. Aeronaut. 2024, 37, 20–40. [Google Scholar] [CrossRef] [Scilit]
- Liu, B.-B.; Zhuo, X.-S.; Fan, J.-F.; Cai, Y.; Wei, Z.-Y.; Zhang, W.-W.; Xu, X.-F.; Wang, J.-F.; Sun, J.-X.; Wang, H.-L.; et al. Influence of Thermally Grown Oxide Dynamic Growth Mode and Creep Strength on the Delamination and Failure of Thermal Barrier Coatings in the Furnace Cycle. Coatings 2025, 15, 1251. [Google Scholar] [CrossRef] [Scilit]
- Chen, L.; Yueming, L. Interface Stress Evolution Considering the Combined Creep–Plastic Behavior in Thermal Barrier Coatings. Mater. Des. 2016, 89, 245–254. [Google Scholar] [CrossRef] [Scilit]
- Qin, S.; Gao, M.; Sui, Y.; Luan, S.; Zhang, C.; Li, S.; Xu, N.; Chang, X. Evolution of CMAS Corrosion Mechanism of Zirconia-Based Thermal Barrier Coatings. Mater. Today Commun. 2025, 42, 111489. [Google Scholar] [CrossRef] [Scilit]
- Yan, Z.; Guo, L.; Li, Z.; Yu, Y.; He, Q. Effects of Laser Glazing on CMAS Corrosion Behavior of Y2O3 Stabilized ZrO2 Thermal Barrier Coatings. Corros. Sci. 2019, 157, 450–461. [Google Scholar] [CrossRef] [Scilit]
- Gildersleeve, E.; Viswanathan, V.; Sampath, S. Molten Silicate Interactions with Plasma Sprayed Thermal Barrier Coatings: Role of Materials and Microstructure. J. Eur. Ceram. Soc. 2019, 39, 2122–2131. [Google Scholar] [CrossRef] [Scilit]
- Ahrens, M.; Lampenscherf, S.; Vaßen, R.; Stöver, D. Sintering and Creep Processes in Plasma-Sprayed Thermal Barrier Coatings. J. Therm. Spray Technol. 2004, 13, 432–442. [Google Scholar] [CrossRef] [Scilit]
- Chevalier, J.; Gremillard, L.; Virkar, A.V.; Clarke, D.R. The Tetragonal-Monoclinic Transformation in Zirconia: Lessons Learned and Future Trends. J. Am. Ceram. Soc. 2009, 92, 1901–1920. [Google Scholar] [CrossRef] [Scilit]
- Bhatnagar, H.; Ghosh, S.; Walter, M.E. Parametric Studies of Failure Mechanisms in Elastic EB-PVD Thermal Barrier Coatings Using FEM. Int. J. Solids Struct. 2006, 43, 4384–4406. [Google Scholar] [CrossRef] [Scilit]
- Parker, W.J.; Jenkins, R.J.; Butler, C.P.; Abbott, G.L. Flash Method of Determining Thermal Diffusivity, Heat Capacity, and Thermal Conductivity. J. Appl. Phys. 1961, 32, 1679–1684. [Google Scholar] [CrossRef] [Scilit]
- Yang, X.; Wang, X.; Fang, W.; Hu, G.; Liu, Y.; Tao, N.; Zhang, C. Pulsed Thermography with Laser Beam Homogenizing for Thickness Prediction of Thin Semi-Transparent Thermal Barrier Coatings. Opt. Lasers Eng. 2022, 158, 107182. [Google Scholar] [CrossRef] [Scilit]
- Maldague, X.; Marinetti, S. Pulse Phase Infrared Thermography. J. Appl. Phys. 1996, 79, 2694–2698. [Google Scholar] [CrossRef] [Scilit]
- Kumar, R.; Gupta, R. Estimation of Thermal Properties by Active Infrared Thermography: A Review. Infrared Phys. Technol. 2025, 150, 106037. [Google Scholar] [CrossRef] [Scilit]
- Guo, W.; Dong, L.; Wang, H.; Feng, F.; Xing, Z.; Ma, R.; Shao, H.; Gao, Z.; Wang, B.; Yang, J. Size Estimation of Coating Disbonds Using the First Derivative Images in Pulsed Thermography. Infrared Phys. Technol. 2020, 104, 103106. [Google Scholar] [CrossRef] [Scilit]
- Almond, D.P.; Angioni, S.L.; Pickering, S.G. Long Pulse Excitation Thermographic Non-Destructive Evaluation. NDT E Int. 2017, 87, 7–14. [Google Scholar] [CrossRef] [Scilit]
- Wang, Z.; Tian, G.; Meo, M.; Ciampa, F. Image Processing Based Quantitative Damage Evaluation in Composites with Long Pulse Thermography. NDT E Int. 2018, 99, 93–104. [Google Scholar] [CrossRef] [Scilit]
- Zarezadeh-Mehrizi, M.A.; Farahani, M.; Safarabadi, M.; Rezaee Hajideh, M. Debonding Defect Detection in TBC Structures with Different Coating Thicknesses by Pulse and Long-Pulse Thermography: A Comparative Study. J. Adhes. Sci. Technol. 2026, 1–28. [Google Scholar] [CrossRef] [Scilit]
- Tromaras, A.; Kappatos, V. Exploring Step-Heating and Lock-In Thermography NDT Using One-Sided Inspection on Low-Emissivity Composite Structures for New Rail Carbodies. Sensors 2022, 22, 8195. [Google Scholar] [CrossRef] [Scilit] [PubMed]
- Jena, P.; Gupta, R. Simultaneous Estimation of Multiple Thermal Properties Using Single-Sided Step Heating Thermography. Infrared Phys. Technol. 2021, 115, 103726. [Google Scholar] [CrossRef] [Scilit]
- Zhuo, L.; Yang, X.; Zhu, J.; Huang, Z.; Chao, J.; Xie, W. Size Determination of Interior Defects by Reconstruction of Subsurface Virtual Heat Flux for Step Heating Thermography. NDT E Int. 2023, 133, 102734. [Google Scholar] [CrossRef] [Scilit]
- Chen, F.; Zhang, K.; Jiang, H.; Shen, Z.; Chen, L. Modulated Step-Heating Thermography for Coating Thickness Measurement. NDT E Int. 2024, 145, 103140. [Google Scholar] [CrossRef] [Scilit]
- Balageas, D.L.; Roche, J.-M. Common Tools for Quantitative Time-Resolved Pulse and Step-Heating Thermography–Part I: Theoretical Basis. Quant. InfraRed Thermogr. J. 2014, 11, 43–56. [Google Scholar] [CrossRef] [Scilit]
- Busse, G.; Wu, D.; Karpen, W. Thermal Wave Imaging with Phase Sensitive Modulated Thermography. J. Appl. Phys. 1992, 71, 3962–3965. [Google Scholar] [CrossRef] [Scilit]
- Luo, Z.; Wang, H.; Huang, Y.; Shen, P.; Zheng, E.; Zhang, H. Nondestructive Detection of CFRP Subsurface Defects Using Transient Lock-in Thermography. J. Therm. Anal. Calorim. 2025, 150, 8229–8239. [Google Scholar] [CrossRef] [Scilit]
- Shrestha, R.; Kim, W. Evaluation of Coating Thickness by Thermal Wave Imaging: A Comparative Study of Pulsed and Lock-in Infrared Thermography–Part II: Experimental Investigation. Infrared Phys. Technol. 2018, 92, 24–29. [Google Scholar] [CrossRef] [Scilit]
- Luo, Z.; Zhu, J.; Chen, F.; Wang, F.; Yan, D.; Shen, P.; Zheng, E.; Zhang, H. An Improved Transient Lock-in Thermography Integrating Alpha Blending Strategy for Automatic Enhancement Recognition of TBC Debonding Defects. J. Therm. Anal. Calorim. 2025, 150, 8207–8227. [Google Scholar] [CrossRef] [Scilit]
- Ma, B.; Sun, S.; Zhang, L. Quantitative Depth Estimation in Lock-In Thermography: Modeling and Correction of Lateral Heat Conduction Effects. Materials 2025, 18, 5247. [Google Scholar] [CrossRef] [Scilit] [PubMed]
- Tang, Q.-J.; Zhang, T.; Gu, Z.-Y.; Bu, C.-W. Infrared Thermal Wave Detection of Interfacial Debonding Defects of Thermal Barrier Coatings Based on Non-Linear Frequency Modulation. Therm. Sci. 2023, 27, 705–711. [Google Scholar] [CrossRef] [Scilit]
- Mulaveesala, R.; Tuli, S. Theory of Frequency Modulated Thermal Wave Imaging for Nondestructive Subsurface Defect Detection. Appl. Phys. Lett. 2006, 89, 191913. [Google Scholar] [CrossRef] [Scilit]
- Chatterjee, K.; Tuli, S.; Pickering, S.G.; Almond, D.P. A Comparison of the Pulsed, Lock-in and Frequency Modulated Thermography Nondestructive Evaluation Techniques. NDT E Int. 2011, 44, 655–667. [Google Scholar] [CrossRef] [Scilit]
- Mulaveesala, R.; Tuli, S. Digitized Frequency Modulated Thermal Wave Imaging for Nondestructive Testing. Mater. Eval. 2005, 63, 1046–1050. [Google Scholar]
- Chatterjee, K.; Roy, D.; Tuli, S. A Novel Pulse Compression Algorithm for Frequency Modulated Active Thermography Using Band-Pass Filter. Infrared Phys. Technol. 2017, 82, 75–84. [Google Scholar] [CrossRef] [Scilit]
- Gong, J.; Liu, J.; Yu, Y.; Zheng, Y. Multi-Characteristic Combination Based Reliability Enhancement of Optical Bidirectional Thermal Wave Radar Imaging for GFRP Laminates with Subsurface Defects. NDT E Int. 2021, 119, 102415. [Google Scholar] [CrossRef] [Scilit]
- Li, T.; Almond, D.P.; Rees, D.A.S. Crack Imaging by Scanning Pulsed Laser Spot Thermography. NDT E Int. 2011, 44, 216–225. [Google Scholar] [CrossRef] [Scilit]
- Nies, D.; Pulz, R.; Glaubitz, S.; Finn, M.; Rehmer, B.; Skrotzki, B. Testing of Thermal Barrier Coatings by Laser Excitation. Adv. Eng. Mater. 2010, 12, 1224–1229. [Google Scholar] [CrossRef] [Scilit]
- Liu, Z.; Jiao, D.; Shi, W.; Xie, H. Linear Laser Fast Scanning Thermography NDT for Artificial Disbond Defects in Thermal Barrier Coatings. Opt. Express 2017, 25, 31789–31800. [Google Scholar] [CrossRef] [Scilit] [PubMed]
- Jiao, D.-C.; Liu, Z.-W.; Zhu, W.-Y.; Xie, H.-M. Exact Localization of Debonding Defects in Thermal Barrier Coatings. AIAA J. 2018, 56, 3691–3700. [Google Scholar] [CrossRef] [Scilit]
- Ibarra-Castanedo, C.; Genest, M.; Piau, J.-M.; Guibert, S.; Bendada, A.; Maldague, X.P.V. Active Infrared Thermography Techniques for the Nondestructive Testing of Materials. In Ultrasonic and Advanced Methods for Nondestructive Testing and Material Characterization; World Scientific: Singapore, 2007; pp. 325–348. ISBN 978-981-270-409-2. [Google Scholar]
- Shepard, S.M.; Ahmed, T.; Lhota, J.R. Experimental Considerations in Vibrothermography. Proc. SPIE 2004, 5405, 332–335. [Google Scholar] [CrossRef] [Scilit]
- Renshaw, J.; Holland, S.D.; Thompson, R.B.; Uhl, C. The Effect of Crack Closure on Heat Generation in Vibrothermography. AIP Conf. Proc. 2009, 1096, 473–480. [Google Scholar] [CrossRef] [Scilit]
- Holland, S.D.; Uhl, C.; Ouyang, Z.; Bantel, T.; Li, M.; Meeker, W.Q.; Lively, J.; Brasche, L.; Eisenmann, D. Quantifying the Vibrothermographic Effect. NDT E Int. 2011, 44, 775–782. [Google Scholar] [CrossRef] [Scilit]
- Solodov, I.; Bai, J.; Bekgulyan, S.; Busse, G. A Local Defect Resonance to Enhance Acoustic Wave-Defect Interaction in Ultrasonic Nondestructive Evaluation. Appl. Phys. Lett. 2011, 99, 211911. [Google Scholar] [CrossRef] [Scilit]
- Solodov, I.; Rahammer, M.; Gulnizkij, N.; Kreutzbruck, M. Noncontact Sonic NDE and Defect Imaging Via Local Defect Resonance. J. Nondestruct. Eval. 2016, 35, 48. [Google Scholar] [CrossRef] [Scilit]
- Rahammer, M.; Kreutzbruck, M. Fourier-Transform Vibrothermography with Frequency Sweep Excitation Utilizing Local Defect Resonances. NDT E Int. 2017, 86, 83–88. [Google Scholar] [CrossRef] [Scilit]
- Fierro, G.P.M.; Ginzburg, D.; Ciampa, F.; Meo, M. Imaging of Barely Visible Impact Damage on a Complex Composite Stiffened Panel Using a Nonlinear Ultrasound Stimulated Thermography Approach. J. Nondestruct. Eval. 2017, 36, 69. [Google Scholar] [CrossRef] [Scilit]
- Fierro, G.P.M.; Calla’, D.; Ginzburg, D.; Ciampa, F.; Meo, M. Nonlinear Ultrasonic Stimulated Thermography for Damage Assessment in Isotropic Fatigued Structures. J. Sound Vib. 2017, 404, 102–115. [Google Scholar] [CrossRef] [Scilit]
- Zhu, W.; Liu, Z.; Jiao, D.; Xie, H. Eddy Current Thermography with Adaptive Carrier Algorithm for Non-Destructive Testing of Debonding Defects in Thermal Barrier Coatings. J. Nondestruct. Eval. 2018, 37, 31. [Google Scholar] [CrossRef] [Scilit]
- Riegert, G.; Gleiter, A.; Busse, G. Potential and Limitations of Eddy Current Lockin-Thermography. Proc. SPIE 2006, 6205, 62051E. [Google Scholar] [CrossRef] [Scilit]
- Tu, Y.; Tang, Z.; Qiu, Y.; Wang, B. Microwave Thermal Imaging System for Debonding Detection of Radar Absorbing Materials. Rev. Sci. Instrum. 2025, 96, 014704. [Google Scholar] [CrossRef] [Scilit] [PubMed]
- Wilcox, L.M.; Hook, A.; Bohannon, E.T.; Donnell, K.M. Active Microwave-Thermographic Signal Reconstruction with Adaptive Polynomial Regression. IEEE Open J. Instrum. Meas. 2025, 4, 1–11. [Google Scholar] [CrossRef] [Scilit]
- Yin, A.; Gao, B.; Yun Tian, G.; Woo, W.L.; Li, K. Physical Interpretation and Separation of Eddy Current Pulsed Thermography. J. Appl. Phys. 2013, 113, 064101. [Google Scholar] [CrossRef] [Scilit]
- Weekes, B.; Almond, D.P.; Cawley, P.; Barden, T. Eddy-Current Induced Thermography—Probability of Detection Study of Small Fatigue Cracks in Steel, Titanium and Nickel-Based Superalloy. NDT E Int. 2012, 49, 47–56. [Google Scholar] [CrossRef] [Scilit]
- Li, Z.; Wang, P.; Haigh, A.; Soutis, C.; Gibson, A. Review of Microwave Techniques Used in the Manufacture and Fault Detection of Aircraft Composites. Aeronaut. J. 2021, 125, 151–179. [Google Scholar] [CrossRef] [Scilit]
- Zou, X.; Sneed, L.H.; Mirala, A.; Al Qaseer, M.T.; Donnell, K. Debonding Detection of Defected CFRP-Concrete Interface Using Active Microwave Thermography. Compos. Struct. 2023, 310, 116753. [Google Scholar] [CrossRef] [Scilit]
- Mirala, A.; Foudazi, A.; Ghasr, M.T.; Donnell, K.M. Detection of Flat-Bottom Holes in Conductive Composites Using Active Microwave Thermography. J. Nondestruct. Eval. Diagn. Progn. Eng. Syst. 2018, 1, 041005–041005-7. [Google Scholar] [CrossRef] [Scilit]
- Zhang, H.; Gao, B.; Tian, G.Y.; Woo, W.L.; Bai, L. Metal Defects Sizing and Detection under Thick Coating Using Microwave NDT. NDT E Int. 2013, 60, 52–61. [Google Scholar] [CrossRef] [Scilit]
- He, H.; Zhao, Y.; Lu, B.; He, Y.; Shen, G.; He, Z.; Wang, H. Detection of Debonding Defects Between Radar Absorbing Material and CFRP Substrate by Microwave Thermography. IEEE Sens. J. 2022, 22, 4378–4385. [Google Scholar] [CrossRef] [Scilit]
- Thakare, J.G.; Mulik, R.S.; Mahapatra, M.M. Effect of Carbon Nanotubes and Aluminum Oxide on the Properties of a Plasma Sprayed Thermal Barrier Coating. Ceram. Int. 2018, 44, 438–451. [Google Scholar] [CrossRef] [Scilit]
- Singh, P.; Islam, A.; Pandit, N.; Indupuri, S.; Rahman, O.S.A.; Pandey, S.M.; Keshri, A.K. Plasma Sprayed Graphene/Carbon Nanotube Reinforced Lanthanum-Cerate Hybrid Composite Coating. Ceram. Int. 2023, 49, 11167–11177. [Google Scholar] [CrossRef] [Scilit]
- Pinto, F.; Ciampa, F.; Polimeno, U.; Meo, M. In Situ Damage Detection in SMA Reinforced CFRP. Proc. SPIE 2012, 8345, 83452V. [Google Scholar] [CrossRef] [Scilit]
- Khor, W.; Ravindran, A.R.; Ladani, R.B.; Limprapuwiwattana, M.; Whitton, P.; Meeks, C.; Foreman, A.D.; Ciampa, F. Material-Enabled Damage Inspection of Multifunctional Shape Memory Alloy Tufted Composite T-Joints. NDT E Int. 2024, 142, 103002. [Google Scholar] [CrossRef] [Scilit]
- Defanti, S.; De Giorgi, S.; Rizza, G.; Colombini, G.; Denti, L.; Galati, M. Detection of Sub-Superficial Defects by Infrared Thermography in Parts Made by Powder Bed Fusion with Electron Beam. Prog. Addit. Manuf. 2025, 10, 10533–10547. [Google Scholar] [CrossRef] [Scilit]
- Sakagami, T.; Ogura, K. New Flaw Inspection Technique Based on Infrared Thermal Images under Joule Effect Heating. JSME Int. J. Ser. A Mech. Mater. Eng. 1994, 37, 380–388. [Google Scholar] [CrossRef] [Scilit] [PubMed]
- Wiśniewska, M.; Kubicki, G.; Marczewski, M.; Leshchynsky, V.; Celotti, L.; Szybowicz, M.; Garbiec, D. Aerosol-Deposited 8YSZ Coating for Thermal Shielding of 3YSZ/CNT Composites. Coatings 2024, 14, 1186. [Google Scholar] [CrossRef] [Scilit]
- Adnan, L.H.K.; Tanim, M.I.A.; Saif, S.S.; Talukder, C.; Haque, K.; Jahan, N.; Hossain, M.M.; Uddin, M.M.; Rana, T.H.; Ali, M.A. DFT-Based Assessment of M3AlB2 (M = V, Nb, Mo, Hf) MAX Phases for TBC Applications. Appl. Mater. Today 2026, 50, 103219. [Google Scholar] [CrossRef] [Scilit]
- Kim, B.; Lu, Y.; Kim, T.; Han, J.-W.; Meyyappan, M.; Li, J. Carbon Nanotube Coated Paper Sensor for Damage Diagnosis. ACS Nano 2014, 8, 12092–12097. [Google Scholar] [CrossRef] [Scilit] [PubMed]
- Zhao, S.; Zhang, C.; Wu, N.; Wang, H. Quality Evaluation for Air Plasma Spray Thermal Barrier Coatings with Pulsed Thermography. Prog. Nat. Sci. Mater. Int. 2011, 21, 301–306. [Google Scholar] [CrossRef] [Scilit]
- Kunji Purayil, S.K.; Balasubramaniam, K. Data-Driven AI for the Automated Classification of the Isothermal Heat-Treated Thermal Barrier Coatings Using Pulsed Infrared Thermography. J. Phys. D Appl. Phys. 2024, 58, 045306. [Google Scholar] [CrossRef] [Scilit]
- Zhu, W.; Li, Z.Y.; Yang, L.; Zhou, Y.C.; Wei, J.F. Real-Time Detection of CMAS Corrosion Failure in APS Thermal Barrier Coatings Under Thermal Shock. Exp. Mech. 2020, 60, 775–785. [Google Scholar] [CrossRef] [Scilit]
- Sun, J.G.; Kulkarni, A.; Fry, A.T. Pulsed Thermal Imaging for Non-Destructive Evaluation of Hot Gas Path Coatings in Gas Turbines. Mater. High Temp. 2024, 41, 557–571. [Google Scholar] [CrossRef] [Scilit]
- Zhao, Y.; Feng, H.; Lou, W.; Li, L.; Wang, Q.; Ding, G.; Zhang, C. Intelligent Temperature Measuring Thermal Spray Multilayer Thermal Barrier Coatings Based on Embedded Thin Film Thermocouples. J. Colloid Interface Sci. 2025, 680, 1042–1052. [Google Scholar] [CrossRef] [Scilit] [PubMed]
- Peng, D.; Yang, L.; Cai, T.; Liu, Y.; Zhao, X.; Yao, Z. Phosphor-Doped Thermal Barrier Coatings Deposited by Air Plasma Spray for In-Depth Temperature Sensing. Sensors 2016, 16, 1490. [Google Scholar] [CrossRef] [Scilit] [PubMed]
- Chen, Y.; Zhang, X.; Van Der Zwaag, S.; Sloof, W.G.; Xiao, P. Damage Evolution in a Self-healing Air Plasma Sprayed Thermal Barrier Coating Containing Self-shielding MoSi2 Particles. J. Am. Ceram. Soc. 2019, 102, 4899–4910. [Google Scholar] [CrossRef] [Scilit]
- Cernuschi, F.; Kulczyk-Malecka, J.; Zhang, X.; Nozahic, F.; Estournès, C.; Sloof, W.G. Thermal Conductivity of Binary Ceramic Composites Made of Insulating and Conducting Materials Comprising Full Composition Range–Applied to Yttria Partially Stabilized Zirconia and Molybdenum Disilicide. J. Eur. Ceram. Soc. 2023, 43, 6296–6307. [Google Scholar] [CrossRef] [Scilit]
- Li, M.; Holland, S.D.; Meeker, W.Q. Quantitative Multi-Inspection-Site Comparison of Probability of Detection for Vibrothermography Nondestructive Evaluation Data. J. Nondestruct. Eval. 2011, 30, 172–178. [Google Scholar] [CrossRef] [Scilit]
- Liu, H.; Sakamoto, M.; Kishi, K.; Shobu, K.; Tabaru, T.; Tateyama, H.; Akimune, Y. Detection of Defects in Thermal Barrier Coatings by Thermography Analyses. Mater. Trans. 2003, 44, 1845–1850. [Google Scholar] [CrossRef] [Scilit]
- Sun, J.G.; Tao, N. Thermal Property Measurement for Thermal Barrier Coatings Using Pulsed Thermal Imaging–Multilayer Analysis Method. AIP Conf. Proc. 2016, 1706, 100004. [Google Scholar] [CrossRef] [Scilit]
- Archer, T.; Beauchêne, P.; Passilly, B.; Roche, J.-M. Use of Laser Spot Thermography for the Non-Destructive Imaging of Thermal Fatigue Microcracking of a Coated Ceramic Matrix Composite. Quant. InfraRed Thermogr. J. 2021, 18, 141–158. [Google Scholar] [CrossRef] [Scilit]
- Puthiyaveettil, N.; Rajagopal, P.; Balasubramaniam, K. Influence of Absorptivity of the Material Surface in Crack Detection Using Laser Spot Thermography. NDT E Int. 2021, 120, 102438. [Google Scholar] [CrossRef] [Scilit]
- Pech-May, N.W.; Oleaga, A.; Mendioroz, A.; Salazar, A. Fast Characterization of the Width of Vertical Cracks Using Pulsed Laser Spot Infrared Thermography. J. Nondestruct. Eval. 2016, 35, 22. [Google Scholar] [CrossRef] [Scilit]
- Liu, B.; Chen, H.-E.; Wang, R.; Yang, Y.; Liu, H.; Pei, C.; Chen, Z. Non-Destructive Testing of Debonding Defects in Thermal Barrier Coating System Using Laser Infrared Thermography. Proc. SPIE 2023, 12550, 125501R. [Google Scholar] [CrossRef] [Scilit]
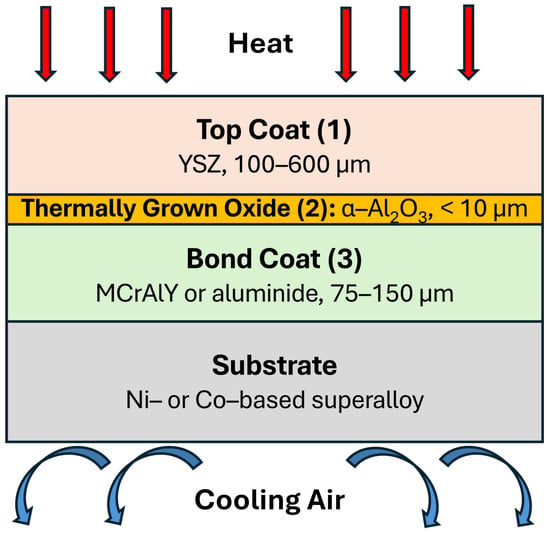
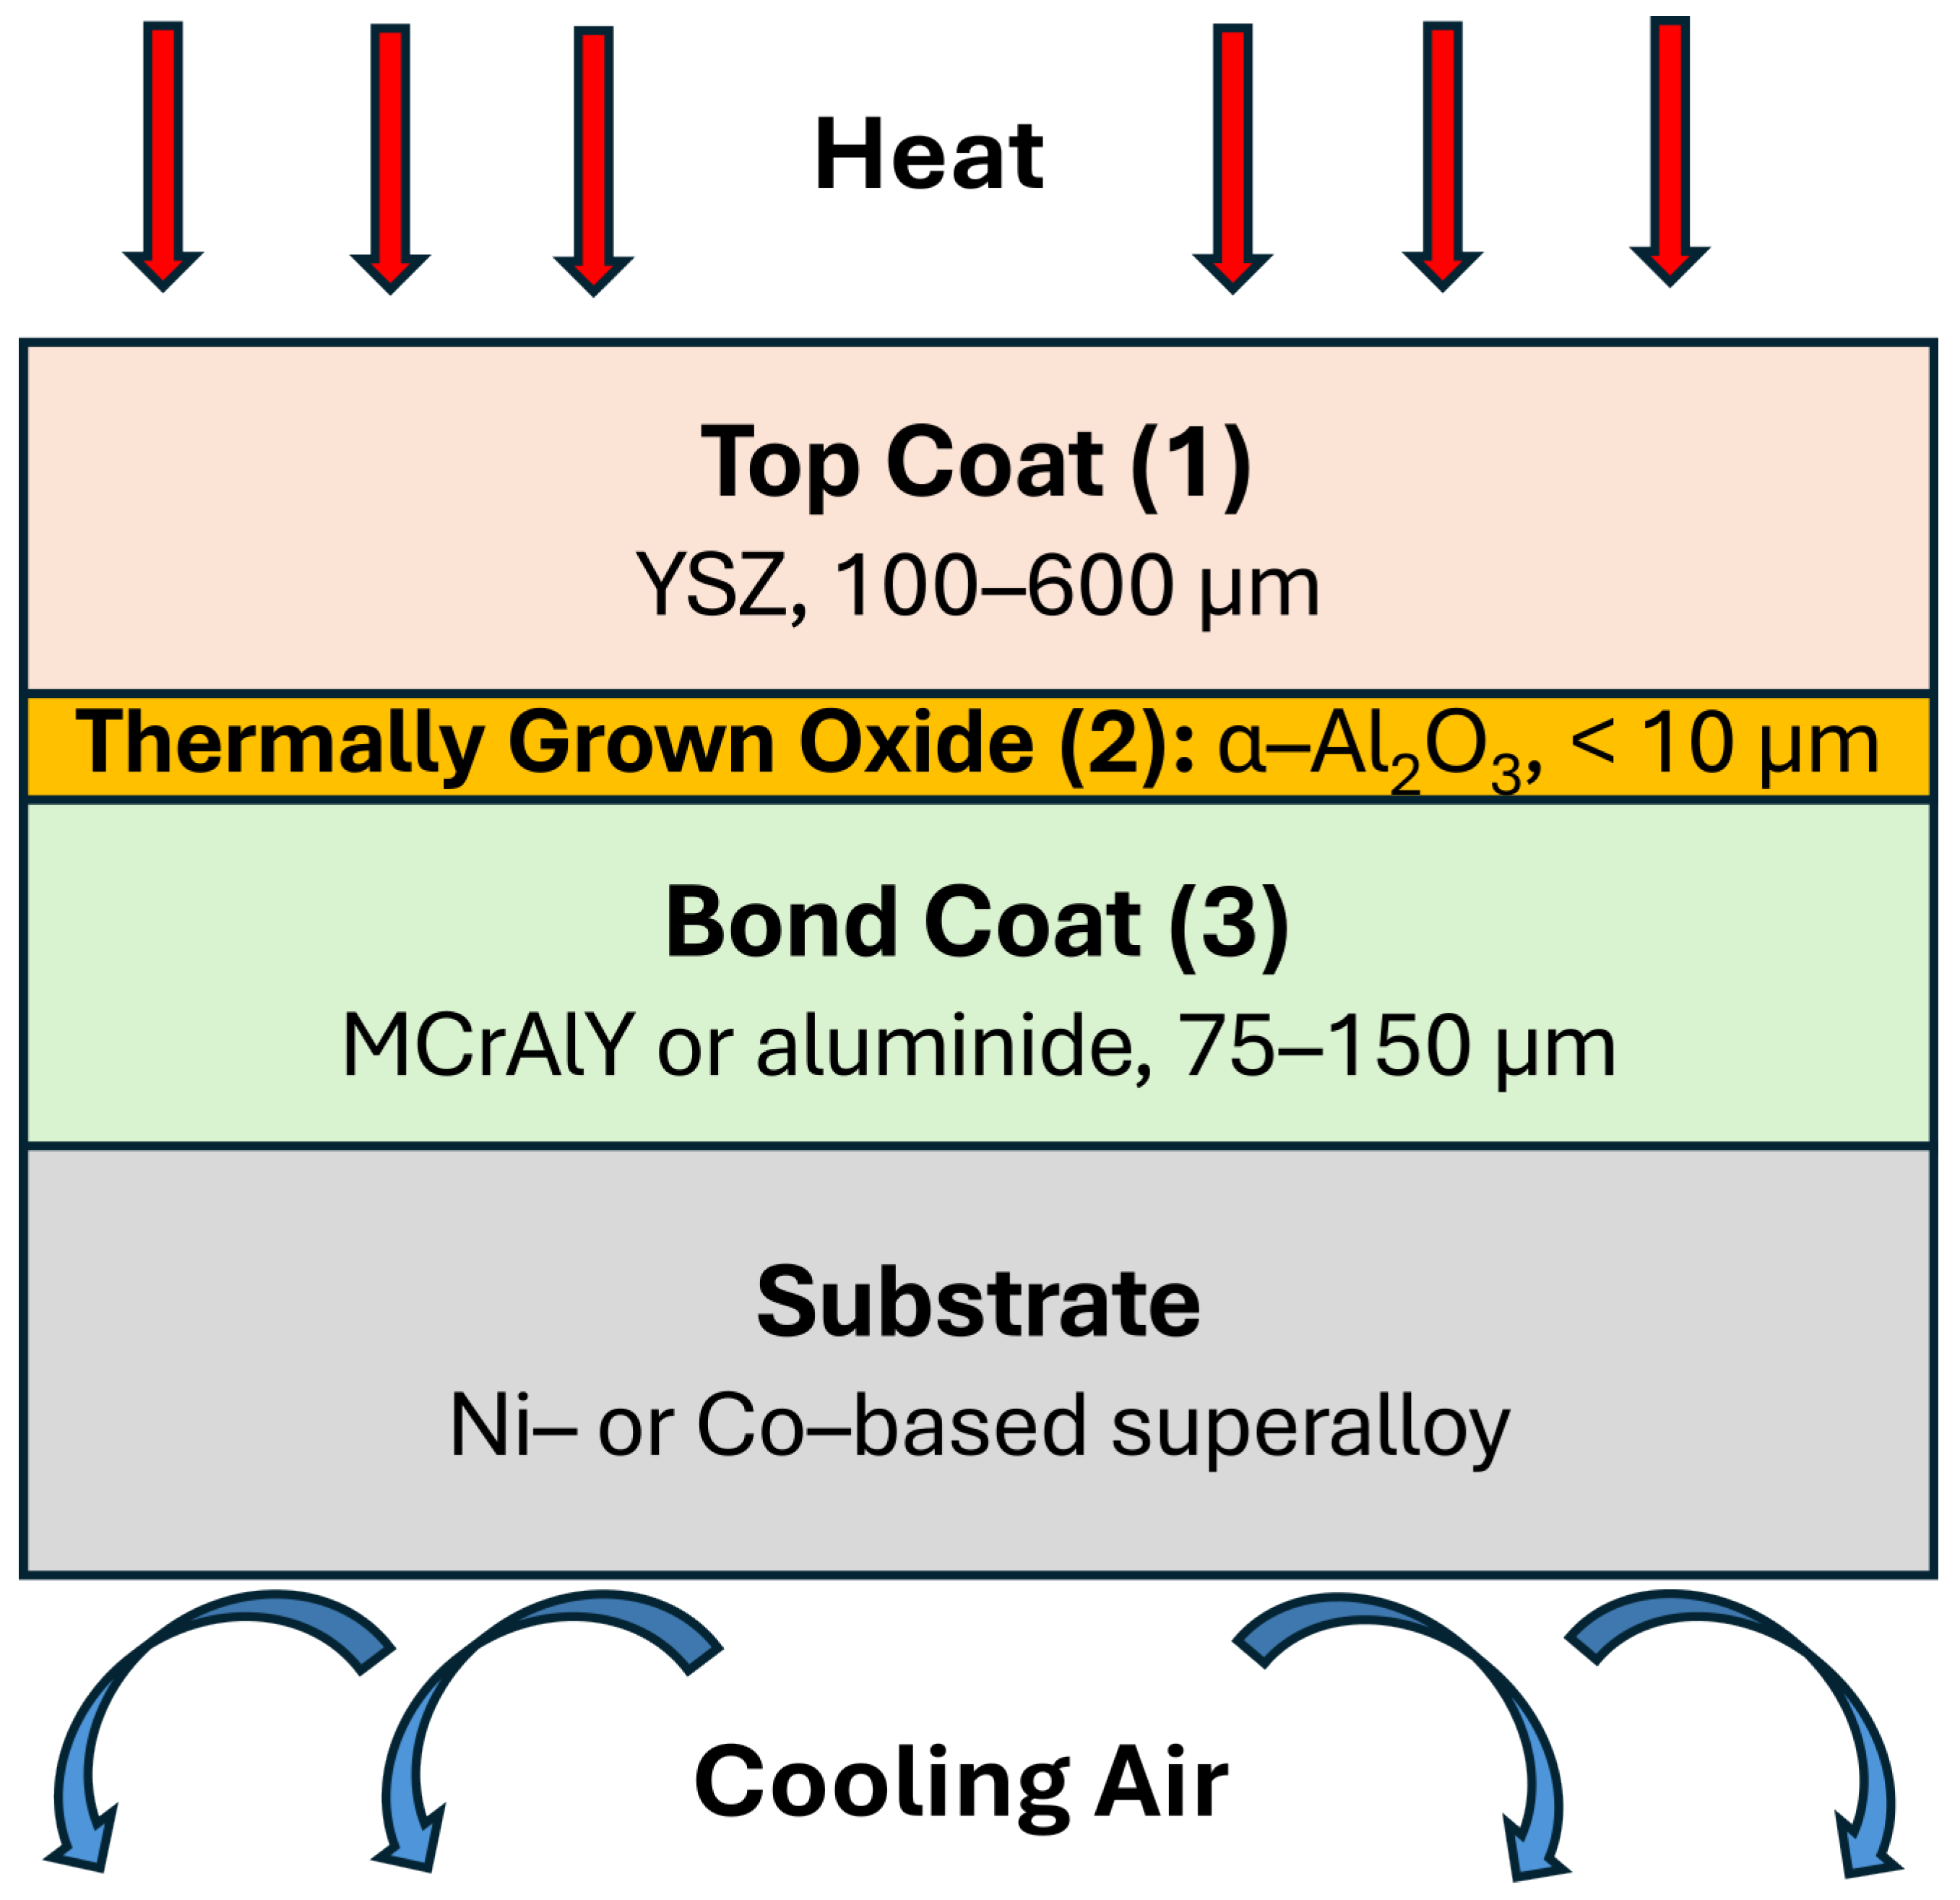
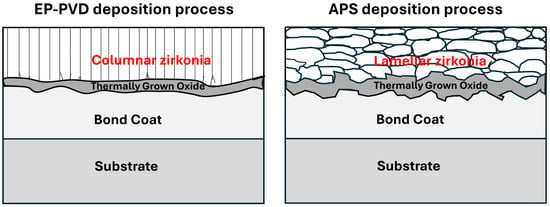
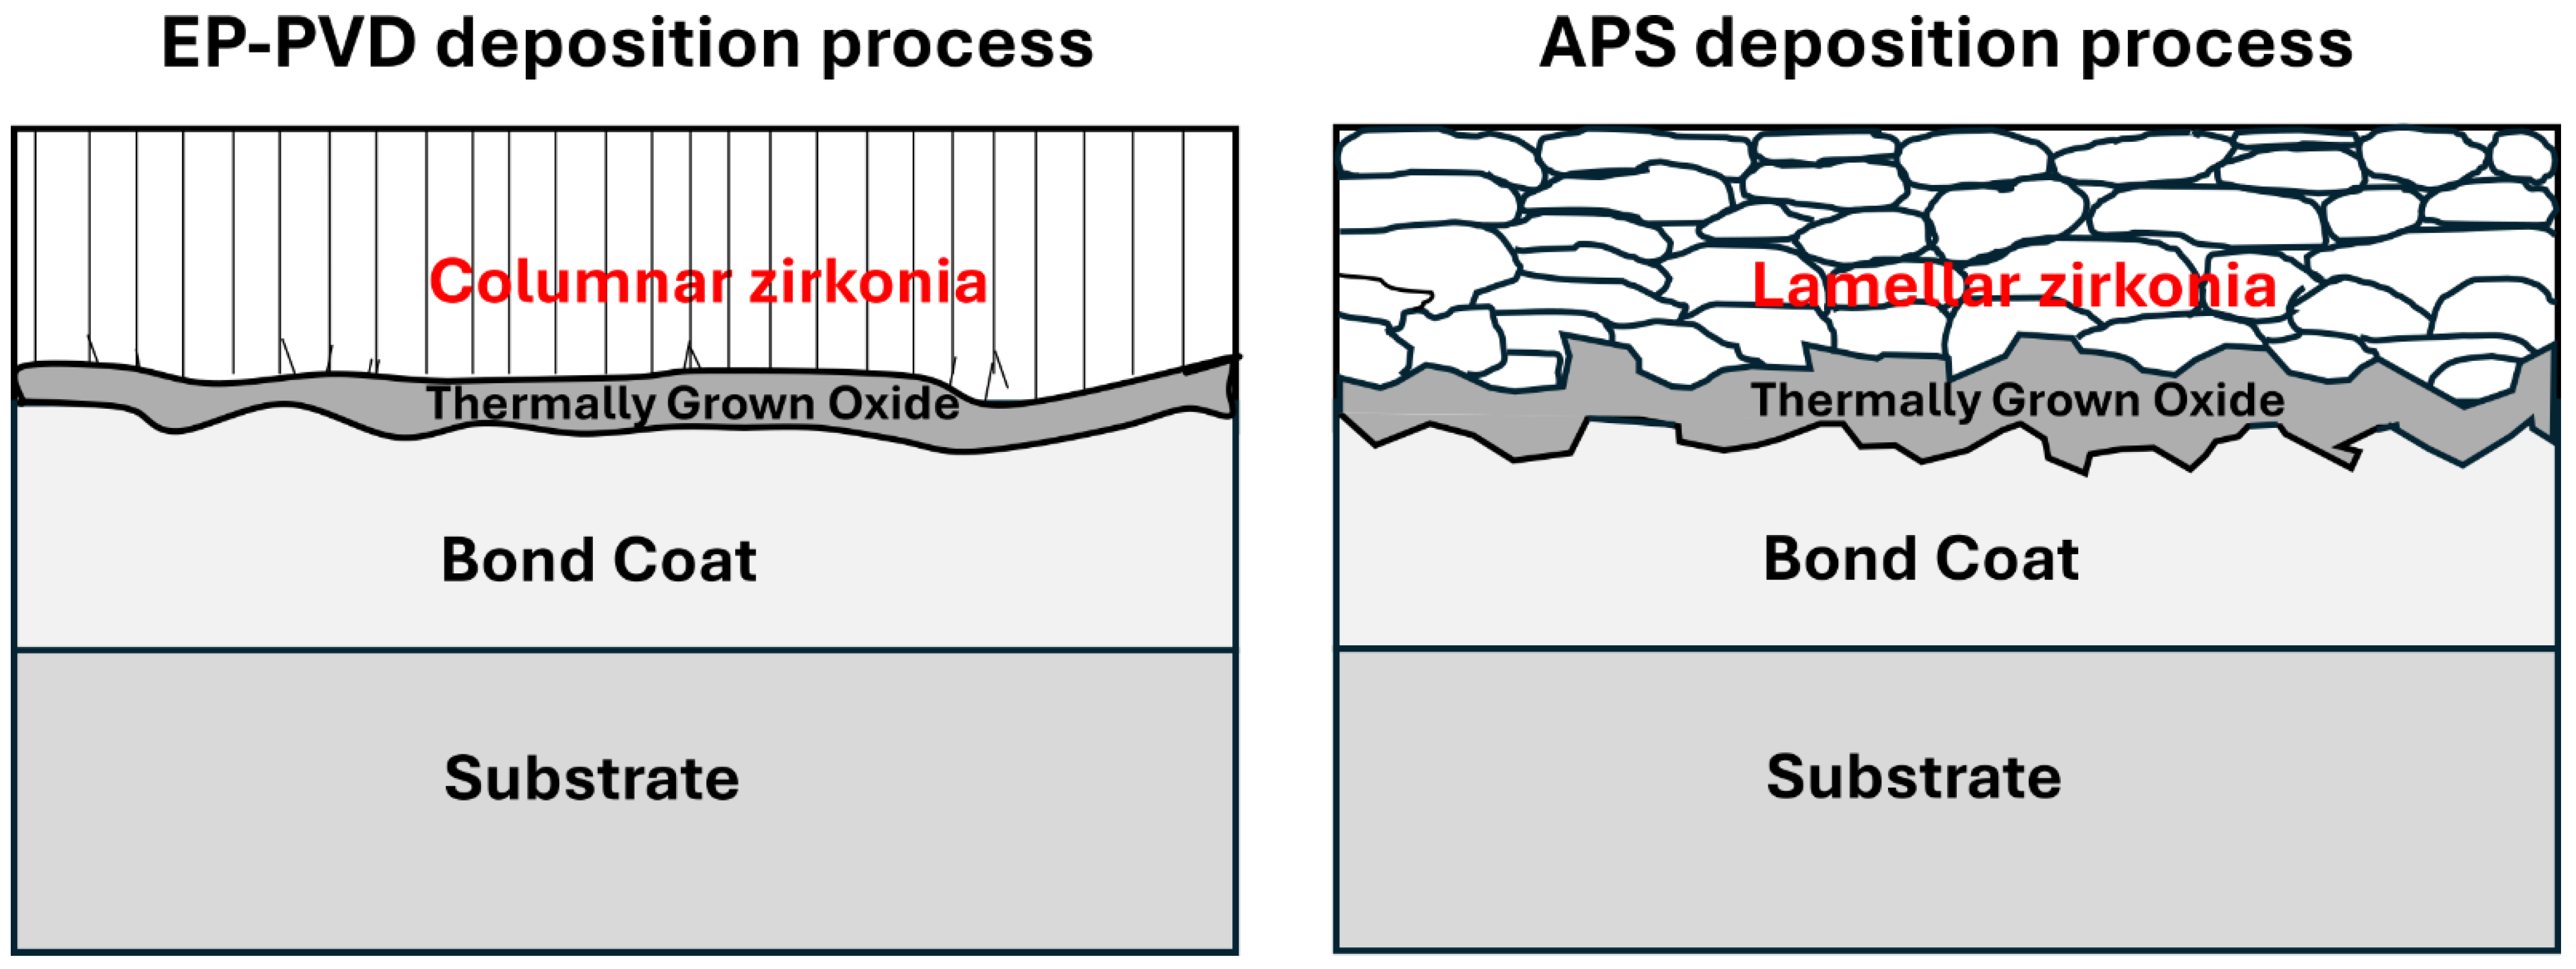
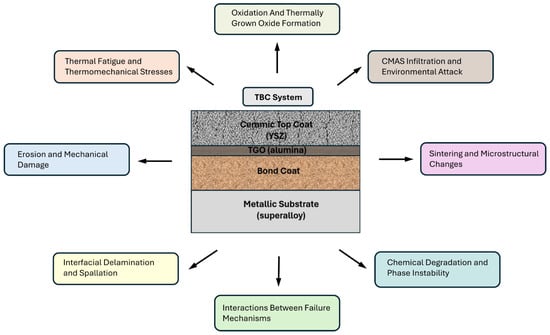
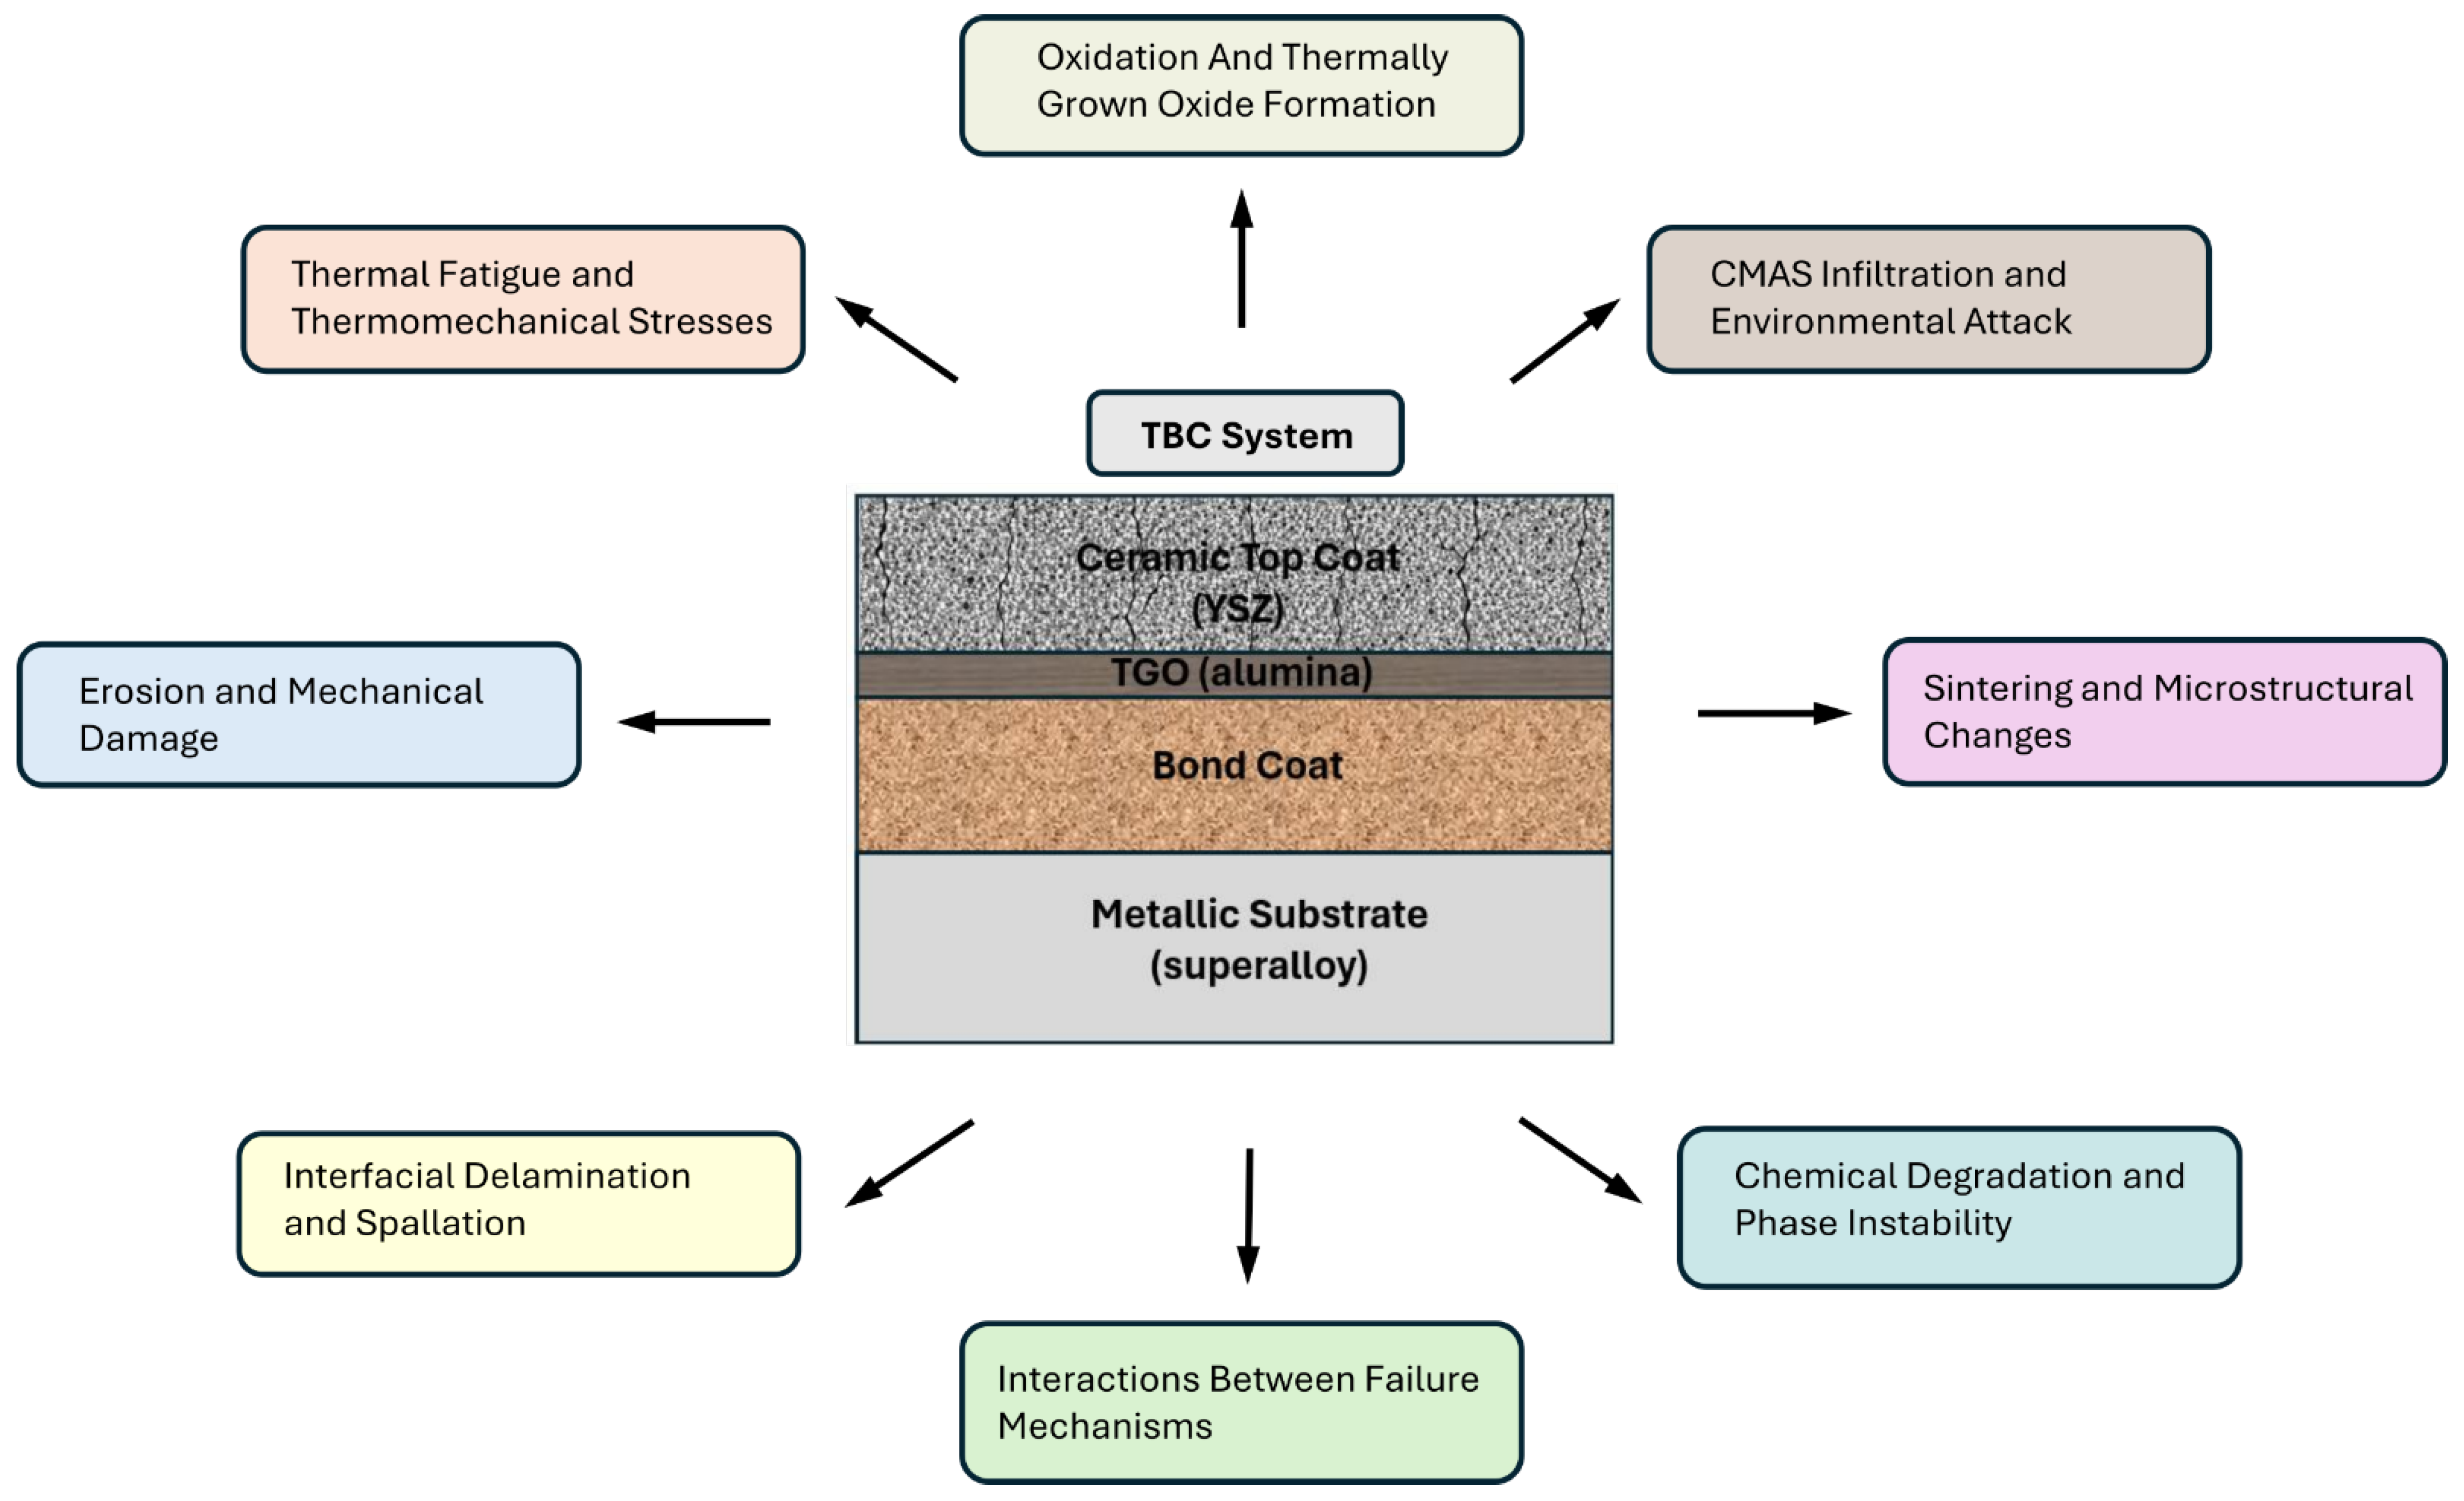
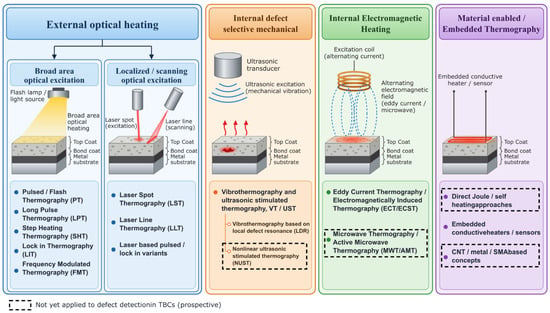
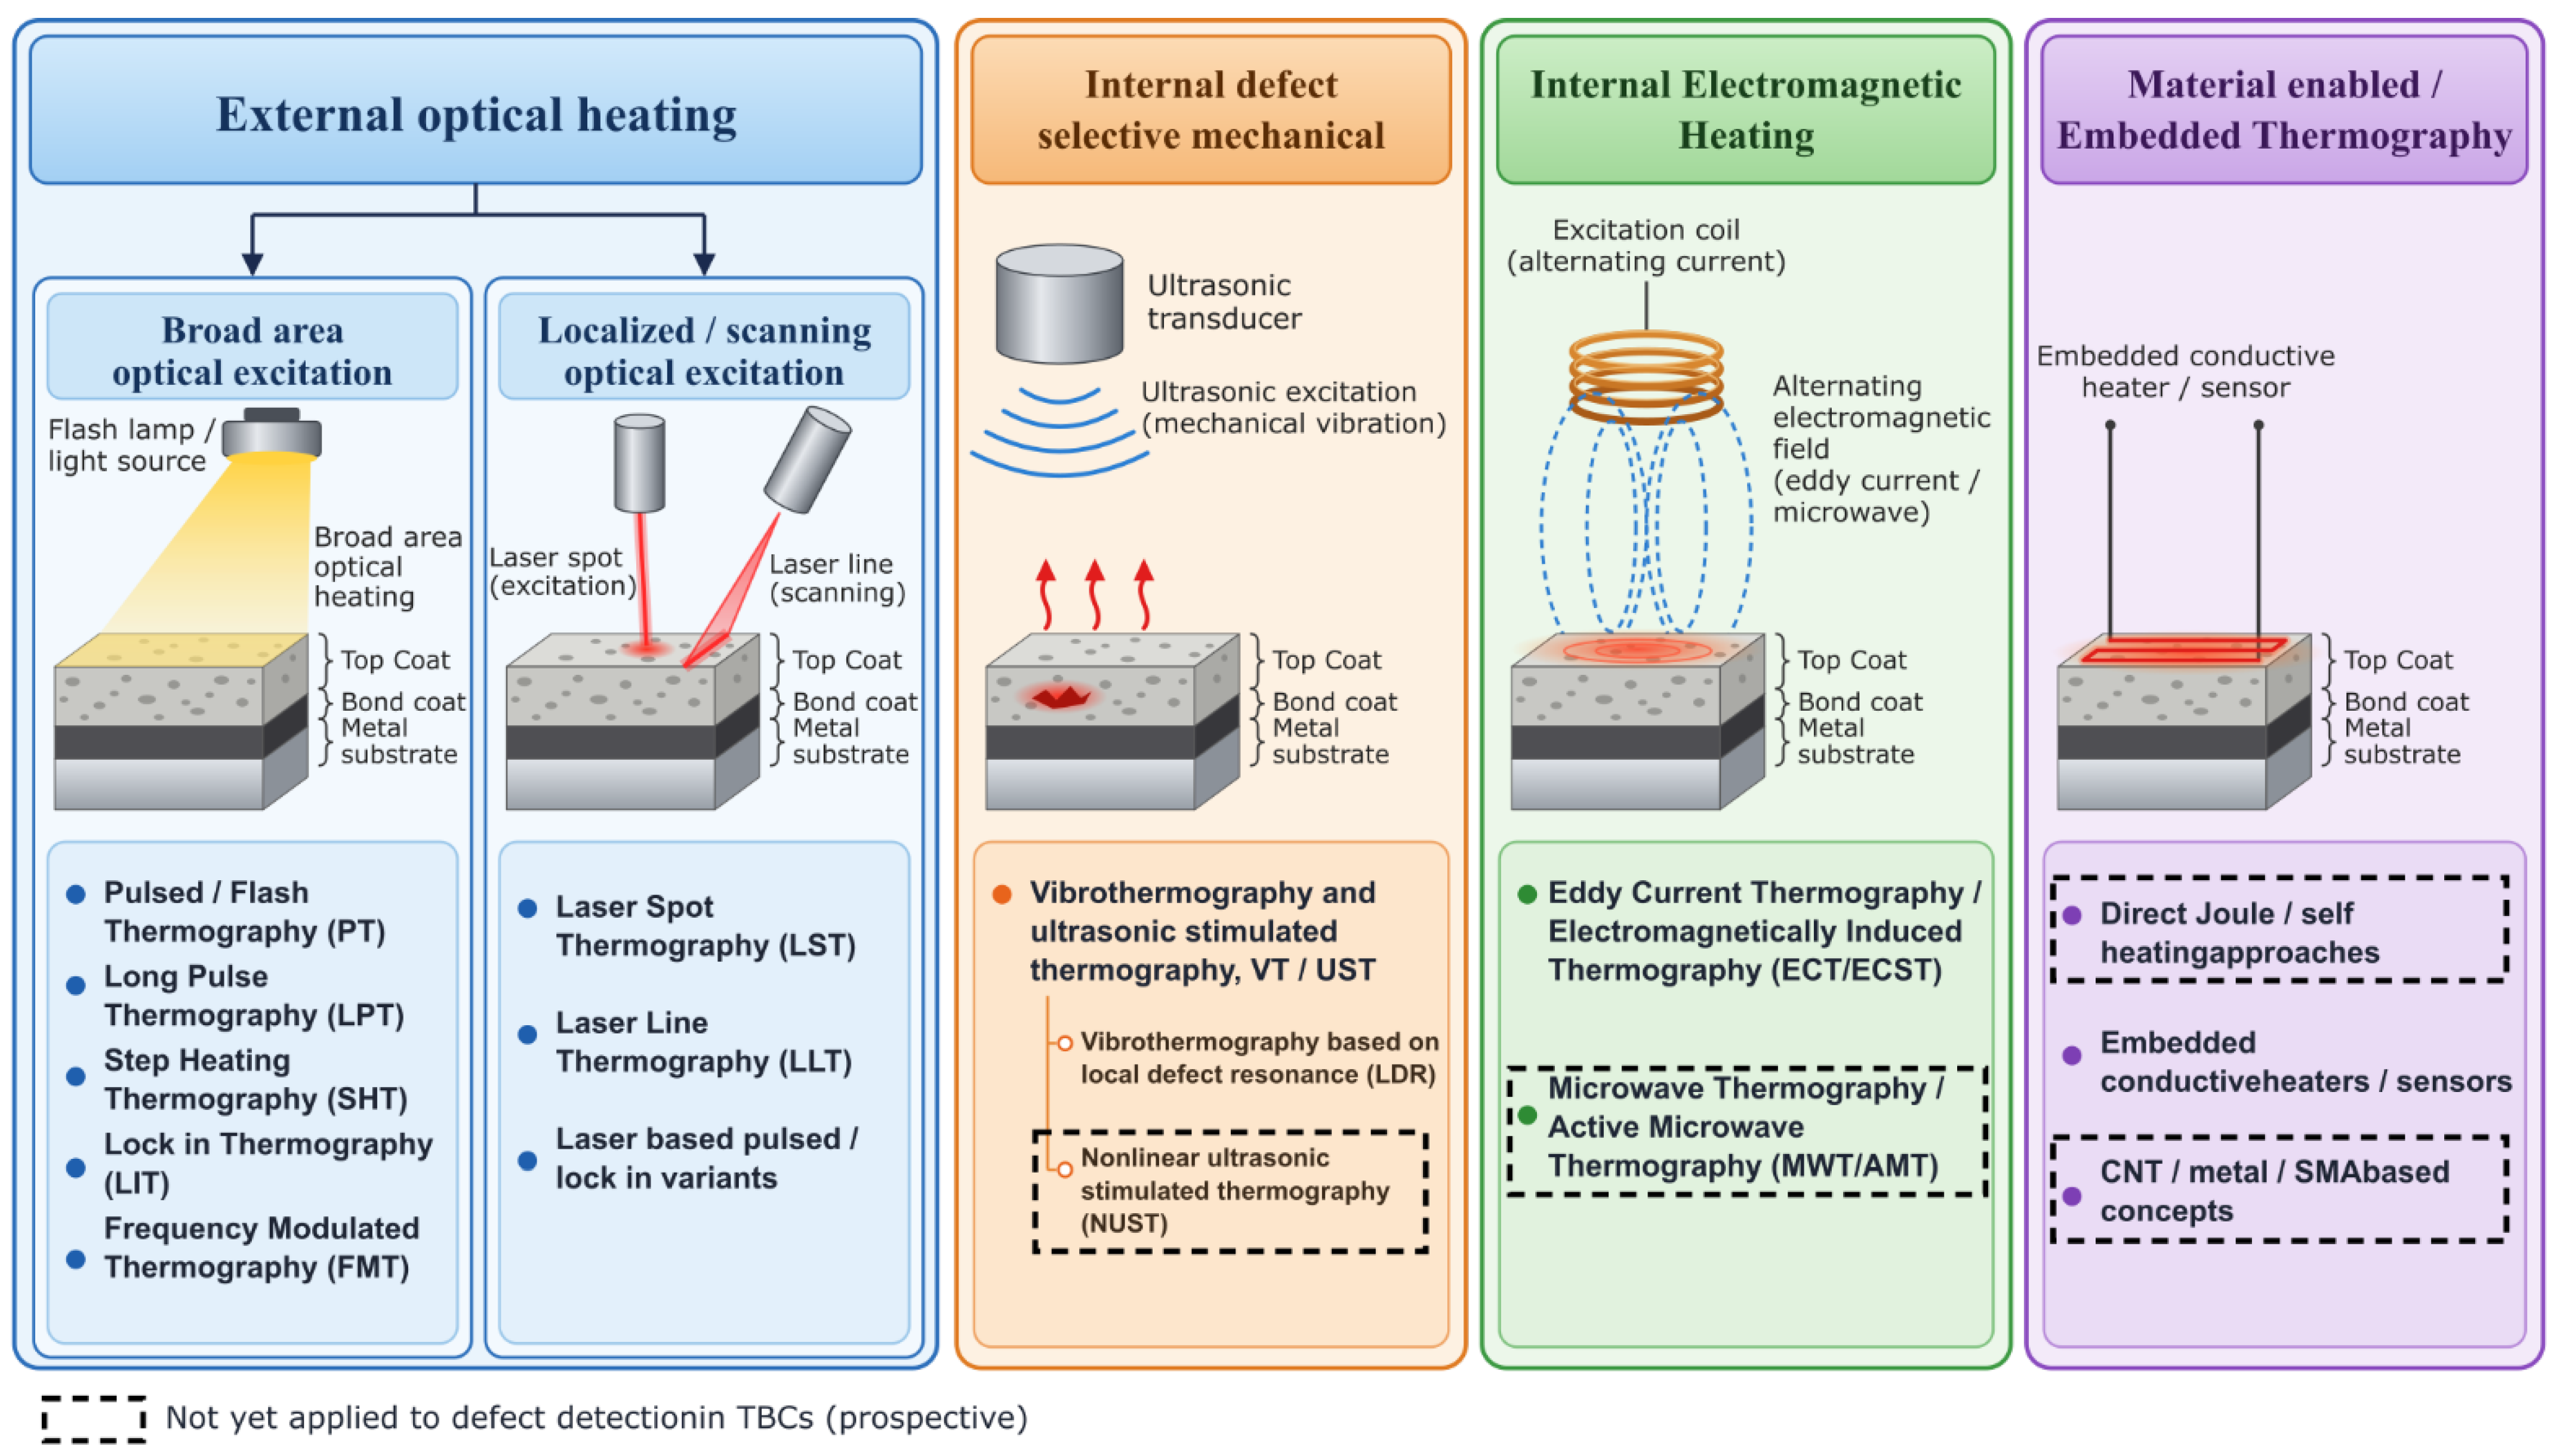
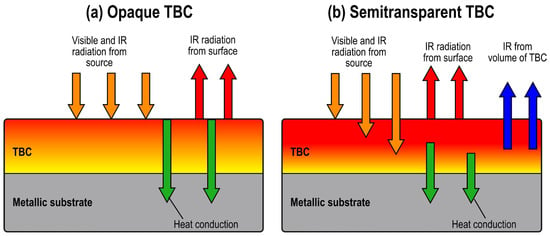
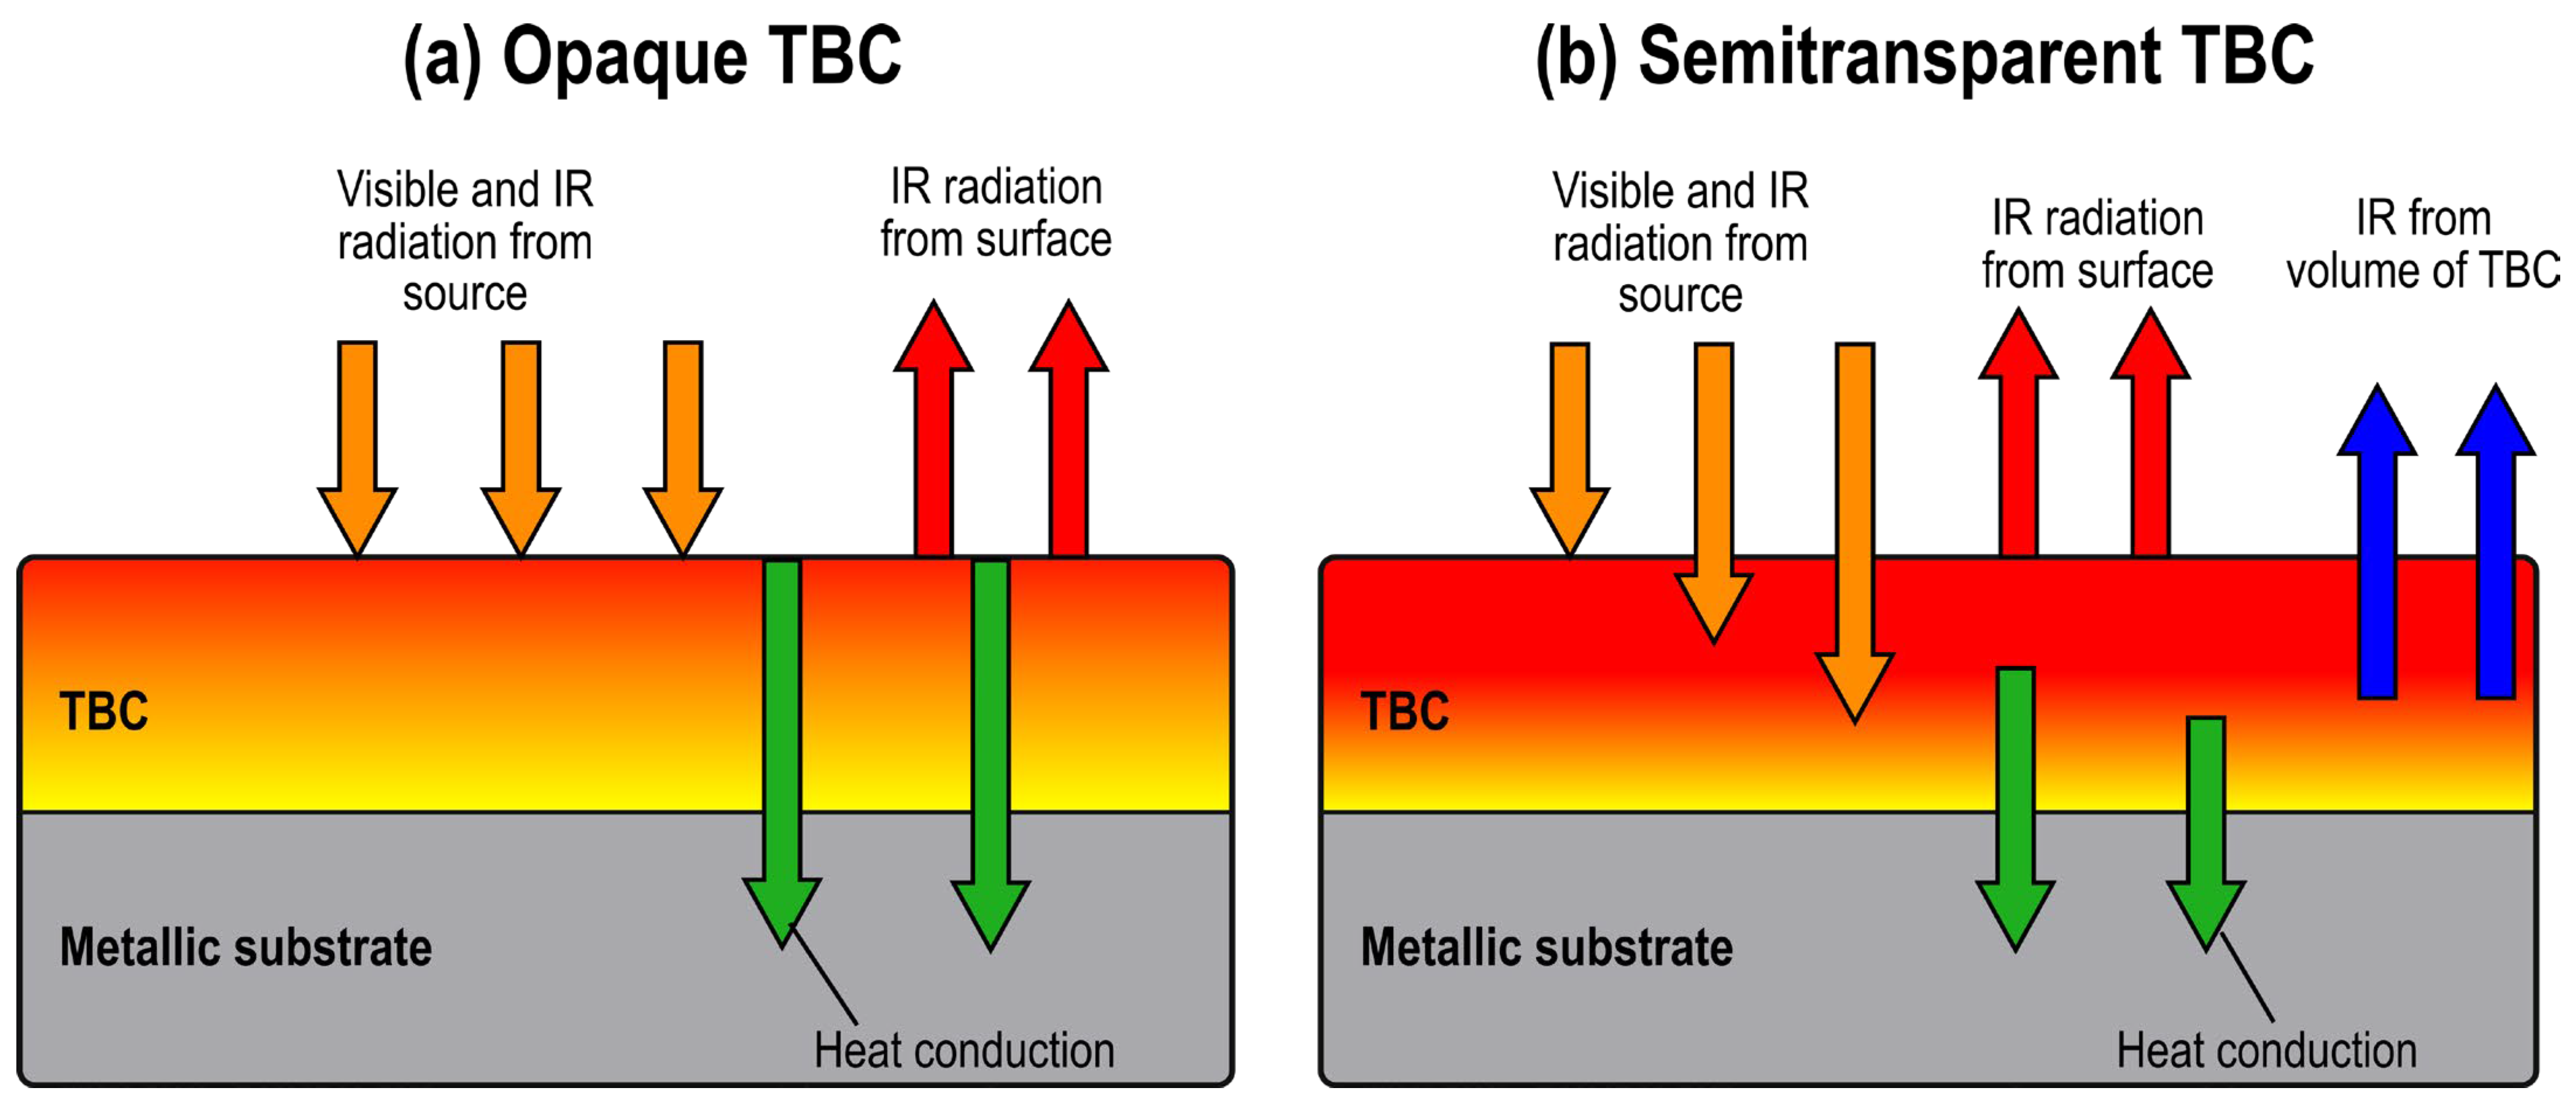
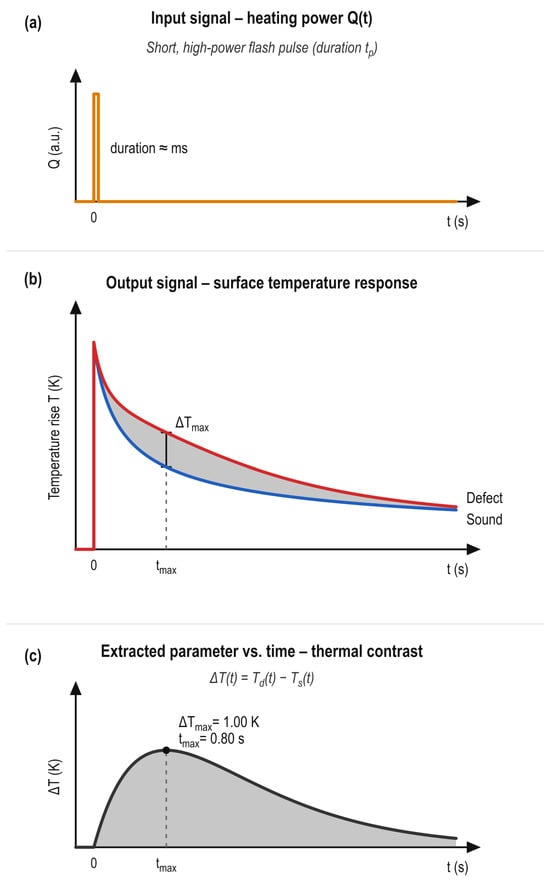
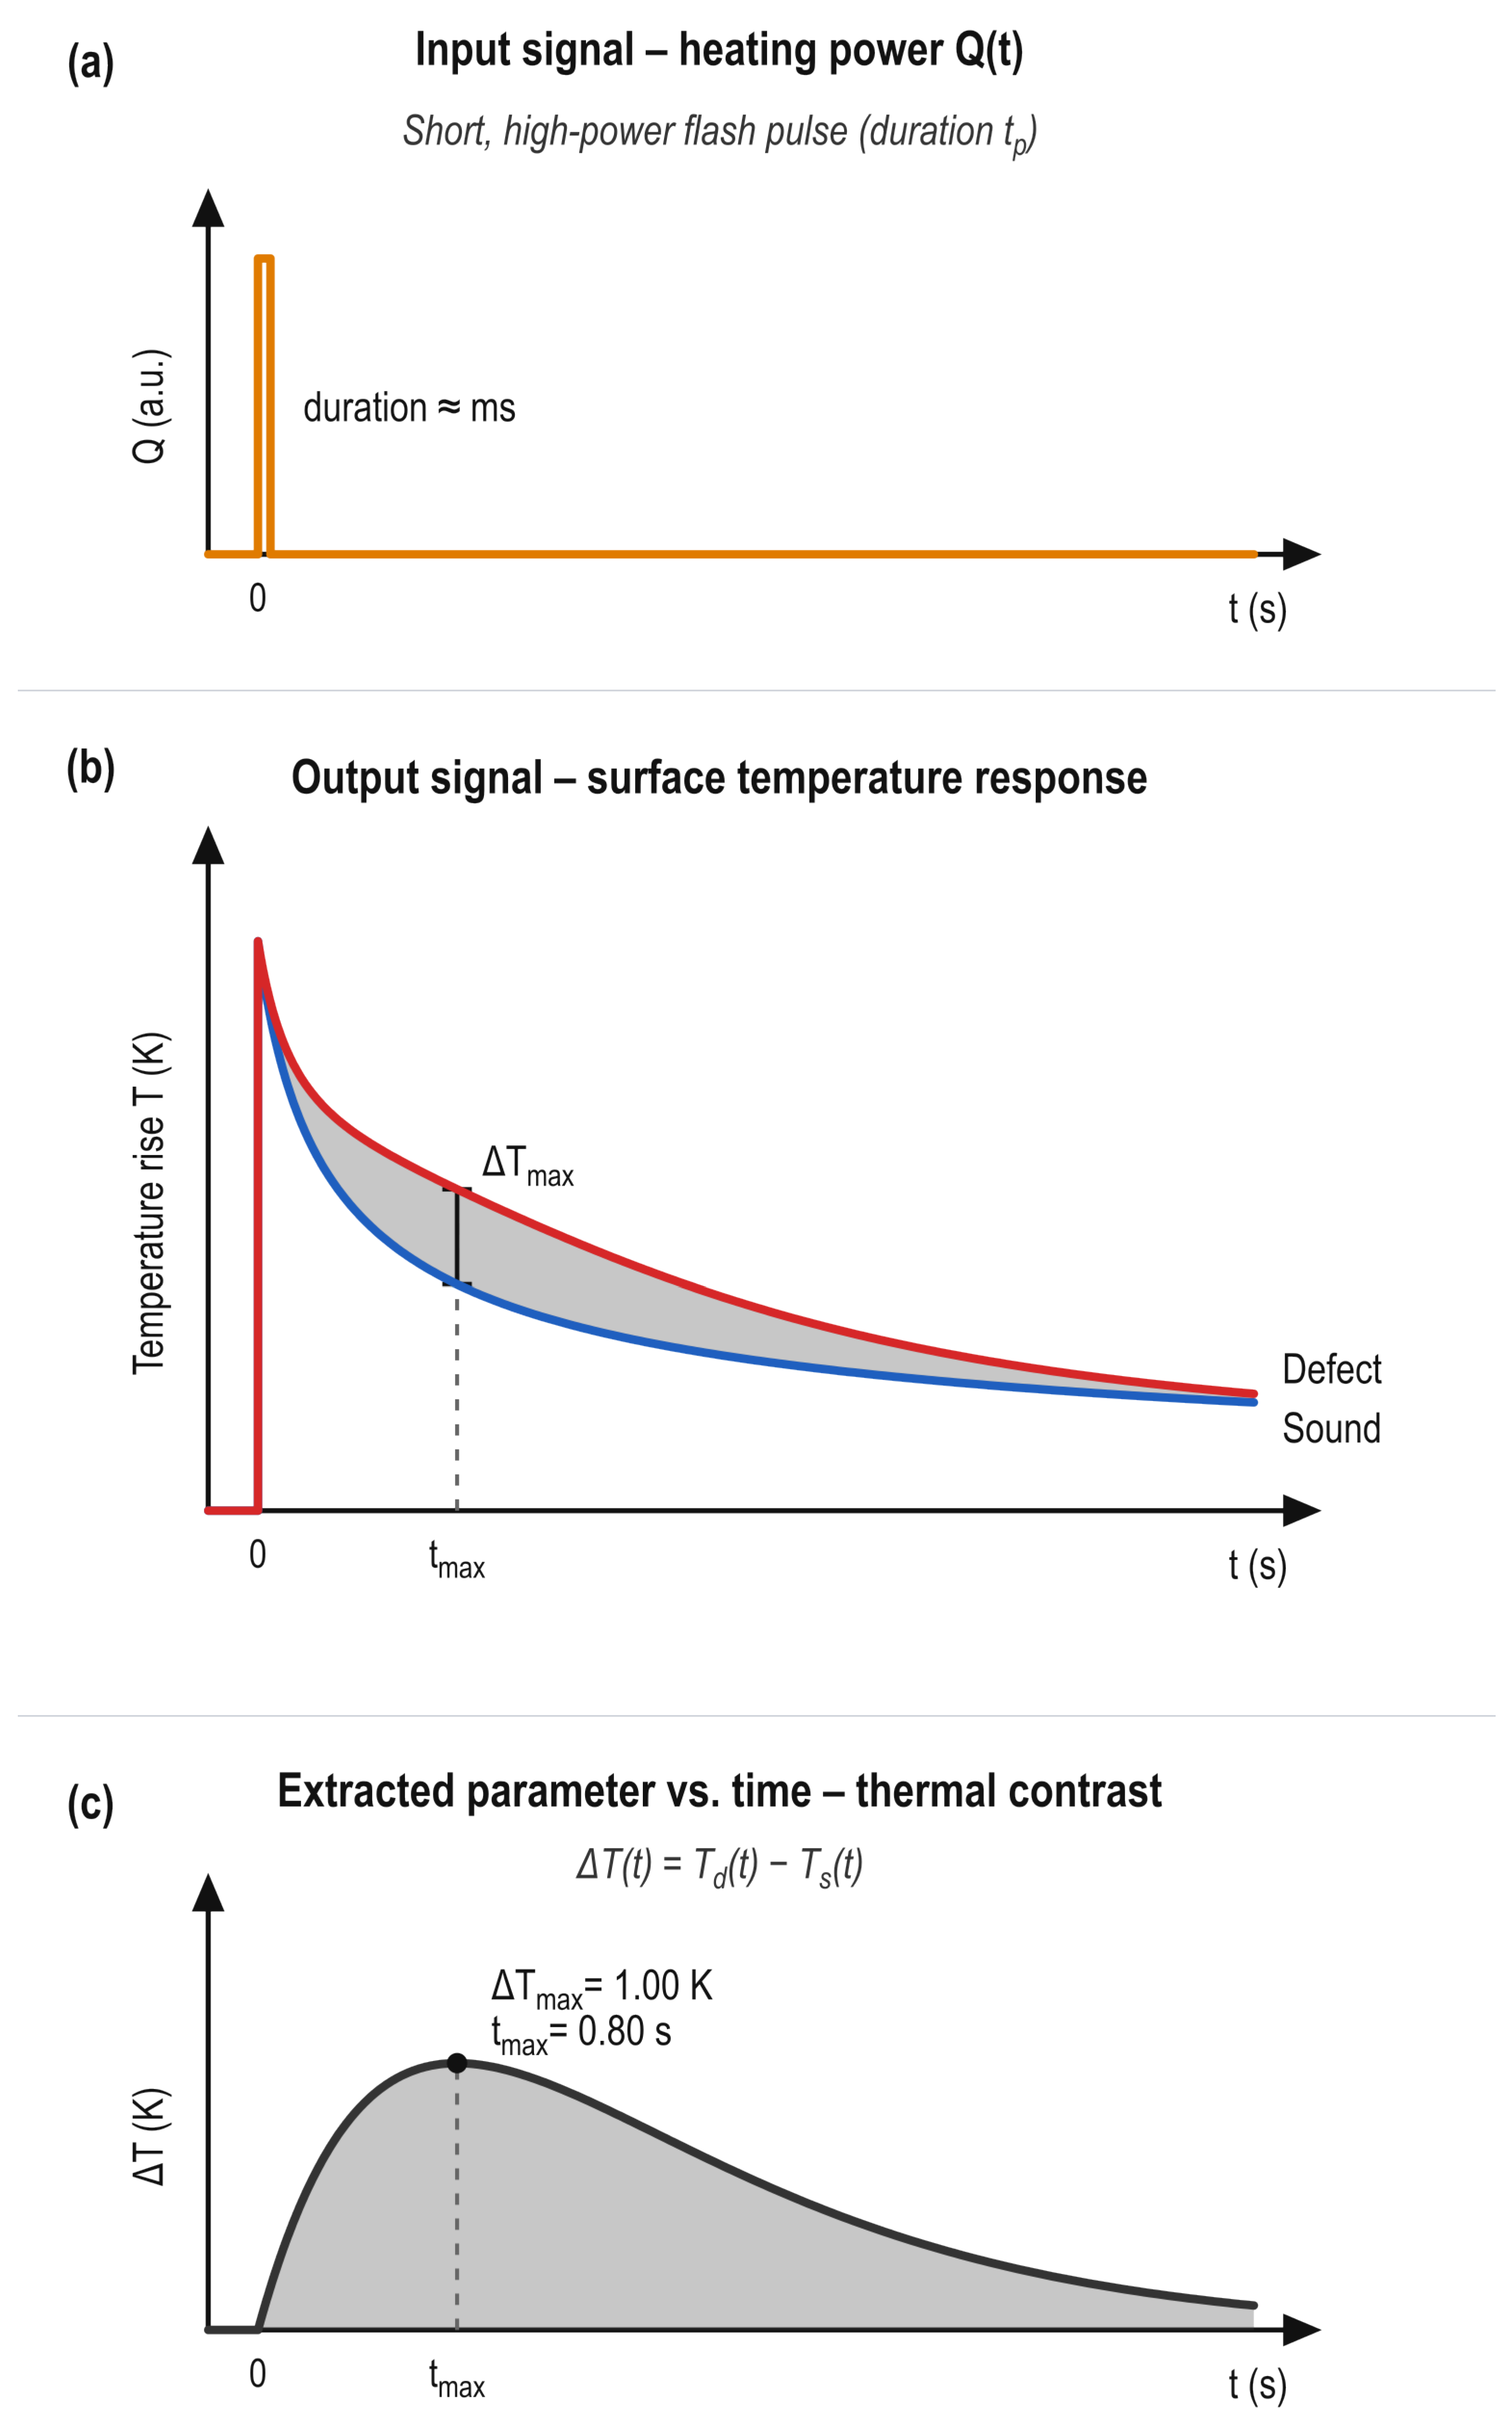
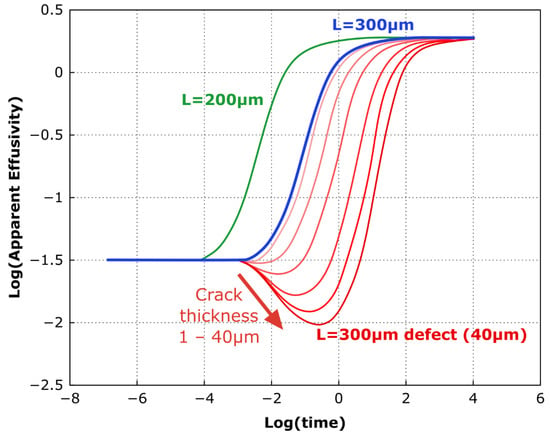
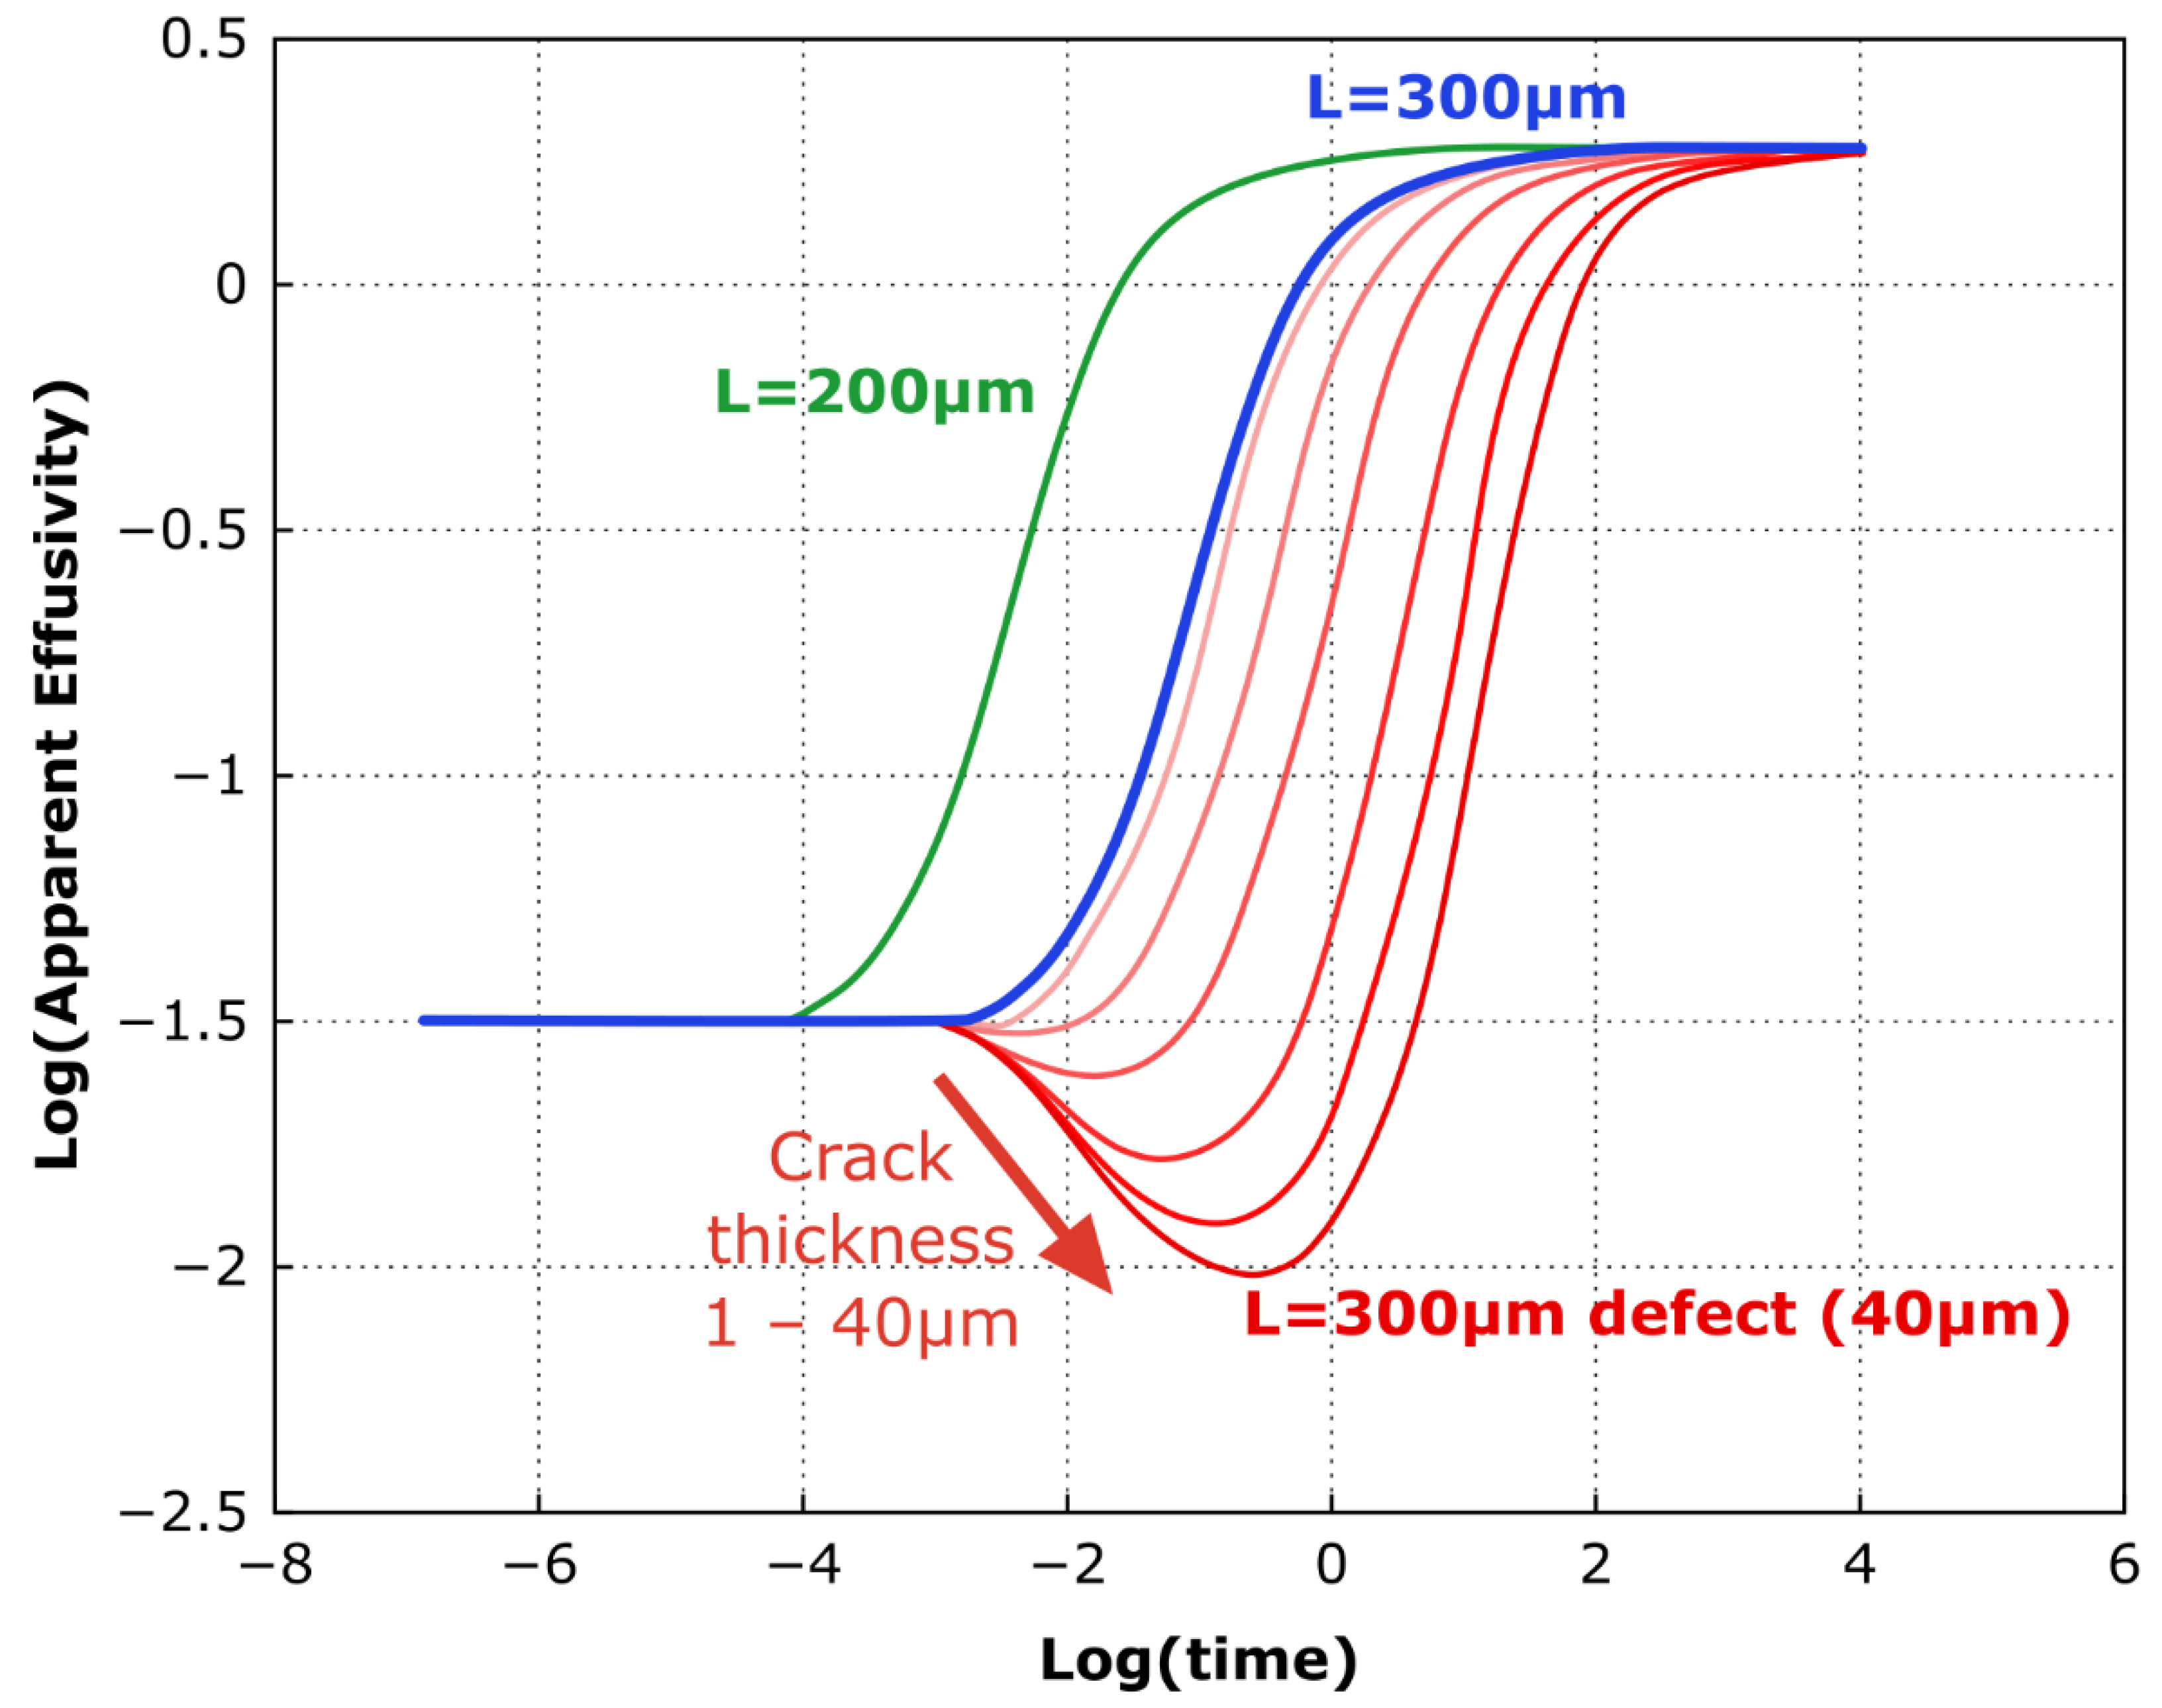
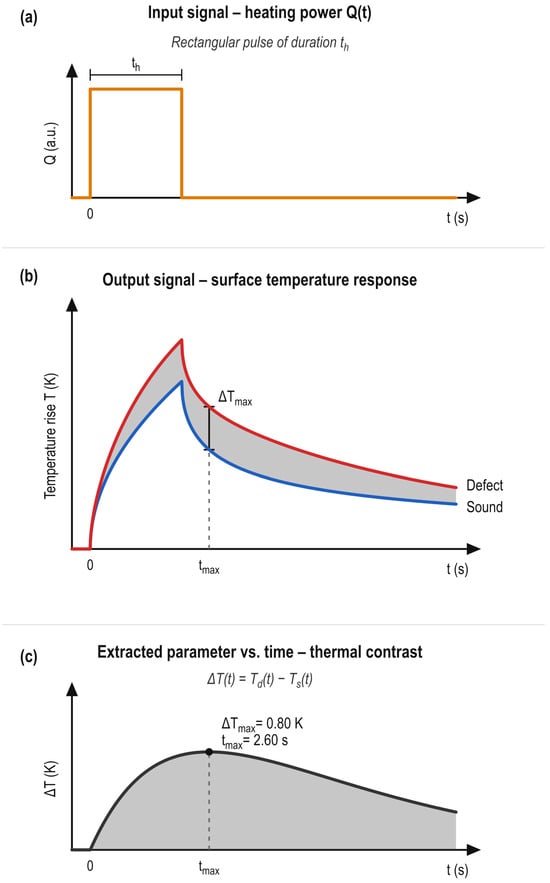
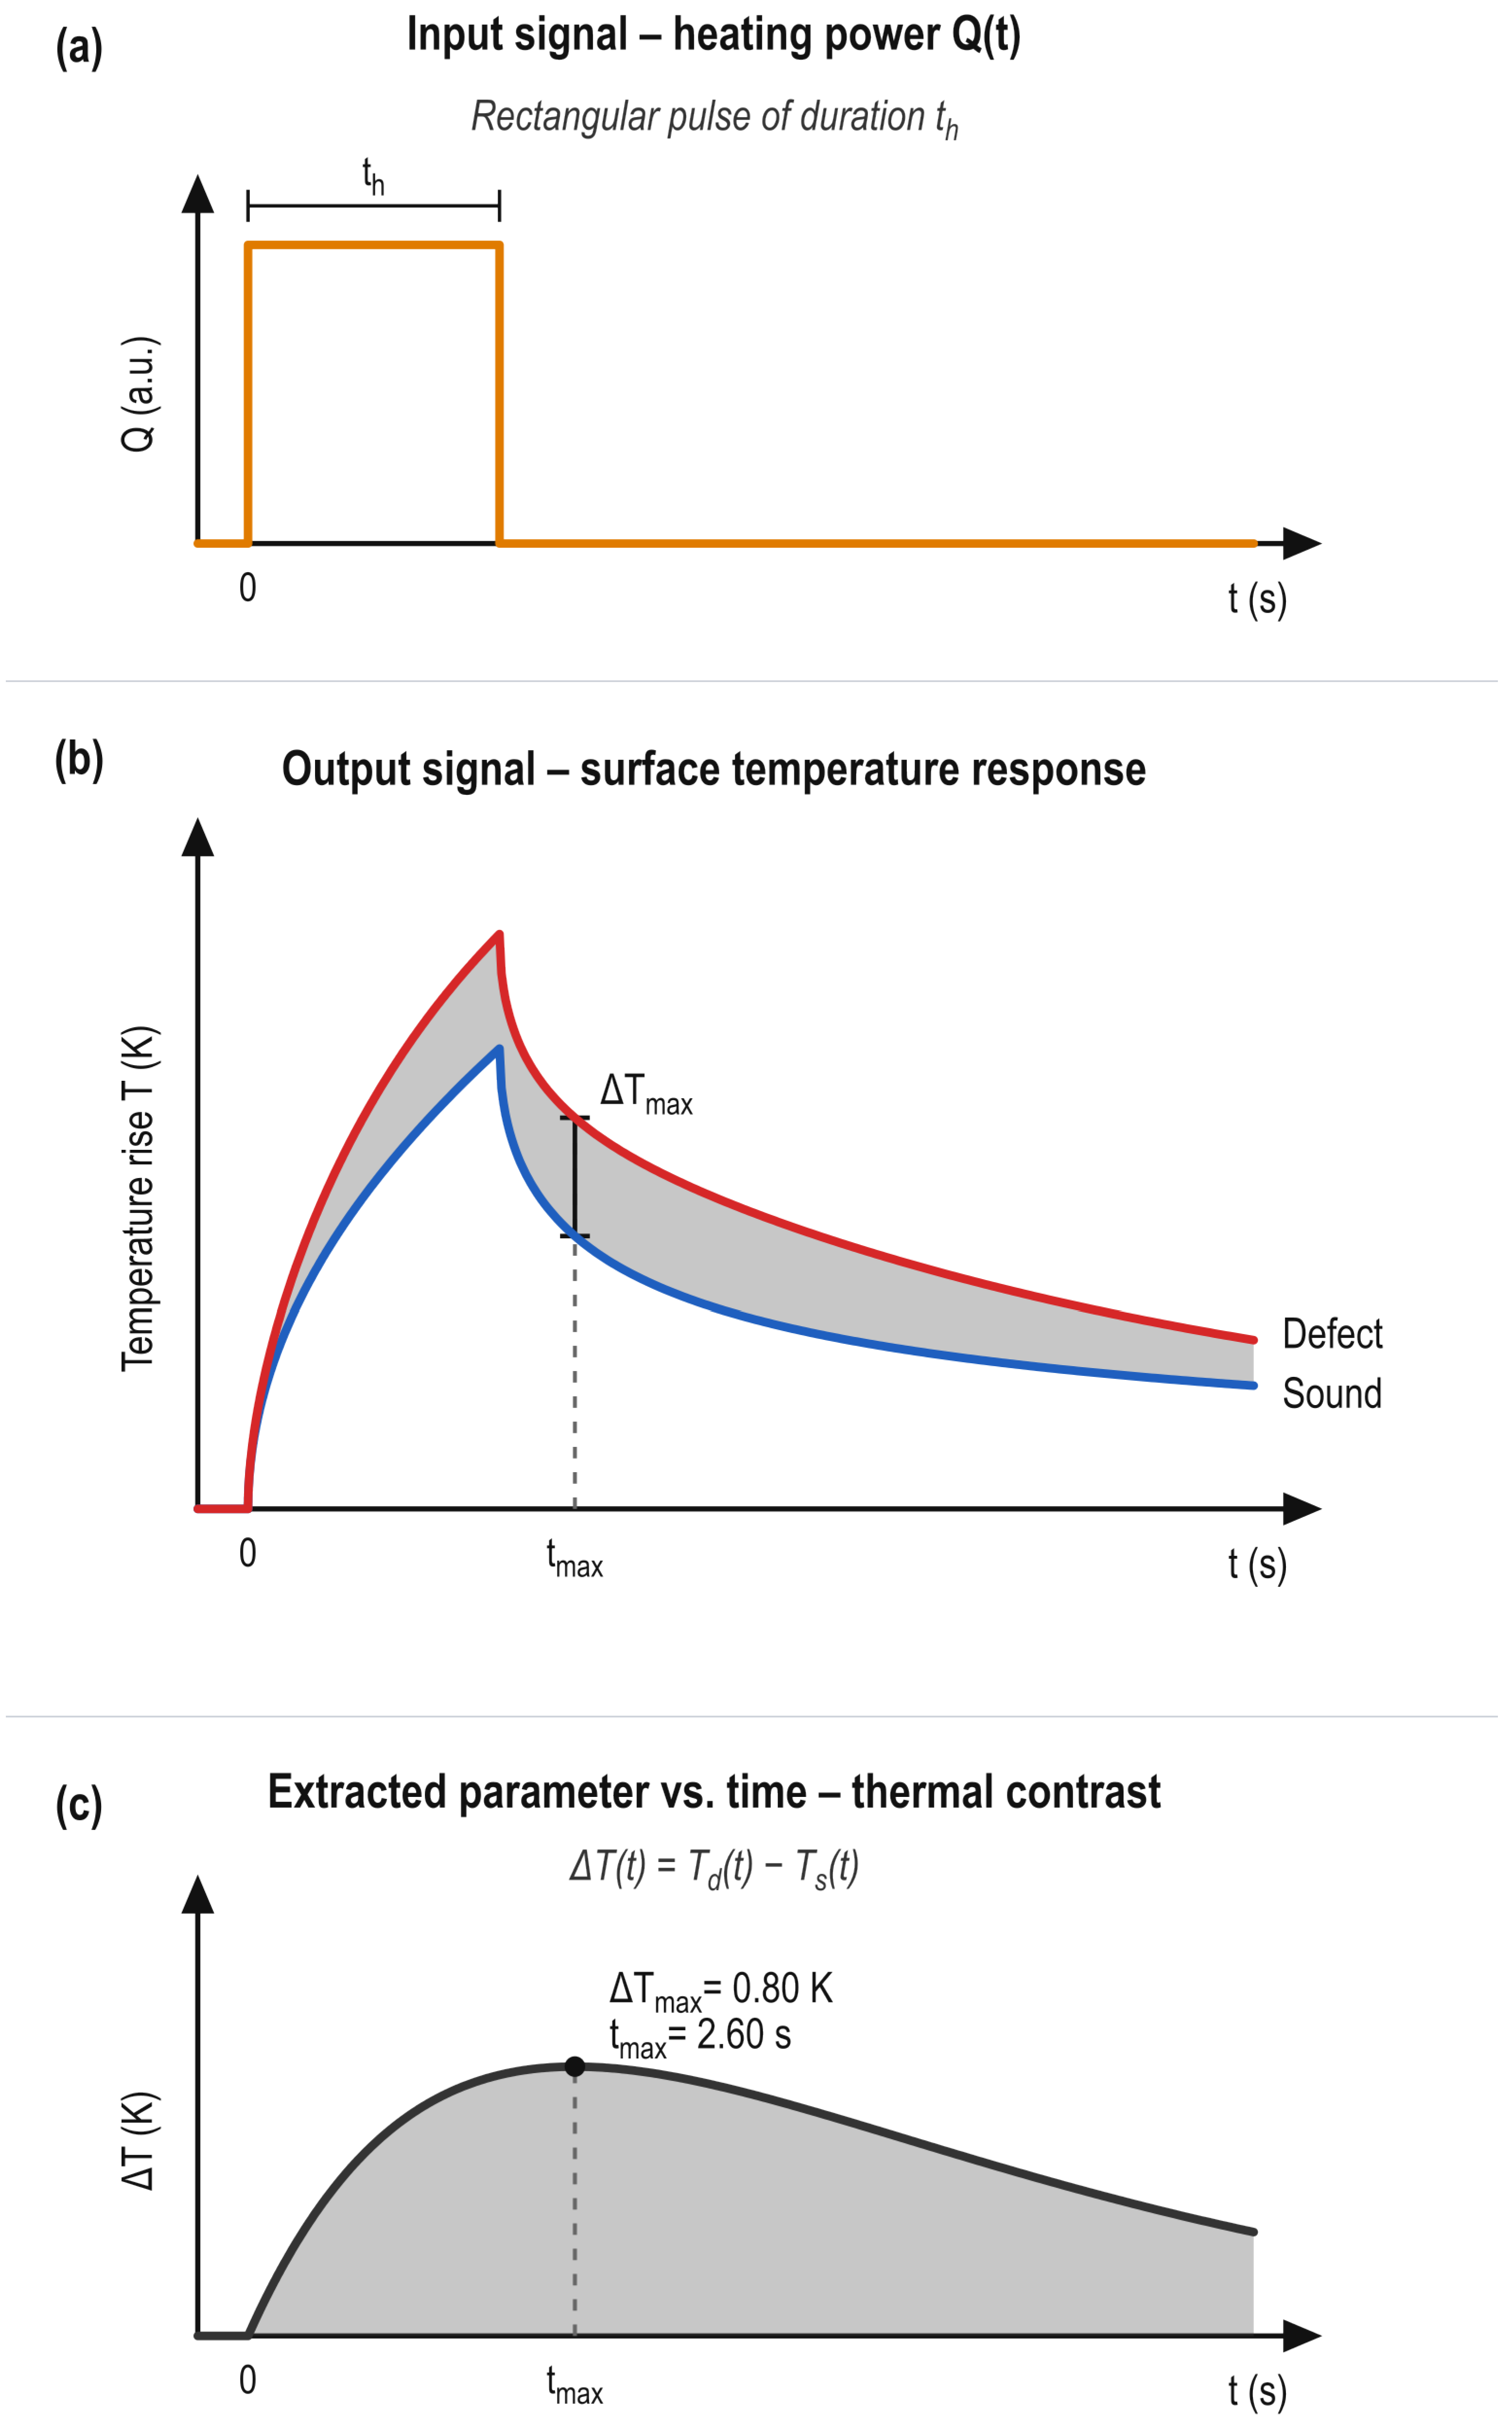
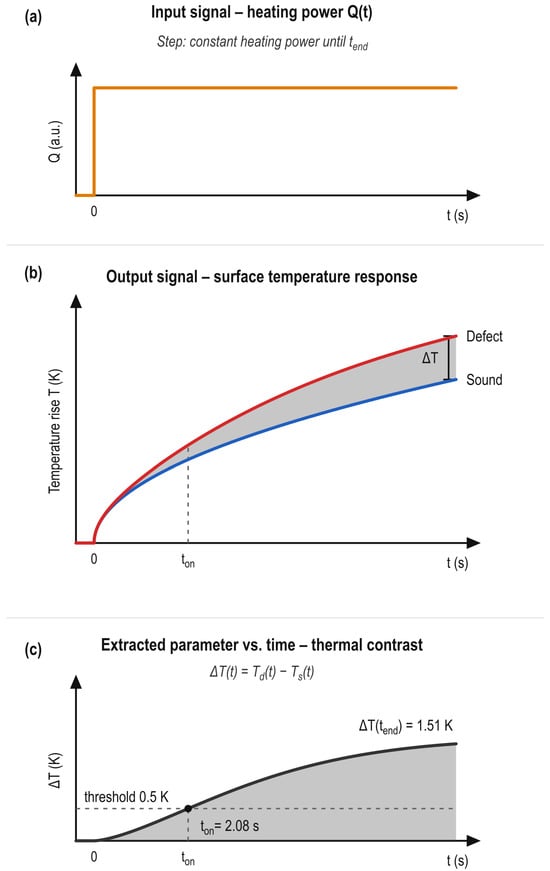
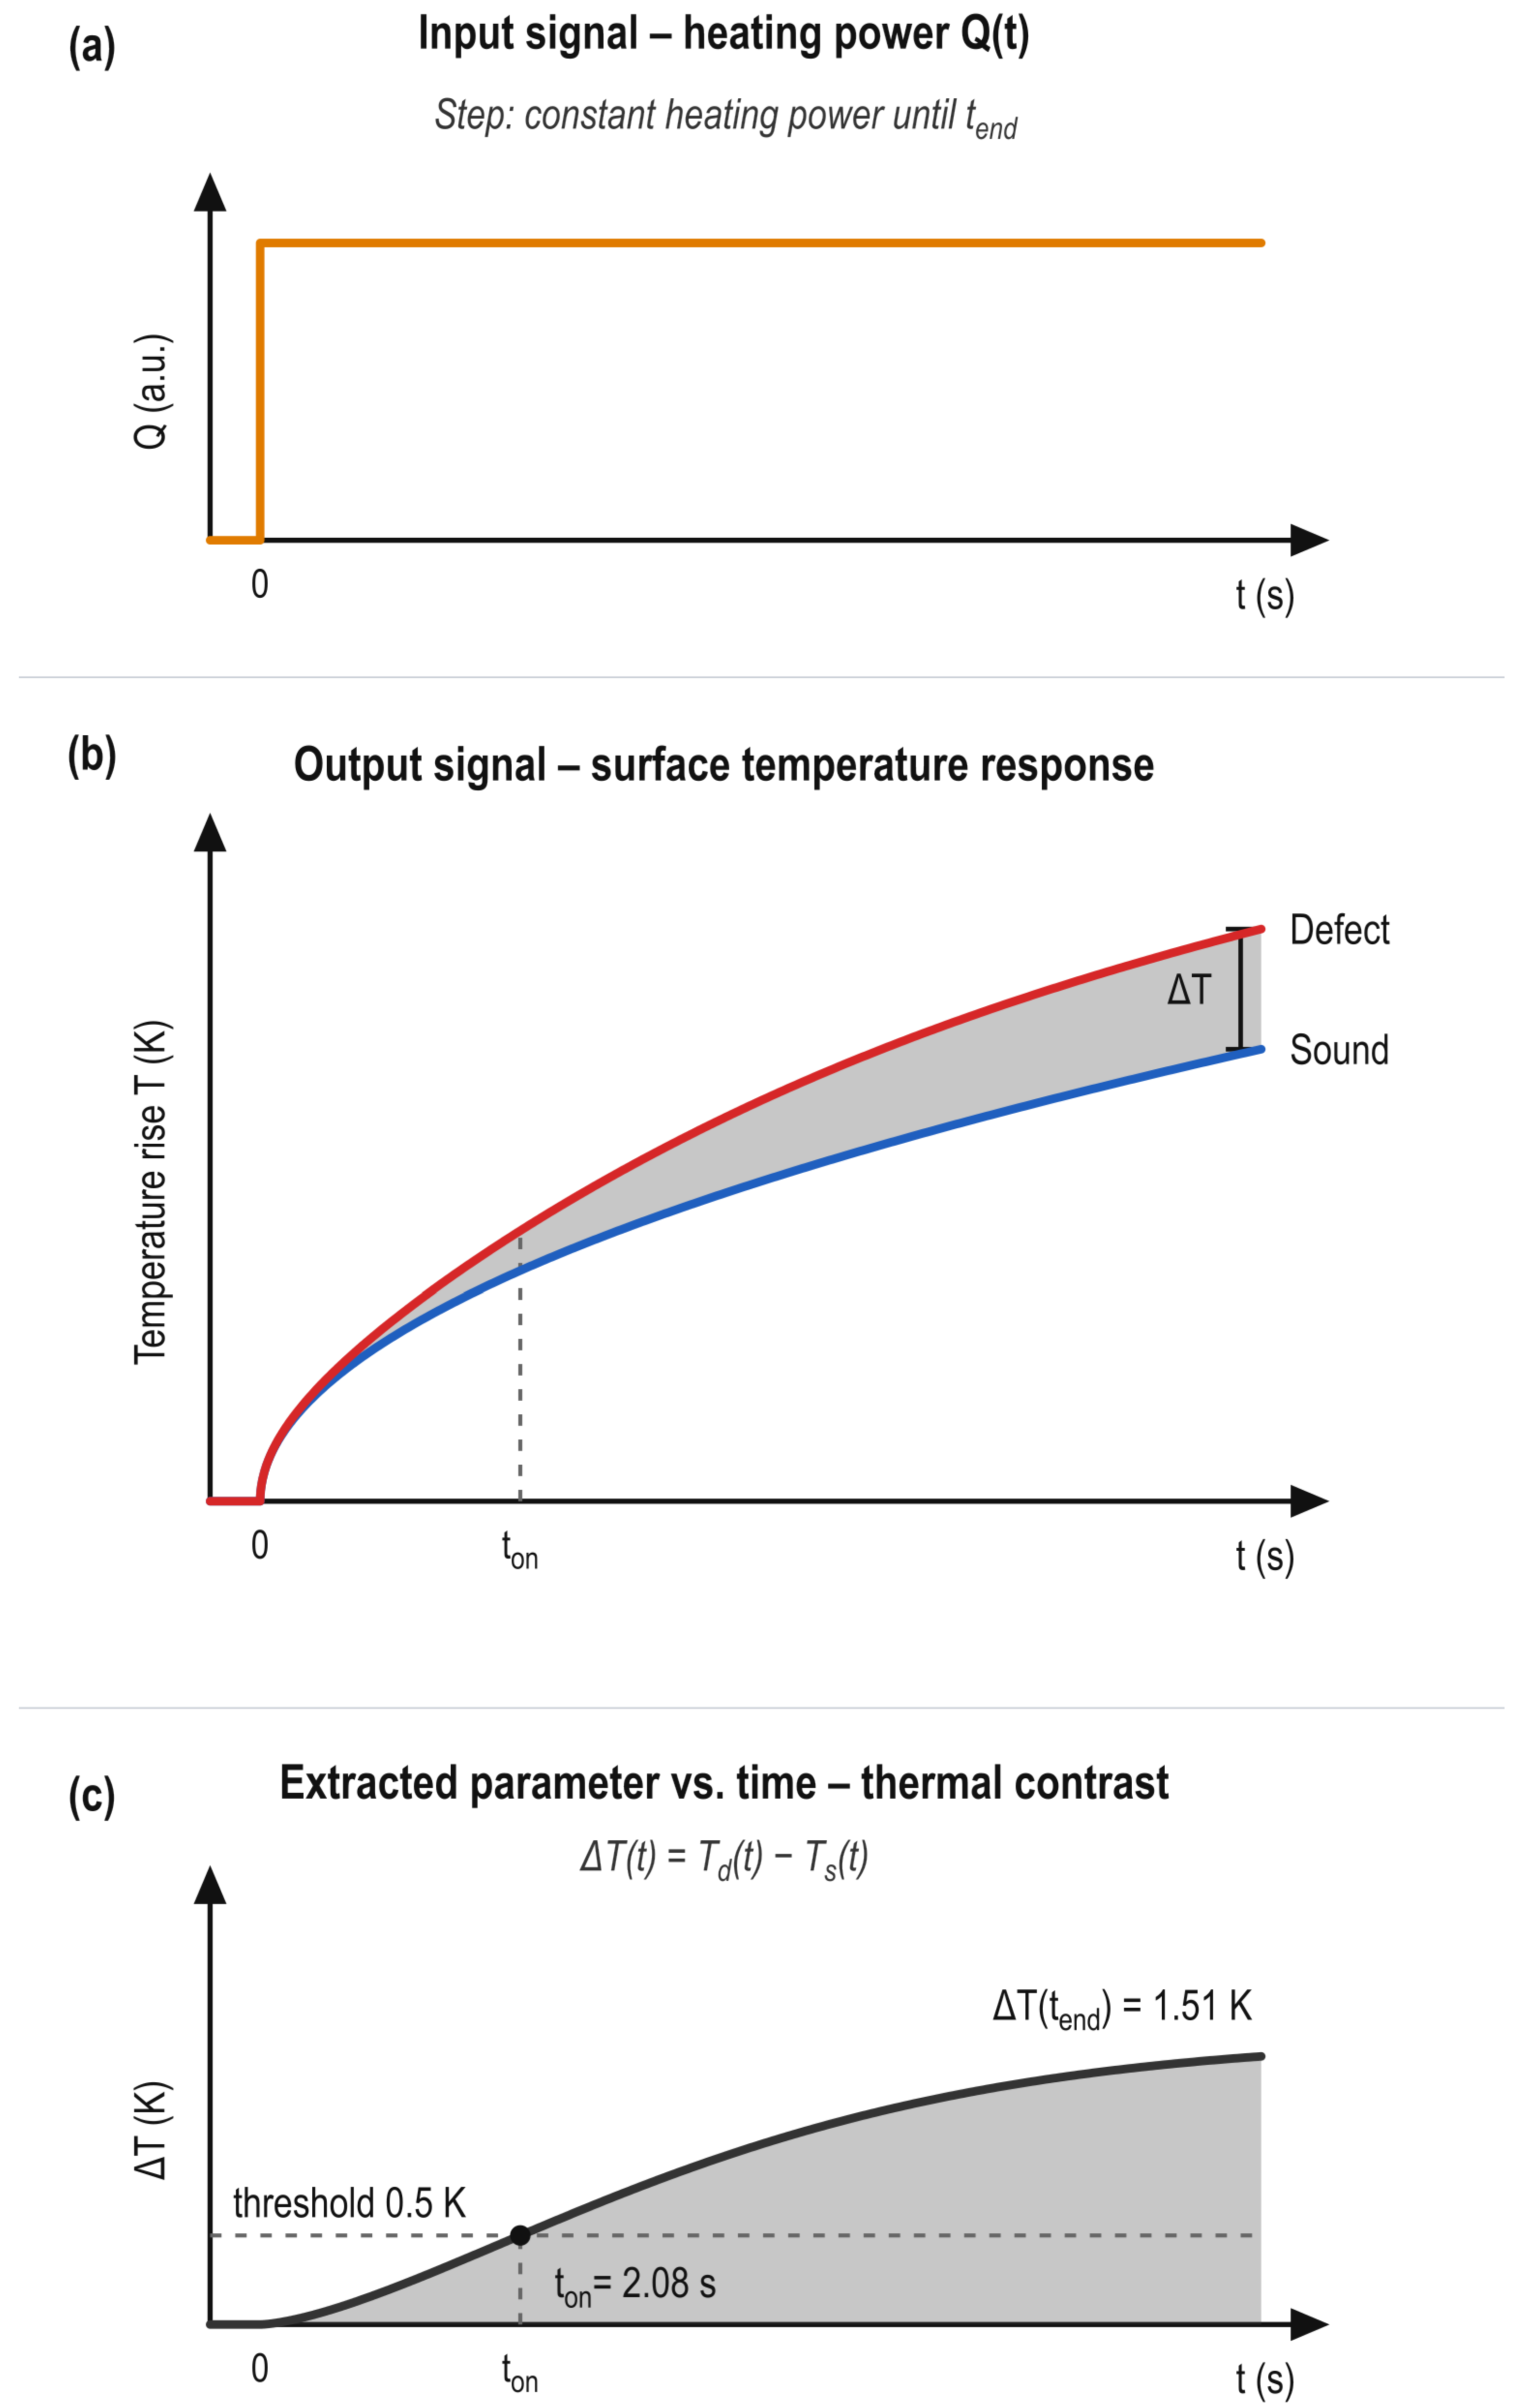
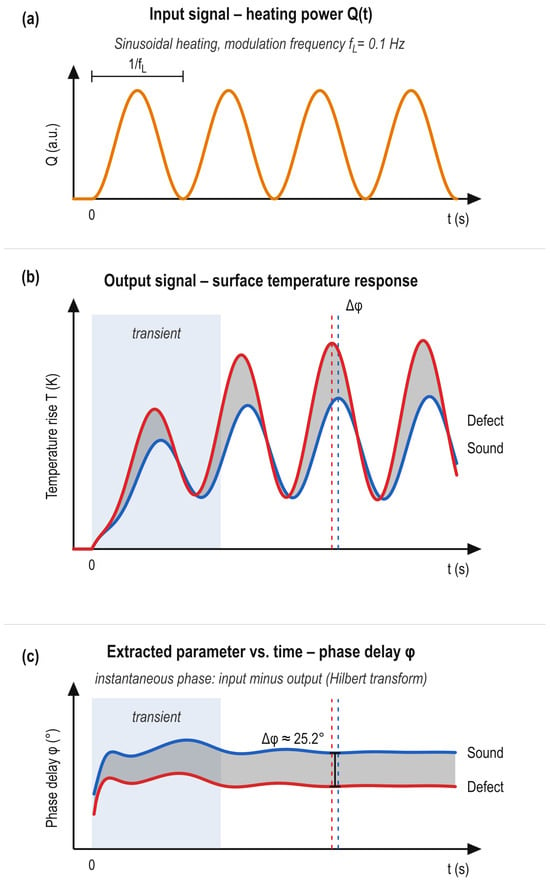
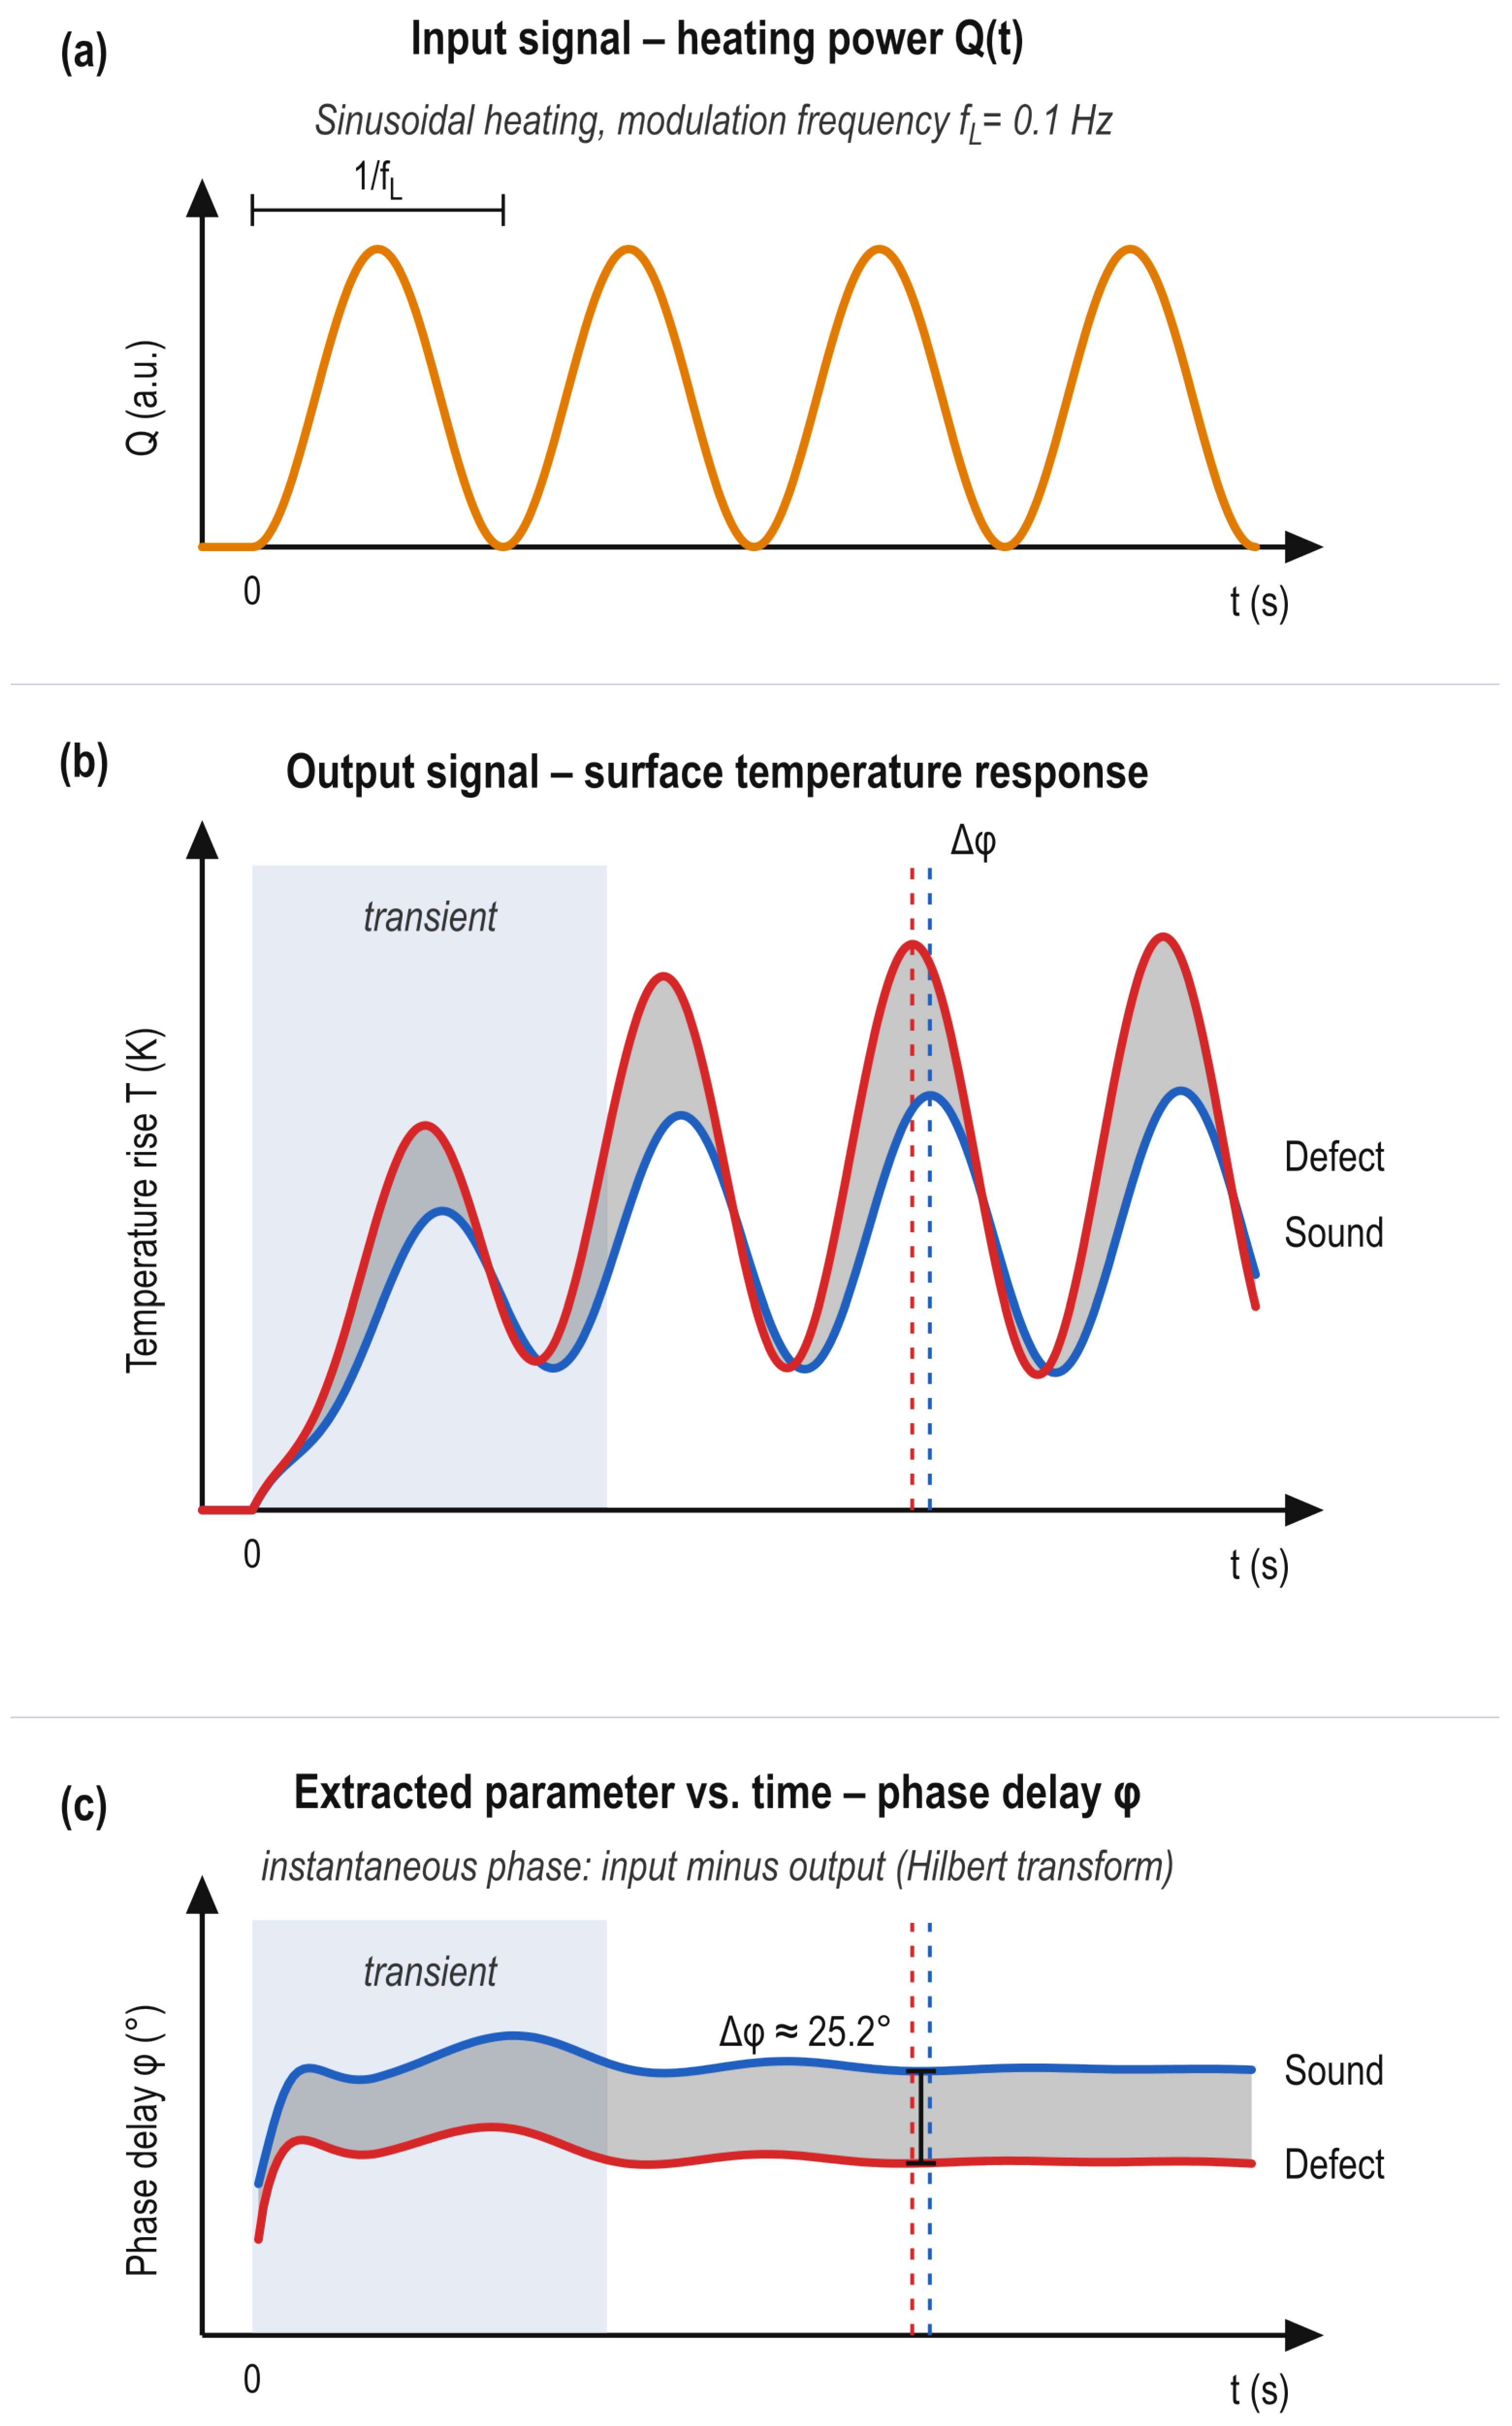
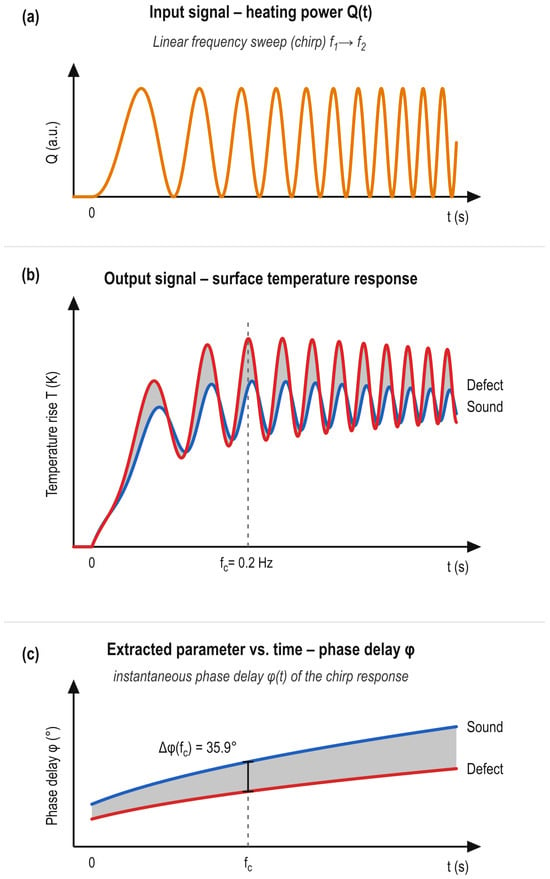
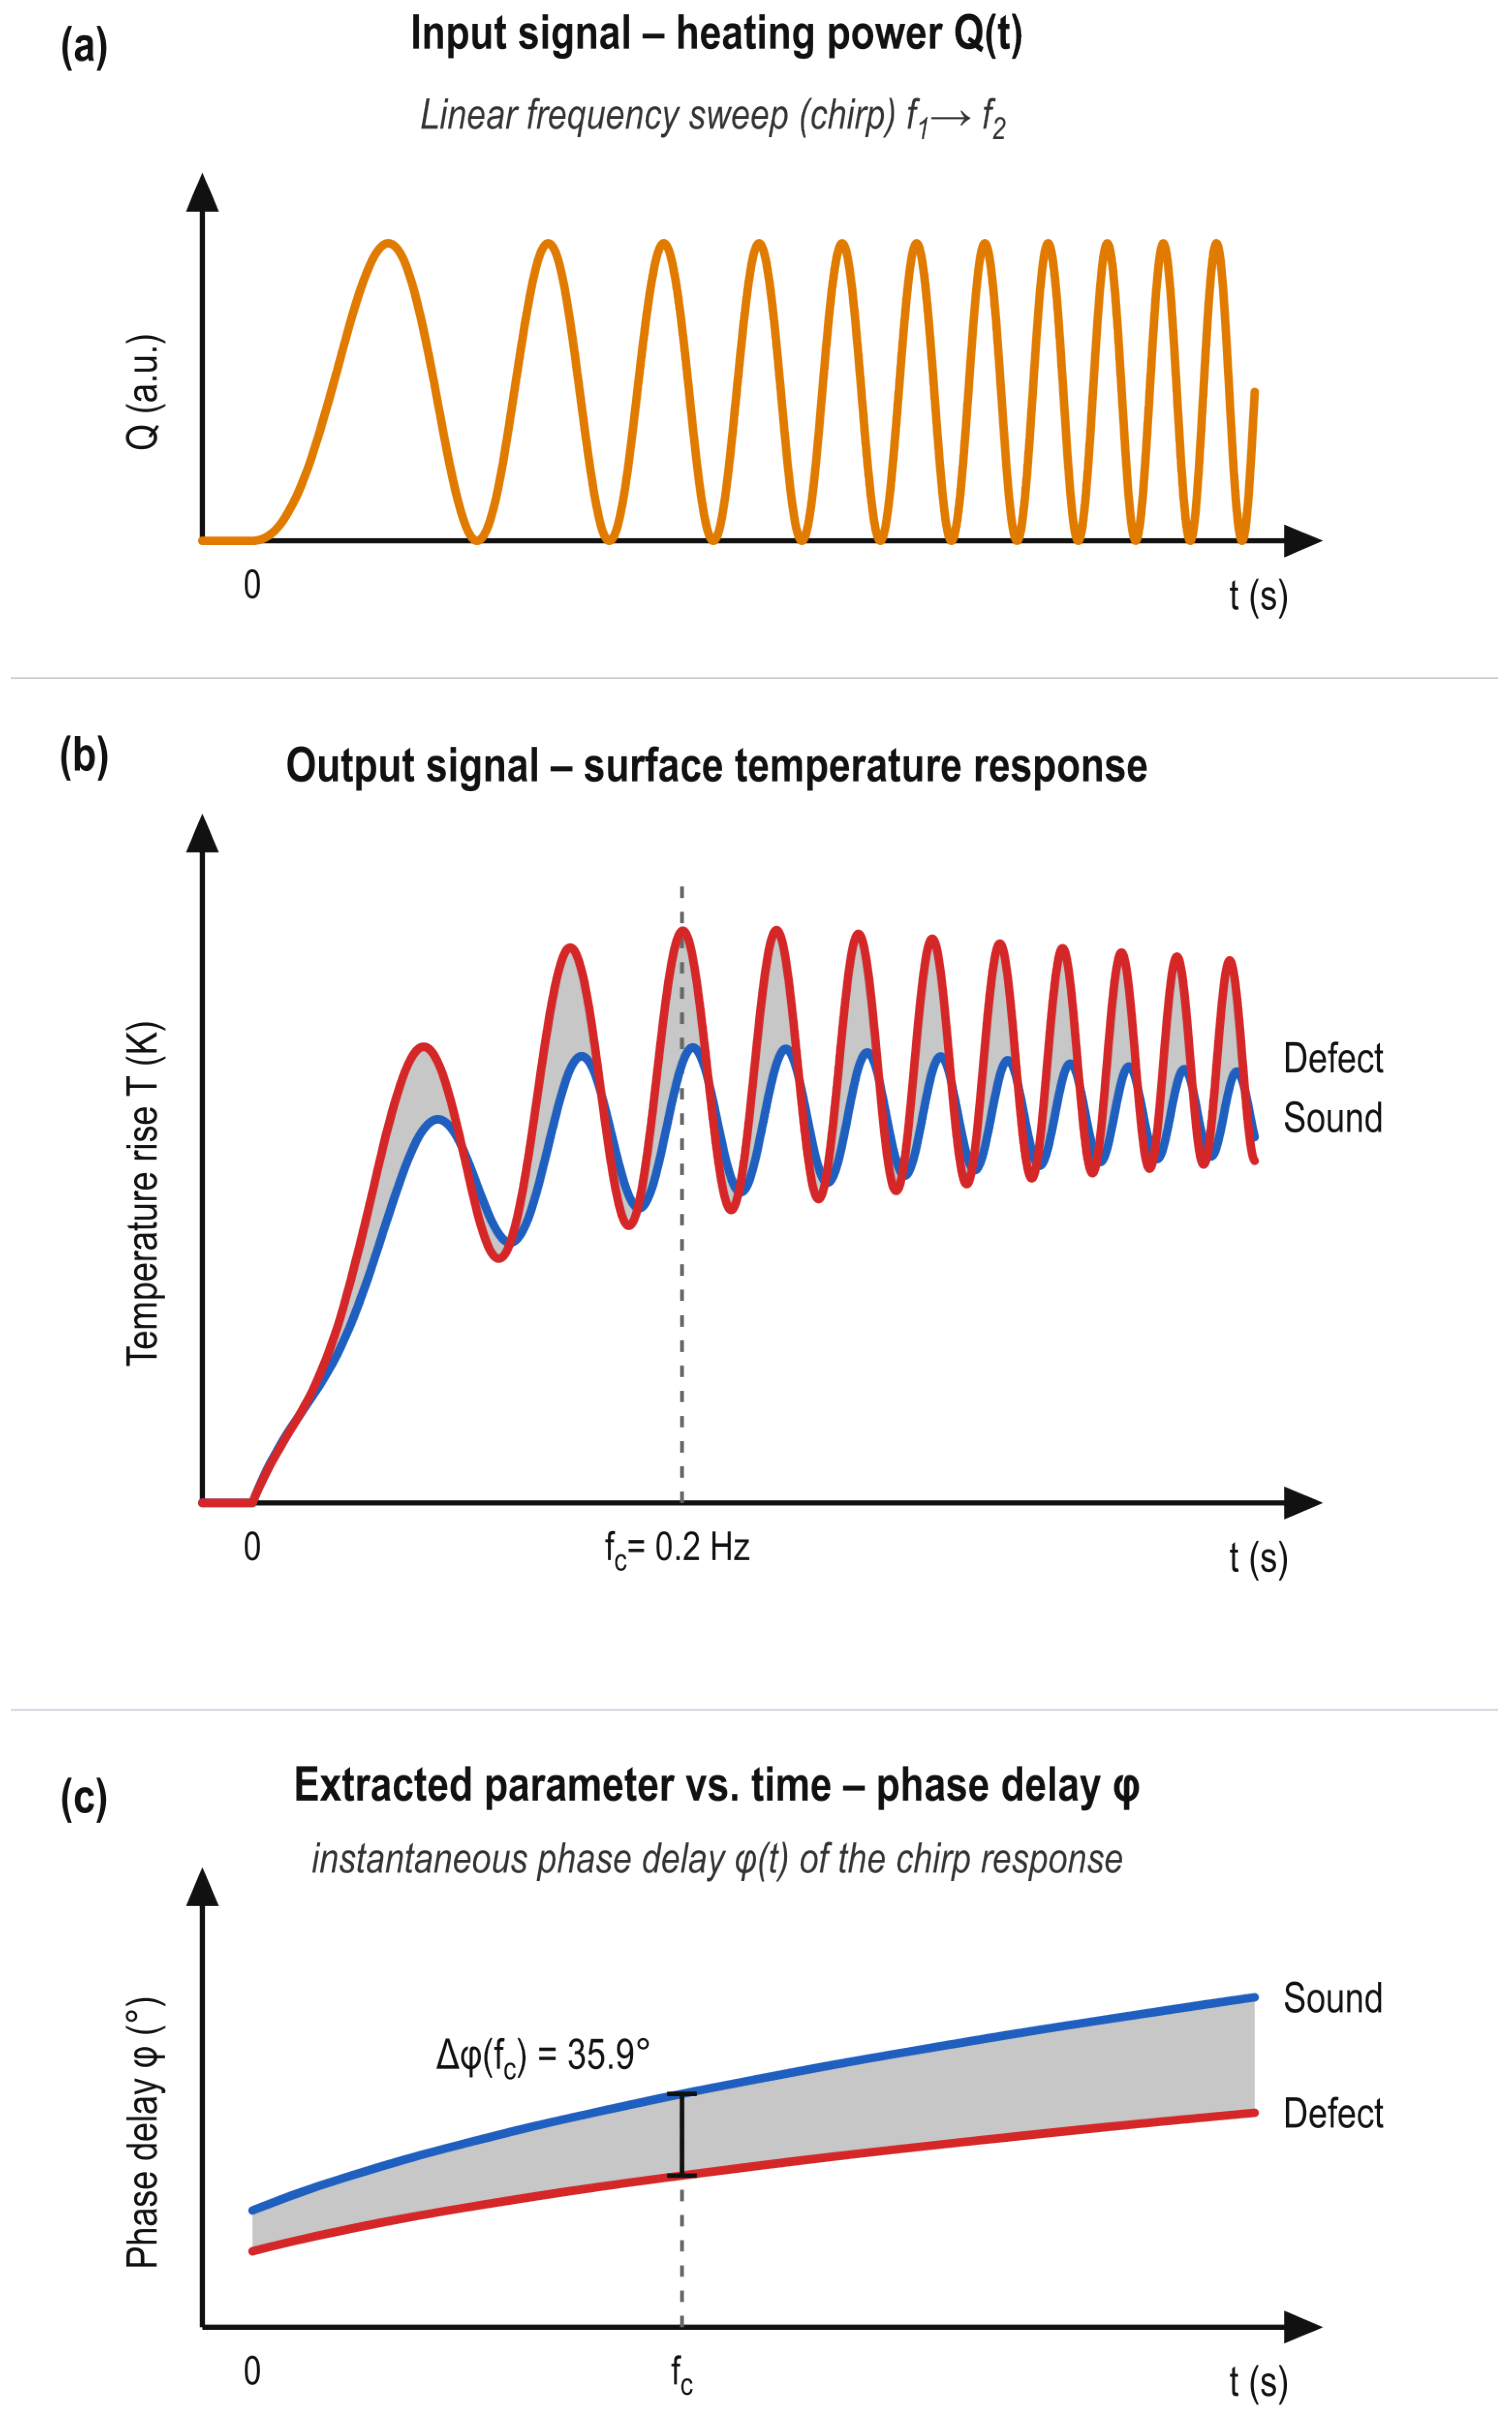
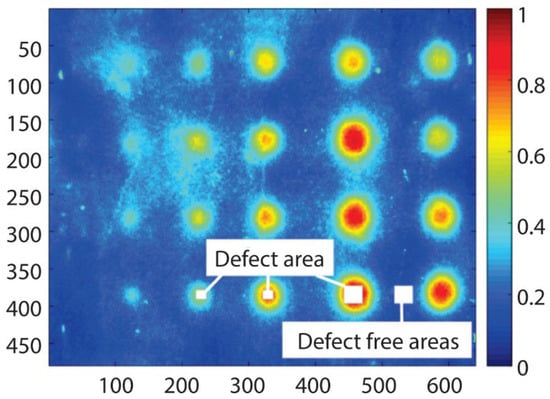
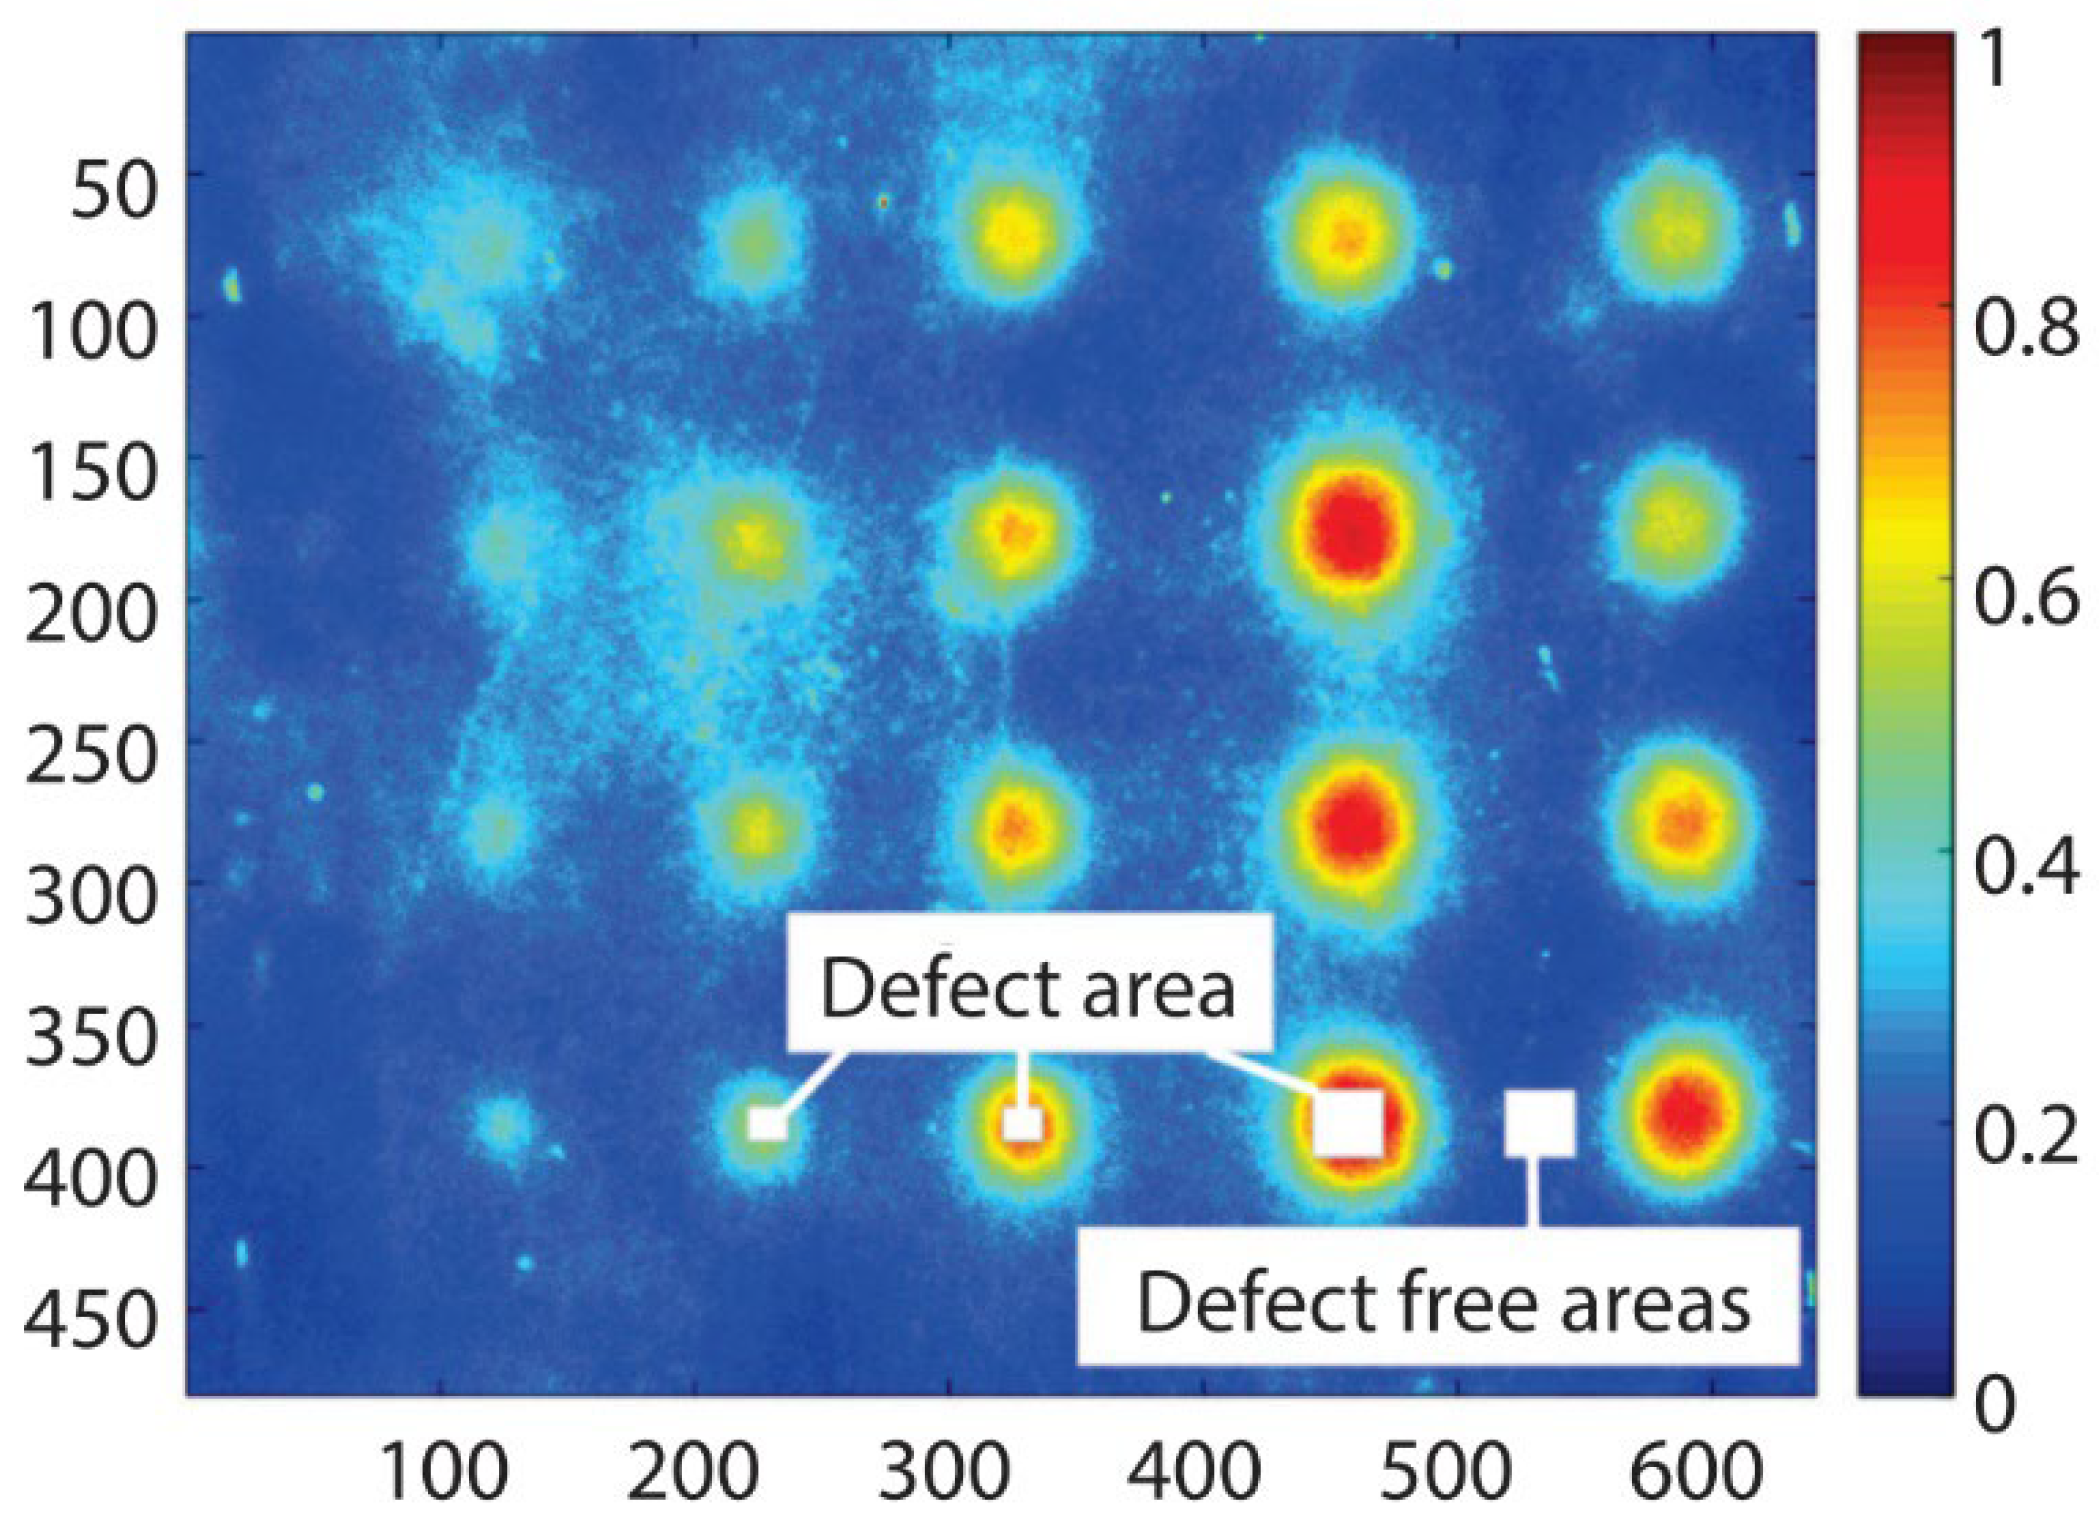
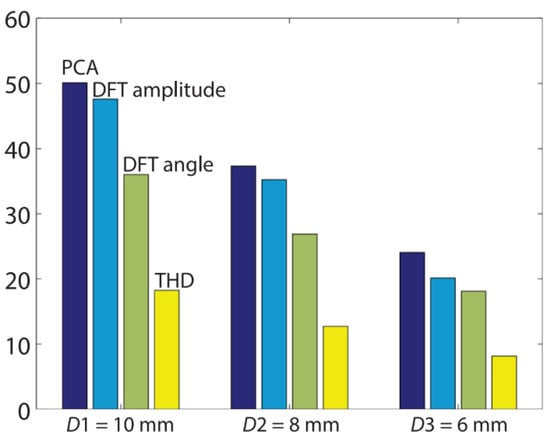
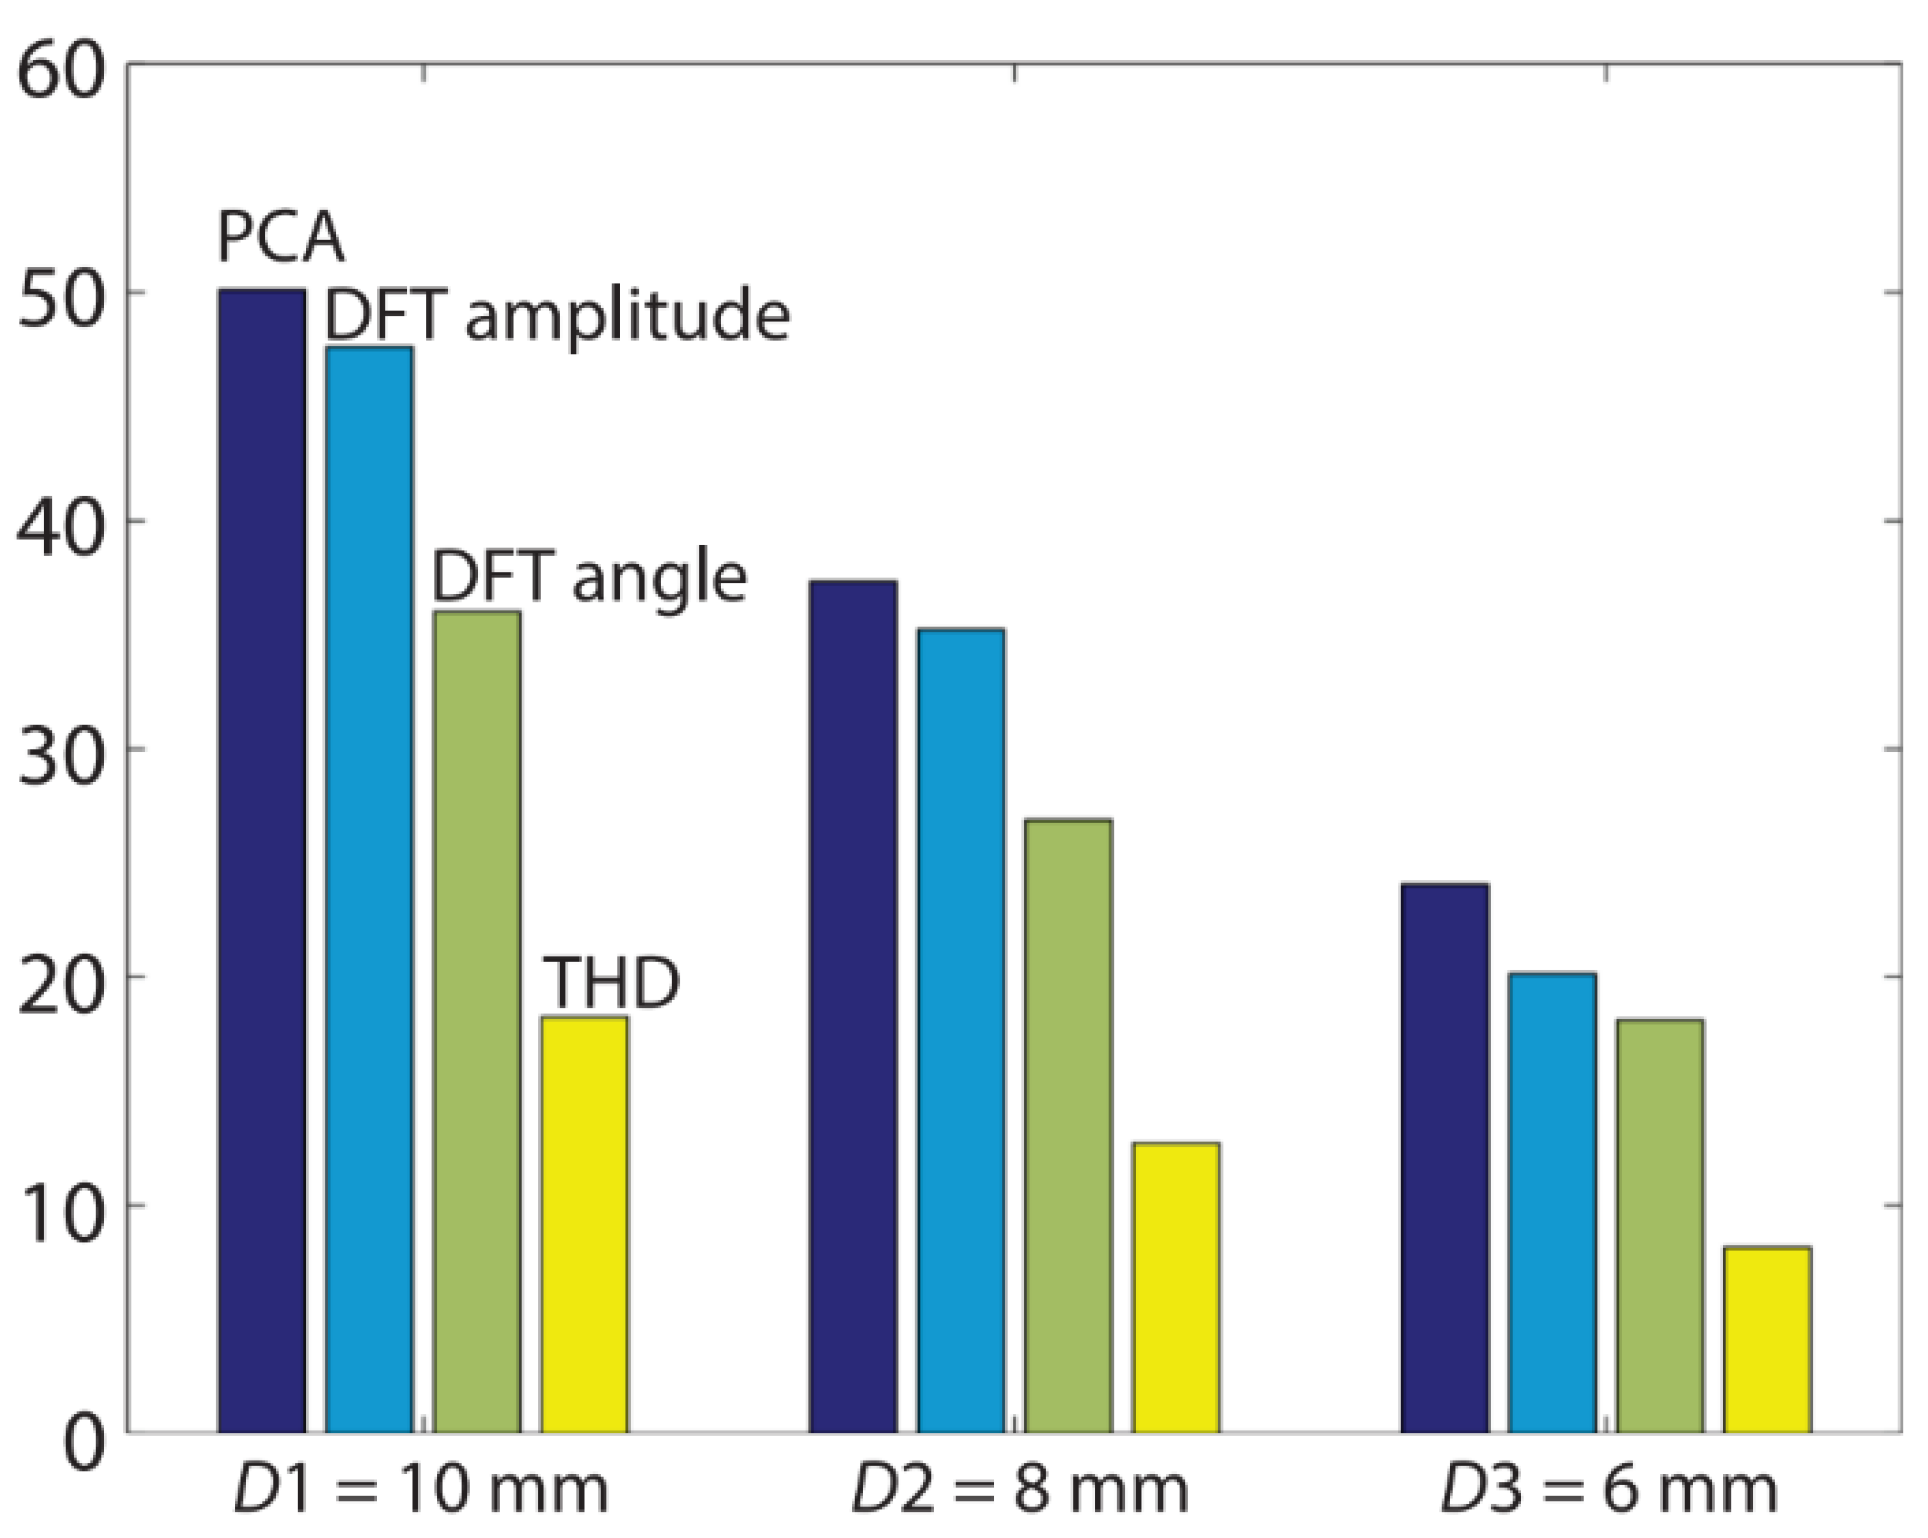
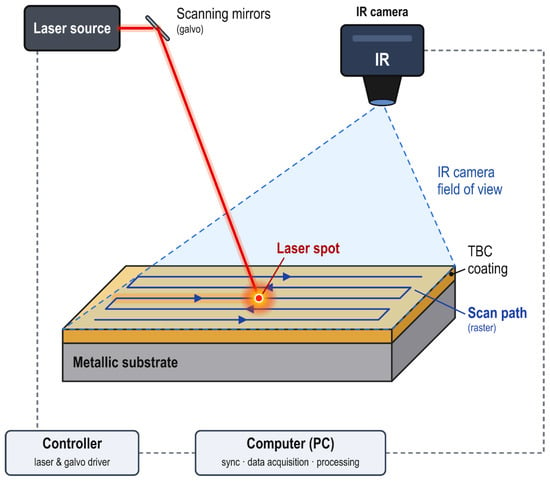
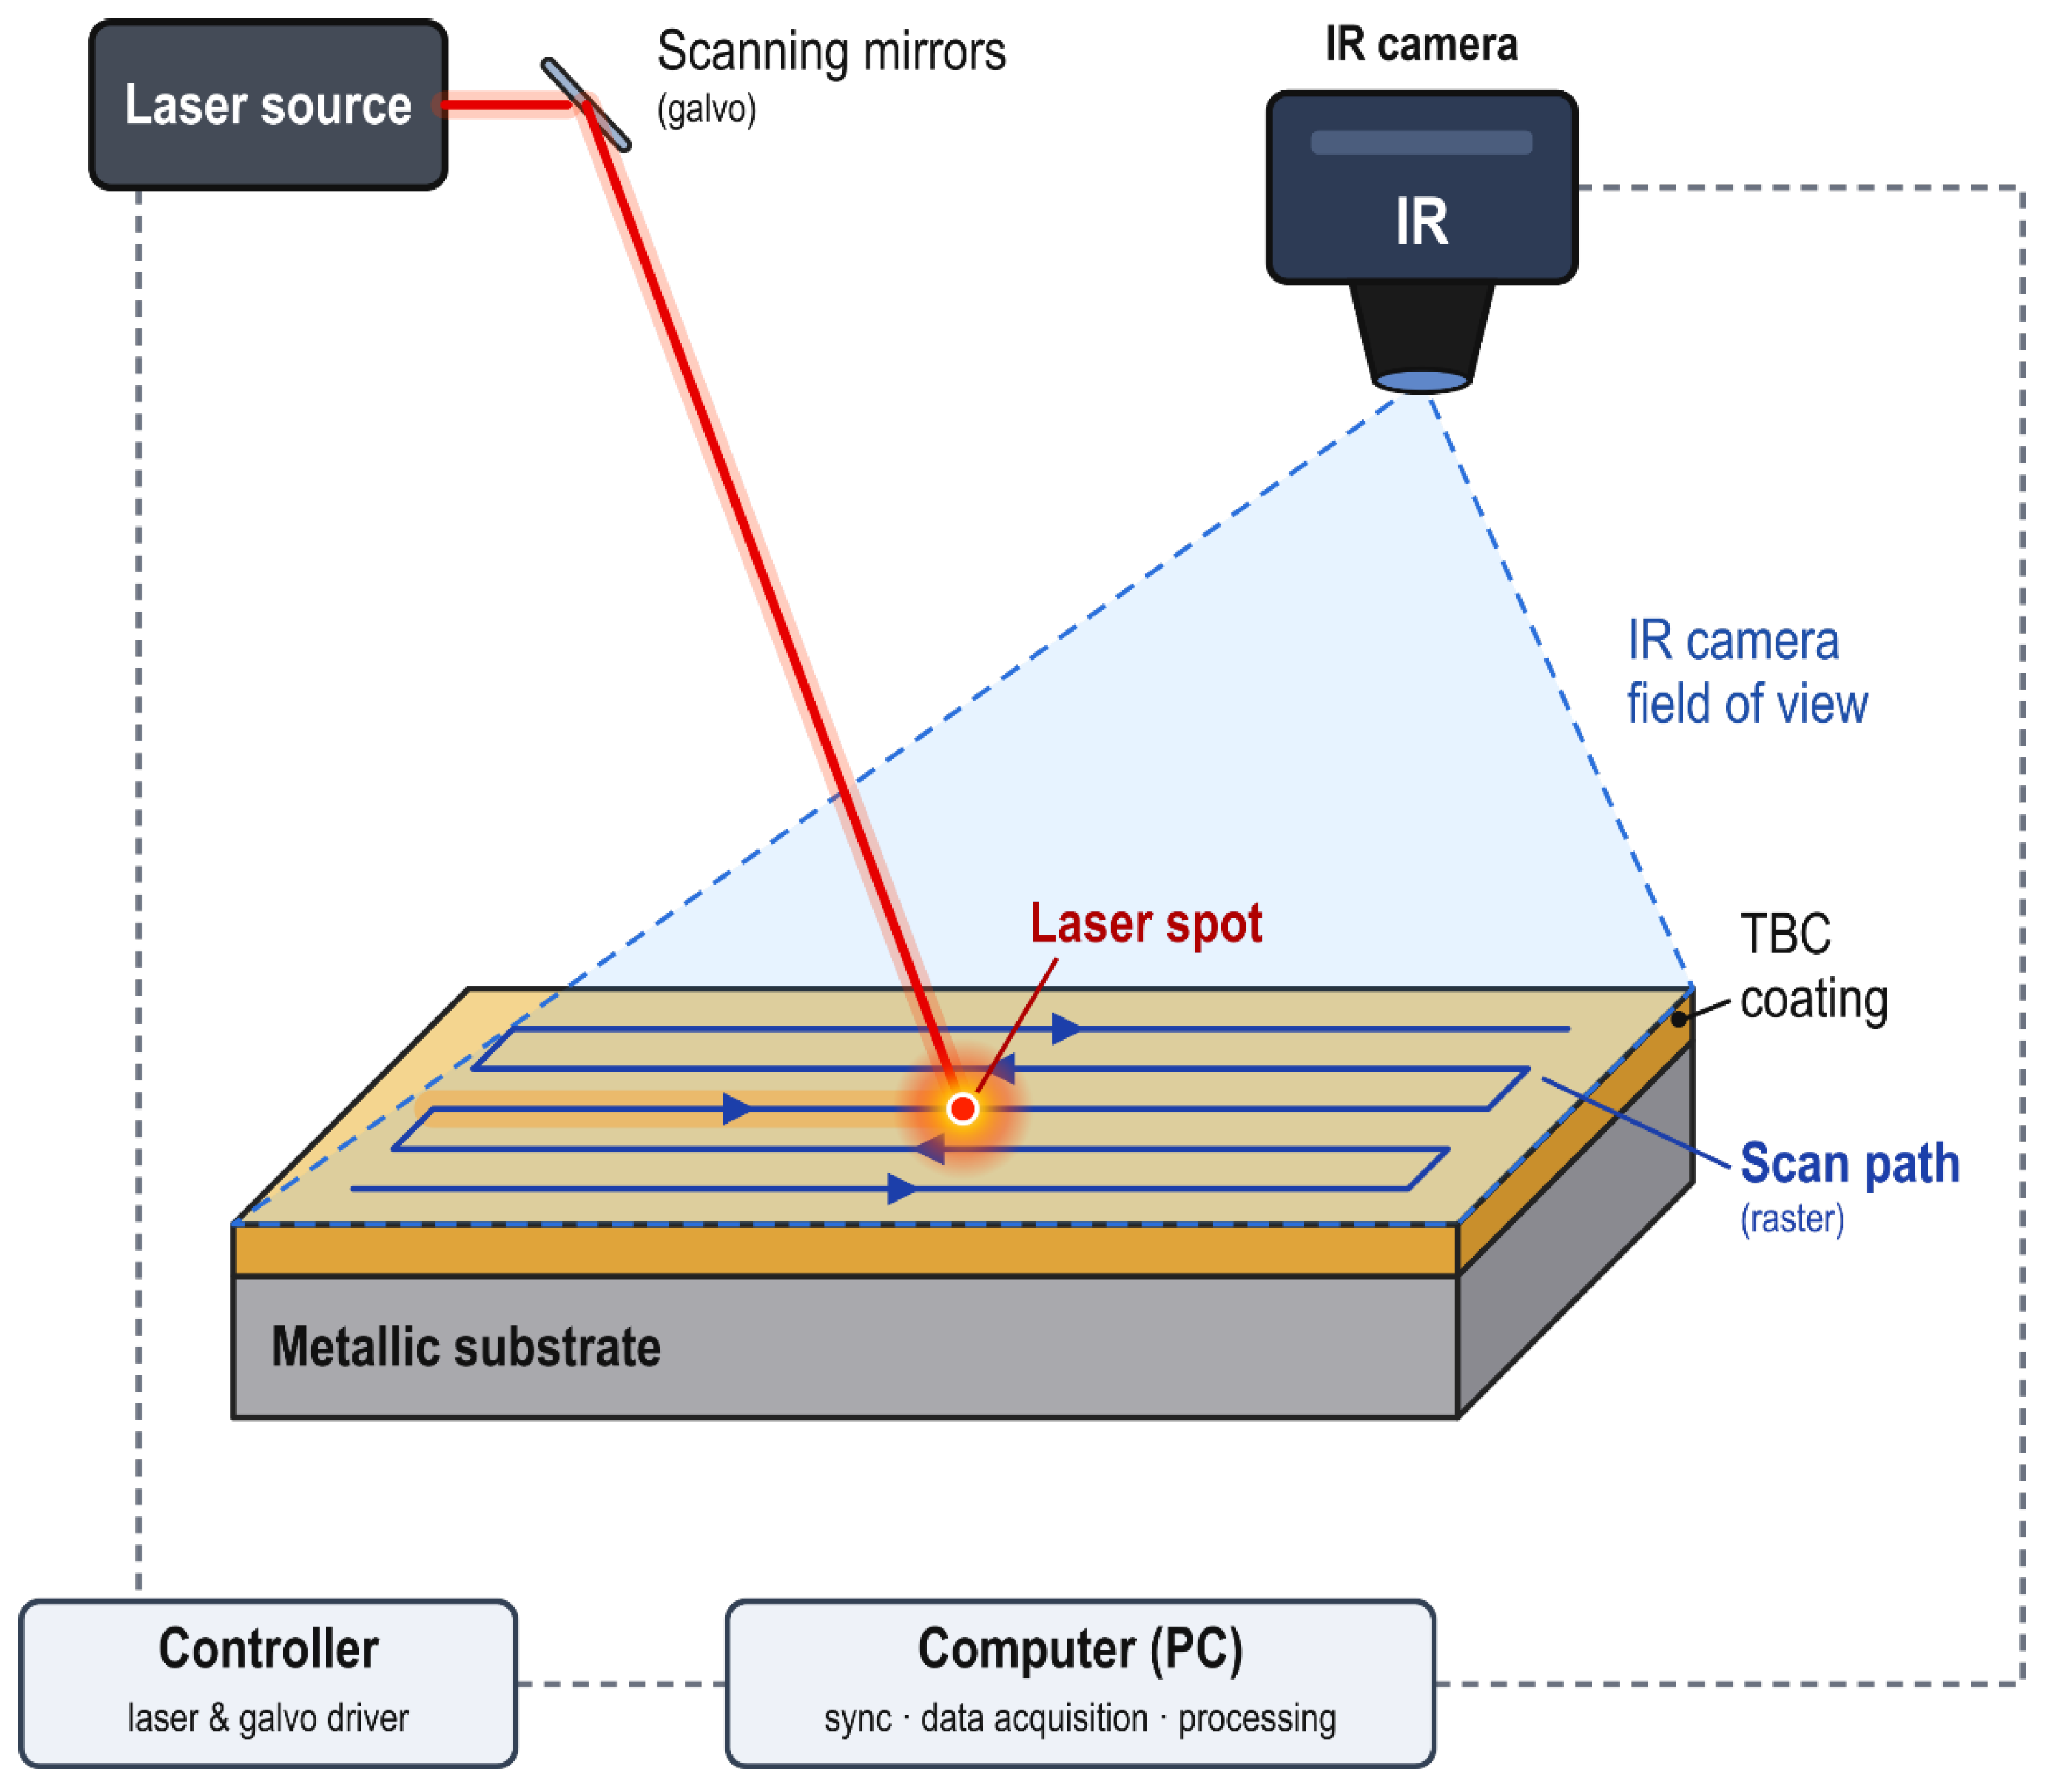
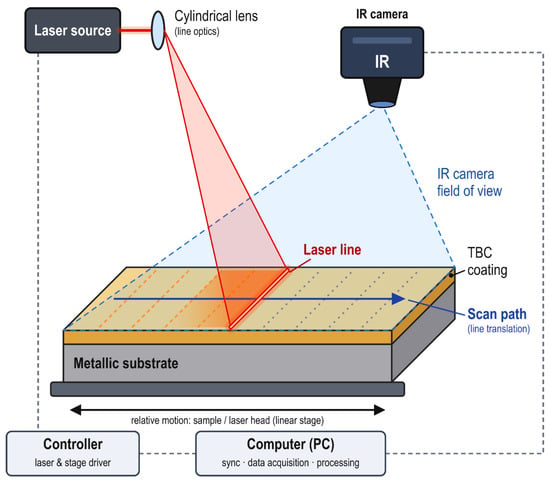
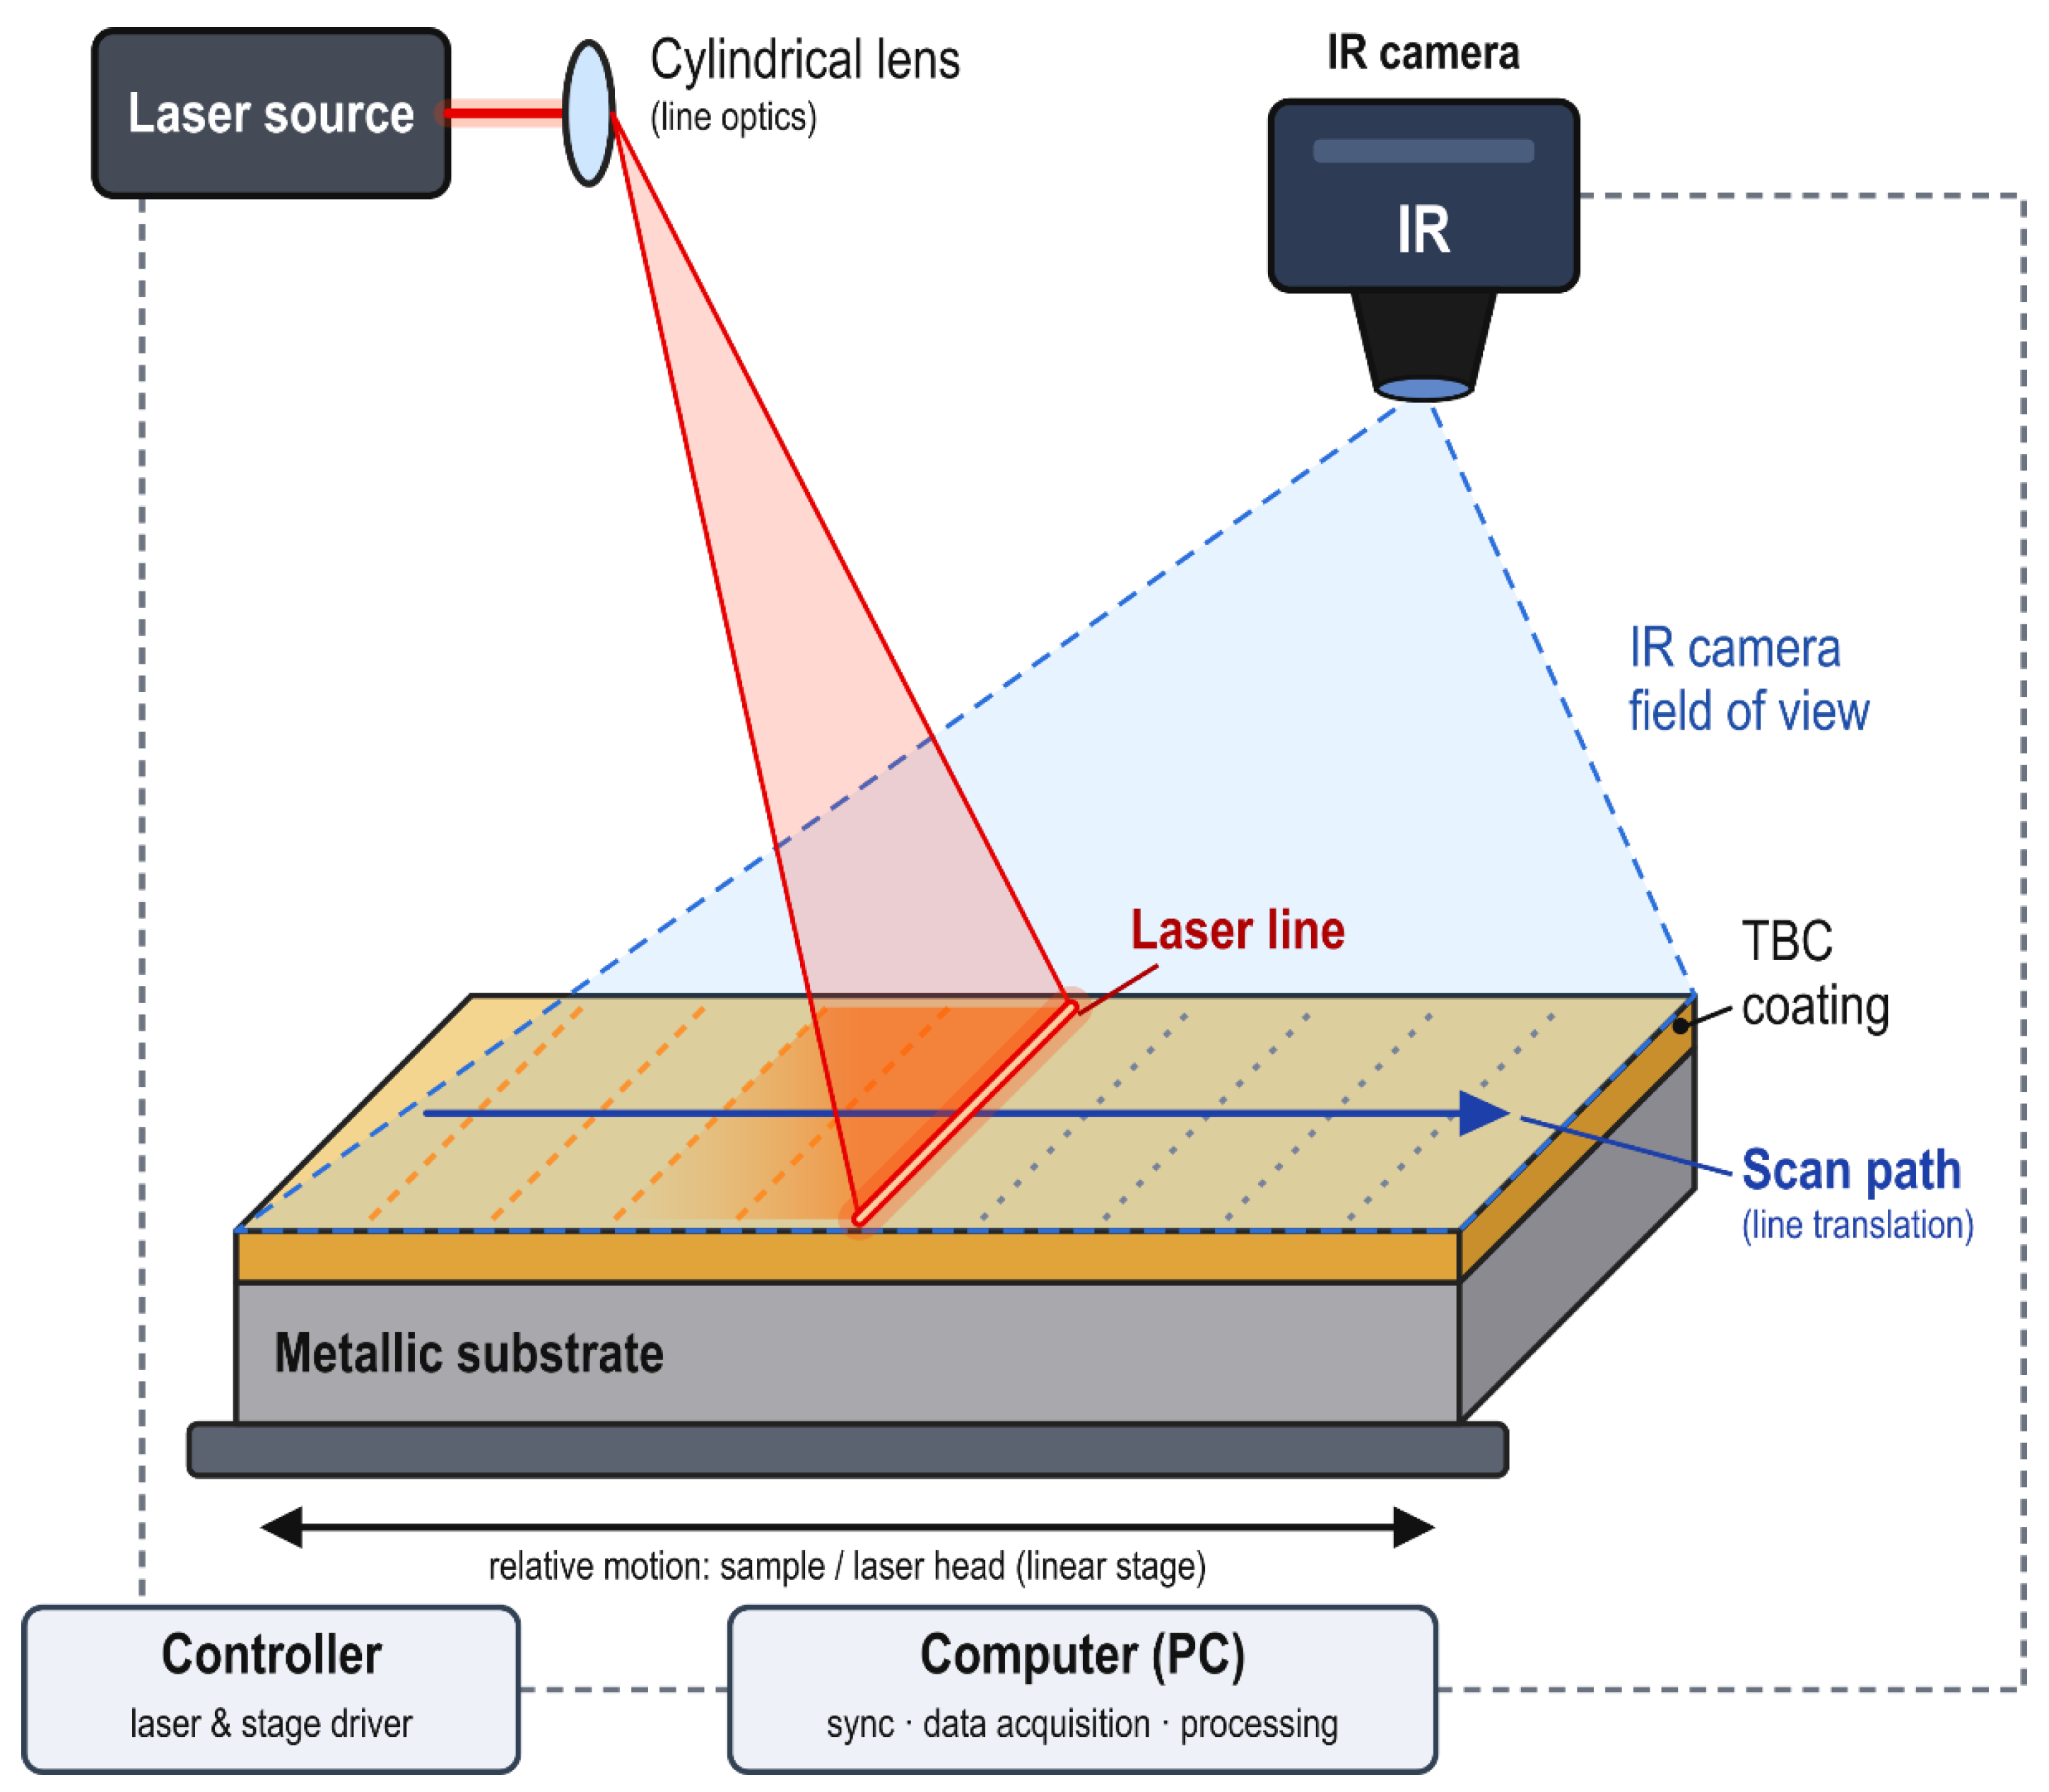
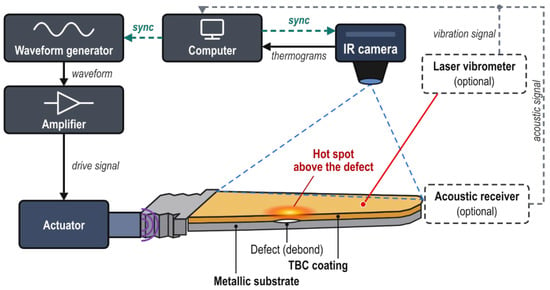
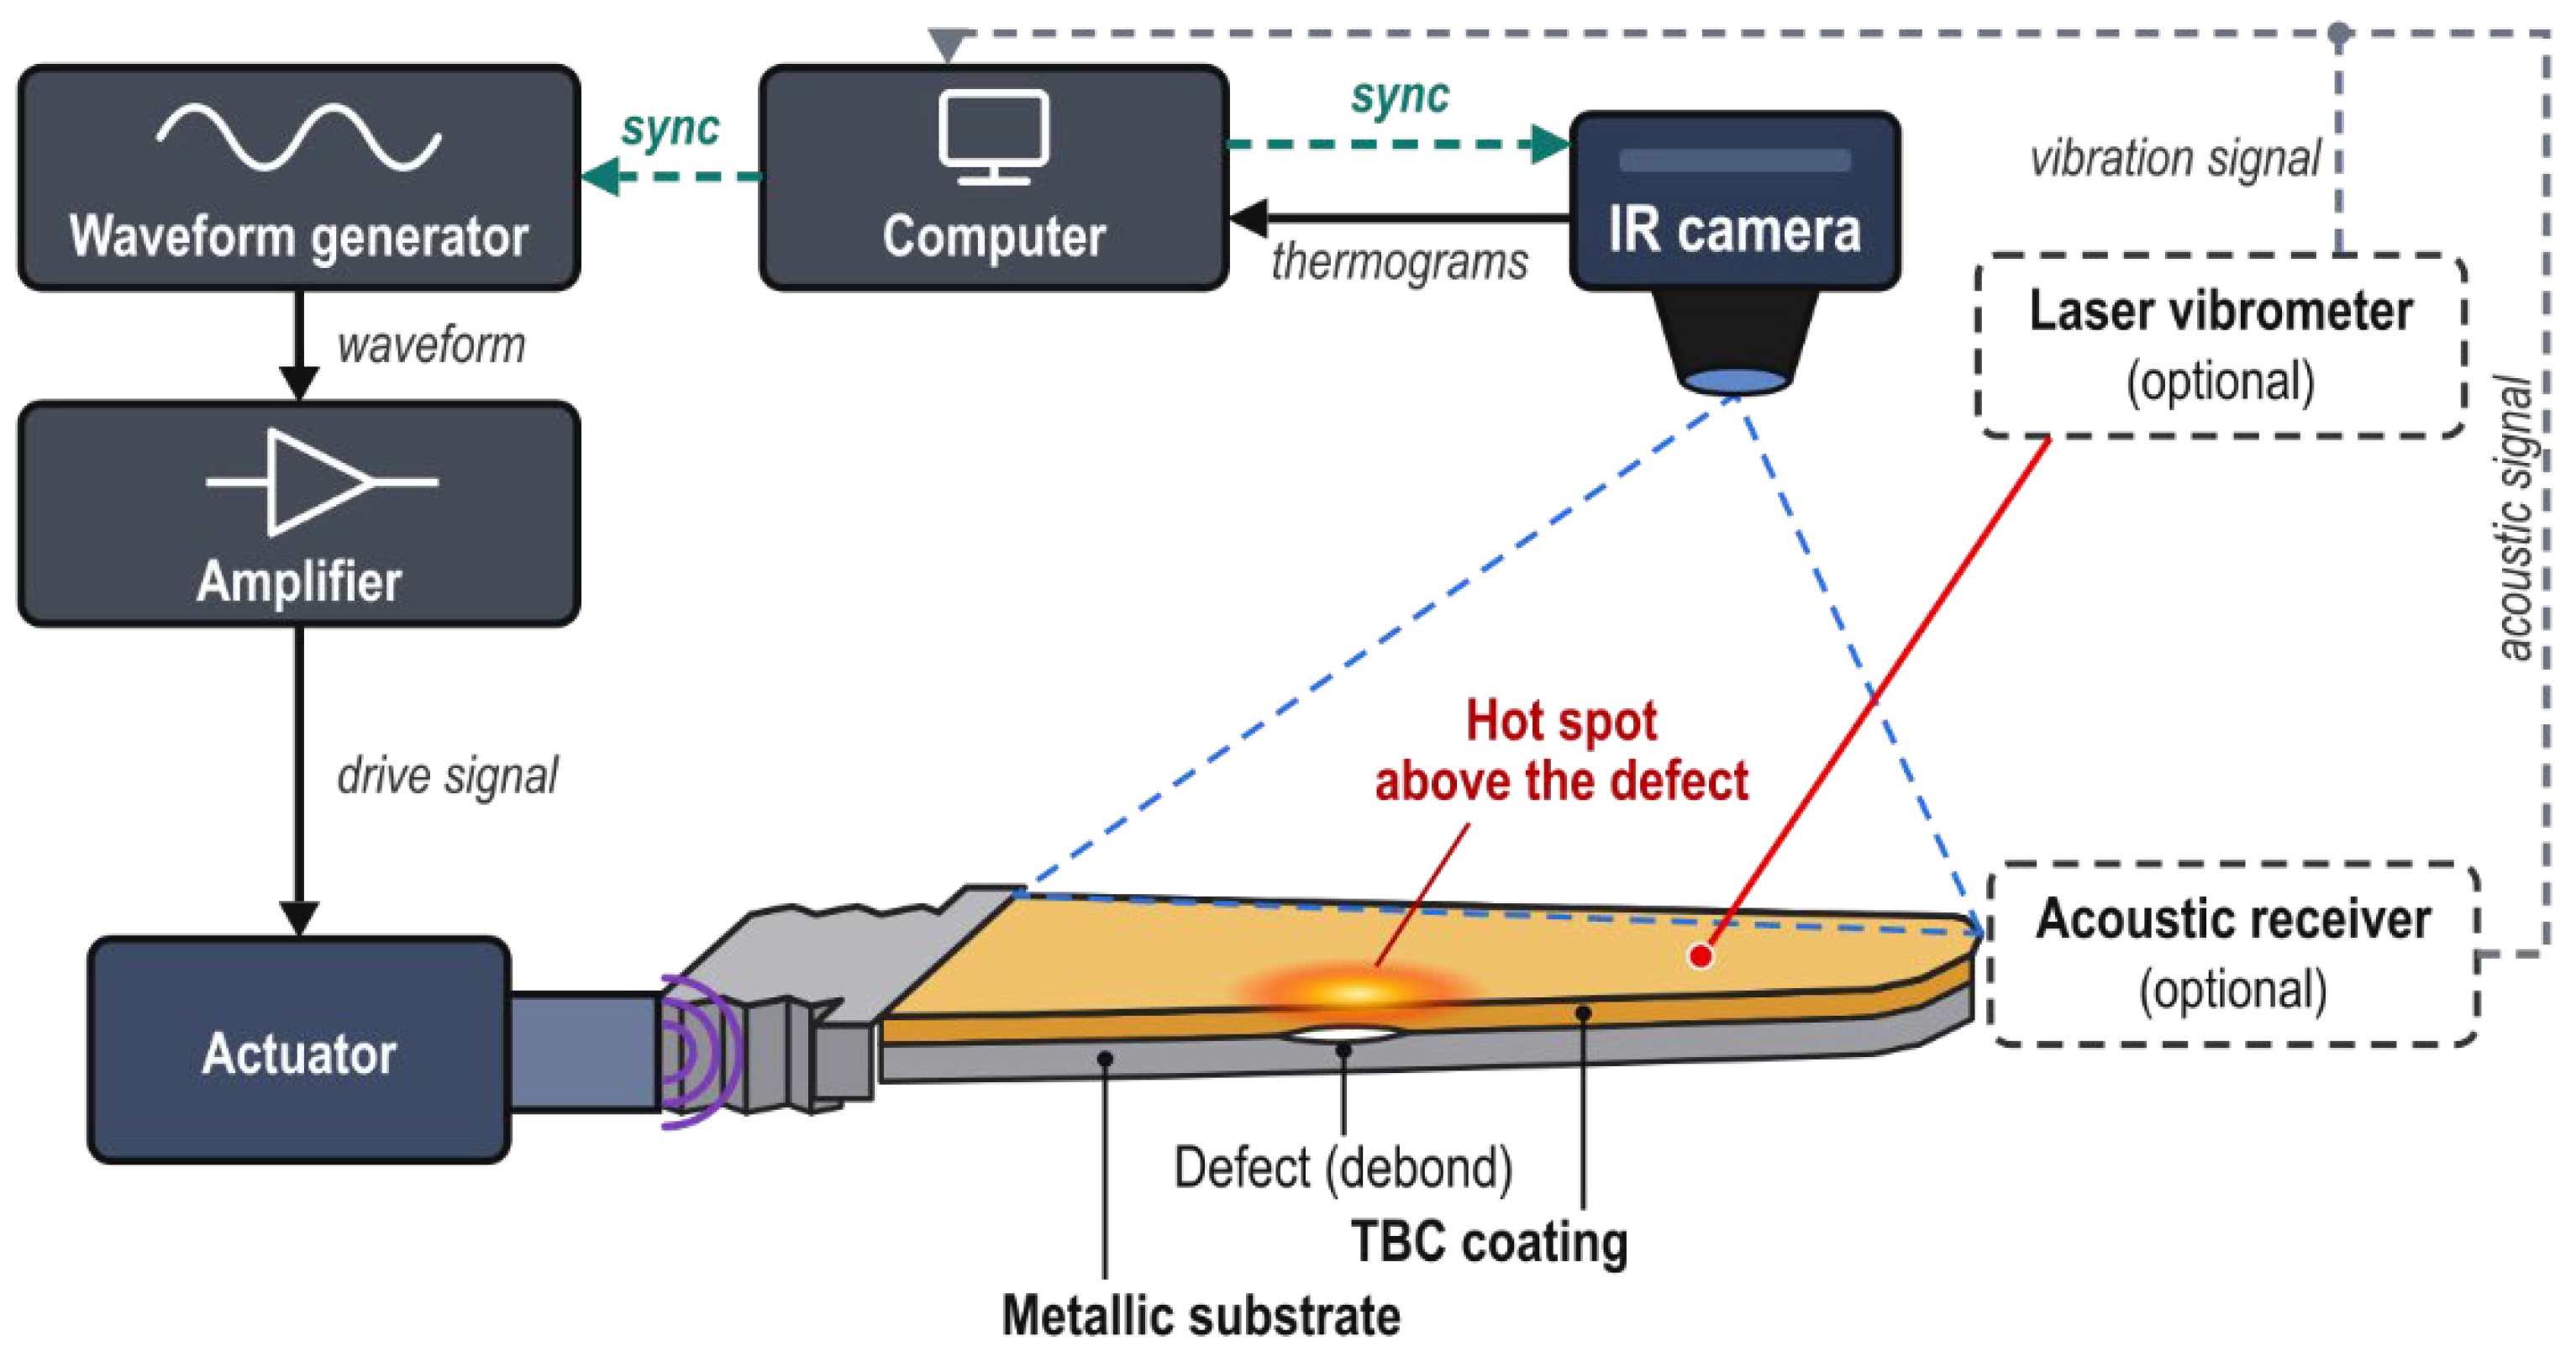
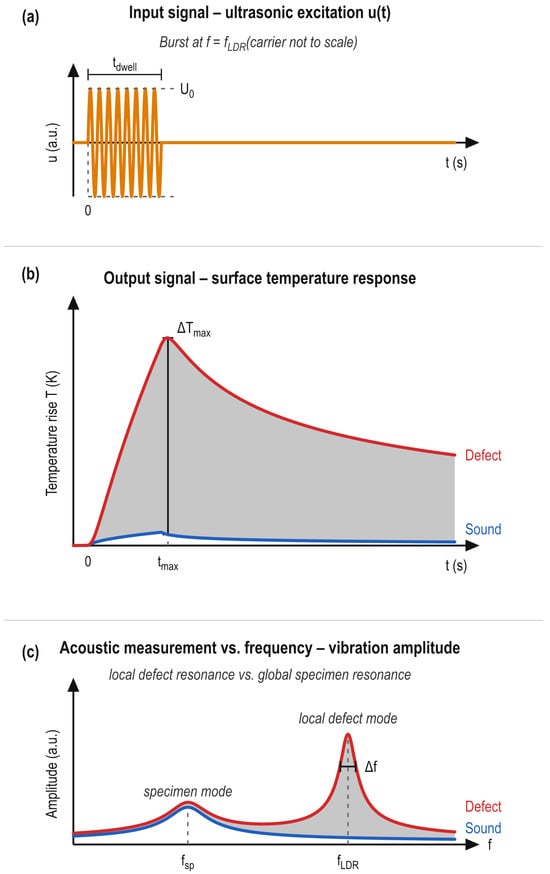
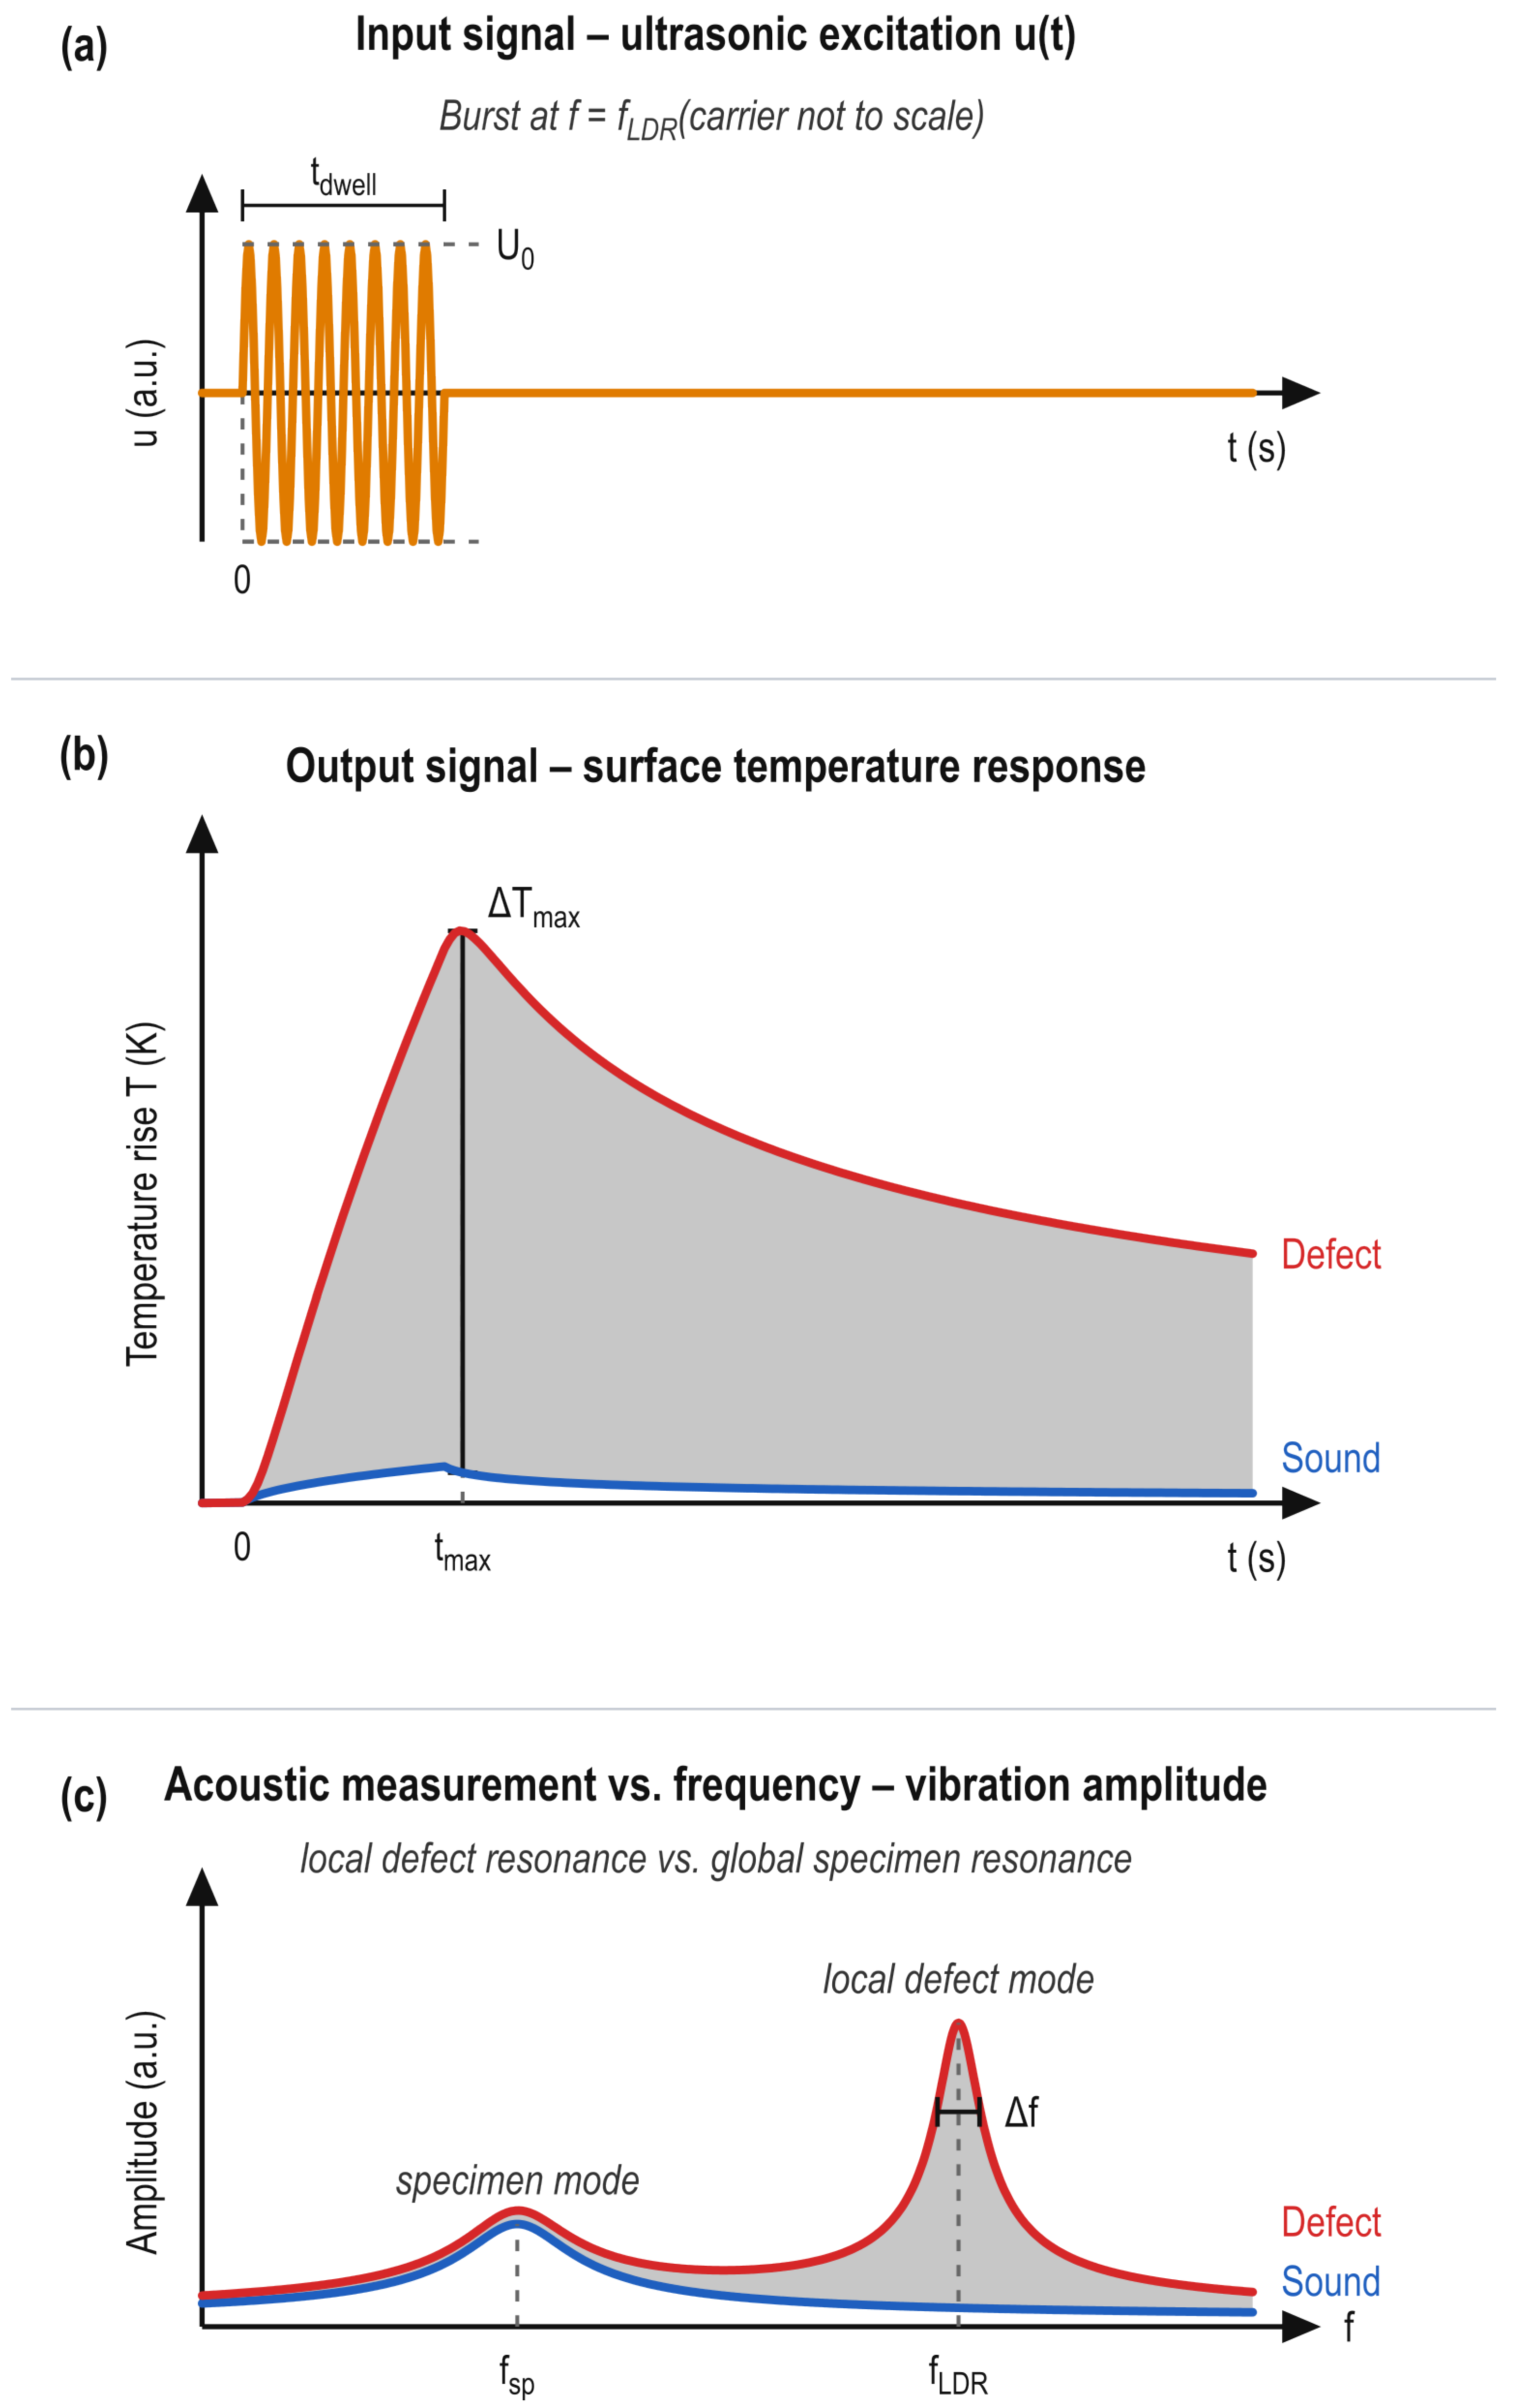
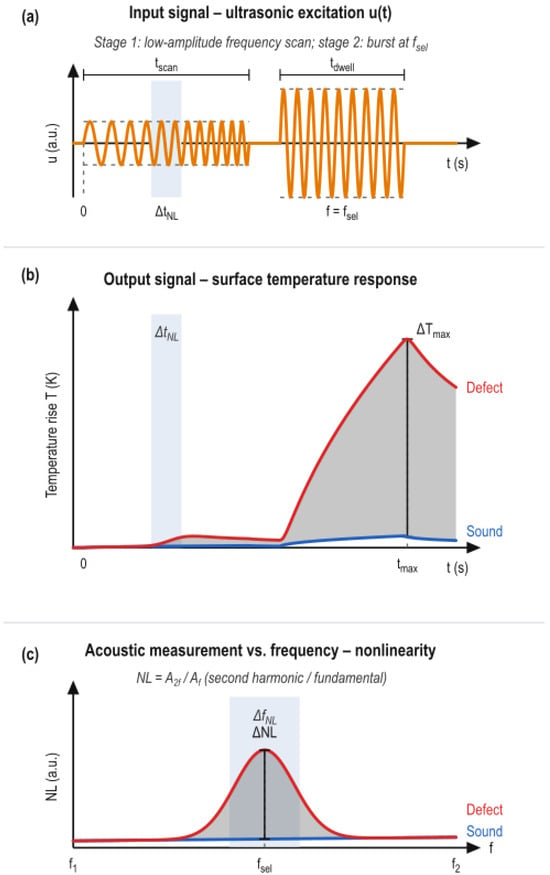
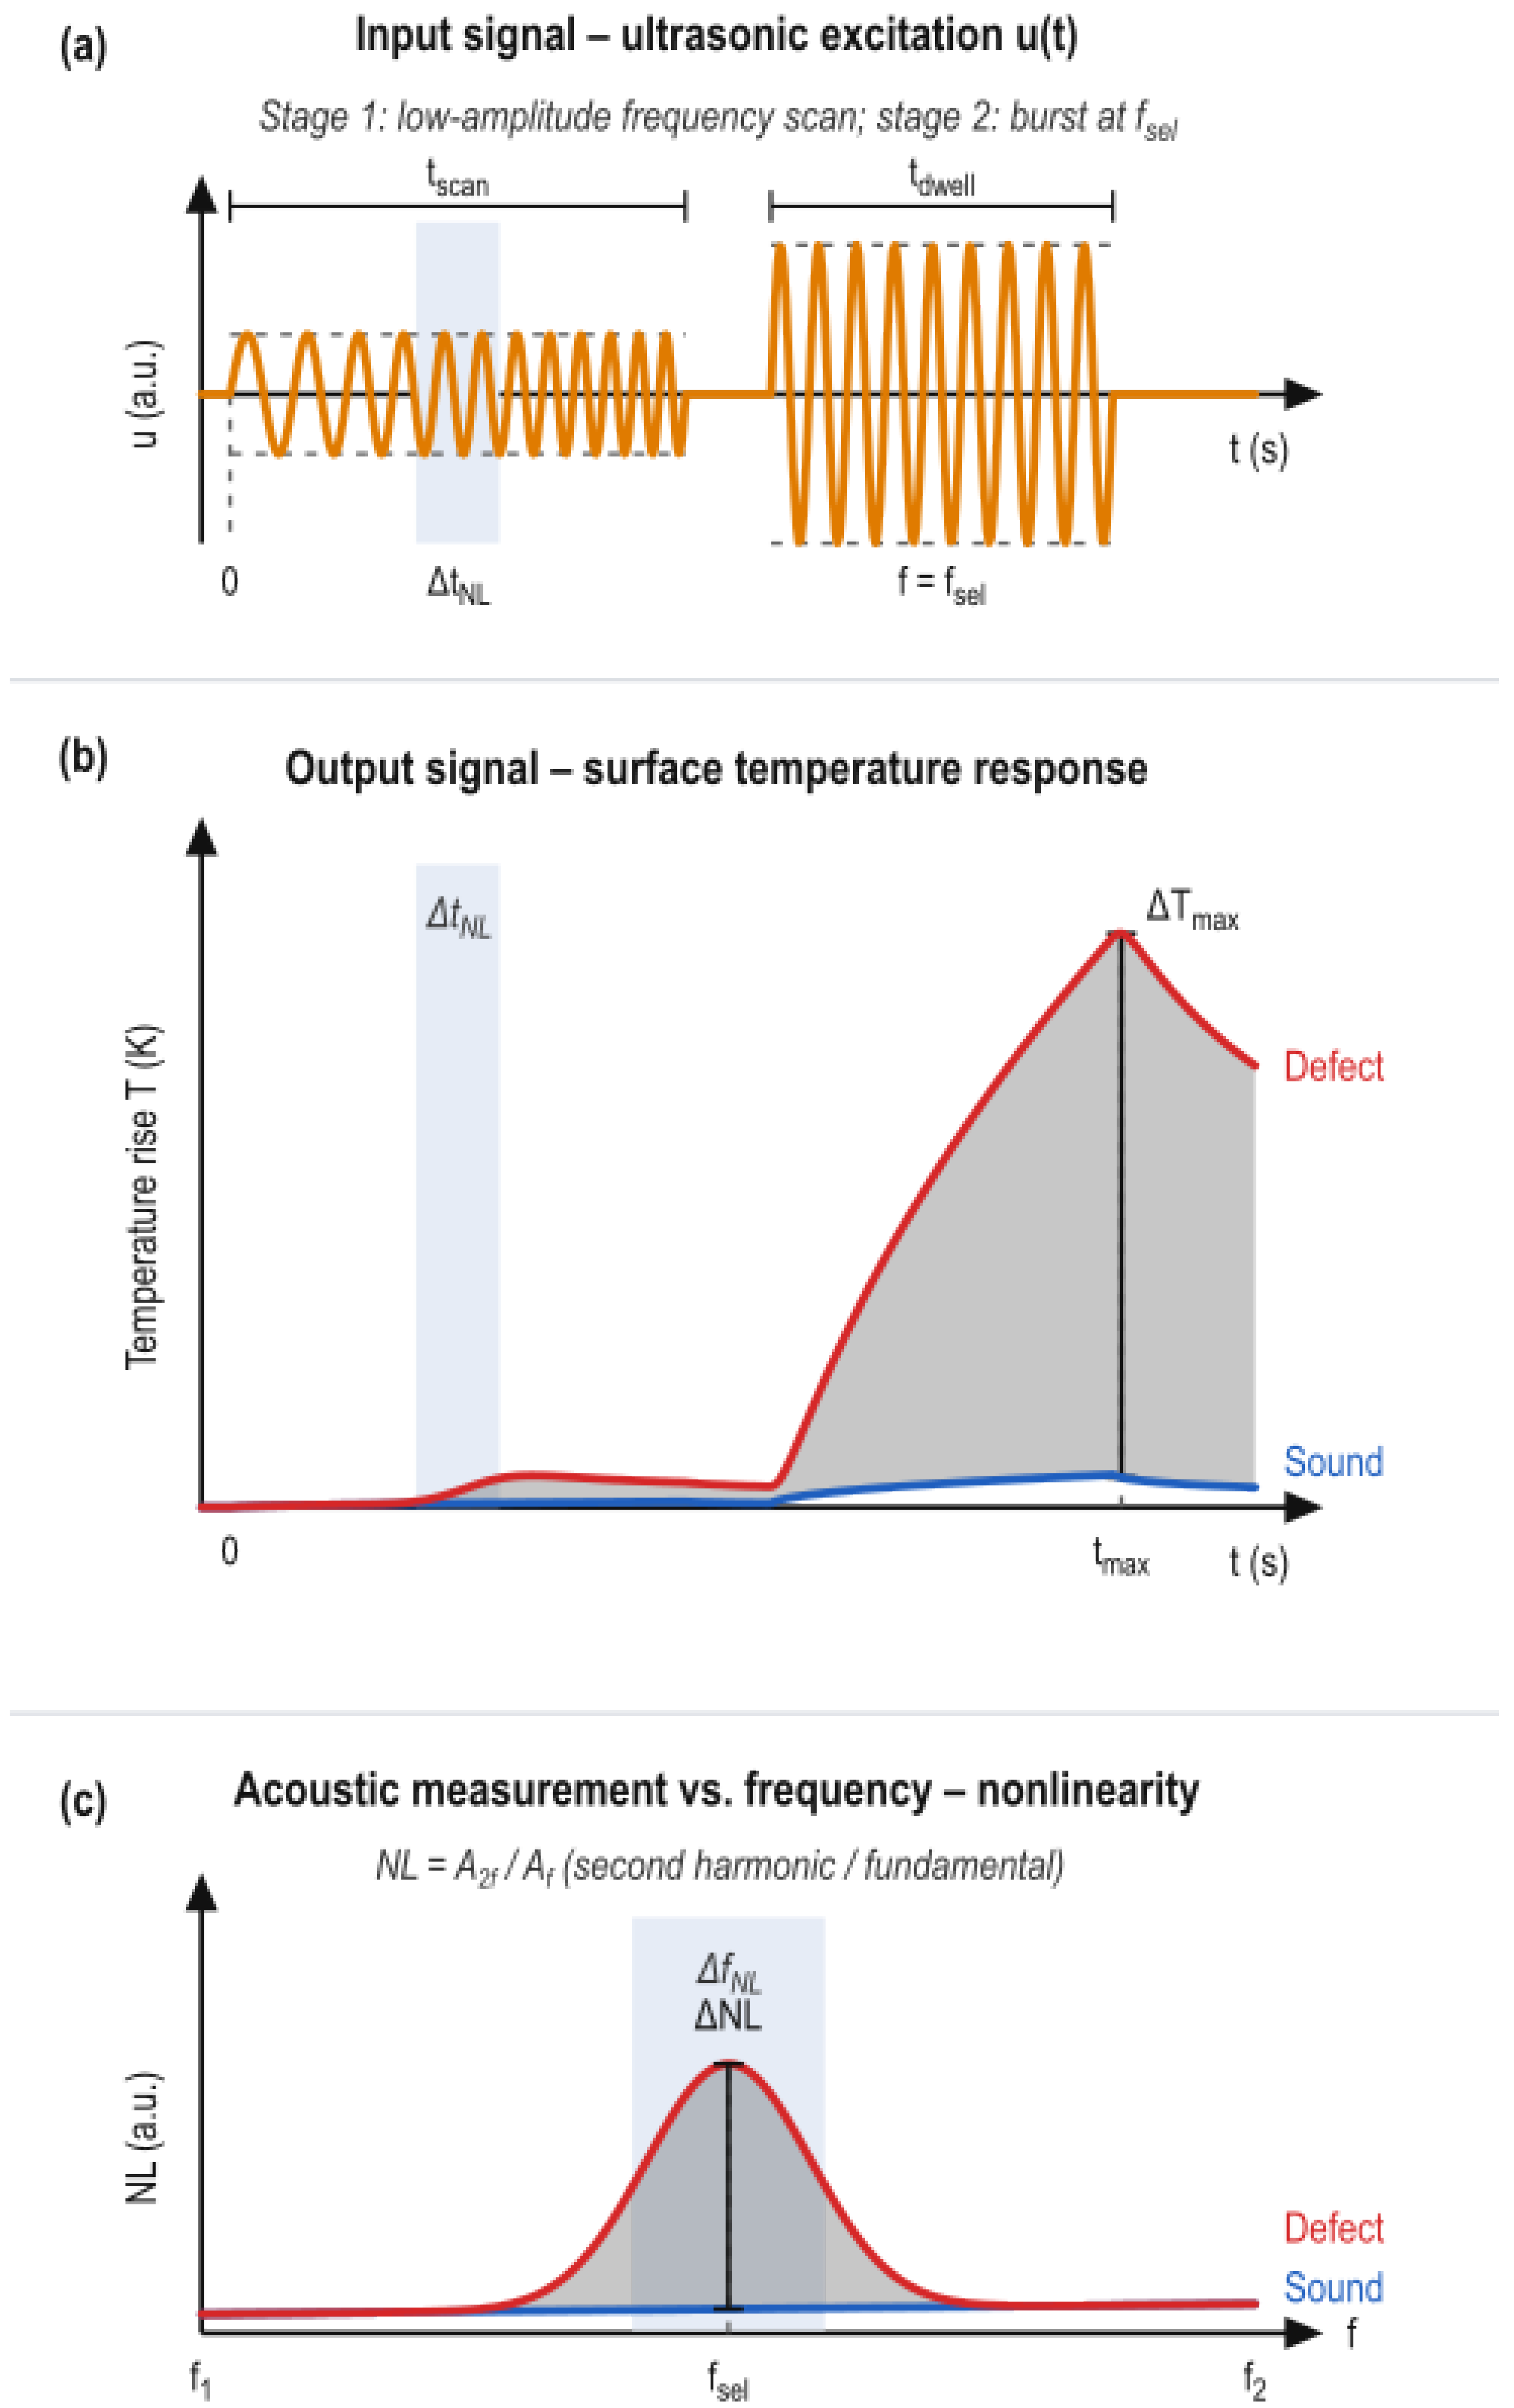
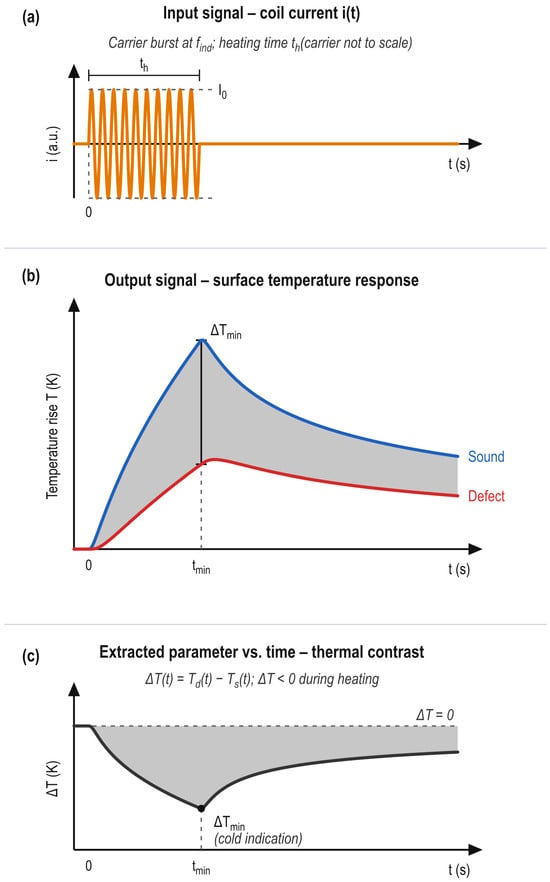
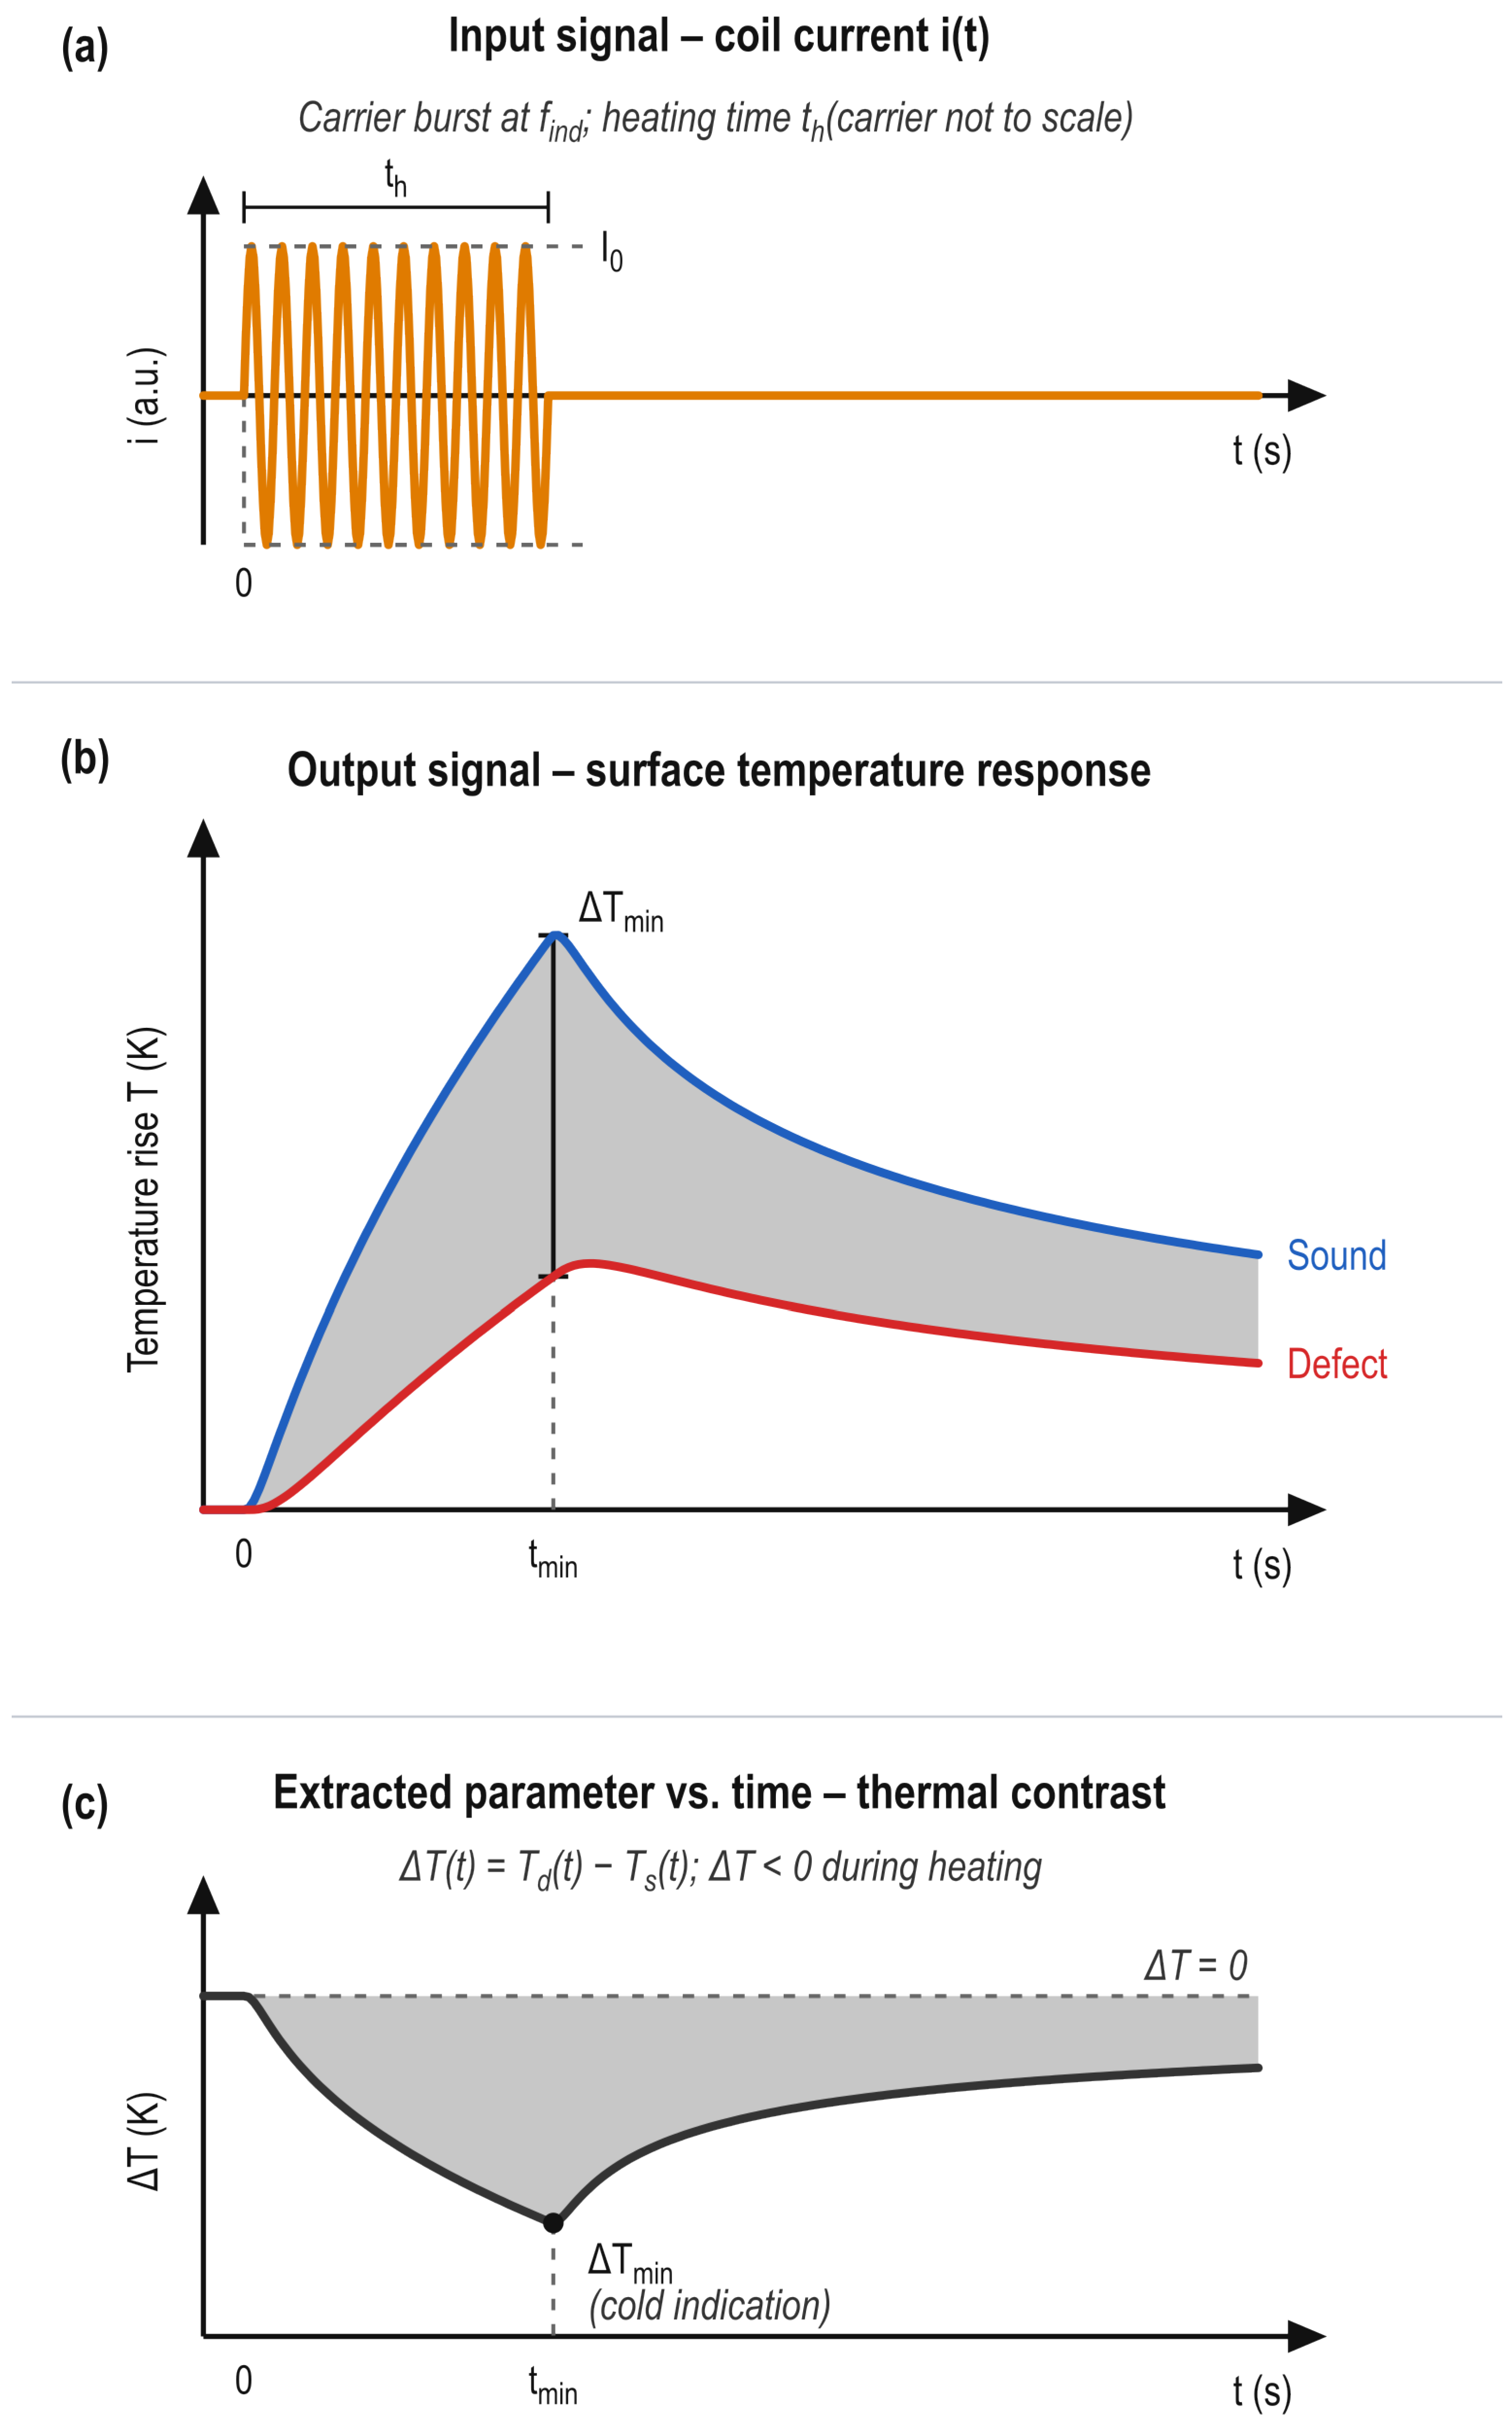
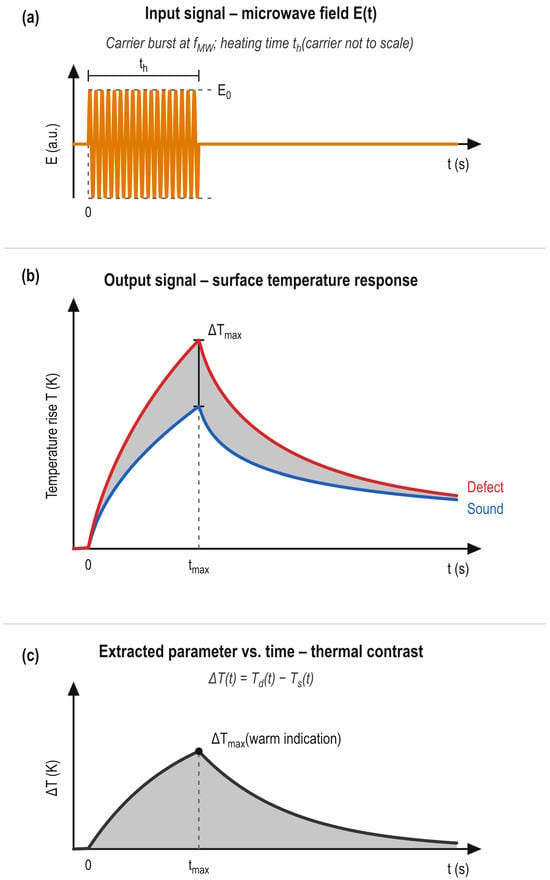
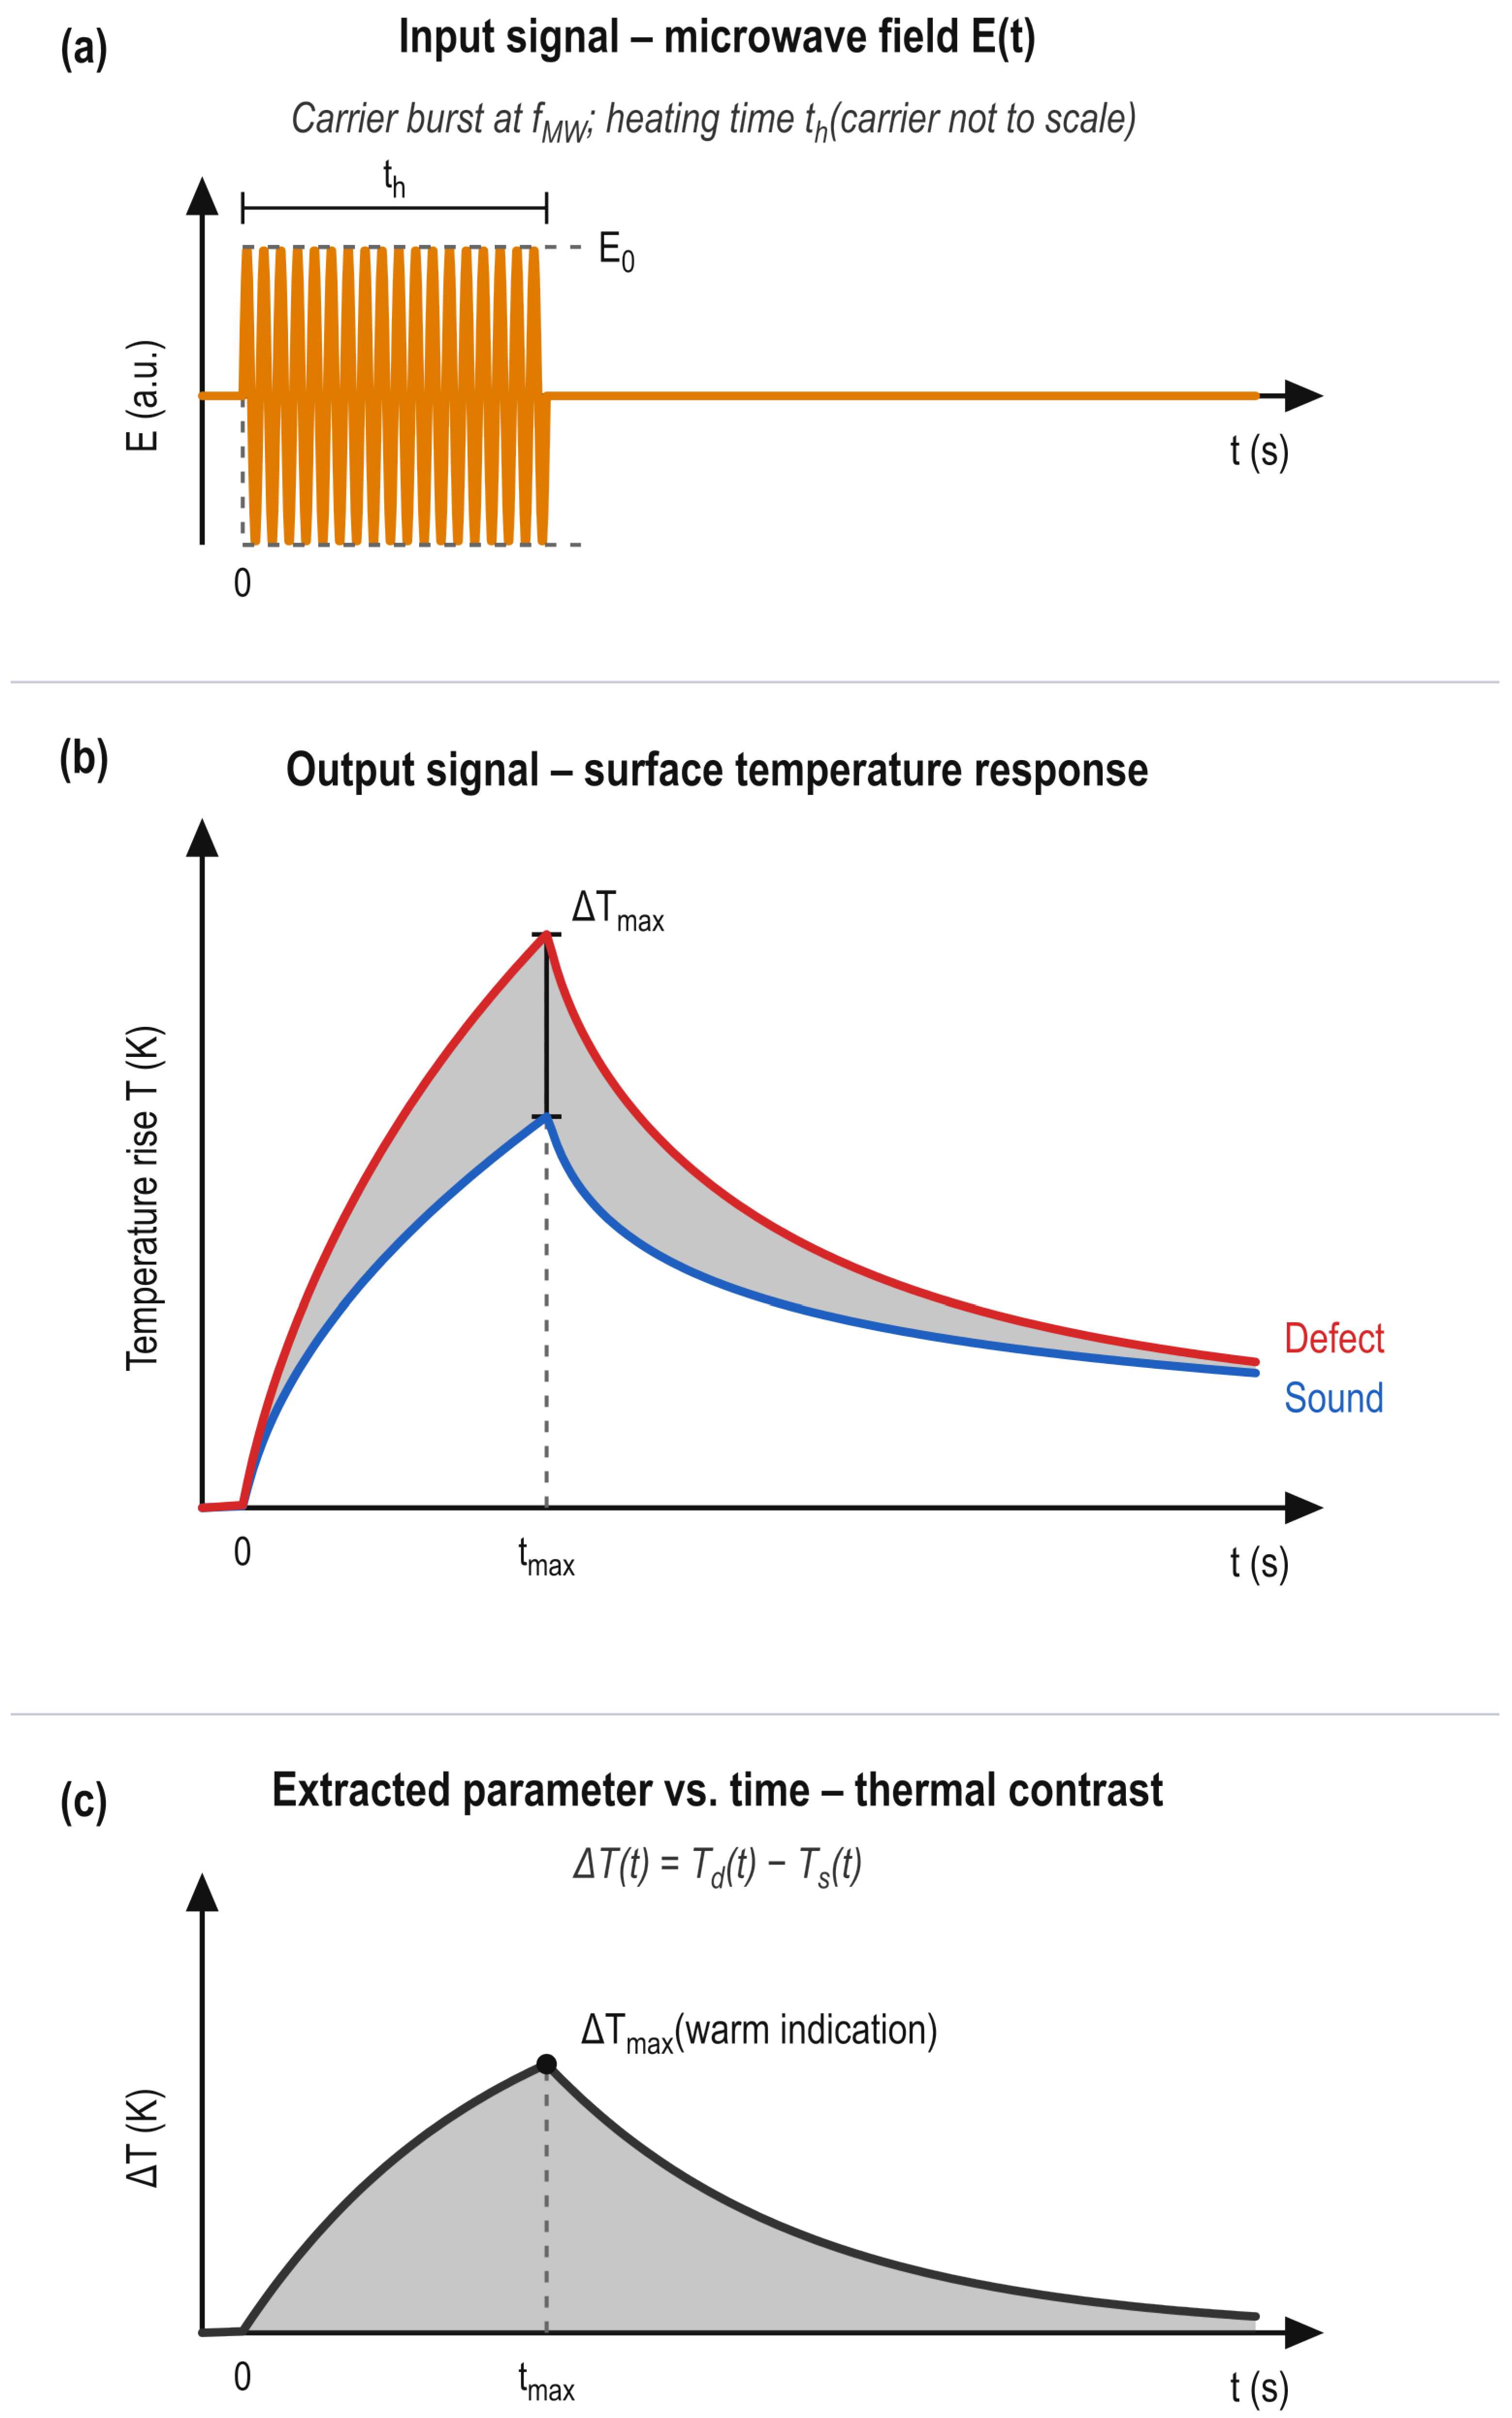
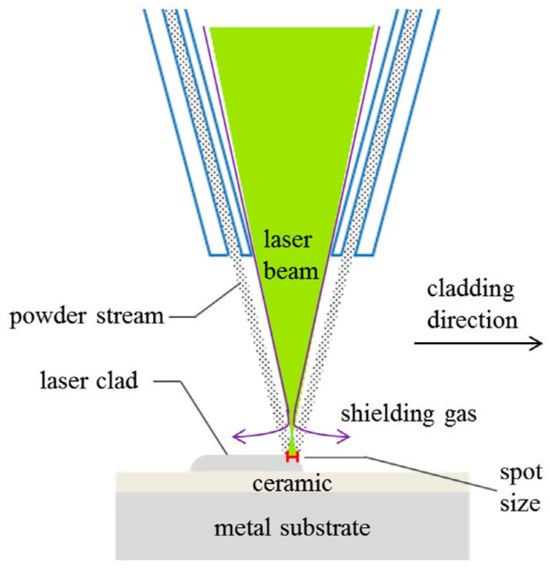
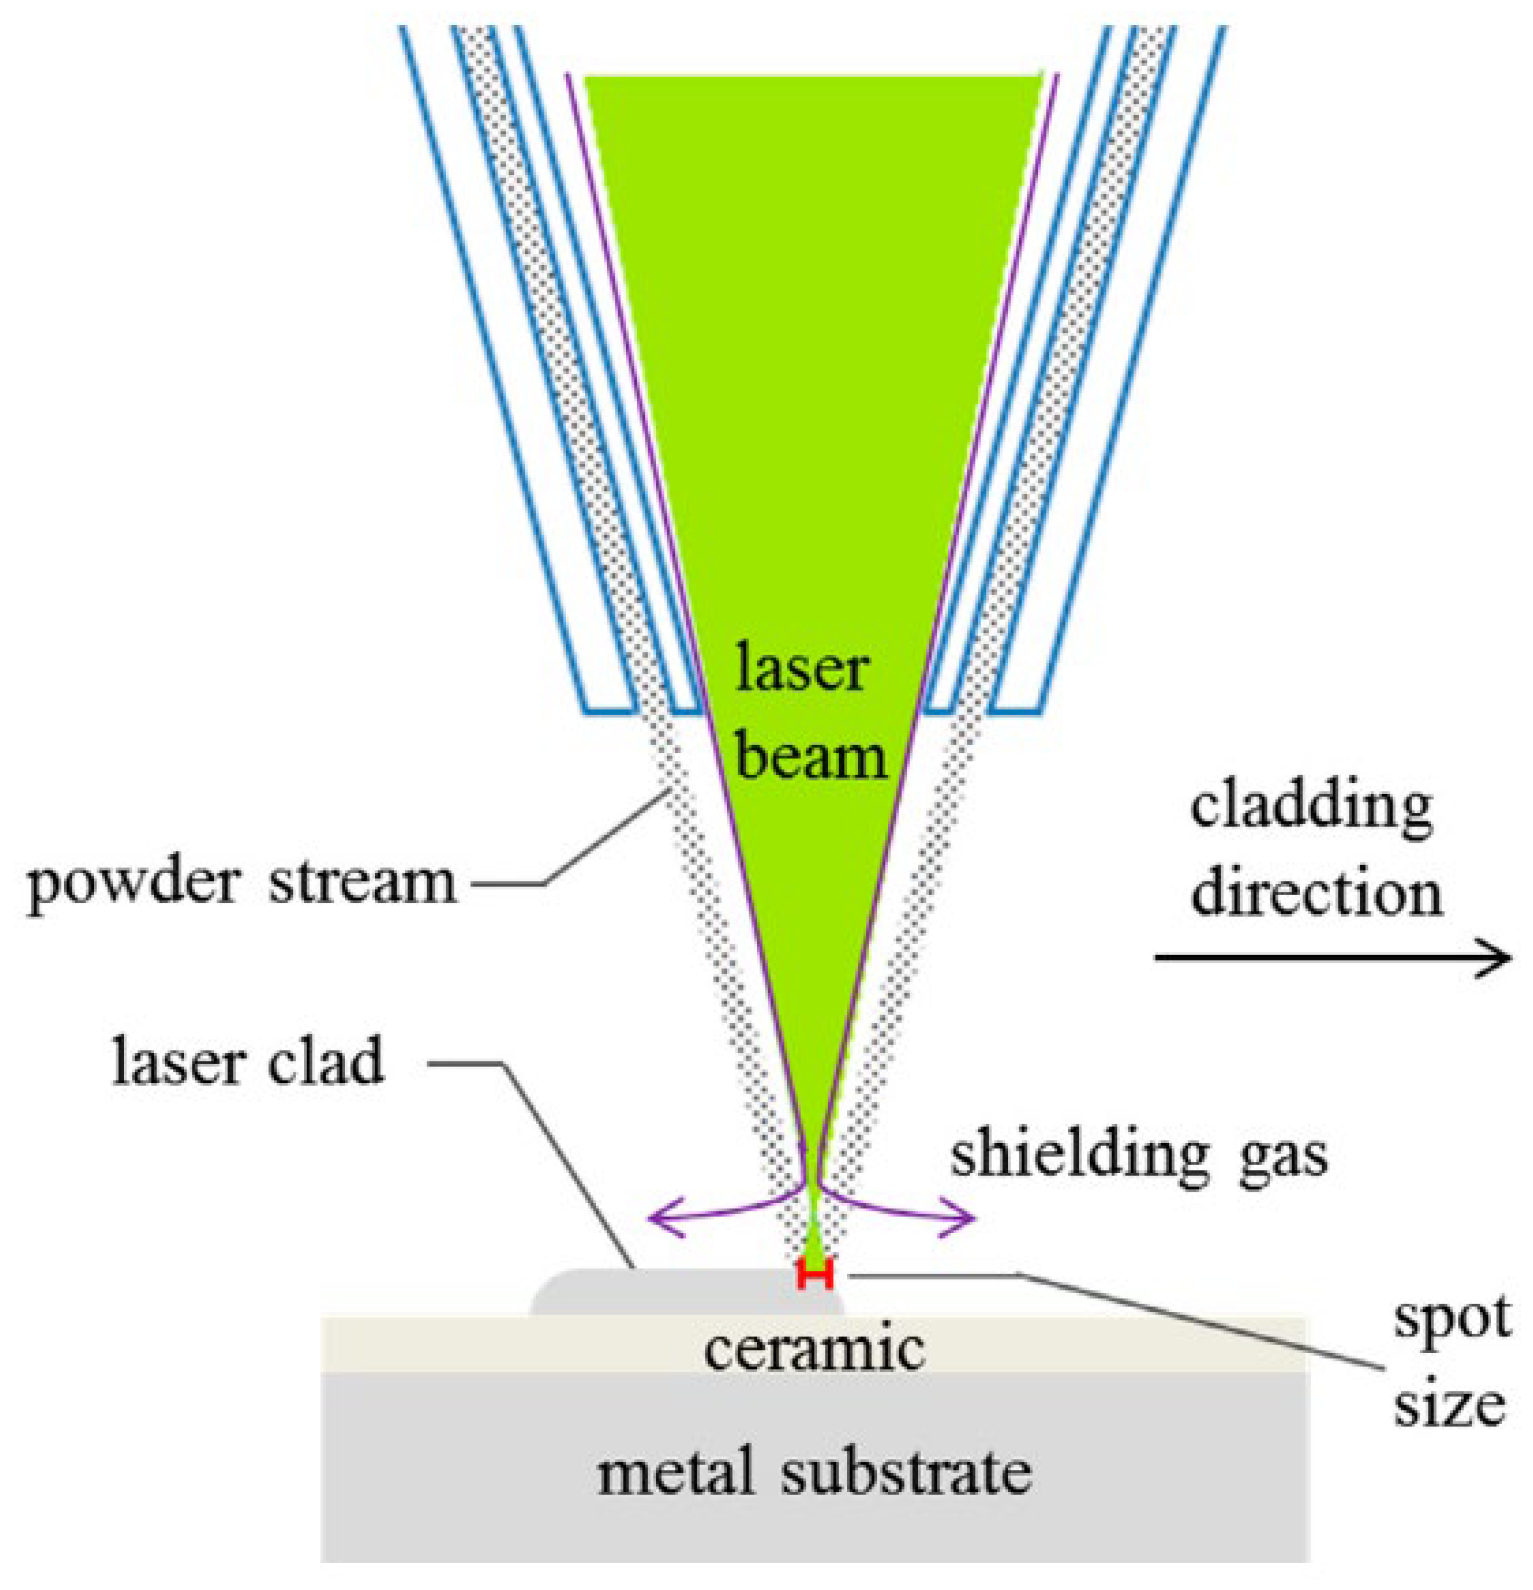
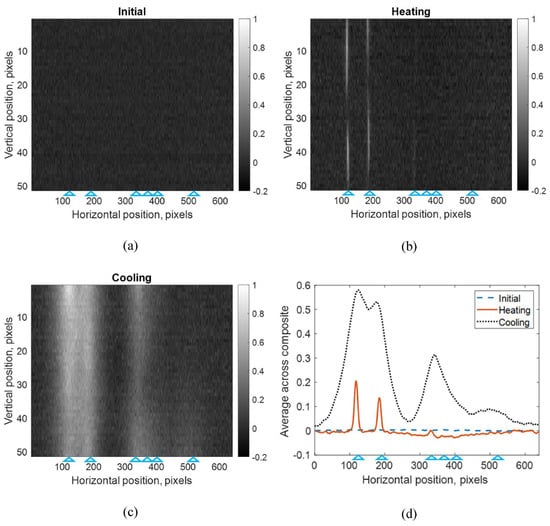
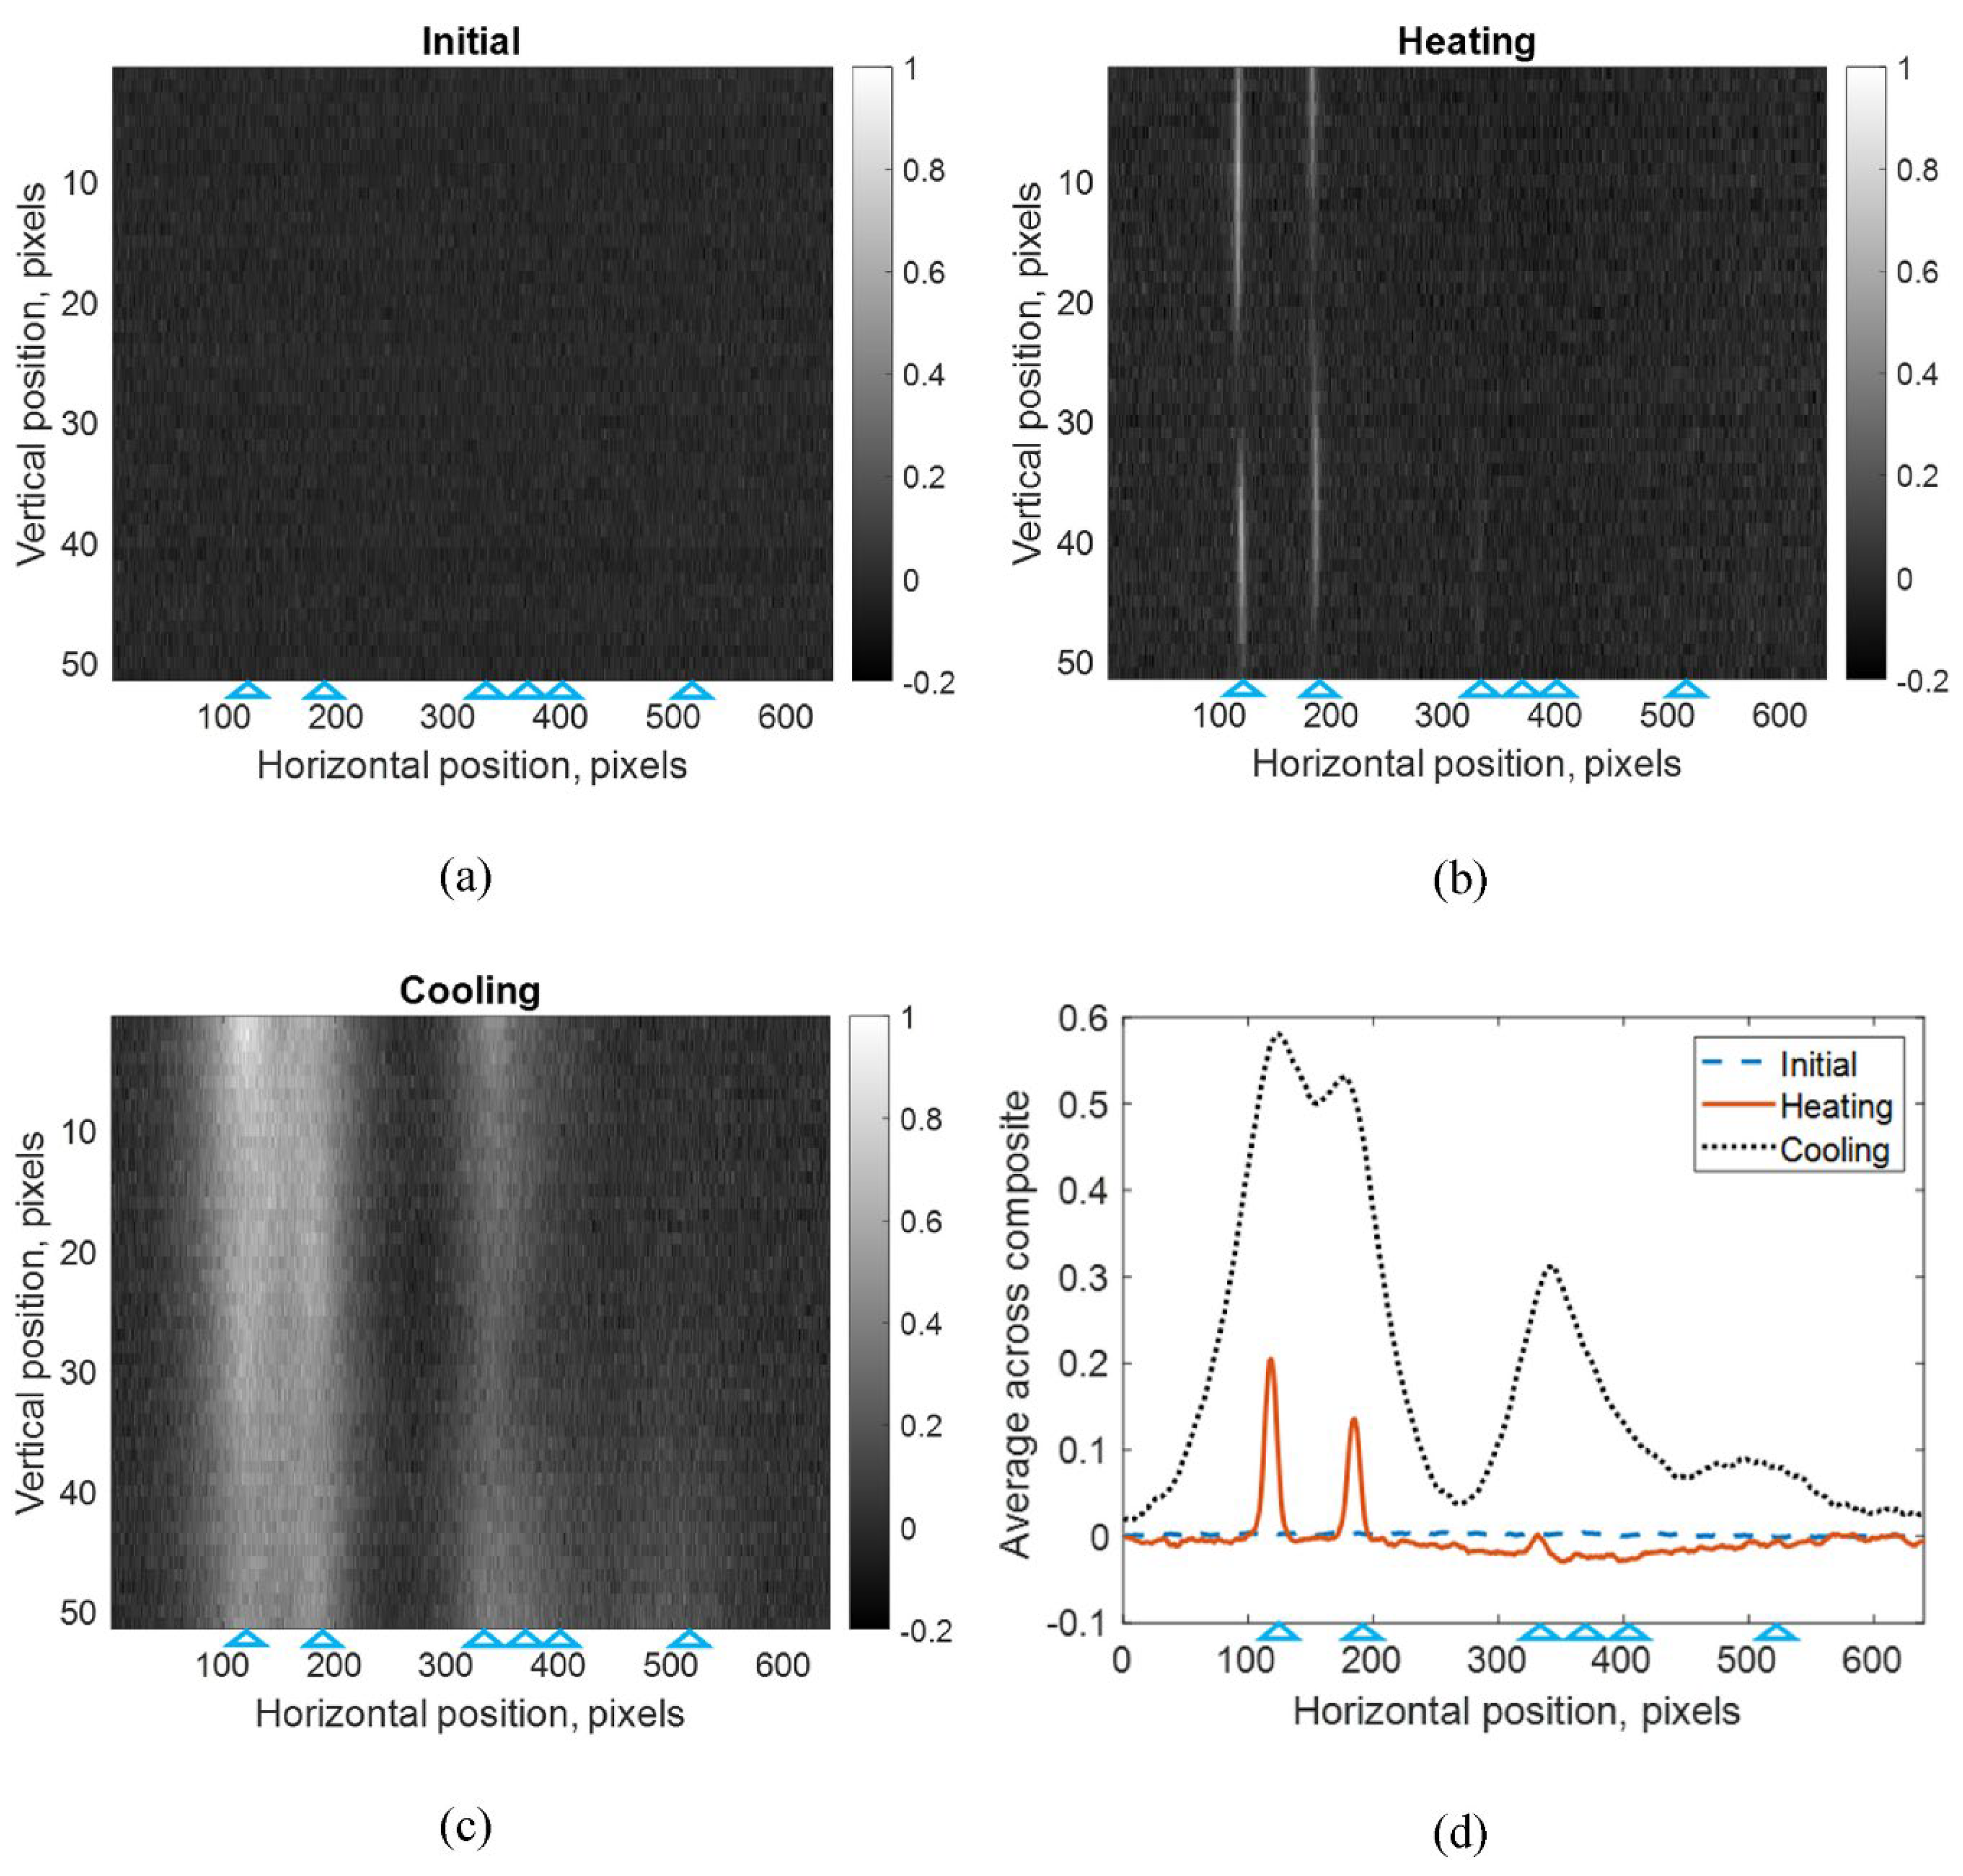
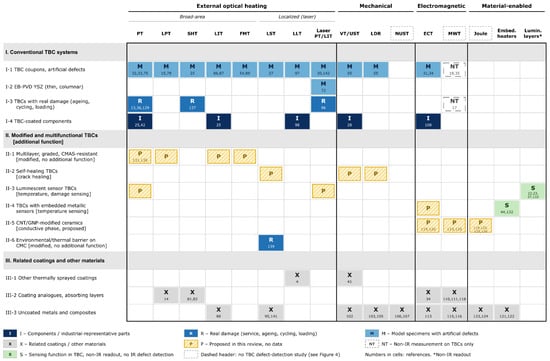
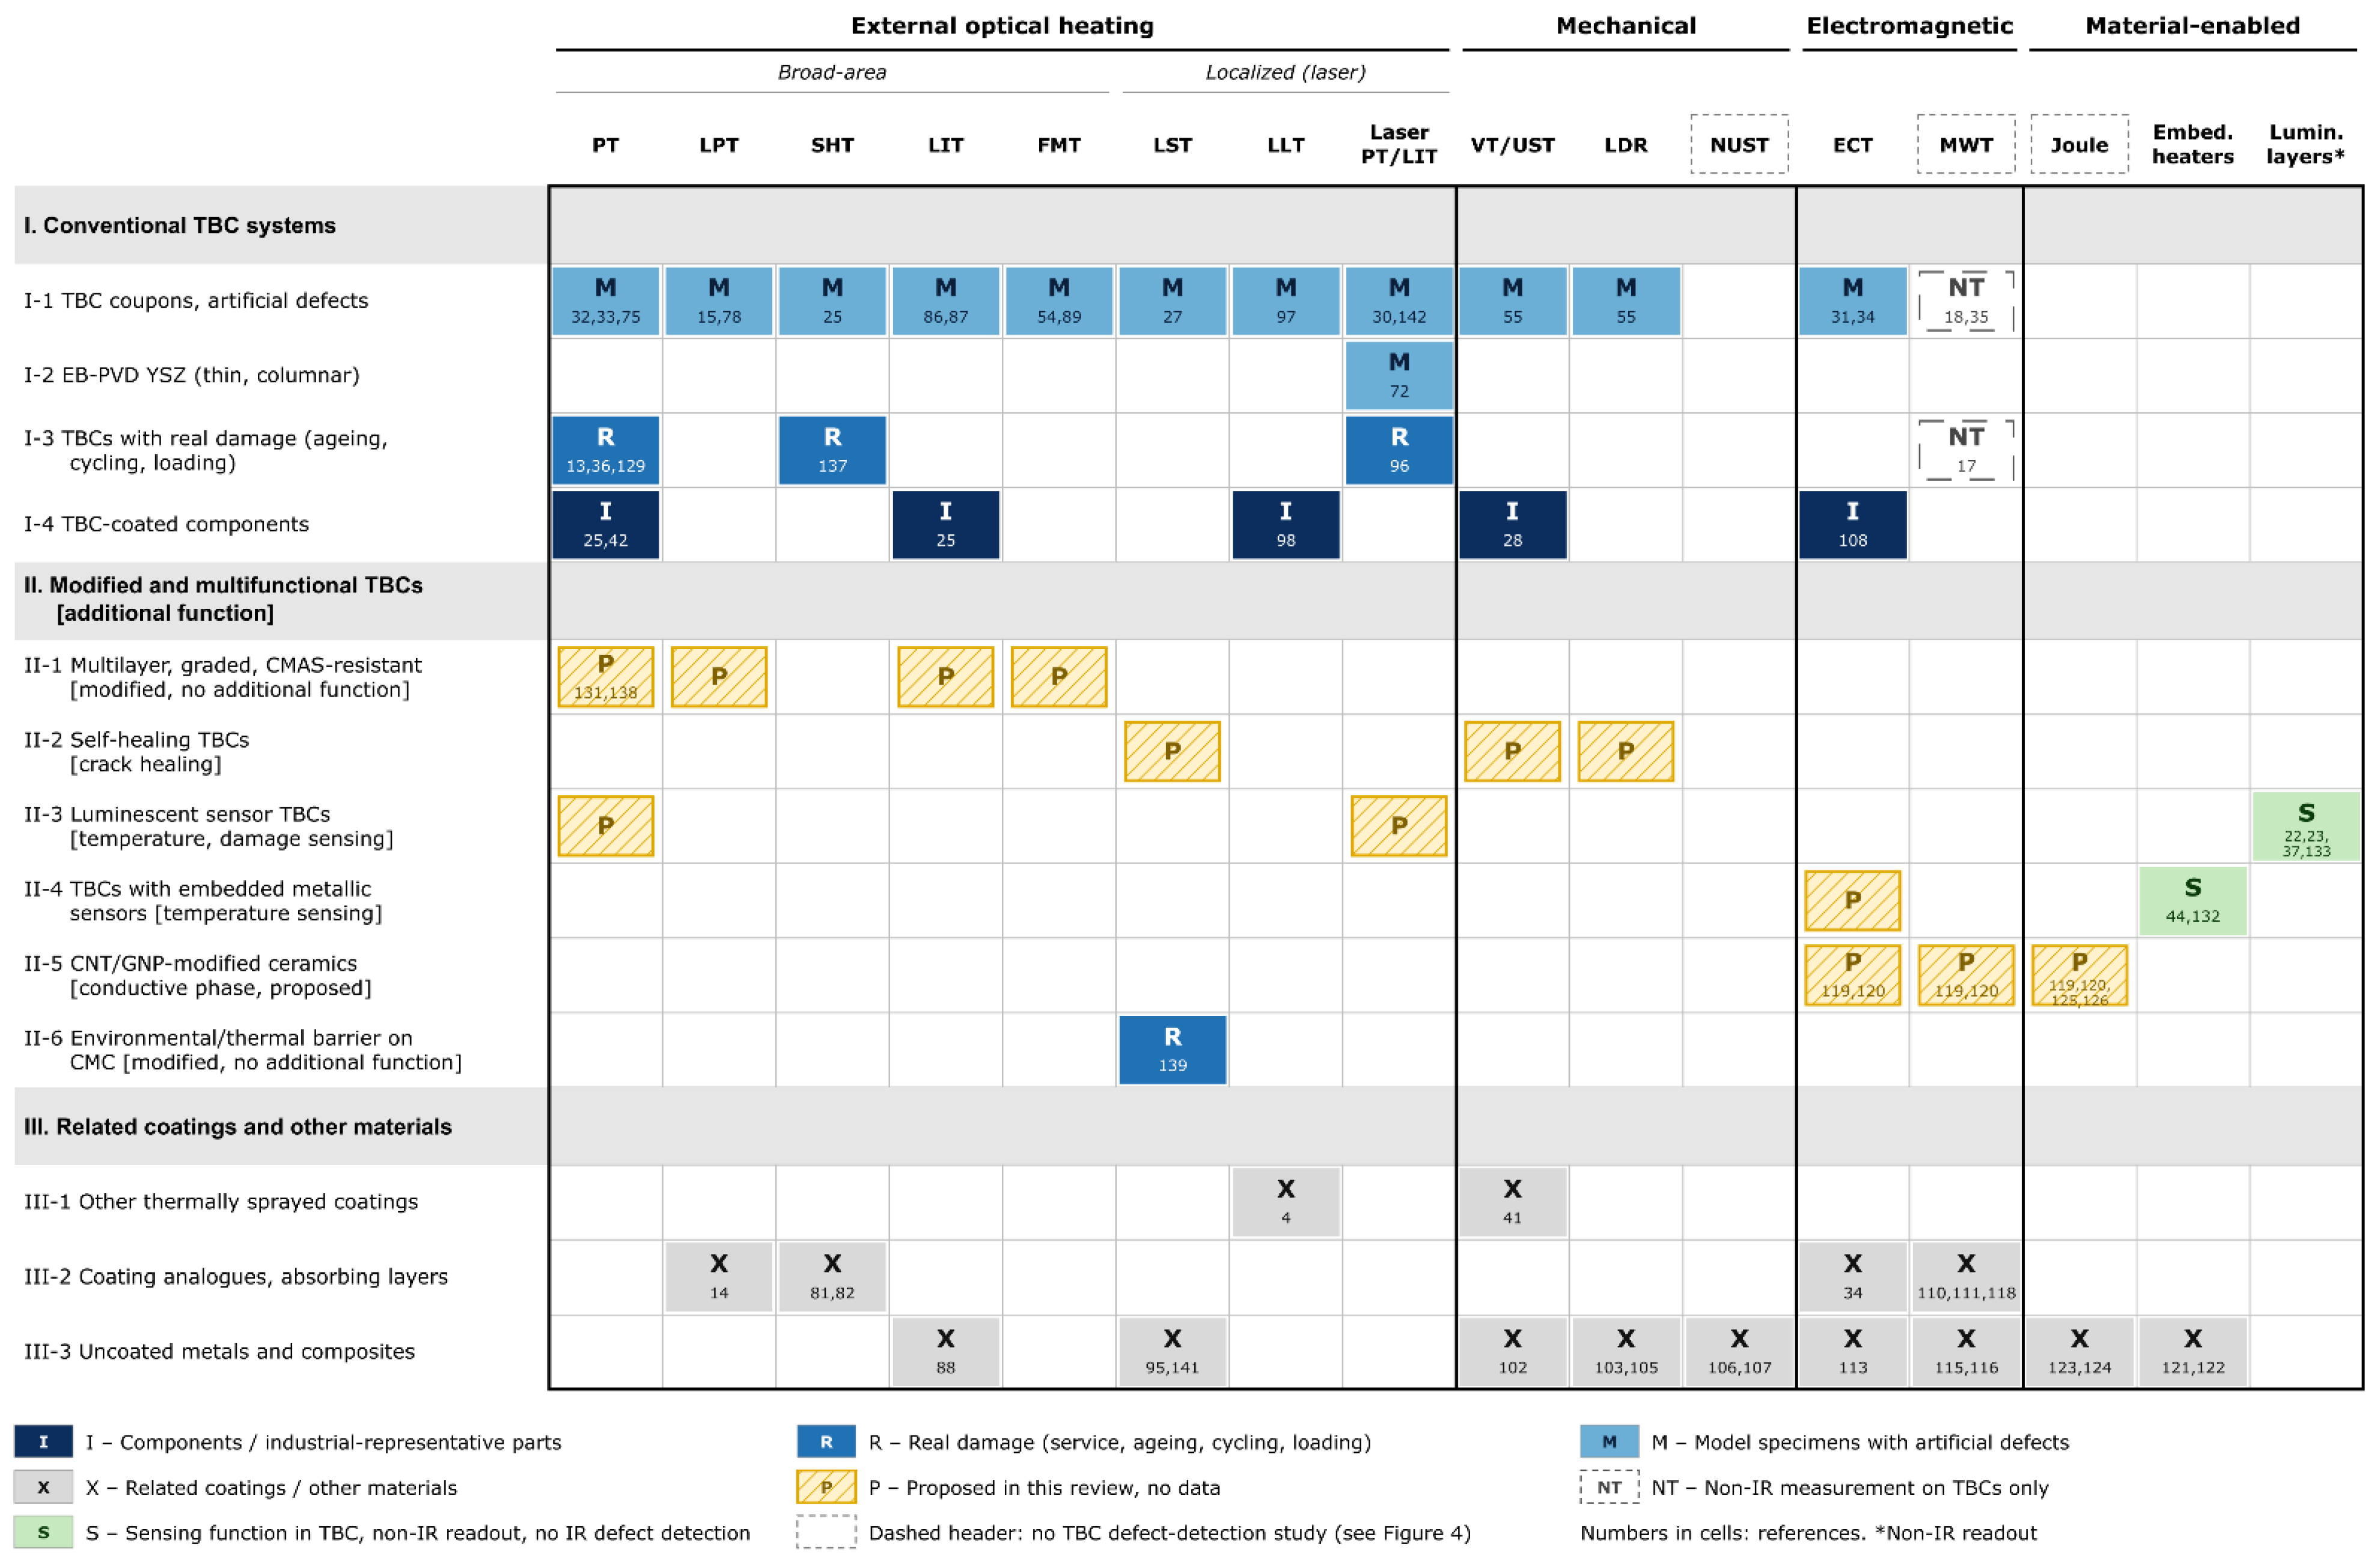

Disclaimer/Publisher’s Note: The statements, opinions and data contained in all publications are solely those of the individual author(s) and contributor(s) and not of MDPI and/or the editor(s). MDPI and/or the editor(s) disclaim responsibility for any injury to people or property resulting from any ideas, methods, instructions or products referred to in the content. |
© 2026 by the authors. Licensee MDPI, Basel, Switzerland. This article is an open access article distributed under the terms and conditions of the Creative Commons Attribution (CC BY) license.