


Abstract
This study investigates the influence of layer height, infill density, and the number of perimeters on the FDM 3D printing performance of PLA, a biodegradable and renewable biopolymer. The primary objective is to identify parameter settings that simultaneously maximize impact strength and production efficiency, quantified through filament usage and printing time. In addition, 3D surface profilometry was employed as a non-destructive characterization method to evaluate surface roughness, assess its dependence on process parameters, and establish correlations with destructive impact strength testing. Experimental work was conducted using a Taguchi L9 orthogonal array, and regression-based mathematical models were developed to quantify the effects of individual parameters on the analysed responses. Finally, Grey Relational Analysis (GRA) was applied to perform multi-objective optimization and determine parameter combinations that jointly enhance mechanical durability, surface quality, and production efficiency. The results provide a clear set of manufacturing parameter settings that satisfy both destructive and non-destructive performance criteria while ensuring resource-efficient production.
1. Introduction
Fused Deposition Modelling (FDM) is among the most extensively applied additive manufacturing technologies due to its simplicity, versatility and economic viability. The technology was commercially introduced in the early 1990s and has since become a standard method for rapid prototyping and small-scale production across engineering, medical and consumer applications [1,2]. In the FDM process, a thermoplastic filament is continuously fed into a heated extrusion nozzle, where it softens and is deposited layer by layer onto a build platform according to a digital CAD model. As each layer is laid down, the material rapidly cools and solidifies, bonding to the previously deposited layer and gradually forming a three-dimensional object [3].
One of the primary advantages of FDM lies in its cost-effectiveness and ease of use. Compared to other additive manufacturing techniques such as stereolithography or selective laser sintering, FDM systems are relatively inexpensive and require minimal maintenance [4,5,6]. In addition, the process supports a wide range of thermoplastic materials, including polylactic acid (PLA), acrylonitrile butadiene styrene (ABS), polyethylene terephthalate glycol (PETG), polycarbonate and nylon, enabling users to tailor material selection to specific mechanical or functional requirements [7]. Another significant benefit of FDM is its material efficiency, as parts are fabricated additively with minimal waste, making the process suitable for rapid design iterations and shortened product development cycles [5].
Despite these advantages, FDM also exhibits several limitations. The surface quality of printed components is generally lower than that of parts produced by other additive manufacturing processes, primarily due to the visible layer lines and the so-called stair-stepping effect on inclined or curved surfaces [1]. Furthermore, FDM parts often display anisotropic mechanical behaviour, meaning that their strength and stiffness vary depending on the printing direction. This anisotropy is mainly caused by incomplete bonding between layers, which results in reduced mechanical performance, particularly in the build direction perpendicular to the deposited layers. As a consequence, FDM components frequently show lower tensile strength, impact resistance and impact strength when compared to conventionally manufactured parts [8,9,10].
Polylactic acid (PLA) is a thermoplastic aliphatic polyester derived from renewable biomass sources such as corn starch and sugar cane, which makes it a sustainable alternative to petroleum-based polymers. In the field of additive manufacturing, PLA has become one of the most commonly used materials for fused deposition modelling (FDM) due to its suitable processing characteristics, such as low glass transition temperatures (45–65 °C), relatively low melting temperatures (140–180 °C), minimal deformation during cooling and good printability without the need for a heated chamber [11,12,13]. PLA offers advantages in terms of dimensional stability and environmental sustainability, but it also exhibits limitations in mechanical performance that are primarily associated with its semi-crystalline molecular structure, limited ductility and insufficient interlayer bonding [7,14,15].
Atakok et al. investigated the influence of layer thickness and infill density on the impact strength of PLA and recycled PLA test parts produced by FDM. PLA showed higher impact strength in comparison to recycled PLA, and the study showed that higher impact strength could be achieved by higher values of layer thickness and infill density [16]. Sharif et al. also found infill density to be the most influential printing parameter among all parameters varied. The study found it was possible to increase the impact strength of PLA by increasing infill density, but also to decrease the values of impact strength by increasing the layer thickness and printing speed [17]. Another study determined infill density and printing speed as influential parameters on the impact strength of PLA, with the highest values of impact strength achieved with 100% infill density and a higher value of printing speed compared to others varied in the study [18]. Tanveer et al. varied the values and arrangement of infill density in the PLA samples, mostly varying infill density on the outer and inner layers. The sample produced with 100% infill density throughout the sample had the greatest impact strength. The study concluded that, contrary to tensile strength, the impact strength increases if the inner layer has higher infill density and the outer layer has lower infill density [19].
Dziewit et al. investigated the influence of building orientation and raster angle on the impact strength of the PLA samples. The study showed no notable difference in the impact strength of samples with raster angle 30°and 90° printed vertically and horizontally. However, building orientation was important with raster angles of 45°and 15°, resulting in higher impact strength values when printed horizontally and vertically, respectively [20]. Rajpurohit and Dave evaluated the impact strength of PLA as a function of raster angle, raster width and layer height. The study shows raster angle as the most significant printing parameter on impact strength and on the fracture surface. It was concluded that higher impact strength can be achieved at the combination of lower raster angle along with a higher value of layer height and raster width [21].
Annealing PLA samples can also be used to increase impact strength. One study reports an increase in impact strength by 385% when annealing the sample for one hour at 80 °C, compared to the sample’s impact strength when produced as-is by the same printing parameters [22]. The same study reports higher impact strength values with higher bed temperatures. This is also reported in the study of Wang et al. Higher bed temperatures result in twice as high an impact strength for the same layer height of the sample [23]. Authors contribute this to the higher crystallinity of samples, improved degree of diffusion and smaller voids inside the samples [22,23]. Zisopol et al. investigated the influence of layer thickness and infill percentage on the impact strength of PLA samples that were also annealed. There was no notable difference in the impact strength values of the non-annealed samples, but the impact strength of annealed samples almost tripled compared to their non-annealed counterparts [24].
Another printing parameter that greatly influences the impact strength of PLA parts is the infill pattern. Ali et al. varied raster angles for the Hilbert curve and honeycomb infill pattern. The study found the highest amounts of absorbed energy in samples with Hilbert curve infill pattern and 90° raster angle [25]. Similarly, Dakhil et al. reported the highest values of impact strength being achieved with higher infill density and a trihexagonal infill pattern [26]. Demir et al. investigated the influence of layer height, printing speed, nozzle temperature and nozzle diameter, as well as the infill pattern. ANOVA analysis revealed that the infill pattern is the most influential parameter, followed by nozzle diameter. An octet pattern and 0.6 mm nozzle diameter showed superior results [27].
Recent studies have applied multi-objective optimization frameworks in FDM to simultaneously address mechanical properties, surface quality, and process efficiency, typically combining design of experiments with statistical or decision-making methods [28,29,30]. Several works have demonstrated that Grey Relational Analysis and related approaches are effective for integrating mechanical responses with non-destructive quality indicators, such as surface roughness and dimensional accuracy, although often focusing on a limited subset of objectives or mechanical properties [28,29,31]. Recent empirical studies further confirm the applicability of Taguchi-based multi-objective strategies for PLA materials, while also indicating that the combined influence of geometric printing parameters on mechanical performance, surface quality, and process efficiency remains insufficiently quantified within a unified optimization framework [30,32].
This study addresses the multi-objective optimization of PLA components fabricated by FDM by simultaneously considering destructive and non-destructive performance indicators within an integrated experimental, modelling, and optimization framework. Unlike most existing studies that focus on individual responses, impact strength, surface roughness, material consumption, and printing time are jointly evaluated to capture both part quality and process efficiency. A Grey Relational Analysis-based optimization strategy is employed to identify process parameter combinations that provide a balanced compromise between these inherently competing objectives, offering quantitative insight into trade-offs relevant to practical FDM application.
2. Experimental Research
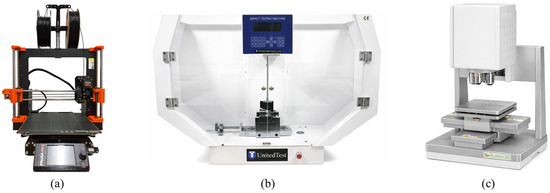
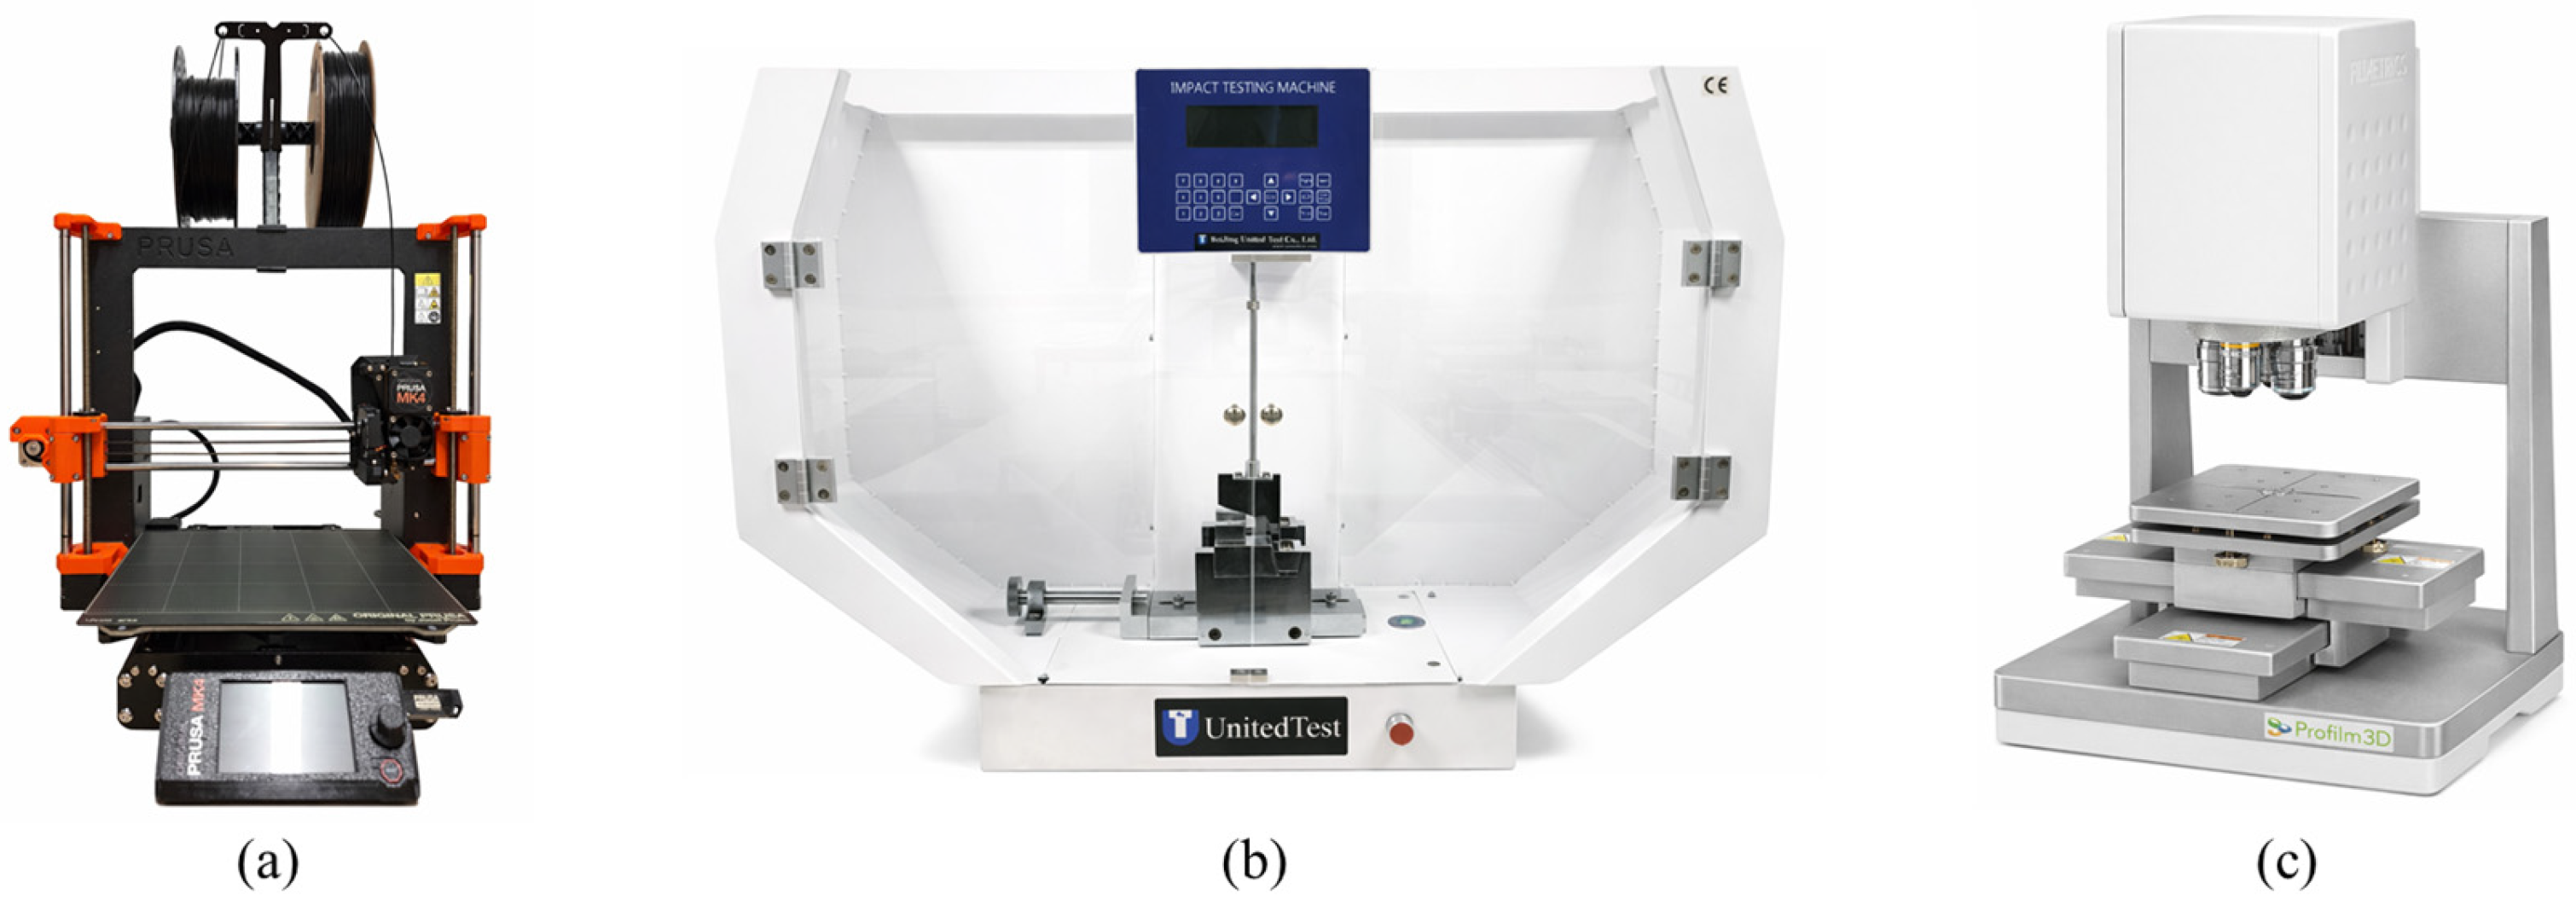
The test specimens were produced by fused deposition modelling using a Prusa MK4 FDM/FFF 3D printer (Figure 1a) in accordance with the ISO 148-1:2016 standard [33] for V-notched impact specimens. A PLA Strongman Black filament (Azurefilm) with a nominal diameter of 1.75 mm was selected as the printing material. The PLA filament was stored under controlled laboratory conditions and used according to the manufacturer’s guidelines. While the moisture content of the filament was not directly measured, potential effects of moisture on printing outcomes and mechanical properties are acknowledged as a limitation of the study. The fabrication parameters were configured and controlled using PrusaSlicer 2.9.4 software, following a Taguchi L9 orthogonal experimental design. Within this design, three primary processing variables—layer height, infill density, and number of perimeters—were systematically varied across three predefined levels. The selected levels were defined based on preliminary trials and literature data to adequately cover the practical FDM processing window while maintaining experimental efficiency. The investigated parameter levels are listed in Table 1, while all remaining printing conditions that were maintained as constant throughout the experiments are reported in Table 2.
Figure 1.
Experimental equipment used in this study: (a) Prusa MK4 FDM 3D printer, (b) UnitedTest impact testing machine, (c) KLA Instruments Profilm 3D Optical Profilometer.
Table 1.
Variable process parameters and corresponding levels.
Table 2.
Constant process parameters.
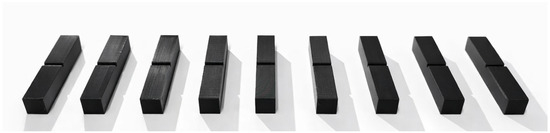
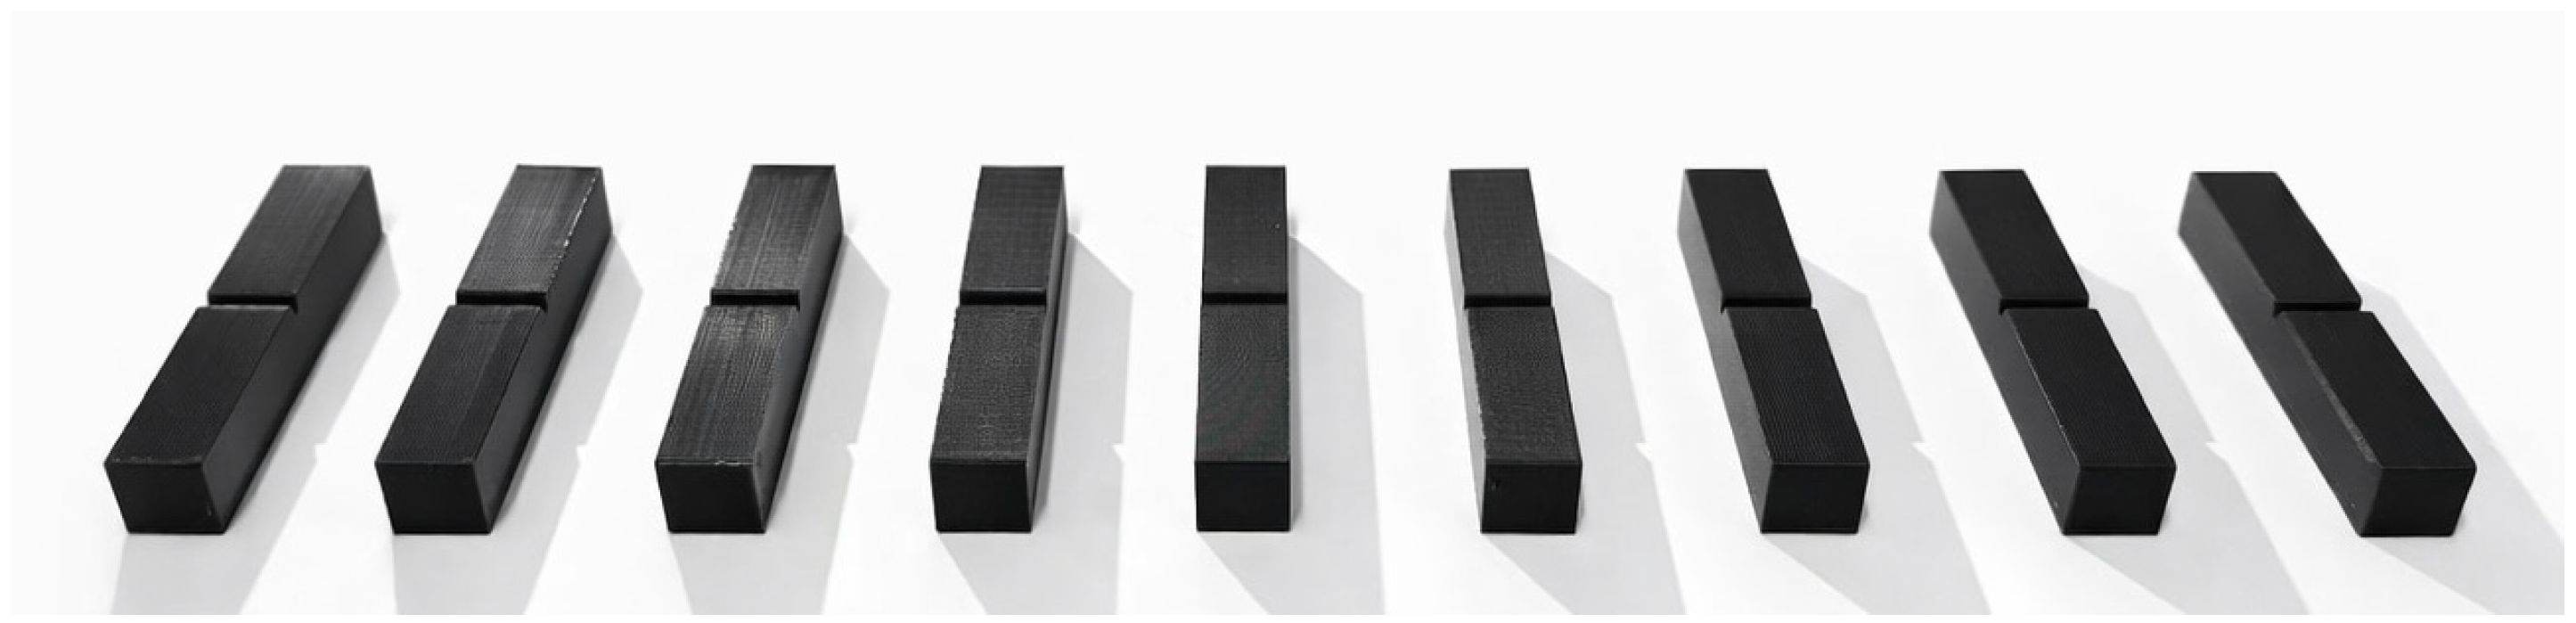
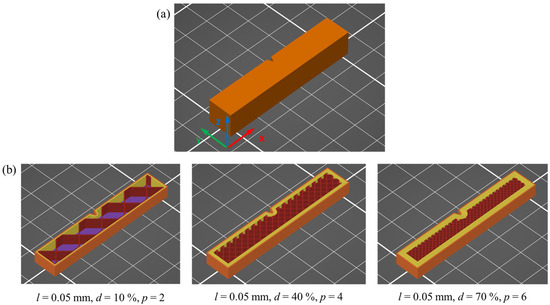
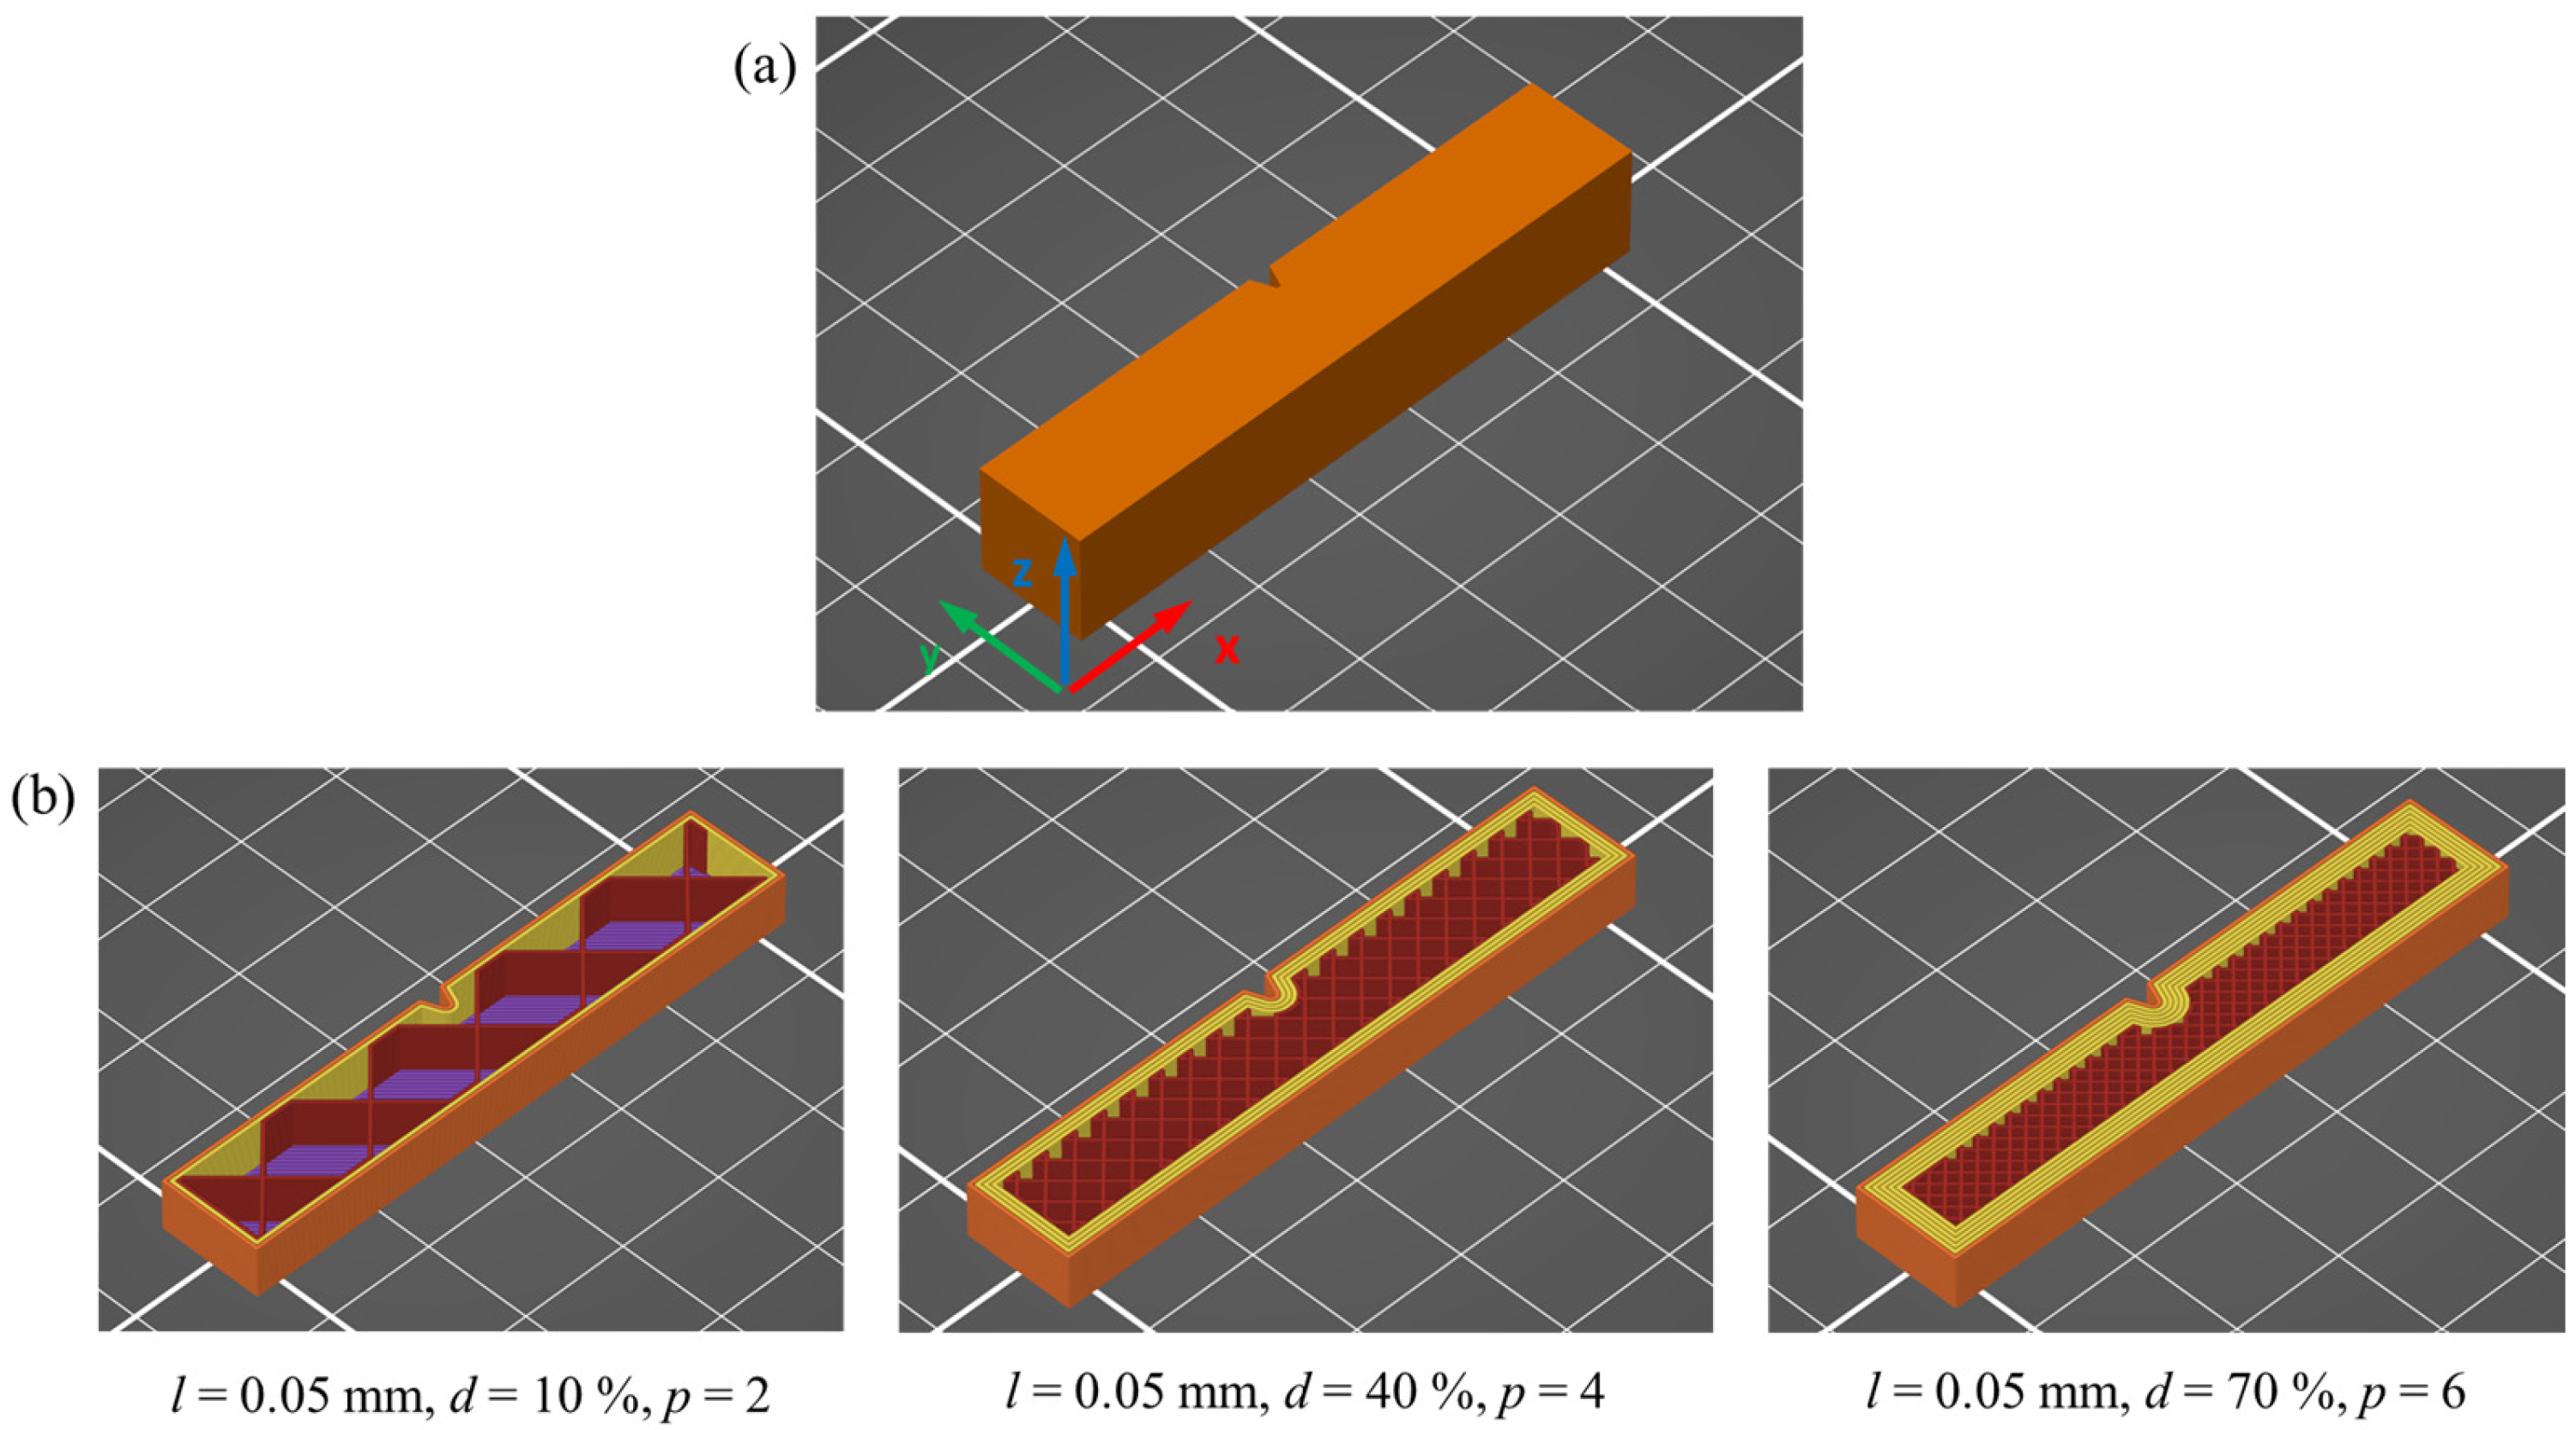
The set of experimental specimens manufactured in accordance with the Taguchi L9 orthogonal design is presented in Figure 2. The Taguchi L9 design offers a significant advantage by enabling systematic evaluation of the main effects of multiple process parameters with a substantially reduced number of experiments, thereby minimizing material consumption and experimental time. However, while this approach is well-suited for identifying dominant factors and general trends, it inherently limits the resolution of higher-order nonlinear interactions, which should be considered when interpreting the results. The arrangement and orientation of the specimens on the build platform are shown in Figure 3a. Furthermore, Figure 3b provides a qualitative representation of the influence of the selected printing parameters—particularly infill density and number of perimeters—on the longitudinal cross-sectional structure of the fabricated parts.
Figure 2.
Experimental samples set.
Figure 3.
Schematic illustration of manufactured samples: (a) orientation on the build platform; (b) cross-sections corresponding to selected process parameter levels.
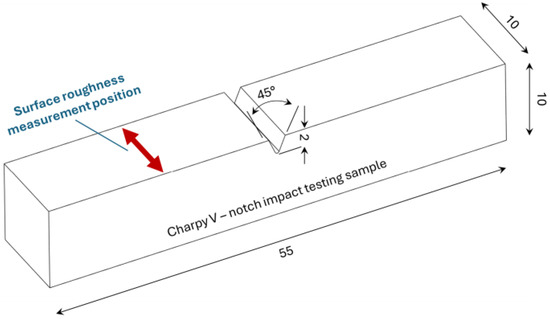
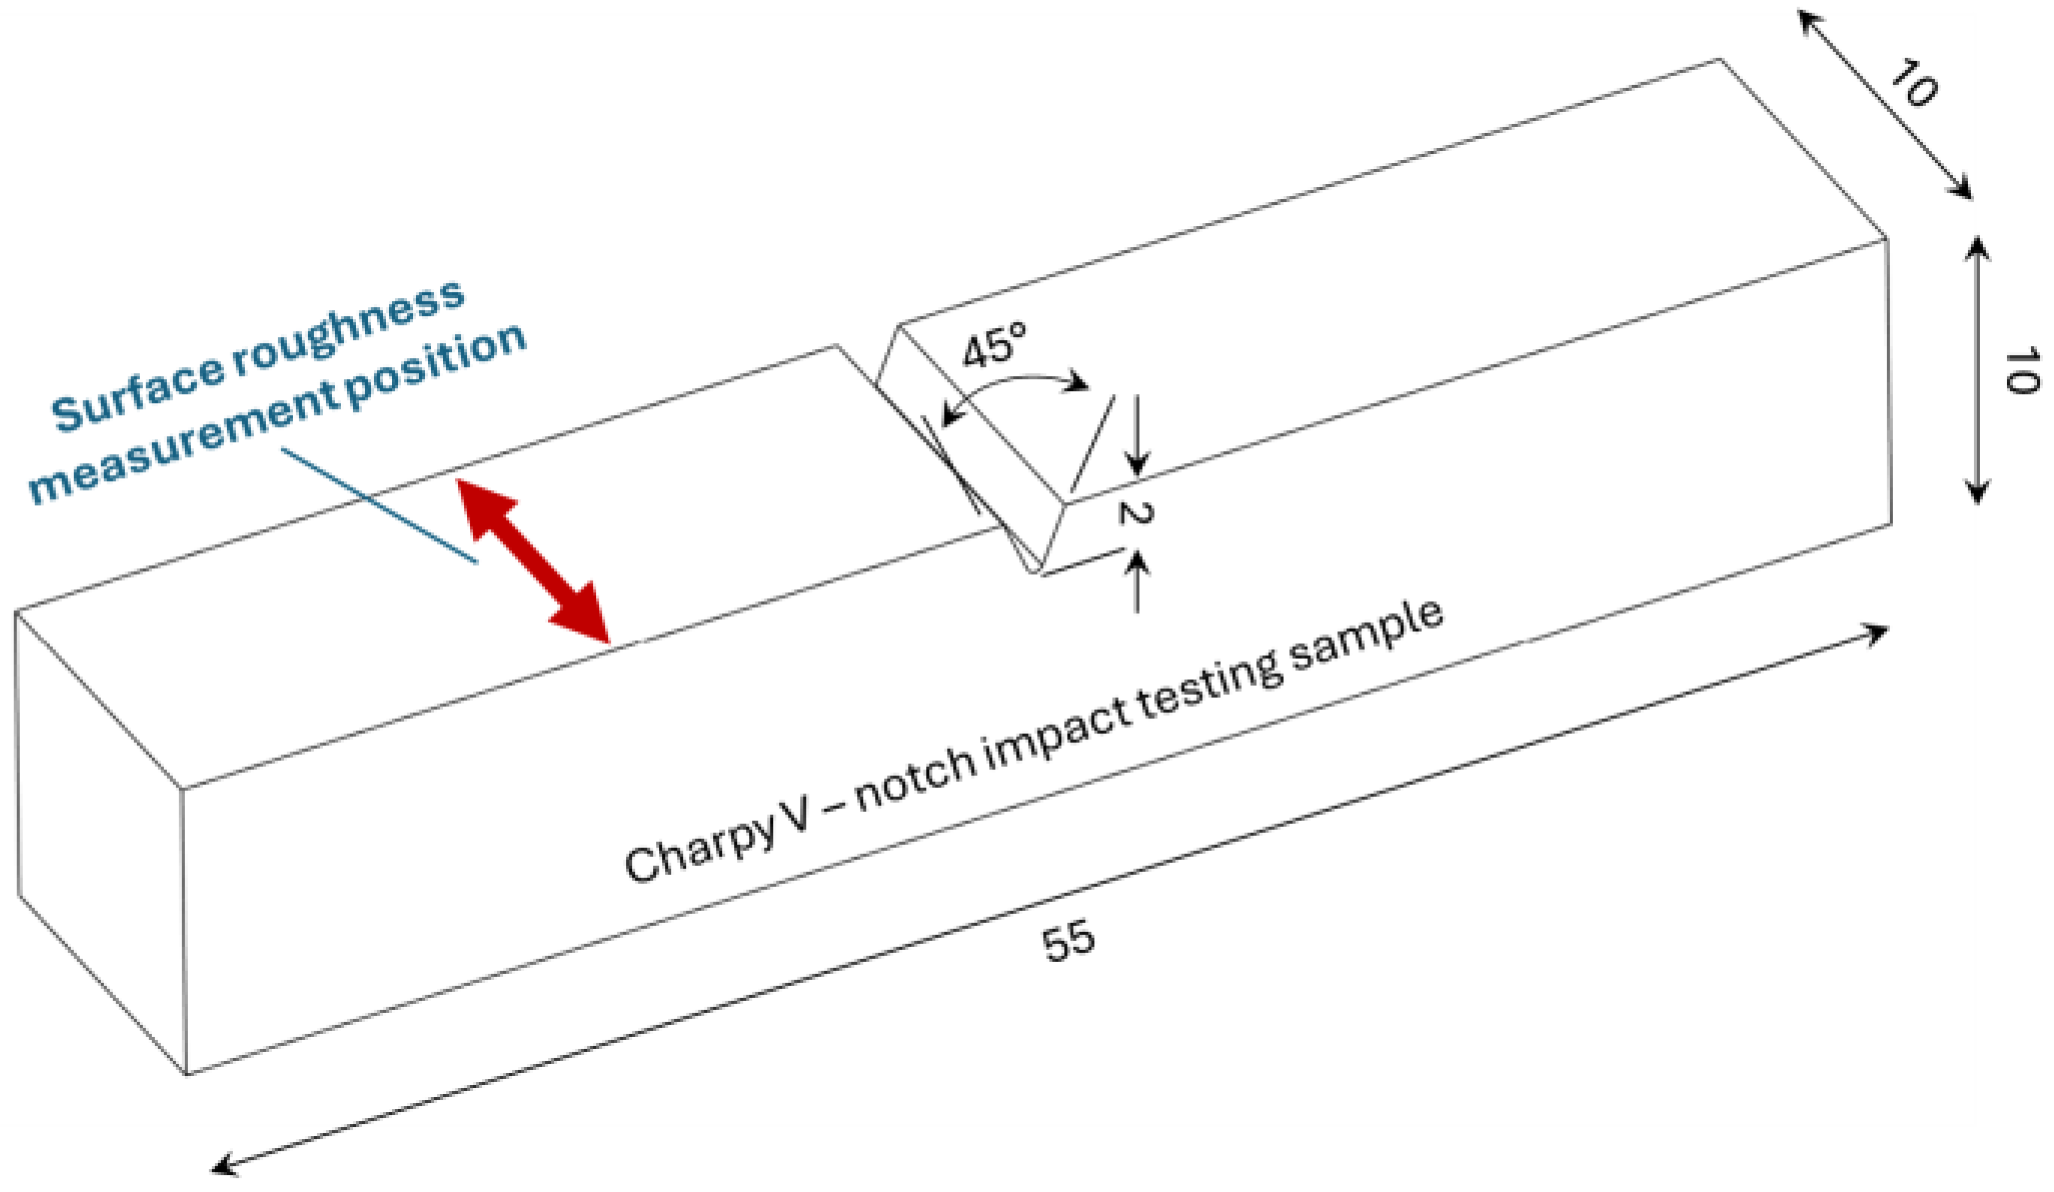
The impact resistance of the fabricated specimens was evaluated using an impact testing machine (UnitedTest, Beijing United Test Co., Beijing, China), as illustrated in Figure 1b. Surface roughness measurements were carried out using a Profilm 3D optical profilometer (KLA Instruments, Milpitas, CA, USA), as illustrated in Figure 1c. The specific location selected for surface roughness evaluation on the specimens is schematically presented in Figure 4.
Figure 4.
Charpy V-notch impact test specimen illustrating the surface roughness measurement area.
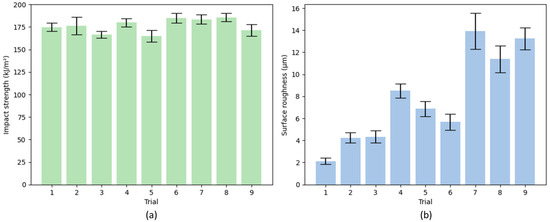
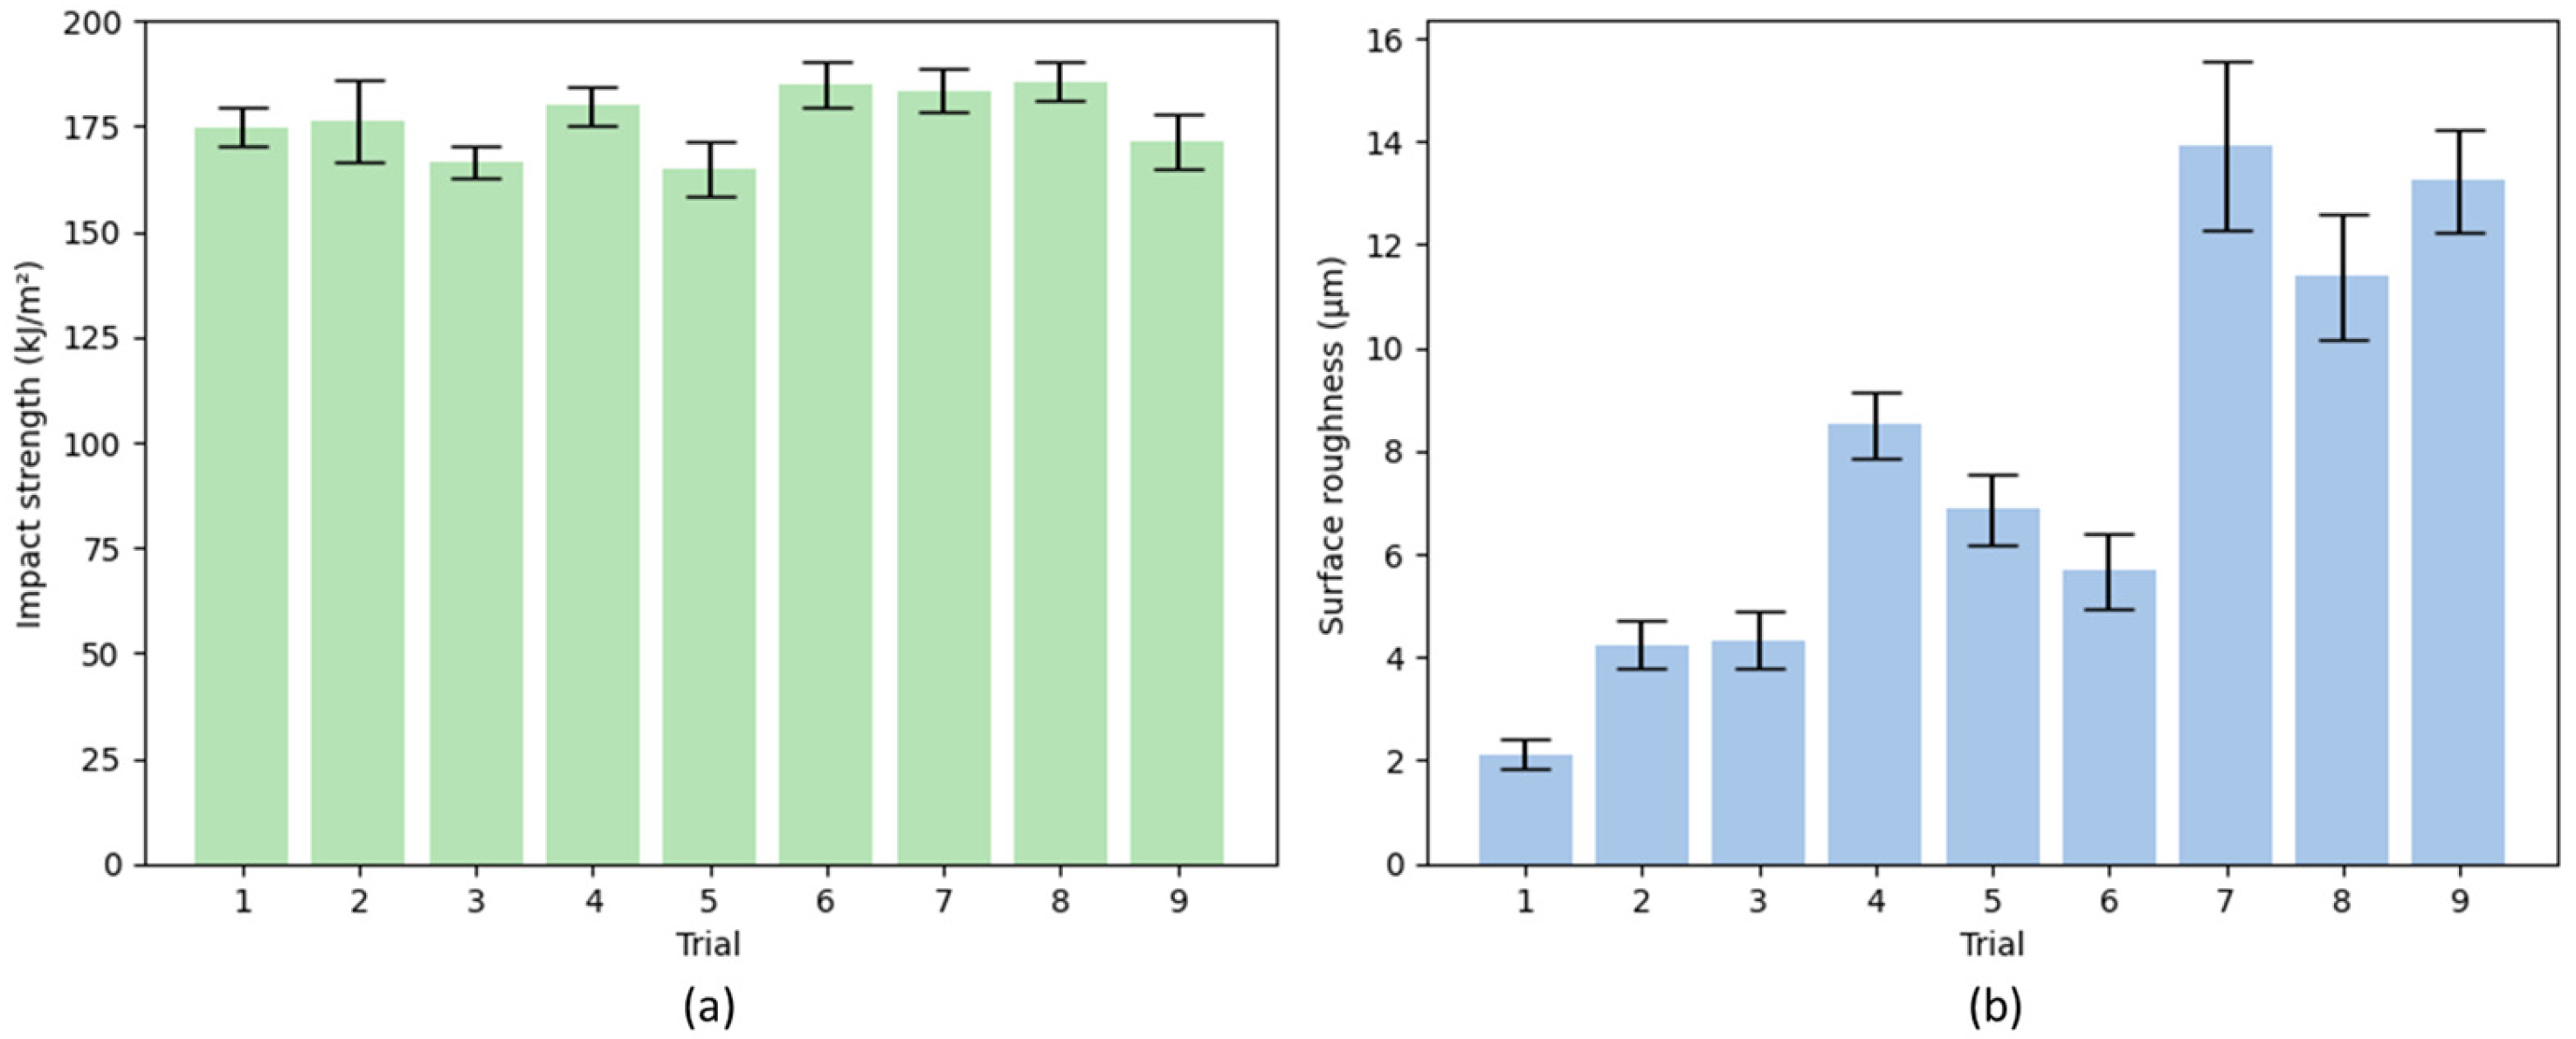
Each experimental test, defined according to the Taguchi L9 design of experiments, was performed three times to ensure the reliability and repeatability of the results. Following the completion of the measurements, the mean values were calculated for each response. These averaged results were subsequently reported as a single representative value for each experimental trial and are presented in Table 3. Figure 5 presents the mean values of impact strength and surface roughness obtained for the nine experimental trials, with error bars indicating 95% confidence intervals based on three repeated measurements.
Table 3.
Experimental results.
Figure 5.
(a) Mean impact strength and (b) surface roughness of the specimens obtained for different experimental trials, with error bars representing 95% confidence intervals.
3. Results and Discussion
3.1. Experimental Results Modelling
Once the experimental investigation was completed, statistical modelling was carried out to formulate predictive equations that relate the selected input parameters to the observed output responses. These equations were generated exclusively from the experimental results and were used to analyse the contribution of each process variable to the corresponding responses [34]. Furthermore, the derived models form the basis for implementing response surface methodology (RSM), allowing the combined effects of process parameters on the investigated responses to be examined and visually interpreted [35]. The final regression expressions describing all three response variables are reported in Equations (1)–(4).
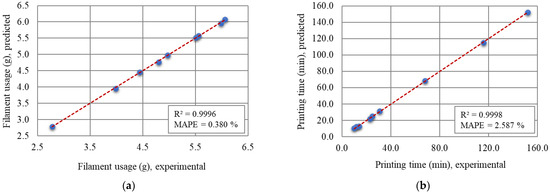
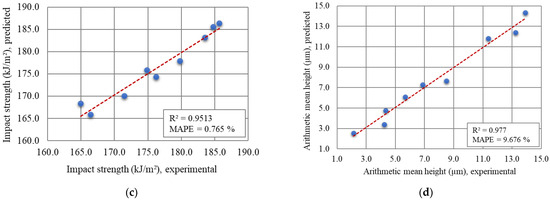
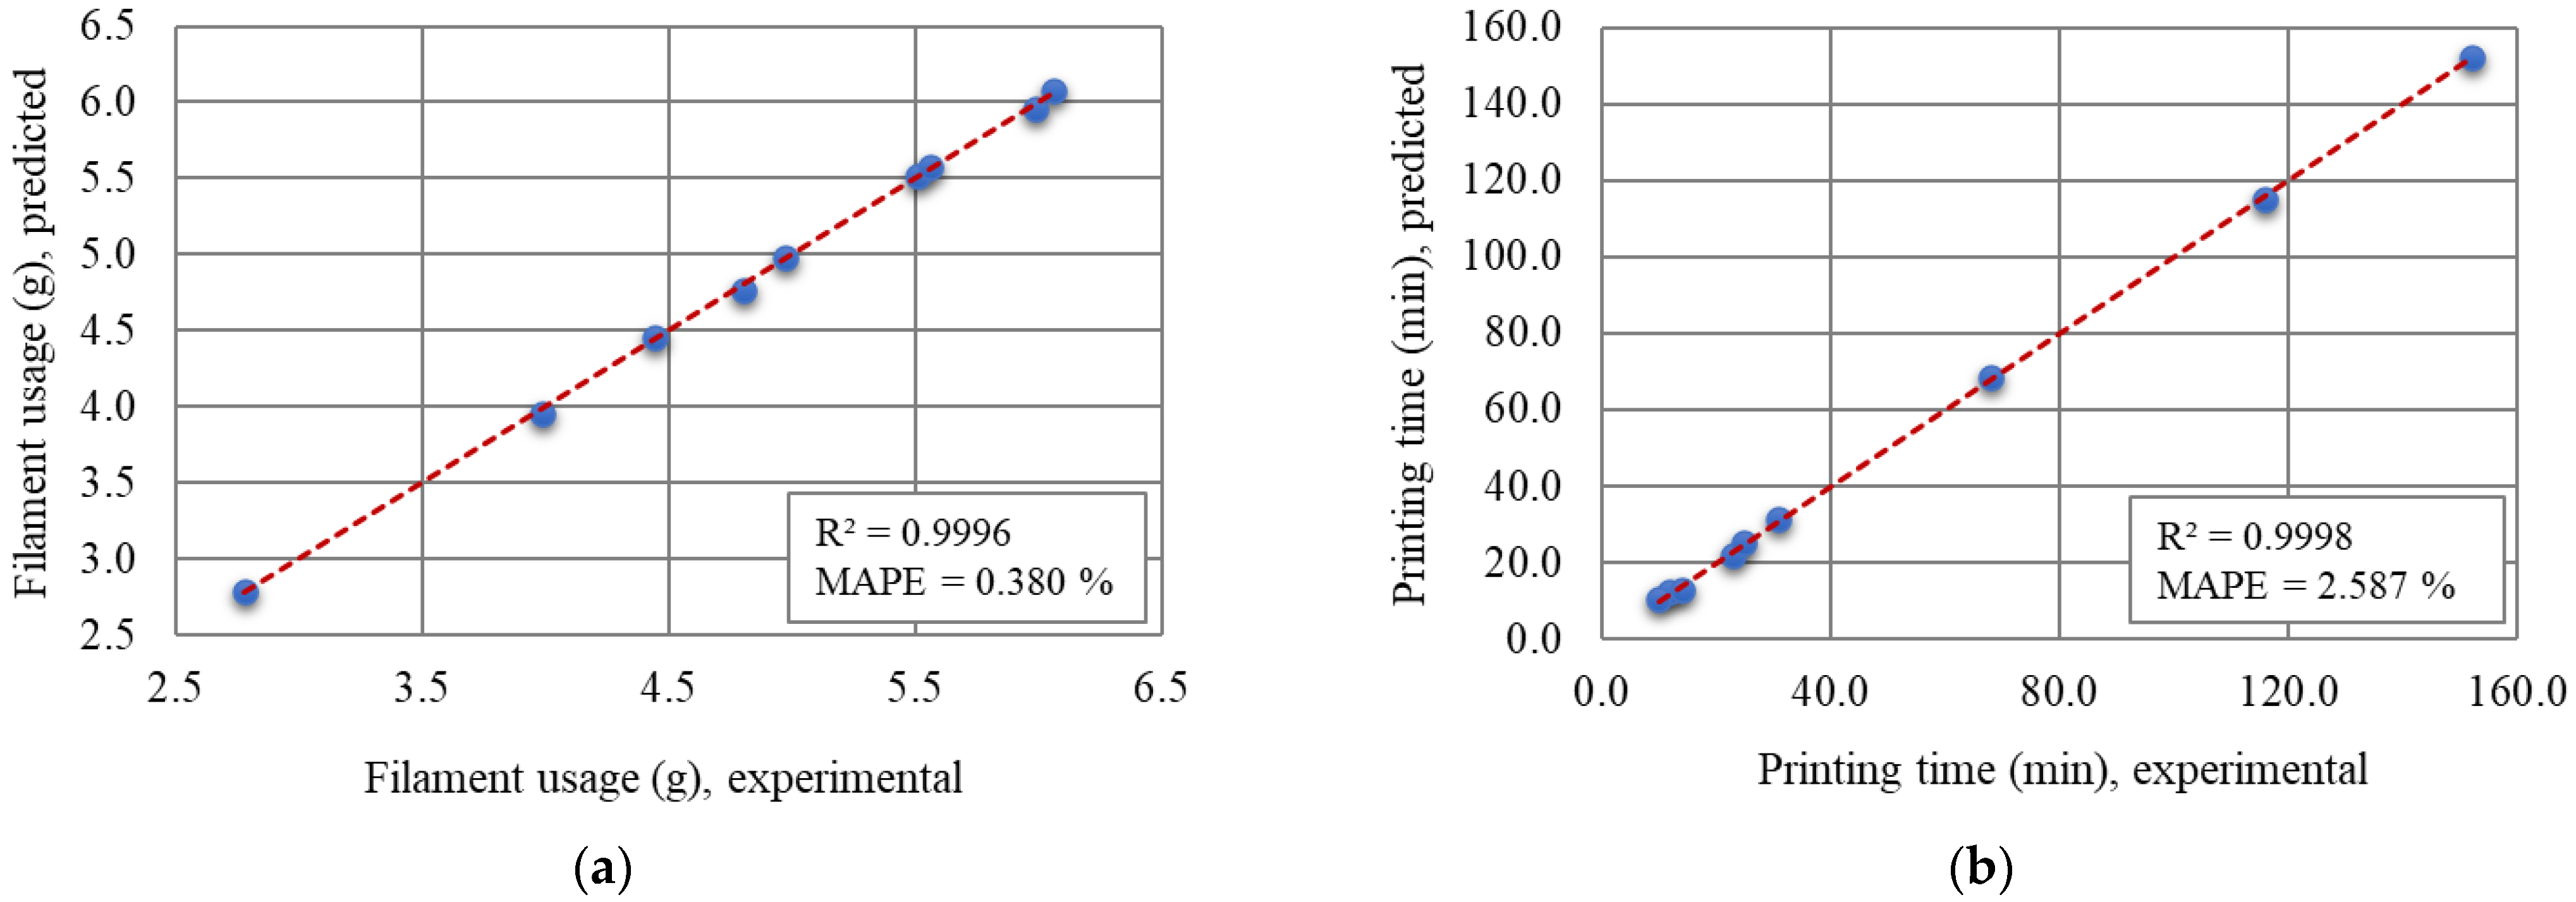
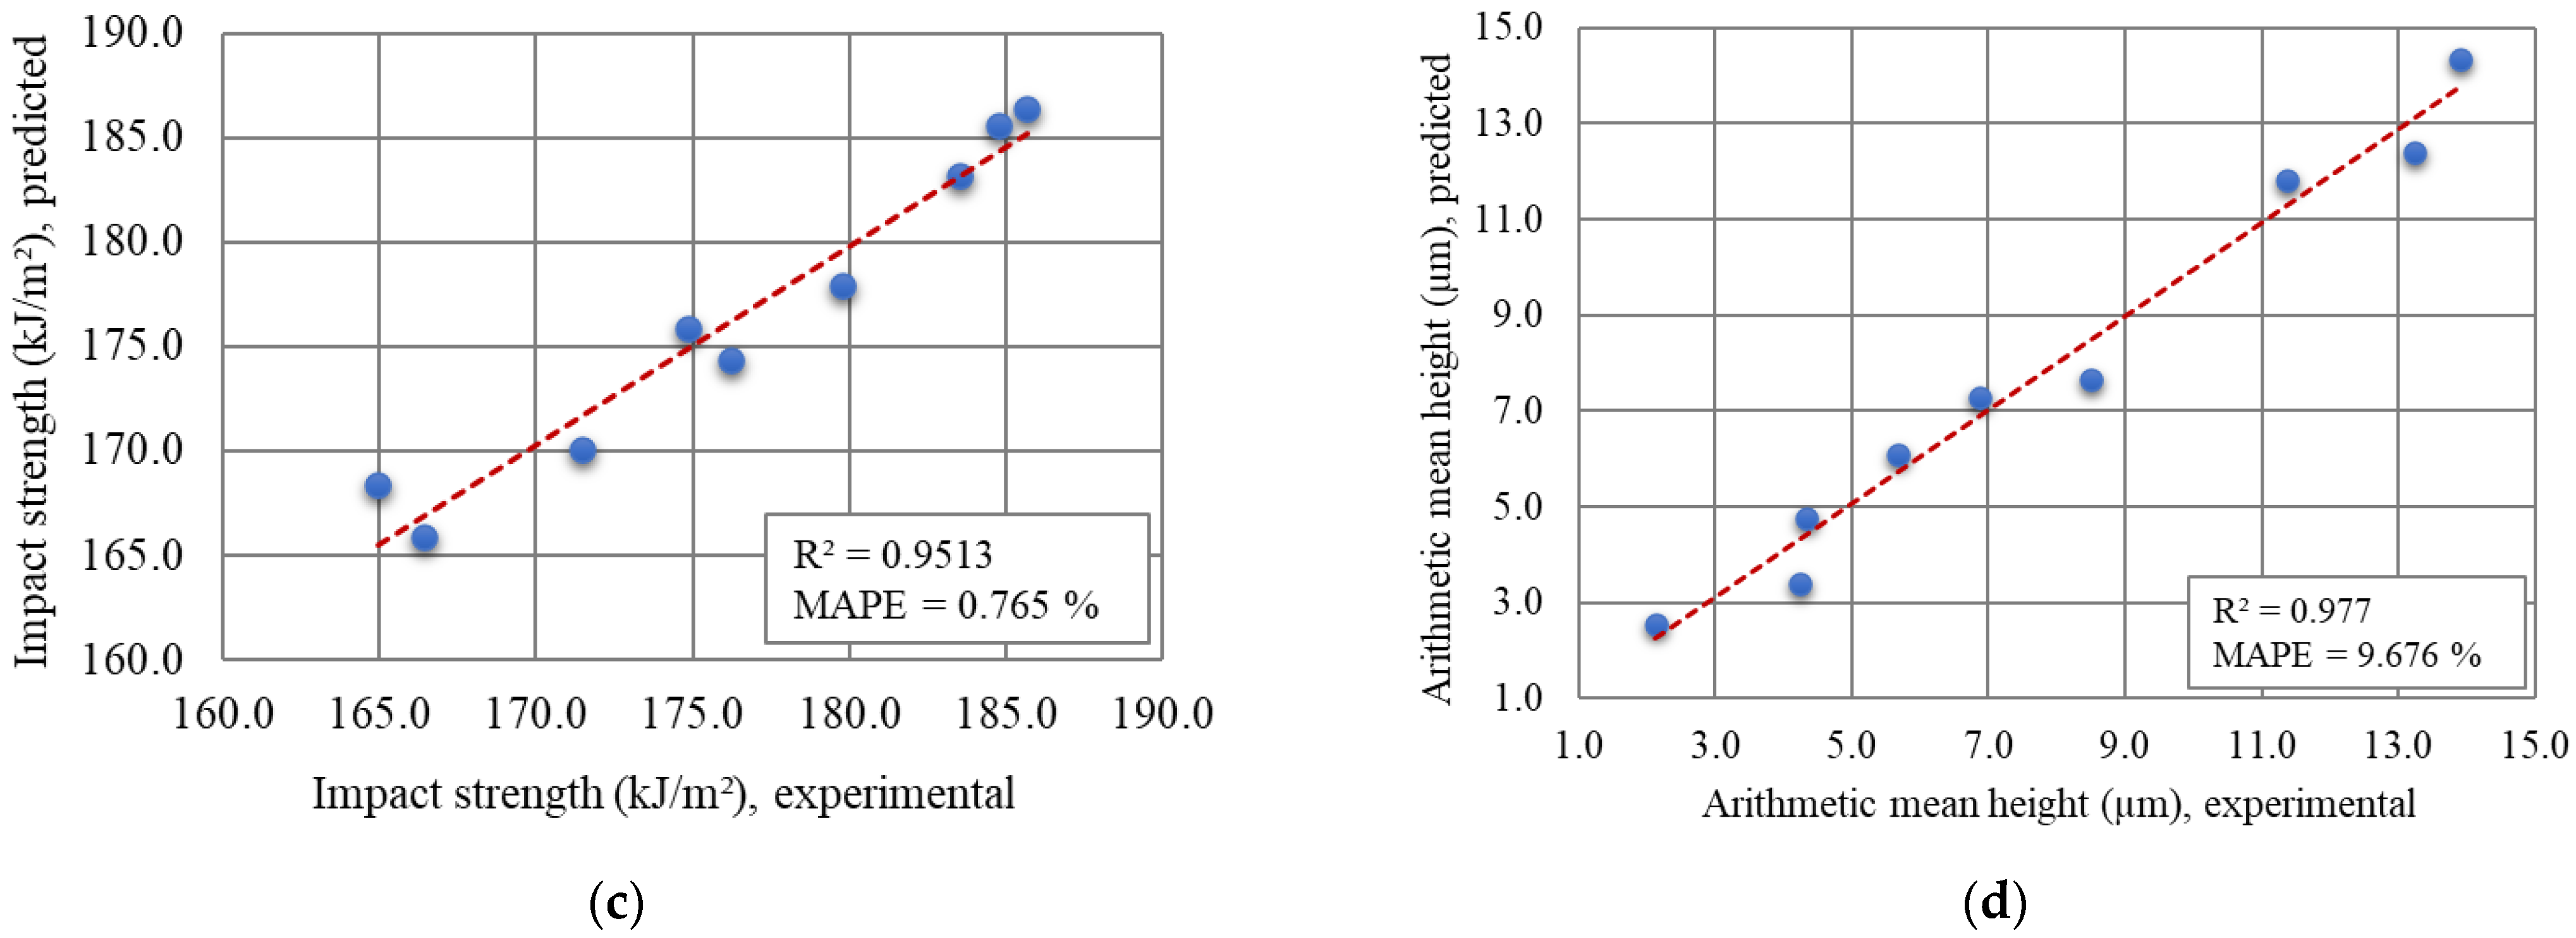
After establishing the regression models describing the responses of the 3D printing process, their predictive reliability was subsequently assessed. This evaluation was performed by comparing the model-generated response values with the corresponding experimental measurements. To quantify the level of agreement, the coefficient of determination (R2) and the mean absolute percentage error (MAPE) were employed as performance indicators. The outcomes of this validation procedure, together with the calculated accuracy metrics for the investigated fused deposition modelling (FDM) process, are illustrated in Figure 6. The obtained R2 and MAPE values demonstrate that the developed models provide highly accurate predictions. Consequently, the validated regression models were deemed suitable for further analysis of parameter–response relationships using response surface methodology (RSM).
Figure 6.
Comparison of experimental results and regression model predictions for: (a) filament usage, (b) printing time, (c) number of cycles to failure, (d) arithmetic mean height responses.
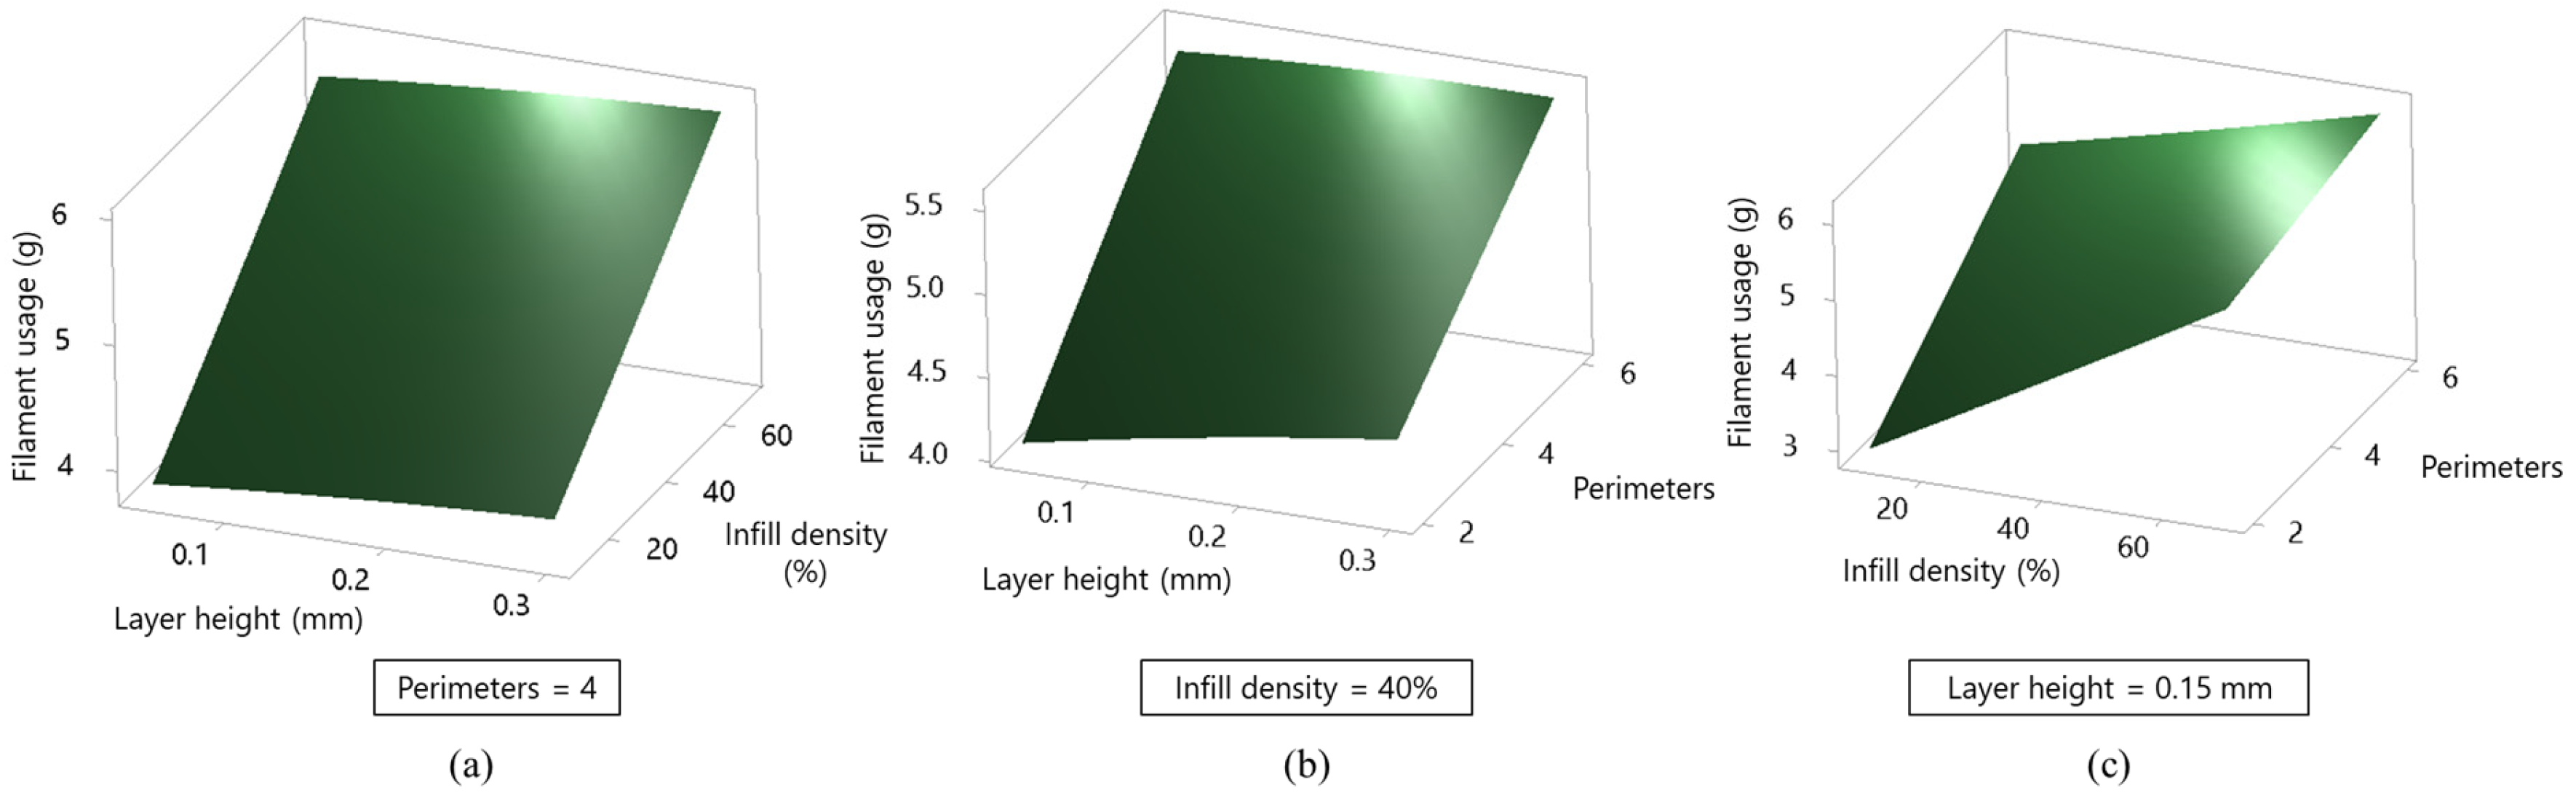
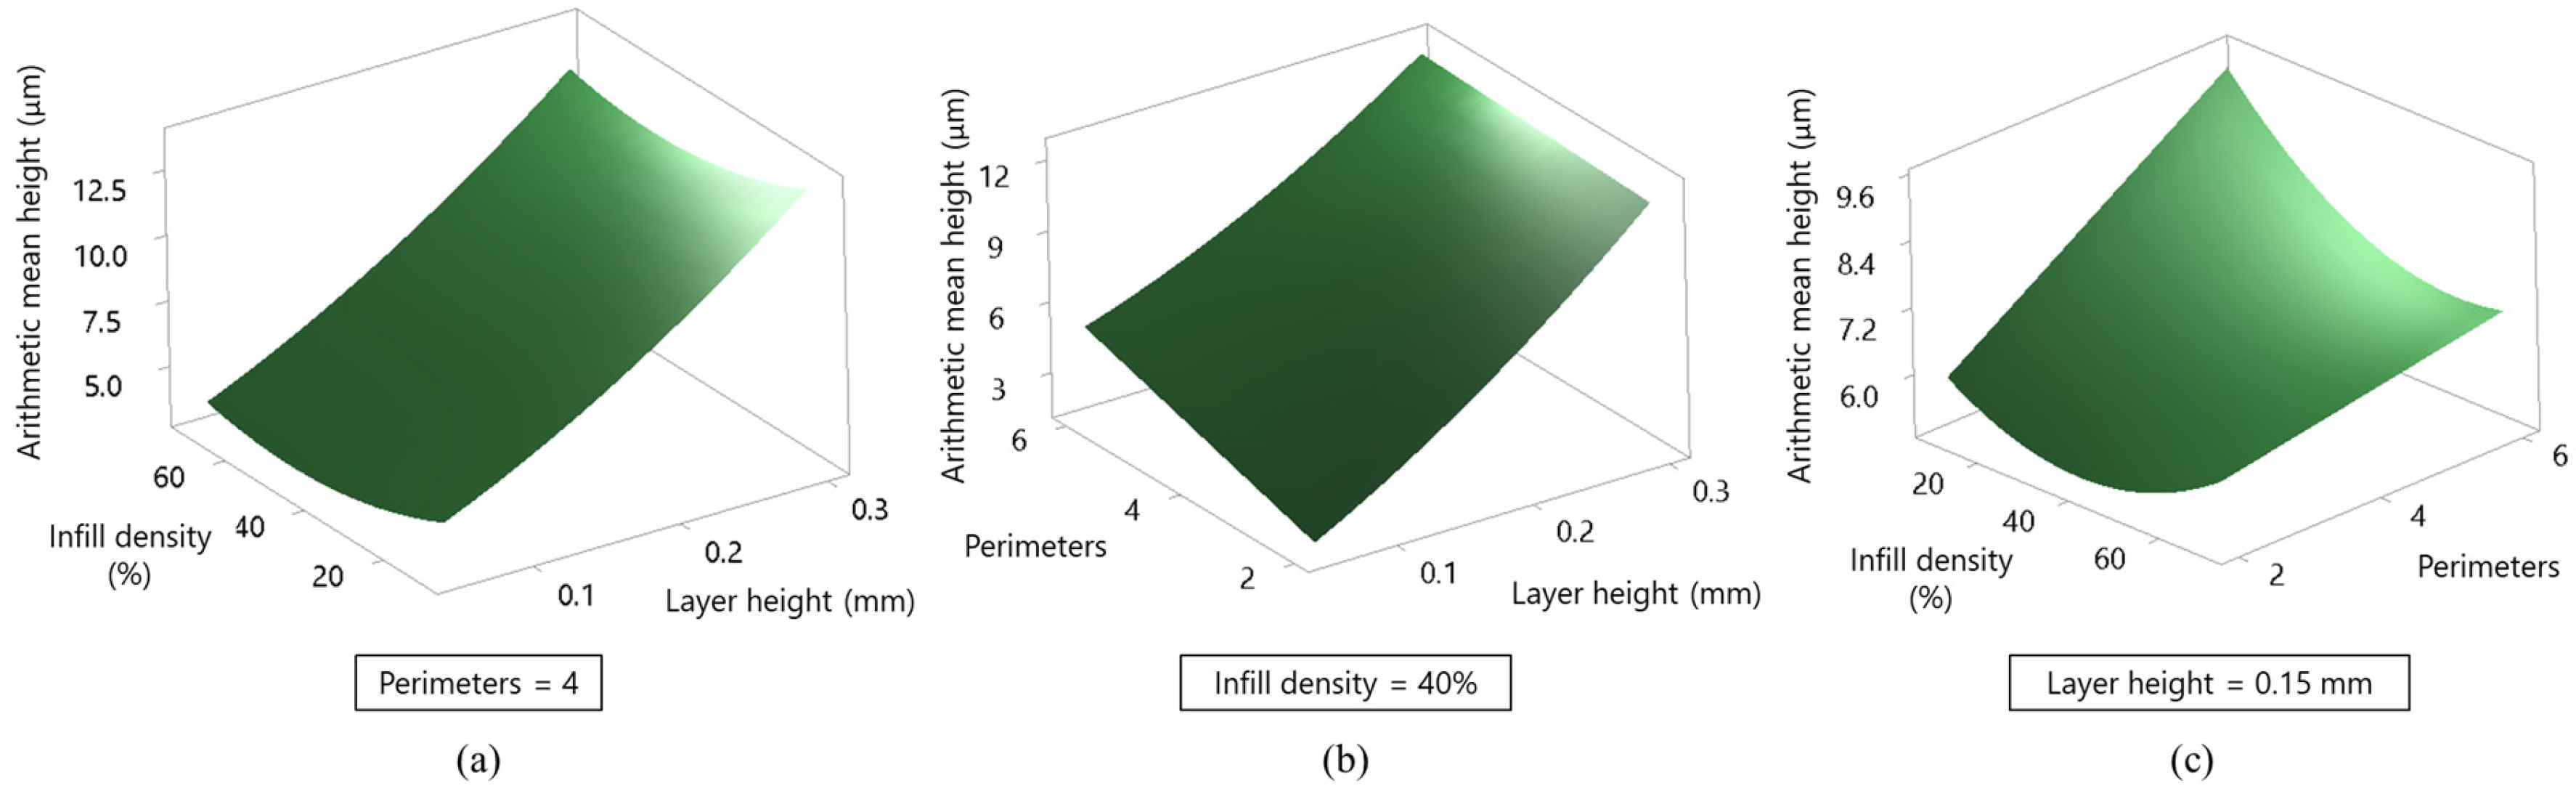
Figure 7, Figure 8, Figure 9 and Figure 10 display three-dimensional response surfaces that demonstrate how variations in the selected printing parameters influence the key FDM process outputs, namely filament usage, printing time, impact strength and surface roughness expressed as arithmetic mean height. In each graphical representation, the combined influence of two parameters is examined, whereas the remaining parameter is held constant at its mid-level setting.
Figure 7.
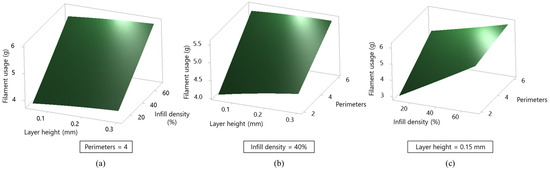
Response surface analysis of filament usage considering parameter interactions: (a) layer height—infill density, (b) layer height—perimeters, (c) infill density—perimeters.
Figure 8.
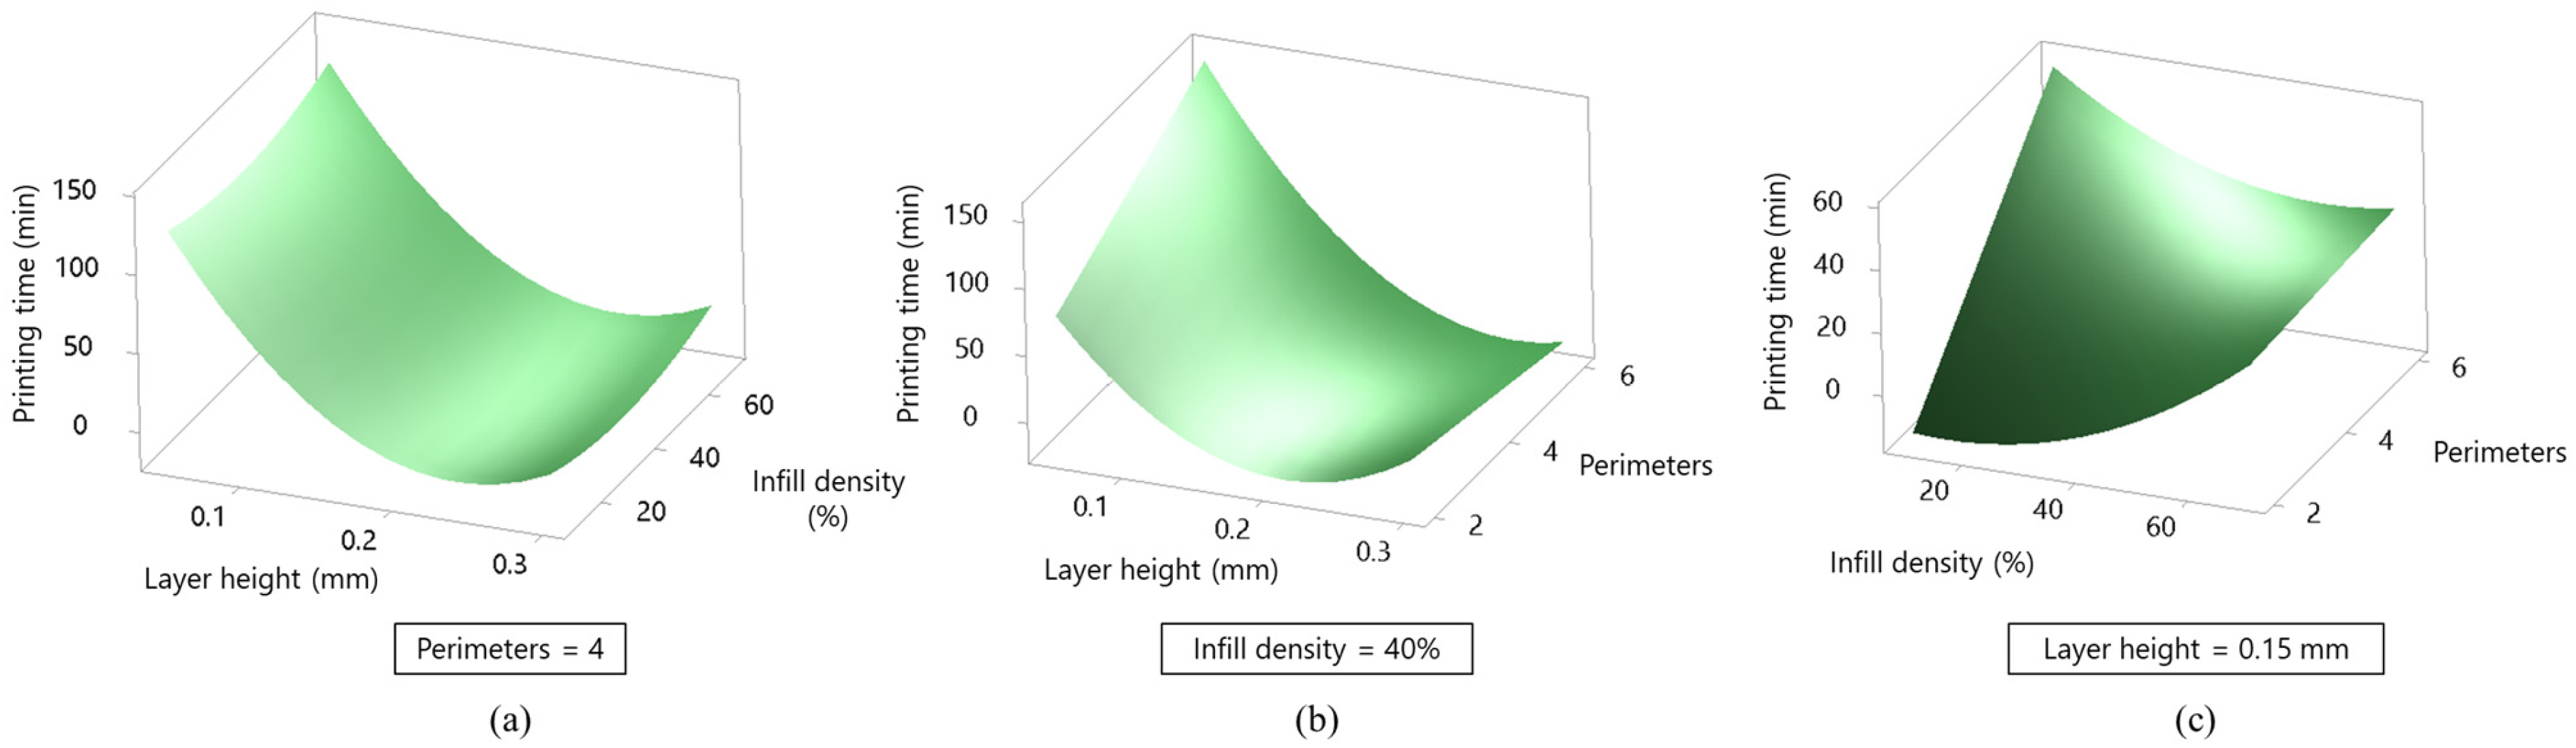
Response surface analysis of printing time considering parameter interactions: (a) layer height—infill density, (b) layer height—perimeters, (c) infill density—perimeters.
Figure 9.
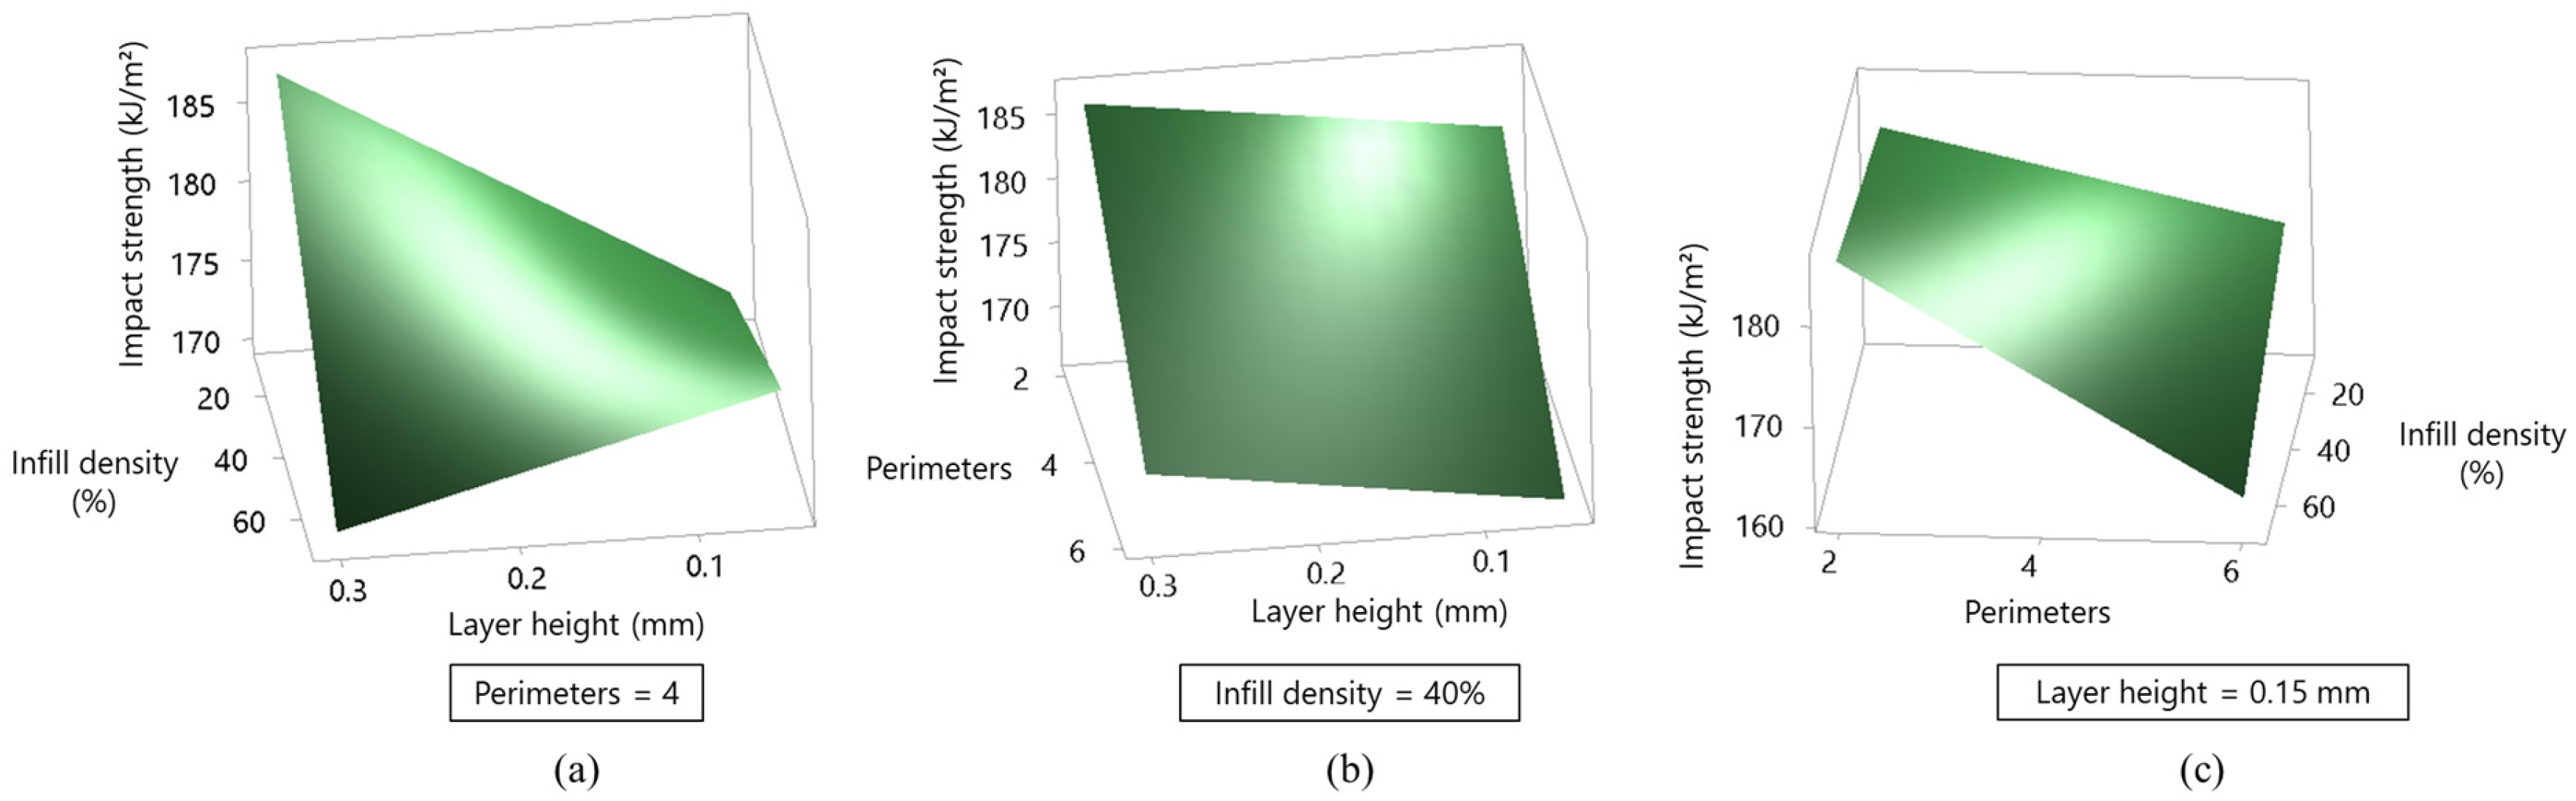
Response surface analysis of impact strength considering parameter interactions: (a) layer height—infill density, (b) layer height—perimeters, (c) infill density—perimeters.
Figure 10.
Response surface analysis of arithmetic mean height considering parameter interactions: (a) layer height—infill density, (b) layer height—perimeters, (c) infill density—perimeters.
The three-dimensional response surfaces shown in Figure 7 illustrate how variations in the selected printing parameters affect filament consumption during the FDM process. The combined effect of layer height and infill density (Figure 7a) indicates that filament usage rises markedly with increasing infill density, which is attributed to the greater amount of material required to fill a larger internal volume. In comparison, changes in layer height exhibit a more moderate influence on material consumption. Although increasing the layer height reduces the total number of deposited layers, the resulting thicker extruded tracks lead to a slight overall increase in filament usage. The response surface presented in Figure 7b highlights the interaction between layer height and the number of perimeters. The results confirm that variations in layer height have a relatively minor effect on filament consumption, whereas increasing the number of perimeters substantially raises material usage due to the addition of multiple external contours. Furthermore, the interaction between infill density and perimeter count shown in Figure 7c demonstrates a combined effect on filament usage. Higher infill densities contribute to increased material demand within the specimen interior, while a larger number of perimeters adds material to the outer shell. When both parameters are set to higher levels, their cumulative influence results in the maximum filament consumption observed.
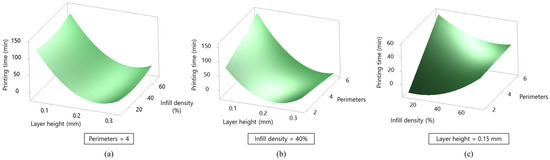
Figure 8 illustrates the combined influence of selected process parameters on the printing time in the FDM process using three-dimensional response surface plots. The interaction between layer height and infill density shown in Figure 8a indicates that printing time decreases noticeably as the layer height increases. This behaviour is primarily associated with the reduced number of layers required to fabricate the specimen when thicker layers are applied. In comparison, changes in infill density have a less pronounced effect on printing duration, leading only to a moderate increase in time due to the limited proportion of the infill region within the overall printed volume. The response surface presented in Figure 8b further confirms the dominant role of layer height in controlling printing time. While increasing layer height shortens the printing process, a higher number of perimeters results in a slight extension of printing time, which can be attributed to the additional toolpaths needed to produce thicker outer walls. Figure 8c illustrates the combined effect of infill density and the number of perimeters on printing time while the layer height is kept constant at 0.15 mm. The response surface clearly shows that an increase in infill density leads to a larger internal volume that must be filled with deposited material, which directly extends the duration of the infill printing phase. At the same time, increasing the number of perimeters adds additional outer wall contours, thereby lengthening the total toolpath and further increasing printing time. At a lower number of perimeters (two), increasing the infill density leads to a noticeable rise in printing time because a larger fraction of the specimen cross-section is filled by the infill structure. In this configuration, the reduced contribution of the outer walls means that the overall printing duration is primarily governed by the amount of material deposited inside the part, making the infill density the dominant factor. Conversely, when the number of perimeters is increased to six, the relative influence of the infill region becomes less pronounced, as a substantial portion of the printing time is consumed by the fabrication of thick external walls. Under these conditions, a lower infill density does not significantly reduce the total printing time, since the extended perimeter toolpaths dominate the process duration. As a result, printing time remains relatively high even at reduced infill densities when a large number of perimeters is applied.
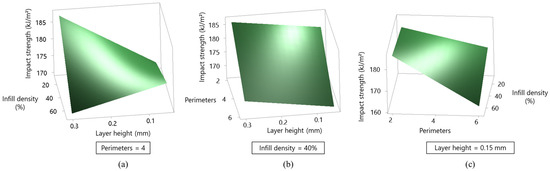
Figure 9a reveals a non-linear interaction between layer height and infill density in determining impact strength, indicating that the influence of one parameter strongly depends on the level of the other. At a relatively large layer height (0.30 mm), a reduction in infill density leads to an increase in impact strength. This behaviour can be attributed to the more compliant internal structure created at lower infill densities, which allows greater deformation and energy absorption during impact loading. In this configuration, the thicker deposited layers form fewer but mechanically more continuous interlayer interfaces, while the reduced internal stiffness delays crack initiation and promotes energy dissipation through controlled deformation rather than brittle fracture. In contrast, when a very small layer height (0.05 mm) is applied, decreasing the infill density results in a slight reduction in impact strength. At such fine layer heights, the large number of deposited layers enhances interlayer bonding; however, lowering the infill density introduces a higher volume of internal voids. In this case, the beneficial effect of improved interlayer adhesion is partially offset by insufficient internal support, leading to earlier crack initiation and reduced energy absorption capacity. The response surface further indicates that, at lower infill densities, increasing the layer height has a positive effect on impact strength. This trend suggests that thicker layers combined with a more open internal structure facilitate greater plastic deformation during impact, allowing the specimen to absorb more energy before fracture. Conversely, at high infill densities, an increase in layer height leads to a decrease in impact strength. Under these conditions, the dense internal structure restricts deformation, while thicker layers reduce interlayer bonding quality, promoting a more brittle fracture behaviour and limiting the material’s ability to dissipate impact energy. Overall, the observed trends in Figure 9a highlight the competing roles of interlayer bonding, internal stiffness, and deformation capability. The balance between these mechanisms determines whether the material response under impact loading is dominated by energy absorption through deformation or by premature crack initiation and propagation.
Figure 9b illustrates the interaction between layer height and the number of perimeters on impact strength at a fixed infill density of 40%. The response surface indicates a slight increase in impact strength with increasing layer height. This trend can be attributed to the formation of thicker extruded filaments, which enhance intra-layer bonding quality within each deposited layer. At a moderate infill density, such as 40%, the internal structure remains sufficiently compliant to allow localized deformation during impact, while thicker layers reduce stress concentration at interlayer boundaries. As a result, the material is able to absorb a marginally higher amount of impact energy before fracture as the layer height increases. In contrast, the response surface clearly shows a pronounced decrease in impact strength with an increasing number of perimeters. The addition of multiple perimeters significantly thickens the external shell, which increases the overall stiffness of the specimen. While a thicker outer wall may delay surface crack initiation, it simultaneously restricts global deformation of the specimen during impact loading. This constraint promotes stress localization at the interface between the rigid outer shell and the comparatively more compliant infill region, facilitating crack propagation once fracture is initiated. Moreover, the increased number of perimeter–infill junctions introduces additional interfacial regions that may act as preferential crack paths under dynamic loading conditions. Overall, the observed behaviour suggests that, at a fixed infill density, impact strength is governed by a balance between interlayer continuity and structural compliance. Increasing layer height slightly improves energy absorption by reducing interlayer discontinuities, whereas an excessive number of perimeters leads to a stiffer and more brittle response, resulting in a significant reduction in impact strength.
Figure 9c illustrates the interaction between infill density and the number of perimeters on impact strength at a fixed layer height of 0.15 mm. The response surface indicates a clear decrease in impact strength with an increasing number of perimeters, suggesting that perimeter count plays a dominant role in governing the impact behaviour under these conditions. An increased number of perimeters significantly thickens the outer shell, which enhances structural stiffness but simultaneously restricts global deformation during impact loading. This restriction limits the material’s ability to dissipate impact energy through plastic deformation, thereby promoting a more brittle fracture response and reducing the measured impact strength. At higher perimeter counts, a reduction in infill density results in an increase in impact strength. This trend can be explained by the introduction of a more compliant internal structure, which facilitates greater energy absorption during impact. When the outer shell is relatively thick, lowering the infill density allows the interior of the specimen to deform and act as an energy-dissipating core, partially compensating for the stiffness imposed by the perimeters. In this configuration, the balance between a rigid shell and a deformable core promotes improved impact performance. In contrast, at a low number of perimeters, variations in infill density have a negligible effect on impact strength. With a thin outer shell, the overall mechanical response is governed primarily by shell integrity and interlayer bonding rather than by the internal infill structure. Consequently, changes in infill density do not significantly alter the dominant fracture mechanisms, and the impact strength remains relatively insensitive to infill variations under these conditions. Overall, the observed trends in Figure 9c highlight the critical role of shell–core interaction in FDM-printed components. Impact strength is maximized when a balance is achieved between sufficient external wall thickness to delay crack initiation and an internal structure that remains compliant enough to absorb impact energy through controlled deformation.
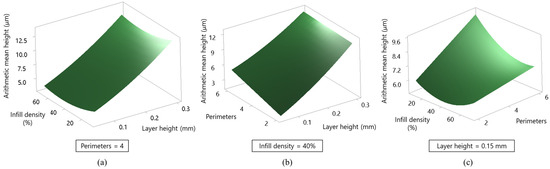
Figure 10 presents the response surface analysis of surface roughness expressed as arithmetic mean height, revealing that surface quality in FDM-printed specimens is primarily governed by layer height, while the influence of infill density and perimeter count becomes significant only under specific structural conditions. As shown in Figure 10a, surface roughness increases monotonically with increasing layer height, whereas infill density exhibits no noticeable effect. This behaviour is expected due to the location of surface roughness measurements. An increase in layer height results in more pronounced stair-stepping effects and larger vertical deviations between successive layers, directly increasing the measured arithmetic mean height. Since infill density affects only the internal structure and does not alter the external deposition path at the measurement location, its influence on surface roughness is negligible in this configuration. Figure 10b illustrates the combined effect of layer height and perimeter count at a fixed infill density of 40%. The response surface clearly indicates that increasing layer height leads to a significant rise in surface roughness, confirming that layer height is the dominant parameter controlling surface topography. In addition, a mild increase in roughness is observed with a higher number of perimeters. This trend can be attributed to the repeated deposition of adjacent outer wall contours, which increases the likelihood of surface irregularities caused by minor variations in extrusion flow, nozzle positioning, and cooling behaviour. As more perimeters are added, the cumulative effect of these small deviations becomes more pronounced, leading to a gradual increase in the arithmetic mean height. The interaction between infill density and perimeter count shown in Figure 10c further highlights the role of structural stiffness beneath the surface layer. At a constant layer height of 0.15 mm, increasing the number of perimeters results in higher surface roughness due to the formation of a thicker and stiffer outer shell. This increased stiffness limits the ability of freshly deposited filaments to relax and self-level, thereby preserving surface irregularities. Moreover, at higher perimeter counts, a reduction in infill density leads to an additional increase in surface roughness. In this case, the less rigid internal structure provides weaker support for the outer shell, making it more susceptible to local deformation, vibration, and uneven cooling during deposition. These effects translate into larger surface height variations and, consequently, increased arithmetic mean height values. In contrast, when the number of perimeters is low, the influence of infill density on surface roughness is minimal, as the surface morphology is predominantly governed by the deposition characteristics of the outermost contour rather than by the internal structure. Overall, the trends observed in Figure 10 demonstrate that surface roughness in FDM-fabricated components is mainly controlled by layer height, while the number of perimeters and infill density play secondary but interacting roles by modifying the mechanical support and stiffness conditions beneath the surface layer. The balance between deposition geometry, shell stiffness, and internal support ultimately determines the resulting surface quality.
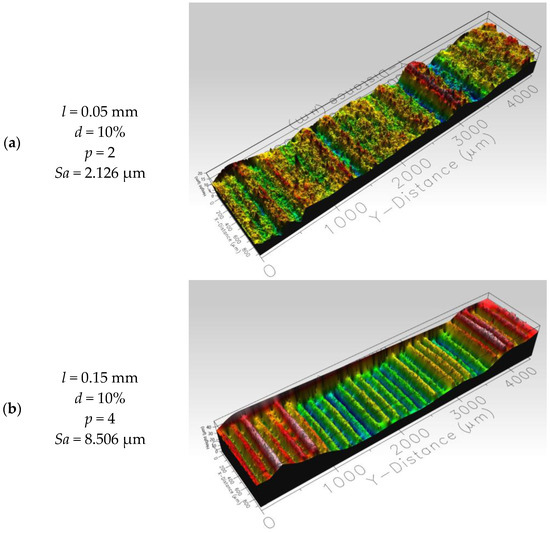
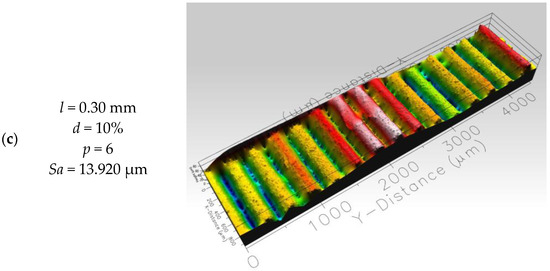
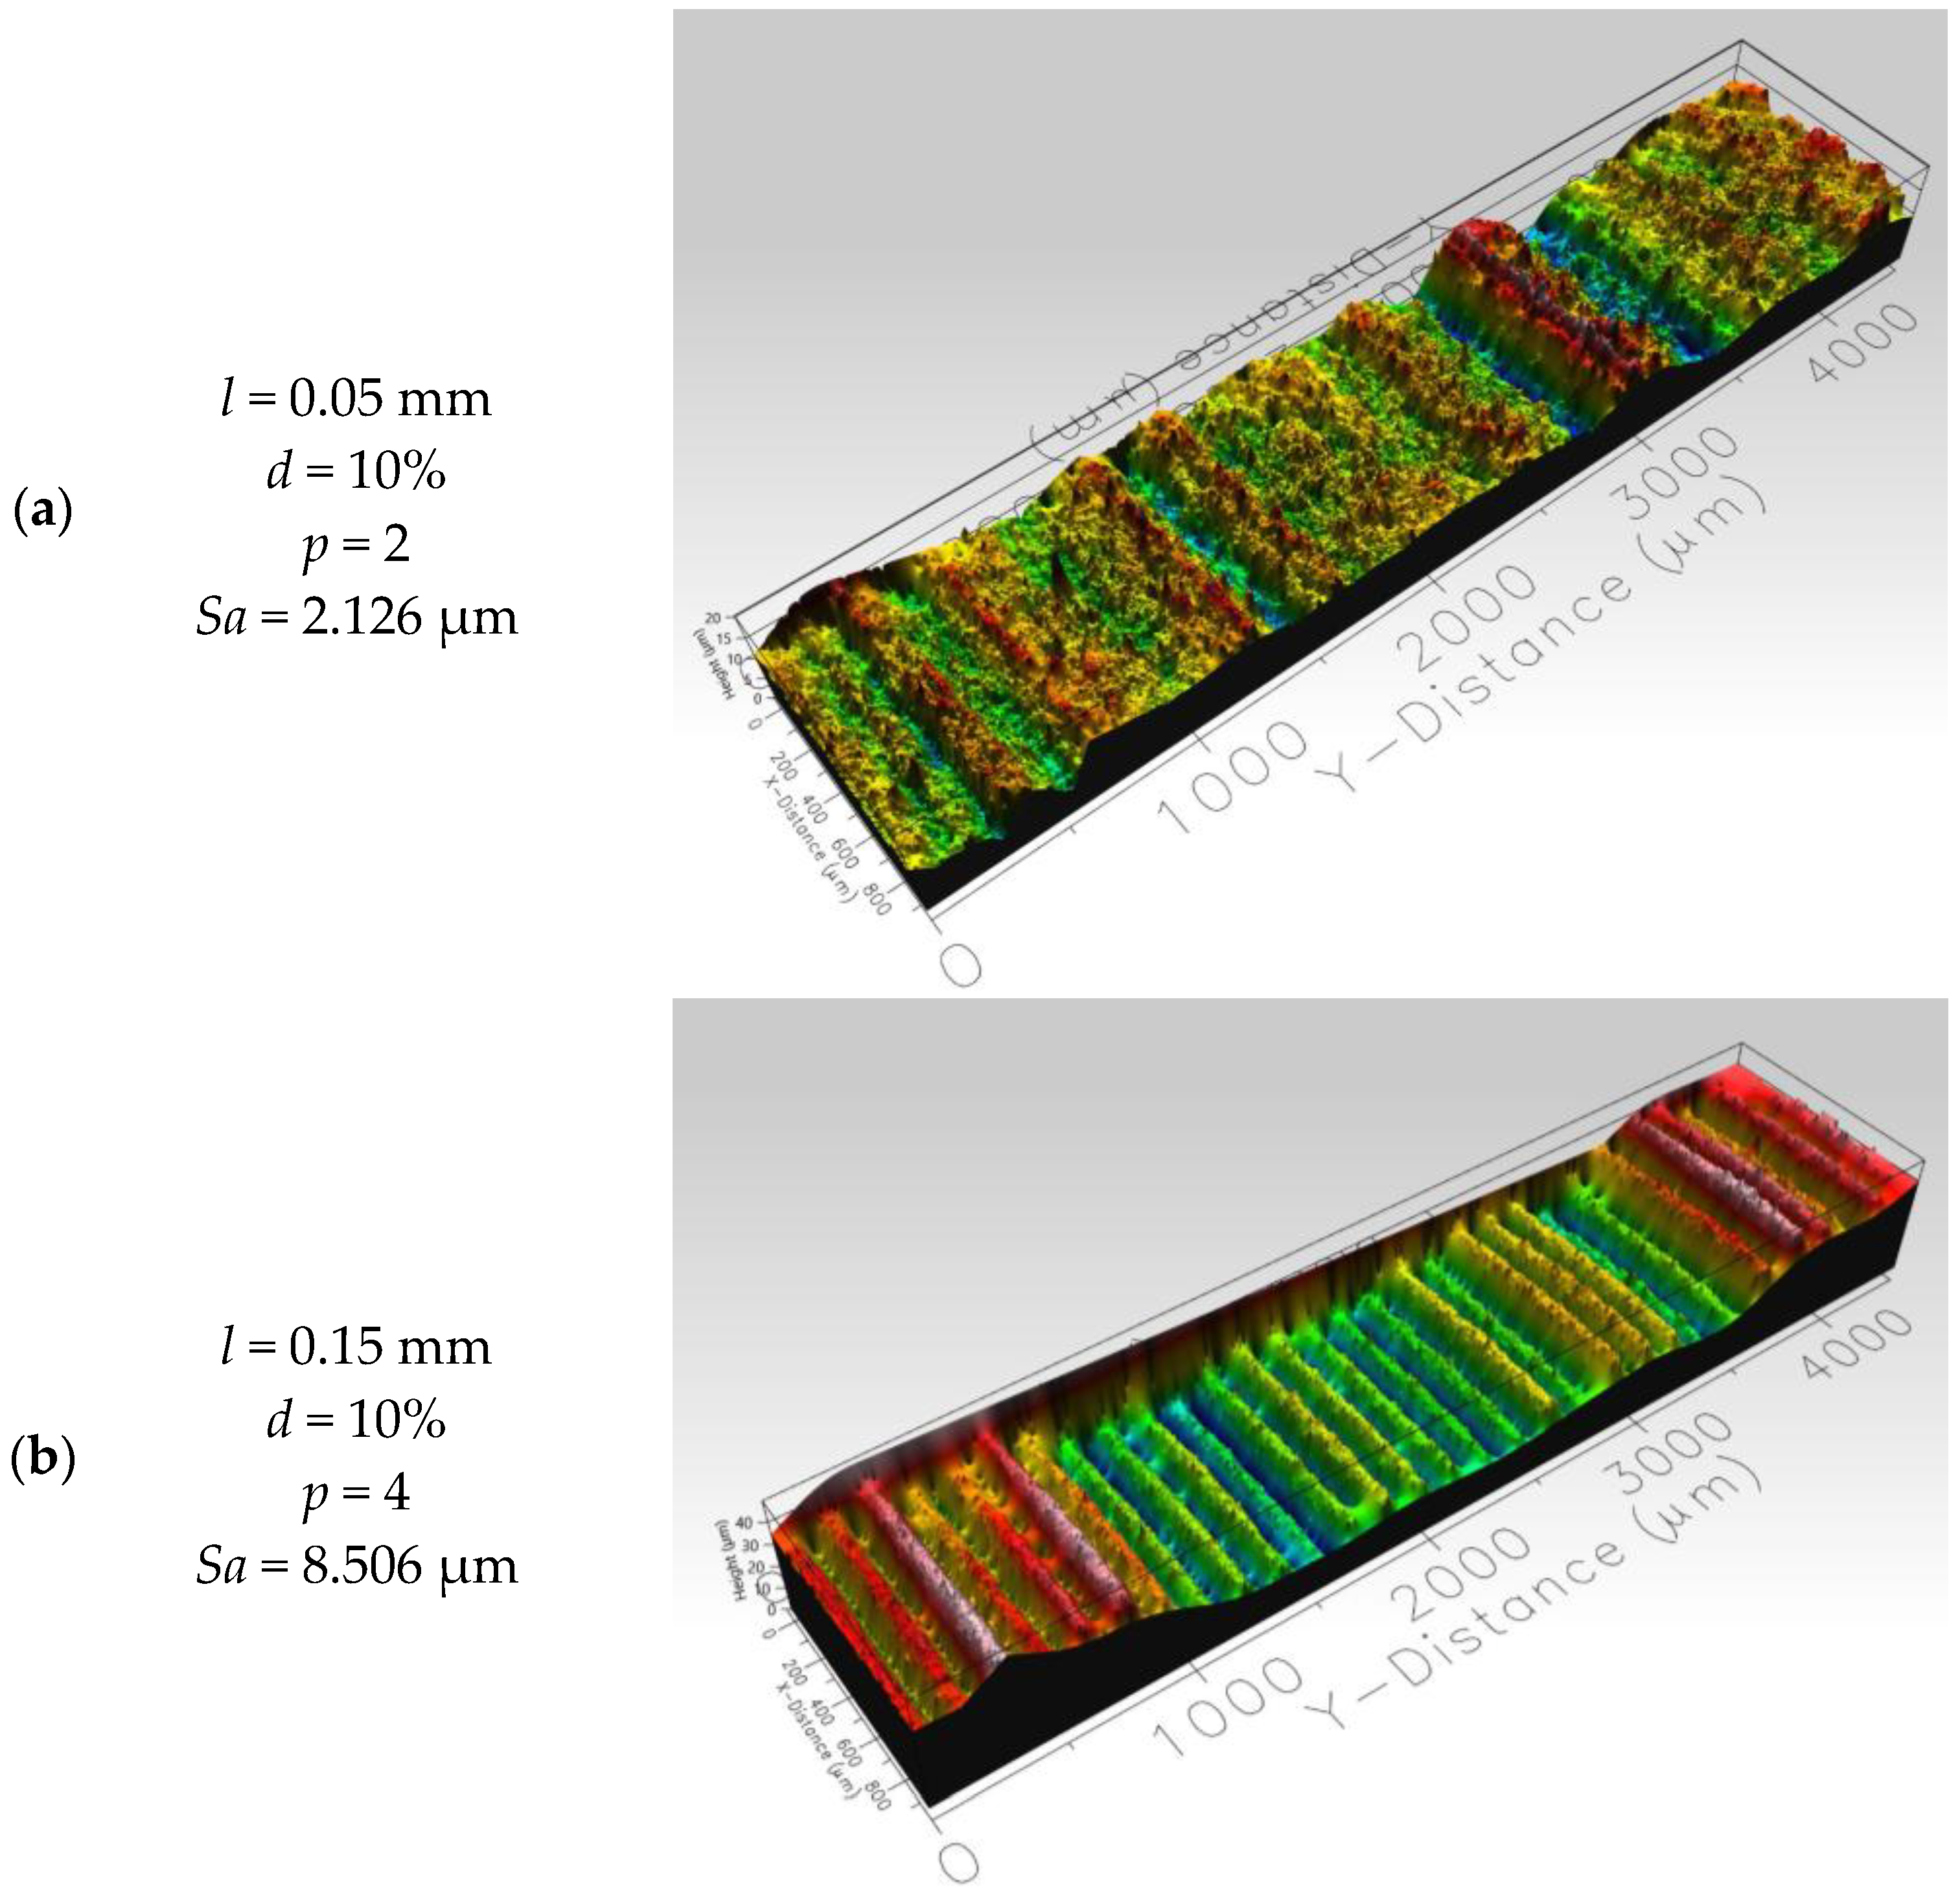
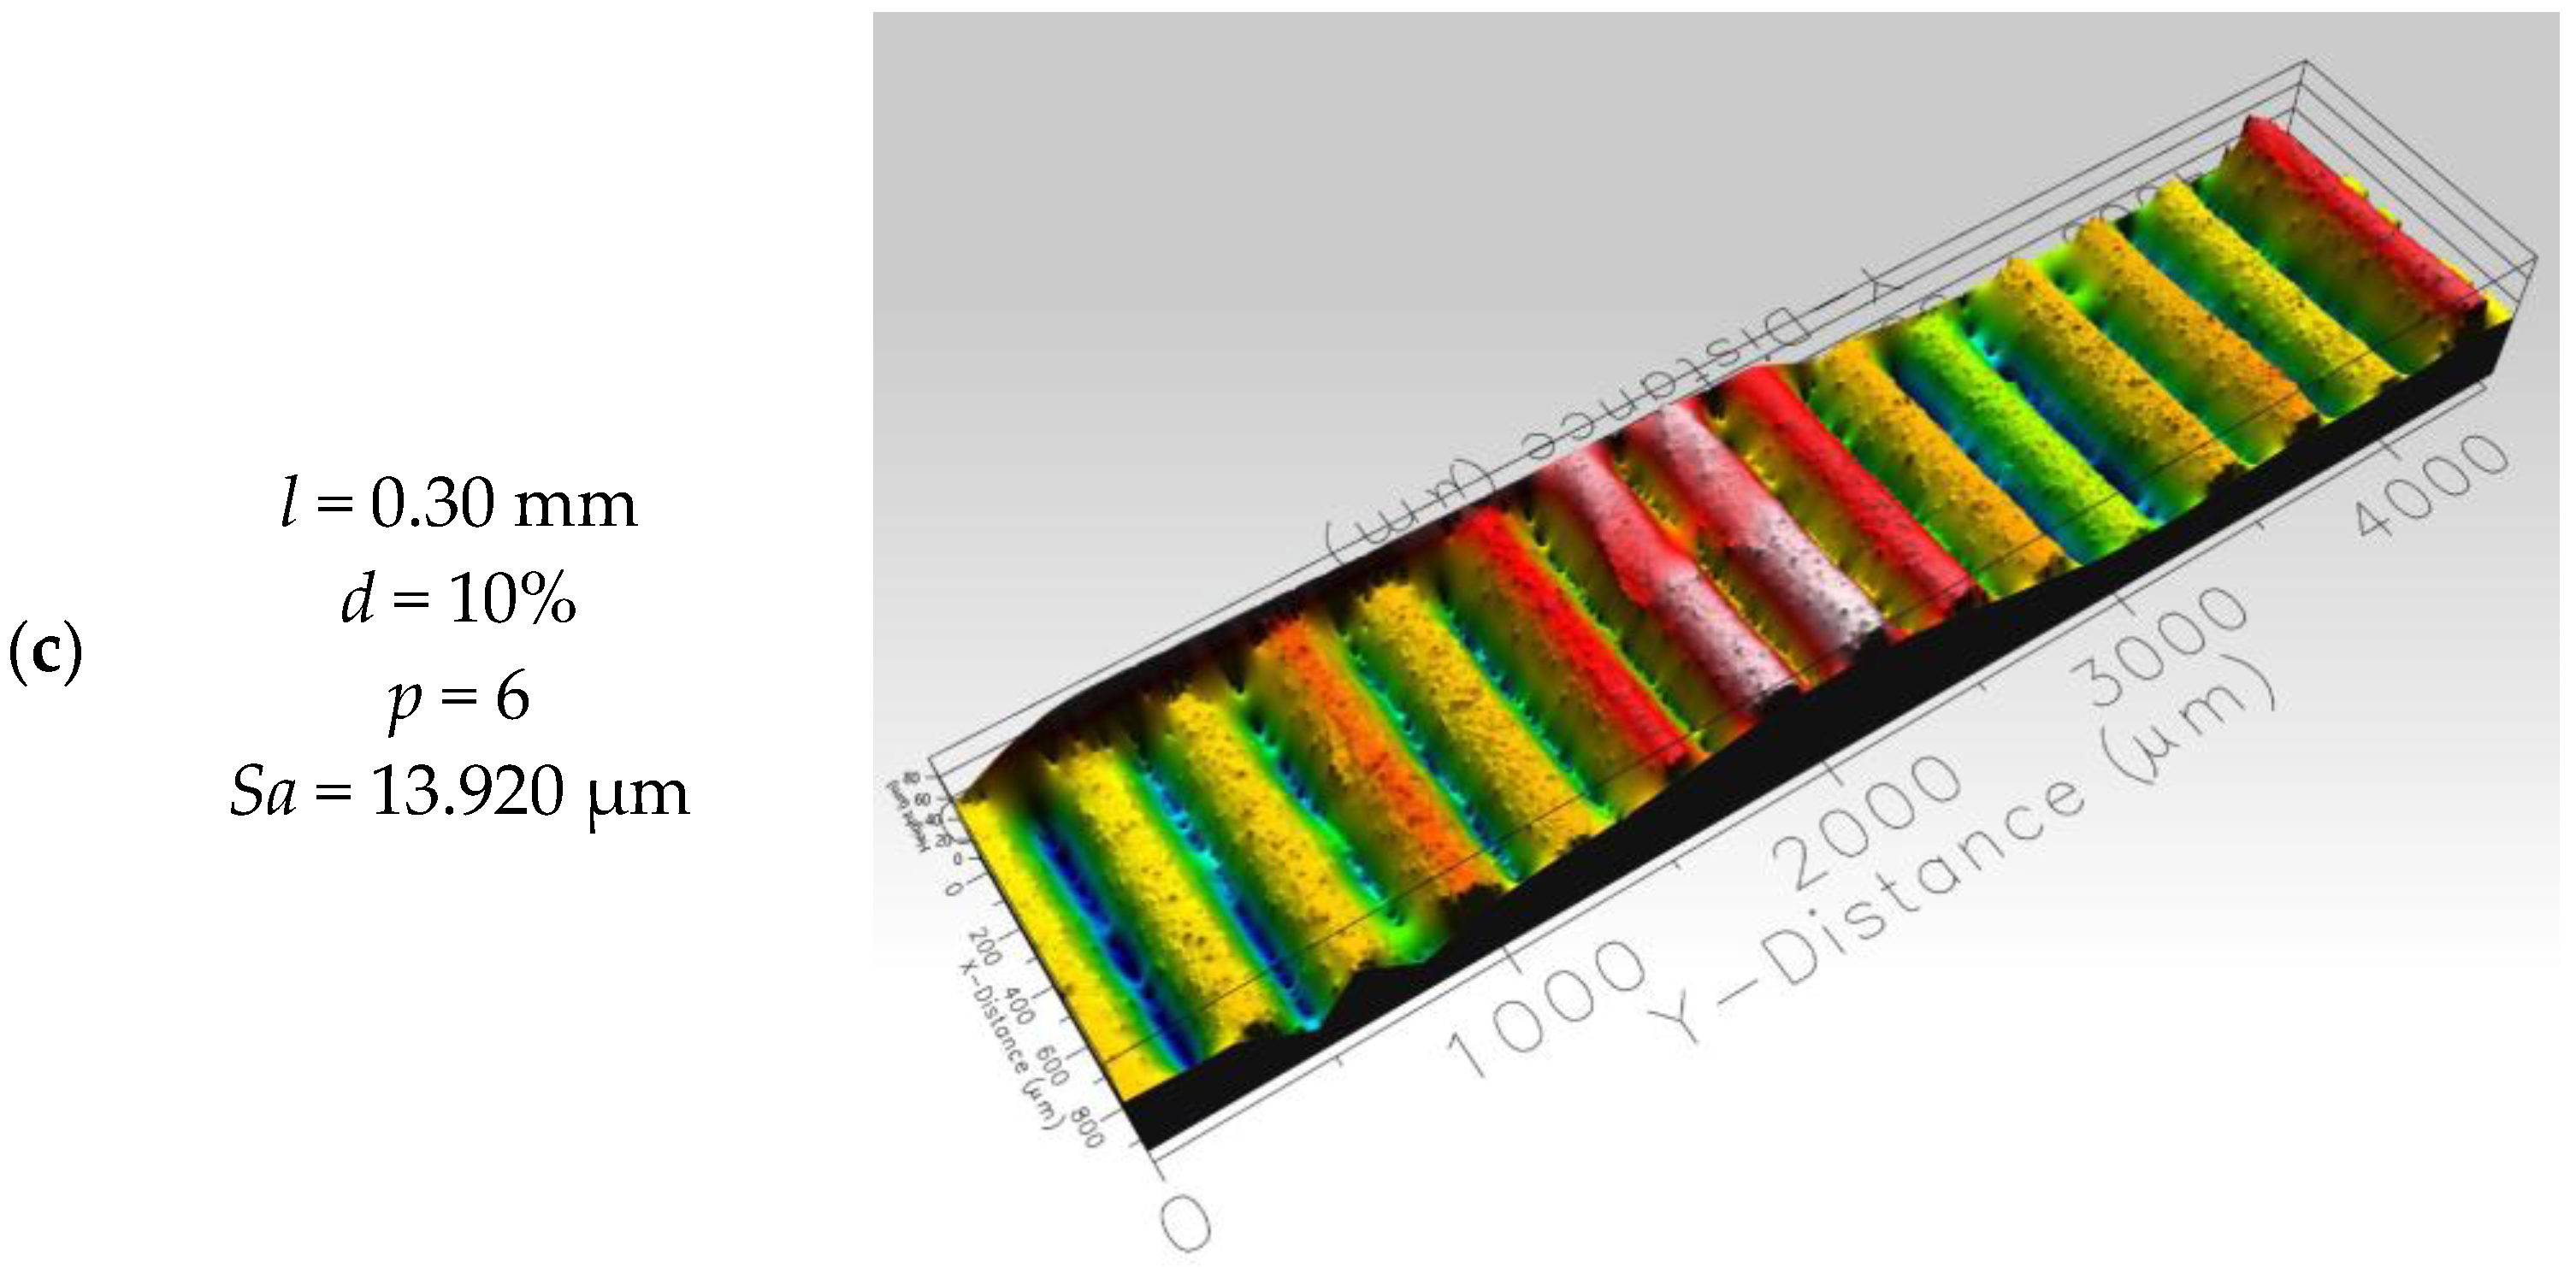
Figure 11 presents the results of 3D surface roughness measurements obtained by optical profilometry for selected specimens, together with the corresponding process parameter settings and measured arithmetic mean height values.
Figure 11.
Visualization of surface topography for selected samples (a) sample No. 1, (b) sample No. 4, (c) sample No. 7.
Relationship Between Impact Strength and Surface Roughness
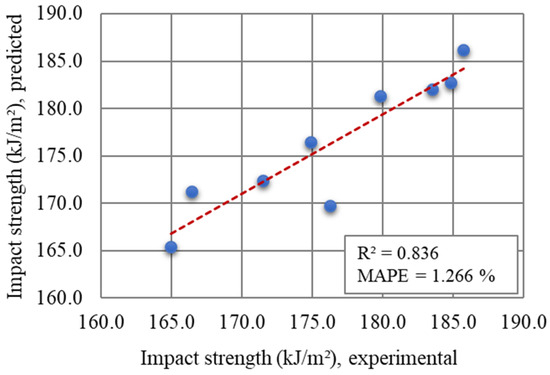
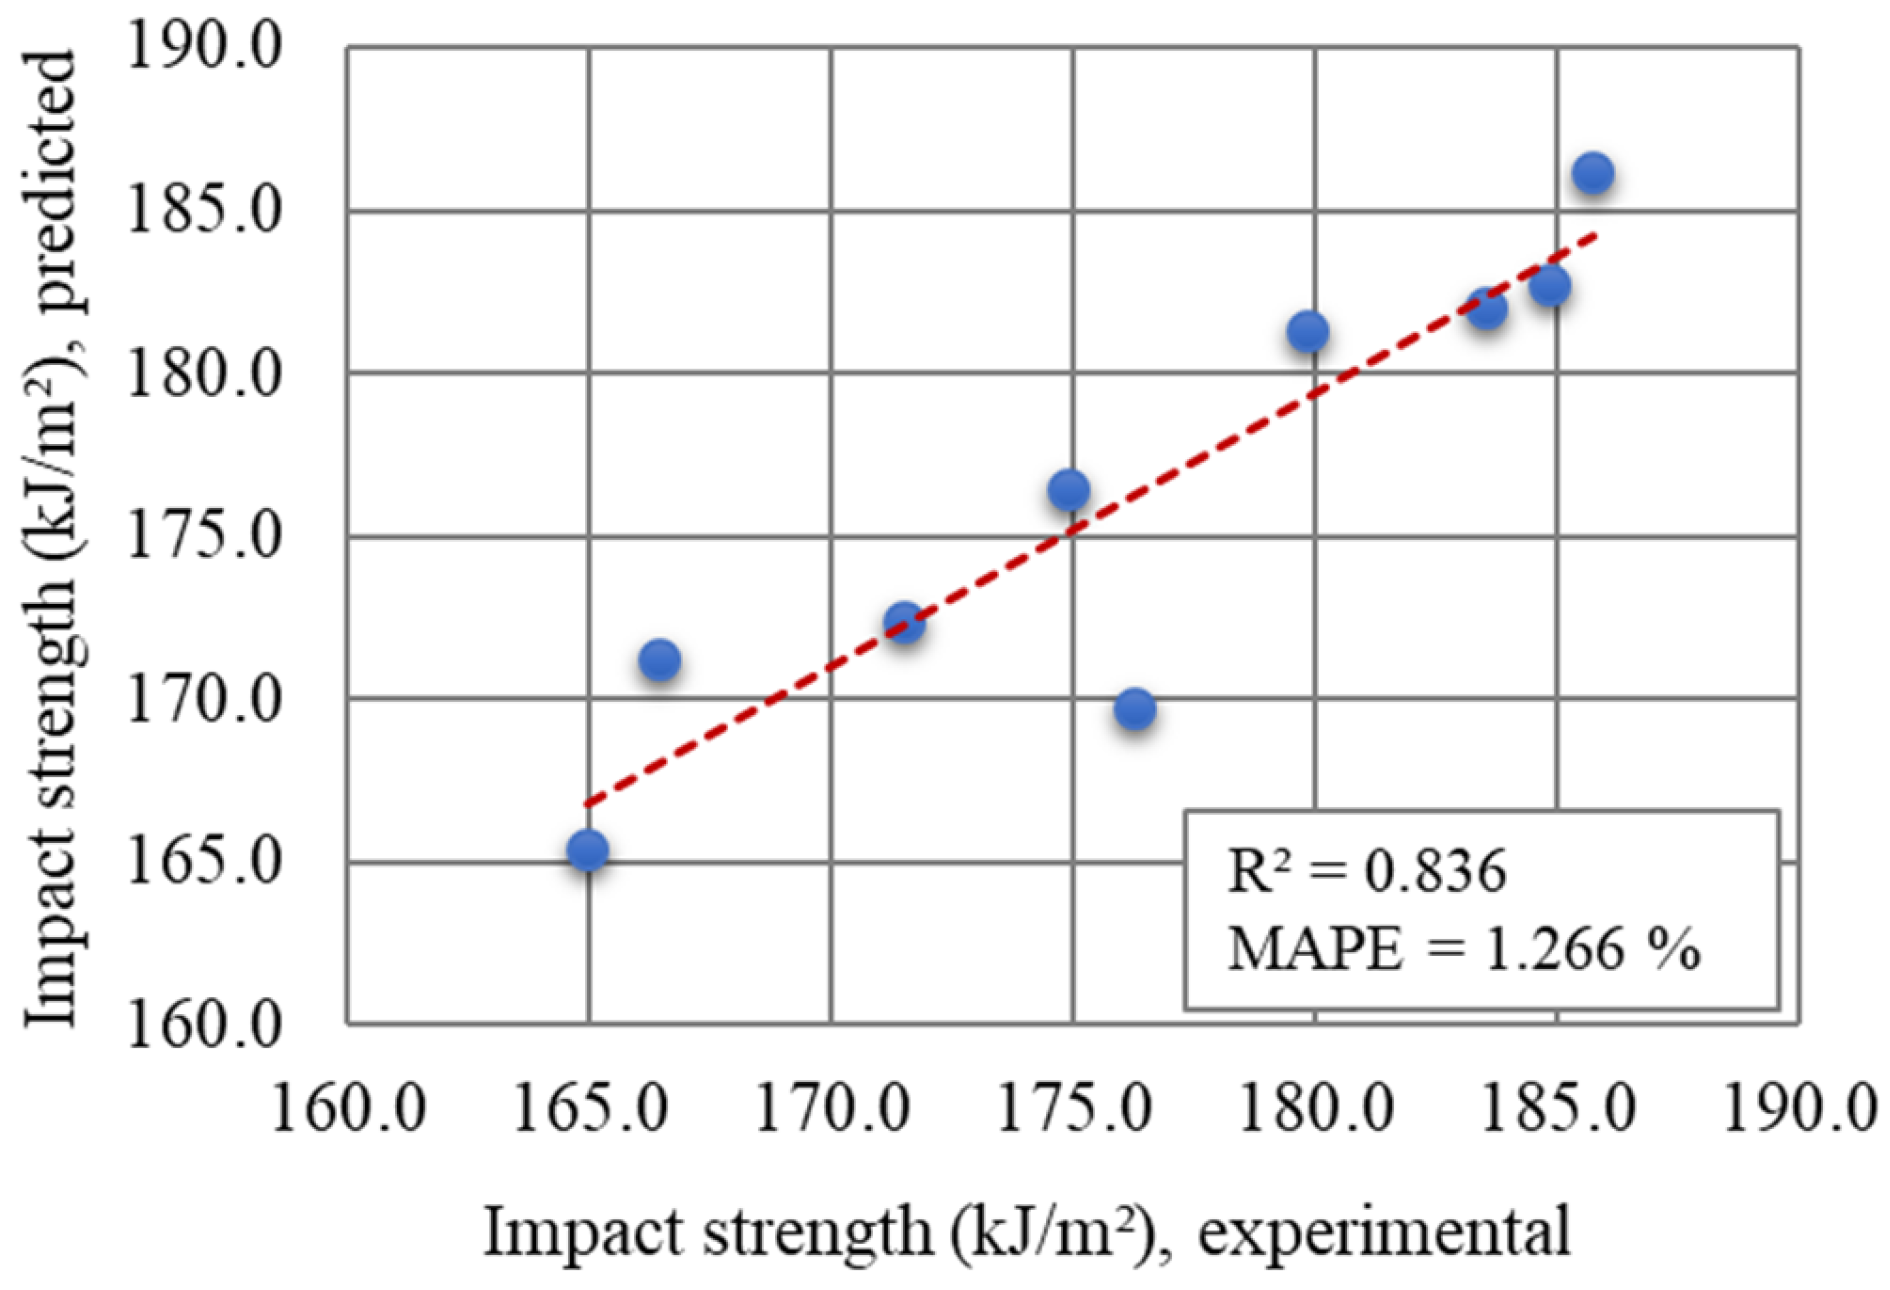
To investigate the relationship between destructive and non-destructive characterization responses, a regression-based mathematical model was developed to describe the correlation between impact strength and surface roughness expressed by the arithmetic mean height. In addition to surface roughness, layer height was included as a key independent variable in the regression formulation, since it was previously identified as the most influential process parameter affecting surface roughness values, as discussed and demonstrated in Figure 10. The resulting regression model, which captures the combined influence of these variables on impact strength, is provided in Equation (5). The reliability and predictive capability of the proposed model were subsequently assessed through a comparison between experimentally measured impact strength values and those estimated by the regression equation. The accuracy of the model was quantitatively evaluated using the coefficient of determination (R2) and the mean absolute percentage error (MAPE) as validation indicators. The comparison results and the corresponding validation metrics are presented in Figure 12, confirming the suitability of the developed regression model for describing the relationship between impact strength and surface roughness.
Figure 12.
Validation of regression model for impact strength prediction.
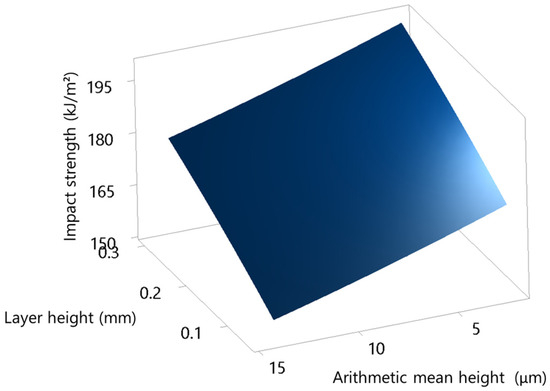
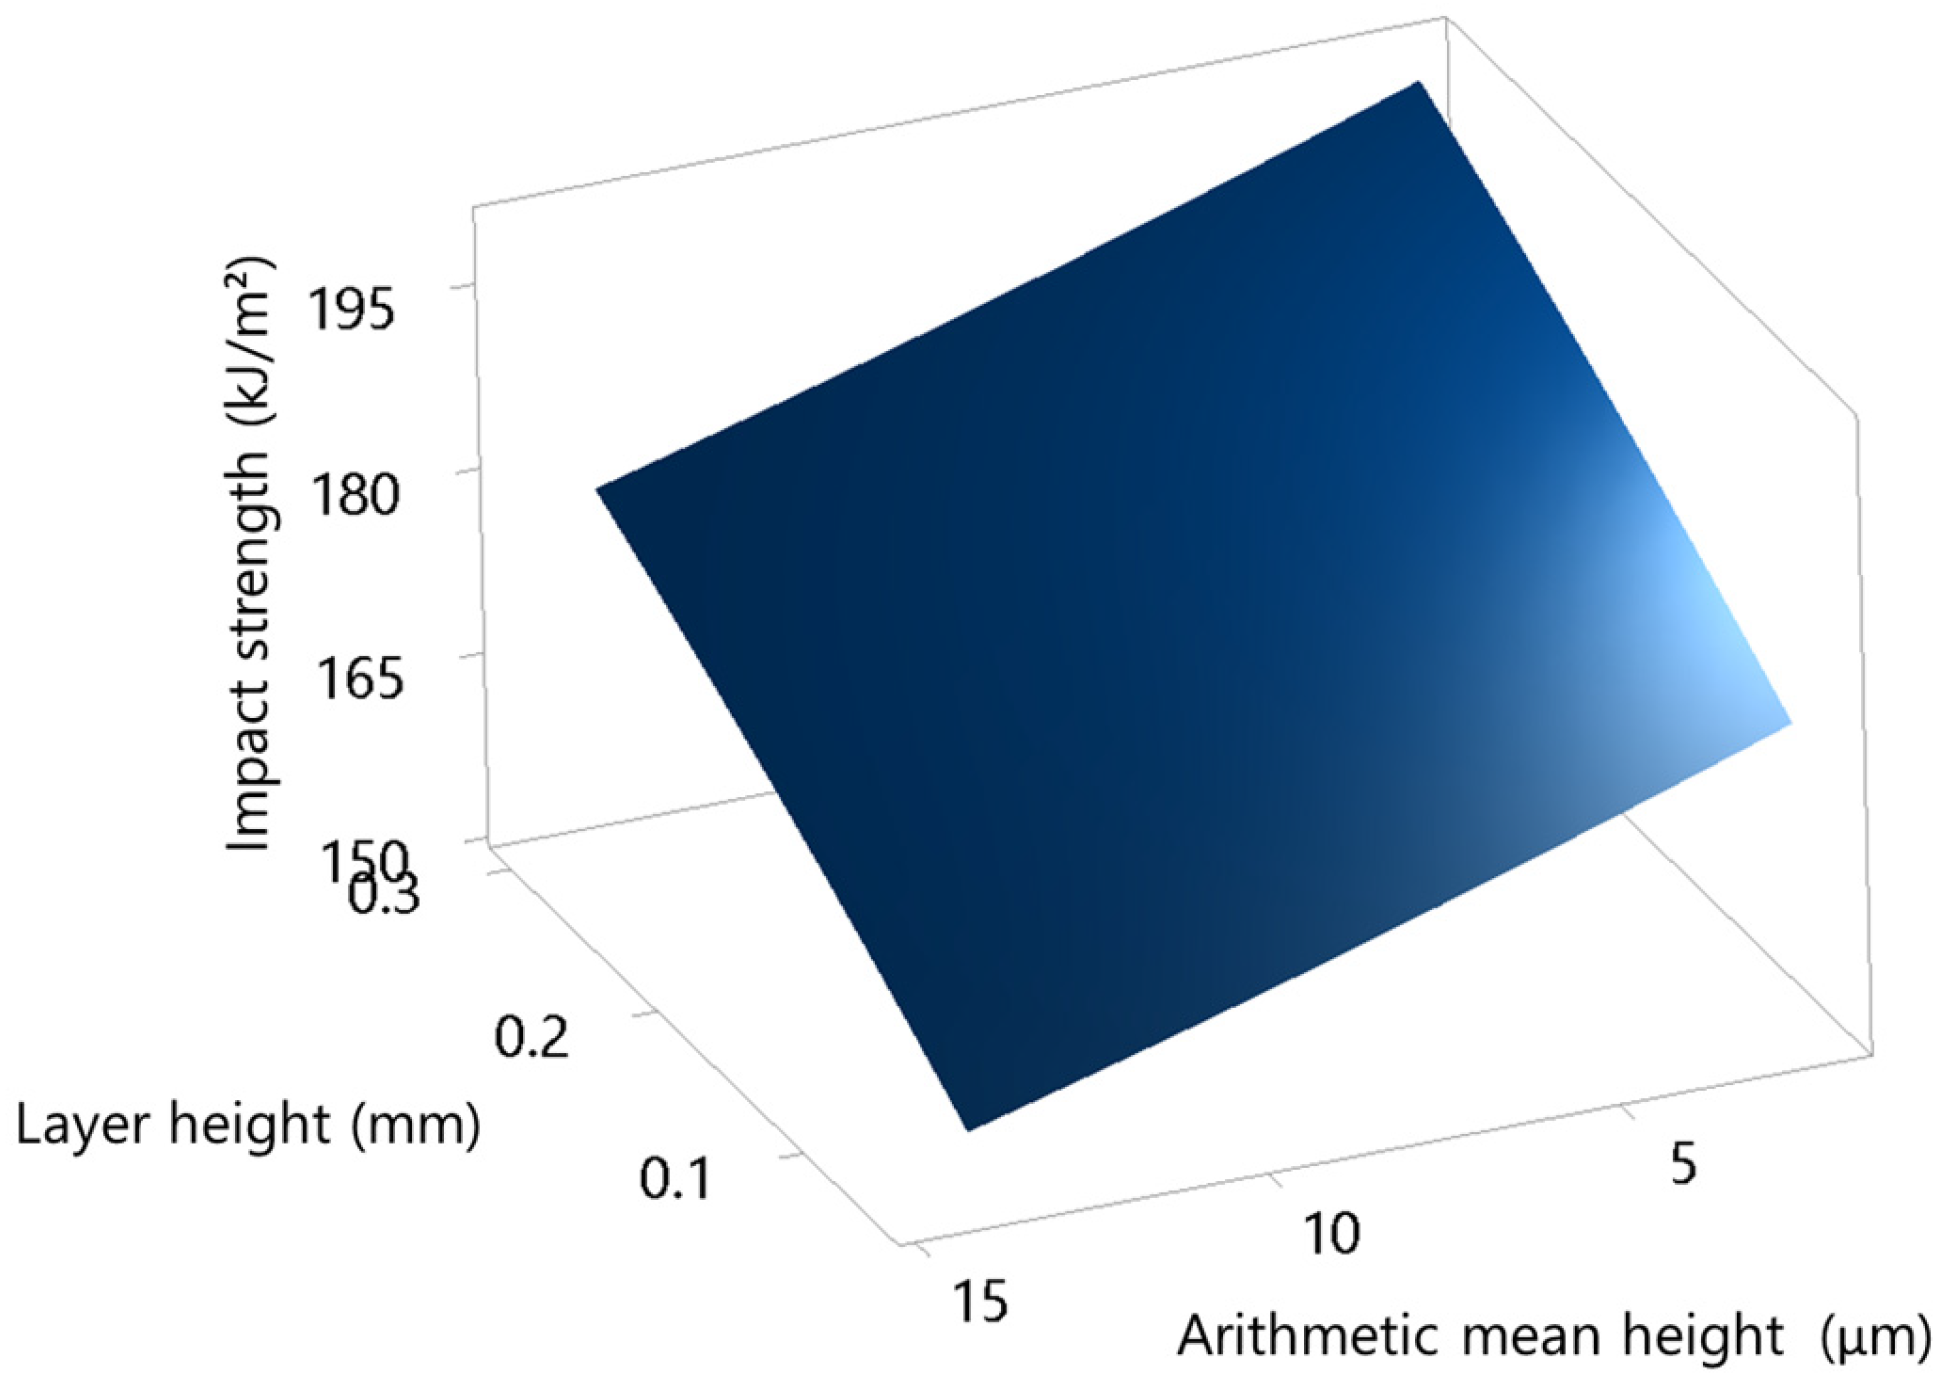
Figure 13 illustrates a three-dimensional response surface that describes the combined influence of layer height and surface roughness, expressed as arithmetic mean height, on impact strength. The response surface clearly indicates that higher impact strength values are achieved with increasing layer height and decreasing surface roughness, confirming that both parameters play a synergistic role in governing the impact behaviour of FDM-printed specimens. The positive effect of increasing layer height on impact strength can be attributed to changes in the internal bonding characteristics of the printed material. Thicker deposited layers reduce the total number of interlayer interfaces, which are commonly identified as preferential sites for crack initiation under impact loading. As a result, the stress distribution during impact becomes more uniform, allowing the material to sustain higher energy absorption before fracture. In addition, larger layer heights promote improved continuity of deposited filaments within each layer, which further contributes to enhanced resistance against crack propagation. Surface roughness, on the other hand, primarily affects impact strength through its influence on stress concentration at the specimen surface. Lower arithmetic mean height values correspond to smoother surfaces with fewer geometric discontinuities, thereby reducing localized stress intensification during impact loading. A smoother surface delays crack initiation at the outer layers and promotes a more stable fracture process, allowing a greater portion of the applied impact energy to be dissipated through deformation rather than being consumed by premature crack growth. The interaction captured in Figure 13 suggests that the beneficial effect of increased layer height is most pronounced when accompanied by reduced surface roughness. In this regime, the combined improvement in interlayer integrity and surface quality minimizes both internal and surface-related fracture initiation mechanisms. Conversely, higher surface roughness levels counteract the positive influence of layer height by introducing surface defects that act as crack initiation points, thereby limiting the achievable impact strength despite favourable internal bonding conditions. Overall, the response surface highlights that impact performance is maximized when internal structural integrity, governed by layer height, is complemented by a smooth surface morphology. This confirms that impact strength in FDM-fabricated components is not solely dictated by bulk material properties, but rather by the combined effects of deposition geometry and surface condition, which together control crack initiation and energy dissipation mechanisms under dynamic loading.
Figure 13.
Response surface analysis of impact strength influenced by arithmetic mean height and layer height.
3.2. Multi-Objective Optimization
At this stage of the study, a multi-objective optimization strategy was implemented to identify the most suitable combination of process parameters that yields optimal performance of the FDM additive manufacturing process. The optimization task aimed to achieve conflicting objectives simultaneously, namely the reduction of filament consumption, printing time, and surface roughness, while at the same time enhancing impact strength. The present analysis assesses the simultaneous contribution of all investigated parameters within a multi-objective optimization context, rather than in identifying the dependency itself.
To address this challenge, a hybrid Taguchi-Grey Relational Analysis (GRA) methodology was employed. This approach enables the transformation of multiple performance indicators into a single grey relational grade, thereby facilitating a comprehensive evaluation and optimization of process parameters. One of the key benefits of this method is its practical simplicity, as it eliminates the need for complex mathematical formulations and allows the direct identification of optimal parameter levels without additional intermediate calculations [36].
The optimization procedure begins with the calculation of signal-to-noise (S/N) ratios based on the experimentally obtained response values. The formulation of the S/N ratio depends on the desired optimization objective for each response. In the present case, filament usage, printing time, and surface roughness were treated as minimization criteria, and their corresponding S/N ratios were computed using Equation (6). In contrast, impact strength was considered a maximization objective, and its S/N ratios were therefore determined according to Equation (7).
where n = number of replications, yij = observed response value where i = 1, 2, …, n; j = 1, 2, …, k.
Grey Relational Analysis (GRA) is a systematic approach used to assess multiple experimental responses by examining their proximity to corresponding ideal performance levels. This proximity is quantified through the Grey Relational Coefficient (GRC), which expresses the degree of association between the experimental outcome and its ideal counterpart. A GRC value of one represents complete agreement, indicating that the experimental response exactly matches the ideal value. For the purpose of multi-objective optimization, the individual GRCs associated with each response are combined into a single scalar metric referred to as the Grey Relational Grade (GRG). Within the GRA framework, optimization is achieved by maximizing the GRG, irrespective of whether the individual response variables are defined as minimization or maximization objectives. Consequently, the parameter combination yielding the highest GRG is considered to provide the most favourable overall process performance [37].
The implementation of GRA-based multi-objective optimization requires a sequence of structured steps. The initial step involves normalizing the experimental response data to a common scale ranging from 0 to 1, which reduces data dispersion and enables a meaningful comparison among different response variables. In the present study, normalization was applied to the signal-to-noise (S/N) ratios associated with each response. The selection of the normalization expression depended on the intended optimization objective of the response. For responses targeted for minimization—namely, filament usage, printing time, and surface roughness expressed as arithmetic mean height—the normalization procedure followed Equation (8). In contrast, for the response requiring maximization, namely impact strength, normalization was performed using Equation (9). The resulting normalized values for all considered responses are reported in Table 4.
where is the original sequence, is the sequence after data pre-processing (normalization), is the largest value in , and is the smallest value in .
The next stage of the GRA-based multi-objective optimization involves the determination of the grey relational coefficient for each individual response. These coefficients were computed in accordance with Equation (10).
are calculated using Equations (11)–(13).
where is the distinguishing coefficient in the range of (in general, ), is the deviation sequence for the reference sequence, is the reference sequence ( is the number of responses), and is the specific comparison sequence.
In the final stage of the GRA-based optimization, the Grey Relational Grade (GRG) was determined using Equation (14), which is applicable under the assumption that all evaluated responses are assigned equal weighting factors. The computed Grey Relational Coefficients (GRCs), the corresponding GRG values, and the resulting ranking of experimental trials—where the highest-ranked trial corresponds to the maximum GRG and the lowest-ranked trial to the minimum—are presented in Table 5.
Table 4.
Response S/N ratios and normalization results.
Table 5.
Grey relational coefficients (GRCs), grey relational grade (GRG) and rank.
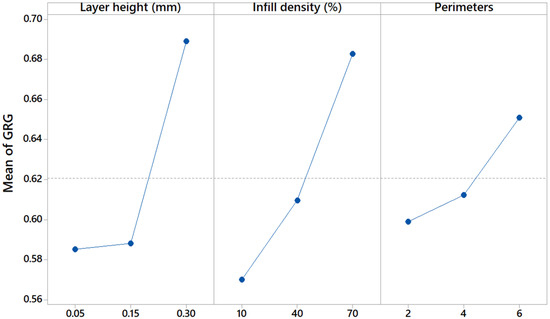
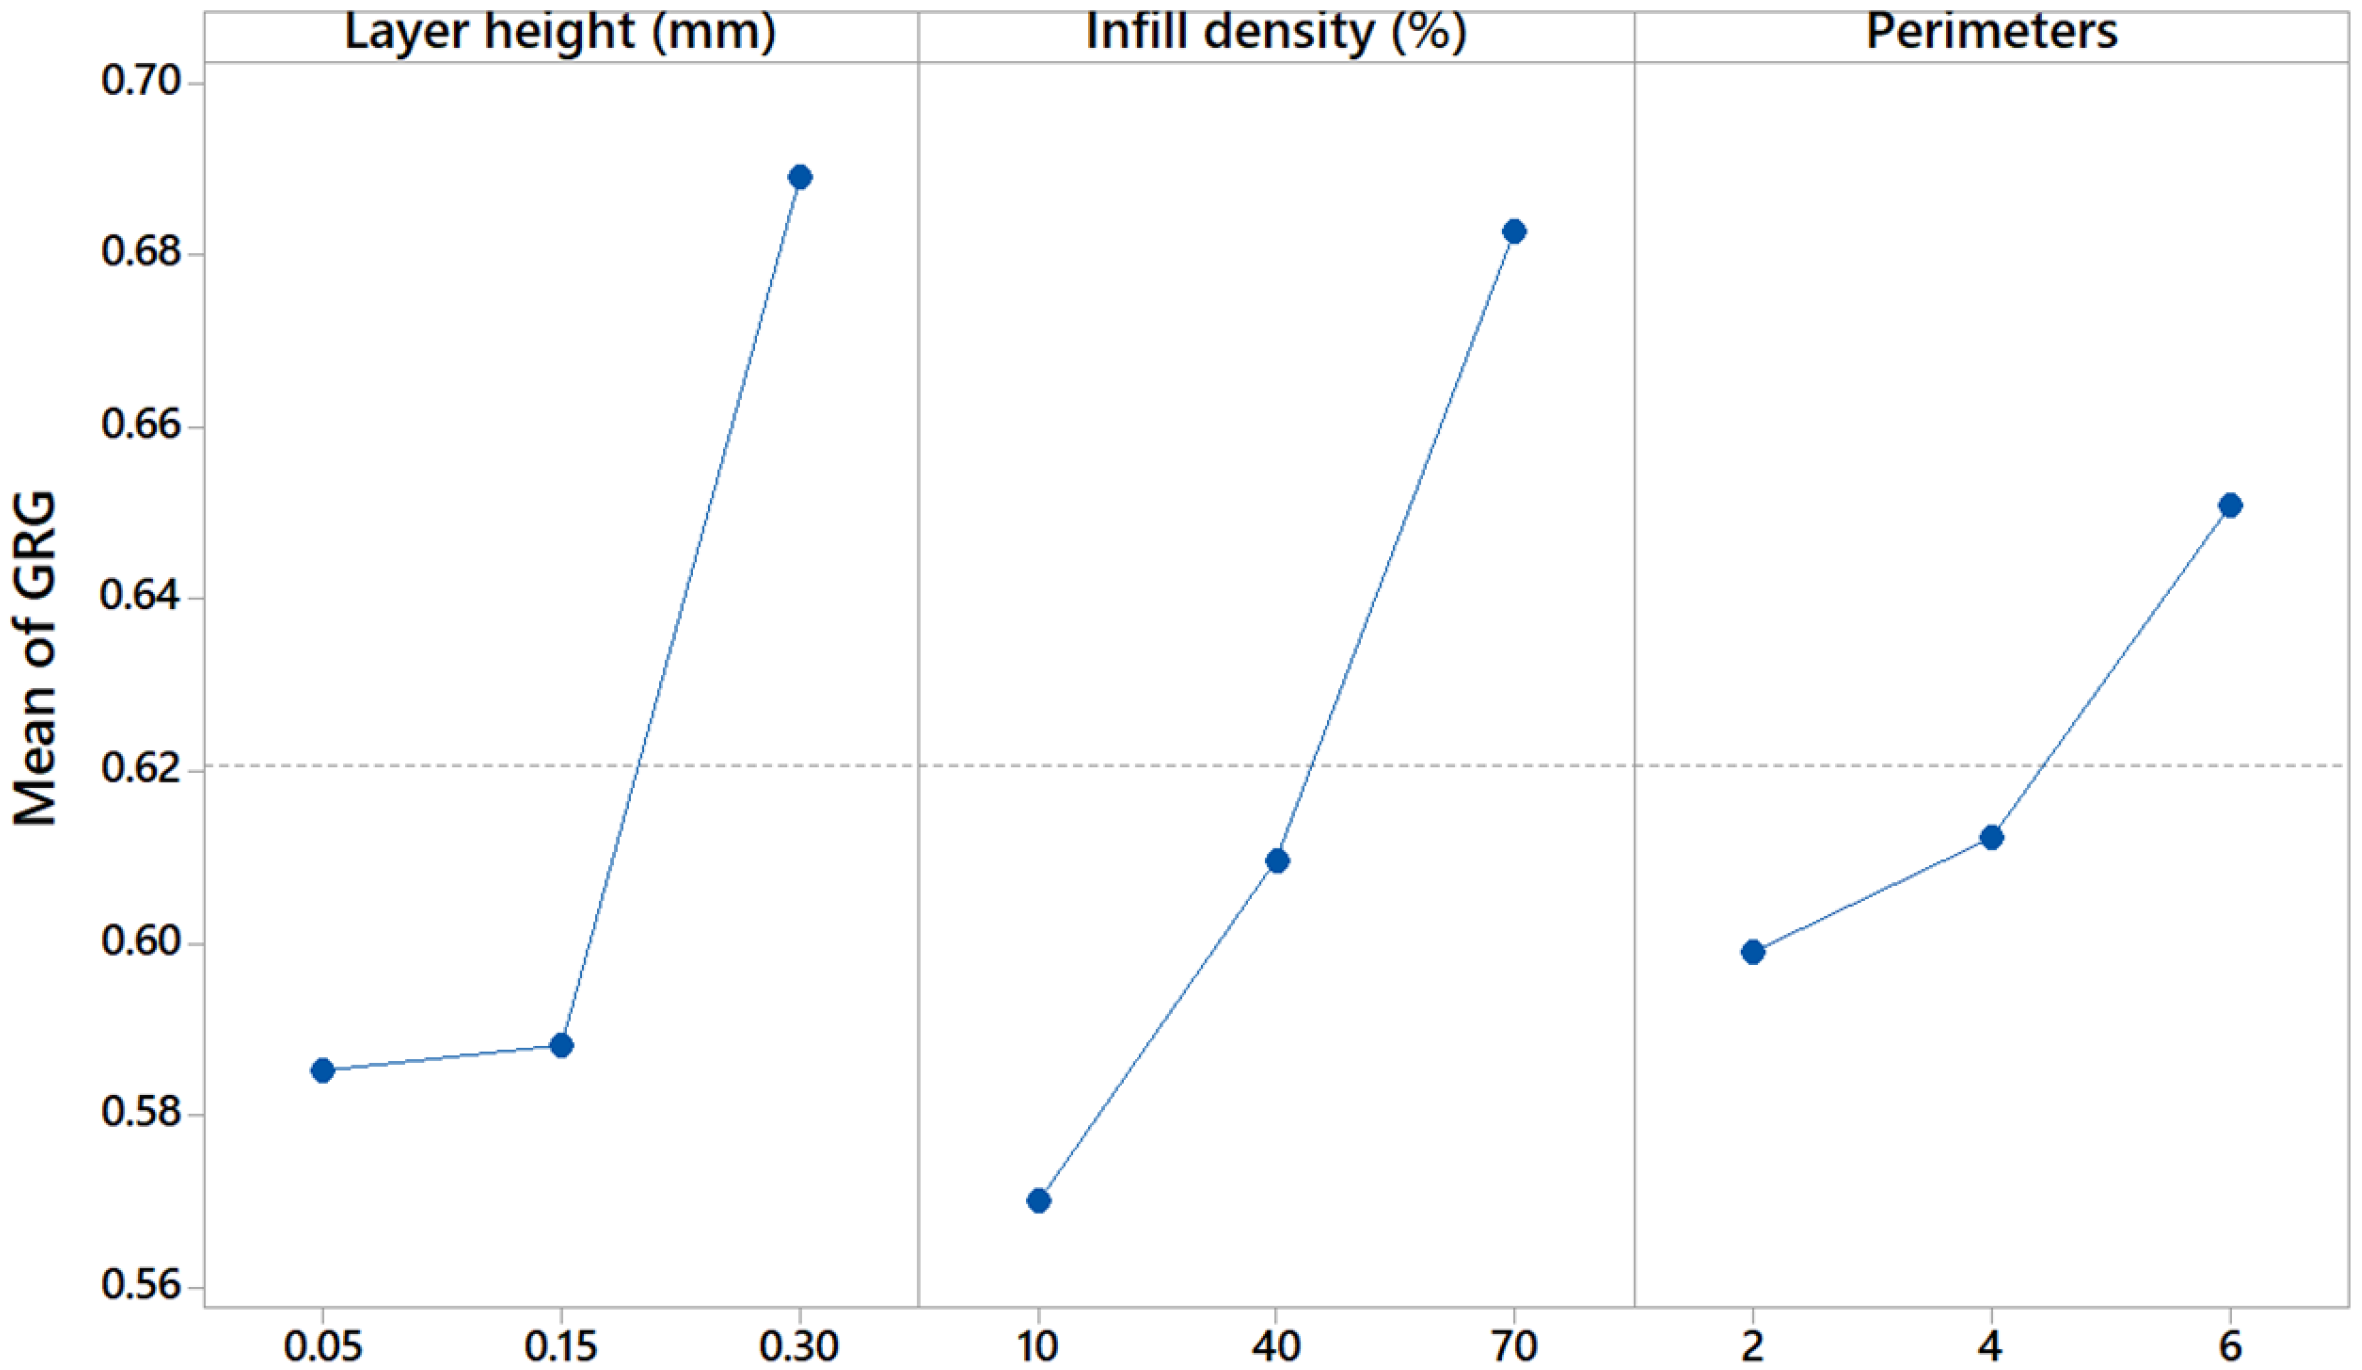
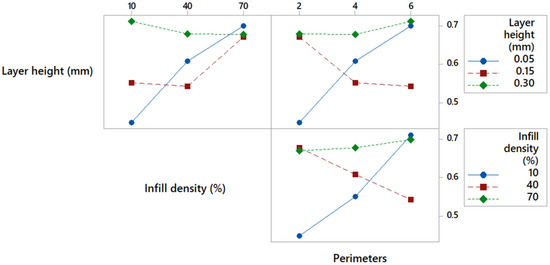
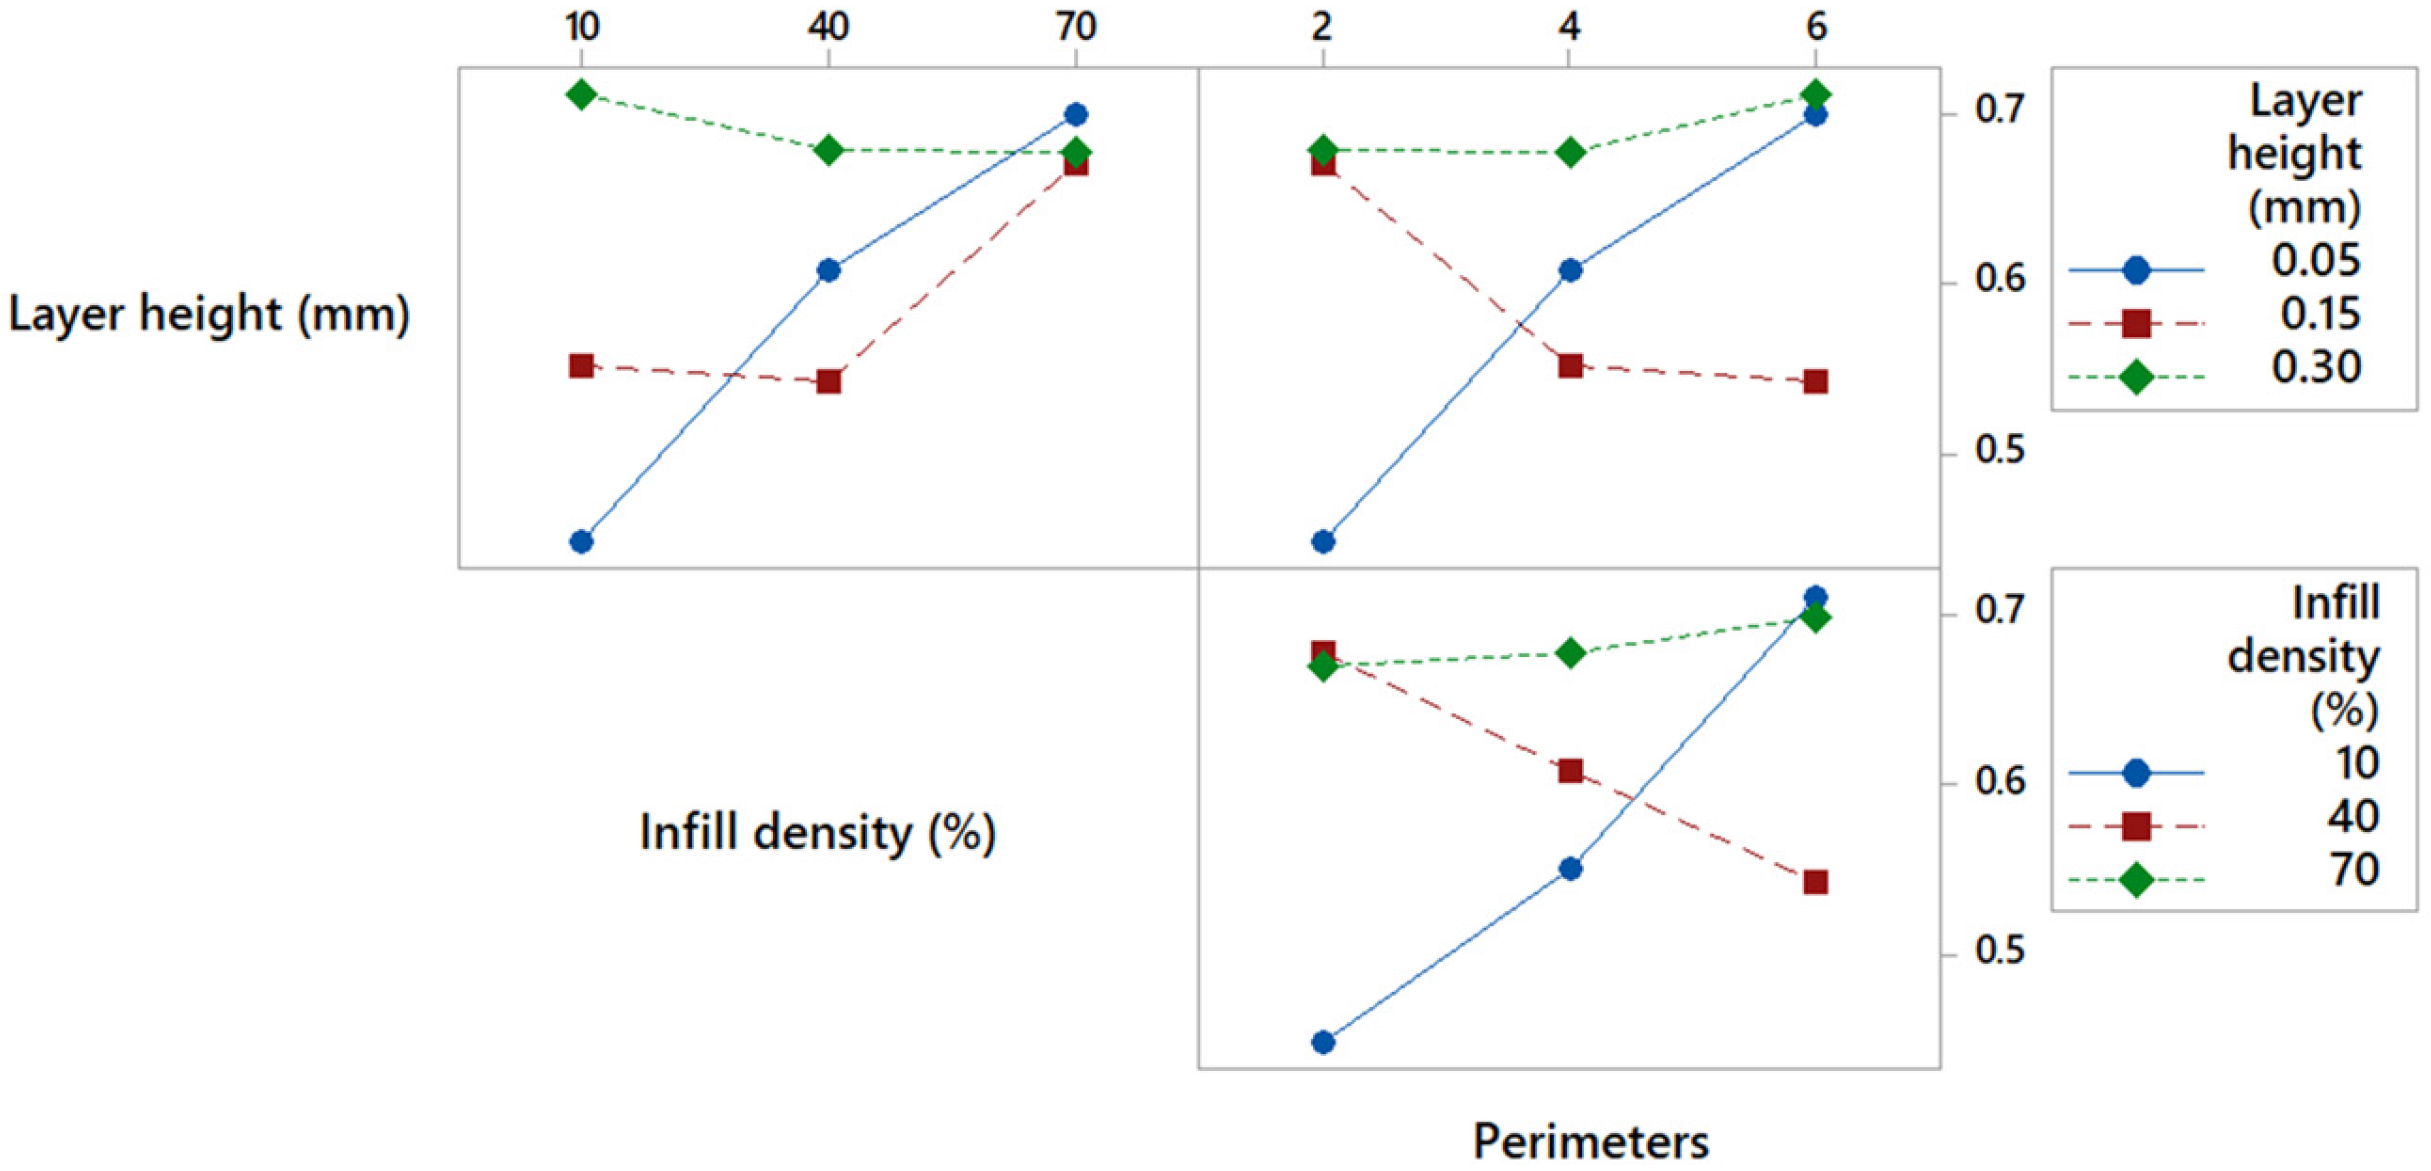
To clarify the influence of the selected process parameters on the resulting Grey Relational Grade (GRG) and to assess their relative contribution, a main effects plot for GRG was generated, as shown in Figure 14. The slopes of the plotted trends indicate that all three investigated parameters have a noticeable effect on the GRG response. Moreover, the main effects plot enables a preliminary identification of the parameter levels associated with the highest mean GRG values, which correspond to the most favourable overall process performance. Based on this analysis, the highest GRG was initially obtained at a layer height of 0.30 mm, an infill density of 70%, and a perimeter count of six, in agreement with the response table presented in Table 6. In addition, Table 6 provides a quantitative evaluation of the relative significance of each parameter, determined from the range between the maximum and minimum mean GRG values. This range analysis reveals that infill density has the strongest influence on the GRG, followed by layer height, while the number of perimeters exhibits the least pronounced effect among the considered factors. However, to more accurately determine the optimal process parameter combination, it is necessary to examine the interaction effects between parameters on the GRG response. These interactions are illustrated in Figure 15. A detailed analysis of the interaction effects lines (especially green and blue) shows that the initially identified optimal settings require revision. In particular, higher GRG values are achieved at a lower infill density of 10%, rather than the previously indicated 70%. Consequently, the refined optimal process parameter levels are defined as follows: layer height of 0.30 mm, infill density of 10%, and number of perimeters equal to six.
Figure 14.
Main effects analysis of process parameters on grey relational grade (GRG).
Table 6.
Response values of grey relational grade (GRG) for different parameter levels.
Figure 15.
Interactions effects analysis of process parameters on grey relational grade (GRG).
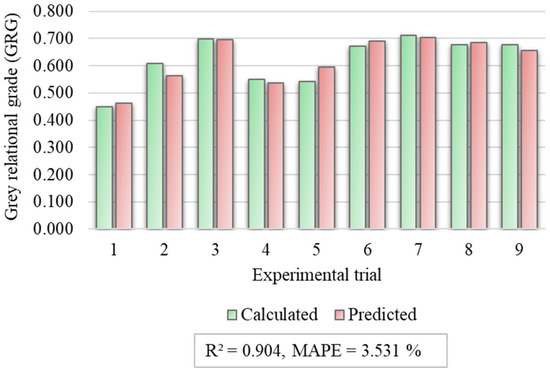
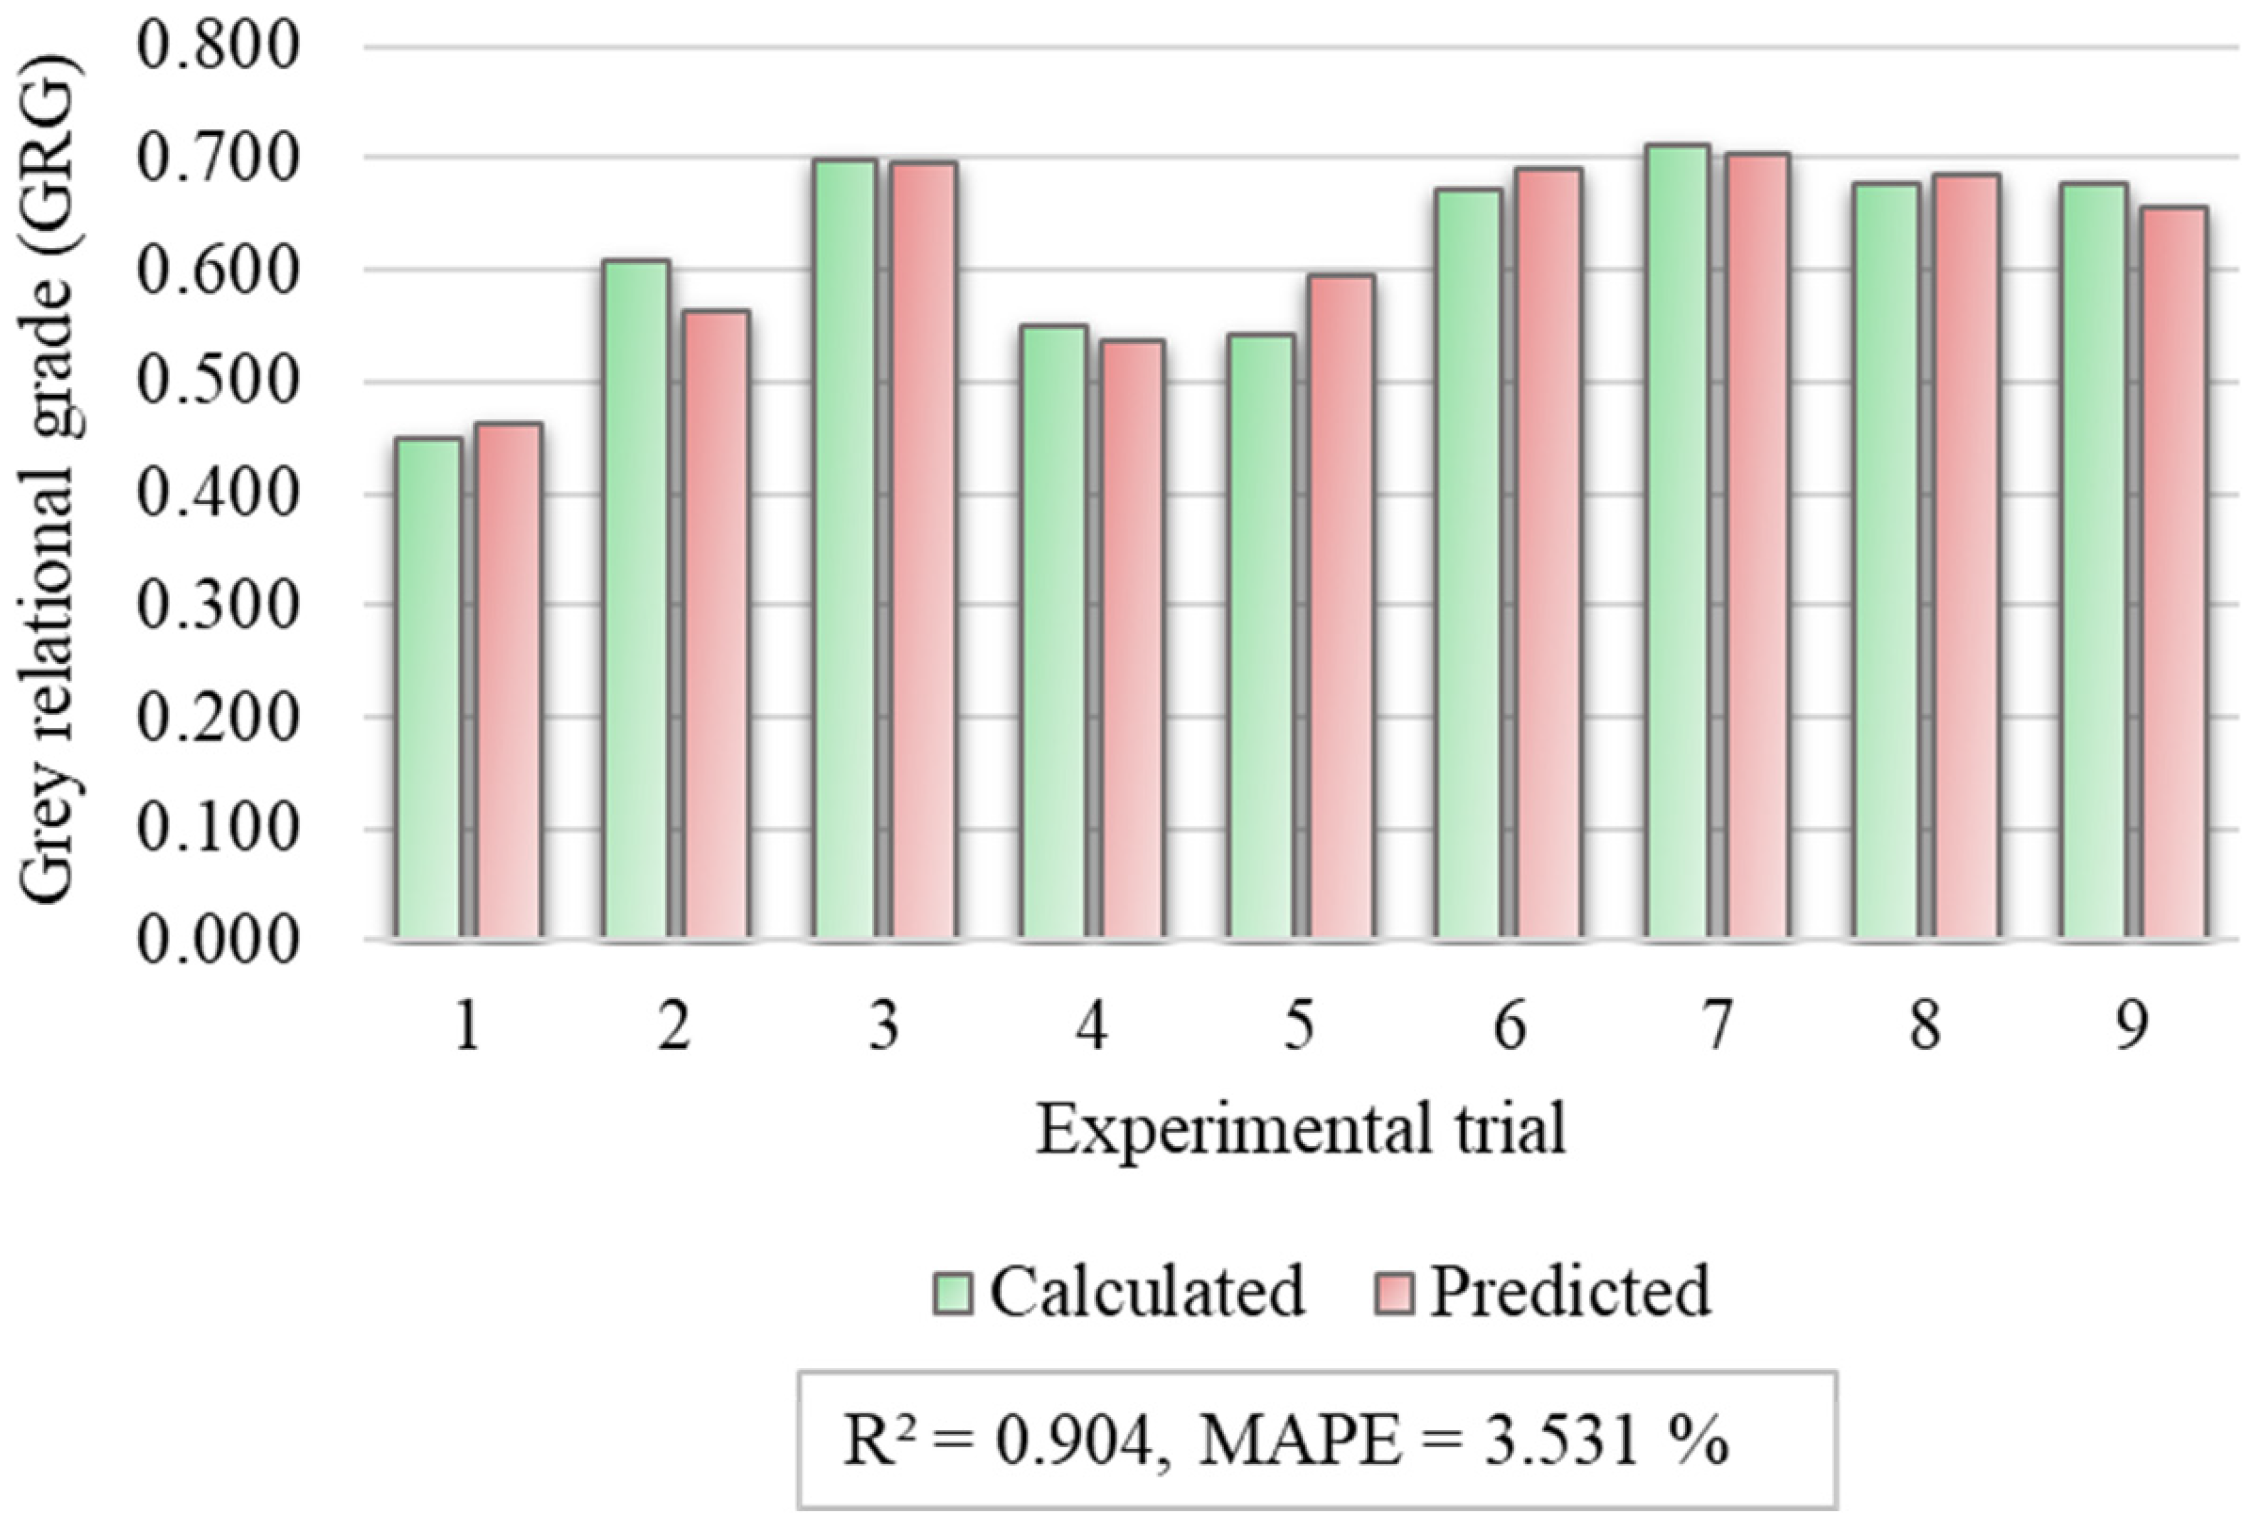
To gain deeper insight into the influence of process parameter interactions on the Grey Relational Grade (GRG) and to outline optimal operating regions of the FDM 3D printing process, a regression-based mathematical model describing the GRG response was developed. The corresponding regression equation is presented in Equation (15). The predictive capability of the proposed model was evaluated by comparing the calculated GRG values reported in Table 5 with those predicted by the regression model. The comparison results, together with the validation metrics (R2 = 0.904 and MAPE = 3.531%), are shown in Figure 16, demonstrating a high level of agreement and confirming that the model is suitable for analysing interaction effects among the process parameters. Furthermore, Figure 16 highlights a set of Pareto-optimal solutions, which represent parameter combinations where no single objective can be further improved without simultaneously deteriorating at least one of the remaining objectives. In the present study, these conflicting objectives include the minimization of filament usage (F), printing time (T), and surface roughness expressed as arithmetic mean height (Sa), alongside the maximization of impact strength (IS). The Pareto front, therefore, defines a compromise region that balances material efficiency, production speed, surface quality, and mechanical performance. Among the identified Pareto-optimal solutions, the highest predicted GRG value corresponds to the seventh experimental trial, characterized by a layer height of 0.30 mm, an infill density of 10%, and a perimeter count of six. This result is fully consistent with the interaction trends observed in Figure 15.
Figure 16.
Calculated versus regression-predicted grey relational grade (GRG).
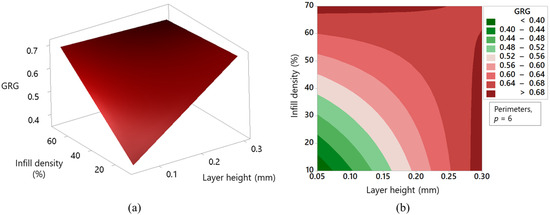
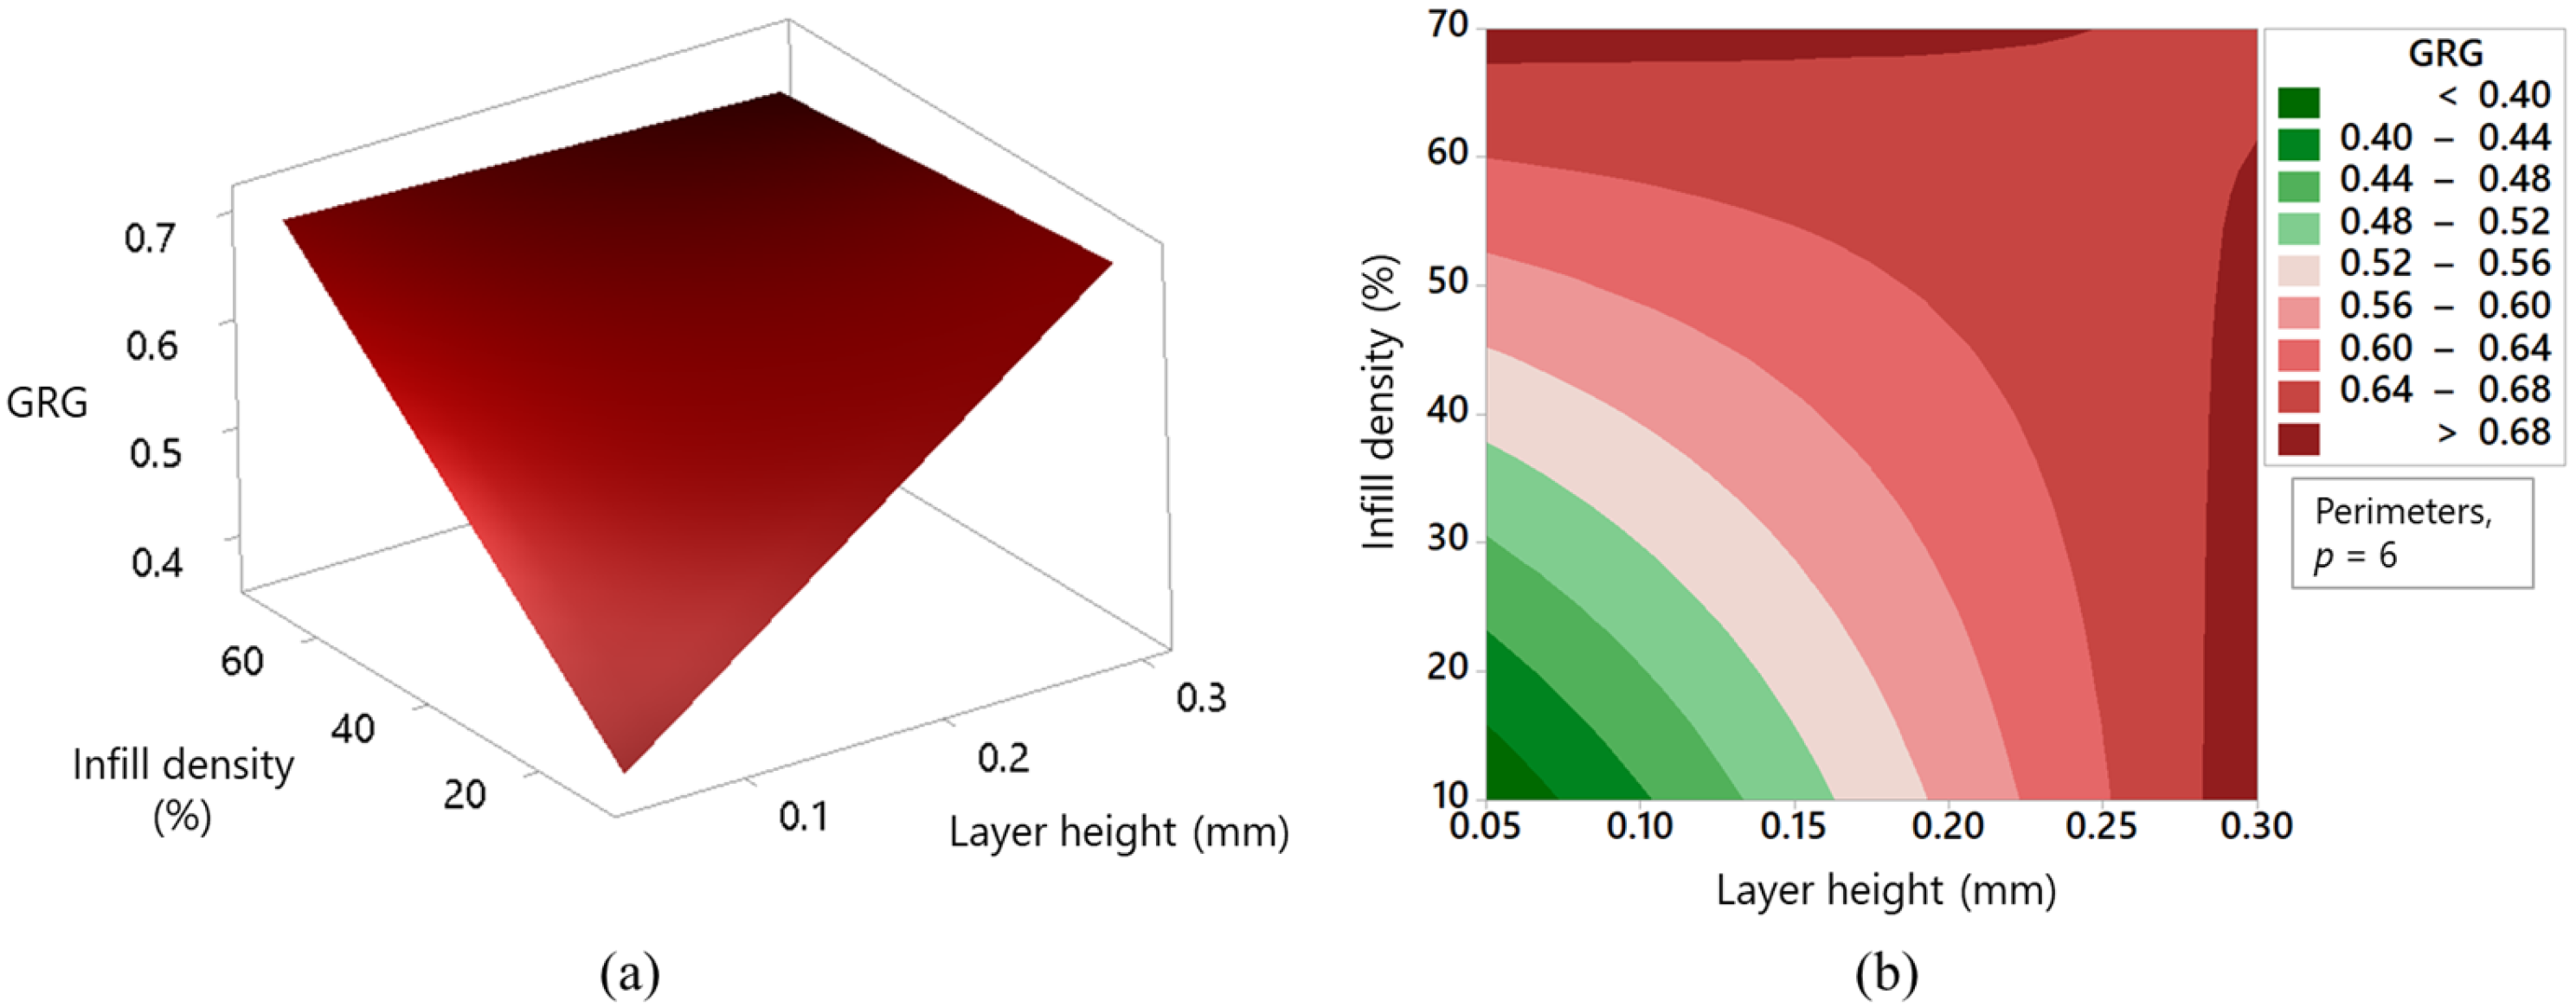
To further visualize the Pareto front and clearly identify optimal processing regions, a three-dimensional response surface plot and corresponding contour maps were generated, as presented in Figure 17. These visualizations focus on the simultaneous variation of layer height and infill density, while the number of perimeters was maintained at a fixed level. This selection is justified by the results of the analysis of variance (ANOVA) performed with a confidence level of 95%, as summarized in Table 7, which revealed that the interaction between layer height and infill density has the most statistically significant influence on the GRG. The dark red regions observed in the contour plot of Figure 17 indicate the optimal FDM processing zones, where printed components achieve the best overall performance by maximizing impact strength while maintaining minimal material consumption, reduced printing time, and low surface roughness.
Figure 17.
Interaction effect of layer height and infill density on grey relational grade: (a) 3D response surface plot, (b) contour map.
Table 7.
ANOVA results for grey relational grade (GRG).
To evaluate the effectiveness of the proposed optimal FDM process parameter configuration, a comparative assessment was performed between the Grey Relational Grade (GRG) values obtained under the initial parameter settings and those corresponding to the optimized conditions. The analysis revealed an increase of approximately 57% in the GRG value, indicating a substantial enhancement in overall process performance achieved through the optimization procedure. To further substantiate these findings, a confirmation experiment was conducted using the identified optimal process parameters. The outcomes of this validation experiment, summarized in Table 8, demonstrate a strong agreement with the predicted results and confirm both the reliability of the multi-objective optimization approach and the effectiveness of the optimized FDM 3D printing parameters.
Table 8.
Validation results of the optimized parameter settings.
4. Conclusions
The objective of this research was to examine how selected FDM 3D printing parameters—namely, layer height, infill density, and the number of perimeters—affect critical process performance indicators, including filament consumption, printing duration, impact strength and surface roughness. The experimental investigation was carried out using biodegradable PLA material and was structured according to a Taguchi L9 orthogonal experimental design.
Based on the obtained results, the principal outcomes of the study are outlined below:
- Regression-based modelling accurately captured the relationships between FDM parameters and the investigated responses, with validated predictions and response surfaces providing clear insight into parameter interactions.
- As expected, filament consumption and printing time are primarily governed by geometric printing parameters. Infill density and the number of perimeters dominate material usage, while layer height is the key factor controlling fabrication time. Although these trends are qualitatively well known and can be estimated by slicer software, the applied modelling framework enabled a quantitative assessment of their relative importance and combined effects within a multi-objective optimization context.
- Impact strength was found to depend on the combined interaction of layer height, infill density, and number of perimeters, reflecting a balance between interlayer bonding, structural stiffness, and deformation capability. Higher impact performance is achieved when a compliant internal structure is paired with sufficient—but not excessive—wall thickness, enabling effective energy dissipation under impact loading.
- Surface roughness is primarily governed by layer height, with secondary contributions from the number of perimeters and infill density. Overall, surface quality is determined by the balance between deposition geometry, wall rigidity, and internal structural support.
- Impact strength was enhanced by the combined effect of increased layer height and reduced surface roughness, indicating a synergistic influence of deposition geometry and surface quality. This combination limits stress concentrations and interlayer weaknesses, enabling more effective energy dissipation under impact loading.
- The combined Taguchi-Grey Relational Analysis approach proved effective for multi-objective optimization of the FDM process, enabling simultaneous reduction of material consumption and printing time while improving impact strength and surface quality. The optimal parameter combination identified was a layer height of 0.30 mm, an infill density of 10%, and six perimeters.
- Analysis of main effects, interactions, and ANOVA of the Grey Relational Grade revealed that infill density, particularly through its interaction with layer height, has the strongest influence on the overall optimization outcome, while other parameters play a comparatively minor role.
- An improvement of nearly 57% in the Grey Relational Grade confirmed the effectiveness and reliability of the proposed multi-objective optimization strategy.
- The proposed optimization framework enables the simultaneous improvement of mechanical performance, surface quality, and process efficiency, supporting more resource-efficient and sustainable FDM manufacturing of PLA components.
- Future research will aim to expand the scope of the present study by incorporating additional process parameters, evaluating a broader range of mechanical and functional performance indicators, and extending the methodology to advanced polymer systems and composite materials used in additive manufacturing. While Charpy impact strength provides a representative measure of toughness, additional mechanical properties were not investigated. Future studies could explore tensile, flexural, and compressive properties to assess potential trade-offs with surface quality and process efficiency.
Author Contributions
Conceptualization, I.P. and N.Č.; methodology, I.P., N.Č., K.A. and J.K.; software, I.P.; validation, I.P., K.A. and J.K.; formal analysis, I.P., J.K. and N.Č.; investigation, I.P., N.Č. and K.A.; resources, I.P. and K.A.; data curation, I.P. and N.Č.; writing—original draft preparation, I.P. and K.A.; writing—review and editing, I.P., N.Č. and K.A.; visualization, I.P., J.K. and N.Č.; supervision, I.P. and N.Č. All authors have read and agreed to the published version of the manuscript.
Funding
This work was supported by the European Union under the NextGenerationEU instrument, through the Recovery and Resilience Mechanism, within the institutional research project AIMTECH 4.5 (IP-UNIST-07), implemented by the Ministry of Science, Education and Youth of the Republic of Croatia.
Institutional Review Board Statement
Not applicable.
Informed Consent Statement
Not applicable.
Data Availability Statement
The data presented in this study are available on request from the corresponding author.
Conflicts of Interest
The authors declare no conflicts of interest.
References
- Godec, D.; Šercer, M. Aditivna Proizvodnja; FSB: Zagreb, Croatia, 2015; 376p. [Google Scholar]
- Topčić, A. Aditivna proizvodnja—Pregled stanja, izazovi i mogućnosti primjene. In Proceedings of the 5th Conference on the Significance of the Development of Technique, Technology, Innovation, Innovation and Information Technologies INN&TECH 2022, Sarajevo, Bosnia and Herzegovina, 16 March 2022. [Google Scholar]
- Alghamdi, S.S.; John, S.; Roy Choudhury, N.; Dutta, N.K. Additive manufacturing of polymer materials: Progress, promise and challenges. Polymers 2021, 13, 753. [Google Scholar] [CrossRef] [Scilit]
- Almehairi, E.H. A Taguchi-Grey Relational Analysis of FDM Printed PLA. Master’s Thesis, Rochester Institute of Technology, Rochester, NY, USA, 28 November 2022. [Google Scholar]
- Alparslan, C.; Bayraktar, Ş.; Gupta, K. A comparative study on mechanical performance of PLA, ABS, and CF materials fabricated by fused deposition modeling. Facta Univ. Ser. Mech. Eng. 2024, 1–18. [Google Scholar] [CrossRef]
- Rasheed, R.; Kandasamy, M.; Raja, V.; Balasubramani, S.; Vijayakumar, M.K.; Mahadevan, R. Experimental investigation on process parameter optimization to enhance tensile strength in FDM—3D printing process with PLA material. In Proceedings of the International Conference on Advancement in Manufacturing Engineering (ICAME 2022), Islamabad, Pakistan, 25 August 2022. [Google Scholar]
- Dey, A.; Eagle, I.N.R.; Yodo, N. A review on filament materials for fused filament fabrication. J. Manuf. Mater. Process. 2021, 5, 69. [Google Scholar] [CrossRef] [Scilit]
- Müller, M.; Jirků, P.; Šleger, V.; Mishra, R.K.; Hromasová, M.; Novotný, J. Effect of infill density in FDM 3D printing on low-cycle stress of bamboo-filled PLA-based material. Polymers 2022, 14, 4930. [Google Scholar] [CrossRef] [Scilit] [PubMed]
- Wang, S.; Ma, Y.; Deng, Z.; Zhang, S.; Cai, J. Effects of fused deposition modeling process parameters on tensile, dynamic mechanical properties of 3D printed polylactic acid materials. Polym. Test. 2020, 86, 106483. [Google Scholar] [CrossRef] [Scilit]
- Milićević, I.; Popović, M.; Dučić, N.; Stepanić, P.; Marinković, D.; Ćojbašić, Ž. Improving the mechanical characteristics of the 3D printing objects using hybrid machine learning approach. Facta Univ. Ser. Mech. Eng. 2022, 1–14. [Google Scholar] [CrossRef] [Scilit]
- Jem, K.J.; Tan, B. The development and challenges of poly (lactic acid) and poly (glycolic acid). Adv. Ind. Eng. Polym. Res. 2020, 3, 60–70. [Google Scholar] [CrossRef] [Scilit]
- Samir, A.; Ashour, F.H.; Hakim, A.A.A.; Bassyouni, M. Recent advances in biodegradable polymers for sustainable applications. npj Mater. Degrad. 2022, 6, 68. [Google Scholar] [CrossRef] [Scilit]
- Bijarimi, M.; Ahmad, S.; Rasid, R. Mechanical, thermal and morphological properties of PLA/PP melt blends. In Proceedings of the International Conference on Agriculture, Chemical and Environmental Sciences (ICACES 2012), Dubai, United Arab Emirates, 6–7 October 2012. [Google Scholar]
- Fico, D.; Rizzo, D.; Casciaro, R.; Corcione, C.E. A review of polymer-based materials for fused filament fabrication (FFF): Focus on sustainability and recycled materials. Polymers 2022, 14, 465. [Google Scholar] [CrossRef] [Scilit]
- Al-Zaidi, A.A.M.A.; Al-Gawhari, F.J.J. Types of polymers using in 3D printing and their applications: A brief review. Eur. J. Theor. Appl. Sci. 2023, 1, 978–985. [Google Scholar] [CrossRef] [Scilit]
- Atakok, G.; Kam, M.; Koc, H.B. Tensile, three-point bending and impact strength of 3D printed parts using PLA and recycled PLA f ilaments: A statistical investigation. J. Mater. Res. Technol. 2022, 18, 1542–1544. [Google Scholar] [CrossRef] [Scilit]
- Sharif, A.; Khan, H.; Bashir, N.; Alam, W. Parametric optimization and evaluating mechanical properties of poly lactic acid proceed by FDM additive manufacturing. J. Mater. Manuf. 2023, 1, 11–20. [Google Scholar] [CrossRef]
- Tunçel, O. Optimization of Charpy Impact Strength of Tough PLA Samples Produced by 3D Printing Using the Taguchi Method. Polymers 2024, 16, 459. [Google Scholar] [CrossRef] [Scilit]
- Tanveer, M.Q.; Haleem, A.; Suhaib, M. Effect of variable infill density on mechanical behaviour of 3-D printed PLA specimen: An experimental investigation. SN Appl. Sci. 2019, 1, 1701. [Google Scholar] [CrossRef] [Scilit]
- Dziewit, P.; Rajkowski, K.; Płatek, P. Effects of Building Orientation and Raster Angle on the Mechanical Properties of Selected Materials Used in FFF Techniques. Materials 2024, 17, 6076. [Google Scholar] [CrossRef] [Scilit] [PubMed]
- Rajpurohit, S.R.; Dave, H.K. Impact strength of 3D printed PLA using open source FFF-based 3D printer. Prog. Aditive Manuf. 2021, 6, 119–131. [Google Scholar] [CrossRef] [Scilit]
- Benwood, C.; Anstey, A.; Andrzejewski, J.; Misra, M.; Mohanty, A. Improving the Impact Strength and Heat Resistance of 3D Printed Models: Structure, Property, and Processing Correlationships during Fused Deposition Modeling (FDM) of Poly(Lactic Acid). ASC Omega 2018, 3, 4400–4411. [Google Scholar] [CrossRef] [Scilit] [PubMed]
- Wang, L.; Gramlich, W.M.; Gardner, D.J. Improving the impact strength of Poly(lactic acid) (PLA) in fused layer modeling (FLM). Polymer 2017, 114, 242–248. [Google Scholar] [CrossRef] [Scilit]
- Zisopol, D.G.; Portoaca, A.I.; Tanase, M. Improving the Impact Resistance through Annealing in PLA 3D Printed Parts. Eng. Technol. Appl. Sci. Res. 2023, 13, 11768–11772. [Google Scholar] [CrossRef] [Scilit]
- Ali, M.U.; Nadeem, A.; Ashfaq, B.; Ullah, S.; Waseem, M.; Aslam, M.A.; Alam, Q.A. Optimizing Impact Toughness in 3D-Printed PLA Structures Using Hilbert Curve and Honeycomb Infill Patterns. Eng. Proc. 2024, 75, 27. [Google Scholar] [CrossRef] [Scilit]
- Dakhil, G.Y.; Salih, R.M.; Hameed, A.M. The Influence of Infill Pattern and Infill Density on the (Tensile, Flexural and Impact) Strength Of 3D Printed Polymers. AIP Conf. Proc. 2022, 2660, 020109. [Google Scholar] [CrossRef] [Scilit]
- Demir, S.; Dönmez, S.; Yayla, P. Optimizing impact resistance of FFF-printed PLA parts: A comprehensive analysis of infill patterns and process parameters. Rapid Prototyp. J. 2026, 32, 180–195. [Google Scholar] [CrossRef] [Scilit]
- Peko, I.; Čatipović, N.; Antunović, K.; Ljumović, P. Multi-Objective Optimization of Fatigue Performance in FDM-Printed PLA Biopolymer Using Grey Relational Analysis. Sustainability 2025, 17, 10902. [Google Scholar] [CrossRef] [Scilit]
- Işik, U.; Demir, H.; Özlü, B. Multi-objective Optimization of Process Parameters for Surface Quality and Geometric Tolerances of AlSi10Mg Samples Produced by Additive Manufacturing Method Using Taguchi-Based Gray Relational Analysis. Arab. J. Sci. Eng. 2025, 50, 9211–9229. [Google Scholar] [CrossRef] [Scilit]
- Siraj, I.; Drégelyi-Kiss, Á. Empirical comparison of FDM additive manufacturing process parameters by application grey relational analysis and multi-linear regression. Int. J. Adv. Manuf. Technol. 2025, 138, 2861–2876. [Google Scholar] [CrossRef] [Scilit]
- Morvayová, A.; Contuzzi, N.; Fabbiano, L.; Casalino, G. Multi-Attribute Decision Making: Parametric Optimization and Modeling of the FDM Manufacturing Process Using PLA/Wood Biocomposites. Materials 2024, 17, 924. [Google Scholar] [CrossRef] [Scilit]
- Luis-Pérez, C.J.; Buj-Corral, I. Multi-objective optimization of surface roughness, dimensional errors and density in FFF 3D-printed glass fiber-reinforced PP parts via adaptive neuro-fuzzy inference modelling. Rapid Prototyp. J. 2025, 31, 1905–1932. [Google Scholar] [CrossRef] [Scilit]
- ISO 148-1:2016; Metallic Materials—Charpy Pendulum Impact Test—Part 1: Test Method. International Organization for Standardization: Geneva, Switzerland, 2016.
- Peko, I.; Marić, D.; Nedić, B.; Samardžić, I. Modeling and Optimization of Cut Quality Responses in Plasma Jet Cutting of Aluminium Alloy EN AW-5083. Materials 2021, 14, 5559. [Google Scholar] [CrossRef] [Scilit]
- Vrsalović, L.; Čatipović, N.; Gudić, S.; Kožuh, S. Beneficial effect of Cu content and austempering parameters on the hardness and corrosion properties of austempered ductile iron (ADI). Facta Univ. Ser. Mech. Eng. 2025, 23, 33–47. [Google Scholar] [CrossRef] [Scilit]
- Čatipović, N.; Peko, I.; Grgić, K.; Periša, K. Multi Response Modelling and Optimisation of Copper Content and Heat Treatment Parameters of ADI Alloys by Combined Regression Grey-Fuzzy Approach. Metals 2024, 14, 735. [Google Scholar] [CrossRef] [Scilit]
- Peko, I.; Crnokić, B.; Čulić-Viskota, J.; Matić, T. Hybrid Grey–Fuzzy Approach for Optimizing Circular Quality Responses in Plasma Jet Manufacturing of Aluminum Alloy. Appl. Sci. 2025, 15, 7447. [Google Scholar] [CrossRef] [Scilit]

Disclaimer/Publisher’s Note: The statements, opinions and data contained in all publications are solely those of the individual author(s) and contributor(s) and not of MDPI and/or the editor(s). MDPI and/or the editor(s) disclaim responsibility for any injury to people or property resulting from any ideas, methods, instructions or products referred to in the content. |
© 2026 by the authors. Licensee MDPI, Basel, Switzerland. This article is an open access article distributed under the terms and conditions of the Creative Commons Attribution (CC BY) license.