


Abstract
In high-fill load reduction cut-and-cover tunnels (HFLRCCTs), the vertical earth pressure (VEP) after load reduction cannot be accurately determined using conventional methods. This study employs discrete element method (DEM) simulation to analyze the load reduction mechanism of expanded polystyrene (EPS). A mechanical analysis model is established, from which a VEP calculation method is derived. Then, based on the concept of relative differential settlement (RDS), a simplified VEP calculation method is proposed as a more practical alternative. The results indicate that the average VEP above the cut-and-cover tunnel (CCT) is smaller when the cross-section is rectangular, and the optimal load reduction effect occurs at a slope angle of 60–70°. Quantitatively, the inclusion of EPS reduces the VEP by 60–70%. Based on the DEM results, the RDS in the top section of the EPS layer (δ0) exhibits a strong linear correlation with the upward additional VEP (p2) (R2 > 0.99). The optimal load reduction effect occurs at H/h = 9/2. Thicker EPS layers enhance load reduction (increasing the thickness from 0.10 m to 0.15 m improves the load reduction rate by 8%), while a lower EPS density (12–20 kg/m3) provides better performance. The proposed RDS-based formula predicts the VEP with errors of 0.43–4.58% compared with cases reported in the literature (max error 1.10 kPa, RMSE = 0.51 kPa, MAPE = 4.18%). Compared with the elasticity-based method, the RDS-based method is simpler and more intuitive for engineering practice. However, this study has some limitations: the use of the two-dimensional DEM is not applicable to the case of tunnel portals and has not been verified in practical engineering.
1. Introduction
The application of high-fill cut-and-cover tunnels (HFCCTs) in northwestern China has effectively met the land utilization requirements. However, the large amount of backfilling within cut-and-cover tunnels (CCTs) during construction leads to significantly high earth pressure, posing potential safety risks. Therefore, research is needed to explore the load reduction mechanism of HFLRCCTs, derive an earth pressure calculation method applicable to these structures, and quantitatively assess the load reduction performance under various schemes.
The concept of earth pressure load reduction for high-fill structures originated with Marston [1], who first proposed imperfect trench installation (ITI). This method involves placing a compressible layer on top of the conduit to reduce the vertical earth pressure. Since then, this method has been widely adopted in both engineering practice and scientific research, with numerous scholars who have conducted extensive studies on the selection of load reduction materials [2,3], laying methods, and the optimization of the load reduction effect [4,5,6,7,8], achieving remarkable outcomes.
Moreover, a variety of equations and methods have been proposed for calculating earth pressure on buried high-fill structures. These methods primarily rely on approaches such as Marston–Spangler (M–S) theory [1,9,10,11]; originally developed for buried conduits, it estimates earth pressure based on the relative settlement between the interior and exterior soil prisms. The soil column method simplifies the representation of backfill above the structure as a rigid column, neglecting shear transfer to adjacent soil, and the elasticity theory method [12,13,14] treats soil as a continuous elastic medium, solving stress distributions using analytical or semi-analytical formulations. However, unlike traditional high-fill structures, the crossing span of HFCCTs is significantly larger, and the structural safety requirements are more stringent. Existing earth pressure calculation theories are not entirely applicable to HFCCTs. Previous studies have focused extensively on the force conditions, load reduction schemes, and structural forms of HFCCTs [15,16,17,18,19,20,21], among other topics. Some scholars have also investigated the calculation of the vertical earth pressure (VEP) in HFCCTs, proposing relevant formulas. However, the calculation process is overly complex, and the required parameters are difficult to obtain, making it impractical for engineering applications [4,15]. As shown in Table 1, the authors of [4] conducted DEM simulations on HFCCTs with EPS and geogrid but did not propose a simplified analytical method for vertical earth pressure (VEP) calculation; the present study, on the other hand, establishes an explicit RDS-based formula. The authors of [15] derived a VEP calculation method based on elasticity theory for HFCCTs, but its procedure is complicated and requires parameters that are not readily available in practice, the present study aims to overcome this limitation by proposing a simpler RDS-based approach. Existing research indicates that the excessive VEP above the CCT is primarily caused by the relative differential settlement (RDS) between the interior and exterior soil prisms above the CCT [22], but it only considers the RDS in the top section of the cut-and-cover tunnel (CCT) and ignores the upward additional VEP induced by the RDS in the top section of the expanded polystyrene (EPS) board. Specifically, the following research gaps remain: the quantitative relationship between δ0 and the upward additional VEP (p2) has not been established; existing RDS-based methods omit the upward VEP component induced by EPS compression; the effects of EPS thickness and density on the RDS–VEP relationship have not been incorporated into a simplified calculation method.
Table 1.
Comparison of the proposed method with previous studies.
The objectives and novelty of this study are threefold. First, to quantify how RDS influences VEP using DEM, revealing the load reduction mechanism of EPS in HFLRCCTs, and investigating the influence of key factors (section type, slope angle, groove–width ratio). Second, to evaluate the practicality of the elasticity-based analytical model by deriving a VEP calculation method based on elasticity theory, serving as a reference to demonstrate the complexity of traditional methods. Third, to validate the accuracy of the proposed RDS-based empirical formula against DEM results and literature cases. This formula incorporates both the downward additional VEP (p1) induced by δ and the upward additional VEP (p2) induced by δ0, along with correction coefficients for EPS thickness (Et) and density (Ed).
To further investigate the load reduction mechanism of HFLRCCTs and its effect on the VEP on top of CCTs, this study employs the discrete element method (DEM), and the analysis reveals the load reduction mechanism. Furthermore, this study examines the changes in the VEP and relative differential settlement (RDS) between the interior and exterior soil prisms under various load reduction conditions, as well as the intrinsic correlation between them. On this basis, the calculation method of the load reduction rate of HFLRCCTs based on RDS is obtained; further, the influencing factors are studied, and the obtained formula is modified. The results are compared with those from theoretical derivation to analyze the advantages and limitations of each approach. Finally, the accuracy of the calculation method is verified against previous case studies.
2. Establishment of the Discrete Element Model for HFLRCCT
Combined theoretical analysis and numerical simulation were adopted to investigate the VEP of HFCCTs. Given the discrete and heterogeneous nature of soil particles, particle flow code (PFC2D) was employed for numerical analysis. However, due to the intrinsic limitations of PFC2D, macroscopic parameters cannot be directly prescribed into the program. Consequently, appropriate microscopic parameters must be determined to ensure the accuracy and reliability of the simulation outcomes.
2.1. Microscopic Parameter Calibration
2.1.1. Microscopic Parameter Calibration of Soil
The soil parameters from [15] were adopted for the numerical analysis in this study, the basic physical parameters are summarized in Table 2, while the mechanical parameters of soil are presented in Table 3. To account for the cohesive forces between soil particles, the linear contact bond model was employed to simulate the ball–ball contacts. The linear contact model was utilized to simulate ball–wall contacts.
Table 2.
Basic physical properties of the soil [15].
Table 3.
Mechanical parameters of the soil [15].
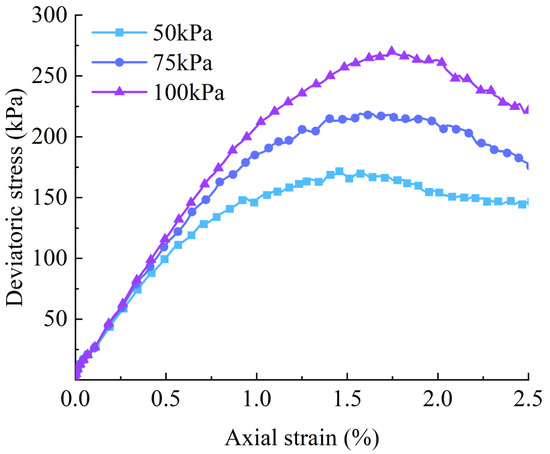
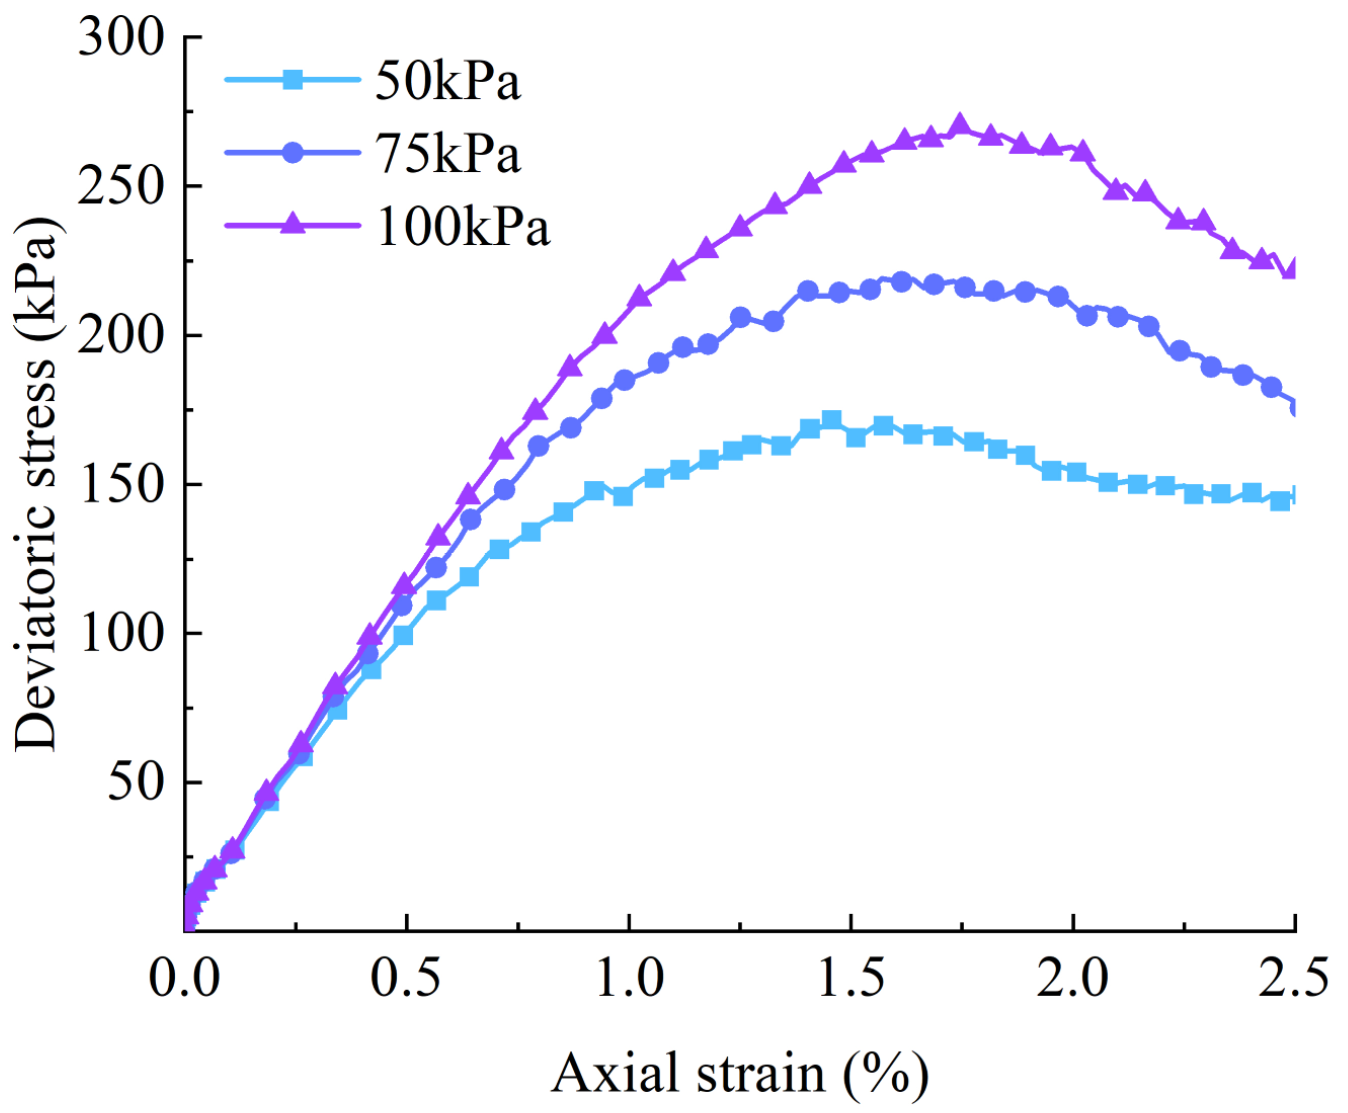
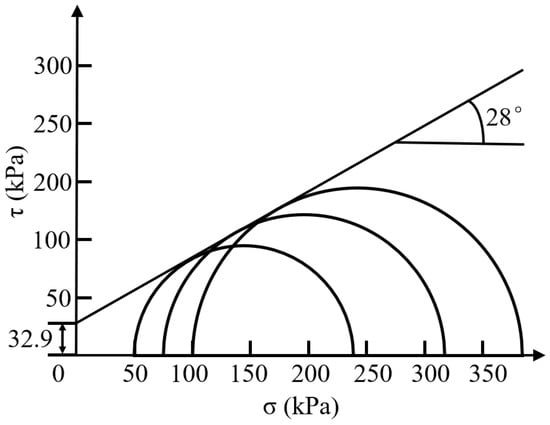
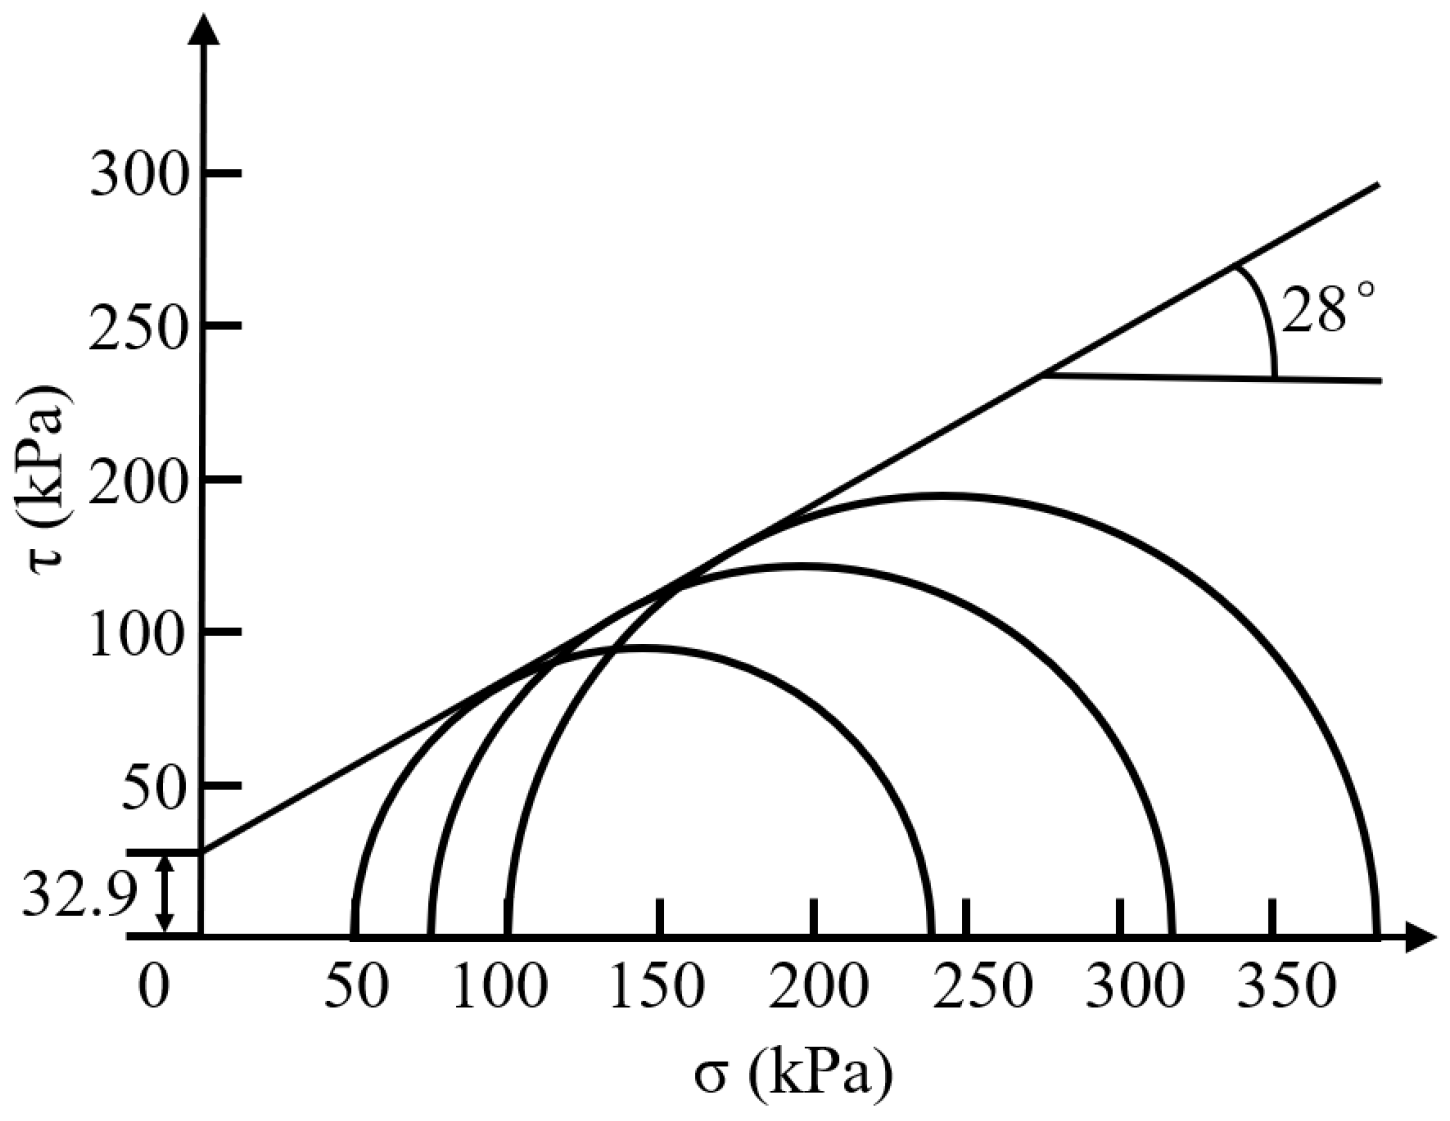
A biaxial compression test model was constructed to calibrate the soil strength parameters—specifically, the internal friction angle and cohesion—according to the Mohr–Coulomb failure criterion. The boundary walls were first specified, and the test specimens were subsequently created. The particle assembly was then brought to equilibrium and homogenized through successive calculation cycles. The consolidation of the specimens was performed using the built-in servo-control functionality of PFC2D, after which axial loading was imposed. Once consolidation was complete, the servo-control constraints on the upper and lower boundary walls were released, and a constant wall velocity was prescribed to maintain uniform axial deformation throughout the loading phase. Axial strains and their corresponding axial stresses were monitored continuously via the history command. The simulation procedure was carried out in an iterative manner, with each microscopic parameter being refined through a trial-and-error process until the numerical results exhibited satisfactory agreement with the experimental data. The built-in PFC command “ball distribute” was utilized to generate soil specimens with specified porosity and particle size distribution. A fixed random seed of 10,001 was employed for particle generation, and local damping with a coefficient of 0.7 was applied to ensure reproducibility. Since particles were generated randomly within the test container, significant initial overlap and non-uniform stress distribution occurred among the particles. Therefore, after the initial particle assembly was generated, a linear contact model and its associated microscopic parameters were typically applied first. Additionally, to ensure that the generated specimen was uniform and dense, and to minimize the influence of wall friction on interparticle contact forces, the wall friction coefficient was set to zero. Subsequently, the internal unbalanced forces within the particles were dissipated through a series of calculation cycles. Once the ratio of unbalanced forces reached the program’s default value (1 × 10⁻⁵), the calculation automatically stopped, and the initial specimen was generated. Normal stiffness was adjusted to match the initial slope of the stress–strain curve; the friction coefficient was adjusted to match the peak deviatoric stress; bond strength was adjusted to match the post-peak behavior and cohesion. This sequence was repeated until all criteria were satisfied. The microscopic parameters of the soil were finally obtained and are presented in Table 4. Contact stiffness and stiffness ratio control the macro-scale elastic modulus and Poisson’s ratio, respectively; the friction coefficient governs the internal friction angle; and bond strength provides macro-scale cohesion. Deviatoric stress–strain relationships corresponding to confining pressures of 50 kPa, 75 kPa, and 100 kPa were derived from the biaxial compression simulations, as illustrated in Figure 1. In addition, from these results, we constructed Mohr stress circles (Figure 2), from which the internal friction angle and cohesion associated with the numerical model were determined. The calibrated values align closely with the experimental data presented in Table 3, exhibiting a cohesion discrepancy of 5.75% and a friction angle deviation of merely 0.85%. This close correspondence indicates that the calibrated microscopic parameters are capable of accurately reproducing the macroscopic mechanical response of the soil.
Table 4.
Microscopic parameters of soil and wall.
Figure 1.
Biaxial deviatoric stress–strain curve.
Figure 2.
Mohr stress circles from the biaxial compression simulation results.
2.1.2. Microscopic Parameter Calibration of EPS
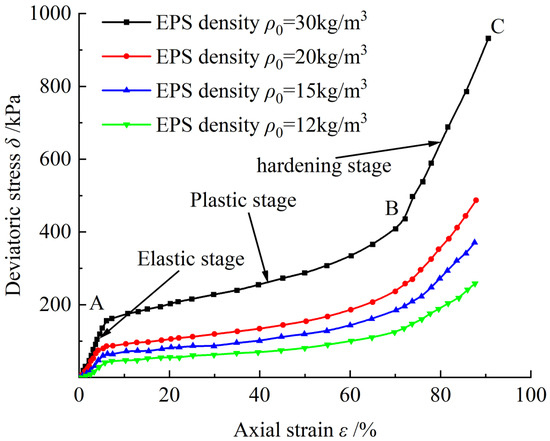
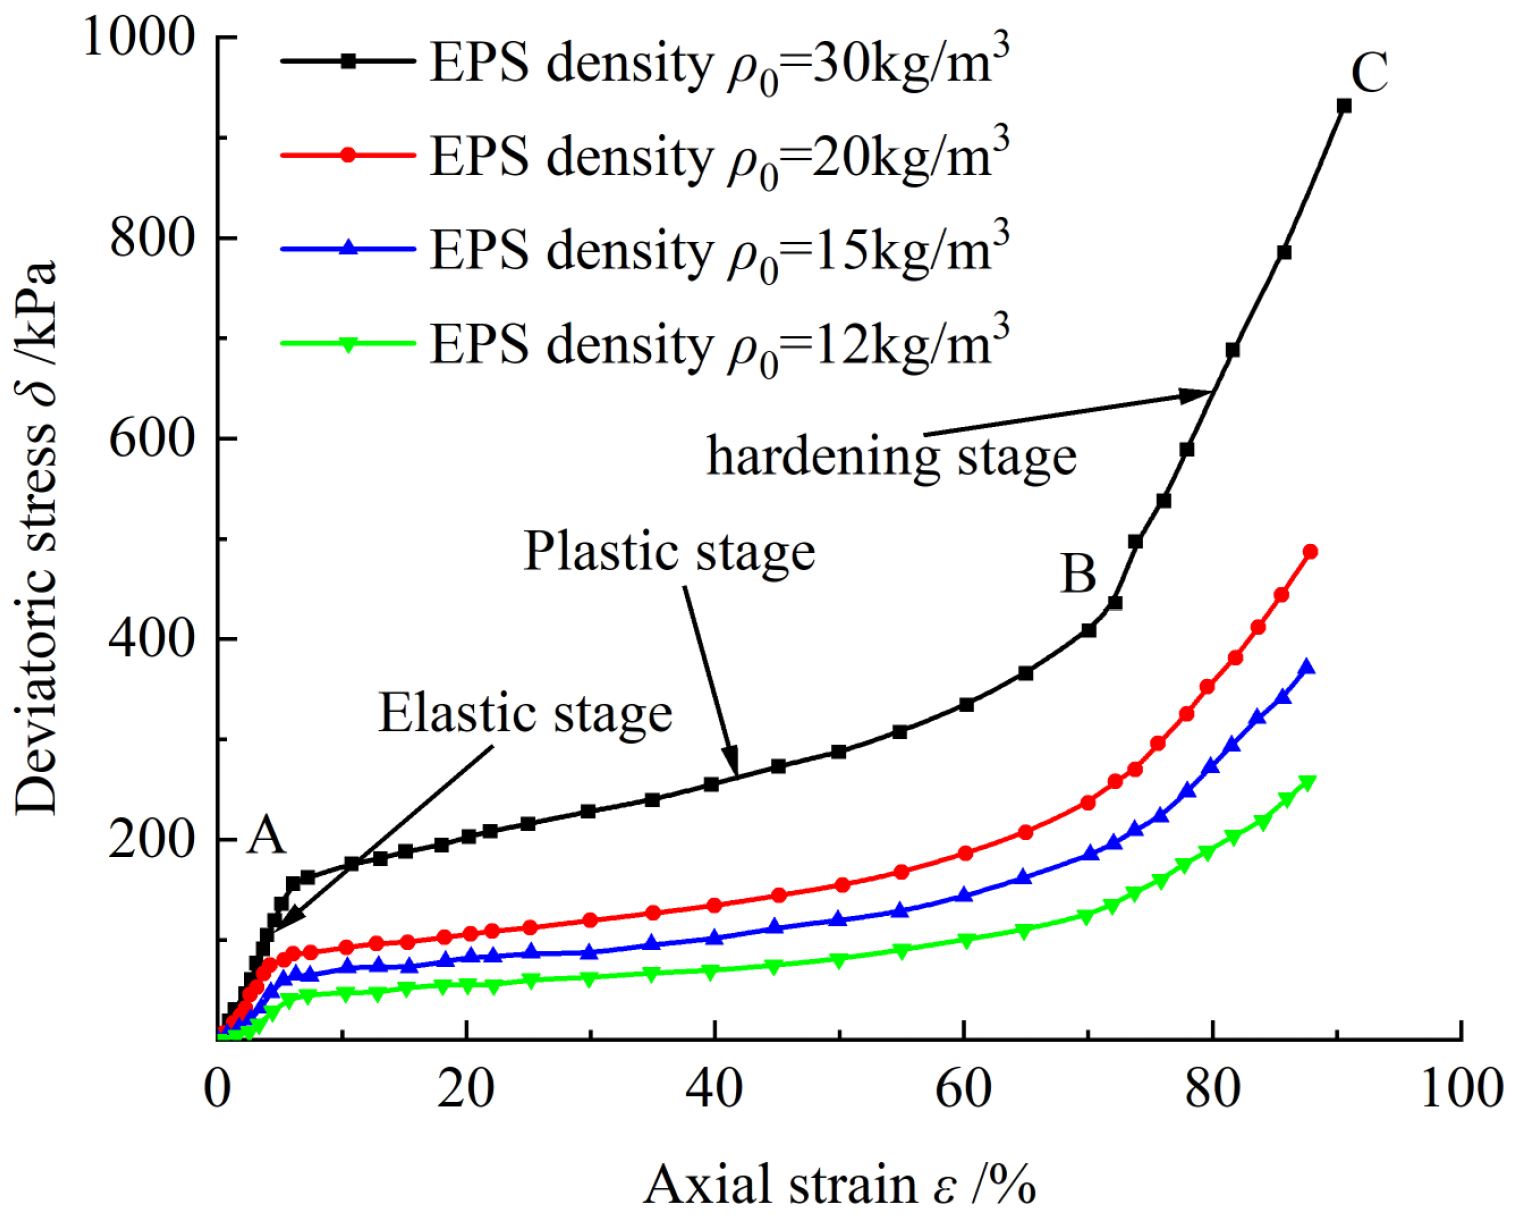
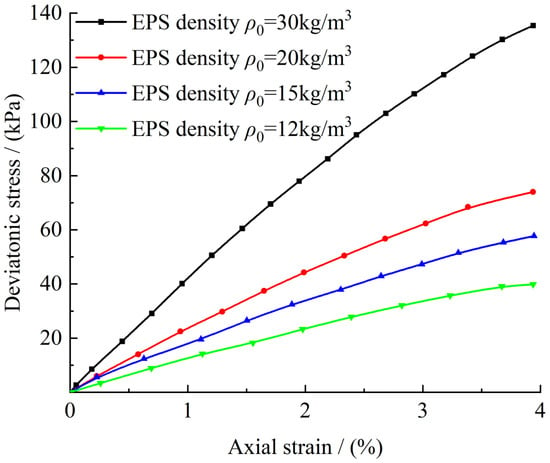
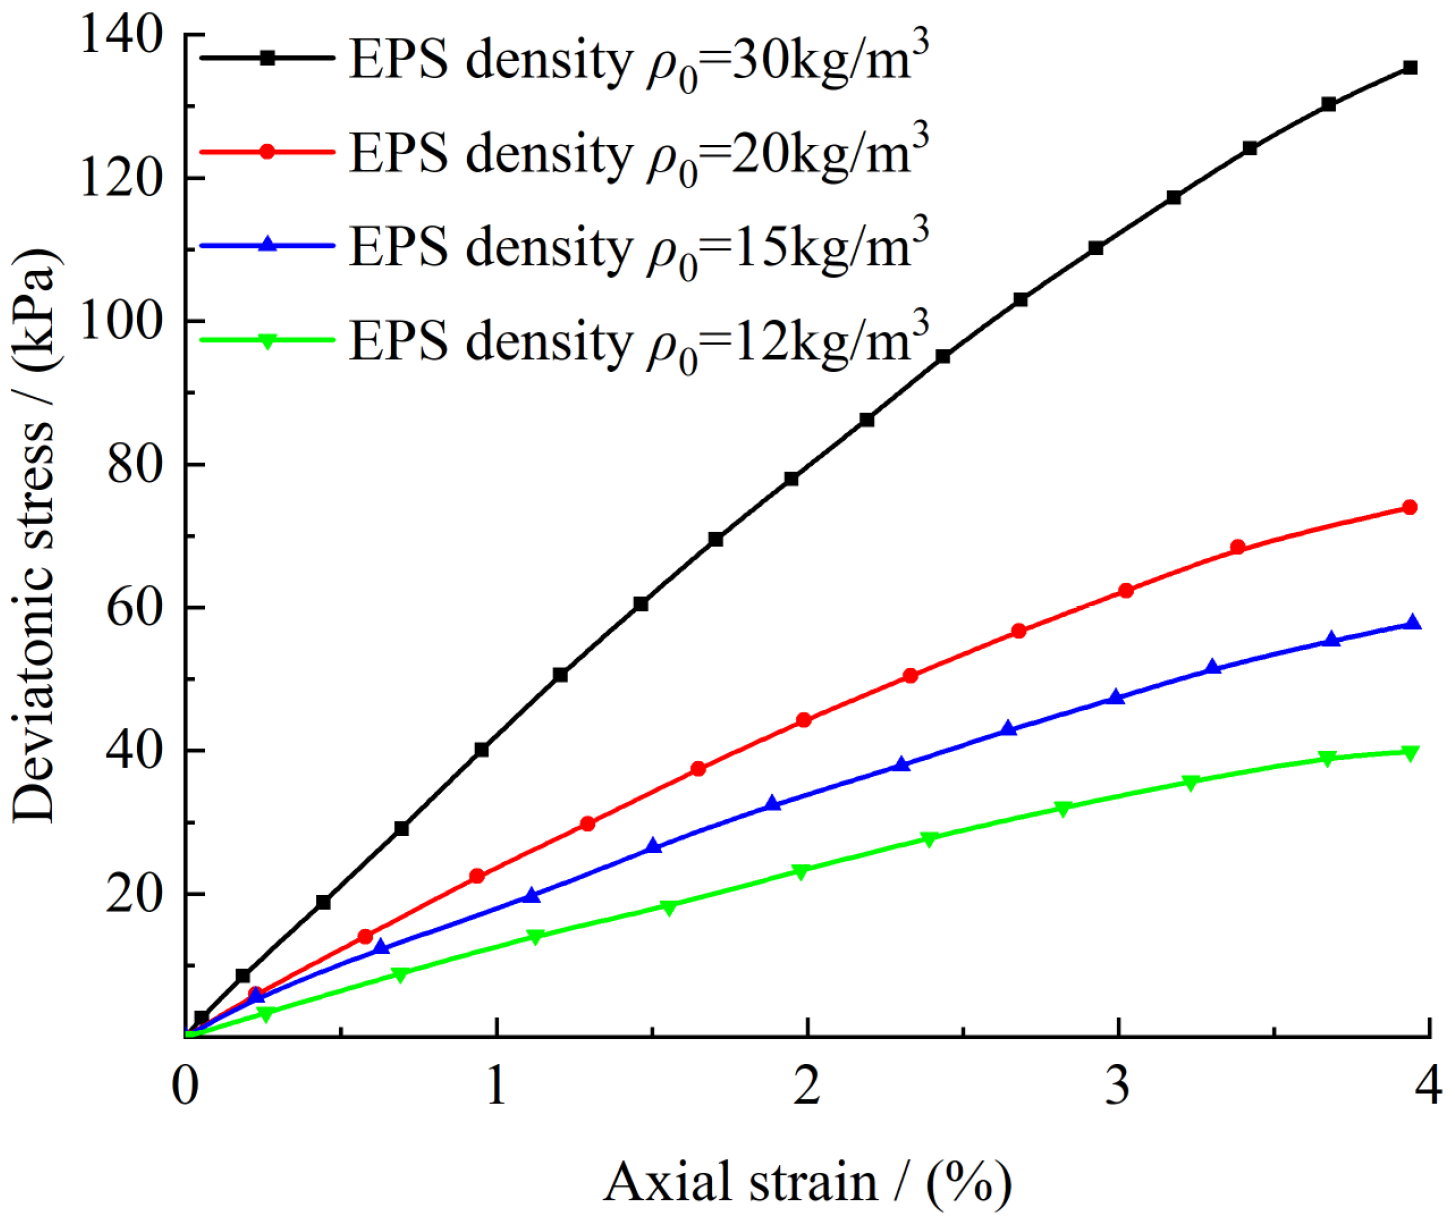
Placing a compressible layer above CCTs is a common load reduction measure. Compared with compacted soil, EPS exhibits lower stiffness and thus provides more effective load reduction performance [17]. In this study, EPS was selected as the load reduction material for HFCCTs; consequently, calibration of its microscopic parameters was required. The stress–strain curves obtained from uniaxial compression tests on EPS are shown in Figure 3 [23], and the calibrated curve is shown in Figure 4. According to the literature [24], the maximum elastic strain of EPS can reach approximately 4%, and the stress corresponding to a strain of 5% is generally adopted as the compressive strength in engineering practice. In the present study, EPS with a density of 20 kg/m3 was taken as a representative example, and its stress–strain behavior within 5% strain was used to calibrate its microscopic parameters.
Figure 3.
Uniaxial compressive stress–strain curve of EPS [23].
Figure 4.
EPS uniaxial compression simulation results (strain ≤ 5%).
A linear contact model was adopted for EPS, and its microscopic parameters were determined by establishing a numerical uniaxial compression test. The calibration process is analogous to that employed for the soil parameters. However, it should be noted that for EPS subjected to axial loading, the left and right walls must be fixed to achieve true uniaxial loading conditions. The resulting deviatoric stress–strain curve is summarized in Figure 4. The microscopic parameters of EPS are summarized in Table 5.
Table 5.
Microscopic parameters of EPS.
2.2. Model Establishment
Since many discrete element models (DEM) need to be established and the modeling process of each model is similar, the laboratory test in [15] is used as an example to establish the discrete element analysis model.
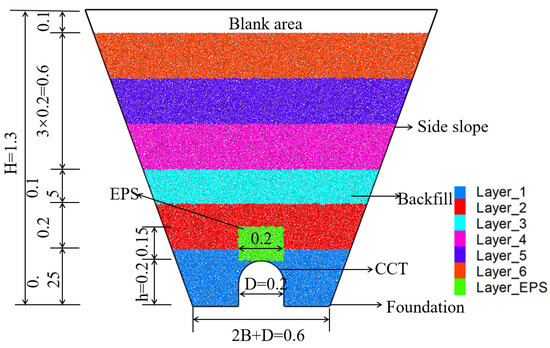
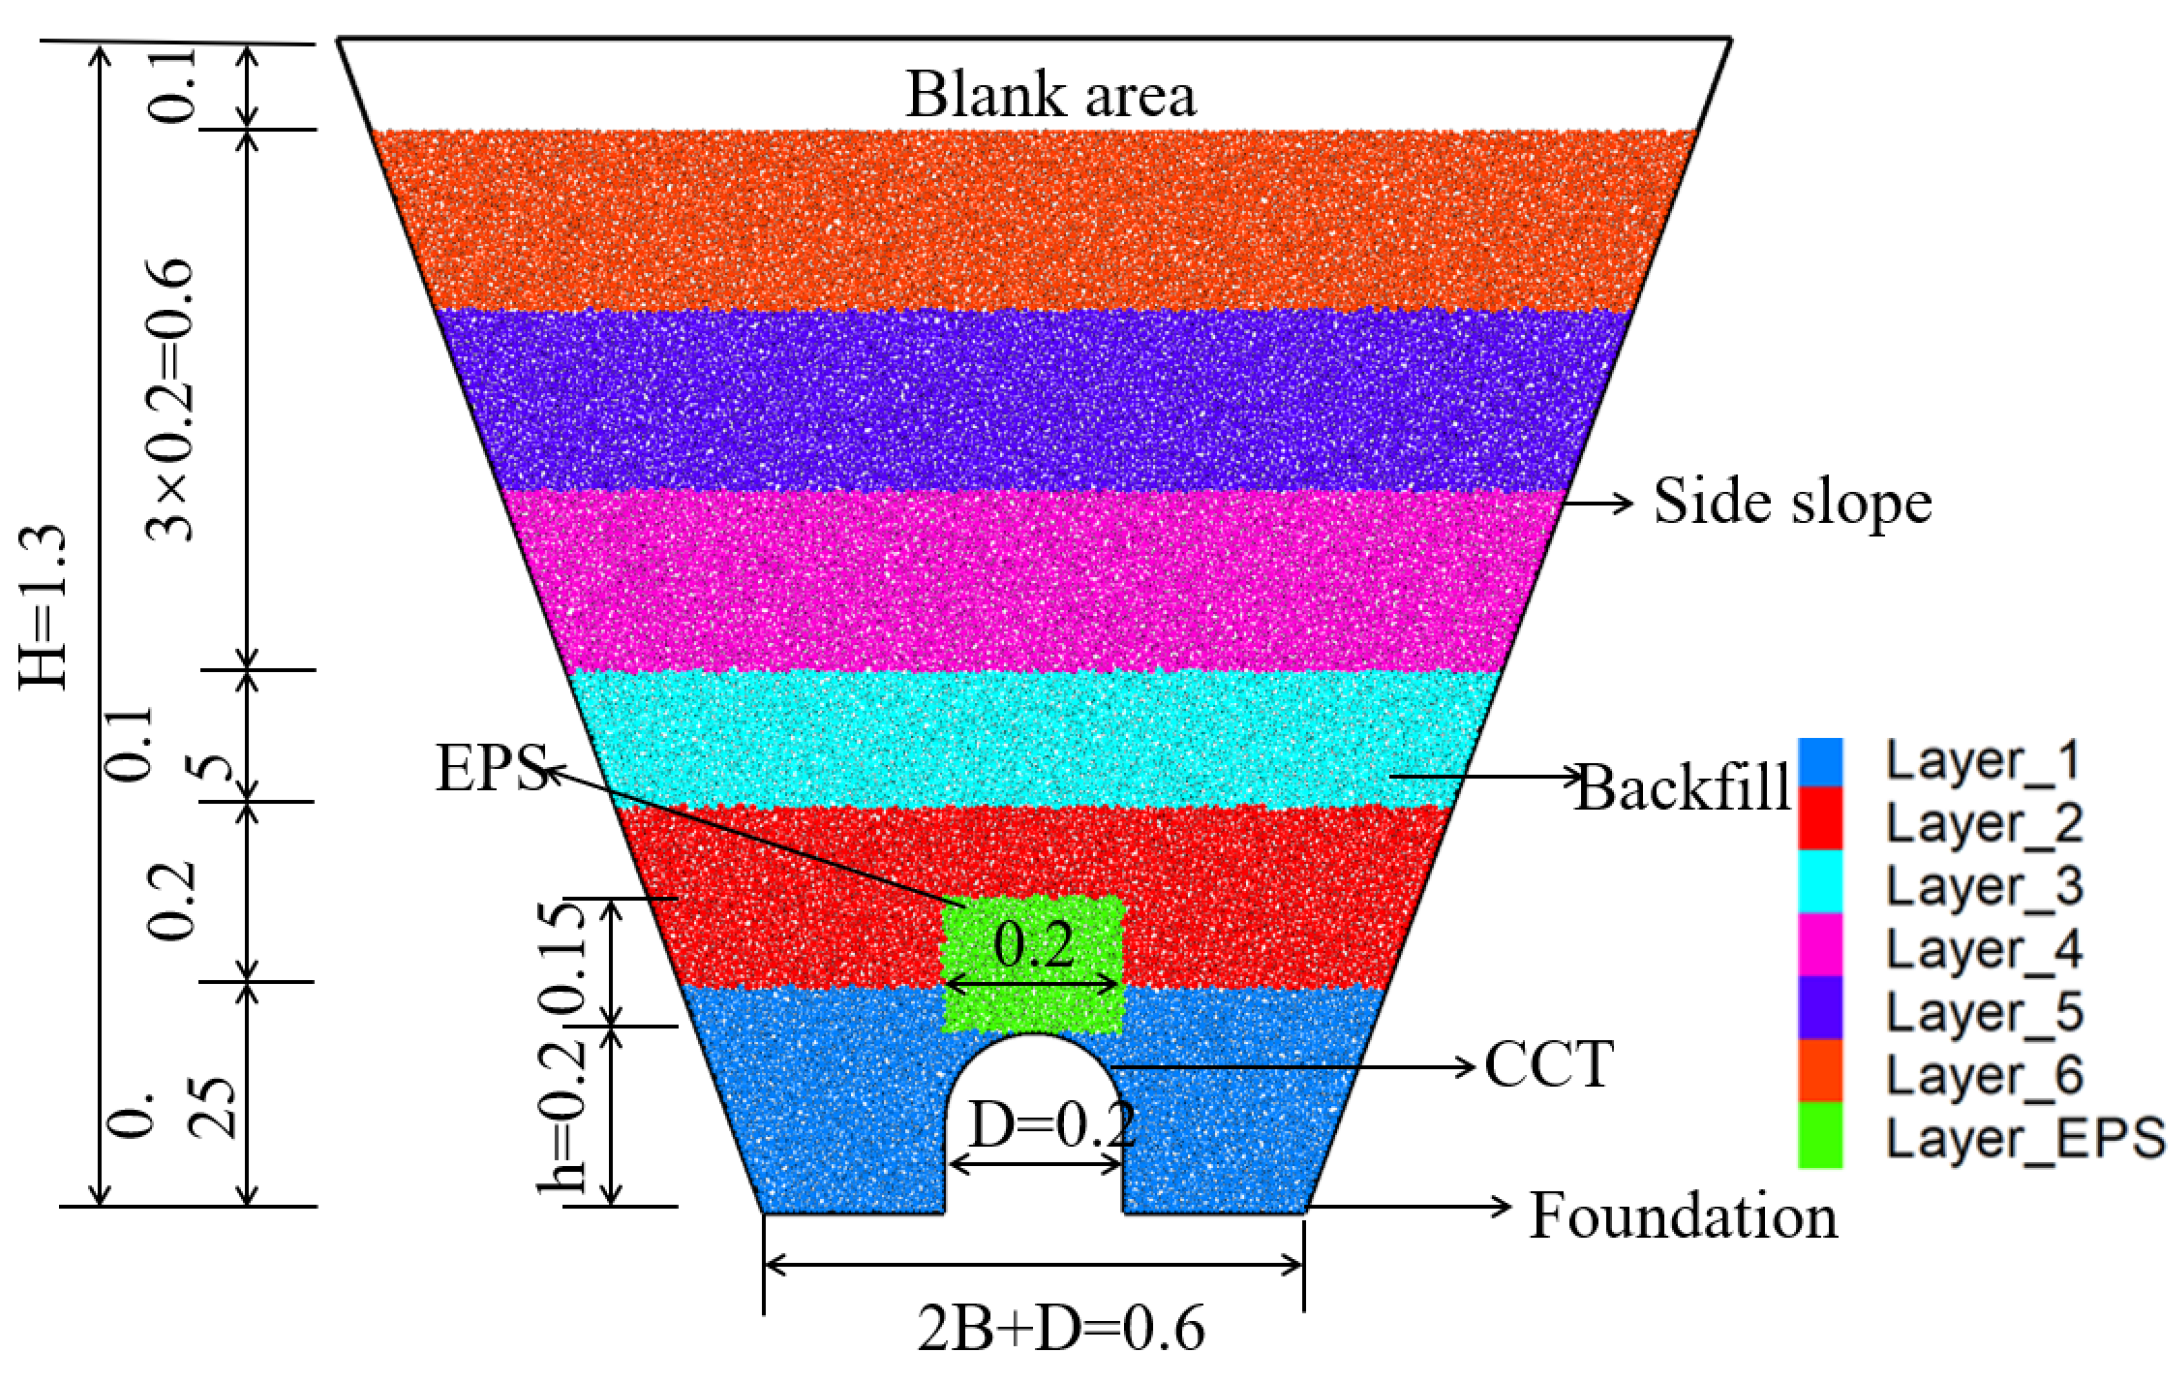
A discrete element model was developed using PFC2D to simulate an HFLRCCT. The model geometry followed a 1:25 scale, with an arch-shaped CCT of height and width h = D = 0.2 m, placed centrally within a groove of width B = 0.6 m. The side slopes had an angle θ = 70°, and the backfill height above the CCT was 1.0 m. A 0.1 m void was reserved above the CCT for EPS placement. Rigid walls with a zero-friction coefficient were used to represent the slope boundaries and foundation. The foundation wall was fixed to simulate an incompressible base. A local damping value of 0.7 was applied to facilitate convergence. Convergence was achieved when the ratio of average unbalanced force to average contact force falls below 1 × 10⁻⁵, and the maximum unbalanced force was below 1 × 100. Backfill particles were generated layer by layer using the improved multi-layer compaction method (IMCM) [25], which entails generating loose particles at 20% porosity, compacting them to 15% porosity via wall displacement, and removing the compaction wall. This sequence was repeated until the model box was fully filled. EPS was introduced by first creating a rectangular wall zone at the intended location, deleting the particles within, and then generating new particles using the radius expansion method. After reaching equilibrium, the temporary wall was removed, gravity was applied, and contact parameters were assigned. Figure 5 shows the final DEM with EPS load reduction.
Figure 5.
Discrete elemental model of HFLRCCTs (unit: m).
3. Load Reduction Mechanism of HFLRCCTs
Laying loose material on top of a CCT is one of the most common load reduction measures. To reveal the functional relationship between RDS and VEP more clearly, they were varied by altering the backfill height above the CCT. The following assumptions were made:
(1) VEP refers to the average VEP on top of the CCT.
(2) RDS is defined as the maximum RDS generated between the interior and exterior soil prisms. HFLRCCTs produce two RDS values.
One is the RDS between the interior and exterior soil prisms in the top section of the CCT, which has a positive value and produces downward additional VEP.
The other is the RDS between the interior and exterior soil prisms in the top section of the EPS layer, which has a negative value and produces upward additional VEP.
(3) Exterior soil prisms farther from the CCT have less influence on the interior soil prisms. Therefore, the settlement within 1.0D from the interior soil prisms was considered, and the average value within that range was used for the settlement of the exterior soil prisms [26].
3.1. Measuring Points and Working Conditions
3.1.1. Measuring Points
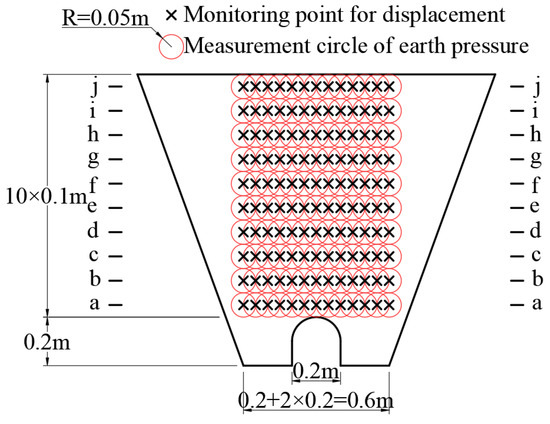
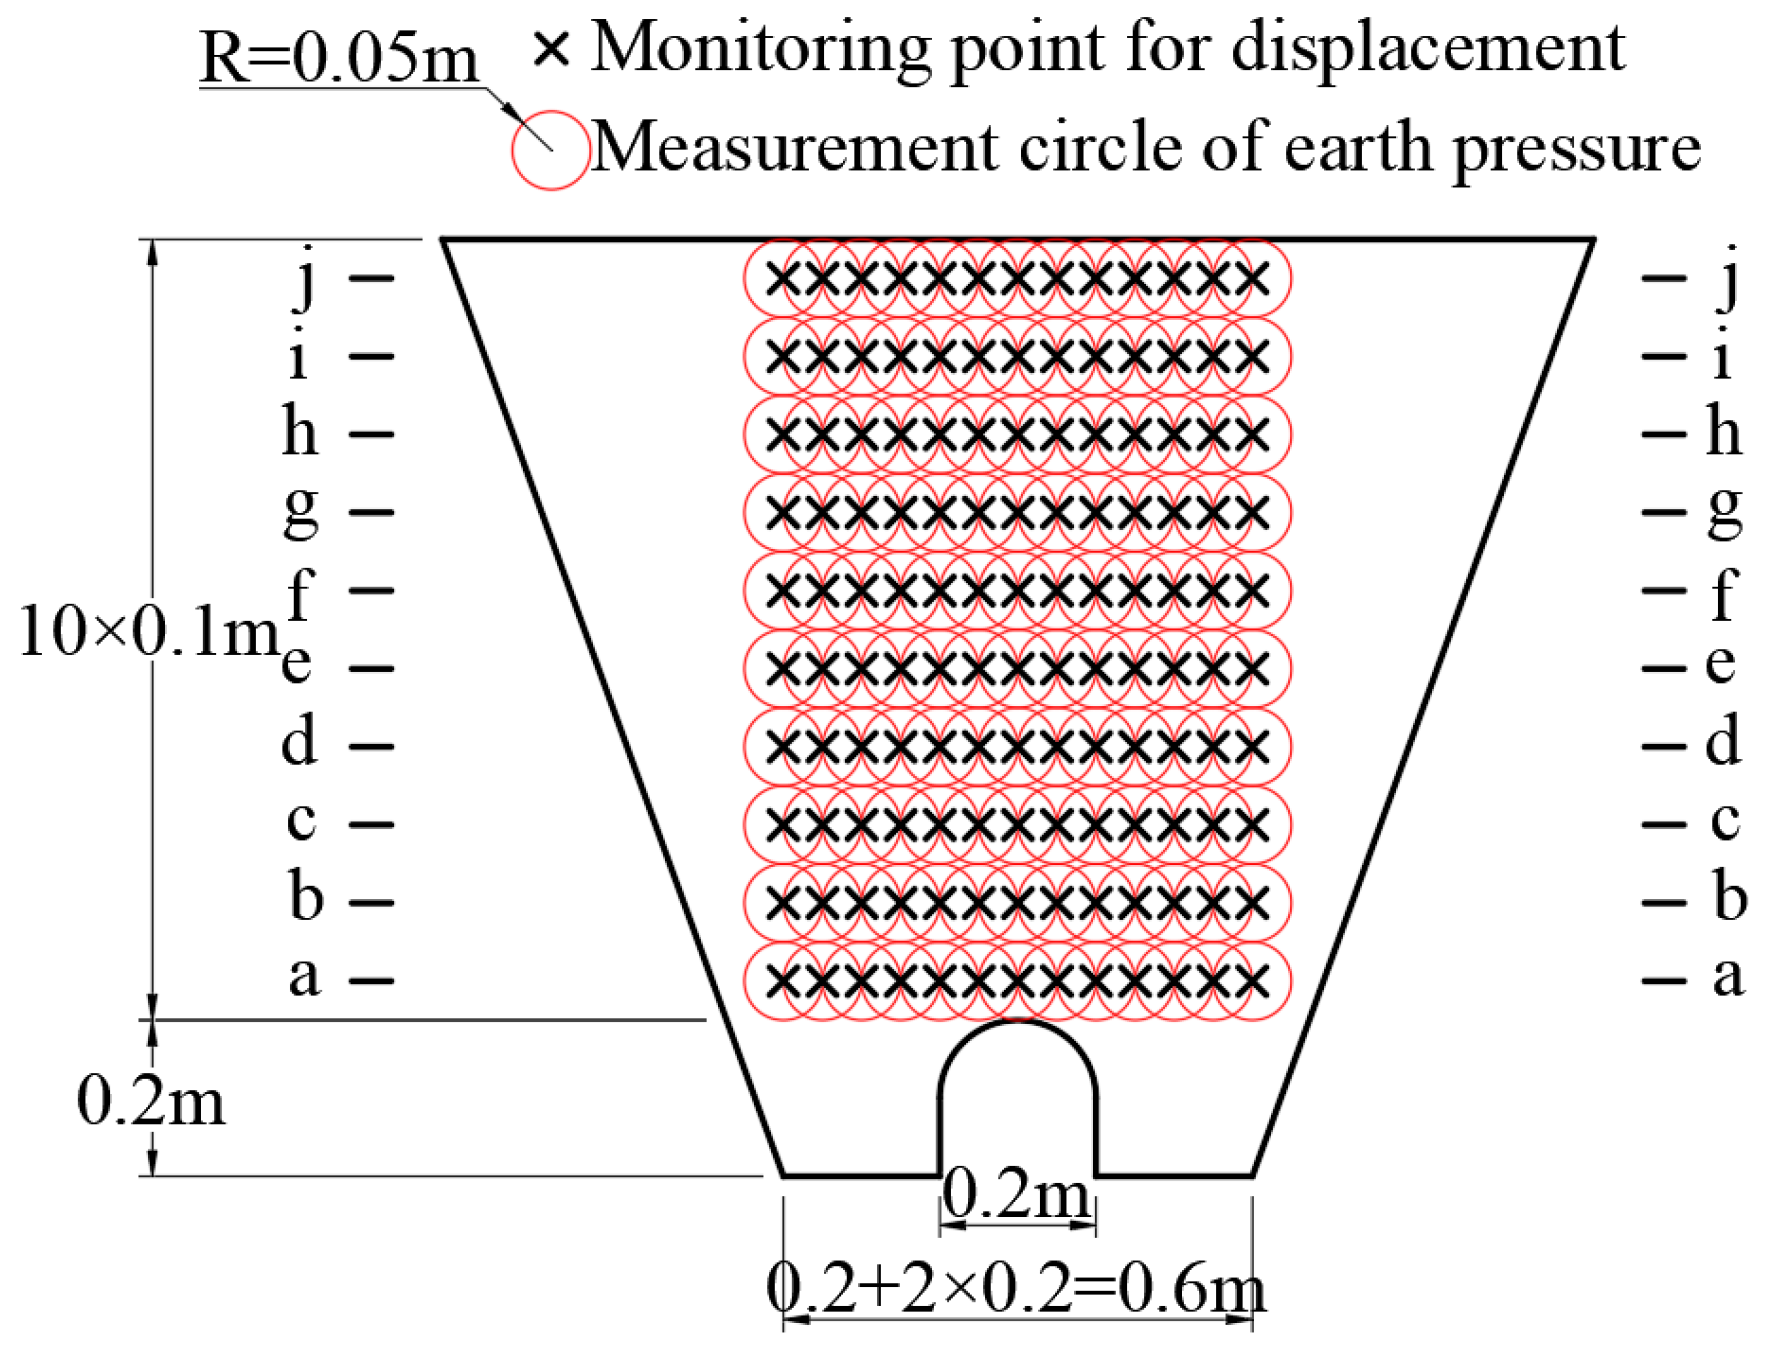
To study the load reduction mechanism of HFLRCCTs, numerical analyses of HFCCTs under different conditions were conducted to extract the VEP and settlement. The VEP measurement circle and the displacement monitoring point of the particles are shown in Figure 6, there the former is represented by a black circle, and the settlement is represented by a red fork. To ensure the accuracy of the measurement results, the radius of the VEP measurement circle was set to 10 times the maximum particle radius [27], following the standard practice recommended by Itasca. This radius ensures that the measurement circle contains a statistically sufficient number of particles (typically 30–50 particles) to obtain representative averages of vertical earth pressure, while remaining small enough to capture local spatial variations.
Figure 6.
Arrangement of measurement points.
3.1.2. Working Conditions
We studied the transfer mechanism of the VEP in HFLRCCTs under the influence of various factors, i.e., section type, slope angle, and groove–width ratios [19,22]. The load reduction scheme was kept constant, with a 0.2 m × 0.15 m EPS layer 20 kg/m3 in density being arranged on top of the CCT (Figure 5). Accordingly, the following working conditions (Table 6) were designed to analyze the VEP and settlement of the HFLRCCT, and elucidate the VEP transfer mechanism. A controlled variable approach was adopted to isolate the influence of each factor.
Table 6.
Working conditions.
3.2. Vertical Earth Pressure Transfer Mechanism of HFLRCCTs
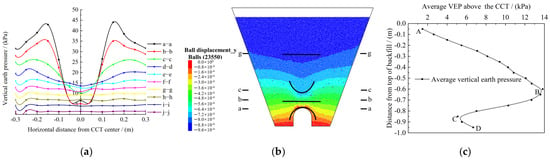
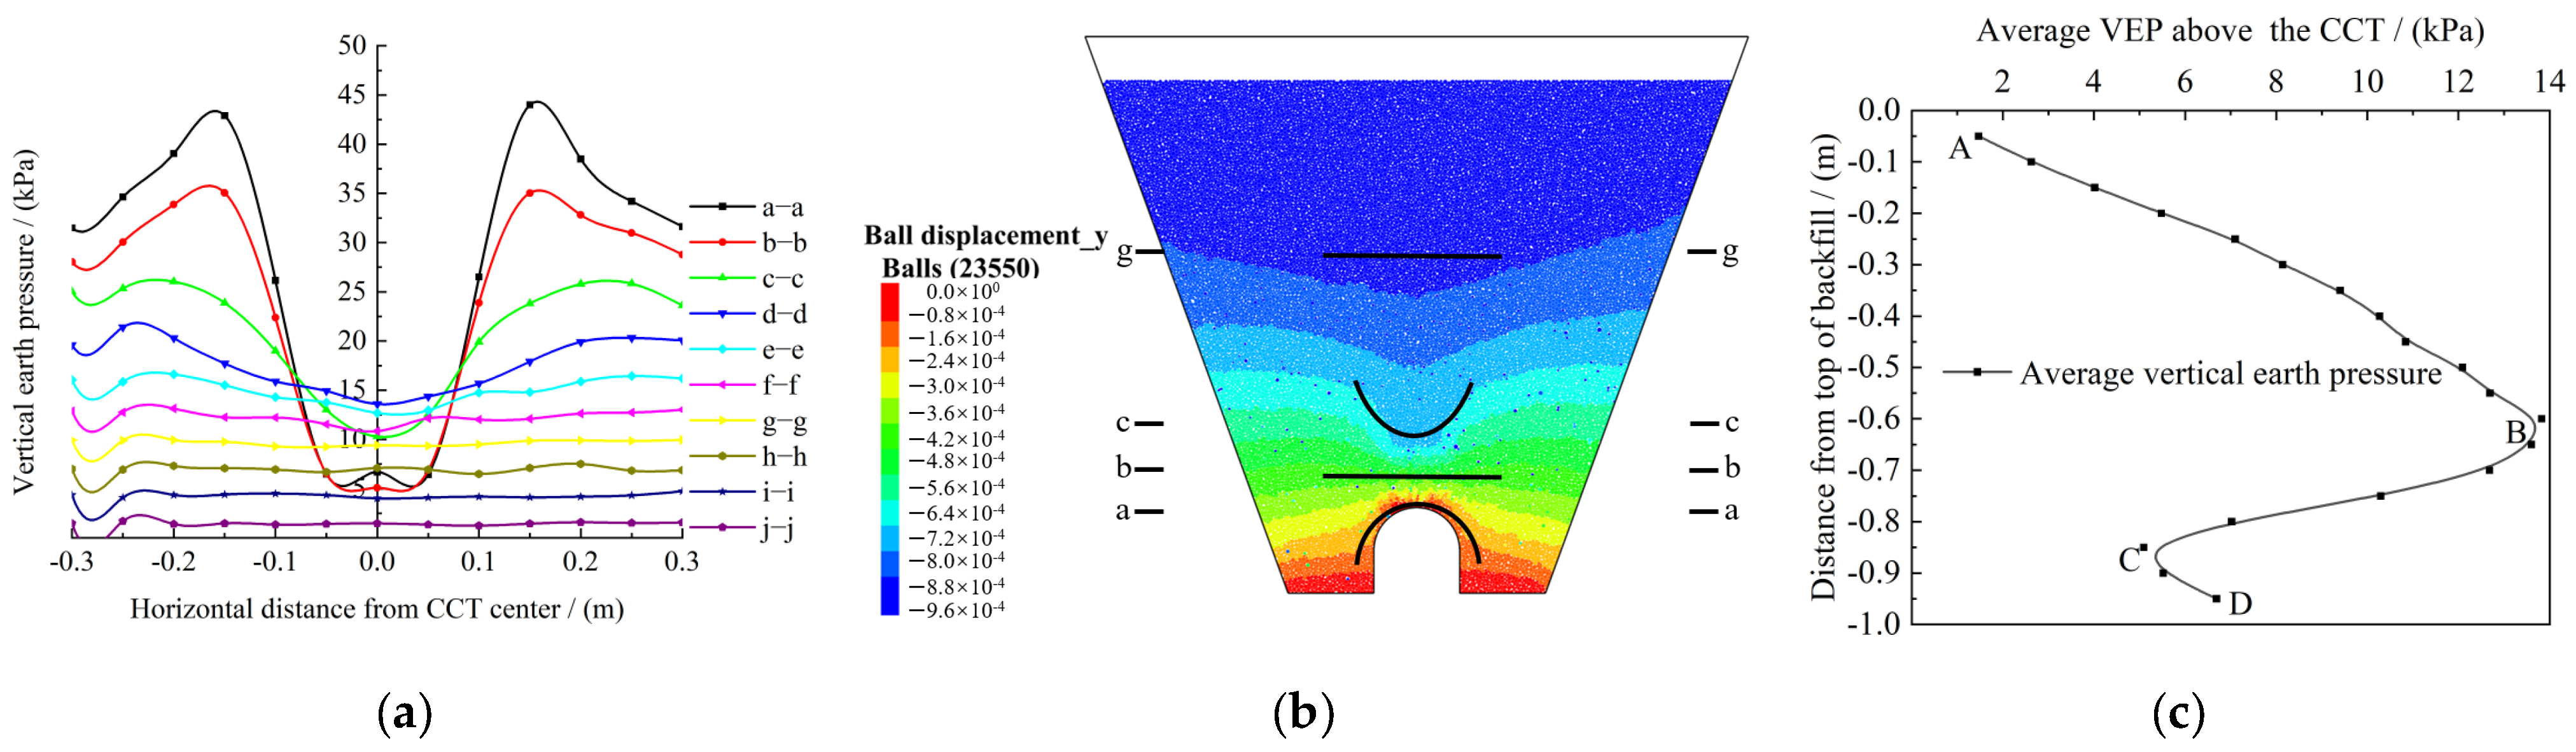
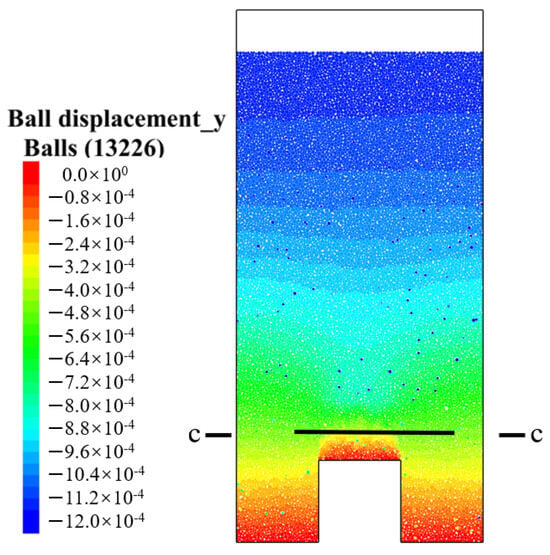
Using case ST1 as an example, the VEP at different backfill heights was extracted to analyze the load transfer mechanism when EPS is used for load reduction in HFLRCCTs (Figure 7).
Figure 7.
Analysis of the load reduction mechanism: (a) distribution of VEP; (b) vertical displacement cloud map; (c) variation in average VEP above the CCT with backfill height.
As shown in Figure 7a, the VEP on top of the CCT in the a–a section is significantly lower than the surrounding VEP. This is because the difference in stiffness between the EPS layer and the surrounding soil causes the soil column directly above the CCT to settle more than the exterior soil prisms, leading the latter to exert upward additional VEP.
As shown in Figure 7c, the transfer of VEP when using EPS for load reduction can be divided into three stages:
- (1)
- A–B Stage (Top of Backfill to g–g Section): The settlement of all soil prisms is similar, and no additional VEP is generated. The VEP increases linearly with the depth of backfill and reaches its maximum at point B.
- (2)
- B–C Stage (g–g Section to b–b Section): The shape of the RDS between the interior and exterior soil prisms changes from a “horizontal straight line” to an “arc with up-facing opening”, and then back to a “horizontal straight line”. The EPS layer acts as a load reduction element, significantly reducing the VEP, and the VEP at point C reaches its minimum.
- (3)
- C–D Stage (b–b Section to a–a Section): The shape of the RDS between the interior and exterior soil prisms changes from a “horizontal straight line” to an “arc with downward-facing opening”. The exterior soil prisms exert downward additional VEP on the interior soil prisms, causing the VEP to increase slightly.
3.3. Variation in VEP Under Various Working Conditions
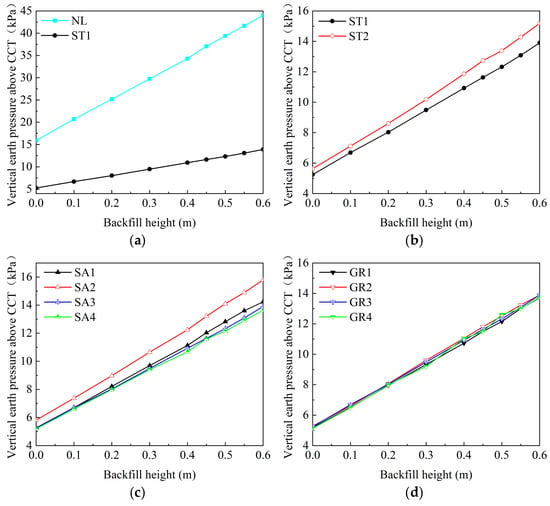
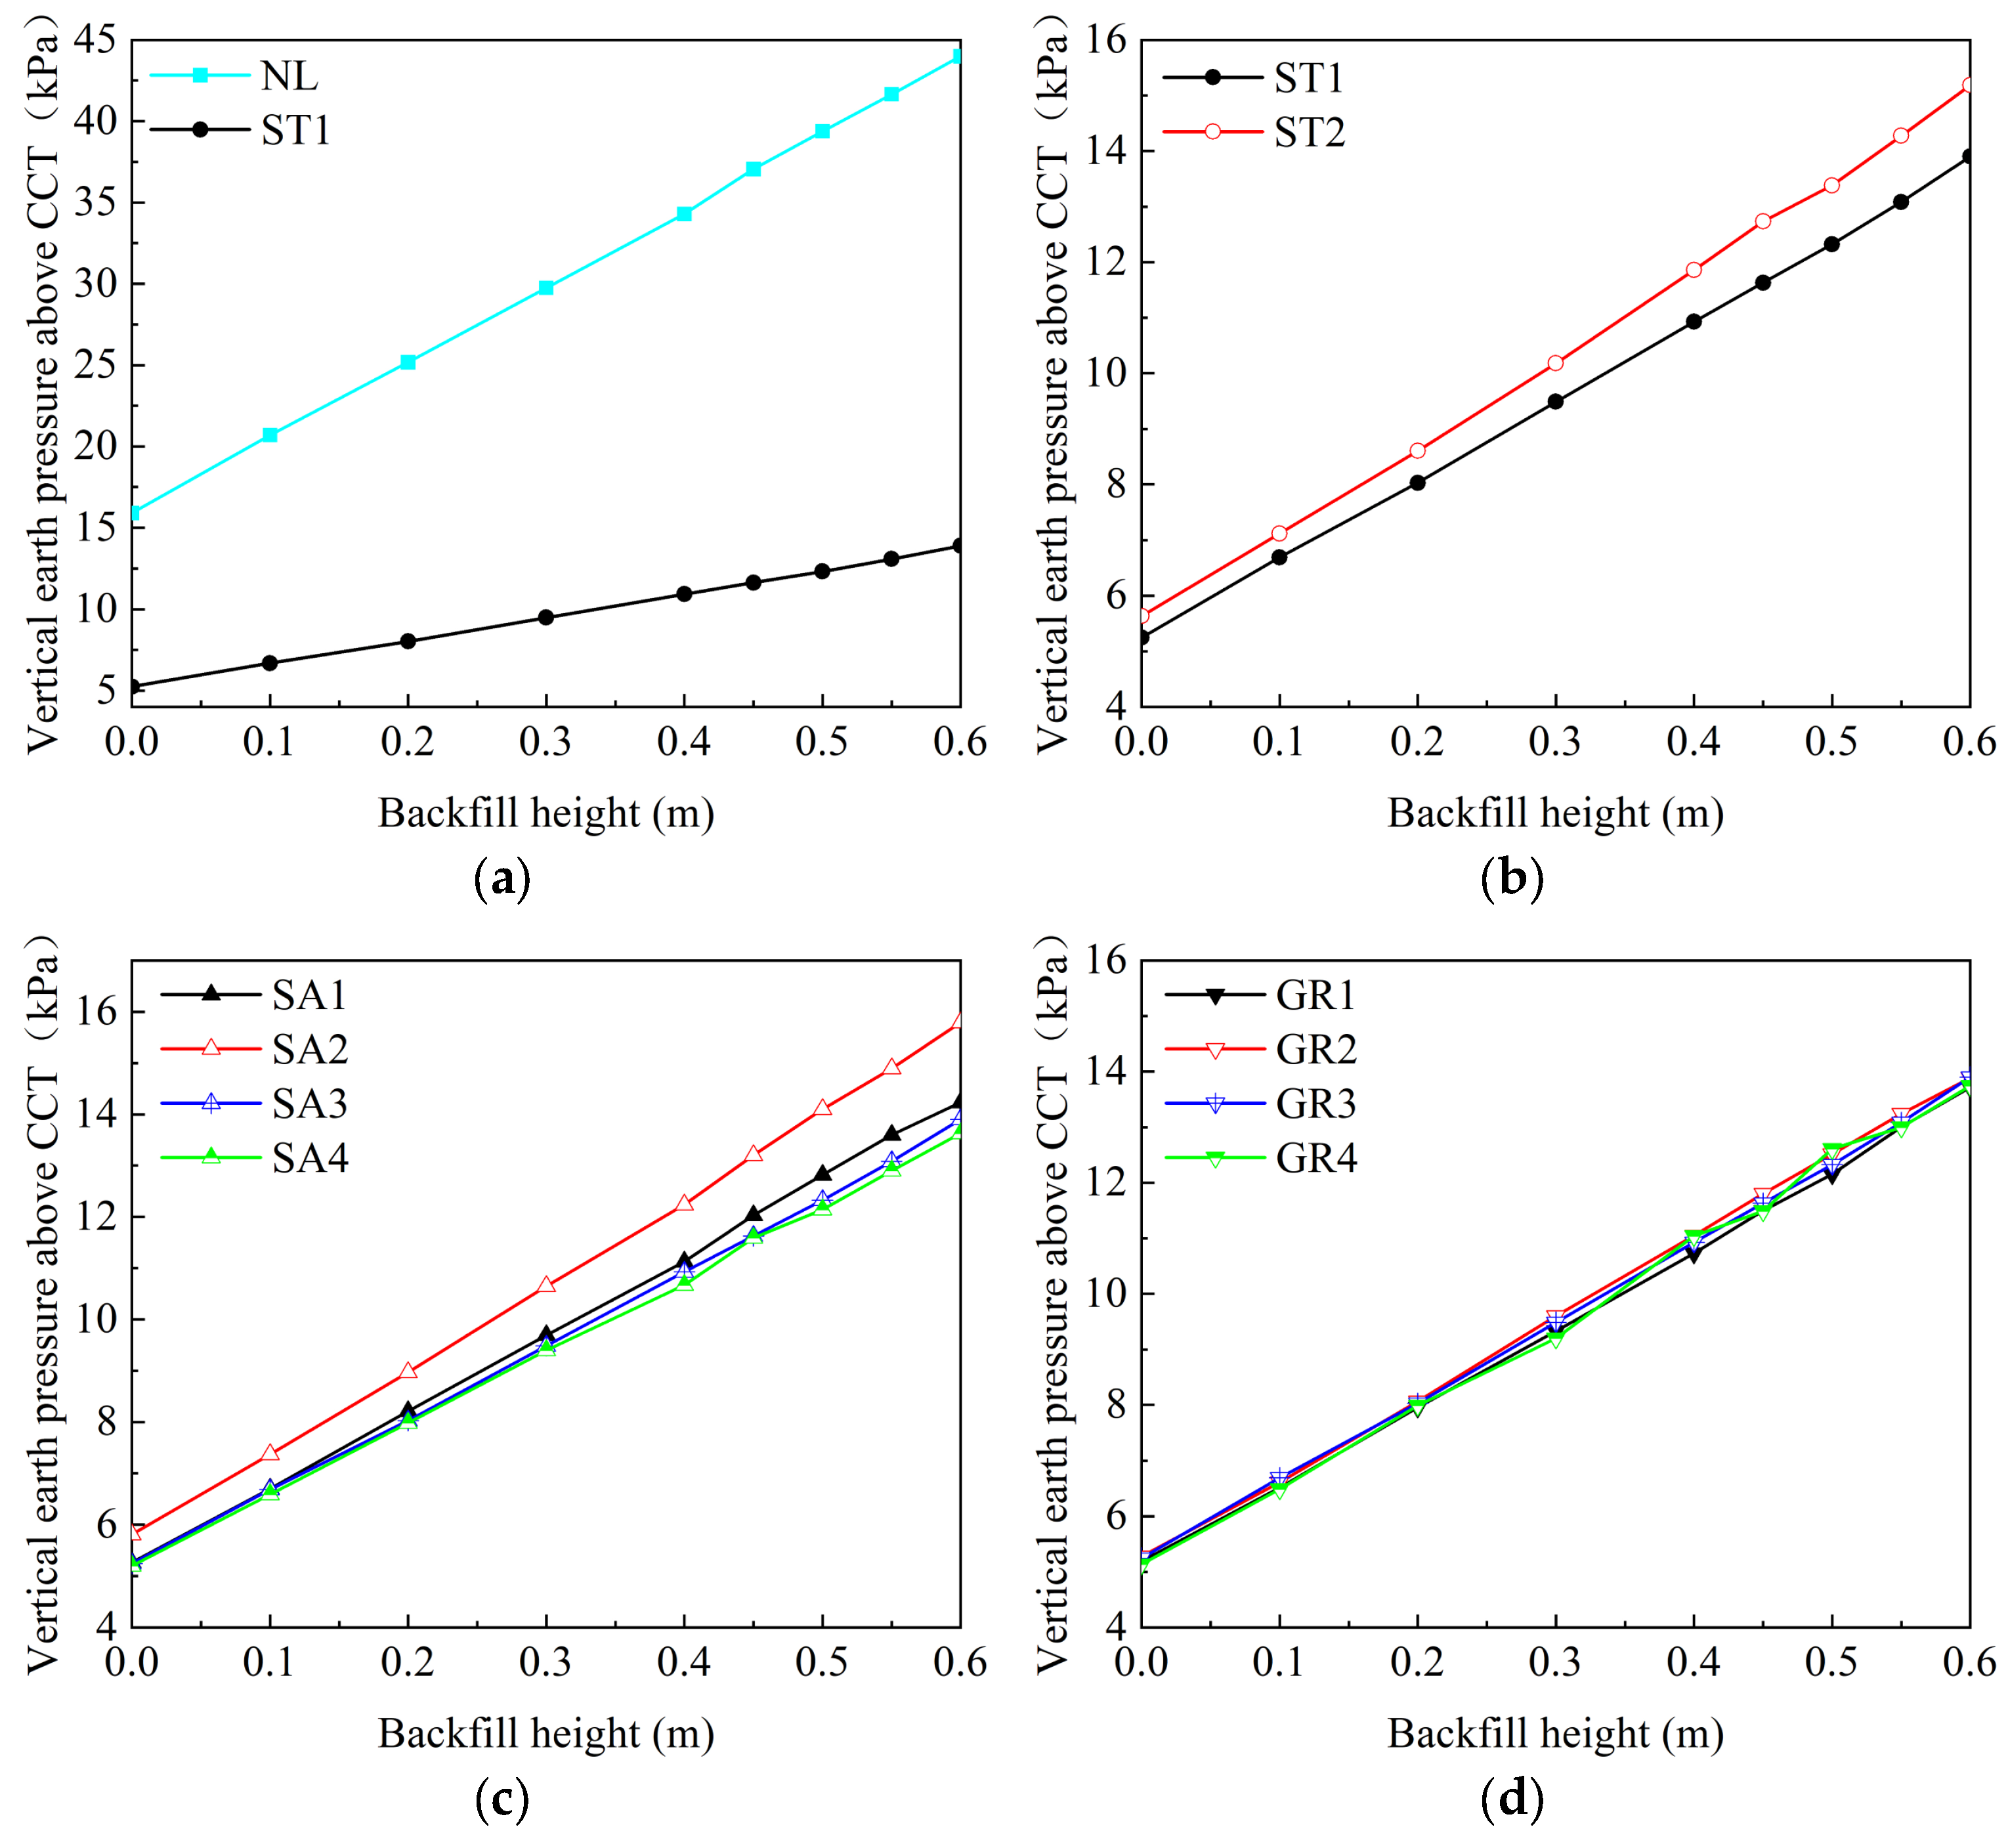
Figure 8 shows the variation in the VEP on top of the CCT with backfill height under different working conditions. The following observation can be made: As shown in Figure 8a, with the increase in backfill height, the VEP above the CCT increases linearly. The VEP in HFLRCCTs is generally smaller than that in HFCCTs. With the increase in backfill height, the increase in the VEP in HFCCTs without load reduction measures is larger. Arranging EPS above the CCT significantly reduces the VEP, a load reduction effect that improves with the increase in backfill height. As shown in Figure 8b, the section type influences the magnitude of the VEP above the CCT. The VEP is smaller for rectangular sections, which is better for optimizing load reduction above the CCT. As shown in Figure 8c, the change in slope angle has a significant effect on the VEP above the CCT. The VEP is the highest when the slope angle is 80° and the lowest at 60° and 70°, which indicates that the slope angle has a greater influence on the load reduction effect of EPS, with optimal performance achieved at slope angles between 60° and 70°. As shown in Figure 8d, with the increase in backfill height, the change in the VEP under different groove–width ratios is similar, indicating that the groove–width ratio has a relatively minor influence on the load reduction performance of EPS.
Figure 8.
Variation in VEP with backfill height: (a) before and after load reduction; (b) influence of section type; (c) influence of slope angle; (d) influence of groove–width ratio.
3.4. Variation in RDS Under Various Working Conditions
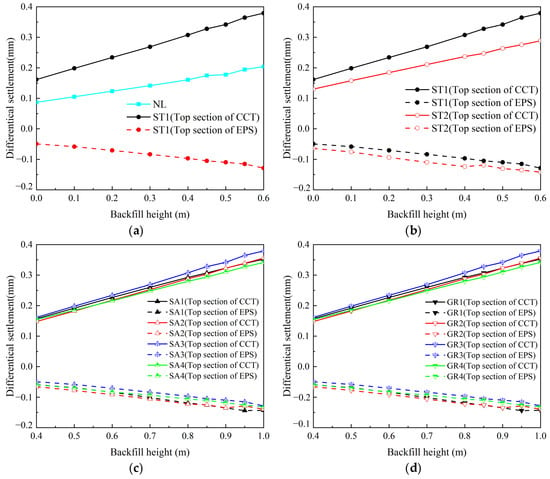
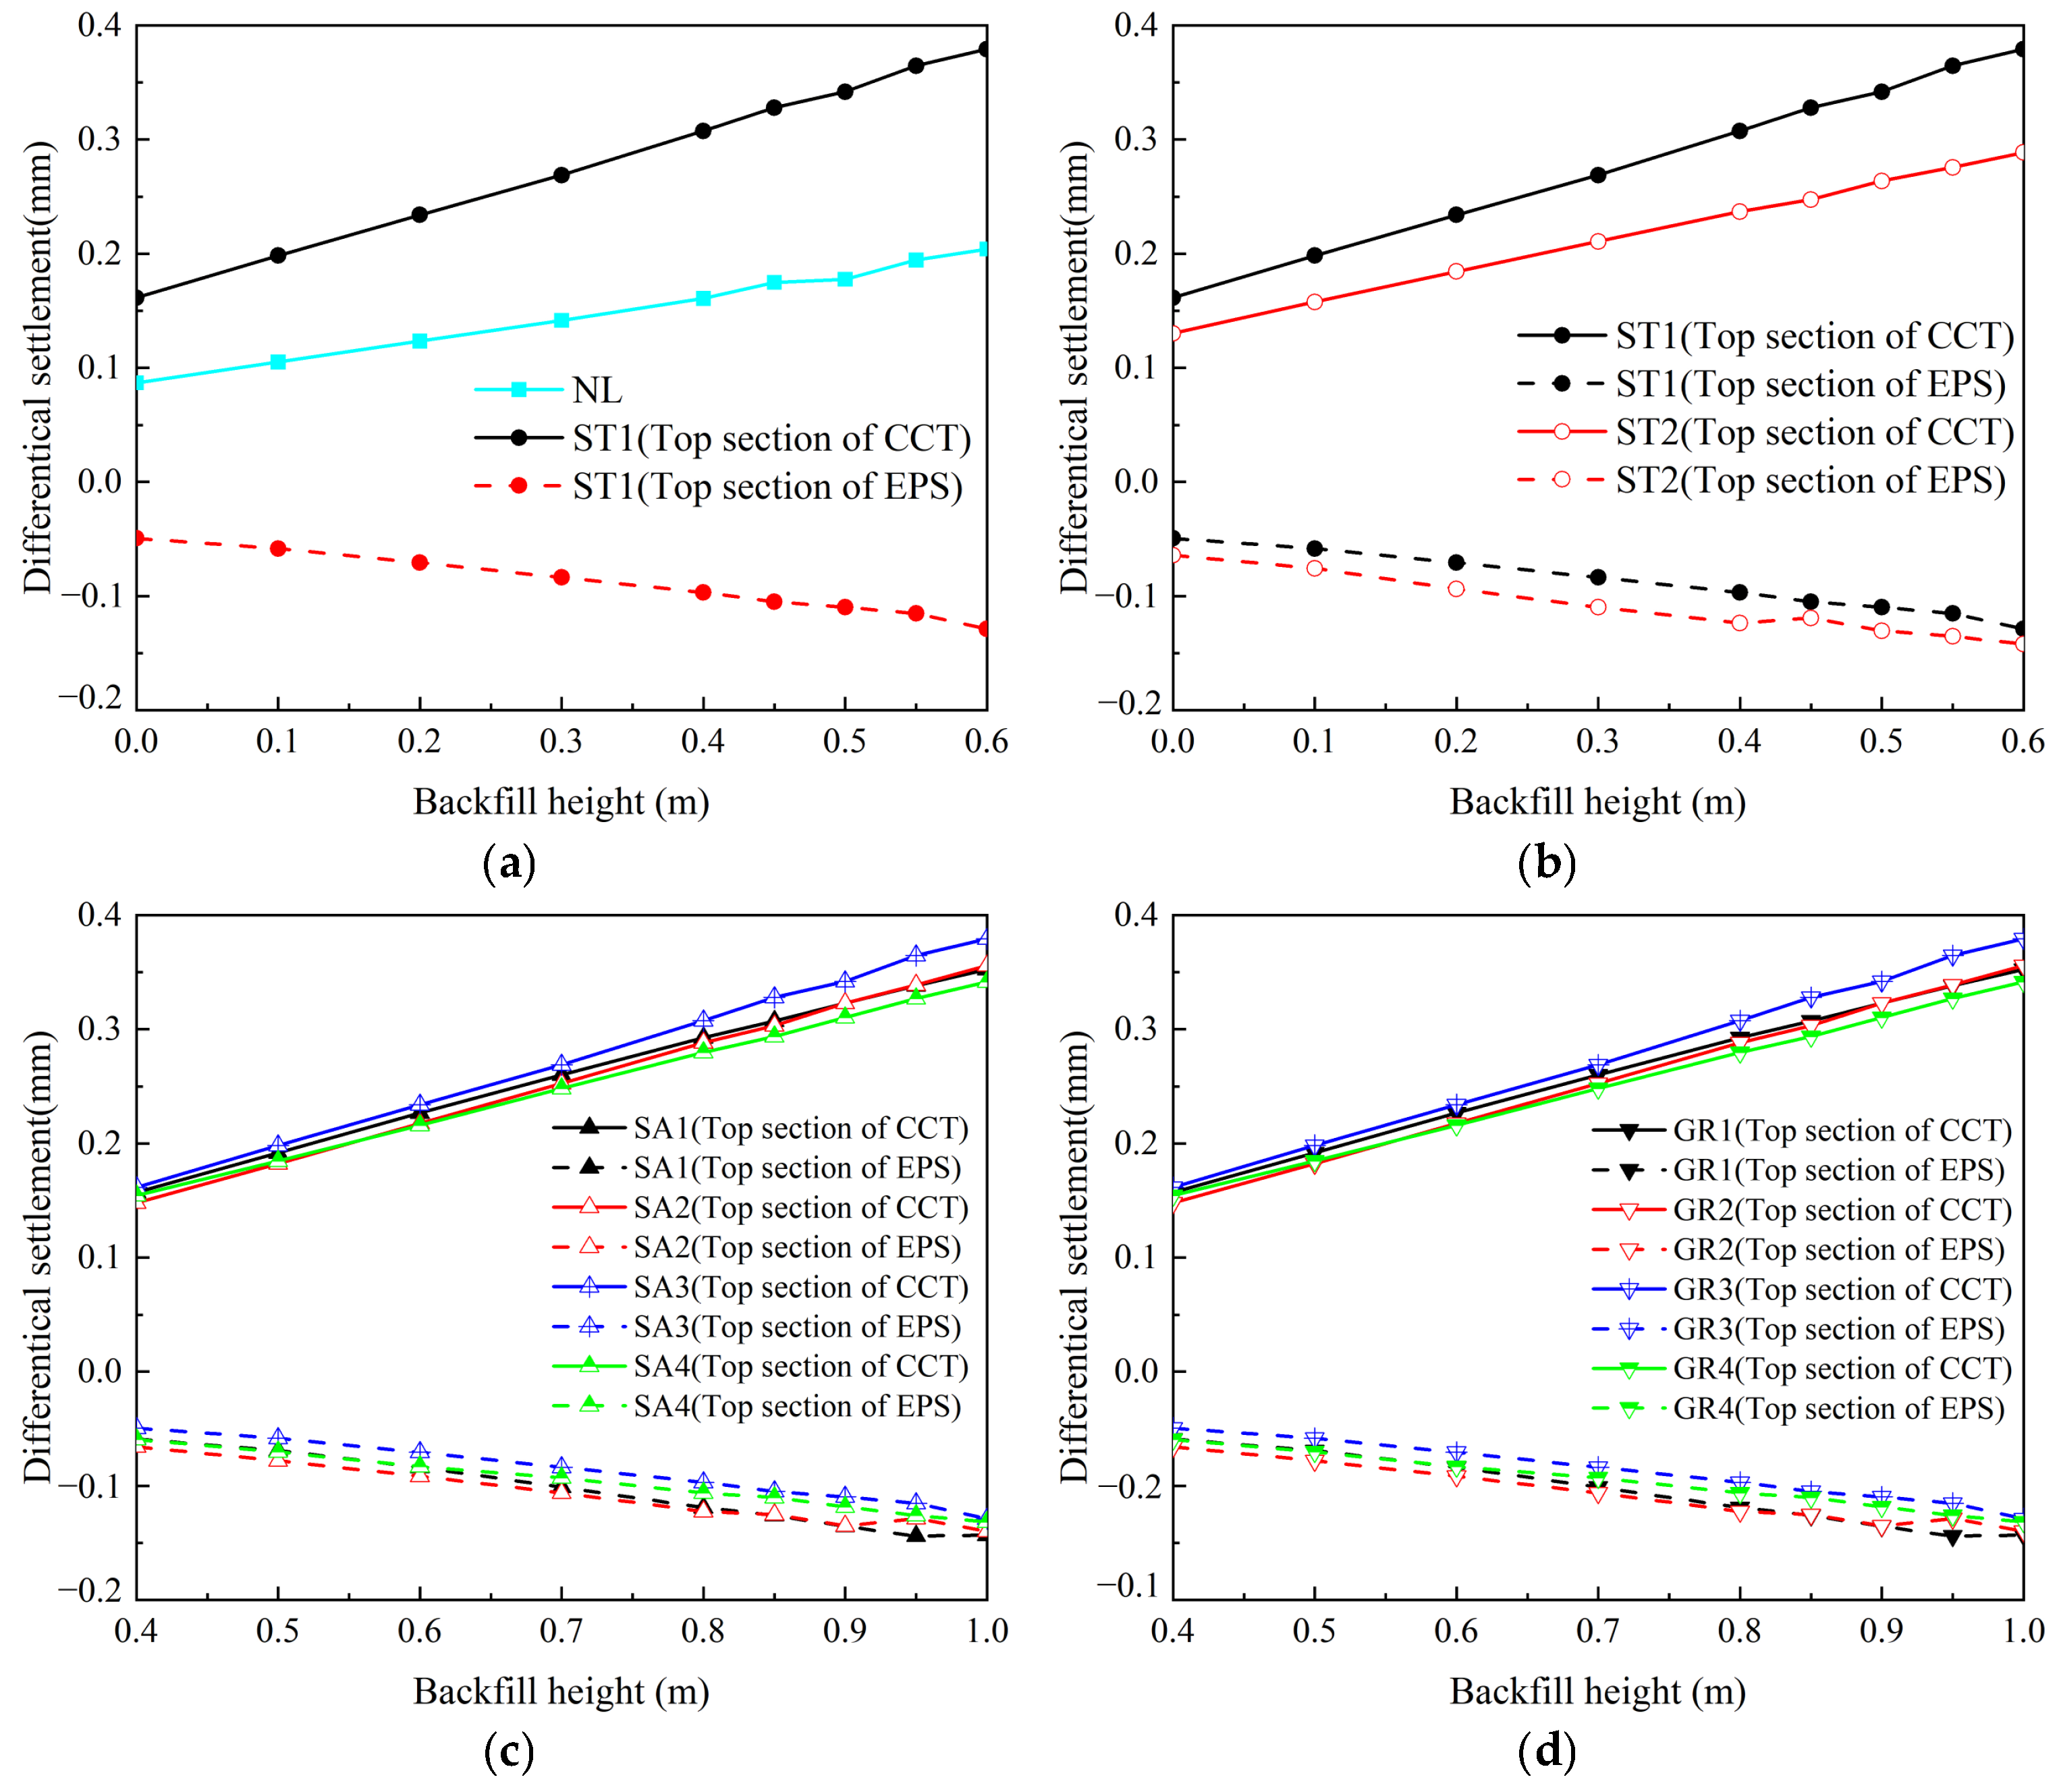
In HFCCTs, the stiffness difference between the CCT and backfill leads to RDS (δ) between the interior and exterior soil prisms in the cross-section above the CCT. Similarly, the stiffness difference between the EPS layer and the surrounding backfill leads to RDS (δ0) in the top section of the EPS layer.
Figure 9 shows the variation in δ and δ0 with the backfill height for each working condition. As the backfill height increases, the absolute value of δ0 increases exhibiting a linear correlation, in turn indicating that δ0 is linearly correlated with the VEP. The absolute value of RDS increases and shows a linear correlation with the backfill height. Figure 8 demonstrates that earth pressure varies linearly with fill height. Earth pressure comprises three components: the self-weight of the soil, the additional earth pressure induced by δ (p1) [22], and the additional earth pressure induced by δ0 (p2). Given that both the soil self-weight and p1 are linear functions of fill height, it necessarily follows that δ0 and p2 are also linearly correlated. This trend is consistent with the variation in the VEP with backfill height shown in Figure 9, further confirming that RDS and VEP are linearly correlated. The RDS in the top section of the EPS layer is smaller in magnitude than that in the top section of the CCT. However, the VEP above the CCT is lower than that before load reduction, indicating that δ0 plays a more significant role in reducing earth pressure.
Figure 9.
Variation in RDS with backfill height: (a) influence of load reduction; (b) influence of section type; (c) influence of slope angle; (d) influence of groove–width ratio.
4. Vertical Earth Pressure Based on Elasticity Theory
4.1. Fundamental Assumption
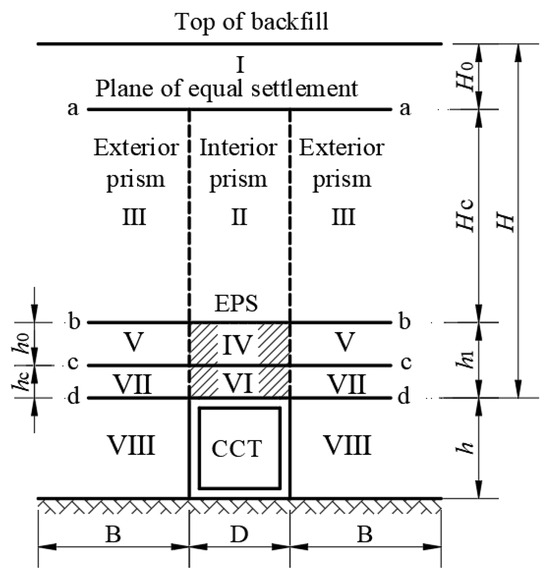
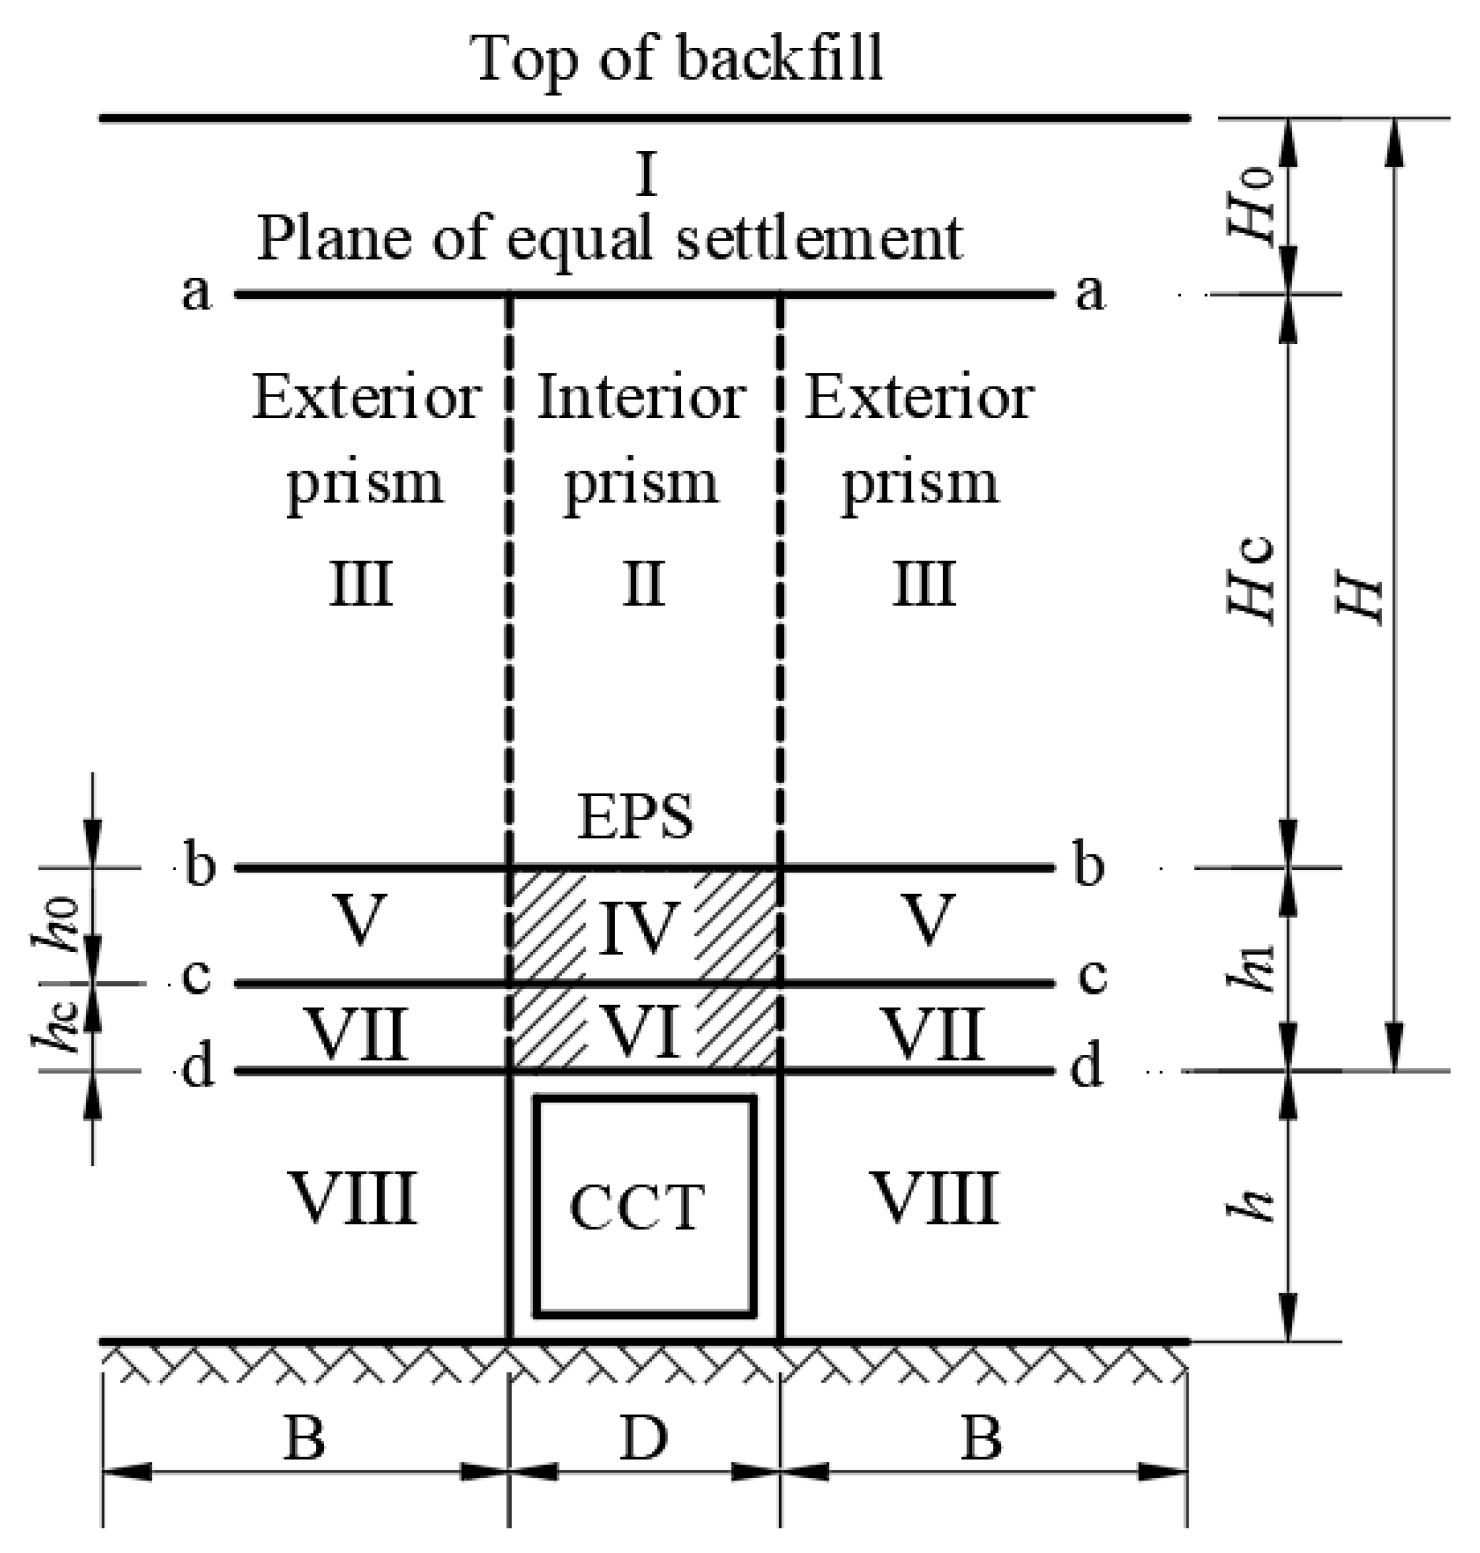
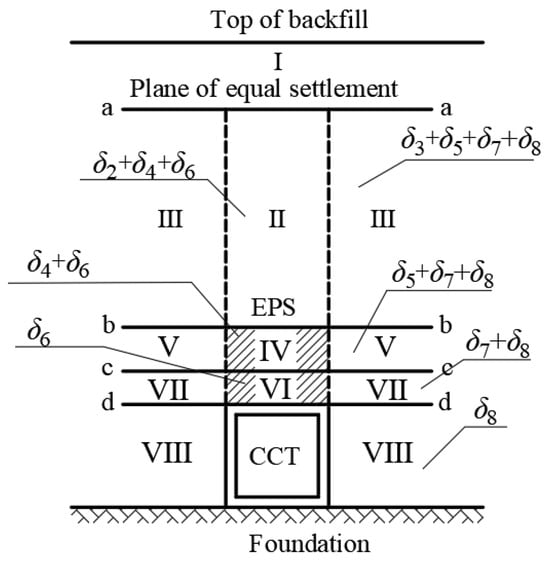
Referring to Marston’s research on high-fill structures and incorporating the analysis of the VEP transfer mechanism in the previous section, a physical analysis model was established, as shown in Figure 10. The model is based on the following fundamental assumptions: the CCT and foundation are rigid, and their deformation is neglected; the interface between the interior and exterior soil prisms is a vertical plane, and relative displacement occurs between them, generating a shear force τ. A unit length along the axial direction of the CCT is taken as the object of study; since the object of study is an HFLRCCT, a plane of equal settlement exists within the backfill height, and the soil above this plane undergoes no relative displacement.
Figure 10.
Mechanical analysis model of HFLRCCT.
4.2. Calculation Method for Average VEP
For HFLRCCTs, a compressive load reduction material of a certain thickness is placed above the CCT to reduce the VEP. Due to the stiffness difference between the CCT and the surrounding soil, the settlement of load reduction material VI relative to soil VII becomes greater. In section a–a, the settlement of load reduction material VI (δ6) is equal to the settlement of soil VII (δ7) and soil VIII (δ8). The exterior soil prisms temporarily do not produce relative displacement. As the backfill height increases, the deformation modulus of the load reduction material is lower than that of the backfill, making it more susceptible to larger settlement. Consequently, it moves upward relative to load reduction material IV, generating upward additional force. This mechanism reduces the VEP above the CCT.
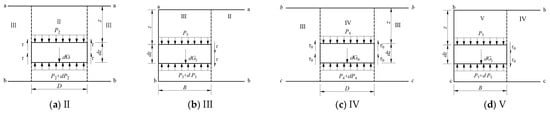
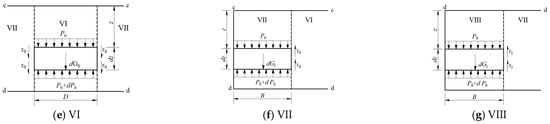
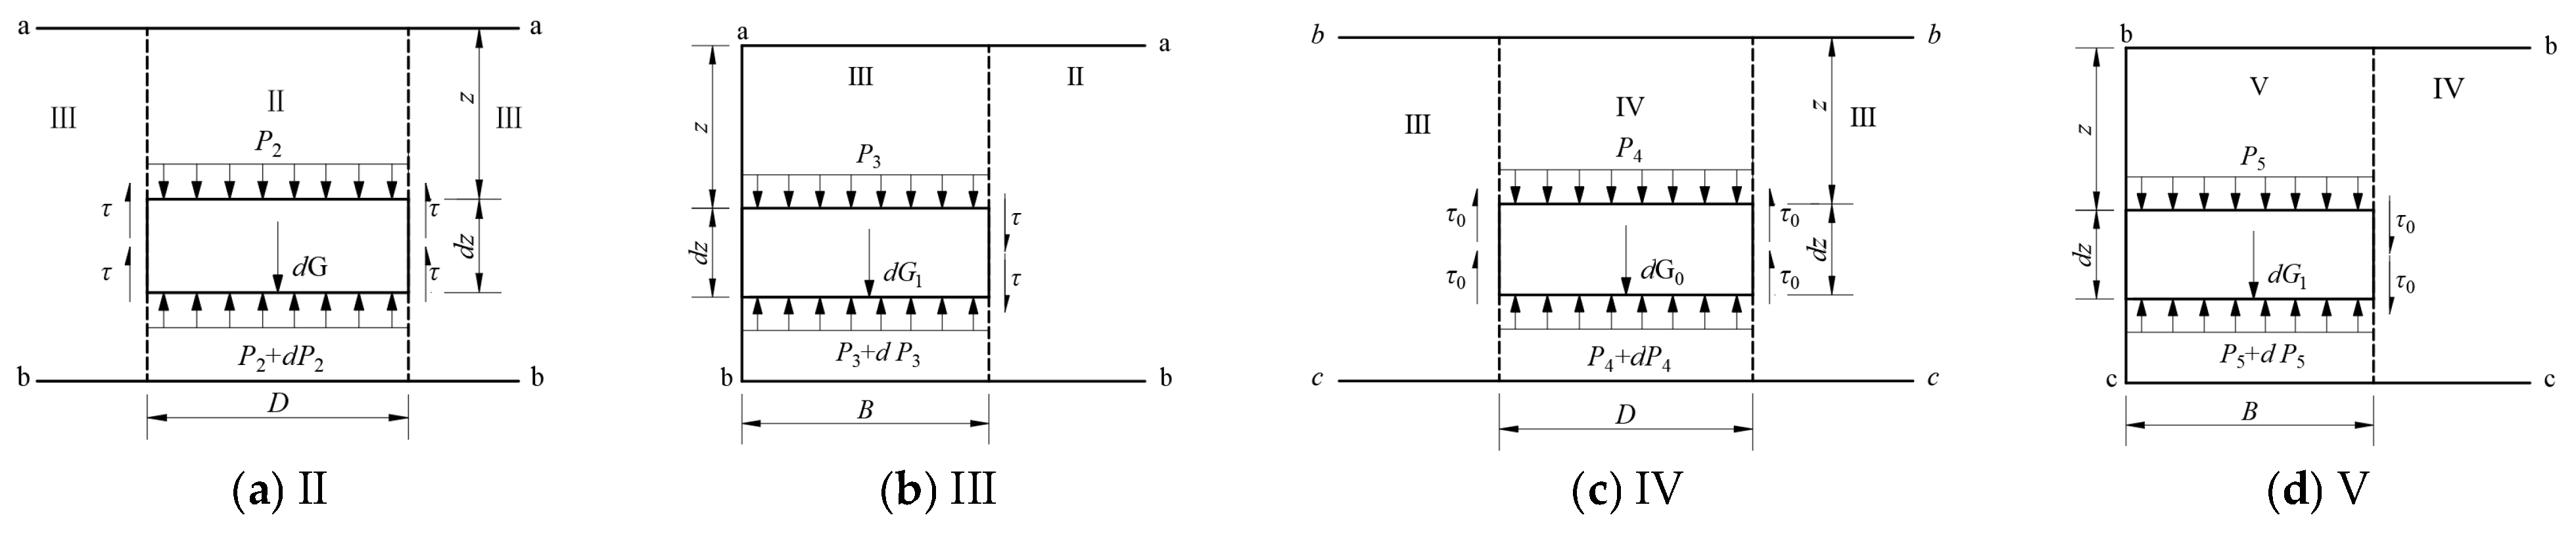
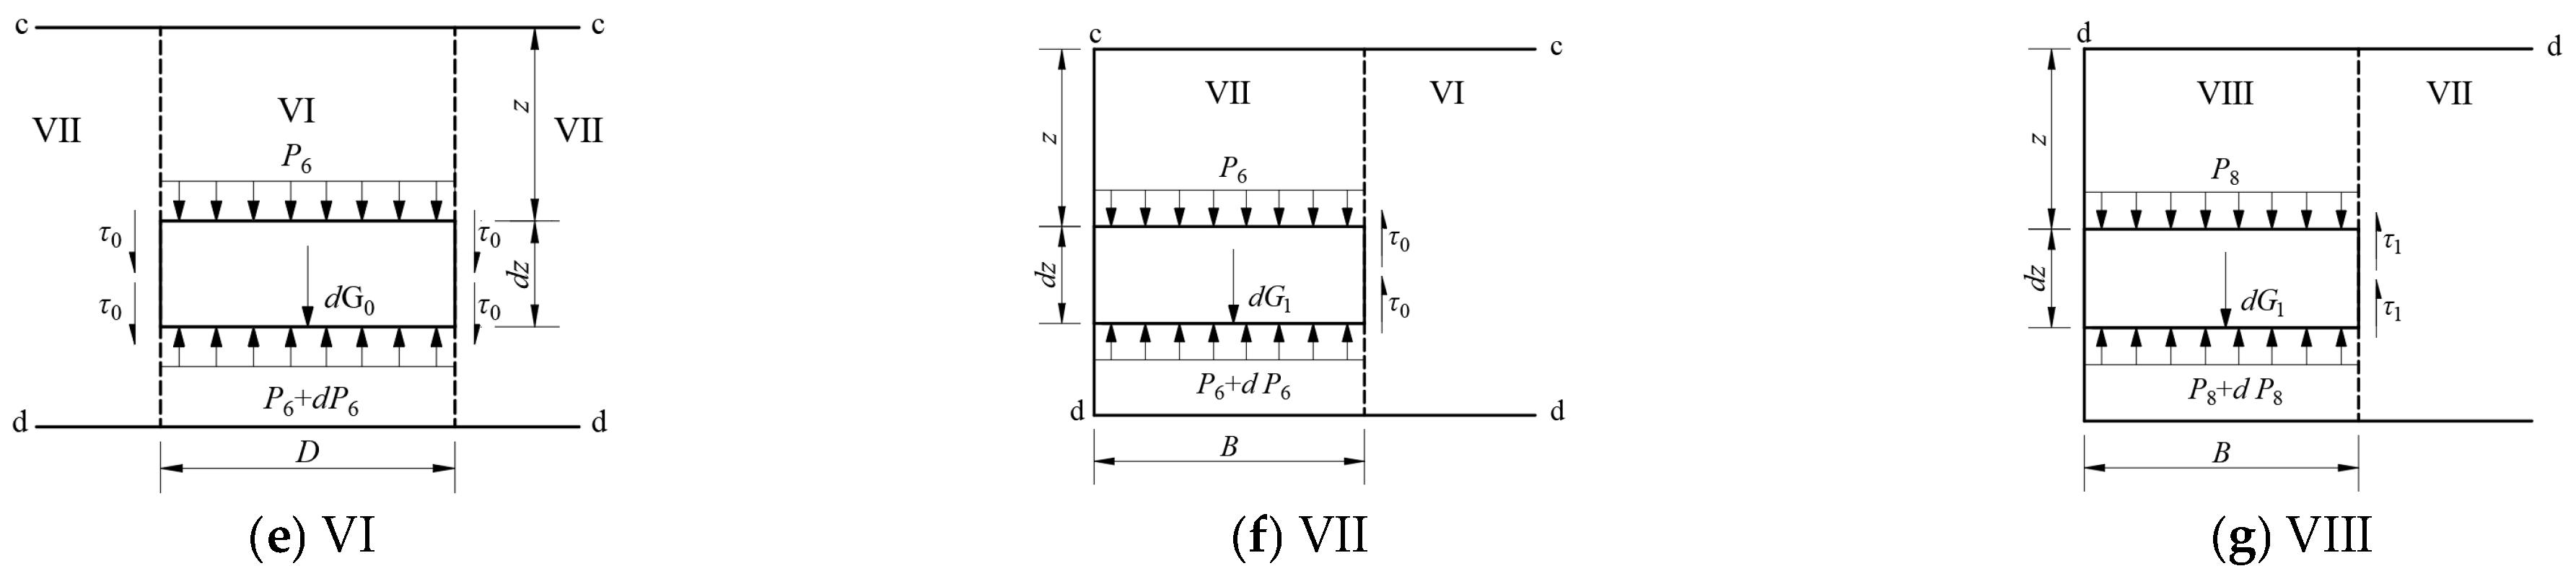
The VEP equilibrium conditions for each part of the backfill are shown in Figure 11. The shear force is given by the Bjerrum friction equation [28]: , which is based on the Mohr–Coulomb strength criterion. The physical meaning of each parameter is as follows: tanφe is the internal friction angle of the material, Ke is the lateral VEP coefficient of the backfill, and P is the average VEP. β is a friction mobilization coefficient, which depends on the displacement between the interior and exterior soil prisms and ranges from 0 to 1, for ease of calculation, β is taken as 1, and .
Figure 11.
VEP equilibrium conditions of each part of backfill: (a) soil II; (b) soil III; (c) soil IV; (d) soil V; (e) soil VI; (f) soil VII; (g) soil VIII.
Since this part of the study entails the interaction of multiple materials, let τ and α represent the friction generated between the backfill layers and their relative friction, respectively; let τ0 and α0 represent the friction generated between the backfill and the EPS layer and their relative friction, respectively; and let τ1 and α1 represent the friction generated between the backfill and the CCT and their relative friction, respectively.
There is no relative displacement in soil I, and the VEP of soil I is given by:
Force balance equations are established for each part:
Here, , , , γ is the unit weight of soil; γ0 is the unit weight of the EPS layer (unit: N/m3); and P1, P2, P3, P4, P5, P6, P7, and P8 are the VEP values in each part of the HFLRCCT. The step-by-step derivation is presented below using Equation (2) as an example.
By simplifying Equation (2), we obtain:
The general solution is obtained as:
Given the boundary condition at z = 0: , the constant C is determined as:
The average vertical earth pressure P2 at any height z in soil II can be written as:
By simplifying the equations, substituting the boundary conditions, and solving for the constants, the VEP for the remaining portion is obtained as follows:
4.3. Determination of the Plane of Equal Settlement
Through the elastic theory formula, the settlement values of each section of soil and of the load reduction material are calculated as follows:
δi is the compression settlement of each part of HFLRCCT; E is the deformation modulus of soil or EPS.
Figure 12 shows the settlement of each part of the HFLRCCT. The deformation settlement of the CCT and the foundations is neglected. Below the plane of equal settlement (section a–a), the total settlement of the exterior and interior soil prisms is equal, yielding the first equivalence relation:
Figure 12.
Settlement of each part of HFLRCCT.
In addition, the sum of the settlement of soil VII and soil VIII in section c–c is equal to the deformation of load reduction material VI, yielding the following relation:
To calculate the plane of equal settlement height (Hc) and section c–c height (hc), a trial-and-error method is employed. Initial values for Hc, and hc are assumed and iteratively adjusted until they satisfy Equations (16) and (17). Once Hc and hc are obtained, they are used in subsequent calculations. The obtained values of Hc and hc are then substituted into Equation (6) to determine the VEP above the CCT.
4.4. Correctness Verification
To verify the correctness of the obtained formula, the numerical results for case SA1 were compared with those from the theoretical analysis. The average VEP above the CCT was extracted and analyzed against the calculation values, and the calculation results are presented in Table 7. The height of section c–c (Figure 13) is 0.085 m, the plane of equal settlement height is 0.191 m, and the calculated average VEP above the CCT is 15.11 kPa. Compared with the numerical simulation results, the calculated value is 5.84% higher. The discrepancy arises because β was taken as 1 for computational convenience, which leads to excessive downward shear forces and consequently increases the average VEP above the CCT.
Table 7.
Comparative analysis of results.
Figure 13.
Discrete element model of working condition SA1.
5. Calculation Method for Vertical Earth Pressure Based on Relative Differential Settlement
5.1. Research Base
The calculation method for VEP based on elasticity theory is not only complicated but also requires parameters that are difficult to obtain. Building on the findings in Section 3, the relationship between VEP and RDS is further analyzed to propose a more straightforward method for calculating VEP. In a previous study [22], the internal relation between the RDS and additional VEP in HFCCTs was investigated. A calculation method for VEP based on the RDS was derived, and its accuracy was verified. For HFLRCCTs, Figure 7b shows that exterior soil prisms will generate RDS both on top of the CCT and on top of the EPS layer.
Specifically, the RDS (δ) between interior and exterior soil prisms in the top section of the CCT will generate downward additional force on the interior prism.
The RDS (δ0) between interior and exterior soil prisms in the top section of the EPS layer, which has an opposite sign to δ, will generate upward additional force on the soil above the CCT.
For convenience, the formula from [22] can be used to account for the additional VEP (p1) induced by δ; the relationship between δ0 and the additional VEP (p2) is then investigated.
Based on these findings, a formula for the VEP above the CCT is constructed as follows:
P is the VEP above the CCT, unit: kPa; γ is the unit weight of the backfill soil (unit: kN/ m3); P0 is the total additional VEP induced by RDS (unit: kPa); and p1 is the downward additional VEP induced by δ (unit: kPa). p1 is calculated using the following equation from [22]:
p2 is the upward additional VEP induced by δ0, with unit kPa.
5.2. Intrinsic Relationship Between RDS and Additional VEP
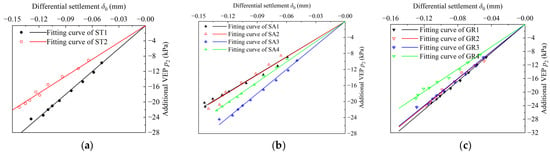
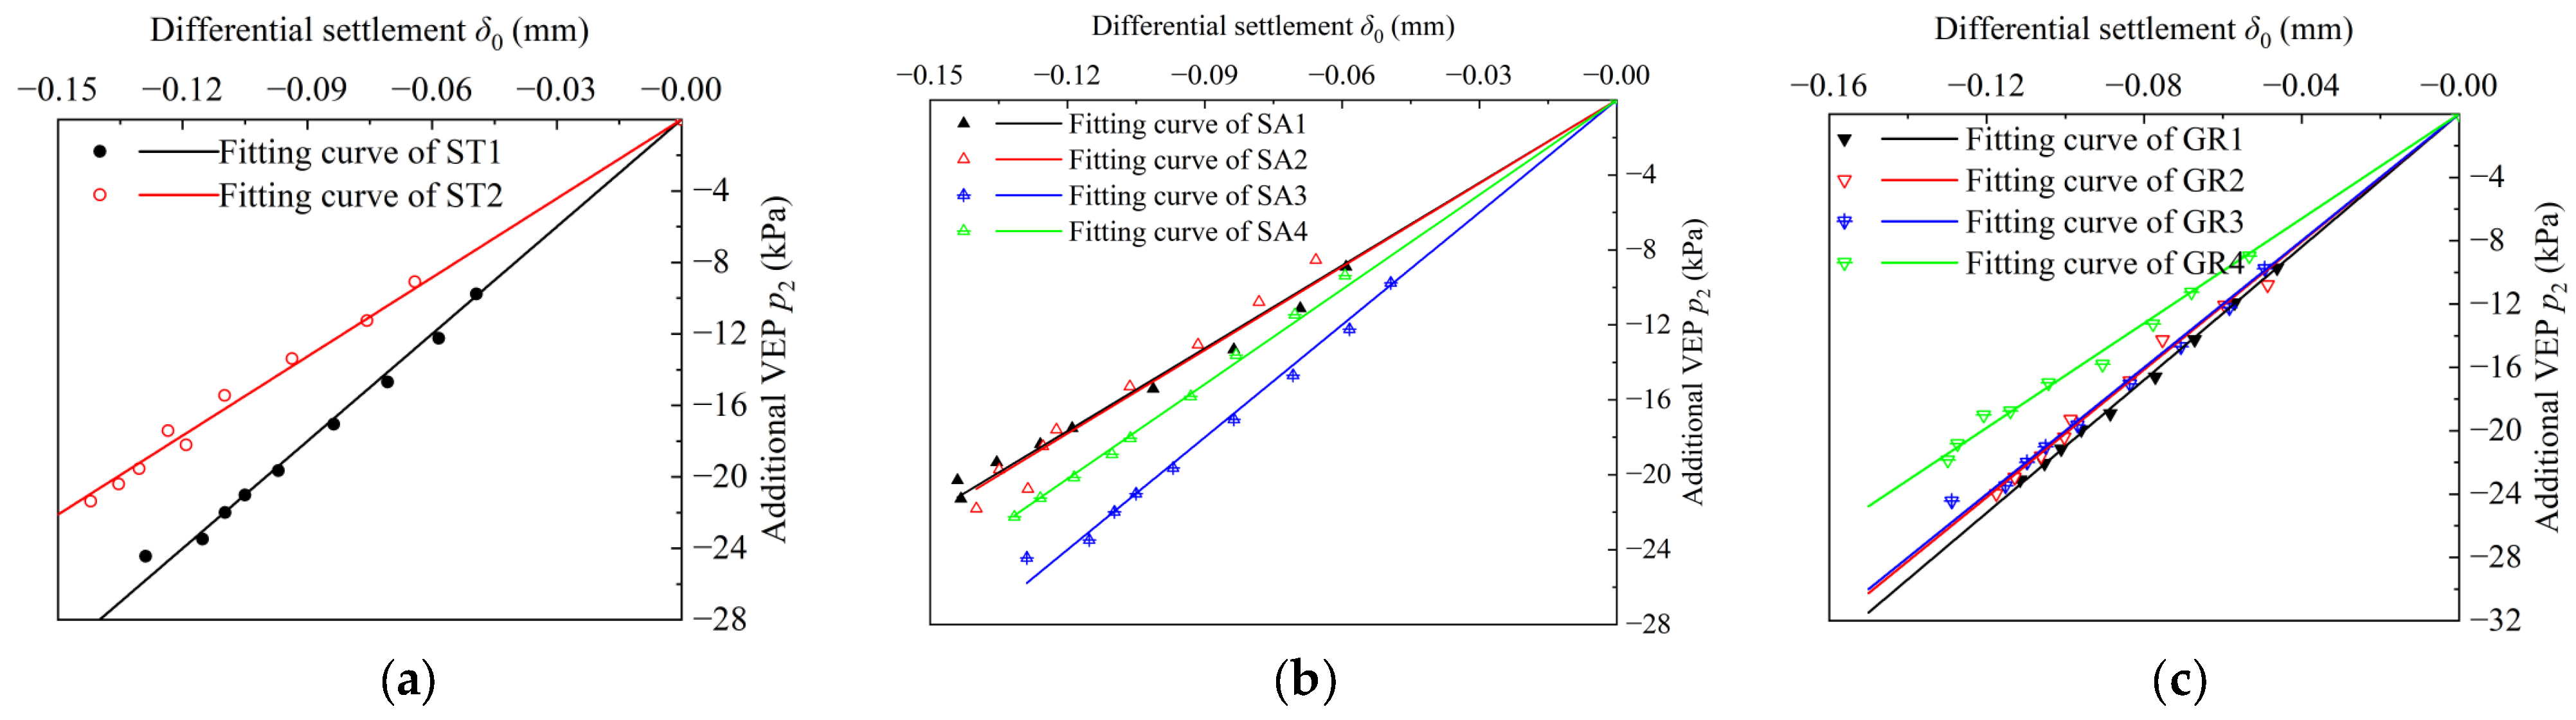
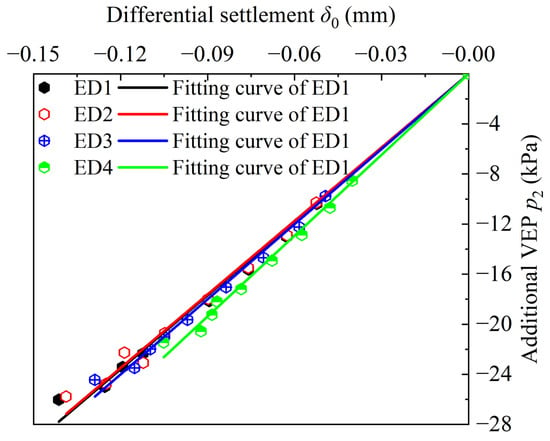
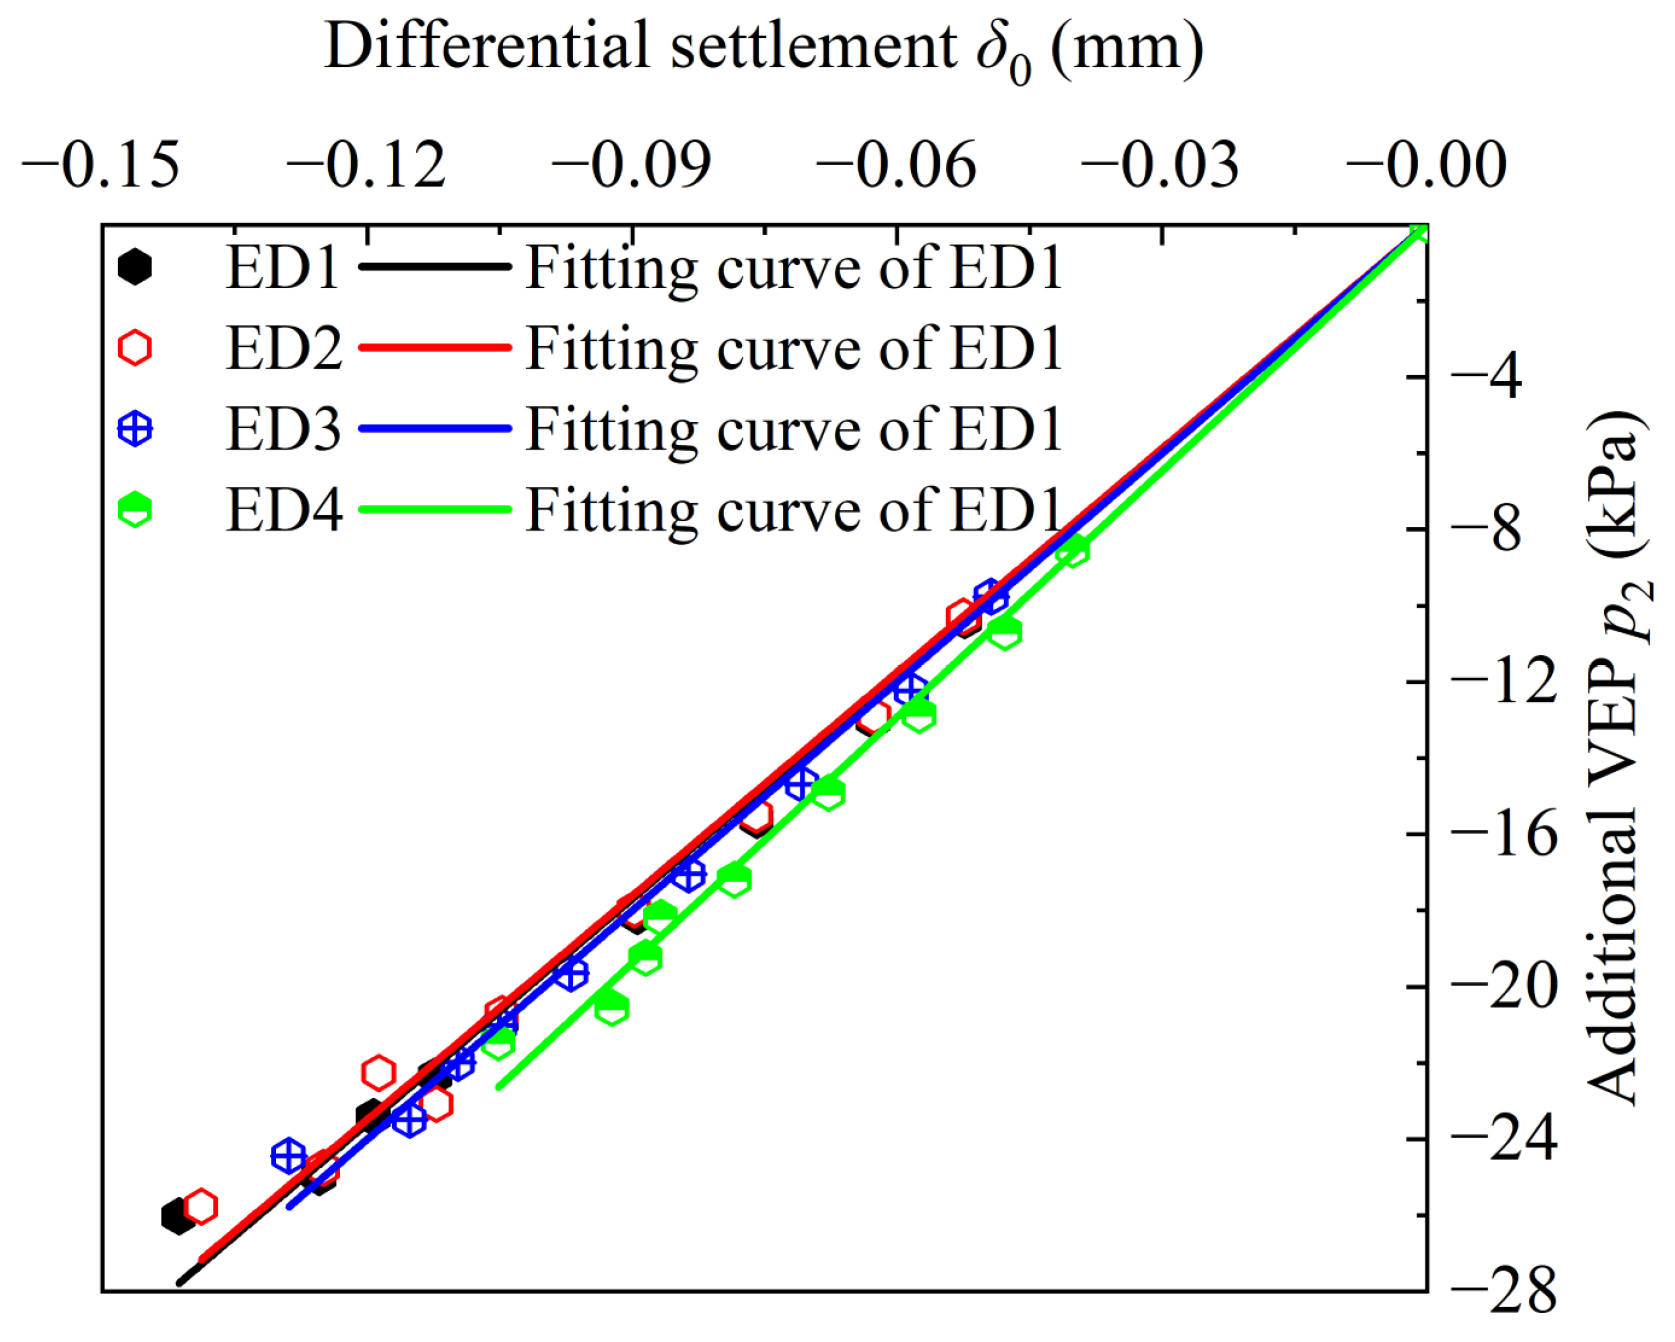
Additional VEP p2 was calculated using Equation (19). The interrelationship between δ0 and p2 was analyzed by preforming curve fitting, with the results being shown in Figure 14. A linear correlation between δ0 and p2 was observed across all working conditions. The information on the fitting curves under each working condition is shown in Table 8. The RDS and additional VEP are linearly correlated in all cases, and the slope of the fitting curve changes. The correlation coefficient R2 for each fitting curve exceeded 0.99, indicating an excellent fit. This confirms that δ0 and p2 are linearly correlated. The resulting functional relationship between δ0 and p2 is given by the following equation:
Figure 14.
Intrinsic relationship between RDS (δ0) and additional VEP (p2): (a) influence of section type; (b) influence of slope angle; (c) influence of groove–width ratio.
Table 8.
Fitting curve information for each working condition.
p2 is the additional VEP above the CCT, unit: kPa; K is the influence coefficient of RDS, which depends on the section type, slope angle, and groove–width ratio, values given in Table 8, unit: kPa/mm; δ0 is the RDS between the interior and exterior soil prisms at the top of the EPS, unit: mm.
5.3. Influencing Factors of EPS
Many factors influence the average VEP and RDS above the CCT. In addition to the section type, slope angle, and groove–width ratio, the factors that can affect the VEP and RDS of HFLRCCTs include the thickness and density of EPS. Therefore, to expand the applicability of the formula, it is necessary to study the thickness and density of EPS.
- (a)
- Influence of EPS thickness
To study the effect of EPS thickness on the intrinsic relationship between the δ0−p2 function, a discrete element numerical analysis model was established, consistent with working condition ST1. By varying the EPS thickness, four simulation conditions were established, as shown in Table 9.
Table 9.
Study of EPS thickness.
The equation for calculating the load reduction rate of HFLRCCTs is given by:
w is the load reduction rate of HFLRCCT, unit: %. The load reduction rate reflects the strength of the load reduction effect; a higher rate indicates a better load reduction effect. P* is the VEP above the CCT before the load reduction unit: kPa, and P is the VEP above the CCT after load reduction, unit: kPa.
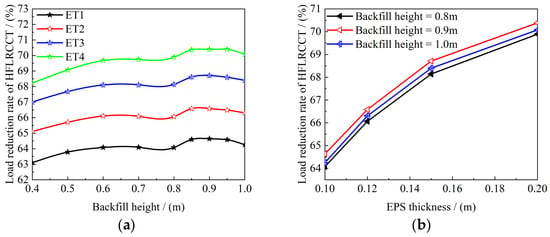
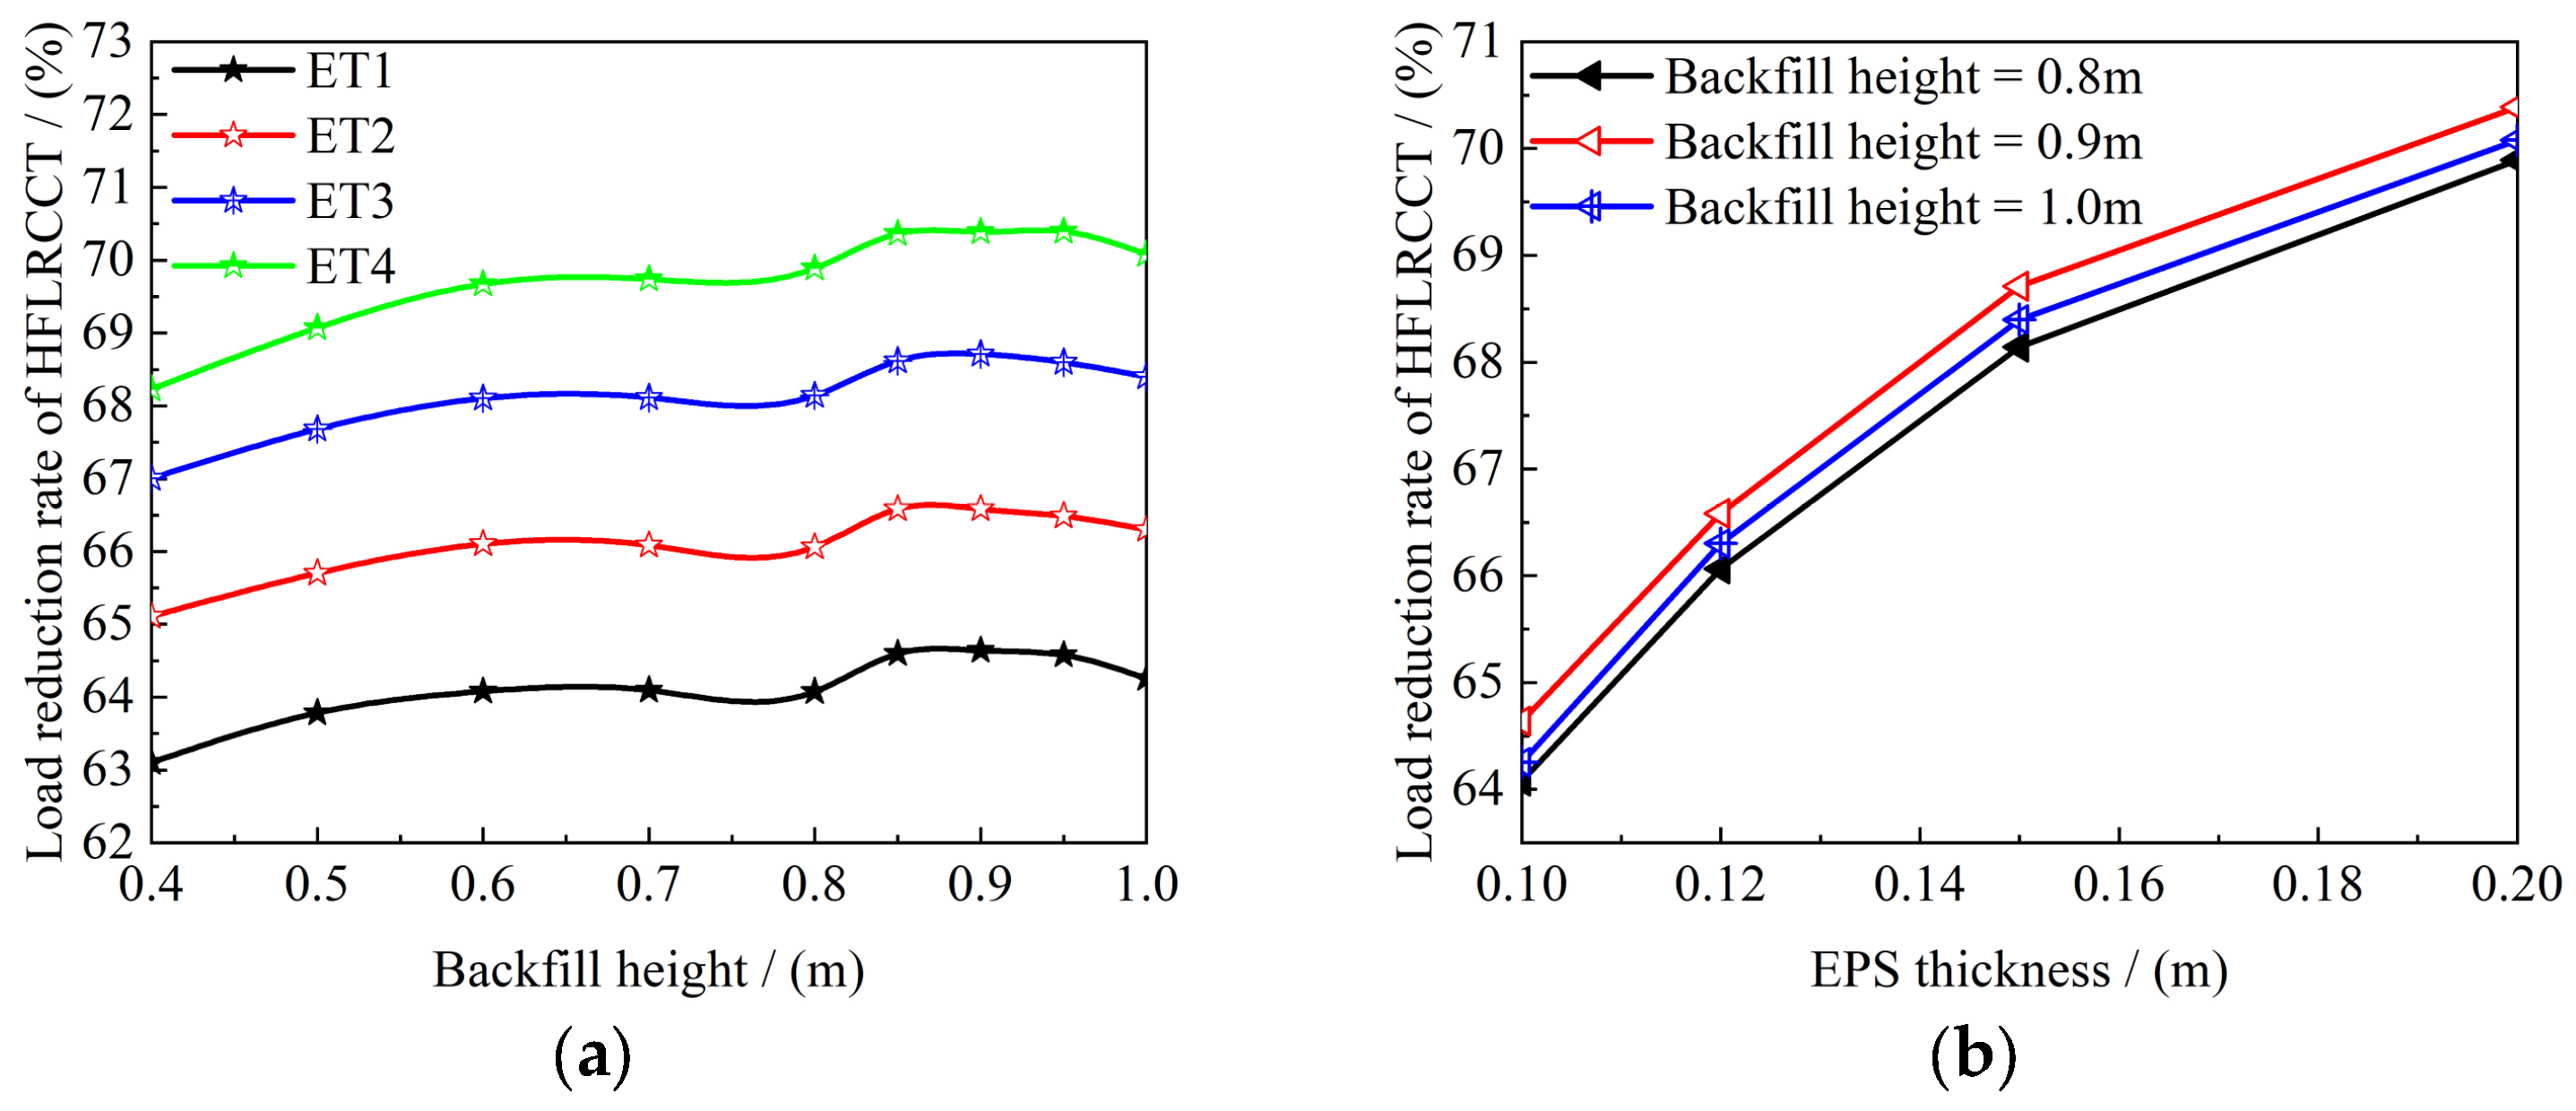
Figure 15 shows the variation in the load reduction rate above the CCT with backfill height. With the increase in EPS thickness, the overall load reduction rate increases. The variation in the load reduction rate with the backfill height is consistent across all working conditions. As the backfill height increases, the load reduction rate generally increases, reaching its maximum at H/h = 9/2. Beyond this height, the load reduction rate gradually decreases with further increases in backfill height. The reason is that as the backfill height increases, the compression of the EPS gradually increases. When the EPS reaches a certain height, its load reduction effect is nearly fully utilized. Then, as the backfill height increases, the additional VEP is basically unchanged, while the VEP above the CCT increases, causing the load reduction rate to plateau. From a physical mechanism perspective, EPS thickness h1 directly affects the compressibility. Greater thickness leads to larger compressibility under the same strain, generating a larger upward additional earth pressure p2 and thus a more significant load reduction effect. However, as shown in Figure 15b, increasing thickness from 0.10 m to 0.15 m improves the load reduction rate by about 4%, while increasing from 0.15 m to 0.20 m improves it by only about 1.5%, indicating diminishing marginal benefit. Therefore, the thickness correction coefficient Et increases with thickness but at a decreasing rate. Thicker EPS layers enhance the load reduction effect but may lead to structural instability.
Figure 15.
Influence of EPS thickness on load reduction rate. (a) variation with backfill height; (b) variation with EPS thickness.
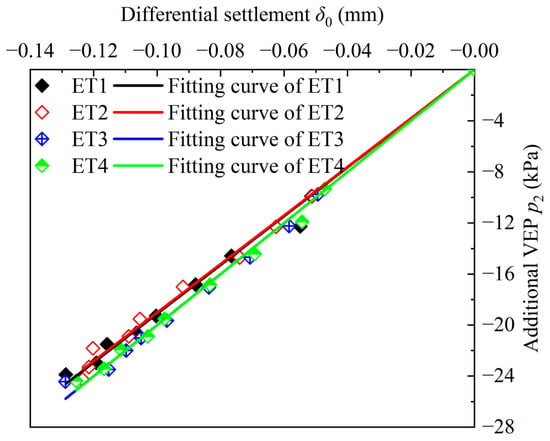
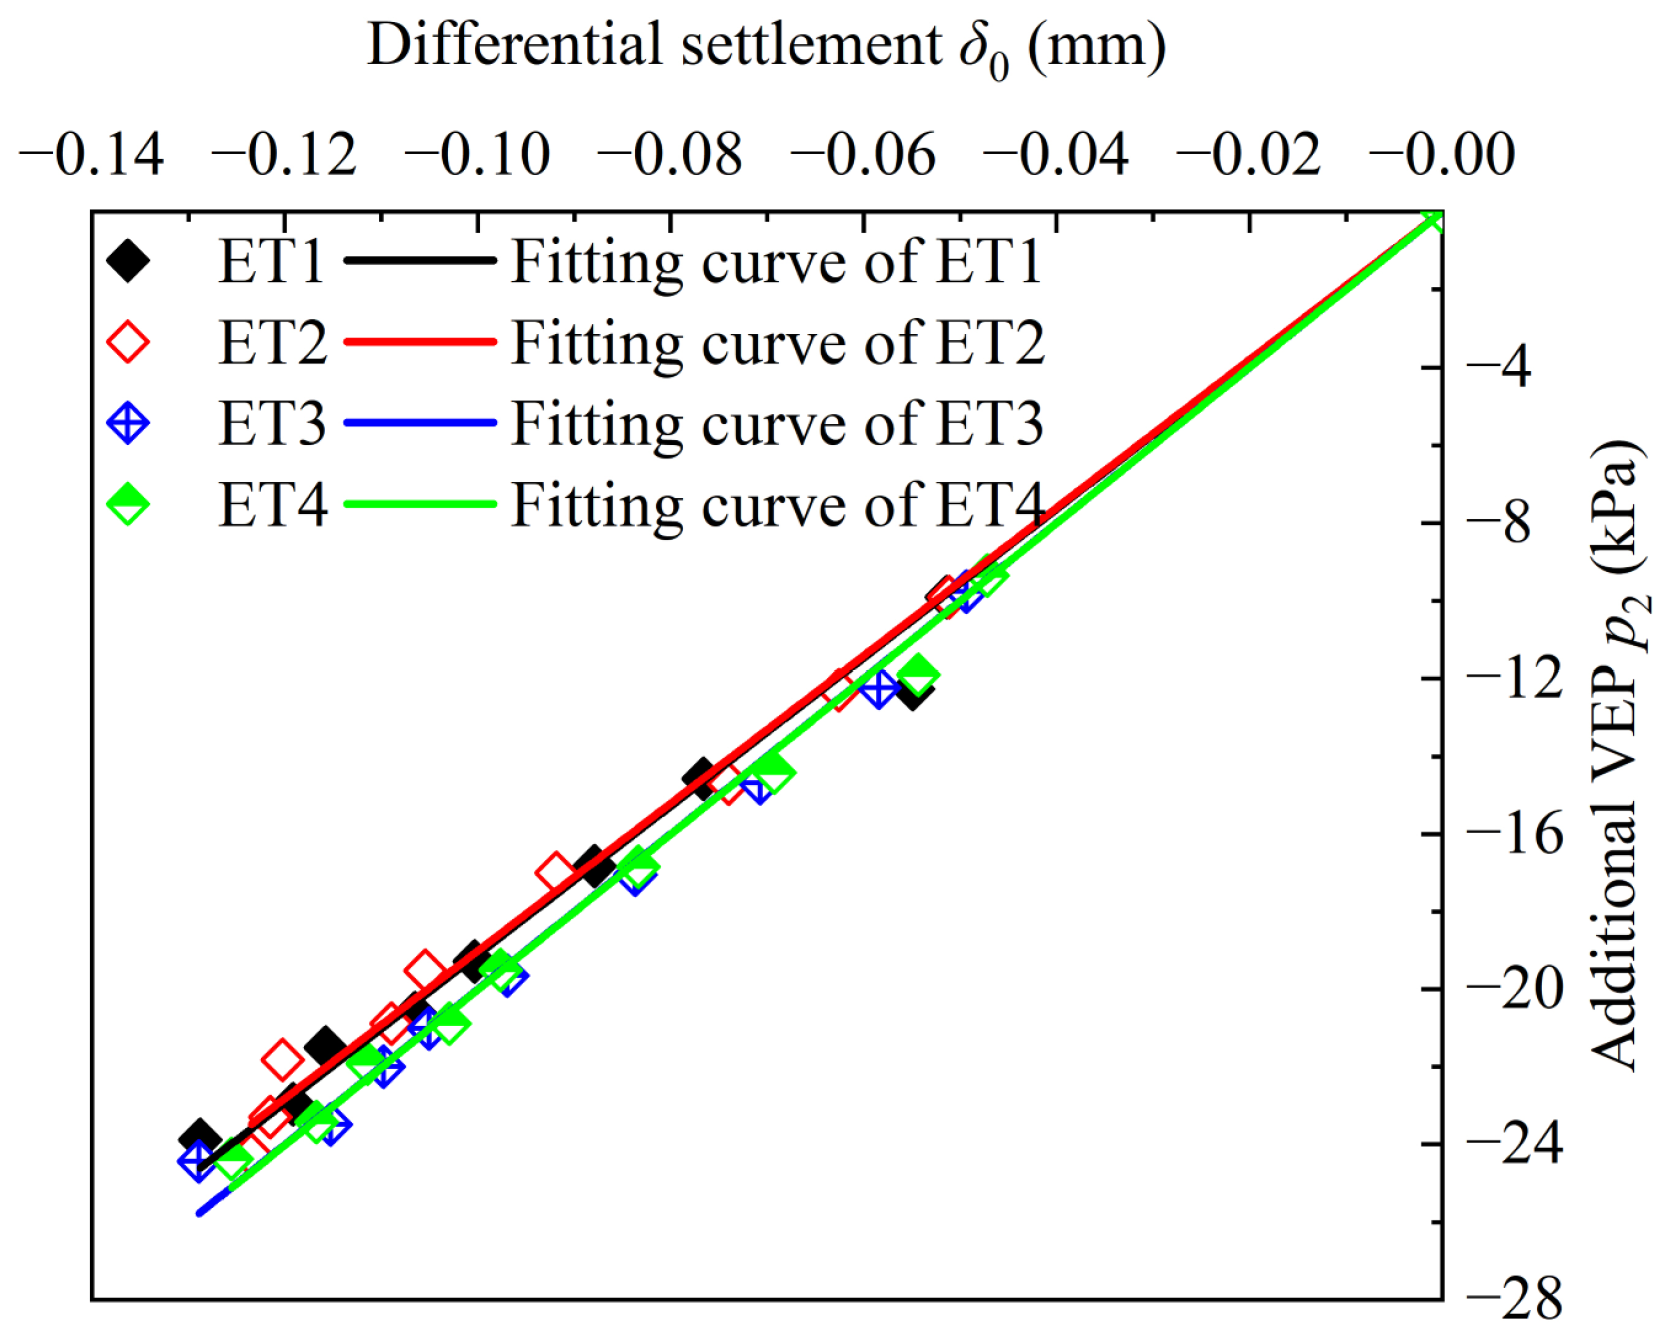
The fitting curves of δ0−p2 for each working condition are shown in Figure 16. A linear correlation between δ0 and p2 is still observed across different working conditions, although the slopes of the fitting curves varied. The parameters of the fitting curves are summarized in Table 10. The correlation coefficients R2 for all fitting curves exceed 0.99, indicating excellent fit. Introducing the coefficient Et (shown in Table 10) to consider the effect of EPS thickness corrects Equation (21).
Figure 16.
Intrinsic relationship between δ0 and p2.
Table 10.
Information on the fitting curves.
- (b)
- Influence of EPS density
To study the effect of EPS density on the intrinsic relationship between δ0 and p2, four simulation conditions with varying EPS densities were established, as shown in Table 11.
Table 11.
Study of EPS density.
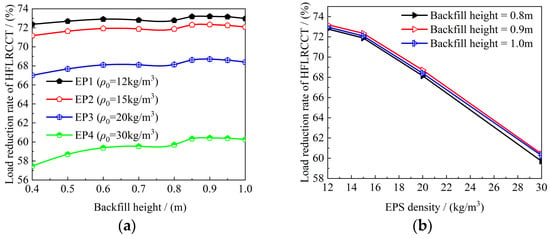
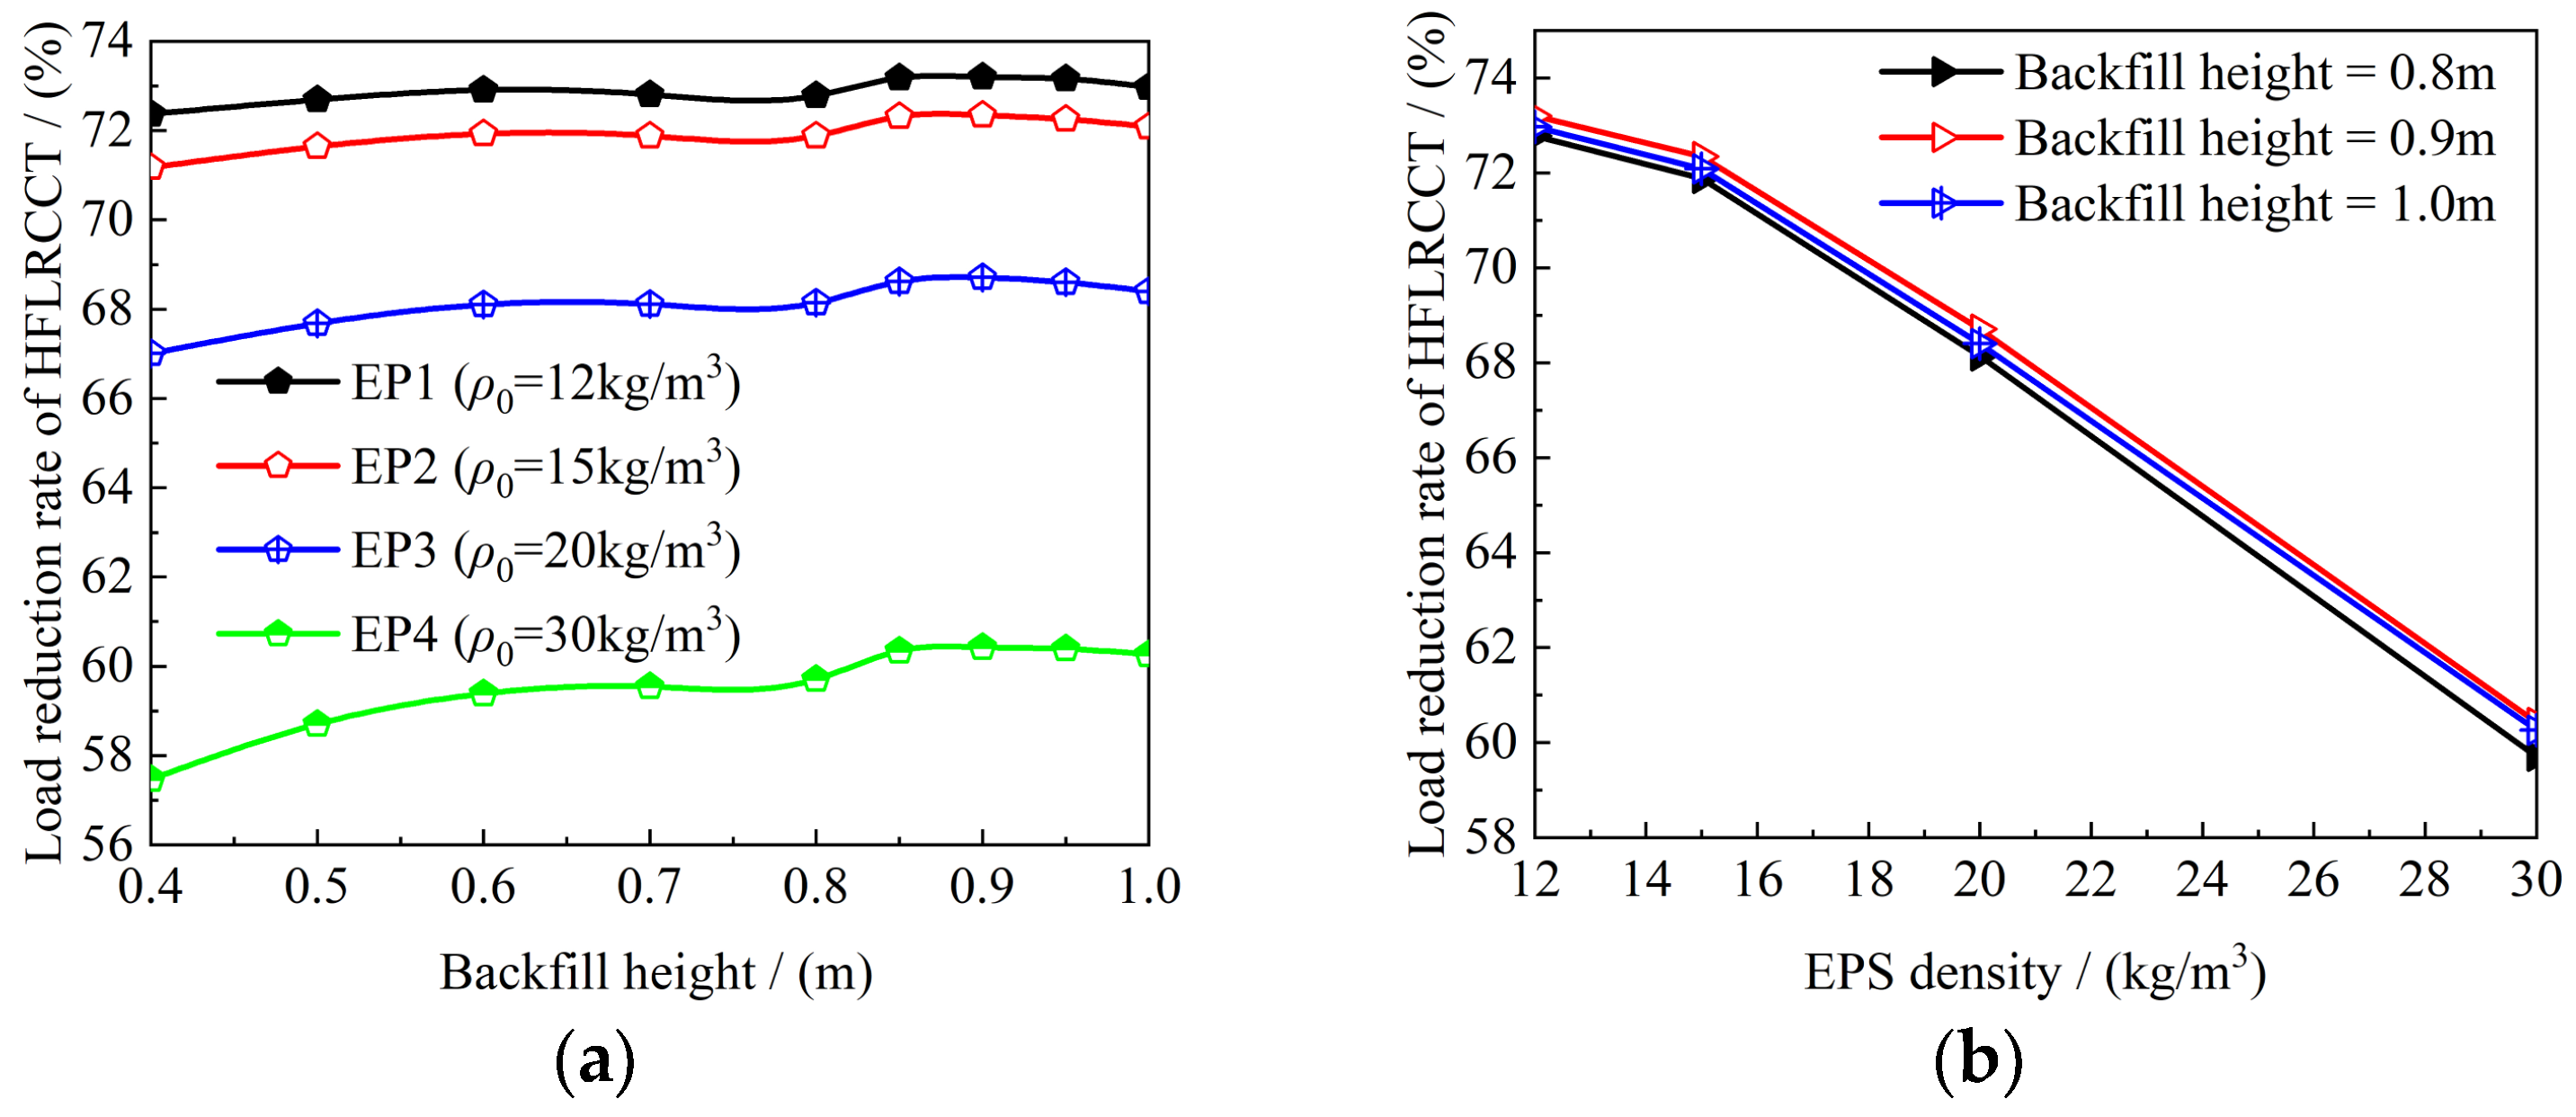
Figure 17 shows the influence of EPS density on load reduction rate. The variation in load reduction rate of each working condition is consistent, and its overall trend is increasing; when the backfill height reaches a certain value, the load reduction rate reaches the maximum, and afterwards, with the increase in backfill height, the load reduction rate slowly decreases. With the increase in the density of EPS, the difference in the stiffness of the EPS layer and the surrounding soil narrows, the load reduction effect decreases, and the load reduction rate shows an overall reduction. Lower EPS density results in higher porosity, softer material, and a smaller compression modulus. Under the same load, low-density EPS can produce greater compressive deformation and absorb more deformation energy, thereby more effectively reducing vertical earth pressure. Furthermore, low-density EPS presents a greater difference in stiffness compared with the surrounding soil, making it easier to generate differential settlement and thus achieve the soil arching effect. Therefore, lower EPS density leads to a better load reduction effect, and the corresponding density correction coefficient (Ed) becomes smaller.
Figure 17.
Influence of EPS density on load reduction rate: (a) variation with backfill height; (b) variation with EPS density.
Figure 18 shows the fitting curves of δ0−p2 for each working condition. A linear correlation between the two is still observed across different working conditions, although the slopes of the fitting curves vary. The information on these fitting curves is shown in Table 12, and all the correlation coefficients (R2) exceed 0.99, indicating excellent fit. Introducing the coefficient Ed to consider the effect of EPS density corrects Equation (21).
Figure 18.
Intrinsic relationship between δ0 and p2.
Table 12.
Information on the fitting curves.
The resulting equation was corrected by analyzing the factors that affect the VEP above the CCT:
Et is the influence coefficient accounting for EPS thickness, and Ed that for EPS density.
5.4. Example Verification
Using the parameters from [17], the proposed formula was applied to an HFLRCCT case. The relevant parameters of the HFCCT, backfill, and EPS were obtained from the same source. From the data in [17], the RDS values (δ) between the interior and exterior soil prisms in the top section of the CCT were calculated to be 0.2397 mm and 0.1599 mm, respectively, and the RDS values (δ0) between the interior and exterior soil prisms in the top section of the EPS layer were −0.1423 mm and −0.1090 mm, respectively.
The CCT had an arched section, with a slope angle of 70° and a groove–width ratio of 3.0. From [22], the influence coefficient for δ was obtained as k = 148.46 kPa/mm, and that for δ0 as K = 147.43 kPa/mm. The EPS thickness was 0.15 m (Et = 1.00), and the EPS density was 12 kg/m3 (Ed = 0.98).
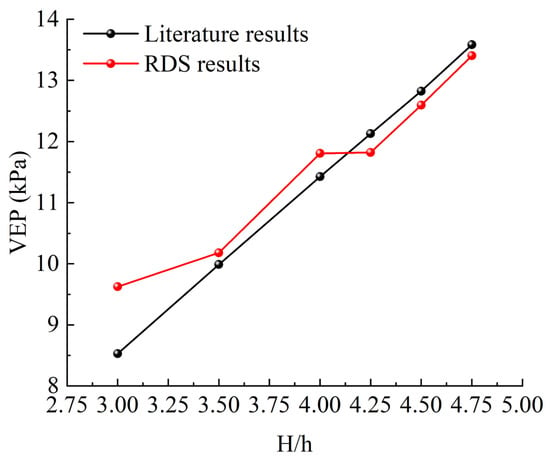
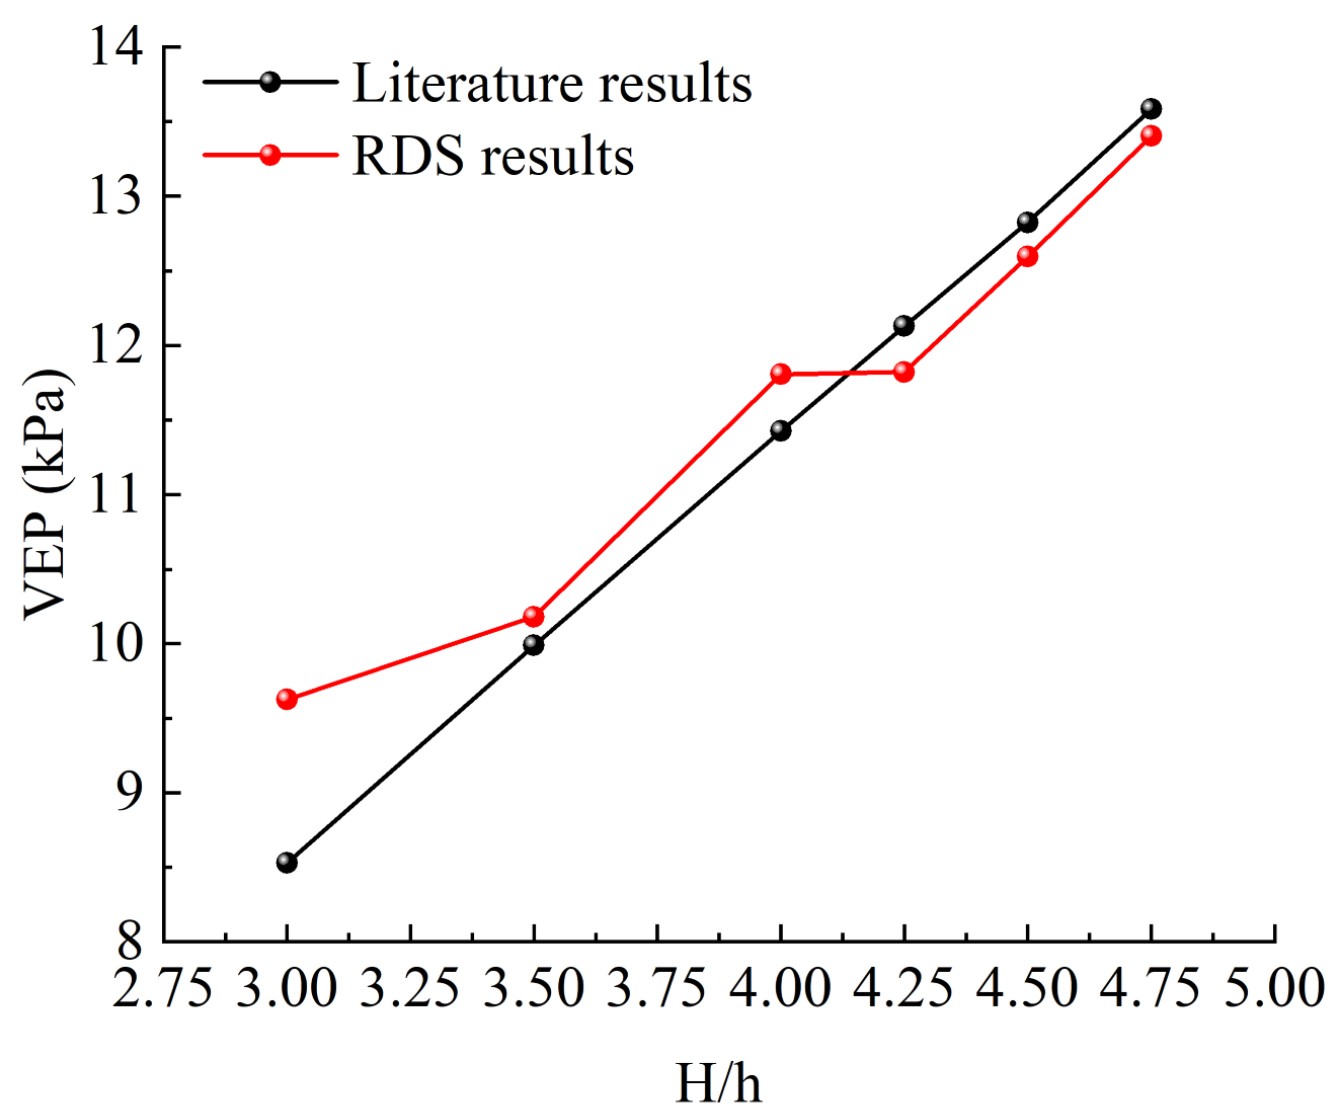
Substituting the relevant parameters into Equation (19) yielded an average VEP above the CCT of 12.00 kPa for working condition S2 [29], where an EPS layer was placed on top of the CCT for load reduction. This value is slightly higher than the literature result of 11.48 kPa, corresponding to an error of only 4.58%. For working condition S3, where an EPS layer was placed on top of the CCT and concrete columns were arranged on the side slopes for load reduction, the calculated VEP was 9.81 kPa, which is only 0.43% higher than the literature value of 9.7675 kPa. Figure 19 compares the calculated earth pressure above the CCT crown with literature results at different backfill heights. The maximum error is only 1.10 kPa, the root mean square error (RMSE) is 0.51 kPa, and the mean absolute percentage error (MAPE) is 4.18%. This good agreement validates the accuracy of the proposed formula.
Figure 19.
Comparison between RDS-based method predictions and literature results.
6. Discussion
In recent years, HFCCTs have been widely used in northwest China, consequently, reducing the earth pressure above these structures has become a key research focus. Similarly to Marston’s approach of laying flexible materials above the culvert to reduce vertical earth pressure, EPS is used to reduce the earth pressure above HFCCTs. The consequent problem of how to calculate the earth pressure after load reduction has been addressed with various approaches based on the available methods; however, the results obtained from the earth column method and Marston theory are large and cannot be directly used for the calculation of earth pressures in HFLRCCTs, while the Platts theory of ground pressure is more suitable for bored tunnels. A study of HFLRCCTs was conducted to address this issue.
The discrete element method was employed to investigate the influence of key factor, i.e., section type, slope angle, and groove–width ratio, and analyze the role of each of them on the load reduction effect. The VEP transfer mechanism in HFLRCCTs was analyzed to further understand the load reduction mechanism of EPS. It was found that the stiffness difference between EPS and backfill leads to relative sliding between the interior and exterior soil prisms, thereby reducing the VEP above the CCT.
Based on this, a mechanical analysis model for HFLRCCTs was established, drawing on Marston’s research on high-fill structures. The VEP calculation method was then derived theoretically, and correctness was verified. However, the complexity of the computational process limits its practical applicability. It was assumed that the VEP above the CCT consists of three components: backfill self-weight, downward additional VEP (p1), and upward VEP (p2). Based on the calculation method for downward VEP established in a previous study [22], the relationship between δ0 and additional VEP was further analyzed. The data revealed a linear positive correlation between RDS and additional VEP, leading to a VEP calculation method based on RDS for HFLRCCTs. Table 13 compares the two methods.
Table 13.
Comparison of the two proposed methods and their applicability.
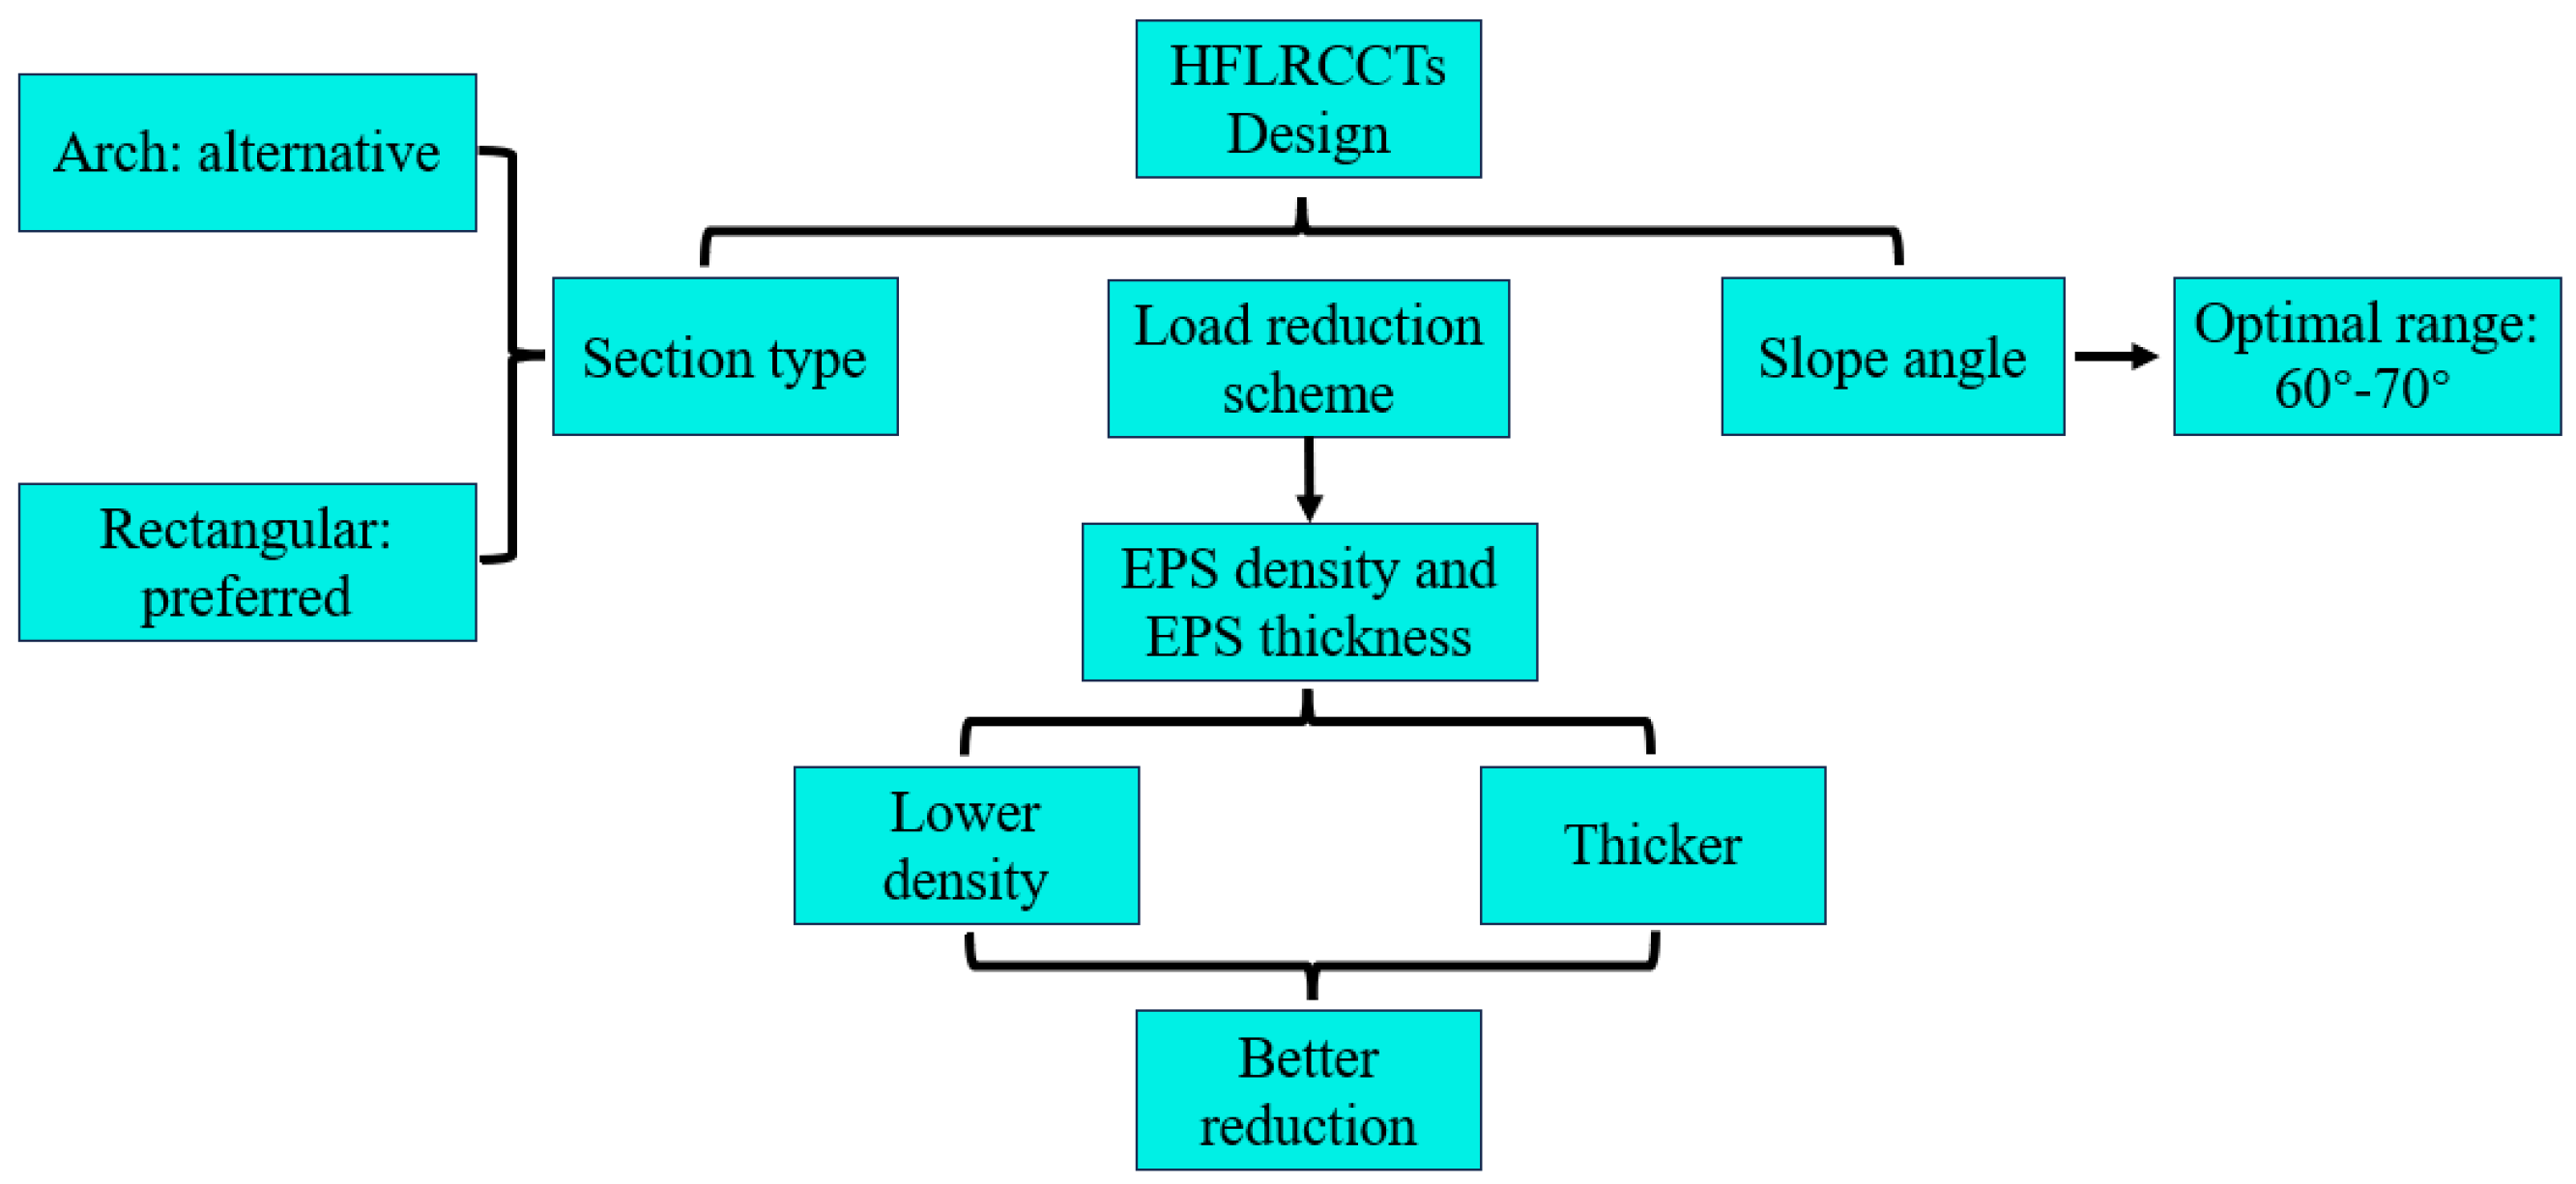
The main contribution of this study compared with existing studies is as follows. Compared with classical Marston theory, the exponential solution in this study is mathematically identical but introduces upward additional earth pressure, p2, caused by EPS compression, extending the theory to load reduction conditions. Compared with refs. [4,15], this study proposes a simplified RDS-based calculation method that avoids complex parameter acquisition and iterative solutions. Compared with ref. [22], this study not only considers downward additional earth pressure (p1) but also introduces upward additional earth pressure (p2), making the method applicable to HFLRCCTs. Compared with refs. [5,6,7,8], this study is consistent in terms of physical mechanisms but further proposes a quantifiable calculation formula. To broaden the applicability of the RDS-based VEP calculation method, the influence of EPS thickness and density on the load reduction effect was investigated. It was found that the load reduction rate first increases and then decreases with the increase in backfill height, indicating that the EPS layer is gradually compressed and becomes fully mobilized at a certain backfill height, beyond this point, its contribution to load reduction diminishes, and the load reduction rate decreases. Greater EPS thickness enhances load reduction, but excessive settlement may compromise the stability of HFLRCCTs. Lower EPS density increases the EPS–backfill stiffness difference, leading to greater RDS and thus a more pronounced load reduction effect. Figure 20 illustrates how to select a load reduction scheme for HFLRCCTs.
Figure 20.
Design decision chart for load reduction in HFLRCCTs.
The proposed RDS-based VEP calculation method was applied to previous research cases to validate its accuracy and identify potential error sources. The results demonstrate that the formula is suitable for the estimation of VEP in HFLRCCTs and can provide a theoretical foundation for the design of HFCCTs and the selection of load reduction schemes. Furthermore, the case study shows that the laying of concrete columns on the side slopes at the two sides of an HFCCT is mainly aimed to reduce the RDS of the interior and exterior soil prisms (δ), to reduce additional VEP p1 caused by δ and thus the VEP on top of the CCT, i.e., the ultimate purpose. To reduce the load, it is first necessary to consider how to reduce the RDS between the interior and exterior soil prisms.
This study has some limitations: (1) the 2D DEM cannot capture end effects; (2) the deformation of the foundation and the CCT was neglected; (3) the actual slip surfaces between soil prisms were log-spiral instead of vertical, which has been experimentally verified in a previous study [29] for deeply buried culverts; (4) HFLRCCTs have a limited range of applicability and are not suitable for all conditions. Future work should include 3D modeling, full-scale validation, extension to broader parameter ranges, and the investigation of soft-foundation conditions and log-spiral slip surfaces.
7. Conclusions
A combination of numerical simulation and theoretical analysis was employed to determine the VEP transfer mechanism in HFLRCCTs, analyze the influence of various factors, and obtain a VEP calculation method based on RDS for HFLRCCTs.
- (1)
- A discrete element model of an HFLRCCT was established to investigate the VEP transfer mechanism and determine the load reduction effect of EPS. This provides a theoretical basis for the design of a load reduction scheme for HFLRCCTs. It was found that, the average VEP on top of the CCT is smaller when the CCT cross-section is rectangular and that the load reduction effect on HFLRCCTs is better when the slope angle is 60–70°.
- (2)
- Drawing on Marston’s theory and the analysis of the VEP transfer mechanism, a mechanical analysis model for HFLRCCTs was established. Mechanical balance equations were derived, leading to a VEP calculation method for HFLRCCTs based on Marston’s theory. The results were compared with numerical simulation to verify the reasonableness of the proposed method.
- (3)
- In HFLRCCTs, the VEP above the CCT consists of three components: backfill self-weight, downward additional VEP (p1) induced by RDS in the top section of the CCT (δ), and upward additional VEP (p2) induced by RDS in the top section of the EPS layer (δ0). δ0 has a larger action, and the upward additional VEP is larger and plays a dominant role. A linear correlation was observed between RDS and additional VEP, leading to the proposal of an RDS-based VEP calculation method for HFLRCCTs. To broaden its applicability, the formula was modified to account for the influence of EPS properties. The proposed method was then applied to previous research cases, validating its accuracy and enabling the analysis of potential error sources. The validation results show good agreement between the predicted and literature values, with a maximum error of only 1.10 kPa, a root mean square error (RMSE) of 0.51 kPa, and a mean absolute percentage error (MAPE) of 4.18%.
- (4)
- The thickness and density of EPS influence its load reduction effect. As the backfill height increases, EPS becomes active, and the load reduction rate gradually rises. Upon reaching a certain height (H/h = 9/2), the EPS layer is fully mobilized. With a further increase in the backfill height, the load reduction rate begins to decrease. Within the tested ranges (EPS thickness of 0.1–0.2 m), thicker EPS layers enhance load reduction, but the improvement diminishes beyond 0.15 m (increasing from 0.10 m to 0.15 m improves the rate by 4%, while an increase from 0.15 m to 0.20 m improves it by only 1.5%). A lower EPS density (12–20 kg/m3) increases the EPS–backfill stiffness difference, leading to greater RDS and a better load reduction effect. For practical design, the proposed RDS-based formula is applicable under the following conditions: a slope angle of 60–70°, a groove–width ratio of 2.5–3.5, an EPS thickness of 0.1–0.2 m, and an EPS density of 12–30 kg/m3.
- (5)
- This study has several limitations, including the use of the 2D DEM (which cannot capture end effects near tunnel portals), the rigid body assumption, and the lack of experimental validation. Future work should address these limitations with 3D modeling, full-scale validation, and investigation of the long-term behavior and creep effects of EPS.
Author Contributions
Conceptualization, methodology, software, formal analysis, validation, Y.H.; supervision, project administration, funding acquisition, J.X.; supervision, data curation, S.L.; writing—original draft preparation, writing—review and editing, Y.H. and J.X. All authors have read and agreed to the published version of the manuscript.
Funding
This work was supported by the Youth Innovation Team of Shaanxi Universities (2023–2026).
Data Availability Statement
The data presented in this study are available on request from the corresponding author. The data are not publicly available due to the ongoing nature of research project, and further related studies are still in progress.
Conflicts of Interest
The authors declare no conflicts of interest.
Abbreviations
The following abbreviations are used in this manuscript:
| HFLRCCTs | High-fill load reduction cut-and-cover tunnels |
| EPS | Expanded polystyrene board |
| RDS | Relative differential settlement |
| VEP | Vertical earth pressure |
| HFCCTs | High-fill cut-and-cover tunnels |
| CCTs | Cut-and-cover tunnels |
Nomenclature
| Symbol | Description | Unit |
| P | VEP above CCT after load reduction | kPa |
| P* | VEP above CCT before load reduction | kPa |
| P1–P8 | VEP for soil I–soil VIII | kPa |
| δ1–δ8 | Settlement for soil I–soil VIII | mm |
| α | The relative friction between the backfill layers | / |
| α0 | The relative friction between the backfill layers and EPS | / |
| α1 | The relative friction between the backfill and CCT | / |
| β | A friction mobilization coefficient | / |
| Hc | The plane of equal settlement height | m |
| ℎc | EPS thickness | m |
| δ | The RDS between interior and exterior soil prisms at the top section of the CCT | mm |
| δ0 | The RDS between interior and exterior soil prisms at the top section of the EPS | mm |
| p1 | The downward additional VEP induced by δ | kPa |
| p2 | The upward additional VEP induced by δ0 | kPa |
| K | The influence coefficient of RDS | kPa/mm |
| Et | Thickness influence coefficient of EPS | / |
| Ed | Density influence coefficient of EPS | / |
References
- Marston, A. The Theory of External Loads on Closed Conduits in the Light of the Latest Experiments; Iowa State College: Ames, IA, USA, 1930. [Google Scholar]
- McAffee, R.P.; Valsangkar, A.J. Field performance, centrifuge testing, and numerical modelling of an induced trench installation. Can. Geotech. J. 2008, 45, 85–101. [Google Scholar] [CrossRef] [Scilit]
- McGuigan, B.L.; Valsangkar, A.J. Centrifuge testing and numerical analysis of box culverts installed in induced trenches. Can. Geotech. J. 2010, 47, 147–163. [Google Scholar] [CrossRef] [Scilit]
- Li, S.; Ho, I.H.; Ma, L.; Yao, Y.X.; Wang, C.D. Load reduction on high-fill cut-and-cover tunnel using discrete element method. Comput. Geotech. 2019, 114, 103149. [Google Scholar] [CrossRef] [Scilit]
- Li, S.; Zhao, L.L.; Ho, I.-H.; Ning, G.X.; Yu, B.T.; Wang, C.D. Influence of Structural Shape on Earth Pressure for High-fill Cut-and-Cover Tunnel with and without Load reduction Based on Discrete Element Method. Adv. Civ. Eng. 2020, 2020, 8877873. [Google Scholar] [CrossRef] [Scilit]
- Hajiazizi, M.; Flamarz Arkawazi, S.A. Experimental investigation of the effect of using expanded polystyrene geofoam and geogrid in different forms on vertical earth pressure on high-filled cut-and-cover roadway tunnel. Cogent Eng. 2024, 11, 2326753. [Google Scholar] [CrossRef] [Scilit]
- Hajiazizi, M.; Flamarz Arkawazi, S.A. Lateral Earth Pressure Reduction on High-Filled Cut-and-Cover Tunnels Using Expanded Polystyrene Geofoam and Tire-Derived Aggregate. Passer J. Basic Appl. Sci. 2024, 6, 92–106. [Google Scholar]
- Kilic, H.; Bicer, P.; Bozkurt, S. A Numerical Investigation of Induced and Embedded Trench Installations for Large-Diameter Thermoplastic Pipes under High Fill Stresses. Appl. Sci. 2023, 13, 3040. [Google Scholar] [CrossRef] [Scilit]
- Marston, A.; Anderson, A.O. The Theory of Loads on Pipes in Ditch and Tests of Cement and Clay Drain Tile and Sever Pipe; Iowa State College: Ames, IA, USA, 1913. [Google Scholar]
- Spangler, M.G. Underground conduits—An appraisal of modern research. Trans. Am. Soc. Civ. Eng. 1948, 113, 316–345. [Google Scholar] [CrossRef] [Scilit]
- Spangler, M.G. A theory on loads on negative projecting conduits. Highw. Res. Board Proc. 1951, 30, 153–161. [Google Scholar]
- Gu, A.Q. Study on vertical earth pressure of buried pipes and caverns. Chin. J. Geotech. Eng. 1981, 3, 3–15. [Google Scholar]
- Zeng, G.X. Calculation of vertical soil pressure on culverts under earth dikes. J. Zhejiang Univ. Eng. Sci. 1960, 4, 79–97. [Google Scholar]
- Zheng, J.J.; Wang, H.B.; Zhang, J.; Shen, J.M. Calculate of earth pressure on top of culvert considering loess seismic subsidence. J. Huazhong Univ. Sci. Technol. Nat. Sci. Ed. 2013, 41, 53–57. [Google Scholar]
- Li, S. Study on Vertical Earth Pressure Characteristic and Calculation Method of Unloading Structure for High Fill Loess Open Cut Tunnel. Ph.D. Thesis, Lanzhou Jiaotong University, Lanzhou, China, 2015. (In Chinese) [Google Scholar]
- Zhuo, B.; Wang, F.Y.; Fang, Y.; Chen, Y.; Ning, G.X. Analysis of Cracking Development and Mechanical Characteristics of High-fill Cut-and-Cover Tunnel. KSCE J. Civ. Eng. 2020, 24, 2519–2532. [Google Scholar] [CrossRef] [Scilit]
- Li, S.; Yao, Y.X.; Ho, I.H.; Ma, L.; Wang, Q.C.; Wang, C.D. Coupled Effect of Expanded Polystyrene and Geogrid on Load reduction for High-fill Cut-and-Cover Tunnels Using the Discrete-Element Method. Int. J. Geomech. 2020, 20, 04020052. [Google Scholar] [CrossRef] [Scilit]
- Zhuo, B.; Zhu, M.Y.; Fang, Y.; Wang, F.Y.; Yao, Y.X.; Li, S. Numerical and experimental analyses for rubber-sand particle mixtures applied in high-fill cut-and-cover tunnels. Constr. Build. Mater. 2021, 306, 124874. [Google Scholar] [CrossRef] [Scilit]
- Li, S.; Han, G.Q.; Ho, I.H.; Ma, L.; Wang, Q.C.; Yu, B.T. Coupled Effect of Cross-Sectional Shape and Load reduction on High-fill Cut-and-Cover Tunnels Considering Soil–Structure Interaction. Int. J. Geomech. 2020, 20, 04020082. [Google Scholar] [CrossRef] [Scilit]
- Yao, Y.X.; Fang, Y.; Li, S.; Zhuo, B. Analysis of Mechanical Behavior of Lining Structure of High-fill Cut-and-Cover Tunnel Based on DEM. Arab. J. Sci. Eng. 2022, 47, 12729–12743. [Google Scholar] [CrossRef] [Scilit]
- Li, S.; Jiani, Y.C.; Ho, I.H.; Ma, L.; Wang, Q.C.; Yu, B.T. Experimental and Numerical Analyses for Earth Pressure Distribution on High-fill Cut-and-Cover Tunnels. KSCE J. Civ. Eng. 2020, 24, 1903–1913. [Google Scholar]
- Li, S.; He, Y.Z.; Ho, I.H.; Ma, L.; Yang, W.B.; Wang, C.D. Method of Average Vertical Earth Pressure for HFCCTs Based on Differential Settlement. Arab. J. Sci. Eng. 2024, 50, 8299–8315. [Google Scholar] [CrossRef] [Scilit]
- Zhuo, B.; Li, S.; He, C.; Wang, H.; Wang, Q.C.; Ma, L. Study on Mechanical Characteristics and Section Design of Trench Type Open-cut Tunnel Lining Structure with Deep Covering Soil under Load Reduction. Mod. Tunn. Technol. 2019, 56, 79–87. [Google Scholar]
- Duskov, M. Materials research on EPS20 and EPS15 under representative conditions in pavement structures. Geotext. Geomembr. 1997, 15, 147–181. [Google Scholar] [CrossRef] [Scilit]
- Lai, H.J.; Zheng, J.J.; Zhang, J.; Zhang, R.J.; Cui, L. DEM analysis of “soil”-arching within geogrid-reinforced and unreinforced pile-supported embankments. Comput. Geotech. 2014, 61, 13–23. [Google Scholar] [CrossRef] [Scilit]
- Zheng, J.J.; Zhao, J.B.; Chen, B.G. Vertical earth pressure on culverts under high embankments. Chin. J. Geotech. Eng. 2009, 31, 1009–1013. [Google Scholar]
- Yao, Y.X. Analysis on Meso-Mechanism of Soil Arching for Unloading Structure of High-fill Cut-and-Cover Tunnel Based on DEM. Master’s Thesis, Lanzhou Jiaotong University, Lanzhou, China, 2020. (In Chinese) [Google Scholar]
- Bjerrum, L. Imperfect trench installations for conduits. In Proceedings of the 4th International Conference on Soil Mechanics and Foundation Engineering, London, UK, 12–24 August 1957; pp. 119–124. [Google Scholar]
- Shimamura, K.; Nishio, N.; Takagi, N.; Hyodo, M. Earth pressure for working on buried pipes under protruding conditions. Proc. Jpn. Soc. Civ. Eng. 1987, 1987, 179–188. [Google Scholar] [CrossRef] [Scilit]

Disclaimer/Publisher’s Note: The statements, opinions and data contained in all publications are solely those of the individual author(s) and contributor(s) and not of MDPI and/or the editor(s). MDPI and/or the editor(s) disclaim responsibility for any injury to people or property resulting from any ideas, methods, instructions or products referred to in the content. |
© 2026 by the authors. Licensee MDPI, Basel, Switzerland. This article is an open access article distributed under the terms and conditions of the Creative Commons Attribution (CC BY) license.