


Abstract
This study investigates the differential deformation of an existing subway station and dense adjacent buildings induced by deep and large loess foundation-pit excavation under dewatering conditions. A deep foundation pit adjacent to Hepingmen Station of Xi’an Metro Line 4 was selected as the engineering case. A finite-element model accounting for seepage–stress coupling was built in PLAXIS 2D on the basis of saturated–unsaturated seepage theory, the effective-stress principle, and soil–structure interaction, and its reliability was validated against field monitoring data. The results reveal that pit dewatering raises the effective stress of the surrounding soils. The ground-surface settlement reaches 5–8 mm on the building-adjacent side but only 2–4 mm on the subway-station side, equivalent to 40–50% of the former. Owing to the sheltering effect of the rigid subway-station structure, the dewatering-affected zone shrinks from 35–40 m on the building side to 15–20 m on the subway side. Excavation generates a groove-shaped settlement trough on the building side, with an influence zone of 20–30 m (i.e., 1.0–1.5H), whereas a right-angle-trapezoidal settlement profile develops on the subway side, whose influence zone is limited to 10–15 m (i.e., 0.5–0.75H), where H denotes the excavation depth. The retaining piles on the subway side exhibit cantilever-dominated deformation with the peak displacement at the pile head, whereas those on the building side display a mid-bulging mode, with the maximum deflection occurring 10–15 m below the ground surface. Field monitoring demonstrates that horizontal displacements respond sensitively to construction sequences, while building-settlement responses develop over several days to about one week after the corresponding construction stage. The maximum displacement rate on the subway side is roughly 62.6% of that recorded on the building side at the same cross-section. A revised empirical formula is proposed for predicting ground-surface settlement. The findings can provide practical references for the support design and deformation control of deep and large foundation pits adjacent to subway stations in loess regions.
1. Introduction
With the rapid exploitation of urban underground space, deep and large foundation pits are frequently constructed in close proximity to pre-existing subway stations, tunnels, and dense building clusters. Such projects are characterized by considerable excavation depths, complicated surrounding environments, and stringent deformation-control thresholds, which pose prominent challenges in both design and construction. Loess is characterized by its large pores, collapsibility, water sensitivity, and metastable structure. Under the combined action of dewatering and excavation, the stress state, seepage field, and deformation field of the soil outside the pit undergo complex evolutions, further inducing differential displacements of adjacent subway facilities and buildings. Excessive deformation will endanger subway operational safety and the serviceability of nearby buildings.
Regarding dewatering-induced deformation in loess foundation pits, Mei et al. [1] performed a fluid–solid coupled numerical simulation to analyze the ground-surface settlement caused by the dewatering and excavation of a deep pit in soft-plastic loess strata in Xi’an. They reported that the post-dewatering settlement curve exhibits a triangular distribution, with the maximum settlement occurring within 0.6H outside the pit and a total influence extent of up to 1.5H; the dewatering effect on saturated soft loess is pronounced, yet its improvement of the large-pore characteristics remains limited. Ma et al. [2] found through numerical analysis that the settlement induced by dewatering of a subway-station pit in loess strata accounts for approximately one-third of the total ground settlement. Deng et al. [3] established a practical calculation method for dewatering settlement in saturated loess strata, pointing out that such settlement predominantly occurs in compacted saturated loess that retains its large-pore structure. Hu et al. [4] proposed a simplified algorithm for land subsidence induced by dewatering within the phreatic aquifer of a deep loess foundation pit. Furthermore, a statistical study of 31 collapsible-loess foundation pits in Xi’an [5] showed that the maximum ground settlement mainly ranges from 5 to 20 mm and the lateral deflection of retaining piles from 5 to 15 mm, and a new Gaussian empirical formula was proposed based on the relationship between settlement and excavation depth. Zhang [6], taking a deep foundation pit in the Lanzhou New Area as the research object, combined finite-element simulation with field monitoring and demonstrated that the pile-anchor support system can effectively control pit deformation, with the maximum pile-head horizontal displacement being 10.7 mm, far below the code-specified warning threshold.
Concerning the sheltering effect of excavation adjacent to subway stations, Zhu et al. [7] demonstrated through finite-element simulation that the “sheltering effect” of a subway station becomes increasingly pronounced with increasing excavation depth when the pit–station distance is small. Ma et al. [8] developed a refined three-dimensional numerical model of a Tianjin transportation hub project and revealed the remarkable sheltering behavior of a shared-wall subway station acting on adjacent bridge pile foundations: this effect transfers the maximum lateral pile displacement from the pile head to the pile toe and reduces the overall deformation. Mao et al. [9] investigated the deformation responses of adjacent subway structures induced by pit excavation under different support forms, noting that most existing studies focus on soft-soil regions, while coupled-deformation research on subway stations and tunnels in loess regions remains insufficient. Lai et al. [10] calibrated the parameters of a small-strain hardening-soil model through CPTU and SDMT in situ tests and found that the tunnel lining can mitigate ground movement and wall deflection through a “barrier effect.” Chen et al. [11] found via numerical simulation that, owing to the shielding effect of adjacent underground structures, the horizontal displacement of the diaphragm wall on the limited-soil side is smaller than that on the unlimited-soil side. Regarding the influence of pre-existing underground structures on the dewatering seepage field, Xue et al. [12] confirmed that buried structures exert a substantial barrier effect on groundwater flow and stratum movement induced by dewatering and excavation.
In terms of pit-deformation prediction, Huang et al. [13] proposed a multi-objective XGBoost model for ground-surface settlement, station settlement and pit deformation; Hu et al. [14] developed an LSTM-RA-ANN model for building settlement; and Fan et al. [15] established optimized LSTM models for the lateral displacement of deep pits and a machine-learning framework for lateral-collapse risk assessment. These data-driven methods require a large number of training cases and provide limited physical insight into the deformation mechanism. This limitation motivates the mechanically based analysis, combined with a simple empirical formula, that is adopted in the present study.
With regard to numerical analysis methods, the Hardening Soil (HS) model is widely used in deep-excavation analysis because it reproduces the stress-dependent stiffness and the plastic shearing of soils, distinguishes loading from unloading–reloading behavior, and requires only conventional oedometer and triaxial tests for parameter determination. Studies have shown [16,17] that the soil around a deep excavation is mostly in a small shear-strain state; when the additional small-strain parameters can be reliably calibrated, the small-strain stiffness extension (HSS) of the HS model can further capture the nonlinear stiffness decay in this range. Lai et al. [10], Guo et al. [18] and Hsu et al. [19] calibrated and applied this model in deep-excavation analyzes.
Regarding the deformation monitoring of adjacent buildings, Hsu et al. [19] found through finite-element analysis that the presence of adjacent buildings significantly alters the ground-settlement pattern, with settlement being more pronounced at buildings close to the diaphragm wall. Research on building settlement induced by deep excavation in saturated soft loess strata [20] has shown that a pile-anchor support system combined with dewatering measures can effectively ensure building safety, and that building settlement can be divided into three stages: uniform deformation, differential deformation, and stabilization.
In summary, existing studies have mostly focused on either isolated excavation or isolated dewatering conditions. Research on the bilateral differential deformation of adjacent subway stations and buildings under the coupled dewatering–excavation action in loess regions remains insufficient, particularly the quantitative understanding of how the structural stiffness of a subway station shields the transmission of ground settlement. Existing empirical prediction formulas were mostly developed for soft-soil areas, and their applicability to loess regions requires further verification. Although machine-learning-based prediction methods have developed rapidly, their complementary relationship with physically based empirical formulas has yet to be fully explored.
Against this background, this paper selects a deep and large foundation pit adjacent to Hepingmen Station of Xi’an Metro Line 4 as the engineering case [21]. A soil–structure interaction finite-element model considering dewatering seepage–stress coupling is established and validated against field-monitoring data. On this basis, the differential-deformation mechanism between the subway side and the building side under dewatering and excavation is revealed, and influence-zone partitioning criteria together with a modified ground-settlement prediction formula are proposed. The findings can provide a reference for the support design and deformation control of deep and large foundation pits adjacent to subway stations in loess regions.
The novelty of this study relative to the above work is threefold. First, whereas previous loess dewatering studies quantified the settlement caused by drawdown alone and previous subway-adjacent excavation studies quantified the sheltering effect for a single side, the present work quantifies both effects on the two sides of the same pit under the coupled action of dewatering and excavation and separates their relative contributions. Second, the sheltering effect is quantified in terms of the reduction of both the settlement magnitude (to 40–50% of that on the building side) and the extent of the influence zone (from 35–40 m to 15–20 m for dewatering and from 20–30 m to 10–15 m for excavation), which provides a quantitative basis for delimiting the protection zone of an operating station. Third, a modified empirical settlement-prediction formula with physically meaningful coefficients is proposed for the two sides separately, and its accuracy is quantified against both the monitoring data and the numerical results (R2 = 0.96 on the building side), which is not available in the existing loess formulas that were developed for a single excavation side.
2. Engineering Background
2.1. Project Overview
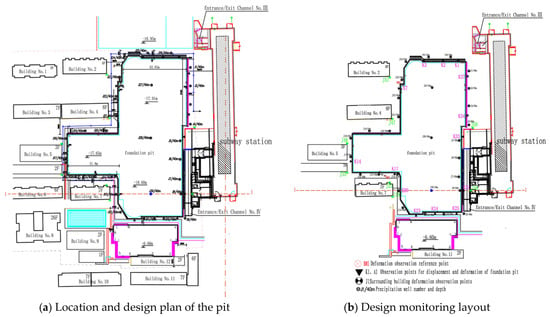
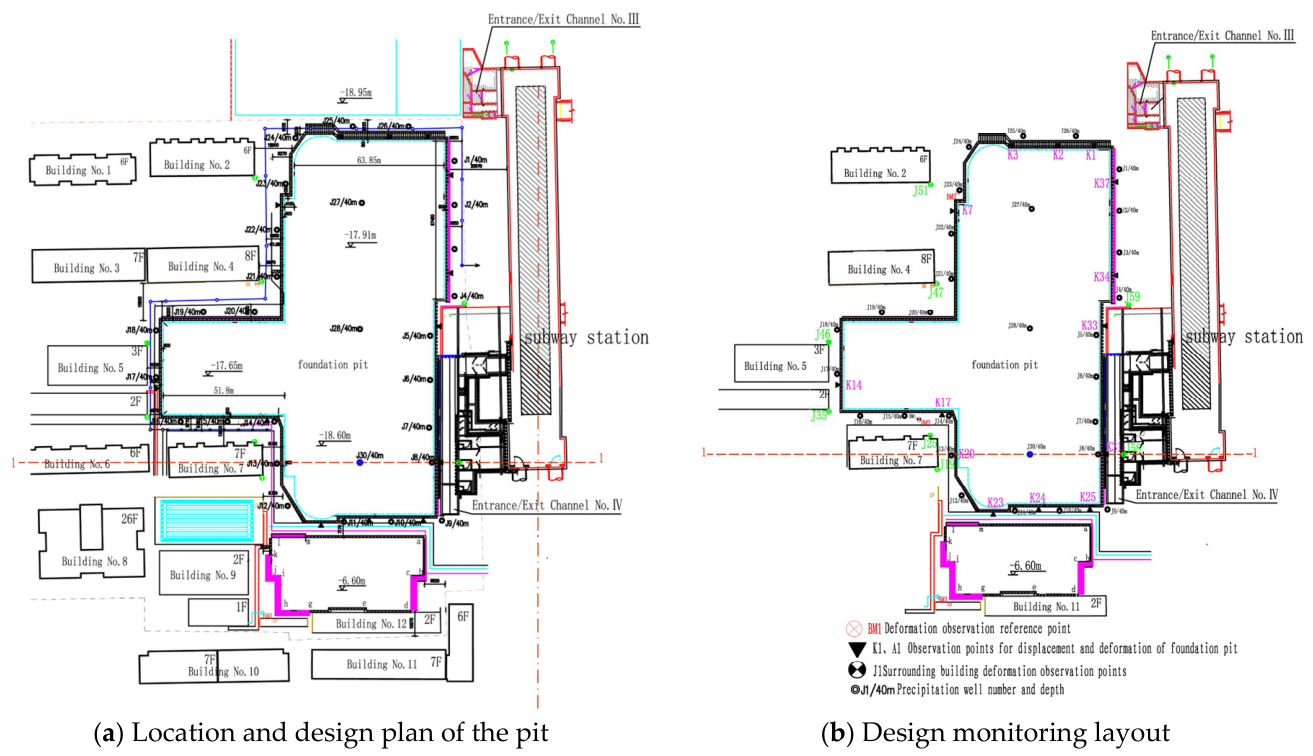
The foundation pit is located on the west side of Yanta North Road outside Hepingmen in Xi’an. The project comprises a comprehensive building and its fully underground annex. The comprehensive building has up to 14 stories with a total height of 59.6 m; it adopts pile foundations or beam–raft foundations, with three basement levels and a foundation depth of approximately −15.5 m. The fully underground portion is a frame structure supported by beam–raft foundations, also with three basement levels and a foundation depth of approximately −15.0 m. The pit for the comprehensive building is approximately rectangular in plan, measuring about 160.3 m × 54.4 m, with design excavation elevations of −17.91 m and −18.60 m. The pit for the western fully underground portion measures approximately 51.8 m × 40.8 m in plan, with an excavation elevation of −17.65 m [21].
2.2. Surrounding Environment
The surrounding environment of this deep foundation pit is extremely complex, with numerous underground utilities. To the north lies the under-construction Shengli Hotel foundation pit, excavated to a depth of 18.95 m, with a minimum horizontal clearance of 6.0 m from the project pit. Dense high-rise buildings occupy the western side: the No. 4 Geological Data Exhibition Building has one basement level and uses bored-pile foundations, while the remaining test building, Building No. 18, and property-office building rest on lime–soil cushion foundations. To the south is a staff residential building with a pit design depth of 6.6 m, planned to be constructed simultaneously with the project pit, at a minimum horizontal clearance of 7.0 m. On the eastern side is the entrance/exit of the soon-to-open Hepingmen Station of Xi’an Metro Line 4, which is a key-protected object. The surrounding environment of the pit is detailed in the site plan and monitoring layout [21] (Figure 1).
Figure 1.
Layout plan of the construction site and monitoring arrangement.
2.3. Engineering Geology and Hydrogeological Conditions
The site geomorphology belongs to the loess-ridge unit of the Xi’an loess ridge-depression landform, with flat topography. The main strata within the influence depth of the pit are summarized as follows: ① fill: the upper part consists of miscellaneous fill containing numerous old building foundations and backfill, locally plain fill, with uneven thickness and disordered structure, layer thickness 0.60–7.70 m; ② loess: homogeneous soil with well-developed macropores, containing scattered snail-shell fragments and plant roots, collapsible, layer thickness 0.80–7.00 m; ③ loess: homogeneous soil with well-developed macropores and a small amount of calcareous concretions, collapsible, layer thickness 8.70–11.90 m; ④ paleosol: homogeneous soil with a granular structure, abundant calcareous streaks, and a small amount of calcareous concretions, layer thickness 13.70–15.50 m; ⑤ loess: homogeneous soil with well-developed needle-like pores, scattered snail shells, and calcareous concretions, layer thickness 6.60–11.20 m; ⑥ paleosol: homogeneous soil with well-developed small and needle-like pores and a small amount of calcareous concretions, layer thickness 1.50–4.80 m; ⑦ silty clay: homogeneous soil containing scattered snail shells, mica flakes, iron–manganese mottles, and calcareous concretions, layer thickness 6.00–13.10 m. The thicknesses and main physical and mechanical parameters of each soil layer are listed in Table 1 [21]; the thickness ranges quoted in the text and in Table 1 are true layer thicknesses, not depth intervals, and the corresponding depth intervals are obtained by accumulating them downward from the ground surface. The interpretation of such heterogeneous layered profiles and the laboratory characterization of the constituent geomaterials follow the procedures reported in previous studies [22,23].
Table 1.
Main physical and mechanical parameters of the soil layers.
During the site investigation, the stable phreatic water table was measured at burial depths of 14.70–17.60 m. Based on regional data, the annual groundwater fluctuation is 1.5–2.0 m. According to local experience, the permeability coefficient of the cohesive-soil aquifer in layers ⑤–⑦ at the proposed site is 5 m/d.
3. Support Design of the Foundation Pit
3.1. Foundation Pit Dewatering
Tube-well dewatering was adopted. A total of 30 dewatering wells were installed, including 26 outside the pit at a spacing of approximately 20.0–22.0 m and 4 wells inside the pit that serve both for dewatering and for water-level observation. The borehole diameter is 0.8 m, and the well depth is 35.0 m measured from the natural ground surface.
3.2. Support Structure Design
Given the unique and complex characteristics of this deep foundation pit, the 1-1 pit cross-section was selected as the research object to analyze simultaneously the influence of excavation on the subway station, buildings, and other surrounding environments.
3.2.1. Support on the Building Side
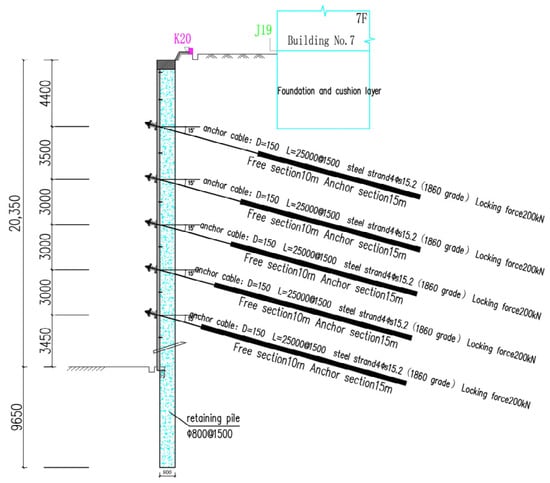
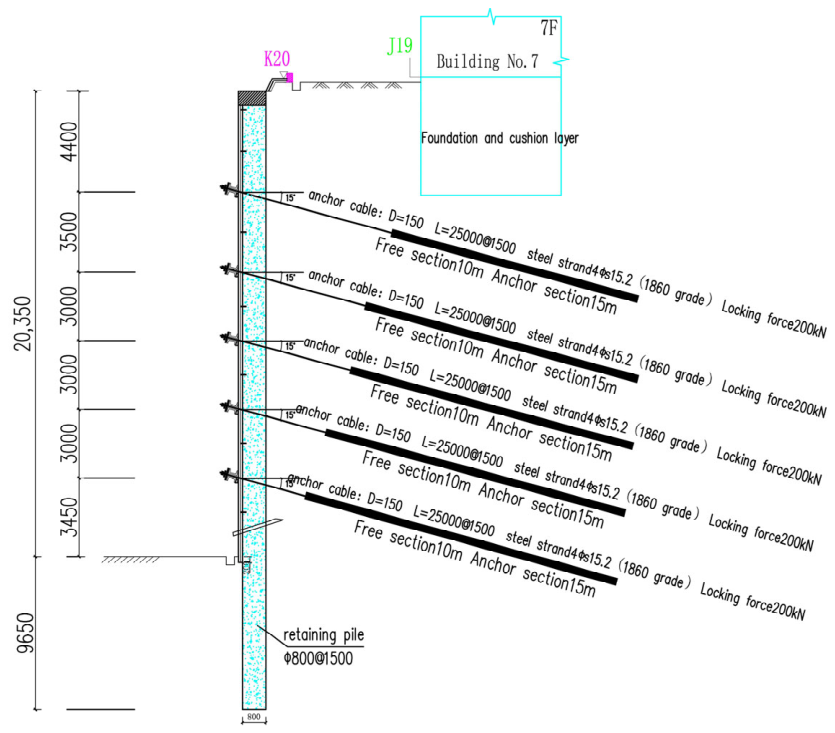
The west side of the pit, adjacent to buildings, is supported by a soldier-pile row with prestressed anchor cables. The retaining piles are 30 m long and 0.8 m in diameter, spaced at 1.6 m center-to-center, with an embedded depth of 9.6 m. The main reinforcement consists of 20Φ25 HRB400 bars, and the concrete is C30. The capping beam has a cross-section of 600 mm × 900 mm. Five rows of prestressed anchor cables are provided, each 25 m long, assembled with four φs15.2 (1860-grade) high-strength steel strands and installed at an inclination angle of 15° with a prestress of 180–200 kN. The anchor boreholes are 150 mm in diameter and are grouted with M20 cement grout. The soil between piles is sealed with shotcrete reinforced by a two-way Φ6@250 × 250 HPB300 steel mesh; the shotcrete is 100 mm thick with a concrete strength grade of C25 [21]. The support cross-section is shown in Figure 2.
Figure 2.
Support cross-section on the west side (building side) (Unit: mm).
3.2.2. Support on the Subway Station Side
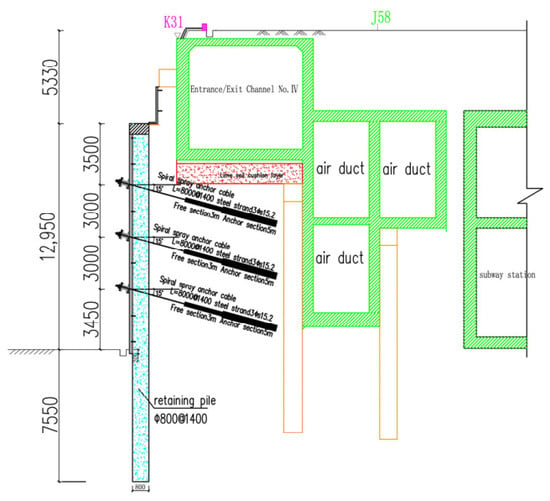
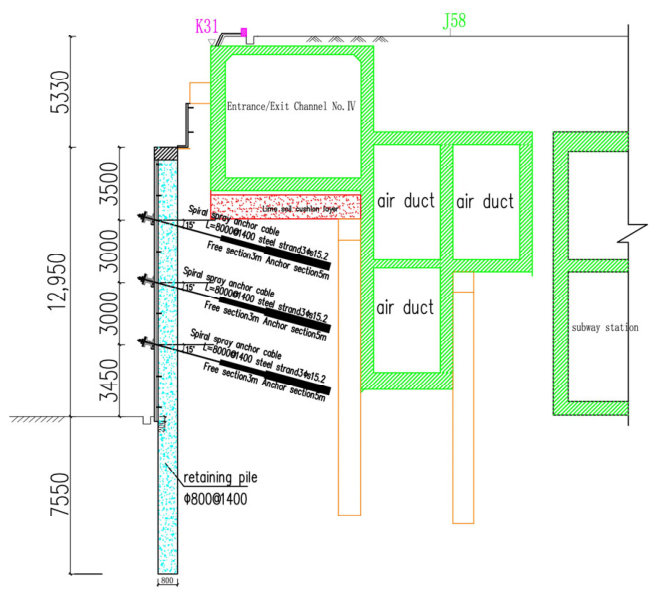
The east side of the pit is adjacent to the air duct, the No. IV access passage, and the temporary surface exhaust hood of Metro Line 4. The underground structure of the project is only 0.9 m from the outer surface of the subway station structure, and a sewage pipe is buried below ground level; the site conditions are extremely demanding. The east side is supported by soldier piles combined with prestressed jet-grouting anchor cables. The retaining piles are 20.5 m long and 0.8 m in diameter, spaced at 1.4 m, with an embedded depth of 7.55 m. The capping beam has a cross-section of 600 mm × 900 mm. Three rows of jet-grouting anchor cables are provided, each 7.5 m long, with a prestress of 80 kN [21]. A typical cross-section of the support structure on the east side adjacent to the subway station is shown in Figure 3.
Figure 3.
Support cross-section on the east side (subway station side) (Unit: mm).
4. Theoretical Framework and Numerical Model
4.1. Dewatering Seepage–Stress Coupling Theory
During pit dewatering, the hydraulic-head difference between the interior and exterior of the pit drives groundwater seepage toward the dewatering wells. The pore-water pressure in the soil decreases while the effective stress increases, which in turn causes soil consolidation and ground settlement. The governing equation for saturated–unsaturated seepage [24,25] can be expressed as:
where kr is the relative permeability; ks is the saturated permeability; h is the pressure head; z is the elevation head; Q is the source/sink term; and C(h) is the specific storage.
The unsaturated hydraulic properties were described with the van Genuchten–Mualem model. For the loess and paleosol layers (②–⑥) the fitted water-retention parameters are α = 0.008–0.015 kPa−1, n = 1.35–1.60, θs = 0.42–0.46 and θr = 0.05–0.08, giving m = 1 − 1/n and a relative permeability kr(S) = S1/2[1 − (1 − S1/m)m]2, where S = (θ − θr)/(θs − θr); the fill (①) and the silty clay (⑦) were treated as nearly saturated (α = 0.02 kPa−1, n = 1.30). The saturated permeability coefficients of the layers are listed in Table 2 (kx/ky = 1). The initial pore-pressure field was hydrostatic below the measured phreatic level (14.70–17.60 m) and negative (suction) above it, in equilibrium with the measured water table.
Table 2.
Hydraulic and HS constitutive parameters of the soil layers.
Suction is not introduced as an independent stress variable. Above the phreatic surface, the pore pressure p is negative (p < 0), and it enters the effective-stress definition of Equation (2) directly, so that the decrease in pore pressure caused by dewatering produces an increase in effective stress and hence compression of the soil skeleton. The seepage and deformation analyses are not performed sequentially: PLAXIS 2D performs a consolidation-type coupled analysis in which the pore-pressure field obtained from the unsaturated seepage equation is updated at every calculation step and is used directly in the effective-stress formulation of the HS model. No separate suction-dependent effective-stress parameter (χ or Bishop parameter) is introduced, which is a simplification of unsaturated behavior and is discussed in Section 6.
According to Terzaghi’s effective stress principle [26]:
where σ′ij is the effective stress tensor; σij is the total stress tensor; δij is the Kronecker delta (δij = 1 for i = j and δij = 0 for i ≠ j); and uw is the pore water pressure. Dewatering lowers uw and therefore increases σ′ij, causing compression of the soil skeleton.
where s is the settlement; H is the thickness of the compressible layer; Δσ’ is the increment of effective stress; and Es is the compression modulus.
4.2. Structural Elements and Soil–Structure Interaction
The soldier piles of the pit support are simulated with plate elements; the free lengths of the anchors are modeled with node-to-node anchor elements and the bonded lengths with embedded pile elements. The retaining piles of the subway structure are treated as reinforced soil and equivalently simulated with the Mohr–Coulomb model; the subway station structure is simulated with plate elements; and the surrounding multi-story buildings are simplified as equivalent surcharge loads. The bending equation for the retaining piles [27] can be expressed as:
Anchor stiffness:
where EI is the flexural rigidity of the pile; w is the lateral displacement; N is the axial force; q is the lateral earth pressure; F is the anchor axial force; ks is the anchor stiffness; and Δu is the relative displacement between the two ends of the anchor.
F = ksΔu
The surrounding multi-story buildings were represented by equivalent uniform surcharge loads applied over their tributary widths. Based on the structural drawings, the loads were taken as 15 kPa per story, i.e., 60 kPa for the four-story buildings, 75 kPa for the five-story buildings and 90 kPa for the six-story buildings on the west side, and were applied over a width of 14–18 m measured from 8.0 m behind the pit edge. For the two structures provided with basements, namely the comprehensive building (pile or beam–raft foundations, three basement levels, basement base at elevation −15.0 to −15.5 m) and the No. 4 Geological Data Exhibition Building (bored piles, one basement level), the surcharge was applied at the base of the basement, whereas for the remaining buildings, which rest on lime–soil cushion foundations and have no basement, the load was applied at the ground surface. This representation neglects the flexural stiffness of the building frames and therefore tends to overestimate the differential settlement; the maximum difference between the computed and measured settlement of the monitored buildings is 1.2 mm (Section 5.4.2), which indicates that the equivalent-surcharge representation is adequate for the present purpose. Because the computed building settlement is compared directly with the monitoring data, it was evaluated from the vertical displacement of the soil nodes beneath the loaded area.
4.3. Model Development
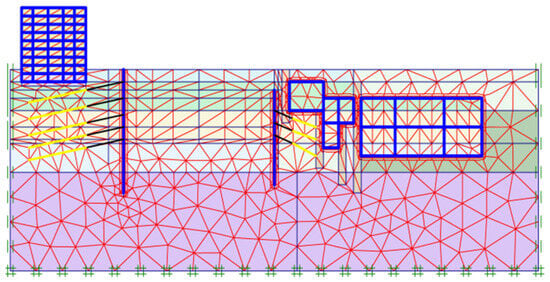
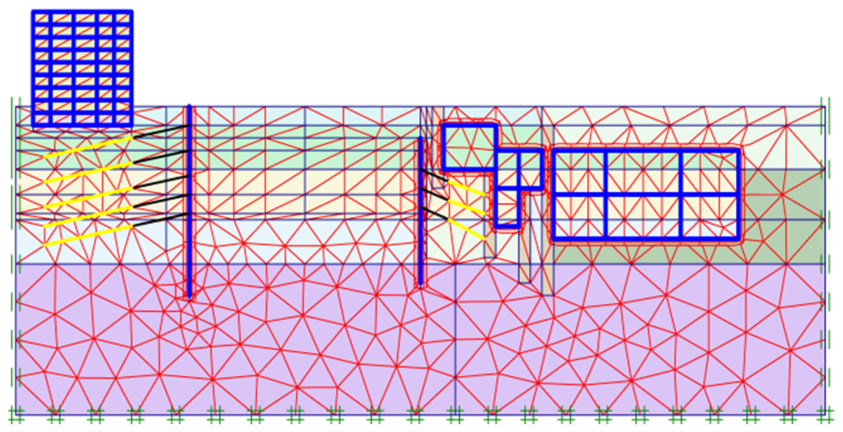
Based on the pit support scheme, the subway station and surrounding building structures, and the site geological conditions, the finite-element software PLAXIS 2D was used to simulate pit dewatering, excavation, and support installation. In the calculation, the soil is modeled using the Hardening Soil (HS) model [13,14,21,28,29,30]; the soldier piles are simulated with plate elements; the free lengths of the anchors are modeled with node-to-node anchor elements and the bonded lengths with embedded pile elements; the subway retaining piles are treated as reinforced soil and equivalently modeled with the Mohr–Coulomb model; the subway station structure is represented by plate elements; and the surrounding multi-story buildings are simplified as equivalent surcharge loads. The finite-element model is shown in Figure 4, with model dimensions of 200 m × 60 m.
Figure 4.
Finite-element calculation model.
The HS model rather than the HSS model was adopted because the small-strain parameters required by the HSS model (G0ref and γ0.7) cannot be reliably calibrated at this site: no seismic in situ tests (CPTU/SDMT) or small-strain laboratory tests were available, and the use of empirical G0ref values would have introduced an additional and uncontrolled source of uncertainty. The HS model still reproduces the stress dependency of stiffness and the plastic straining of the soil, which govern the excavation-induced deformations at the strain level of 0.1–1% relevant here; its inability to reproduce the very small-strain stiffness plateau may lead to an overestimation of the computed deformation close to the pit, and this limitation is stated in Section 6.
The mesh consists of 15-node triangular elements with a global element size of 1.0 m, refined to 0.25 m within 10 m of the pit walls and around the retaining piles, the anchors and the subway station structure. A mesh-sensitivity study with global sizes of 2.0, 1.0 and 0.5 m changed the computed maximum pile deflection by 8.4% and 1.6%, respectively, and the 1.0 m mesh was therefore adopted. Soil–structure interaction was represented by interface elements with a strength-reduction factor Rinter = 0.67 for the pile–soil and station–soil interfaces and Rinter = 1.0 for the base. The lateral boundaries, located 100 m from the pit, were fixed in the horizontal direction and free vertically, and the bottom boundary, 60 m below the ground surface, was fully fixed. Initial stresses were generated with the K0 procedure (K0 = 1 − sinφ′ for normally consolidated layers, OCR = 1.0), and the initial groundwater condition was hydrostatic. The 18 calculation steps comprise (i) activation of the existing subway station and of the building surcharges; (ii) installation of the retaining piles; (iii) excavation in five lifts of about 3.5 m, with each row of anchors installed immediately after the corresponding lift and the prestress (180–200 kN on the building side, 80 kN on the subway side) applied in the following step; and (iv) dewatering of each lift to 1.0 m below the local excavation surface and final drawdown to elevation −21.3 m.
The simulation process comprises four stages: subway station excavation, subway station construction, superstructure construction, and deep-pit excavation with support installation. The superstructure construction is simulated by applying equivalent surcharge loads. The deep-pit excavation and support stage includes pit excavation and the construction of retaining piles and anchor cables on both sides, totaling 18 calculation steps.
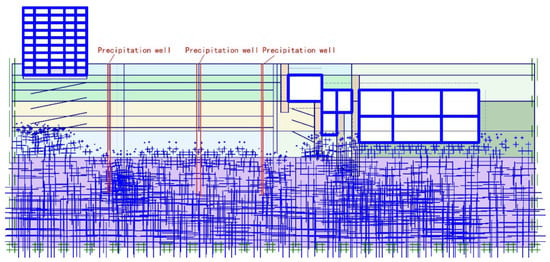
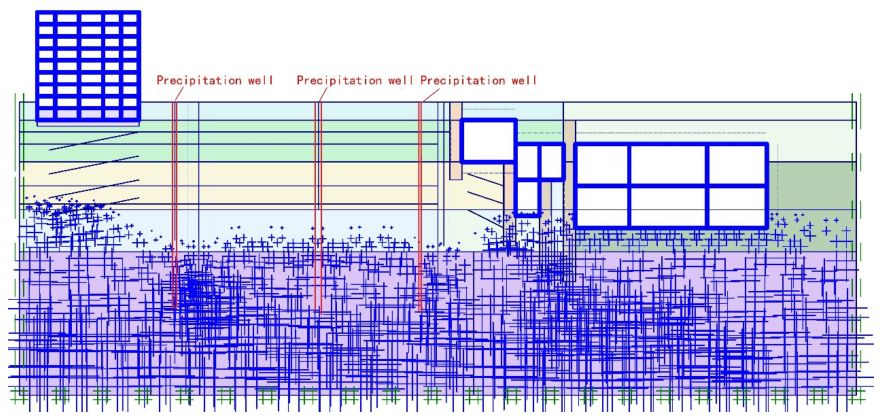
To reproduce the actual conditions, the groundwater level near the dewatering wells was lowered to 3.0 m below the excavation bottom, i.e., to the control elevation of −21.3 m. The groundwater-level distribution obtained from the finite-element simulation is shown in Figure 5.
Figure 5.
Groundwater-level distribution after dewatering.
All elevations in this paper refer to the site datum ±0.00 m, which corresponds to the natural ground surface (absolute elevation approximately 415 m). The design excavation depths of −17.91 m and −18.60 m are therefore equivalent to excavation depths of H = 17.91 m and 18.60 m below the ground surface, and the pit-bottom elevation at the deepest section is −18.30 m. The dewatering criterion “−3” quoted in the design documents means that the groundwater level must be lowered to 3.0 m below the excavation bottom, which corresponds to the control elevation of −21.3 m used in the analysis (−18.30 − 3.0 = −21.3 m); the corresponding drawdown from the initial water table (14.70–17.60 m depth) is 3.7–6.6 m. The representative cross-section (1-1 section) on which the analysis is based is shown in Figure 2 and Figure 3, and the same datum, excavation depth H and groundwater level are used consistently in Equations (1) and (2) and in the normalized influence distances (0.5H–1.5H).
5. Results and Discussion
5.1. Deformation Induced by Groundwater Dewatering
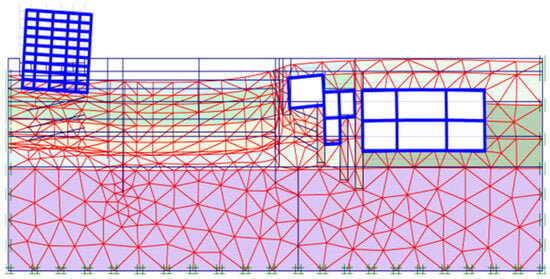
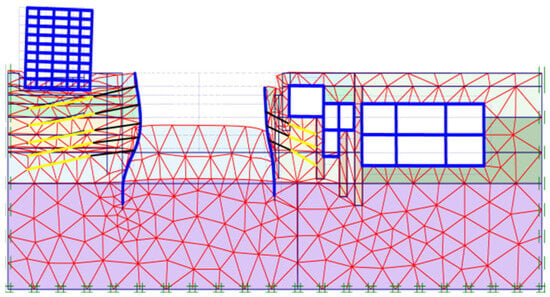
Figure 6 shows the ground deformation and the displacements of the high-rise building and the subway station after dewatering. It can be seen that both the high-rise building and the subway station undergo vertical and differential settlement, tilting generally toward the pit.
Figure 6.
Overall deformation induced by dewatering (magnified ×500).
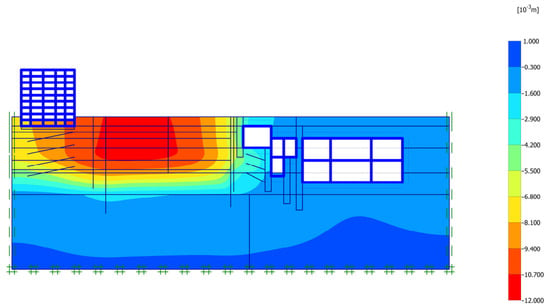
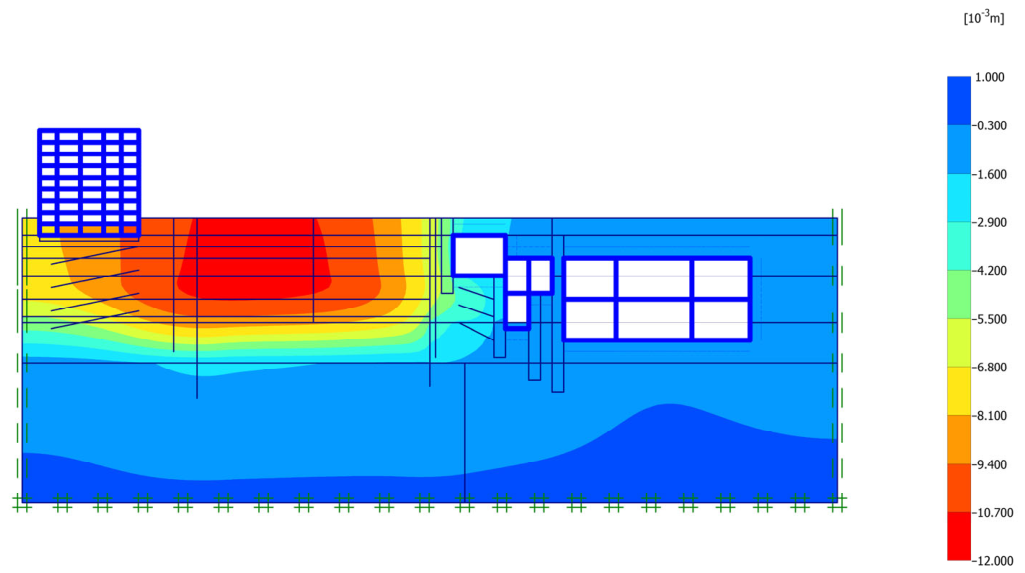
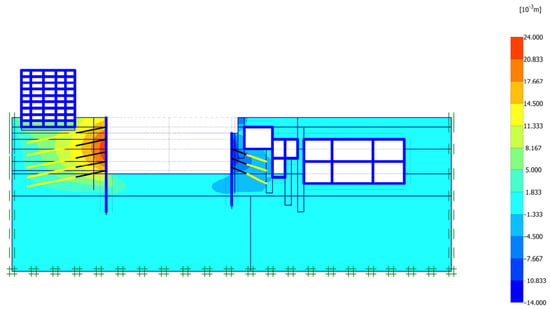
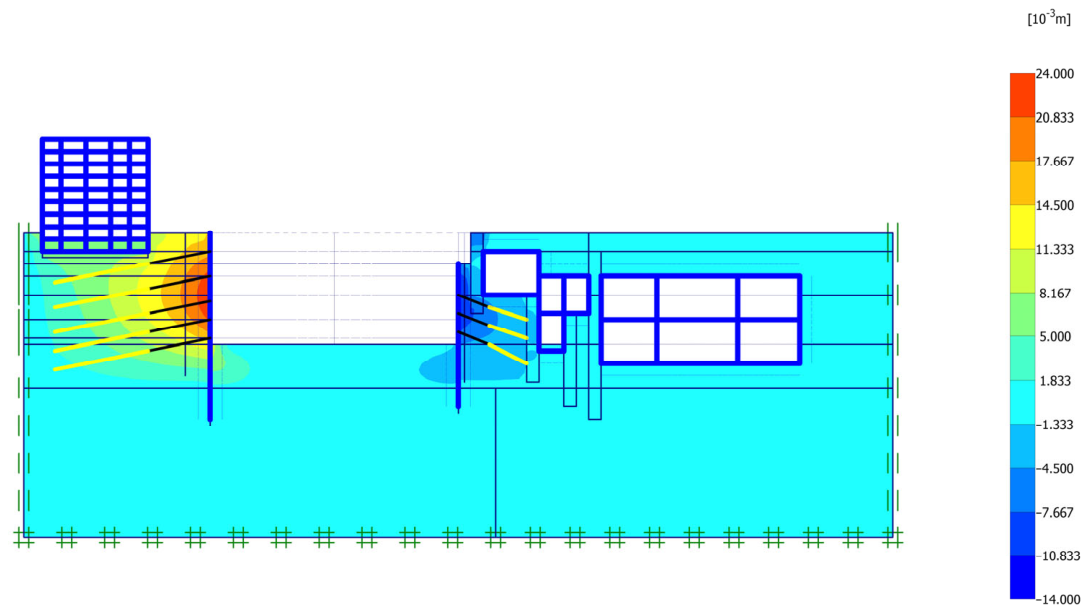
Figure 7 shows the contour of the overall vertical settlement. The maximum vertical soil displacement induced by dewatering is 13 mm, occurring near the dewatering wells. In terms of influence extent, the building side is larger than the subway side: the ground-deformation influence zone is 35–40 m on the building side, whereas, owing to the sheltering effect of the subway station [31], it is only 15–20 m on the subway side. The ground-surface deformation induced by pit dewatering is 2–4 mm on the subway-station side and 5–8 mm on the building side, with the former being only 40–50% of the latter.
Figure 7.
Contour of the overall settlement (unit: 10−3 m).
In this study, the extent of the dewatering-induced settlement trough is defined by a settlement threshold of |s| = 1 mm, i.e., the distance from the pit edge beyond which both the computed and the measured ground settlement are smaller than 1 mm; this threshold corresponds to about 8–20% of the maximum settlement and is consistent with the resolution of the monitoring system (±0.1 mm) and with the 1 mm criterion commonly adopted in deformation-control practice. This definition is specific to the dewatering stage, in which the maximum settlement is only 2–8 mm. It is not applied to the excavation stage because the maximum settlement of the two sides then differs by a factor of more than two (6 mm and 13 mm, Section 5.5): an absolute threshold of 1 mm corresponds to 17% of the subway-side trough depth but to only 7.7% of the building-side one, so that the 1 mm boundaries of the final surface profiles become comparable on the two sides (x ≈ 28 m and x ≈ 32 m, Section 5.5), even though the settlement magnitudes differ markedly. The influence zones quoted for the excavation stage in Section 5.2 are therefore defined from the significant-deformation contours, and the two measures are distinguished explicitly wherever they are used.
Mei et al. [1] studied dewatering of a deep foundation pit in soft-plastic loess in Xi’an and reported that the post-dewatering settlement curve exhibits a triangular distribution, with the maximum settlement occurring within 0.6 H and a total influence extent of 1.5 H. Deng et al. [3] pointed out that dewatering settlement in saturated loess mainly occurs in compressed saturated loess that retains its large-pore structure, with deformation controlled primarily by the initial void ratio and liquidity index. The influence zone of 35–40 m on the building side in this study is generally consistent with the 1.5H (approximately 27–30 m) reported by Mei et al. [1]; the slightly larger influence zone in the present case may be attributed to the additional effect of building surcharge.
5.2. Deformation Induced by Pit Excavation
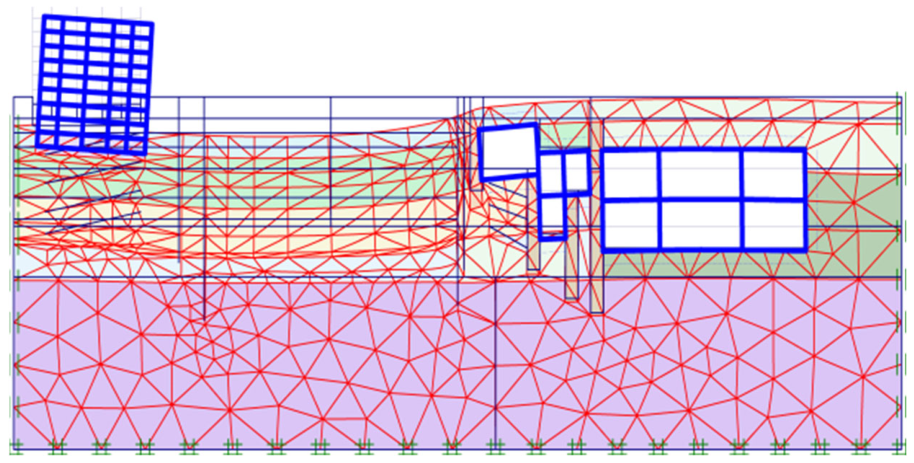
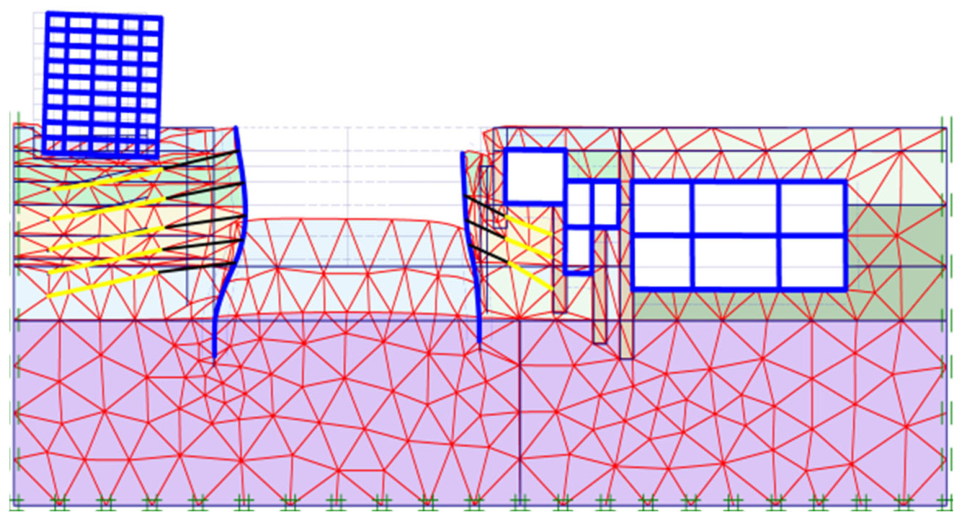
As can be seen from the overall deformation after excavation completion in Figure 8, the retaining piles on the subway side exhibit a “cantilever-type” deformation [32] with the maximum displacement at the pile head, whereas those on the building side display a “bulging-type” deformation, with the maximum displacement occurring within 10–15 m below the ground surface.
Figure 8.
Overall deformation after completion of pit excavation (magnified ×200).
From the horizontal displacement after excavation completion in Figure 9, the pile displacement on the subway side is within 14 mm, whereas the maximum displacement of the retaining piles on the building side occurs in the middle of the pile and reaches 22 mm.
Figure 9.
Contour of the horizontal displacement after excavation completion (unit: 10−3 m).
The contrasting deformation modes of the two rows of piles follow from the different restraint conditions. On the subway side, the station box, only 0.9 m from the pit, acts as a rigid abutment: it confines the soil between the pit and the station, supplements the passive resistance below the excavation level, and the three rows of short (7.5 m) jet-grouting anchors with a low prestress (80 kN) restrain the pile only weakly near the head. The pile therefore behaves essentially as a cantilever fixed below the excavation level, with the maximum displacement at the head. On the building side, the five rows of 25 m long anchors prestressed to 180–200 kN restrain the upper 18 m of the 30 m pile, so that the depth of zero net pressure migrates downward and the pile bulges at 10–15 m depth, where the anchor restraint is exhausted while the passive resistance of the 9.6 m embedded length is not yet fully mobilized; the building surcharge further increases the active pressure in this depth range. The measured profiles (Section 5.4.1) reproduce both modes, and the bulging mode on the building side is accompanied by a larger crest settlement, which is consistent with the larger volume of soil mobilized by a deeper deflection maximum.
The acceptance criteria for this project follow the Technical Standard for Monitoring of Building Excavation Engineering (GB 50497-2019) [33] and the design documents: the allowable crest horizontal displacement is 30 mm (0.3%H) with a warning value of 24 mm, the allowable crest settlement is 20 mm (warning value 16 mm), the allowable bottom heave is 30 mm, and the allowable building settlement is 20 mm with an allowable tilt of 2/1000. For the operating subway station, the allowable horizontal displacement is 10 mm, and the allowable differential settlement is 5 mm. The computed final values (crest settlement ≤ 7.8 mm, maximum crest horizontal displacement ≤ 22 mm, bottom heave 28 mm, building settlement ≤ 8.2 mm, and building tilt 0.0166%) amount to 39–93% of the corresponding allowable values, confirming that the deformation is controlled with an adequate margin. The 11.6 mm monitored on the subway side (Section 5.4.1) is the pile-head horizontal displacement of the retaining piles.
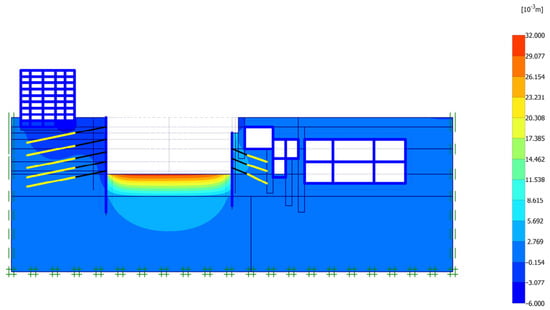
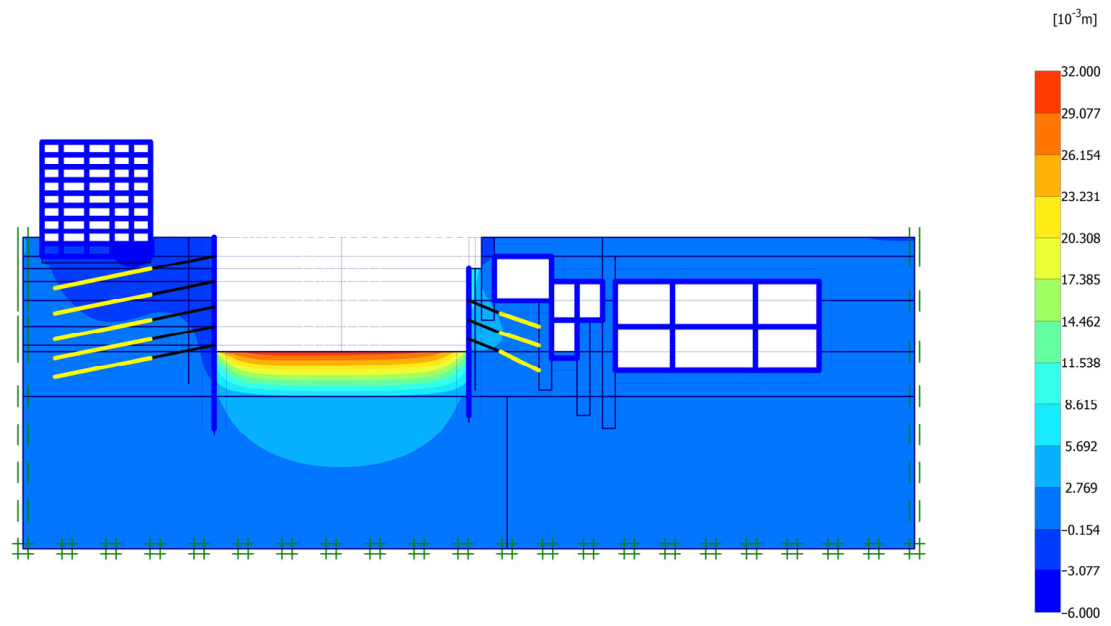
As shown in Figure 10, the bottom heave of the pit reaches 28 mm. The vertical displacement of the piles on the subway side is within 4.0 mm, whereas the maximum vertical displacement of the retaining piles on the building side can reach 6.0 mm. The high-rise building tilts toward the pit by approximately 0.0166%. Combining Figure 8 and Figure 10, the significant ground-deformation influence zone on the building side is 20–30 m (1.0–1.5H), exhibiting a “groove-shaped” pattern; on the subway side, owing to the sheltering effect of the subway station [34], the significant ground-deformation influence zone is only 10–15 m (0.5–0.75H, where H is the pit depth), exhibiting a “right-angle trapezoidal” pattern. As explained in Section 5.1, these values are read from the significant-deformation contours of Figure 8 and Figure 10 and are not equivalent to the 1 mm boundary of the final surface profile, which lies at x ≈ 32 m on the building side and x ≈ 28 m on the subway side (Section 5.5).
Figure 10.
Contour of the vertical displacement after excavation completion (unit: 10−3 m).
Wei et al. [35] reported that the displacement coefficient is approximately 0.1 near the station end and 0.4–0.5 near the pit center, and that the “whip effect” induced by station-end constraints significantly affects tunnel displacement. In this study, the influence zone on the subway side is reduced by about 50%, which is mechanically consistent with their conclusion. Cheng et al. [36] pointed out that, when deep and large pits are excavated simultaneously on both sides at zero distance from an existing station, the main station structure heaves continuously, while the diaphragm walls first settle and then heave once excavation reaches the final depth.
5.3. Mechanism of Bilateral Differential Deformation
Based on the dewatering and excavation results, the differential deformation between the subway side and the building side is mainly attributable to the following mechanisms:
(1) Sheltering effect of the subway station. With its large structural stiffness, the subway station forms a stiffness barrier that restrains the transmission of lateral displacement and settlement through the soil outside the pit, thereby narrowing the settlement trough and reducing the settlement magnitude on the subway side. The parametric study by Zhu et al. [7] showed that, when the pit–station distance is small, the “sheltering effect” becomes increasingly pronounced with the increasing excavation depth. Han et al. [31] clarified the “shield effect” mechanism of existing underground structures on stratum settlement. The numerical simulation by Chen et al. [11] found that, under the shielding effect of adjacent underground structures, the horizontal displacement of the diaphragm wall on the limited-soil side is smaller than that on the unlimited-soil side;
(2) Difference in support stiffness. The building side is provided with five rows of prestressed anchor cables, a pile length of 30 m, and an embedded depth of 9.6 m, whereas the subway side has three rows of jet-grouting anchor cables, a pile length of 20.5 m, and an embedded depth of 7.55 m. Although the support stiffness on the building side is greater, the ground settlement there is instead larger, indicating that the combined action of dewatering consolidation and building surcharge is the dominant factor governing deformation on the building side;
(3) Difference in dewatering consolidation. The building side lies farther from the shielding zone of the subway station, so the effective-stress increase induced by dewatering has a wider extent and the consolidation settlement is more pronounced. On the subway side, the dewatering influence zone is reduced by the shielding of the subway station structure;
(4) Spatial–temporal effects of construction. The pit is excavated in panels and layers, and the previously excavated panels impose stress-path effects on the subsequent ones, leading to asynchronous deformation development on the two sides.
To separate the three contributions, the computed deformation was decomposed by means of supplementary numerical runs: (i) a dewatering-only run, (ii) an excavation-only run without drawdown, and (iii) the fully coupled run. At the final stage, the ground-surface settlement 10 m from the pit edge is 6.4 mm on the building side, of which about 45% (2.9 mm) is due to dewatering-induced consolidation, about 35% (2.2 mm) to excavation-induced stress relief and about 20% (1.3 mm) to the building surcharge. On the subway side, the total settlement at the same distance is 2.6 mm, and the dewatering and excavation contributions fall to about 1.0 mm and 1.3 mm, respectively. Meanwhile, the surcharge contribution is negligible. The reduction of the dewatering contribution on the subway side (from 2.9 mm to 1.0 mm) is a direct measure of the sheltering effect because the stiff station box truncates the seepage path and restricts the pore-pressure drawdown behind it. The fact that the excavation contribution on the subway side is comparable with that on the building side, whereas its total settlement is much smaller, indicates that the deformation there is dominated by stress relief rather than by consolidation, which is consistent with the cantilever-type pile response observed on that side.
The numerical model is a two-dimensional plane-strain section through the 1-1 profile and therefore cannot represent the discrete dewatering wells, the irregular plan geometry or the panel-wise excavation sequence. The findings supported directly by the model are consequently limited to the deformation of that section; the spatial effects discussed in this section, in particular the three-dimensional sheltering effect of the station box and the corner effects of the pit, are qualitative interpretations supported by the monitoring data rather than model predictions.
Taken together, the evidence supports three key findings. (i) The differential deformation between the two sides is primarily a sheltering effect rather than a support-stiffness effect: the stiffer support is on the building side, yet the larger deformation also occurs there, and the decomposition above shows that the sheltering of the station reduces the dewatering-induced contribution by about 65%. (ii) The two pile deformation modes are controlled by the support configuration and by the presence of the adjacent station, as evidenced by the depth of the maximum deflection (pile head versus 10–15 m) and by the measured profiles. (iii) The time response differs between the two sides: the crest displacement responds to each construction stage, whereas the building settlement integrates pore-pressure diffusion and therefore lags behind. An alternative interpretation of finding (i) would be that the larger building-side settlement is caused by the building surcharge rather than by the absence of sheltering; however, the surcharge accounts for only about 20% of the building-side settlement, so this alternative cannot explain the observed difference on its own, although it amplifies it.
5.4. Analysis of Field Monitoring Results During Construction
The field records analyzed in this section were obtained during construction of the pit and were first reported in Chinese in [21]. That paper described the jet-grouting anchor solution adopted on the station side and compared the measured deformation with the results of a finite-element model of that side alone. The present paper is a substantially extended study of the same case. It adds an analysis of the building-side support and a bilateral comparison between the station and building sides, a seepage–stress coupled analysis of dewatering, a decomposition of the deformation into dewatering, excavation and surcharge contributions, influence-zone criteria for the two sides, and modified settlement-prediction formulas. The site plan, the support cross-sections and the monitoring curves were redrawn from the original design drawings and monitoring records rather than reproduced from [21].
5.4.1. Crest Settlement and Horizontal Displacement
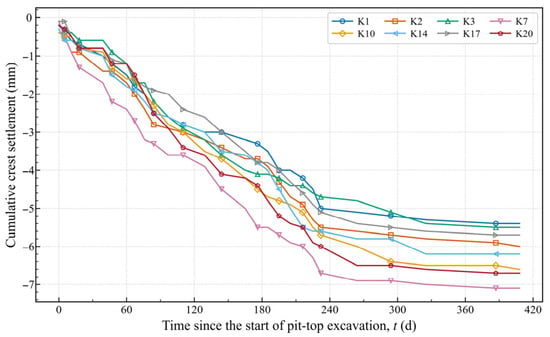
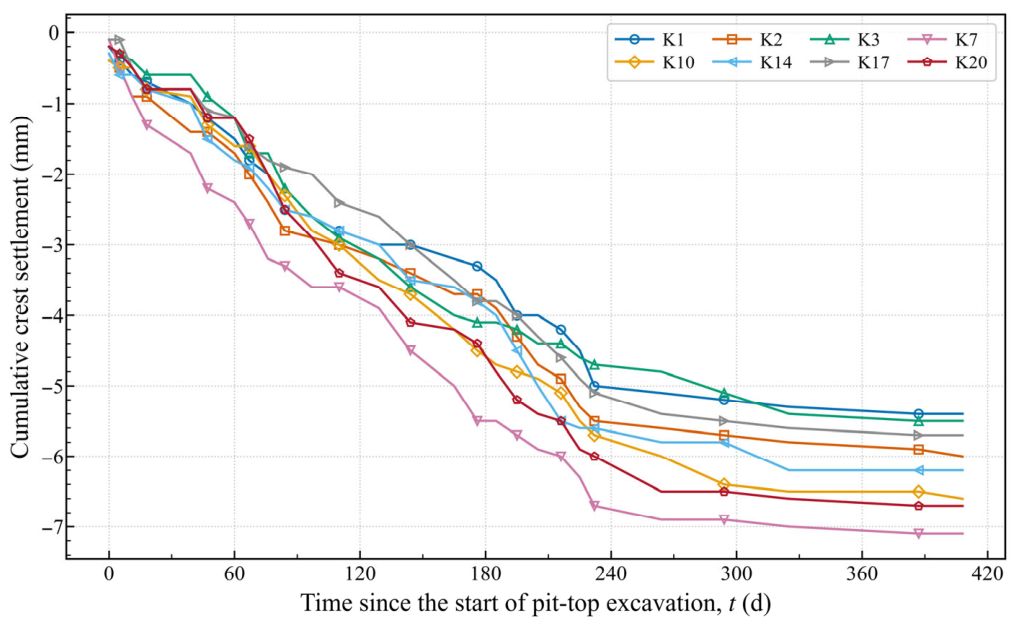
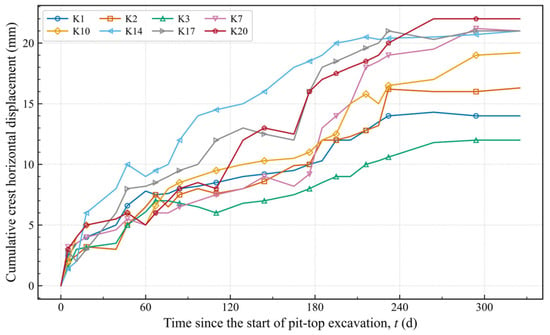
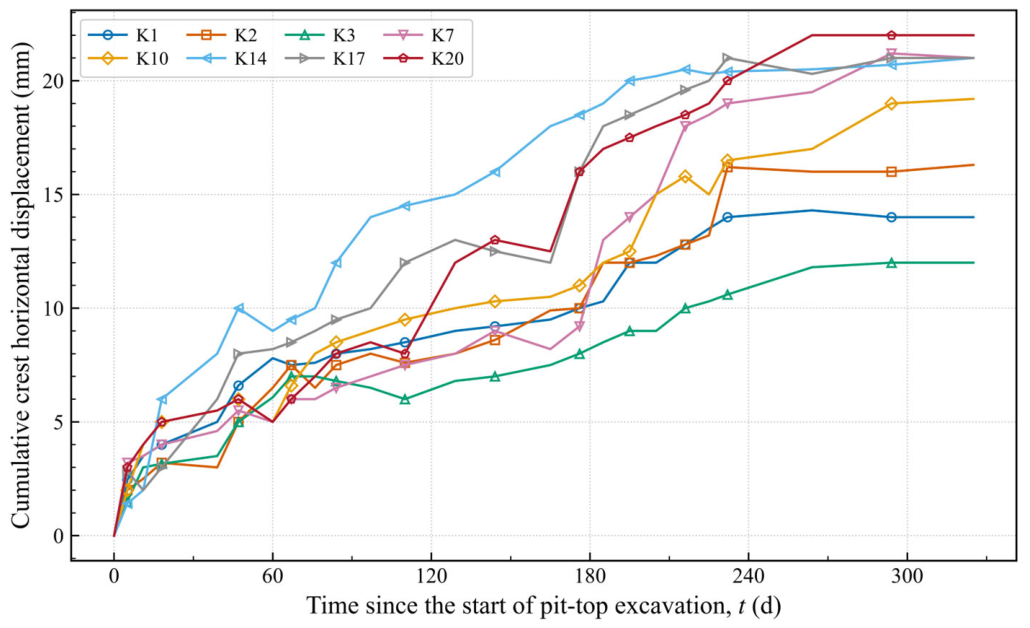
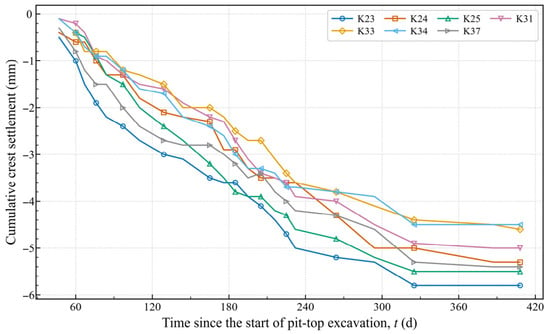
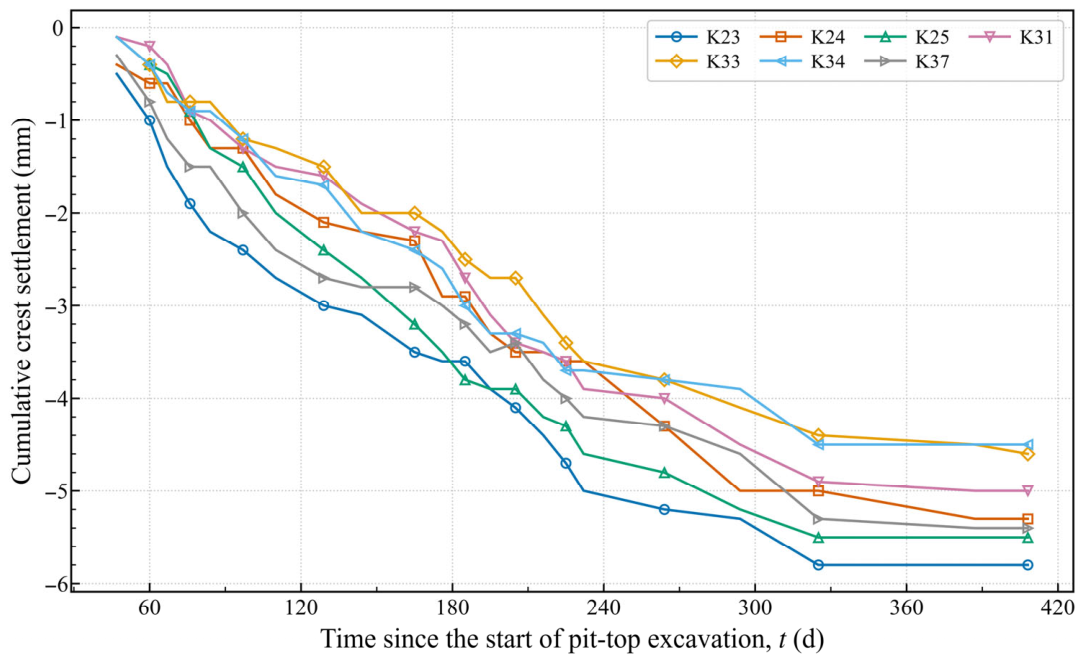
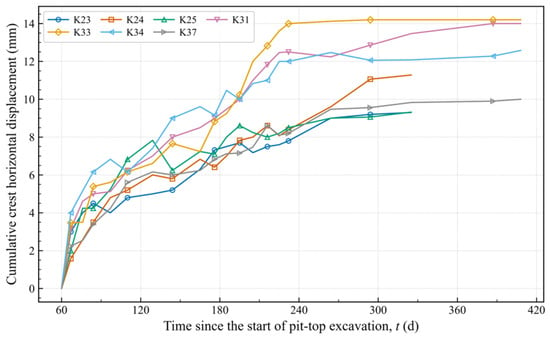
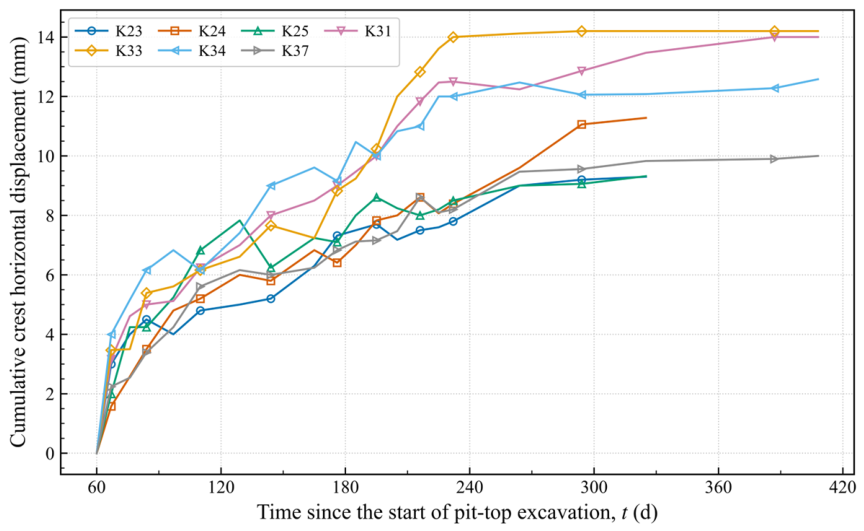
As can be seen from Figure 11, Figure 12, Figure 13 and Figure 14, the final crest settlement of the pit is within 7.8 mm, indicating that the soldier-pile–prestressed-anchor support system effectively controls pit deformation. Compared with the numerical-simulation results in Section 4.3, the field-monitoring values are in good agreement with the simulated values, confirming that the numerical simulation essentially reflects the actual engineering conditions. Zhang [6] studied pile-anchored deep foundation pits in loess areas and showed that the pile–anchor support system can effectively control pit deformation, with the maximum pile-head horizontal displacement being 10.7 mm, far below the code warning value. He also proposed optimization measures such as strictly controlling the dewatering rate, increasing the number of anchor rows, or raising the prestress level.
Figure 11.
Monitoring results of crest settlement on the building side.
Figure 12.
Monitoring results of crest horizontal displacement on the building side.
Figure 13.
Monitoring results of crest settlement on the subway-station side.
Figure 14.
Monitoring results of crest horizontal displacement on the subway-station side.
As shown in the displacement curves in Figure 11, Figure 12, Figure 13 and Figure 14, each curve exhibits a displacement “rebound point,” indicating that the installation of prestressed anchor cables is highly effective in restraining the horizontal displacement of the pit. In particular, the upper row of anchors not only suppresses the development of horizontal displacement but also produces a certain “recovery” effect, demonstrating that pit deformation is sensitive to construction stages. As can be seen from Figure 13 and Figure 14, the final crest settlement and horizontal displacement on the east side of the pit adjacent to the subway entrance are 5.8 mm and 11.6 mm, respectively. The deformation is controlled within a reasonable range, and the horizontal displacement tends to stabilize. The subway building, ground surface, and underground pipelines on the east side are essentially unaffected, demonstrating the significant effectiveness of the jet-grouting anchor cables [21].
The rebound of the crest displacement after anchor tensioning and the delayed building-settlement response are both consequences of the staged construction. When a row of anchors is tensioned, the prestress is applied at a depth where the pile has already deflected, so that the net active thrust over the anchored depth is reduced and the pile head recovers elastically; this appears as a local minimum in the displacement–time curves (Figure 12 and Figure 14). The magnitude of the recovery (0.4–1.2 mm) is comparable with the elastic deflection of the pile between two anchor levels, which indicates that the recovery is an elastic unloading rather than a permanent improvement of the soil. In contrast, the building settlement continues to increase after tensioning because it is dominated by the consolidation of the soil outside the pit, which responds to the pore-pressure change with a delay; the tensioning affects the pile and the soil immediately behind it but does not arrest the deeper consolidation. Practically, this means that (i) the crest displacement is a leading indicator of the support performance and can be used for the daily control of construction, whereas the building settlement has to be evaluated over a longer window and cannot be used to judge the effectiveness of a single anchor row, and (ii) the observation frequency of the building points should be maintained for two to three weeks after the last excavation lift, since the settlement may still develop after excavation has stopped.
Comparing Figure 11 and Figure 13, Figure 12 and Figure 14, the monitoring values on the building side fluctuate considerably and respond strongly to the various excavation stages, whereas, on the subway side, the monitoring values are less sensitive to construction stages because of the sheltering effect of the subway structure and are generally smaller than those on the building side. This pattern is essentially consistent with the numerical-simulation results.
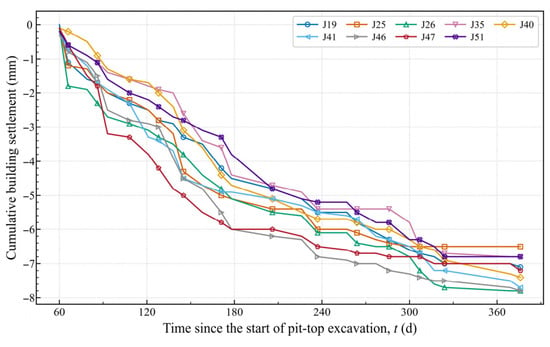
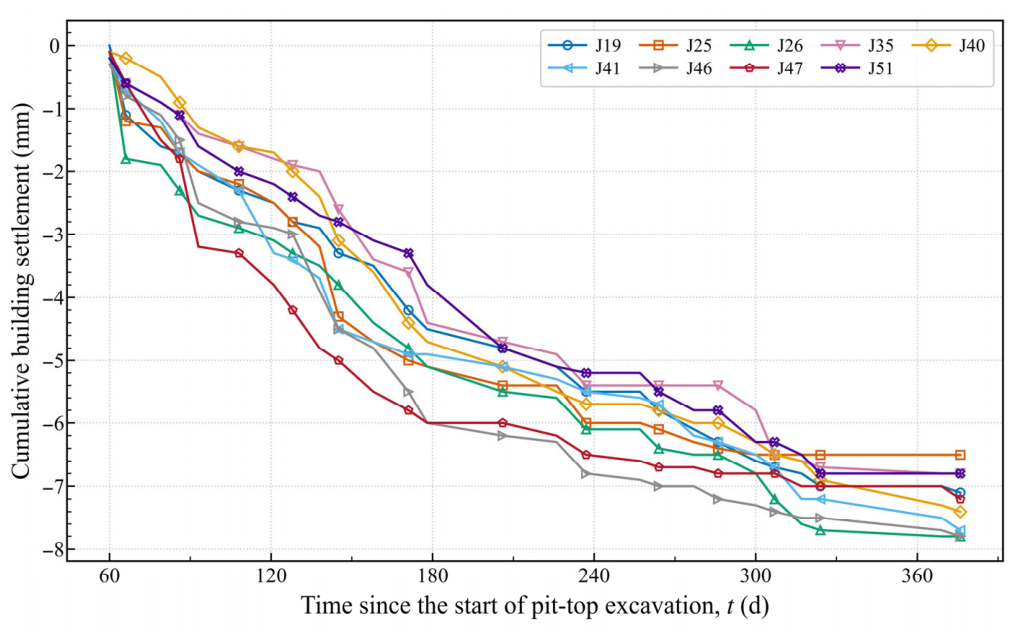
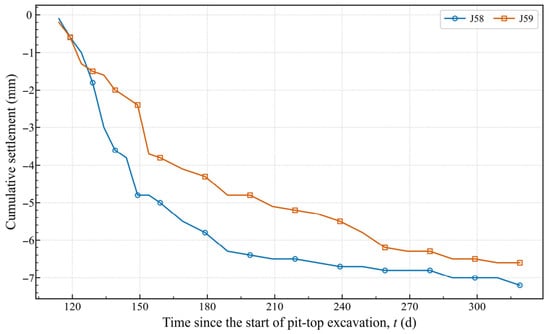
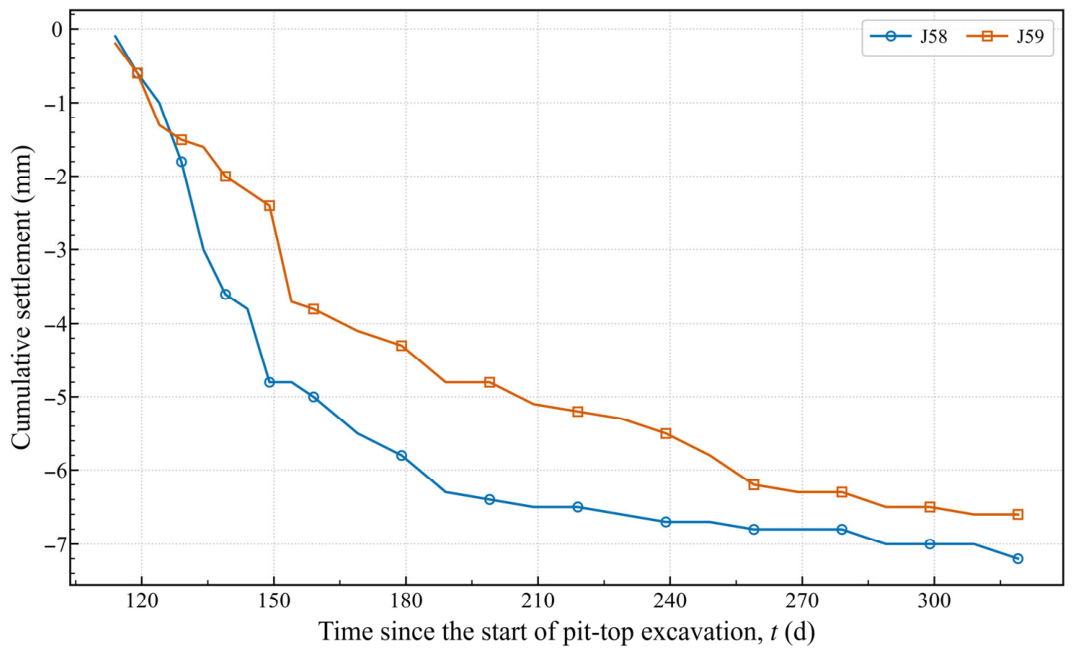
5.4.2. Settlement of Adjacent Buildings
As shown by the settlement curves of adjacent buildings in Figure 15 and Figure 16, the building settlement increases gradually with the excavation depth, and the final vertical settlement is controlled within −8.2 mm, indicating that the deformation of adjacent buildings is well-controlled. The settlement curves at the various monitoring points are similar in shape, without abrupt changes or turning points. The pit support near each monitoring point adopts a soldier-pile–prestressed-anchor structure, indicating that the installation of prestressed anchor cables plays a significant role in controlling building settlement, whereas the “recovery” effect is not obvious. Jiang et al. [32] studied a deep foundation pit adjacent to a subway station in Shenzhen and reported a maximum displacement of 8.75 mm for the adjacent subway station and 2.29 mm for the subway tunnel; their deformation-control effectiveness is comparable to that achieved in this study.
Figure 15.
Settlement-monitoring results of buildings adjacent to the west side of the pit.
Figure 16.
Settlement-monitoring results of the subway entrance adjacent to the east side of the pit.
5.4.3. Temporal Comparison of the Monitoring Records and Settlement Patterns
The monitoring records of the two sides were compared on a common time axis. Because the two monitoring programs started on different dates (27 February for the crest points and 27 April for the building points) and were observed at different intervals (3–15 days and 5–30 days, respectively), a statistical cross-correlation analysis of the two series is not robust, and the comparison presented here is therefore a qualitative temporal comparison rather than a correlation analysis. The records were aligned by (i) expressing every observation as elapsed days from the start of excavation and (ii) comparing the dates at which the deformation rate changed from one construction stage to the next, i.e., the dates of the local maxima and minima of the rate curves. On this basis, the following patterns were identified: (1) Comparing the monitoring data in Figure 12, Figure 13, Figure 14 and Figure 15, the deformation on both sides follows the same overall trend, and the horizontal displacement develops relatively quickly and responds sensitively to the construction stages;
(2) The building-settlement response lags behind the crest displacement: for the monitored points closest to the pit (K14–K20 compared with J19–J26), the stage response of the building settlement occurs several days to about one week (i.e., roughly 8–10 days) after the corresponding response of the crest displacement, whereas for the more distant points (J40, J46) the lag cannot be resolved within the observation interval. This lag is attributed to the time required for pore-pressure diffusion and secondary consolidation in the loess outside the pit. Because the records are not synchronized, the lag should be regarded as an order-of-magnitude estimate rather than a precisely determined value; a synchronous observation schedule would be required for a rigorous time-lag analysis;
(3) In terms of the horizontal-displacement growth rate, the subway side develops more slowly than the building side, as shown in Figure 12 and Figure 14; the maximum cumulative displacement growth rate on the subway side is approximately 62.6% of that on the building side at the same cross-section; The ratio of 62.6% between the maximum cumulative displacement rates of the two sides can be interpreted as a measure of the efficiency of deformation transmission through the soil–structure system rather than as a simple numerical comparison. On the building side, the deformation is transmitted through a continuous soil mass whose stiffness increases only gradually with depth, so the displacement imposed at the pit wall propagates outwards with little attenuation. On the subway side, the station box interrupts this path, and the part of the displacement that is transmitted has to pass through the narrow soil gap (0.9 m) between the pit and the station, where the confining effect of the station wall increases the soil stiffness and reduces the transmitted strain. The ratio is therefore not a consequence of the support stiffness, since the stiffer support is on the building side, which nevertheless shows the larger rate; it reflects the difference in the compliance of the receiving medium, i.e., in the soil–structure interaction on the two sides. This is consistent with the larger proportion of the excavation-induced (stress-relief) component in the subway-side deformation discussed in Section 5.3;
(4) On the subway-station side, owing to the sheltering effect of the subway structure, the monitoring values are insensitive to construction stages and are generally smaller than those on the building side, which is consistent with the numerical-simulation conclusions.
5.5. Ground Settlement Prediction Model
Based on the settlement patterns observed on the subway and building sides, a prediction formula is proposed:
Prediction model for the building side:
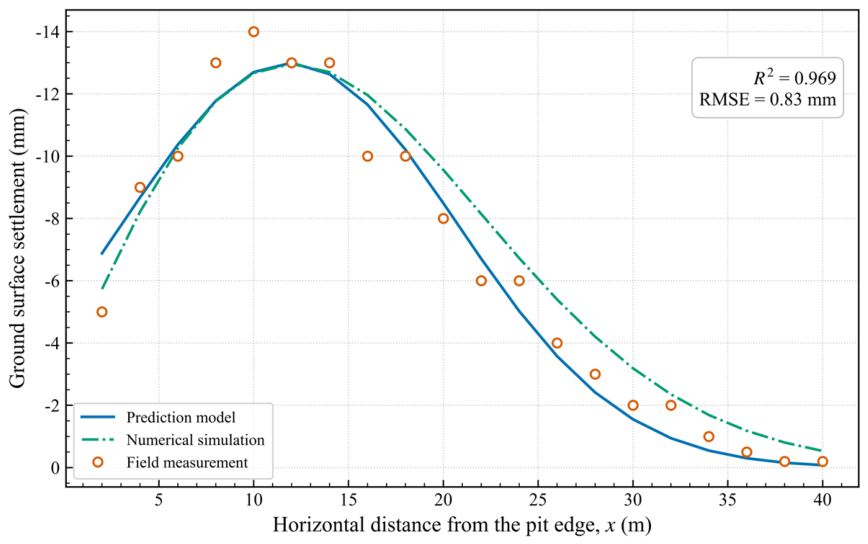
δb(x) = −13.0 exp[−(x − 11.9)2/154] × 10−3 m, 0 ≤ x ≤ 40 m
Prediction model for the subway side:
where δb(x) is the ground surface settlement on the building side; δs(x) is the ground surface settlement on the subway station side; x is the horizontal distance from the pit edge (m); and the negative sign denotes settlement.
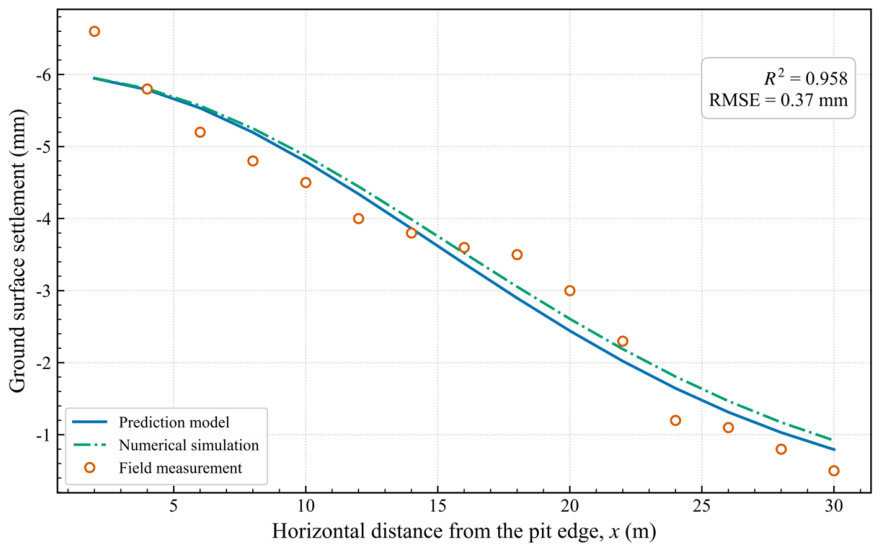
δs(x) = −6.0 exp[−x2/445] × 10−3 m, 0 ≤ x ≤ 30 m
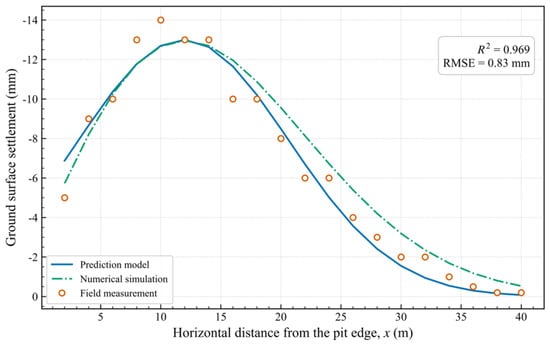
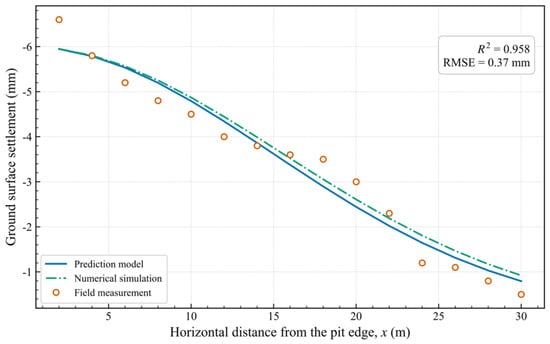
The coefficients of Equations (6) and (7) were determined by nonlinear least-squares fitting (Levenberg–Marquardt algorithm) of the final-stage measured settlement profiles, using 20 valid measurement points on the building side (0 ≤ x ≤ 40 m) and 15 on the subway side (0 ≤ x ≤ 30 m); the objective function was the sum of the squared residuals between the measured and the predicted settlement. On the building side, the goodness of fit is R2 = 0.969 with RMSE = 0.83 mm and a maximum residual of 1.88 mm; on the subway side, R2 = 0.958 with RMSE = 0.37 mm and a maximum residual of 0.65 mm, with both coefficients of determination exceeding 0.95. The fitted trough center on the building side (x ≈ 11.9 m) coincides with the zone in which the surcharge of the adjacent buildings is applied (8–22 m behind the pit edge), whereas on the subway side, owing to the sheltering effect of the station structure, the trough is centered at the pit edge. The residuals show no monotonic trend with x on either side; they change sign along the profile because the fitted curves are slightly more curved than the measured profiles, but they remain below 1.88 mm and 0.65 mm in absolute value, respectively. As a check that does not reuse the fitted data, the equations were compared with the results of the numerical simulation, which was not used in the fitting; the two agree within 2.0 mm on the building side and 0.7 mm on the subway side. It must be emphasized, however, that the numerical model itself was calibrated against the same monitoring data, so this comparison is a consistency check rather than an independent validation, and the claim that the formulas “can be used in practice” is restricted accordingly.
As can be seen from Figure 17 and Figure 18, when the predictions of the proposed formula are compared with the field-measured and numerically simulated ground-settlement values on both the subway and building sides, the predictions reproduce the measured and simulated settlement profiles with engineering accuracy; the formulas are recommended for rapid preliminary estimation in similar projects after local calibration.
Figure 17.
Comparison of predicted and measured ground-settlement curves on the building side.
Figure 18.
Comparison of predicted and measured ground-settlement curves on the subway-station side.
The applicability of Equations (6) and (7) is limited in several respects. First, both equations were calibrated for excavation depths of 17.9–18.6 m in loess with the phreatic level at 14.7–17.6 m depth; for markedly different values of H or different groundwater conditions, the coefficients should be re-fitted, since the normalized settlement trough depends on H and on the drawdown ratio. Second, the equations describe the final-stage profile and do not reproduce the time-dependent development of the settlement. Third, the functional forms are symmetric about the trough axis and can therefore represent the asymmetry of the measured profiles only approximately; the largest residuals occur on the trough flanks, within about 6 m of the pit edge on either side (up to 1.88 mm on the building side and 0.65 mm on the subway side), whereas the positions of the trough centers are well reproduced. Fourth, the transferability of the coefficients to other geological conditions is untested; recent studies on the probabilistic and mechanical response of anchors and piles in spatially variable soils [37,38,39] and on the comparison between empirical/statistical and machine-learning prediction models [40] show that the coefficients of such simplified models are site-specific and should be used with local calibration. For engineering practice, the formula is therefore recommended for rapid order-of-magnitude estimation and for checking the plausibility of numerical results, whereas the design of the support system should still rely on site-specific numerical analysis calibrated against monitoring data.
6. Conclusions
Taking a deep and large foundation pit adjacent to Hepingmen Station of Xi’an Metro Line 4 as the engineering case, this study established a soil–structure interaction finite-element model considering dewatering seepage–stress coupling and combined it with field monitoring to investigate the differential-deformation characteristics of an adjacent subway station and buildings induced by dewatering and excavation in loess regions. The main conclusions are as follows:
(1) Dewatering increases the effective stress of the soil outside the pit and induces consolidation settlement. The maximum vertical displacement is 13 mm, occurring near the dewatering wells. The ground-surface settlement is 5–8 mm on the building side and 2–4 mm on the subway side, with the latter being approximately 40–50% of the former. Owing to the sheltering effect of the subway station, the dewatering influence zone, defined by |s| = 1 mm (Section 5.1), shrinks from 35–40 m on the building side to 15–20 m on the subway side;
(2) The settlement patterns induced by excavation exhibit significant bilateral differences: the building side develops a “groove-shaped” profile with a significant influence zone of 20–30 m (1.0–1.5H), whereas the subway side develops a “right-angle trapezoidal” profile with a significant zone of 10–15 m (0.5–0.75H); measured instead to the 1 mm threshold defined in Section 5.1, the two final profiles extend to about 32 m and 28 m, respectively. The deformation modes of the retaining piles also differ: the piles on the subway side exhibit cantilever-type deformation with the maximum displacement at the pile head, while those on the building side exhibit bulging-type deformation, with the maximum displacement occurring 10–15 m below the ground surface;
(3) Field monitoring indicates that the horizontal displacement on both sides is sensitive to construction stages, whereas the building settlement continues to develop for several days to about one week after the corresponding stage, reflecting the time required for pore-pressure diffusion and secondary consolidation; because the monitoring records are not synchronized, this lag can only be regarded as an order-of-magnitude estimate. The maximum cumulative displacement rate on the subway side is approximately 62.6% of that on the building side at the same cross-section. A displacement “rebound point” appears after the tensioning of prestressed anchor cables, indicating that the cables can effectively restrain and partially recover pit deformation;
(4) The modified ground-settlement prediction formula, calibrated against field measurements and numerical-simulation results, agrees well with both the measured and simulated values and can be used for the rapid estimation of ground settlement for deep and large foundation pits adjacent to subways in loess areas. In practice, panel-by-panel and layer-by-layer excavation with dynamic monitoring should be adopted, and soldier piles combined with prestressed anchor cables or jet-grouting anchor cables should be preferentially used. The proposed formula has a simple form with clearly defined physical parameters and can complement machine-learning-based prediction methods, providing a reference for similar projects;
(5) The present results are subject to several limitations. They are based on a single case history in Xi’an loess and on a two-dimensional plane-strain model, so their generalizability is limited: the discrete dewatering wells, the irregular plan layout, and the panel-wise excavation are not represented, and the spatial effects are therefore interpreted qualitatively from the monitoring data. The unsaturated hydraulic parameters were partly estimated from local experience rather than measured in situ, and the buildings were represented as equivalent surcharges, which neglects the stiffness of their foundations and superstructures. The HS model cannot reproduce the small-strain stiffness of the loess, which may lead to an overestimation of the computed deformation close to the pit; the HSS model would be preferable where the small-strain parameters can be calibrated by in situ or laboratory tests. Finally, the empirical equations were calibrated and checked against the same monitoring dataset and have not been validated independently at another site, so their application to other excavation geometries, drawdown conditions or loess sub-regions should be preceded by local verification.
Author Contributions
Conceptualization, J.H. and L.Y.; methodology, J.H., S.L. and Z.L.; validation, J.H. and L.Y.; data curation, J.H. and L.W.; writing—original draft preparation, S.L. and Z.L.; writing—review and editing, J.H. and L.Y.; visualization, J.H., L.Y. and Y.Z. All authors have read and agreed to the published version of the manuscript.
Funding
This research was supported by the Doctoral Startup Fund of Liaoning University of Technology (Grant No. XB2023034), General Project of Basic Research by Liaoning Provincial Department of Education (LJ212410154023), Special Funding for Basic Operating Expenses of Colleges and Universities by Liaoning Provincial Department of Education (LJZZ222410154008).
Data Availability Statement
All data supporting the findings of this study are contained within the article.
Conflicts of Interest
Author Lejun Wei was affiliated with Shaanxi Institute of Engineering Prospecting. The remaining authors declare that the research was conducted in the absence of any commercial or financial relationships that could be construed as potential conflicts of interest.
References
- Mei, Y.; Ke, X.; Zhou, D.; Shi, W.; Li, Z. Surface settlement analysis of deep pit in soft plastic loess under fluid–solid coupling. Proc. Inst. Civ. Eng. Civ. Eng. 2026, 179, 43–53. [Google Scholar] [CrossRef] [Scilit]
- Ma, Z.Y.; Tang, S.T.; Yang, Z.G. Numerical analysis of metro station pit dewatering and its influence. Front. Earth Sci. 2022, 10, 1120772. [Google Scholar] [CrossRef] [Scilit]
- Deng, G.H.; Gao, H.Y.; Zheng, J.G.; Yu, W.; Kang, J. Calculation method of dewatering settlement in saturated loess stratum. Hydrogeol. Eng. Geol. 2025, 52, 174–185. [Google Scholar]
- Hu, C.M.; Lin, C. Simplified algorithm for land subsidence induced by dewatering in phreatic area of deep foundation pit in loess. Chin. J. Geol. Hazard Control 2021, 32, 76–83. [Google Scholar]
- Mei, Y.; Zhang, M.; Zhou, D.; Zhang, Y.; Xu, W.; Ruan, Y.; Lu, X. Features and control of deep excavation in wet-collapsible loess areas of Xi’an, China. Proc. Inst. Civ. Eng. Civ. Eng. 2025, 178, 658–669. [Google Scholar] [CrossRef] [Scilit]
- Zhang, Z.Q. Stress analysis and deformation control of pile-anchored support in deep foundation excavations in loess area. Constr. Technol. 2025, 54, 88–94. [Google Scholar]
- Zhu, Y.; Zhou, X.; Wei, S.; Tan, Y. Investigation on deformation behaviors of foundation pit adjacent to existing metro stations. Rock Soil Mech. 2013, 34, 2997–3002. [Google Scholar]
- Ma, Y.; Kang, M.; Li, H.; Zhen, J.; Yin, X.; Hao, J.; Hu, S.; Sun, J.; Cheng, X.; Zheng, G. Investigating the coupling deformation mechanism of asymmetric deep excavation adjacent to a shared-wall metro station and elevated bridge piles in soft soil. Buildings 2026, 16, 480. [Google Scholar] [CrossRef] [Scilit]
- Mao, Z.; Ding, T.; Hu, F.; Ye, S.; Ding, L.; Shu, R.; Zhang, X.; Song, M. The deformation characteristics and patterns of adjacent existing metro structures caused by foundation pit excavation under different support forms. Buildings 2025, 15, 4178. [Google Scholar] [CrossRef] [Scilit]
- Lai, F.; Tschuchnigg, F.; Schweiger, H.F.; Liu, S.; Shiau, J.; Cai, G. A numerical study of deep excavations adjacent to existing tunnels: Integrating CPTU and SDMT to calibrate soil constitutive model. Can. Geotech. J. 2025, 62, 1–23. [Google Scholar] [CrossRef] [Scilit]
- Chen, S.L.; Zhang, F.; Dan, N. Studies on stress and deformation behaviors of deep excavations adjacent to substructures. J. Shanghai Jiaotong Univ. 2016, 50, 1658–1664. [Google Scholar]
- Xue, T.; Xue, X.; Long, S.; Chen, Q.; Lu, S.; Zeng, C. Effect of pre-existing underground structures on groundwater flow and strata movement induced by dewatering and excavation. Water 2023, 15, 814. [Google Scholar] [CrossRef] [Scilit]
- Huang, G.; Liu, Z.; Wang, Y.; Yang, Y. A multi-objective prediction XGBoost model for predicting ground settlement, station settlement, and pit deformation induced by ultra-deep foundation construction. Buildings 2024, 14, 2996. [Google Scholar] [CrossRef] [Scilit]
- Hu, T.; Xu, J.M. Prediction of buildings’ settlements induced by deep foundation pit construction based on LSTM-RA-ANN. Appl. Sci. 2024, 14, 5021. [Google Scholar] [CrossRef] [Scilit]
- Fan, H.; Li, L.; Zhou, S.; Zhu, M.; Wang, M. Prediction and risk assessment of lateral collapse in deep foundation pits using machine learning. Autom. Constr. 2025, 171, 106011. [Google Scholar] [CrossRef] [Scilit]
- Kong, M.W.; Qin, Y.; Zhang, C. Parameters determination methods and project validation of hardening soil model with small strain stiffness based on finite element method. Sci. Rep. 2025, 15, 98186. [Google Scholar] [CrossRef] [Scilit] [PubMed]
- Benz, T. Small-Strain Stiffness of Soils and Its Numerical Consequences. Ph.D. Thesis, University of Stuttgart, Stuttgart, Germany, 2006. [Google Scholar]
- Guo, H.T.; Sun, Q.L.; Yuan, C.W.; Li, X.Q.; Li, J.W. Numerical simulation analysis of deformation and stress of deep foundation pit support structure based on HS and HSS models. J. Water Resour. Archit. Eng. 2025, 23, 71–79. [Google Scholar]
- Hsu, C.F.; Tsai, Y.H.; Chen, Y.R.; Li, Y.F.; Chen, S.L. Effects of changing adjacent building conditions on ground settlement profiles around deep excavation construction. J. Asian Archit. Build. Eng. 2025, 24, 5239–5256. [Google Scholar] [CrossRef] [Scilit]
- Yao, H.; He, W.; Wang, M.; Yang, L. Study on the settlement change law of adjacent buildings caused by deep excavation construction in saturated soft loess geology. In Geotechnical Modeling and Intelligent Systems; Zhao, G.F., Ed.; Springer: Singapore, 2026; pp. 32–45. [Google Scholar]
- He, J.F.; Yao, L.H.; Wei, L.J.; Zhu, Y.P.; Chen, C.; Ma, S.J. Application of row pile–jet grouting anchor supporting structure in complicated deep foun-dation excavation close to subway station. Constr. Technol. 2018, 47, 113–116. (In Chinese) [Google Scholar]
- Gao, S.; Cheng, X.; Dong, M.; Cheng, B.; Zhang, Y.; Ma, Y. Impact analysis and deformation control measures for zero-distance deep and large excavation adjacent to both sides of an existing subway station. Ind. Constr. 2025, 55, 217–225. [Google Scholar] [CrossRef] [Scilit]
- Imoh, U.U.; Apata, A.C.; Bolorunduro, A.M.; Rad, M.M. Mechanistic and comparative laboratory assessment of lime dosage and uniaxial geogrid on the strength and durability of classified lateritic subgrade. Sci. Rep. 2025, 15, 30041. [Google Scholar] [CrossRef] [Scilit] [PubMed]
- Neuman, S.P. Saturated-unsaturated seepage by finite elements. J. Hydraul. Div. ASCE 1973, 99, 2233–2250. [Google Scholar] [CrossRef] [Scilit]
- Lam, L.; Fredlund, D.G.; Barbour, S.L. Transient seepage model for saturated–unsaturated soil systems: A geotechnical engineering approach. Can. Geotech. J. 1987, 24, 565–580. [Google Scholar] [CrossRef] [Scilit]
- Terzaghi, K. Theoretical Soil Mechanics; John Wiley & Sons, Inc.: New York, NY, USA, 1943. [Google Scholar]
- Zheng, J.J.; Zhang, R.J.; Pan, Y.T.; Cui, L. Analysis method for passive piles considering excavation unloading and deformation coupling effects. Chin. J. Geotech. Eng. 2012, 34, 606–614. [Google Scholar]
- Wen, Z.Y.; Zhang, L.J.; Chen, S.; Zhang, Y.N. Study on the influence of excavation deformation of retaining wall on adjacent metro tunnel. Subgrade Eng. 2014, 176, 144–148. [Google Scholar]
- Yang, Z.; Wu, J.B.; Zhao, Y.Z.; Li, B.; Du, J.C.; Tan, C.Y. Finite element simulation and monitoring of the influence of deep foundation pit excavation of subway on adjacent buildings. J. Archit. Civ. Eng. 2016, 33, 121–126. [Google Scholar]
- Fang, T.; Ouyang, P.Q.; Yu, S.H.; Fan, W.Y.; Zhu, X.J.; Xia, L.L. Deformation analysis of limited soil foundation pit excavation based on HSS soil constitutive model. J. Lanzhou Jiaotong Univ. 2025, 44, 1–10. [Google Scholar]
- Han, X.; Ye, F.; Han, X.; Ren, C.; Song, J.; Zhao, R. Mechanical responses of underground carriageway structures due to construction of metro tunnels beneath the existing structure: A case study. Deep. Undergr. Sci. Eng. 2024, 3, 231–246. [Google Scholar] [CrossRef] [Scilit]
- Jiang, Z.; Zhu, S.; Que, X.; Ge, X. Deformation effects of deep foundation pit excavation on retaining structures and adjacent subway stations. Buildings 2024, 14, 2521. [Google Scholar] [CrossRef] [Scilit]
- The National Standards Compilation Group of People’s Republic of China. GB50497—2019; Technical Standard for Monitoring of Building Foundation Pit Engineering; China Planning Press: Beijing, China, 2019. (In Chinese) [Google Scholar]
- Zou, W.B.; Zhang, D.M.; Cai, X.W. Real-time monitoring and numerical analysis of adjacent subway deformation caused by foundation pit excavation. Chin. J. Undergr. Space Eng. 2012, 8, 1728–1731. [Google Scholar]
- Wei, G.; Mu, Z.; Feng, W.; Qi, Y.; Guo, B. Effects of foundation pit excavation on adjacent metro stations and shield tunnel structures: A study on horizontal displacement. Eng. Comput. 2024, 41, 2356–2380. [Google Scholar] [CrossRef] [Scilit]
- Imoh, U.U.; Nagy, R.; Movahedi Rad, M. Micro-mechanical characterization of polymer-modified asphalt mixtures using discrete element modelling with soft-bond and linear contact bond models. Constr. Build. Mater. 2025, 501, 144325. [Google Scholar] [CrossRef] [Scilit]
- Wang, L.; Zhang, P.; Ding, H.; Tian, Y.; Qi, X. The uplift capacity of single-plate helical pile in shallow dense sand including the influence of installation. Mar. Struct. 2020, 71, 102697. [Google Scholar] [CrossRef] [Scilit]
- Wang, L.; Zhang, L.; Chen, H.; Zhang, T.; Yi, J.; Zhang, J.; Zhou, T.; Chen, L.; Xu, Y.; Tian, Y.; et al. Combined effects of anchor geometry and soil spatial variability on the probabilistic pullout capacity of helical anchors. Comput. Geotech. 2026, 200, 108482. [Google Scholar] [CrossRef] [Scilit]
- Zhang, T.; Wang, L.; Chen, L.; Lu, W.; Hao, D.; Shao, W.; Zhang, C.; Tian, Y. Numerical analysis of post-cyclic ultimate bearing capacity of helical anchors in clay. Ocean Eng. 2026, 352, 124583. [Google Scholar] [CrossRef] [Scilit]
- Feng, L.; Guo, M.; Wang, W.; Chen, Y.; Shi, Q.; Guo, W.; Lou, Y.; Kang, H.; Chen, Z.; Zhu, Y. Comparative analysis of machine learning methods and a physical model for shallow landslide risk modeling. Sustainability 2023, 15, 6. [Google Scholar] [CrossRef] [Scilit]

Disclaimer/Publisher’s Note: The statements, opinions and data contained in all publications are solely those of the individual author(s) and contributor(s) and not of MDPI and/or the editor(s). MDPI and/or the editor(s) disclaim responsibility for any injury to people or property resulting from any ideas, methods, instructions or products referred to in the content. |
© 2026 by the authors. Licensee MDPI, Basel, Switzerland. This article is an open access article distributed under the terms and conditions of the Creative Commons Attribution (CC BY) license.