


Abstract
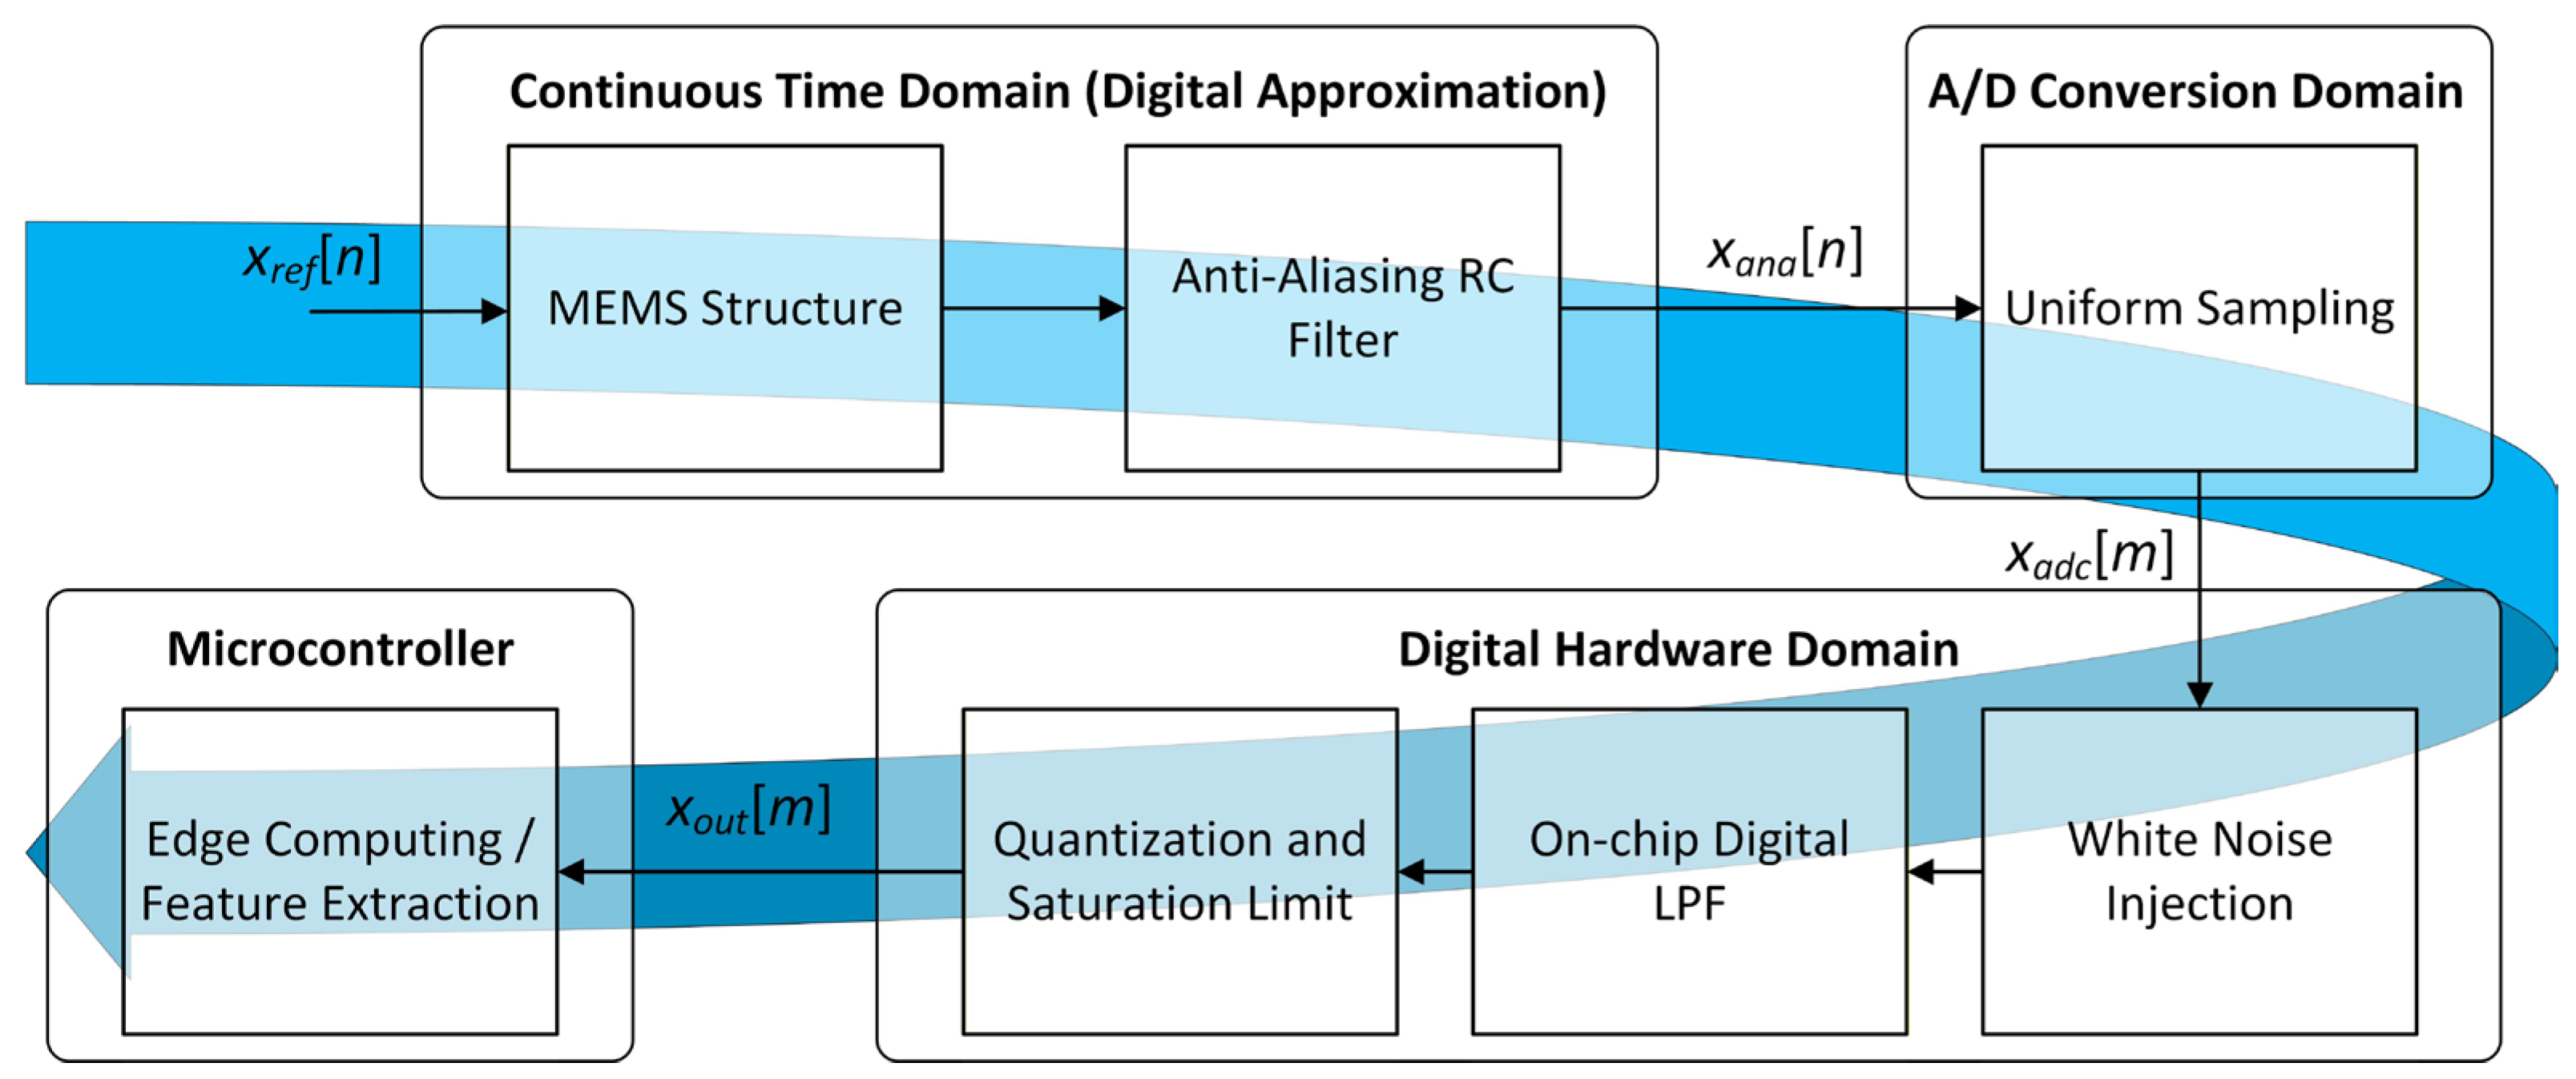
The deployment of autonomous predictive vibration-based diagnostics in Edge-IIoT requires balancing the cost of Micro-Electro-Mechanical System (MEMS) accelerometers against their metrological limitations. This study proposes a parametric Sensor Digital Twin (SDT) framework for virtual benchmarking of measurement chains at the hardware-software co-design stage. The SDT model emulates mechanical and electrical filtering, aliasing, noise, and quantization; its fidelity was validated experimentally using a physical ADXL345 sensor, with an RMS noise error of 8.56%. Virtual profiles of the commercial ADXL345 and ADXL357 sensors were generated using the reference NLN-EMP centrifugal pump dataset acquired with a Wilcoxon 786B-10 piezoelectric accelerometer. Their diagnostic performance was evaluated using eight diagnostic features and five heterogeneous machine-learning algorithms under interpolation, forward extrapolation, and backward extrapolation scenarios across fault severity levels. In the interpolation scenario, the ADXL345 and ADXL357 profiles achieved Macro F1-scores of 0.8999 and 0.8947, respectively, compared with 0.9567 for the reference measurement chain. In the forward extrapolation scenario, the ADXL357 profile achieved a Macro F1-score of 0.7171, compared with 0.6768 for the reference measurement chain. The results confirm that the SDT can support sensor hardware selection through virtual benchmarking, while the considered MEMS accelerometers provide comparable diagnostic performance in the evaluated scenarios when a representative training dataset is available.
1. Introduction
1.1. Research Motivation
Centrifugal pump units are currently among the most critical components of industrial infrastructure across a wide range of sectors, including the oil and gas industry, chemical processing, power generation, water supply, and wastewater treatment. According to industry estimates, they account for up to 70% of the global installed base of pumping equipment [1], while in the chemical industry this figure reaches 90% [2]. The widespread deployment of centrifugal pumps makes their reliability and energy efficiency critical to the overall performance of industrial processes. For example, in municipal water supply and wastewater treatment systems, pumping equipment may account for up to 25% of total electricity consumption, while its operation represents approximately 10% of overall operating costs [3].
Given the widespread use of these assets, their reliability and energy efficiency are critical to sustaining industrial operations. Therefore, operational defects can result in significant direct and indirect economic losses [4]. Consequently, ensuring reliable, uninterrupted operation of centrifugal pump units has become a key priority in modern industry.
The development of the Industry 4.0 paradigm has accelerated the adoption of Industrial Internet of Things (IIoT) technologies for monitoring and lifecycle management of industrial equipment [5]. This digital transformation aims to transition from reactive and preventive maintenance strategies to Predictive Maintenance (PdM), which relies on continuous monitoring of equipment condition and forecasting potential failures [6]. Implementing this approach requires continuous acquisition of diagnostic data directly at the operational site.
In this context, Low-Power Wide-Area Network (LPWAN) technologies, such as LoRaWAN and NB-IoT, combined with autonomous wireless edge devices, are among the most promising hardware platforms for distributed condition-monitoring systems [7,8]. Their application to pumping equipment enables scalable diagnostic networks across large fleets of pump units while maintaining relatively low infrastructure deployment and operating costs [9].
MEMS (Micro-Electro-Mechanical Systems) accelerometers are commonly employed for vibration measurement in autonomous Edge-IIoT nodes because they combine compact dimensions, low power consumption, and low cost. However, their widespread adoption in predictive diagnostics introduces a fundamental trade-off between economic efficiency and diagnostic capability.
On the one hand, reducing the cost and power consumption of sensor nodes requires low-cost consumer-grade or entry-level industrial MEMS accelerometers [10,11]. On the other hand, this optimization inevitably limits their metrological characteristics, including relatively low sampling rates (typically no higher than 1–3 kHz), limited analog-to-digital converter resolution (10–13 bits), elevated intrinsic thermal noise, and simplified analog anti-aliasing filters.
At the same time, effective detection of various critical centrifugal pump defects, including local damage to rolling-element bearings, fatigue failure of coupling components, hydrodynamic cavitation, and others, has traditionally relied on analyzing high-frequency vibration components generated by impact events and excitation of structural resonances [12]. In industrial practice, such signals are typically acquired using IEPE (ICP) piezoelectric accelerometers, which provide a wide bandwidth ranging from several kilohertz to tens of kilohertz, low intrinsic noise, and high dynamic accuracy, together with high-performance data acquisition systems [13].
Thus, a fundamental question arises: to what extent does the combined effect of the hardware limitations of low-cost MEMS accelerometers affect the ability to detect different types of pump faults, and can measurement chains with different metrological characteristics provide the required diagnostic performance? Addressing this question is essential for the rational design of Edge-IIoT systems for predictive maintenance.
In practice, this uncertainty is typically addressed through experimental hardware-software prototyping, which involves developing multiple sensor-node implementations based on different accelerometer integrated circuits, followed by their experimental evaluation using dedicated test rigs. Although this approach provides highly reliable results, it requires considerable time and financial resources, significantly complicating the design process and extending the development cycle of IIoT-based monitoring systems.
Accordingly, a key scientific and engineering challenge is developing virtual benchmarking methods for MEMS sensors that enable quantitative assessment of how measurement-chain characteristics affect diagnostic performance during the design stage of Edge-IIoT systems.
1.2. Current State of the Art
In recent years, the hardware limitations of low-cost diagnostic IIoT systems have received growing research attention. Most studies have focused on experimentally evaluating the diagnostic capabilities of MEMS accelerometers, including sensitivity analysis [14], assessing the accuracy of low-amplitude vibration measurements [15], and comparative benchmarking of different sensor models [16]. Several studies have linked measurement-chain hardware characteristics to machine learning (ML) algorithm performance. In [17], the transfer of a diagnostic model between piezoelectric and MEMS sensors was investigated, while ref. [18] demonstrated the effect of sampling rate on bearing fault classification performance.
Despite the practical relevance of these studies, their assessment of the impact of hardware characteristics is based on experimentally acquired data and does not enable parametric virtual benchmarking of alternative measurement chains at the design stage.
In parallel, researchers have actively developed digital modeling approaches for predictive diagnostics applications [19]. Digital Twins of centrifugal pump units have been successfully used for equipment condition modeling, remaining useful life prediction, and synthetic diagnostic data generation [20,21,22]. At the same time, there is a growing interest in hybrid predictive maintenance architectures that integrate Digital Twins, Edge AI, IIoT infrastructure, and ML algorithms [23,24]. These architectures are designed to jointly optimize monitoring, data processing, and decision-making processes. However, the measurement subsystem parameters are generally treated as fixed hardware characteristics rather than design variables which are to be jointly optimized with signal processing and ML algorithms.
A similar assumption applies to Virtual Sensing technologies, which are designed to estimate unmeasured physical quantities from data acquired by existing sensors [25,26]. Contemporary research in Edge AI and TinyML is primarily focused on deploying ML algorithms directly on edge devices and improving their computational efficiency under resource-constrained conditions [17,27]. The measurement chain and the sensor’s metrological characteristics are generally treated as immutable hardware components and therefore excluded from the co-design of diagnostic algorithms.
A separate line of research concerns system-level modeling of sensor measurement characteristics. In [28], a universal parametric model was proposed that accounts for the main deterministic and stochastic distortions of the measurement chain. However, changes in sampling rate and the resulting aliasing effects are not considered as separate stages of the model. Another approach is implemented in the Sensor-in-the-Loop concept [29], in which prerecorded or synthetic data are supplied in real time to a smart-sensor hardware-software platform for reproducible testing. However, these approaches are not intended for virtual sensor hardware selection in Edge-IIoT vibration diagnostics and do not evaluate the impact of a specific measurement chain directly in terms of final diagnostic performance.
As a result, the systematic impact of sensor metrological characteristics on diagnostic observability of defects and ML algorithm performance remains insufficiently investigated. This significantly complicates sensor hardware selection during Edge-IIoT system design and forces developers to rely on costly experimental prototyping.
To address this gap, this study proposes the Sensor Digital Twin (SDT) concept, which represents a parametric model of a specific accelerometer’s measurement chain. The novelty of the proposed approach lies in integrating individual modeling operations into a unified methodology in which a physically recorded reference vibration signal is subjected to controlled mathematical degradation according to the characteristics of the target sensor. Unlike existing models, which primarily focus on reproducing sensor characteristics or testing their hardware-software implementation [28,29], the SDT is used for virtual benchmarking of sensor hardware for Edge-IIoT systems, with the impact of the complete measurement chain evaluated directly in terms of changes in diagnostic performance. In this way, the measurement chain is incorporated into the hardware-software co-design framework as a designable element of sensor hardware selection.
For centrifugal pump units, this approach enables algorithmic assessment of whether low-cost MEMS accelerometers can detect complex hydrodynamic and mechanical defects without costly physical testing.
1.3. Research Objectives
Based on the foregoing, this study aims to develop a virtual prototyping methodology for measurement nodes based on the Sensor Digital Twin (SDT) concept to support hardware selection for Edge-IIoT vibration diagnostics systems of centrifugal pumps.
To achieve this objective, the following research tasks were defined:
- To develop a multifactor parametric vibration signal degradation model SDT that accounts for the frequency response, aliasing effects, quantization, and intrinsic noise characteristics of MEMS accelerometers of different performance classes, and to validate the SDT experimentally using physical hardware measurements of noise and digitization characteristics.
- To generate a synthetic vibration diagnostics dataset representing the operation of a centrifugal pump unit under mechanical, tribological, and hydrodynamic defect conditions while accounting for the characteristics of signal digitization in low-cost IIoT devices.
- To develop a unified diagnostic feature extraction pipeline that combines broadband statistical analysis with narrowband estimation of vibration kinematic parameters.
- To evaluate the impact of hardware metrological limitations on the diagnostic performance of ML algorithms for centrifugal pump fault classification.
2. Materials and Methods
2.1. Multifactor Parametric Model of Vibration Signal Degradation
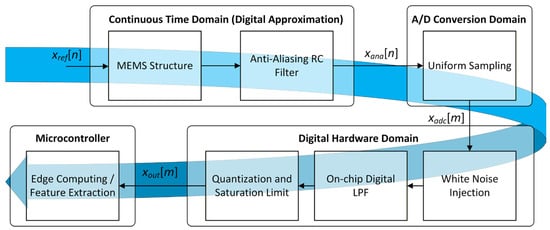
In this study, SDT refers to a multifactor parametric signal degradation model. The model comprises a sequence of transfer functions and mathematical constraints that emulate, as closely as possible, the propagation of a vibroacoustic signal through the stages of an actual MEMS accelerometer measurement chain. This enables high-precision laboratory measurements to be used as reference physical excitation for virtual benchmarking of low-cost Edge-IIoT devices. Figure 1 shows the overall block diagram of the proposed model.
Figure 1.
Block diagram of the multifactor parametric vibration signal degradation model Sensor Digital Twin (SDT).
As shown in Figure 1, the model implements a cascade of transformations that converts the reference physical excitation into the digital code stored in the target MEMS sensor’s memory registers.
The model input is a discrete time series xref[n] acquired using a reference measurement system at a high sampling rate Fref. The methodology assumes a high oversampling ratio, such that the reference sampling rate substantially exceeds the emulated target sensor sampling rate, Fref >> Ftarget. Accordingly, xref[n] is treated as a densely sampled approximation of the underlying continuous-time signal.
The signal degradation process is divided into three functional stages.
2.1.1. Continuous-Time Domain (Digital Approximation)
In the first stage, the sensor structure and analog front-end circuitry response to the physical vibration input is modeled (Continuous-Time Domain (Digital Approximation) in Figure 1). In an actual sensor, these processes are described by continuous-time transfer functions H(s) in the s-domain. In the proposed digital model, these continuous-time transfer functions are approximated by discrete-time infinite impulse response (IIR) filters H(z) obtained via the bilinear transform using the reference sampling rate Fref.
The signal is sequentially processed by two filters:
- a mechanical filter (MEMS Structure in Figure 1), which approximates the mechanical frequency response of the accelerometer’s silicon suspension by a second-order Butterworth low-pass filter (LPF) with a characteristic frequency fc_mech, damping ratio ζ = 0.7071, and quality factor Q = 0.7071. These parameters characterize the reduced-order model and are not interpreted as the physical characteristics of the actual MEMS suspension, whose exact internal structure and parameters are not disclosed by the manufacturer;
- an anti-aliasing filter (Anti-Aliasing RC Filter in Figure 1), which approximates the analog electrical RC network preceding the analog-to-digital converter (ADC) by a first-order Butterworth LPF with a cutoff frequency fc_ana.
Thus, although the physical processes occur in continuous time (the s-domain), within the digital approximation the signal in the z-domain is expressed as:
2.1.2. A/D Conversion Domain
A key stage of the modeling process is the transition from the highly sampled reference signal indexed by n (sampling rate Fref) to the target discrete-time grid indexed by m at the target sensor ADC sampling rate Ftarget (A/D Conversion Domain in Figure 1).
To provide a physically realistic representation of aliasing, conventional decimation using idealized polyphase filters was not employed. Instead, the analog-to-digital conversion process was modeled by uniform sampling, with the signal values at the sampling instants obtained by linear interpolation between time samples.
This approach preserves high-frequency components not attenuated by the anti-aliasing filter, enabling the resulting aliasing to be reproduced.
2.1.3. Digital Hardware Domain
At the final stage (Digital Hardware Domain in Figure 1), distortions characteristic of the sensor’s digital electronics are sequentially applied to the digitized signal xadc[m].
The White Noise Injection block in Figure 1 introduces additive white Gaussian noise before digital filtering.
The root-mean-square (RMS) noise σnoise is calculated from the sensor’s datasheet noise spectral density (NSD, specified in ) using the approximate relationship:
assuming a white-noise spectrum and an effective noise bandwidth equal to the Nyquist bandwidth.
The noisy signal is passed through the on-chip digital filter Hdig(z) at the On-chip Digital LPF stage in Figure 1. For low-cost sensors, a first-order IIR filter model is used. For industrial-grade sensors with a Σ-Δ ADC, the hardware decimation chain is approximated by a high-order Butterworth IIR filter (N = 8). This approximation reproduces the steep roll-off of the actual chip’s frequency response.
The digital filter coefficients were generated using the scipy.signal.butter function from the SciPy 1.15.3 Python library in second-order sections (SOS) form. Filtering was performed with zero initial conditions. The Butterworth filter’s nonlinear phase distortion can be neglected in this model because the diagnostic feature vector extracted at the next stage is phase-invariant.
During saturation and quantization (Quantization and Saturation Limit block in Figure 1), the filtered signal xfilt[m] is clipped to the hardware full-scale limits [−Gmax, +Gmax] and then quantized. The quantization step Δ is determined by the ADC resolution B (in bits):
The resulting discrete signal xout[m], stored in the virtual sensor’s memory registers, is described by:
The resulting array xout[m] corresponds to the data format transmitted by an actual sensor to the Edge-device microcontroller via the I2C/SPI bus for subsequent diagnostic feature extraction.
The proposed model includes only the dominant factors (bandwidth, sampling rate, noise, and quantization) that most affect the diagnostic information. Cross-axis sensitivity, amplitude nonlinearity, and temperature effects were not modeled in the current SDT implementation and were treated as second-order factors. A quantitative assessment of their potential contribution for the selected sensor profiles is provided in Section 2.2.
2.2. Dataset Preparation and Parameterization of Target Sensor Profiles
The reference physical excitation (signal xref[n] in Figure 1) is represented by the open-access NLN-EMP dataset [30], which includes data from independent experimental sessions on two centrifugal pump units (Motor-4 and Motor-2). This dataset was selected because the measurement chain employed high-precision Wilcoxon 786B-10 piezoelectric accelerometers (Wilcoxon Sensing Technologies, USA) [31], with a sampling rate of Fref = 20 kHz and a flat frequency response up to 14 kHz. This satisfies the condition Fref >> Ftarget and allows the recorded signals to serve as a reference analog equivalent for measurement chain modeling.
For the Motor-4 unit, measurements were performed at a fixed rotational speed (70% of the rated speed). The modeled set of anomalies comprised nine conditions: normal operation (Healthy), motor and pump rotor unbalance (Unbalance Motor/Pump), three types of misalignments (Align Angular, Parallel, Combination), flexible coupling defects (Coupling), and pump-specific hydrodynamic cavitation on the suction and discharge sides (Cavitation Suction/Discharge).
For the Motor-2 unit, the experiments covered a different group of defects recorded at three operating speeds (50%, 75%, and 100% of the rated speed). To ensure metrological consistency, the study excluded electrical anomalies and defects with more than two severity levels from the analyzed dataset. Thus, the conditions analyzed for Motor-2 were the healthy condition, hydrodynamic impeller damage (Impeller), and rolling-element bearing defects (BPFO, BPFI, Bearing Pump). The availability of multiple defect severity levels makes this dataset suitable for testing algorithms under extrapolation scenarios.
The fault severity levels and the methods used to physically introduce each fault were adopted from the original description of the NLN-EMP dataset [30] and were not redefined in this study; detailed physical parameters of the corresponding severity levels are provided in the original dataset publication.
Because the study focuses on evaluating sensor hardware limitations, multiple operating speeds were not used to avoid a feature-domain shift that could mask degradation in vibration signal quality in the measurement chain. To eliminate variability due to operating conditions, the analysis was performed at fixed operating speeds: 70% of the rated speed for the Motor-4 unit and 100% (1480 rpm) for the Motor-2 unit.
For virtual benchmarking, profiles of two target sensors, ADXL345 [32] and ADXL357 (Analog Devices, USA) [33], representing two widely used classes of MEMS accelerometers, were configured in the proposed digital model (Section 2.1) using the characteristics specified in Table 1.
Table 1.
Parameters of the reference measurement chain and MEMS sensor profiles.
An additional order-of-magnitude assessment of the neglected factors was performed based on the datasheet specifications of the selected sensors. Cross-axis sensitivity is approximately 1%. Amplitude nonlinearity does not exceed 0.5% FSR for the ADXL345 and 1.3% for the ADXL357. The temperature coefficient of zero offset reaches ±0.4/±1.2 mg/°C for the X(Y)/Z axes of the ADXL345 and up to ±0.75 mg/°C for the ADXL357, whereas the temperature-dependent sensitivity variation is approximately ±0.01%/°C for both sensors. For a temperature change of 25 °C, this corresponds to a sensitivity variation of approximately ±0.25%. The constant component of the temperature-induced zero offset is largely suppressed in the employed processing pipeline by signal mean-centering and exclusion of frequencies below 10 Hz (Section 2.3), whereas temperature-induced scale-factor drift and amplitude nonlinearity remain secondary error sources.
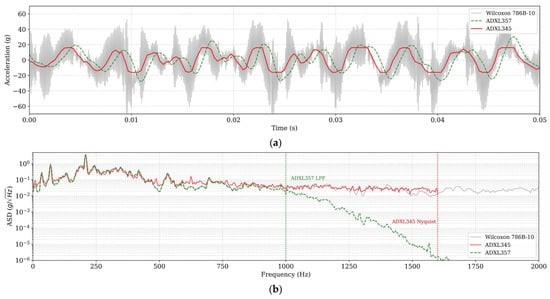
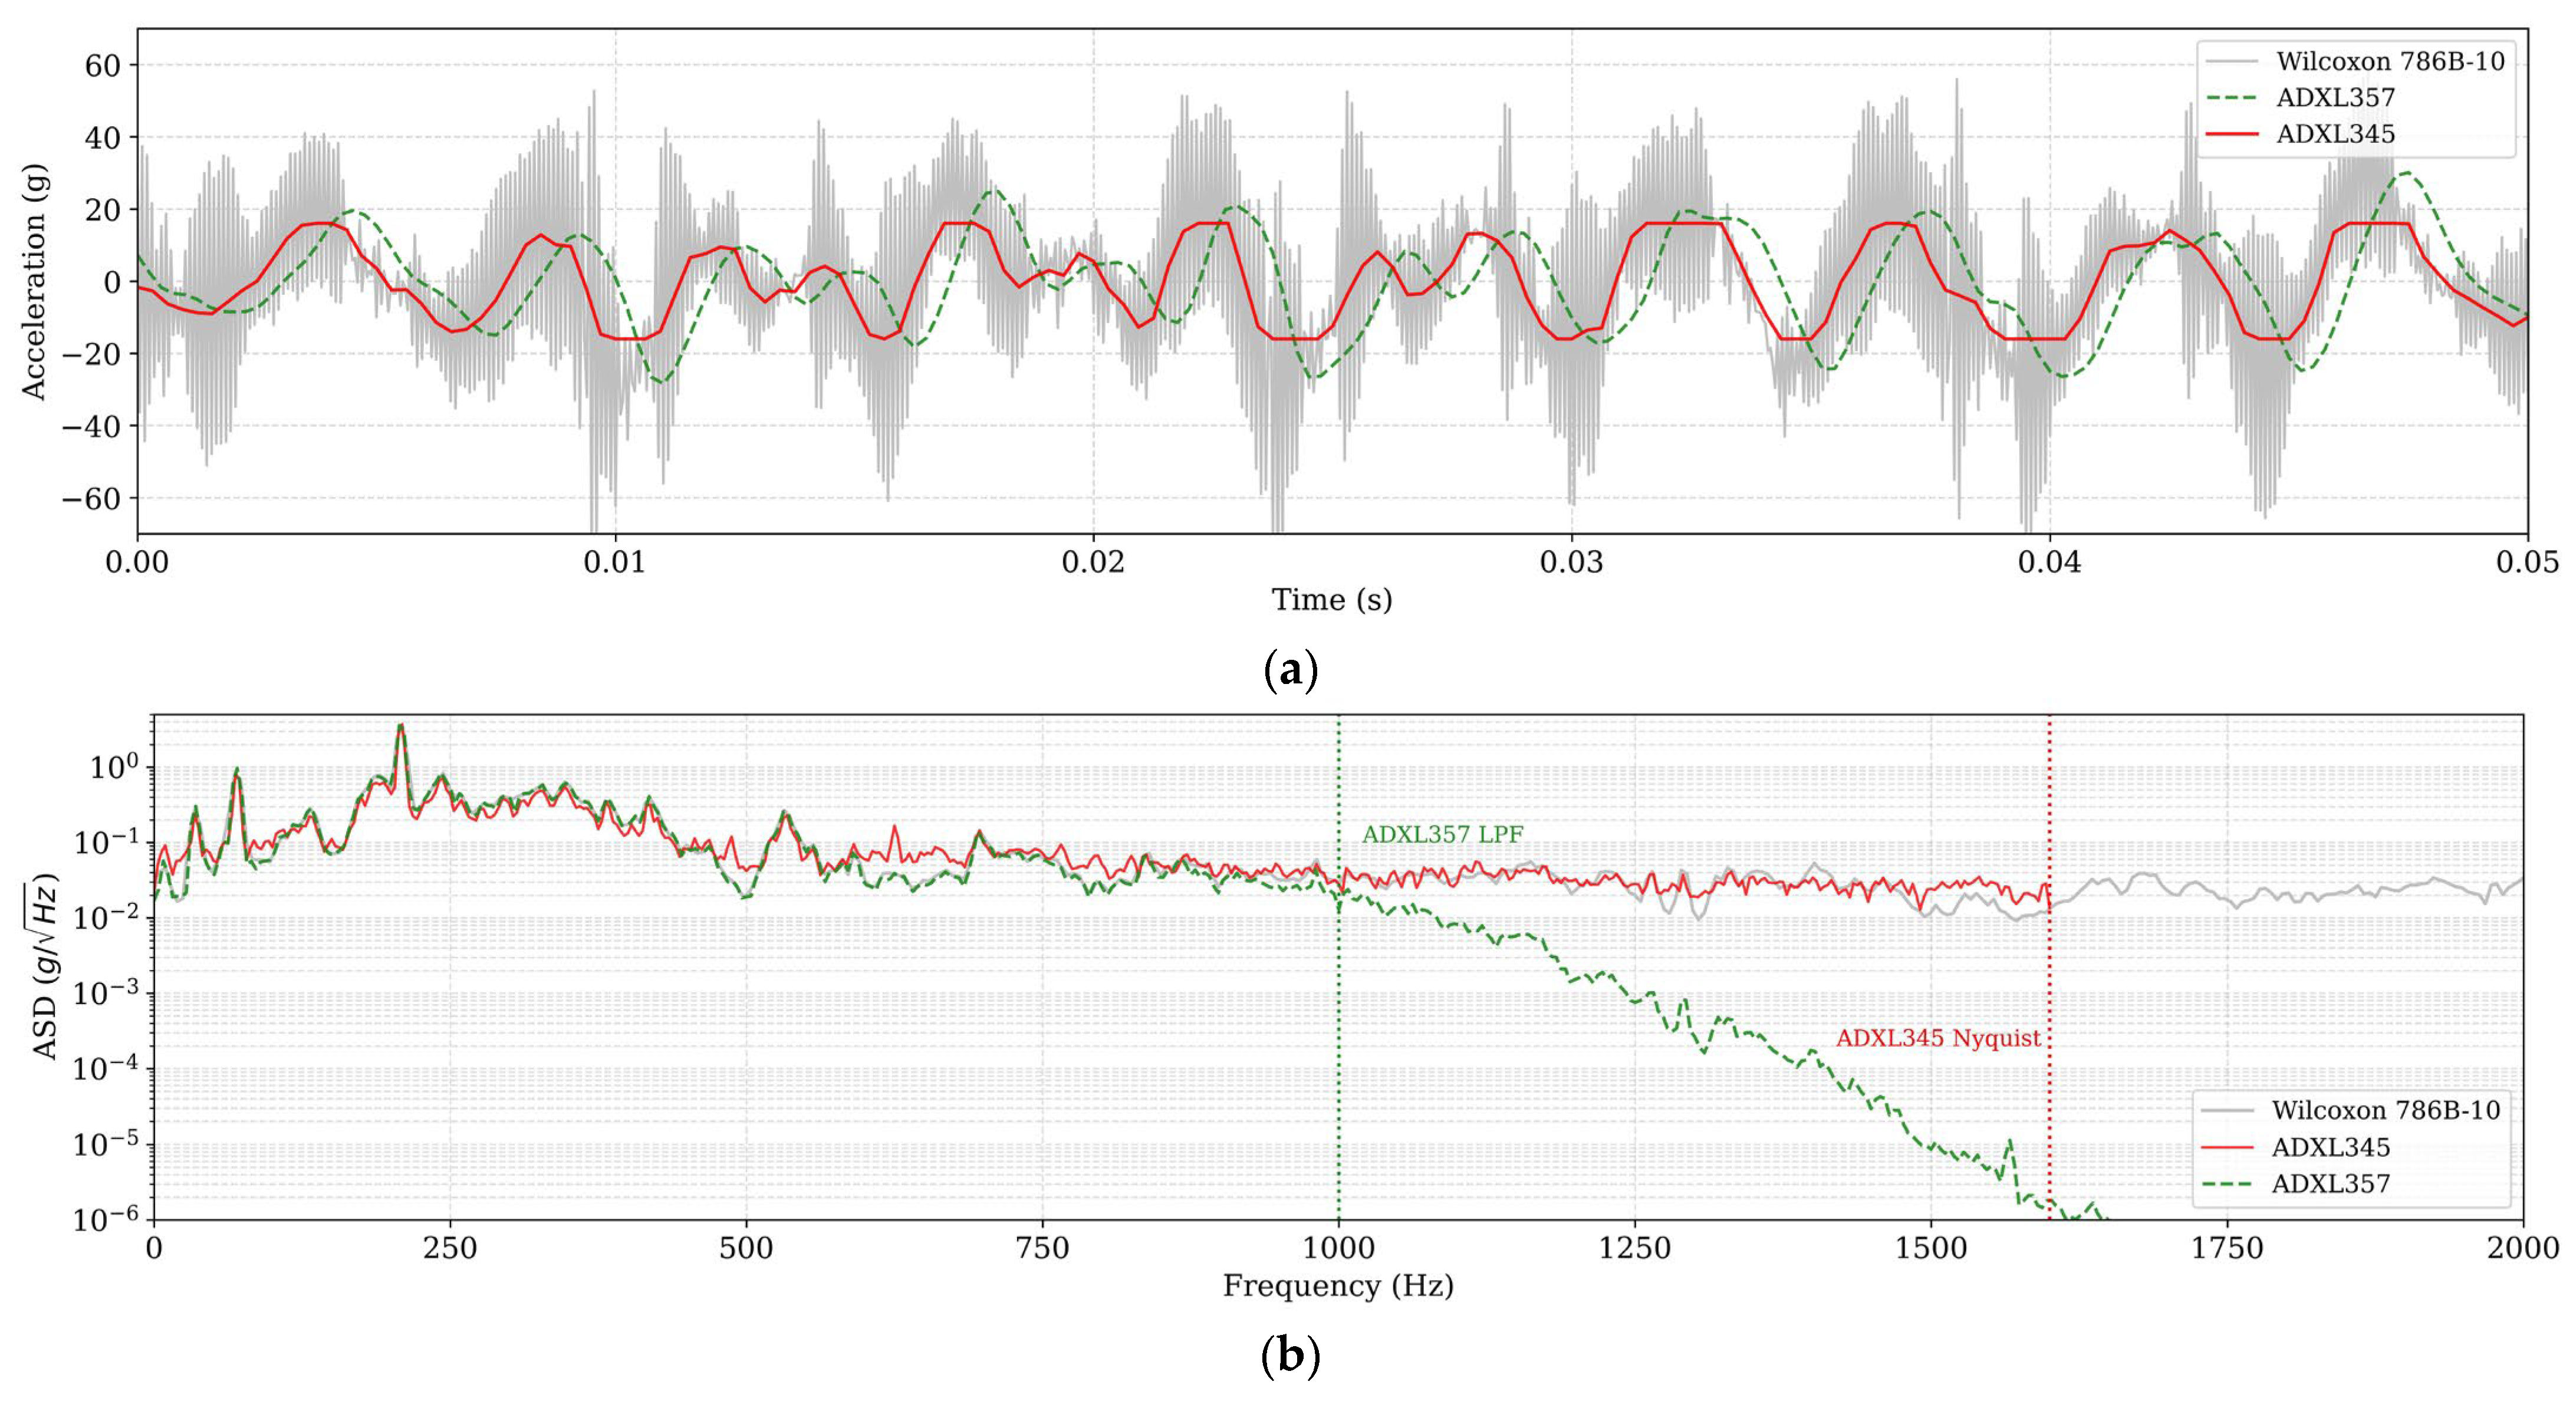
The entire reference dataset was processed using the parametric model to generate corresponding synthetic datasets. Figure 2 provides a comparative visualization of the SDT response for a transient process (hydrodynamic cavitation; file “Vibration_Motor-4_70_time-cavitation suction 4-ch1.csv” from the NLN-EMP dataset).
Figure 2.
Visualization of SDT operation in modeling MEMS accelerometer measurement chains: (a) Time-domain signals; (b) Amplitude spectral density (ASD) estimated using Welch’s method.
As shown in Figure 2a, the effects of dynamic range limitation are evident in the time domain. The ADXL345 profile (red curve) exhibits severe amplitude saturation (clipping), whereas the ADXL357 profile (green dashed curve) reproduces a smoothed version of the original signal without peak clipping. Both profiles exhibit a time shift relative to the reference signal, corresponding to the group delay introduced by the causal filters.
The amplitude spectral density in Figure 2b, estimated using Welch’s method, shows that the piezoelectric sensor signal (gray curve) contains broadband spectral components above 1 kHz. The ADXL345 profile maintains a comparable spectral density level up to the Nyquist frequency (1.6 kHz). In contrast, the ADXL357 profile shows a steep spectral roll-off around the 1 kHz cutoff frequency, strongly attenuating components above it.
2.3. Unified Diagnostic Feature Extraction Pipeline
The proposed concept is intended for autonomous Edge-IIoT devices; therefore, diagnostic features are extracted immediately after SDT-based modeling of the measurement chain. This approach ensures the feature space is built from signals whose characteristics match those available from a specific MEMS accelerometer.
LPWAN technologies (LoRaWAN, NB-IoT, etc.) impose stringent constraints on data transmission volume and sensor-node power consumption. Transmitting raw vibroacoustic signals to the cloud is practically infeasible; therefore, this study implements a unified edge-processing pipeline (Edge Computing/Feature Extraction in Figure 1) that transforms each time window into a compact diagnostic feature vector comprising eight parameters.
The analysis window length was set to Tw = 0.64 s, corresponding to 2048 samples at a sampling rate of 3200 Hz (2560 samples at 4000 Hz). The signals were segmented into consecutive non-overlapping windows with the stride equal to the window length (overlap = 0%). This window provides a frequency resolution of Δfw = 1/Tw ≈ 1.56 Hz, sufficient for robust estimation of spectral characteristics in the subsequent calculation of vibration kinematic parameters. To eliminate filter transients caused by digital filtering, the initial 100 ms settling interval was systematically discarded from each signal before windowing and feature extraction.
To enable simultaneous detection of rapidly developing localized damage and slowly evolving mechanical defects, the feature set was divided into two complementary groups.
- Broadband statistical features. These features are computed directly from the time-domain signal using the full available bandwidth of the modeled measurement chain. This approach preserves as much information as possible on high-frequency impulsive components associated with rolling-element bearing defects, hydrodynamic cavitation, and other rapidly developing damage [4,12]. The features used are standard deviation σ, skewness S, kurtosis K, and crest factor CF [34]. Before calculating the statistical characteristics, the signal is automatically mean-centered, eliminating the influence of the DC component. This group of features was selected because of the high sensitivity of these features to impulsive processes and their computational complexity, which is compatible with the resource constraints of low-power Edge devices.
- Narrowband kinematic features. To preserve the diagnostic information contained across the entire measured frequency band, the root-mean-square (RMS) acceleration ARMS and the maximum spectral amplitude of acceleration APeak are additionally determined after computing the real fast Fourier transform (RFFT). These features are calculated over the MEMS accelerometer’s available bandwidth, from 10 Hz to the Nyquist frequency. This approach accounts for changes in the high-frequency component of the spectrum, which is particularly sensitive to MEMS accelerometer hardware limitations and the early stages of local fault development.
To assess macromechanical defects (unbalance and misalignment), the RMS vibration velocity VRMS and vibration displacement DRMS are calculated over the 10–1000 Hz frequency range in accordance with ISO 10816-7 [35]. To avoid the accumulation of numerical integration errors, acceleration is converted to velocity and displacement in the frequency domain:
where Ak is the spectral amplitude of acceleration, and kmin and kmax correspond to frequencies of 10 and 1000 Hz, respectively.
As a result, each time window is transformed into an eight-dimensional diagnostic feature vector (6) represented in Float32 format:
The feature vector in (6) requires 32 bytes per axis. For a triaxial MEMS accelerometer, the total diagnostic data volume is 96 bytes, which is several orders of magnitude smaller than the original time-domain signal. This enables efficient transmission of edge-processing results over LPWAN infrastructure.
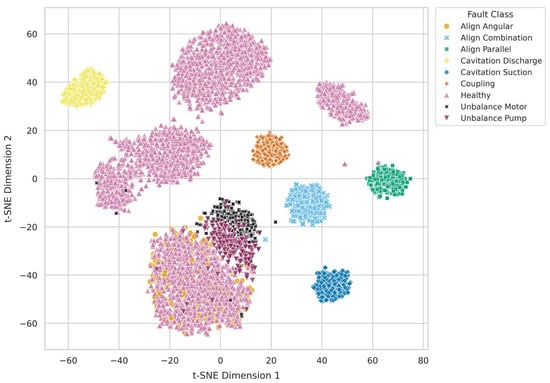
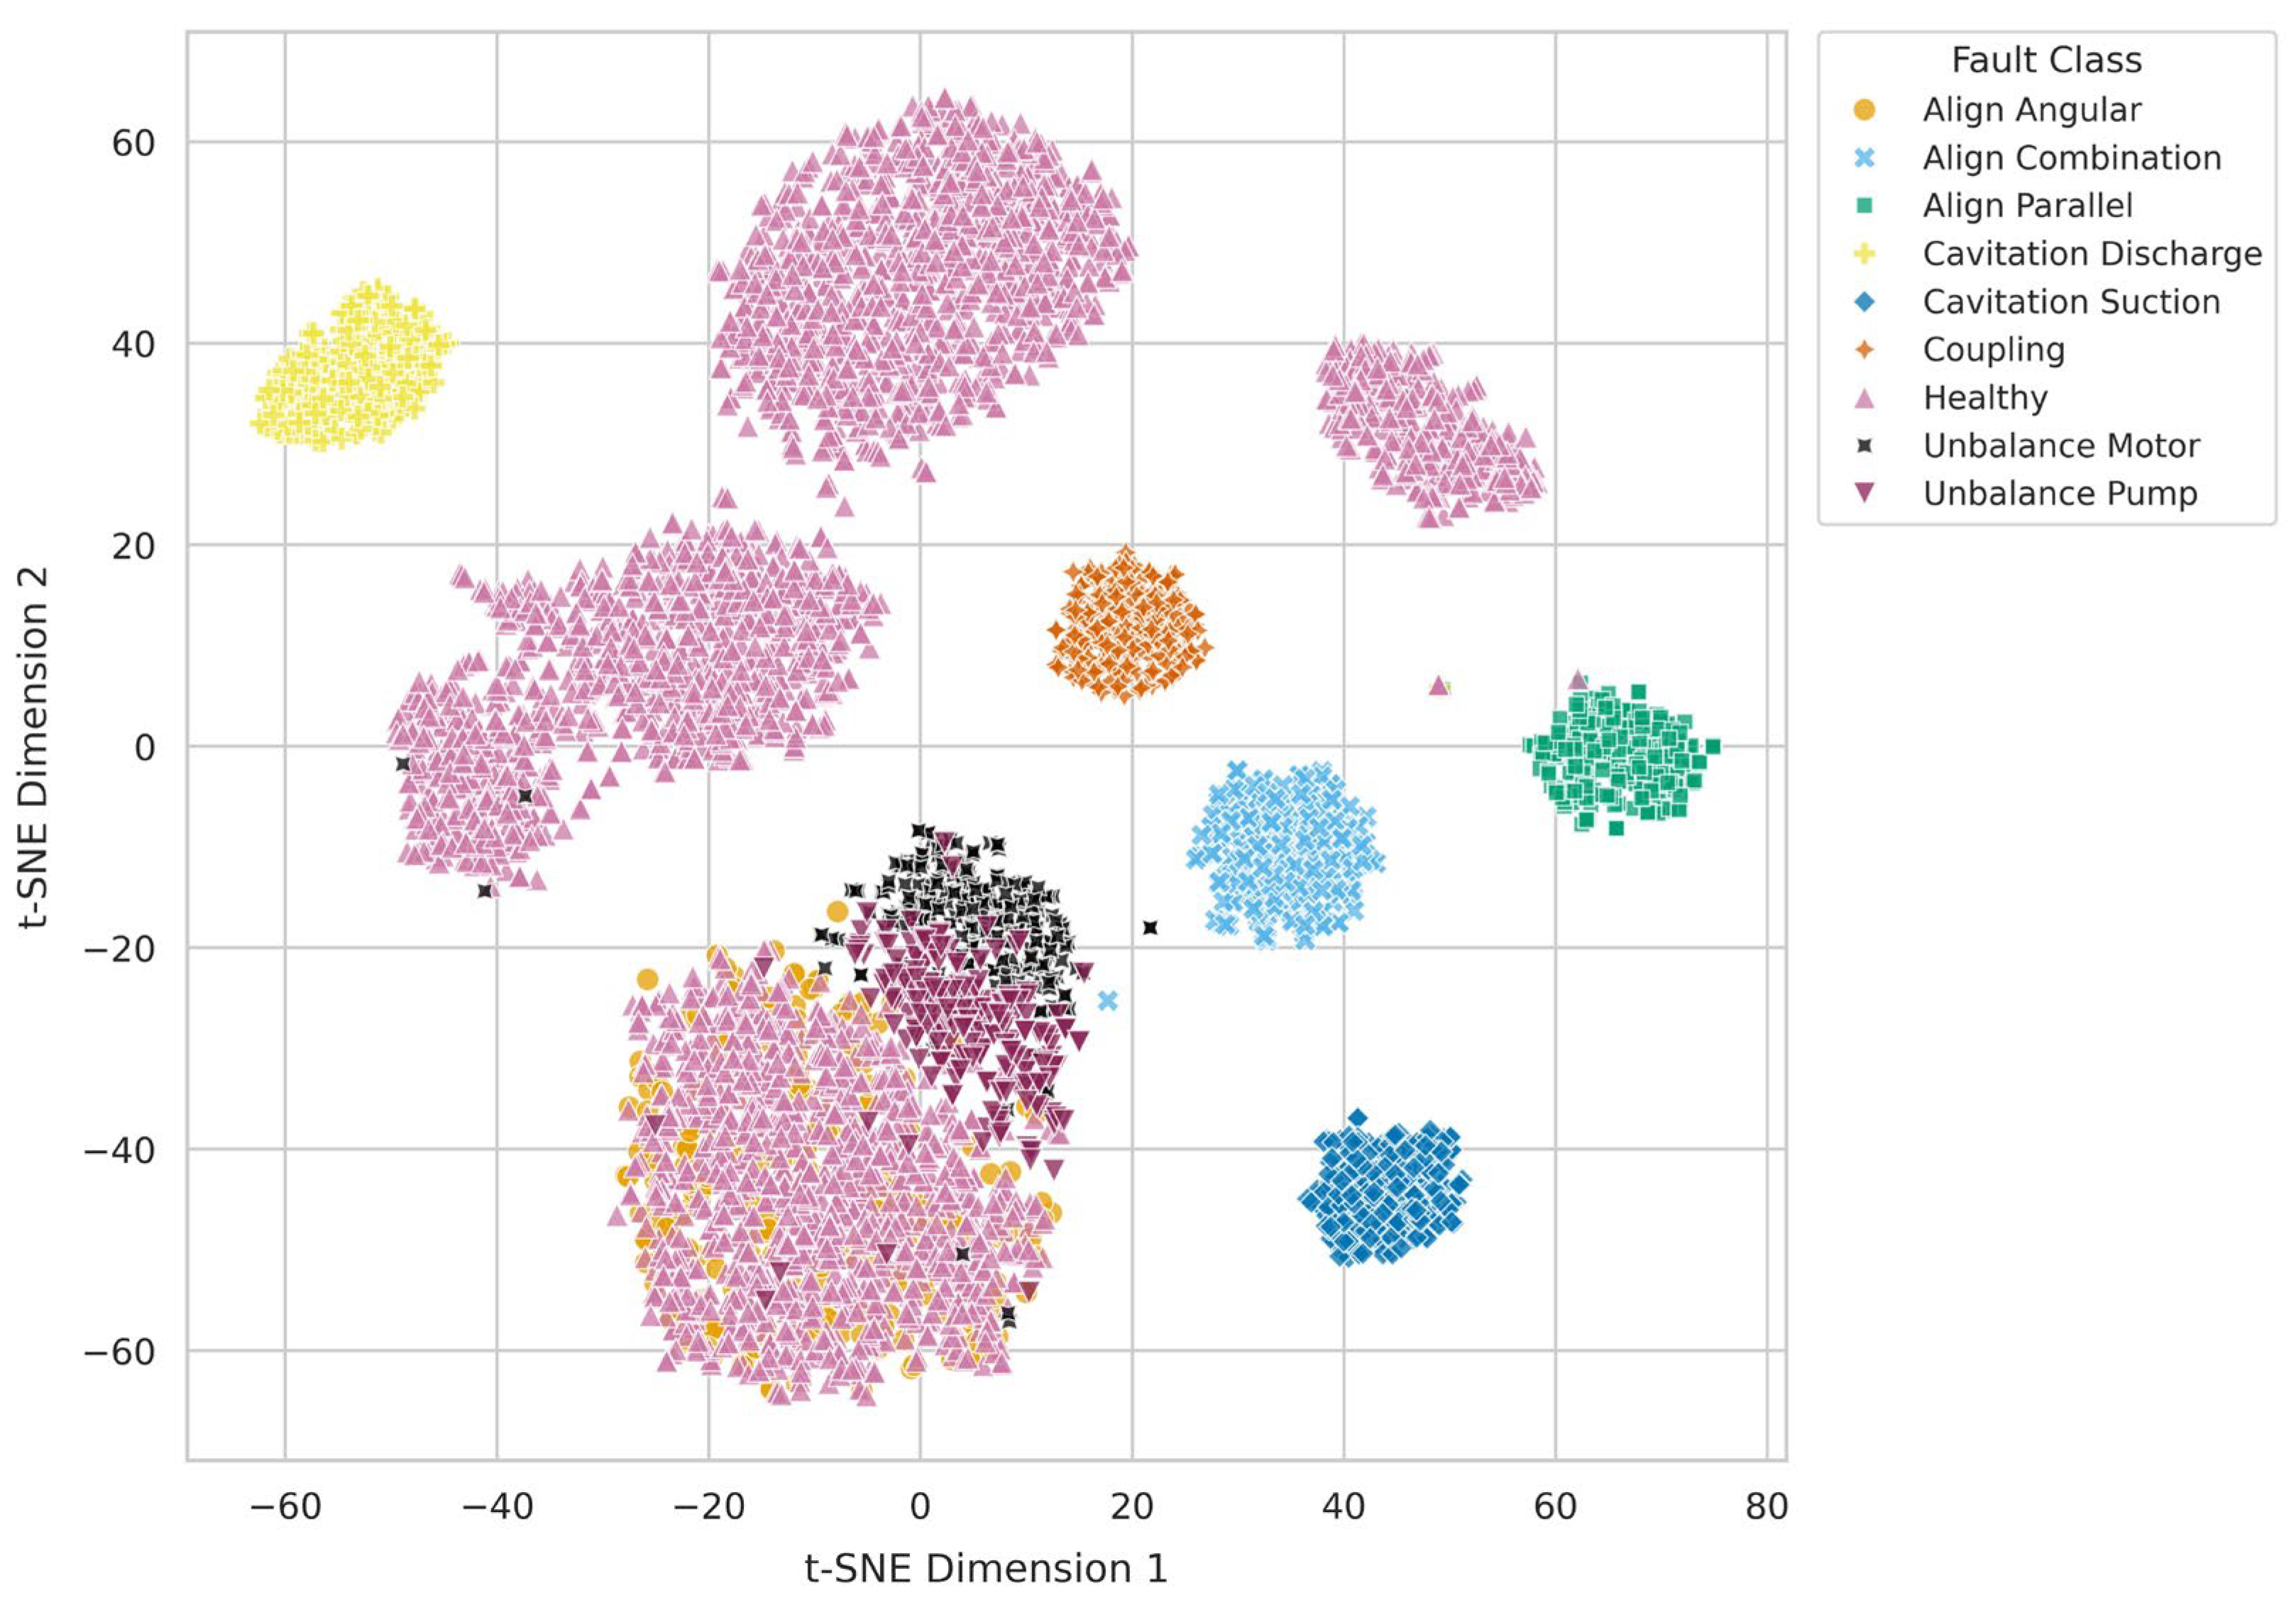
Figure 3 presents a two-dimensional t-SNE [36] projection of the feature space generated by the SDT for the ADXL345 profile (Motor-4, defect severity level 1).
Figure 3.
Two-dimensional t-SNE projection of the feature space generated by the SDT for the ADXL345 profile (Motor-4, defect severity level 1).
3. Results
3.1. Experimental Validation of the Physical Parameters of the SDT Measurement Chain
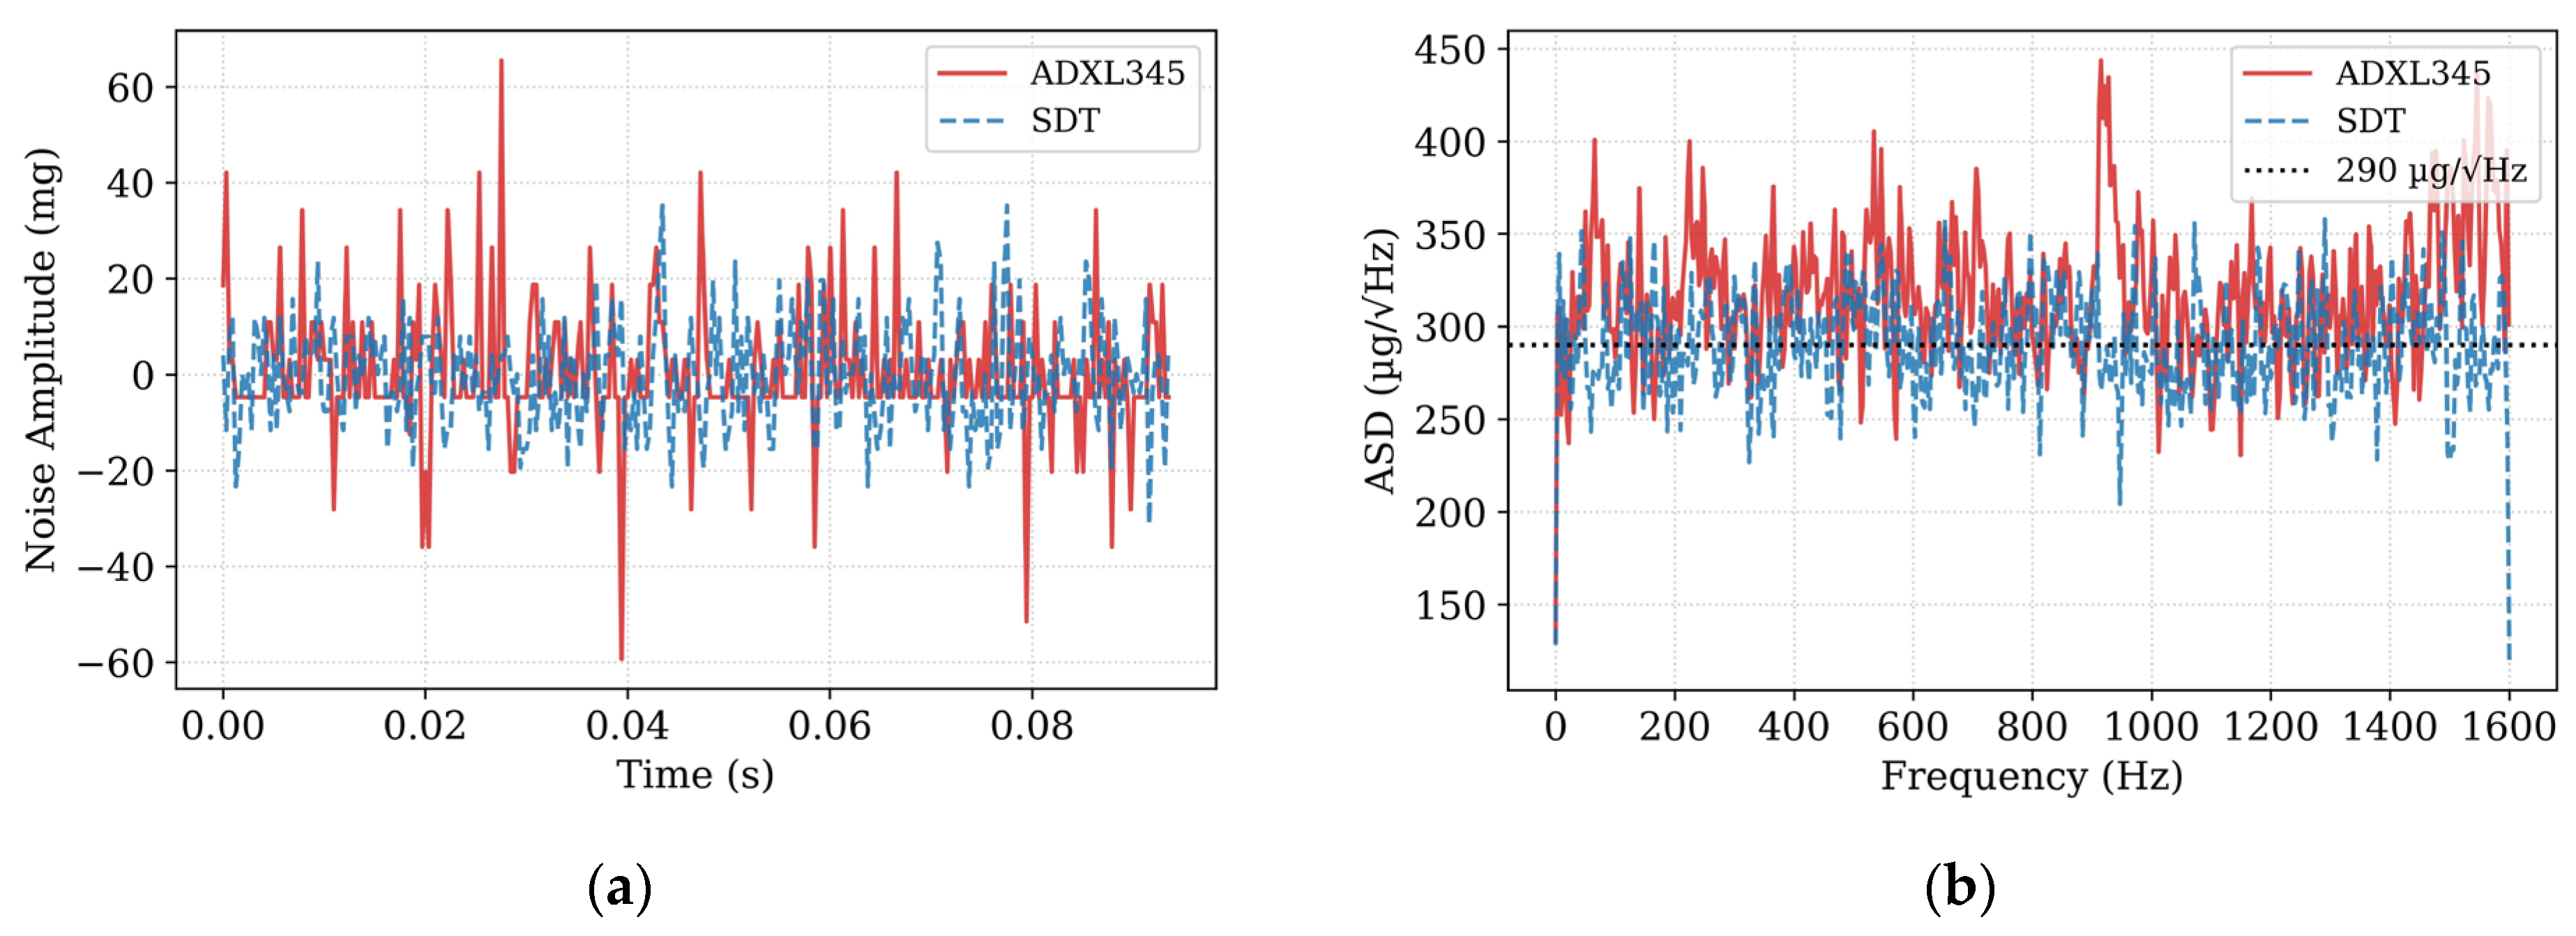
To experimentally validate the reproduction of the stochastic and quantization characteristics of the SDT, a zero-motion accelerometer experiment was conducted. A physical ADXL345 accelerometer (X-axis), connected to an ESP32-S3 microcontroller via a dedicated I2C bus operating at an increased clock frequency of 800 kHz, recorded a zero-motion noise signal. Although the manufacturer recommends the SPI interface for high-speed multi-axis data acquisition, reading only one axis (2 bytes) over the dedicated bus provided continuous data transfer without loss. An array of 16,384 samples (32,768 bytes) was acquired over 5.1186 s. In parallel, the SDT model processed a zero-valued reference signal (xref = 0) using the ADXL345 datasheet parameters (Table 1).
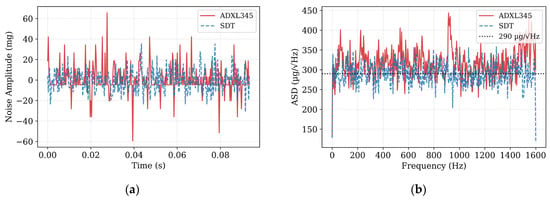
Time-domain analysis (Figure 4a) shows that the SDT model reproduces the discrete ADC quantization steps and the amplitude envelope of the physical sensor noise. In the frequency domain (Figure 4b), the amplitude spectral density exhibits a flat white-noise profile over the 10–1500 Hz frequency range, while the physical accelerometer shows a slight offset (314.02 ).
Figure 4.
Experimental validation of the ADXL345 SDT zero-motion noise characteristics: (a) Time-domain waveforms of intrinsic zero-motion noise; (b) Amplitude spectral density (ASD) of the noise.
To assess statistical reproducibility, both signals were divided into N = 8 non-overlapping windows (2048 samples). Table 2 shows that the SDT model’s relative errors for RMS noise (8.56%) and noise spectral density (NSD) (6.95%) are within the specified device-to-device variation (±10.25%) [32].
Table 2.
Statistical validation of the ADXL345 SDT zero-motion noise characteristics.
3.2. Fault Classification Results and Comparison of ML Algorithms
To quantitatively assess the impact of measurement chain metrological characteristics on diagnostic performance, a computational experiment was conducted by comparing three sensor profiles: the reference Wilcoxon 786B-10 + NI DAQ measurement chain and two virtual MEMS profiles, ADXL357 and ADXL345 (Table 1), generated using the developed SDT model.
In all experiments, the same set of diagnostic features defined in (6), the same normalization procedure, identical training and test samples derived from the NLN-EMP dataset [30], and fixed ML algorithm parameters were used. Thus, the measurement chain characteristics were the only varying factor, enabling an objective assessment of the impact of sensor hardware limitations on classification performance.
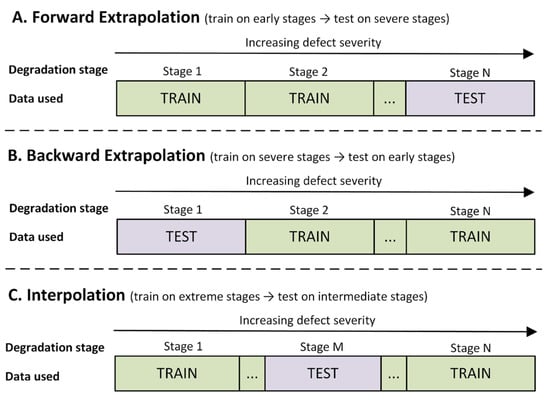
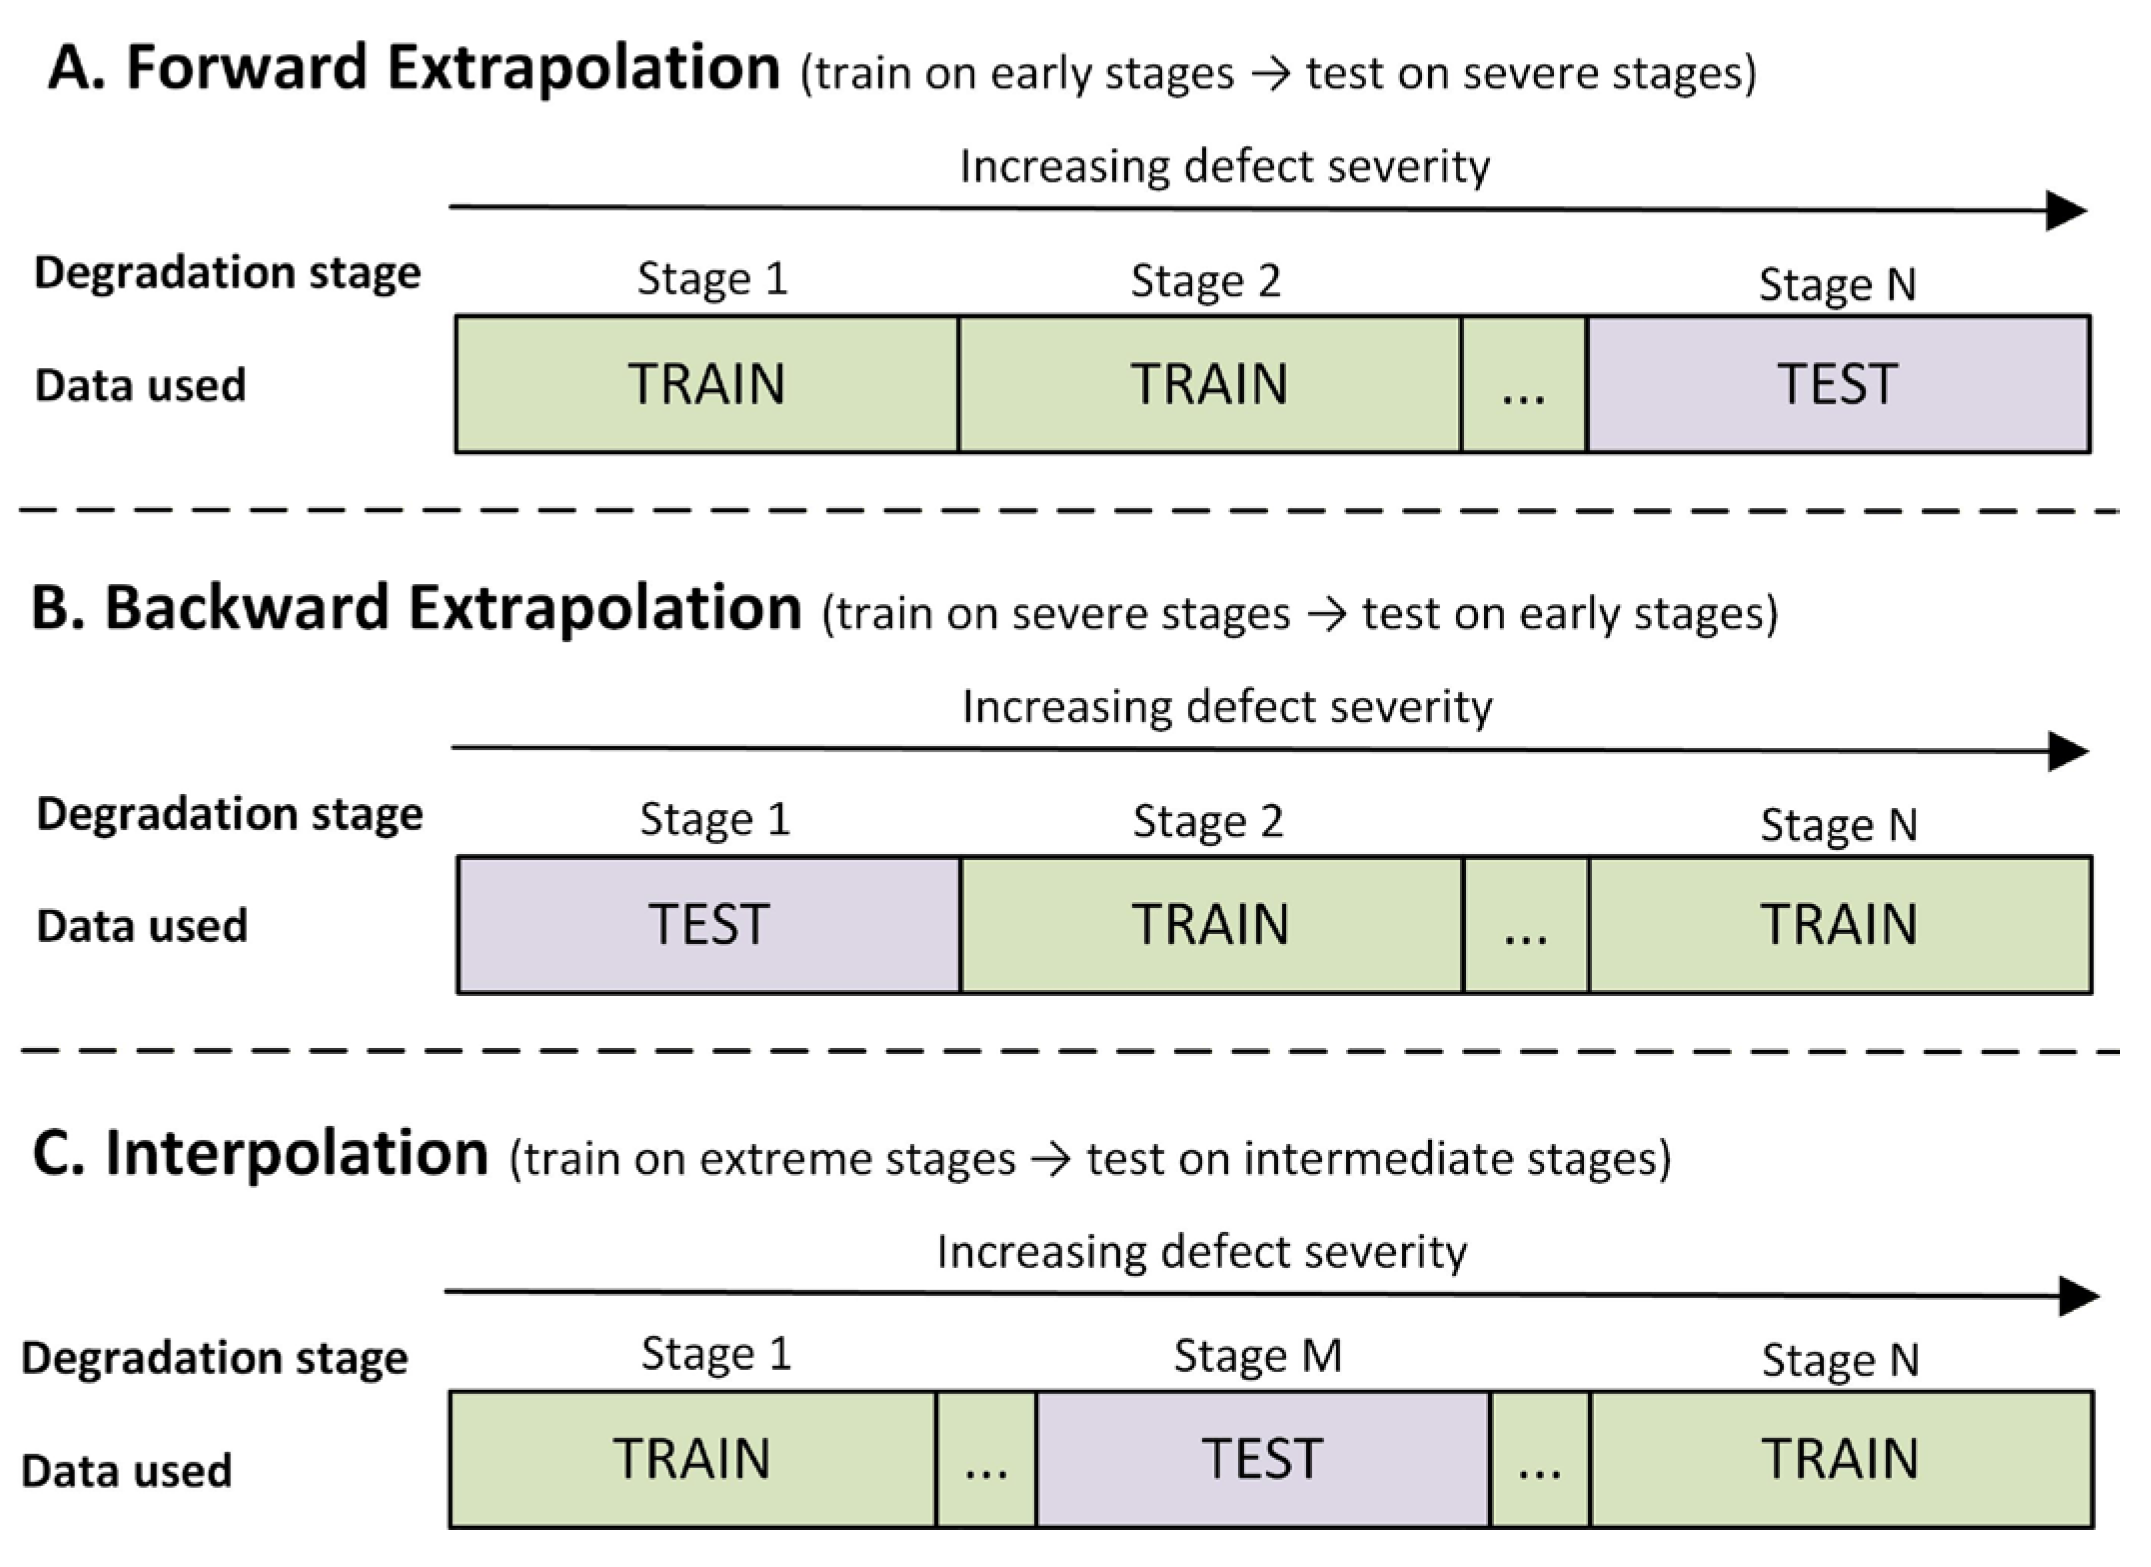
To investigate the generalization capability of the diagnostic models, three scenarios for constructing the training and test sets were considered (Figure 5).
Figure 5.
Computational experiment design for evaluating model generalization under different fault severity scenarios.
Experiment A (Forward Extrapolation) simulated a scenario in which the model was trained on early stages of fault development and tested on more severe fault levels. Experiment B (Backward Extrapolation) represented the reverse scenario, in which the model was trained on advanced defects and tested on early stages of their occurrence. Experiment C (Interpolation) involved training on extreme fault severity levels, followed by testing at an intermediate severity level, allowing assessment of the model’s ability to interpolate previously unseen equipment conditions.
Five ML algorithms representing different model families were used as classifiers: logistic regression (LR), k-nearest neighbors (kNN), random forest (RF), eXtreme Gradient Boosting (XGBoost) [37], and a multilayer perceptron (MLP). Using multiple model families minimized the influence of algorithm-specific characteristics on the study’s overall conclusions [38].
The split into the training and test sets was performed at the level of the source experimental recordings and fault severity levels (Figure 5). Therefore, time windows generated from the same source recording could not simultaneously be included in both the training and test sets. Feature normalization parameters were calculated exclusively from the training data.
The complete allocation of the source recordings and generated time windows by pump unit, fault type, fault severity level, and train/test scenario is provided in the Supplementary Materials.
All ML models were implemented using Python (version 3.10) and the Python libraries scikit-learn (version 1.7.1) and XGBoost (version 3.2.0). Table 3 lists the key hyperparameters in accordance with the parameter naming conventions of these libraries.
Table 3.
Hyperparameters of the applied classifiers.
Parameters not explicitly specified were left at their default values. Extensive hyperparameter optimization was not performed because the primary objective of the study was to assess the relative impact of sensor hardware limitations on diagnostic performance rather than to achieve the maximum attainable classification accuracy.
Because the task involves multiclass classification with an imbalanced distribution of observations across classes, the Macro F1-score was used as the primary performance metric. The experimental results for this metric obtained for the Motor-4 and Motor-2 pump units [30] are presented in Table 4. To assess the robustness of the results to stochastic factors in the computational procedure, each experiment was repeated N = 10 times with different realizations of the SDT noise and random initializations of the stochastic ML algorithms, while keeping the source experimental recordings and the training/test split unchanged. The mean and standard deviation of the Macro F1-score characterize the computational variability of the results.
Table 4.
Quantitative assessment of the impact of measurement chain metrological characteristics on fault classification performance using the Macro F1-score, reported as (mean ± SD).
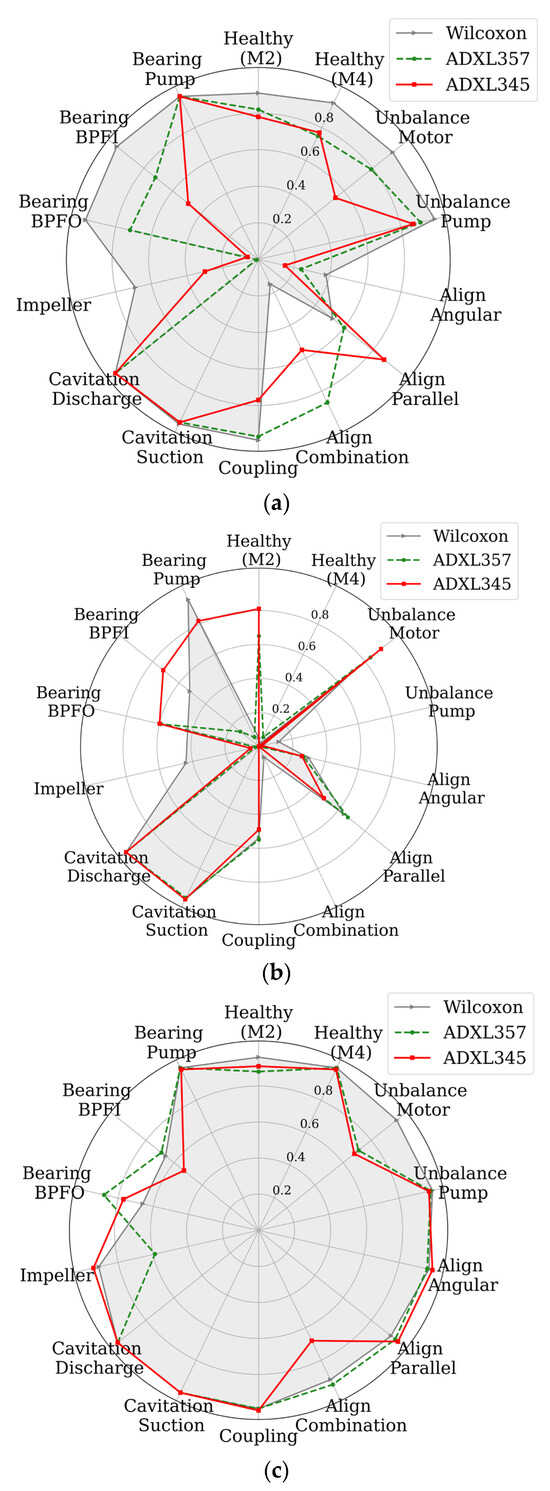
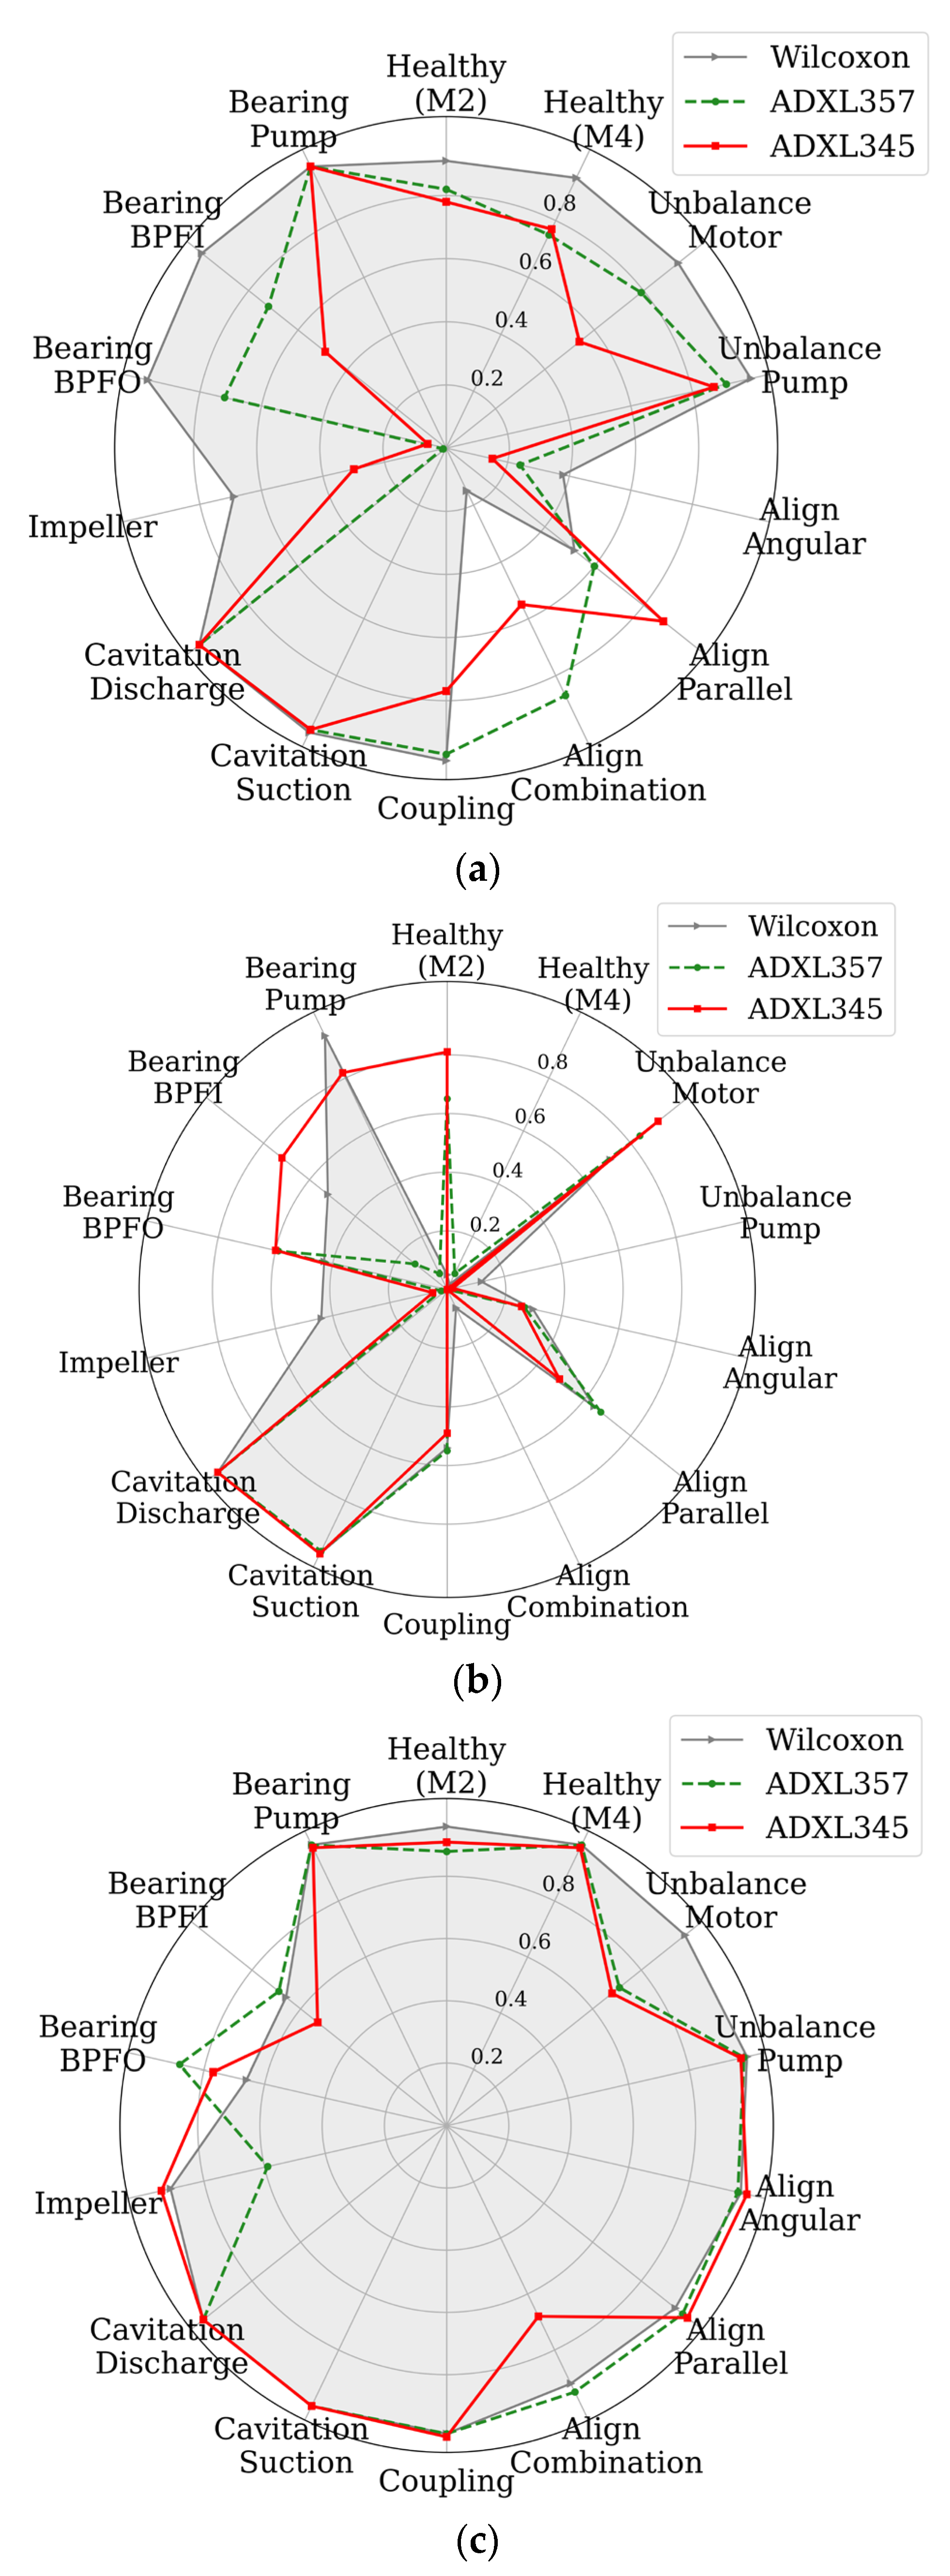
Figure 6 presents, for each sensor profile and fault type, the highest F1-score achieved by any evaluated ML algorithm (LR, kNN, RF, XGB, and MLP).
Figure 6.
Radar charts of the maximum F1-score by fault class: (a) Experiment A, Forward Extrapolation; (b) Experiment B, Backward Extrapolation; (c) Experiment C, Interpolation.
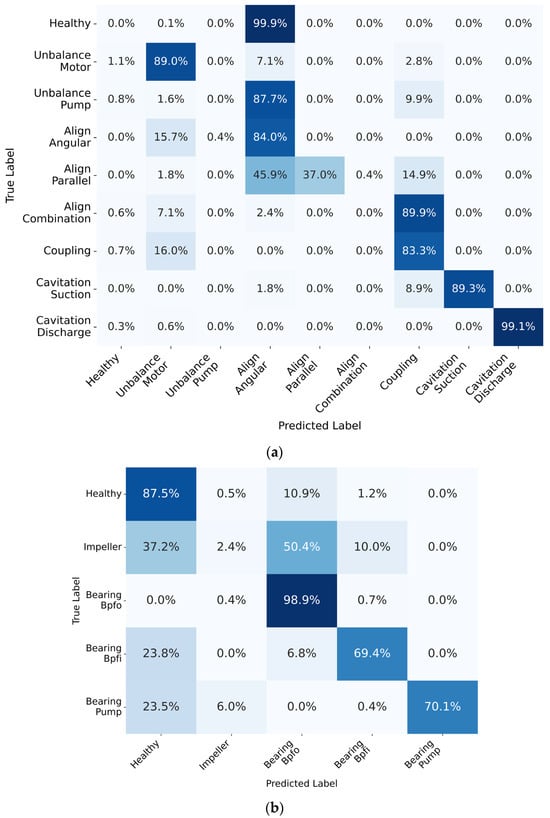
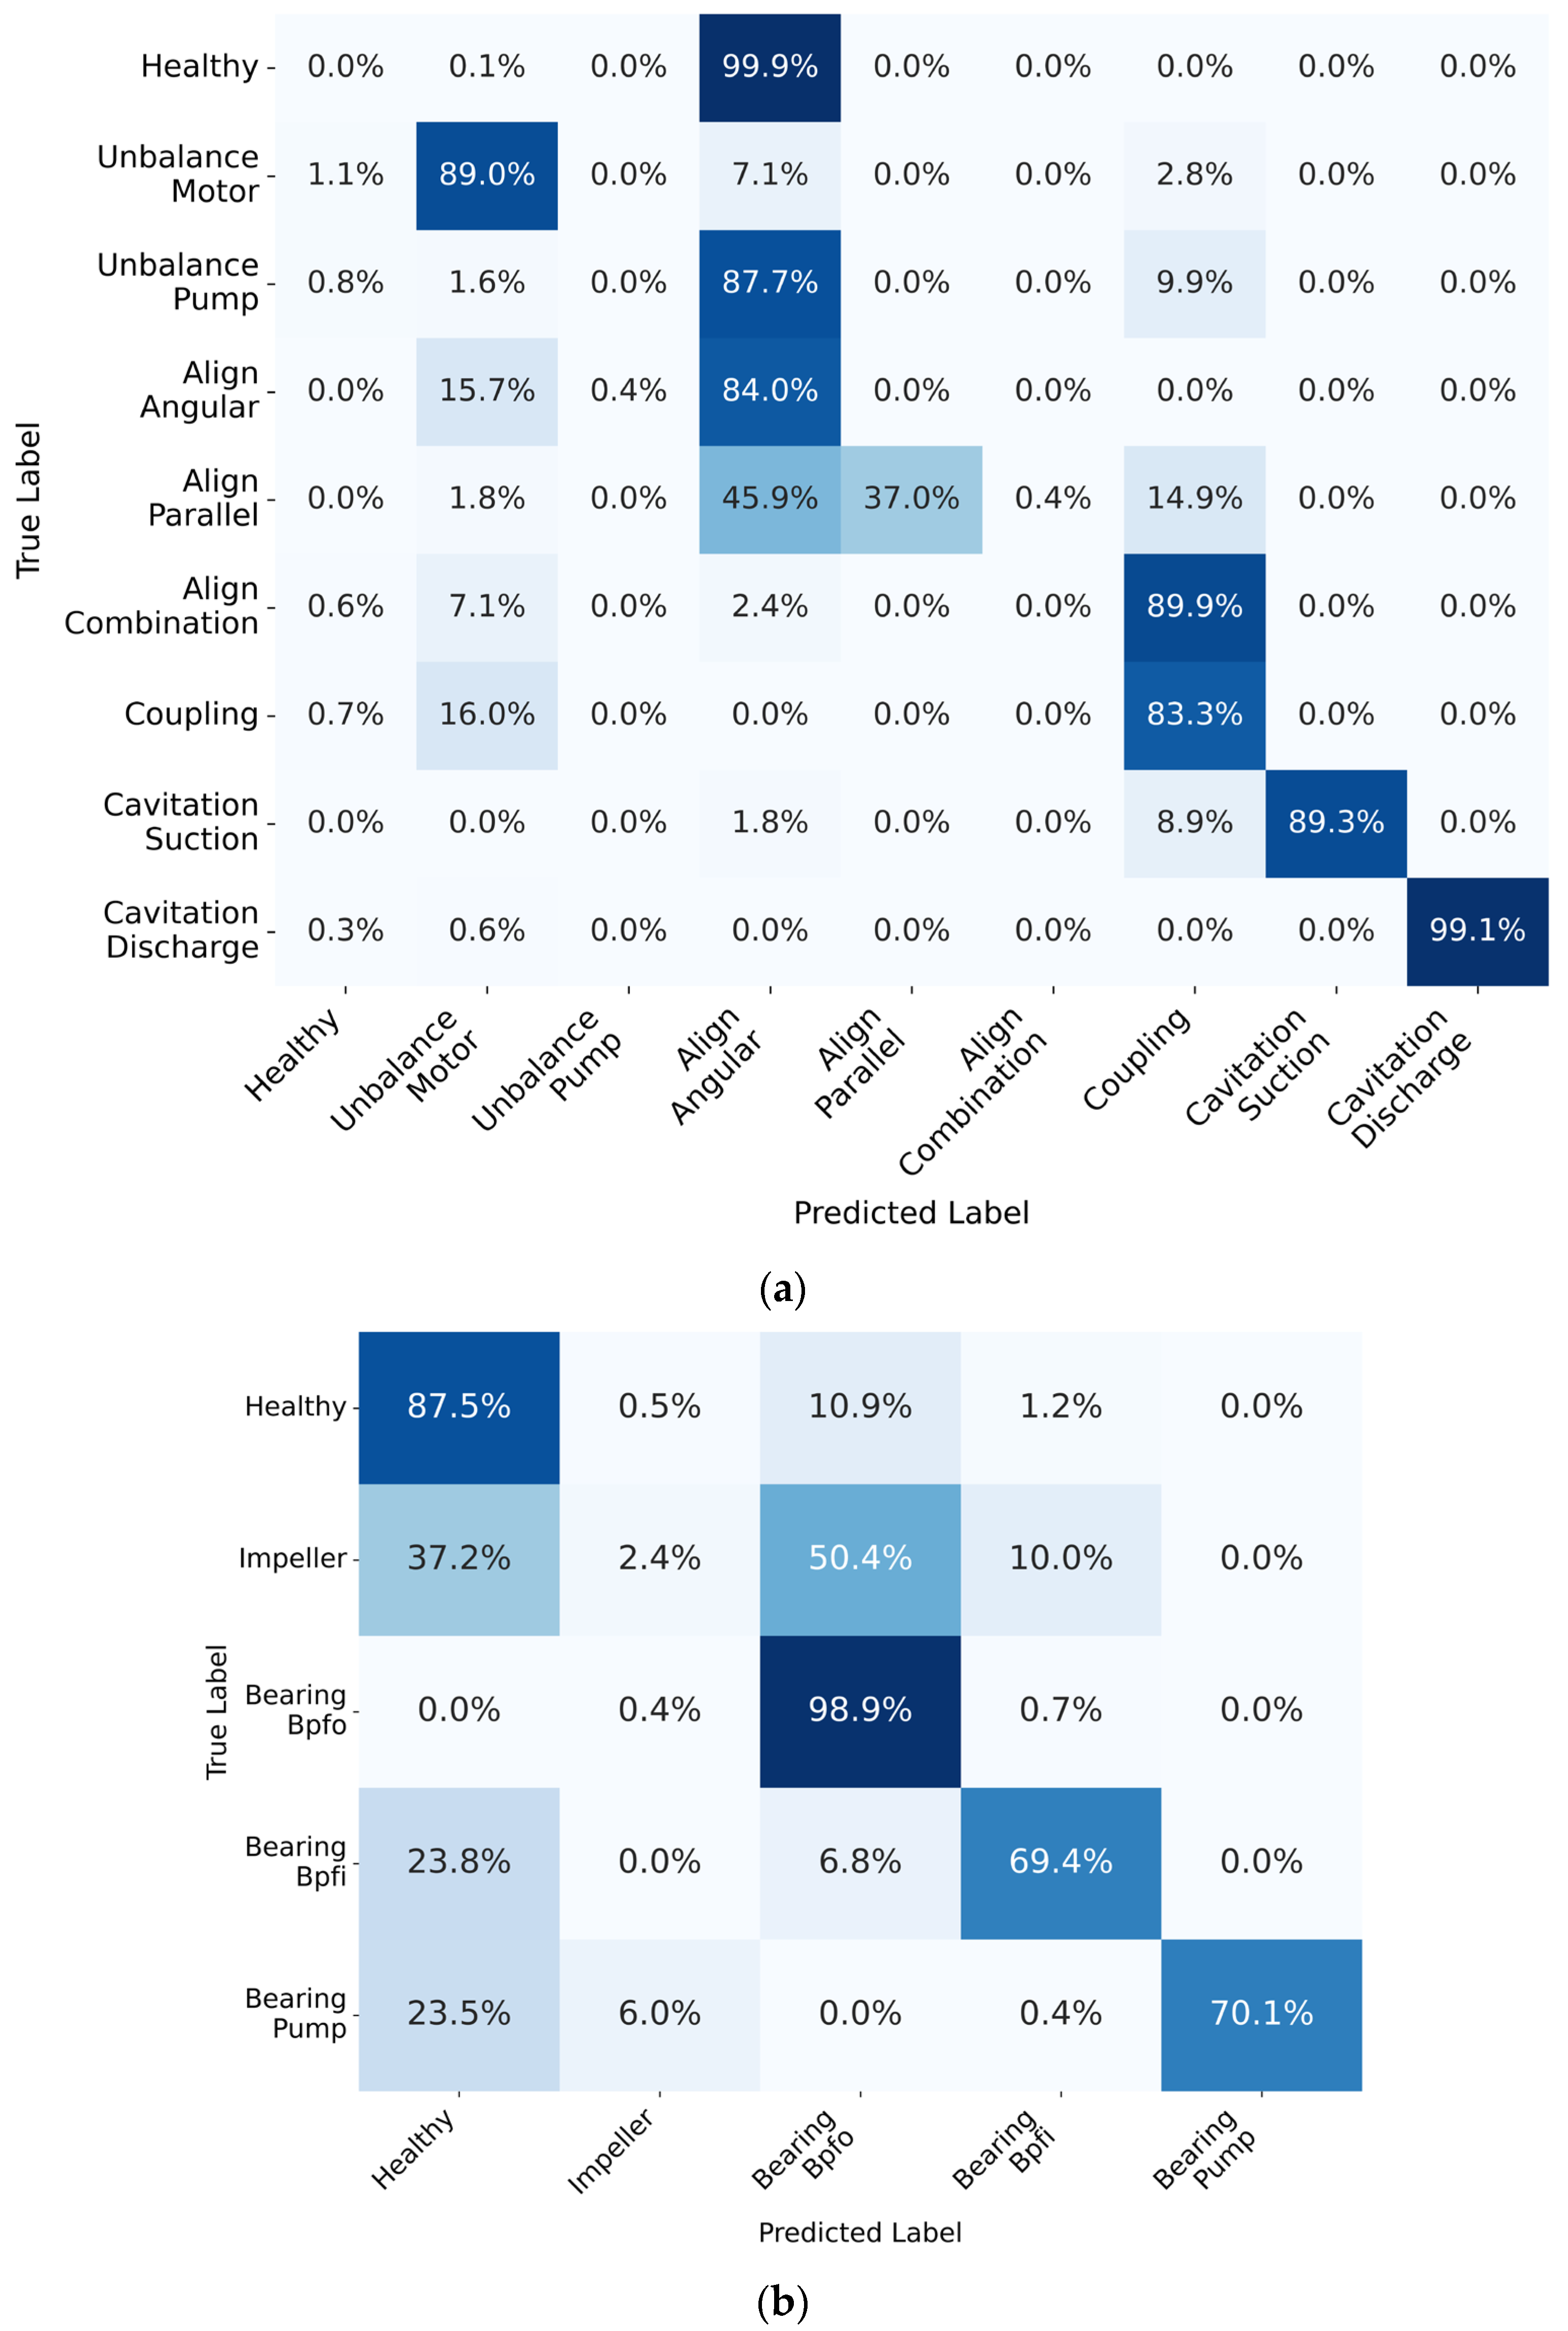
Figure 7 depicts representative confusion matrices for the fault classification results obtained for Motor-4 and Motor-2.
Figure 7.
Confusion matrices for Experiment B (Backward Extrapolation): (a) LR classifier for Motor-4 faults using the ADXL357 profile; (b) MLP classifier for Motor-2 faults using the ADXL345 profile.
4. Discussion
The physical validation results confirmed that the SDT model reproduces the noise and quantization characteristics of the physical ADXL345 (Figure 4, Table 2). The obtained agreement confirms the correctness of the parametric reproduction of these characteristics without individual calibration fitting of the model to the particular sensor unit.
The computational experiment (Section 3.2) showed that diagnostic performance depends not only on the metrological characteristics of the measurement chain but also on the representativeness of the training dataset. Unlike conventional cross-validation, which assumes that the training and test data follow the same statistical distribution, the proposed validation scenarios (Figure 5) represent three practically relevant operating cases. Comparative analysis showed that the interpolation scenario (Experiment C in Figure 5) achieves the highest classification performance, whereas the backward extrapolation scenario (Experiment B in Figure 5) is the most challenging regardless of sensor class and ML algorithm (Table 4, Figure 6). The principal advantage of the SDT concept is its ability to quantitatively disentangle and independently assess the effects of MEMS chip hardware limitations and ML model generalization capability, which are practically impossible to isolate using physical testing alone.
The interpolation results confirm the feasibility of using low-cost MEMS accelerometers when a representative training dataset is available. For the Motor-4 unit, logistic regression applied to the ADXL345 and ADXL357 profiles yields Macro F1-scores of 0.8999 ± 0.0006 and 0.8947 ± 0.0005, respectively, compared with 0.9567 for the reference Wilcoxon measurement chain (Table 4).
Across the performed experiments, no unambiguous relationship was observed between sensor bandwidth and classification performance. In some scenarios, the ADXL357 profile demonstrated higher Macro F1-score values than the reference Wilcoxon measurement chain. Thus, in the Forward Extrapolation scenario for Motor-4, LR achieved a Macro F1-score of 0.7171 ± 0.0014 for the ADXL357 profile, compared with 0.6768 for the reference Wilcoxon measurement chain (Table 4). A similar trend was observed for Motor-2, where, in the Interpolation scenario, the LR and MLP algorithms trained on data from the MEMS sensor profiles in some cases achieved higher Macro F1-score values than the reference measurement chain.
The observed increase in Macro F1-score may be associated with the suppression of some high-frequency components by the measurement chain. However, because several sensor-profile parameters vary simultaneously, this result requires a separate factorial investigation.
Analysis of individual classes reveals that diagnostic robustness depends on the physical nature of the fault. The most stable results were obtained for Cavitation Suction and Cavitation Discharge, for which Precision and Recall remained close to unity for most models, regardless of sensor type (Figure 6 and Figure 7a). This indicates that the principal diagnostic information is concentrated within the frequency range accessible even to low-cost MEMS accelerometers.
In contrast, classes associated with different types of misalignment are substantially more sensitive to the metrological characteristics of the measurement chain and to extrapolation scenarios, as shown by a marked decrease in Recall and increased pairwise misclassification between these classes (Figure 7a).
The most substantial performance degradation occurs in the Backward Extrapolation experiment, which models early fault detection (Table 4, Figure 7b). In this case, the performance metrics deteriorate for all sensors investigated, including the reference Wilcoxon measurement chain, indicating that the distribution shift in the diagnostic features between early and advanced stages of fault development is the dominant factor. Consequently, adequate coverage of different stages of fault development in the training dataset is equally important for diagnostic performance.
The comparative performance of the ML algorithms is also noteworthy. Despite its substantially lower computational complexity, logistic regression achieves performance comparable to or better than that of more complex ensemble methods and neural networks in many scenarios (Table 4). This result indicates the high discriminative capability of the proposed set of statistical and kinematic features and suggests a high degree of linear class separability, as illustrated in Figure 3.
The high degree of feature-space segregation (Figure 3) also helps explain why simple linear algorithms achieve high diagnostic performance even with a limited sampling rate (Fs = 3200 Hz for ADXL345) and 13-bit quantization. In addition, the t-SNE projection reveals a region of local overlap among the healthy condition, motor and pump unbalance, and angular misalignment classes (Figure 3). This spatial proximity is consistent with the main pairwise misclassifications observed in the confusion matrices (Figure 7a) and suggests that difficulty distinguishing these faults is primarily due to the properties of the feature representation rather than sensor bandwidth. In such cases, improving diagnostic performance requires less enhancement of the measurement chain and more expansion of the diagnostic feature set, multichannel spatial processing, or the incorporation of additional information sources.
Experiments conducted on the independent Motor-2 dataset further confirm the generalizability of the proposed SDT methodology. Although the training-set construction scenario remains the dominant factor, the Motor-2 results show that the impact of sensor metrological characteristics depends substantially on the nature of the faults being diagnosed. For Motor-2, systematic confusion occurs between impeller faults and rolling-element bearing faults (Figure 7b). Most ML algorithms also show similar misclassification patterns, which persist across different sensor profiles. This suggests that these misclassifications arise from the similarity of the vibration signatures associated with the corresponding faults rather than from the characteristics of a particular classifier or sensor.
The consistently high diagnostic performance for the pump-bearing fault across all tests (Figure 6 and Figure 7b) can be attributed to the high vibration energy associated with this fault in the original dataset (severe damage introduced during assembly [30]).
Several limitations of this study should also be noted. The proposed methodology was validated using the open-access NLN-EMP dataset [30], with each measurement channel processed independently without constructing a spatial triaxial feature vector. Because synchronous coherent recordings from the orthogonal axes of a single measurement node were unavailable, cross-axis coupling effects were not included in the model. Nevertheless, algorithmic removal of the DC component mitigated DC offset and temperature-induced zero-offset drift. An additional limitation is related to the structure of the original dataset. Individual combinations of fault type and severity level are represented by a single experimental recording, which limits the assessment of between-recording statistical variability. At the same time, the results characterize the combined effect of the measurement chain parameters and do not allow the contribution of individual metrological characteristics or their minimum acceptable values to be unambiguously determined.
Further development of the SDT involves evaluating its robustness to different types of domain shift. Under variable rotational speed, a promising approach is to construct speed-invariant and severity-sensitive features using a speed discriminator, severity classifier, and relative-similarity-based health indicator [39], which would allow changes in operating conditions to be separated from fault progression. In addition, the transferability of diagnostic information between virtual and physical MEMS domains can be evaluated using simulation-assisted transfer learning methods incorporating subdomain alignment, Wasserstein distance, domain discriminators, and feature-centroid-based loss [40]. The combined application of these approaches would enable a more rigorous separation of the effects of operating conditions, fault progression, and measurement chain characteristics.
Thus, the results enable a transition from empirical testing of multiple physical sensor ICs on a test rig to targeted optimization of the measurement chain for a specific class of diagnostic tasks. This demonstrates that, for a broad range of faults, the metrological limitations of low-cost MEMS accelerometers do not constitute an insurmountable barrier but can instead be treated as design constraints whose effects can be mitigated through appropriate feature-space design and adequate coverage of fault conditions in the training data.
5. Conclusions
This study developed and experimentally validated a Sensor Digital Twin (SDT) framework for virtual benchmarking of measurement chains in predictive vibration diagnostics systems for centrifugal pumps. The proposed approach integrates the measurement chain into the hardware-software co-design framework, enabling quantitative assessment of the impact of hardware-induced signal degradation on classification performance without resource-intensive test-rig experiments.
Computational experiments using data from two pump units of the NLN-EMP dataset showed that, in the considered scenarios, diagnostic performance is determined not only by the measurement chain characteristics but also by the physical nature of the fault and the representativeness of the training dataset across fault severity levels. At the same time, the proposed compact feature vector (32 bytes per axis) provided robust discrimination of a range of macromechanical and hydrodynamic conditions when modeling the limitations of MEMS measurement chains.
The practical value of the results lies in providing a tool for virtual benchmarking of sensor hardware for Edge-IIoT systems prior to physical prototyping. Within the scope of the dataset used, fixed operating speeds, and selected feature space, the modeled ADXL345 and ADXL357 profiles provided diagnostic performance comparable to that of the reference piezoelectric measurement chain in several diagnostic scenarios. Further experimental validation on other pump units, under different operating conditions, and using physical sensors, will allow the generalizability and applicability of these findings to be assessed.
Future research will include evaluating the SDT under variable-speed and load conditions, extending the analysis to multichannel measurements and other pump units, performing a factorial analysis of measurement-chain parameters, and physically validating the virtual profiles using synchronized vibration recordings from physical MEMS sensors.
Supplementary Materials
The following supporting information can be downloaded at: https://www.mdpi.com/article/10.3390/machines14101113/s1,Table S1: Recording-level train-test partitioning of the Motor-4 dataset for the three experimental scenarios; Table S2: Recording-level train-test partitioning of the Motor-2 dataset for the three experimental scenarios.
Author Contributions
Conceptualization, A.S., K.K. and A.T.; methodology, A.S., K.K. and A.P.; software, A.S., Y.T. and M.K.; validation, A.S., Y.T. and M.K.; formal analysis, A.S., K.K. and A.T.; investigation, A.S., K.K. and A.T.; resources, A.S., Y.T. and M.K.; data curation, A.S., Y.T. and M.K.; writing—original draft preparation, A.S., K.K., A.P. and A.T.; writing—review and editing, A.S., K.K. and A.T.; visualization, A.S., M.K. and A.P.; supervision, A.T.; project administration, A.T.; funding acquisition, A.T. All authors have read and agreed to the published version of the manuscript.
Funding
This research was funded by the Ministry of Science and Higher Education of the Republic of Kazakhstan, grant number BR28713691 “Development of Design Technology for Centrifugal Pumps for Various Applications, Including the Creation of Design Documentation Based on 3D Modeling, Digital Twins, and 3D Prototyping”.
Data Availability Statement
The software implementation of the parametric Sensor Digital Twin model, the feature extraction pipeline, and the computational experiment scripts are available in a public GitHub repository: https://github.com/alex21582/sensor_d_twin (accessed on 20 September 2026).
Conflicts of Interest
The authors declare no conflicts of interest.
Abbreviations
The following abbreviations are used in this manuscript:
| ADC | Analog-to-Digital Converter |
| IIoT | Industrial Internet of Things |
| IIR | Infinite Impulse Response |
| kNN | k-Nearest Neighbors |
| LPF | Low-Pass Filter |
| LR | Logistic Regression |
| MEMS | Micro-Electro-Mechanical Systems |
| ML | Machine Learning |
| MLP | Multilayer Perceptron |
| NSD | Noise Spectral Density |
| RF | Random Forest |
| RMS | Root-Mean-Square |
| XGB | eXtreme Gradient Boosting |
References
- Sunal, C.E.; Dyo, V.; Velisavljevic, V. Review of Machine Learning Based Fault Detection for Centrifugal Pump Induction Motors. IEEE Access 2022, 10, 71344–71355. [Google Scholar] [CrossRef] [Scilit]
- Fausing Olesen, J.; Shaker, H.R. Predictive Maintenance for Pump Systems and Thermal Power Plants: State-of-the-Art Review, Trends and Challenges. Sensors 2020, 20, 2425. [Google Scholar] [CrossRef] [Scilit]
- Hallaji, S.M.; Fang, Y.; Winfrey, B.K. Winfrey, Predictive maintenance of pumps in civil infrastructure: State-of-the-art, challenges and future directions. Autom. Constr. 2022, 134, 104049. [Google Scholar] [CrossRef] [Scilit]
- Mohd Ghazali, M.H.; Rahiman, W. Vibration Analysis for Machine Monitoring and Diagnosis: A Systematic Review. Shock Vib. 2021, 2021, 9469318. [Google Scholar] [CrossRef] [Scilit]
- Bányai, T.; Bányai, Á. Real-Time Maintenance Optimization with Industrial Internet of Things. Appl. Sci. 2025, 15, 5640. [Google Scholar] [CrossRef] [Scilit]
- Molęda, M.; Małysiak-Mrozek, B.; Ding, W.; Sunderam, V.; Mrozek, D. From Corrective to Predictive Maintenance—A Review of Maintenance Approaches for the Power Industry. Sensors 2023, 23, 5970. [Google Scholar] [CrossRef] [Scilit]
- Orlovs, D.; Rusins, A.; Skrastiņš, V.; Judvaitis, J. LPWAN Technologies for IoT: Real-World Deployment Performance and Practical Comparison. IoT 2025, 6, 77. [Google Scholar] [CrossRef] [Scilit]
- Savostin, A.; Koshekov, K.; Tuleshov, A.; Savostina, G.; Koshekov, A. Development of remote diagnostic monitoring system for pumping equipment with open architecture. Radioelectron. Comput. Syst. 2024, 2024, 192–206. [Google Scholar] [CrossRef] [Scilit]
- Brito, S.D.; Azinheira, G.J.; Semião, J.F.; Sousa, N.M.; Litrán, S.P. Non-Intrusive Low-Cost IoT-Based Hardware System for Sustainable Predictive Maintenance of Industrial Pump Systems. Electronics 2025, 14, 2913. [Google Scholar] [CrossRef] [Scilit]
- Adli, B.; Rusmin, P.H. Vibration Measuring Tools For Rotary Pumping Machine With Accelerometer MEMS Sensor. In Proceedings of the 2020 FORTEI-International Conference on Electrical Engineering (FORTEI-ICEE), Bandung, Indonesia, 23–24 September 2020; pp. 69–74. [Google Scholar] [CrossRef] [Scilit]
- Chen, L.; Wei, L.; Wang, Y.; Wang, J.; Li, W. Monitoring and Predictive Maintenance of Centrifugal Pumps Based on Smart Sensors. Sensors 2022, 22, 2106. [Google Scholar] [CrossRef] [Scilit]
- Liu, X.; Mou, J.; Xu, X.; Qiu, Z.; Dong, B. A Review of Pump Cavitation Fault Detection Methods Based on Different Signals. Processes 2023, 11, 2007. [Google Scholar] [CrossRef] [Scilit]
- Levinzon, F. Piezoelectric Accelerometers with Integral Electronics; Springer International Publishing: New York, NY, USA, 2015. [Google Scholar] [CrossRef] [Scilit]
- Fidali, M.; Augustyn, D.; Ochmann, J.; Uchman, W. Evaluation of the Diagnostic Sensitivity of Digital Vibration Sensors Based on Capacitive MEMS Accelerometers. Sensors 2024, 24, 4463. [Google Scholar] [CrossRef] [Scilit]
- Srokosz, P.E.; Daniszewska, E.; Banach, J.; Śmieja, M. In-Depth Analysis of Low-Cost Micro Electromechanical System (MEMS) Accelerometers in the Context of Low Frequencies and Vibration Amplitudes. Sensors 2024, 24, 6877. [Google Scholar] [CrossRef] [Scilit]
- Ghazali, M.H.M.; Rahiman, W. An Investigation of the Reliability of Different Types of Sensors in the Real-Time Vibration-Based Anomaly Inspection in Drone. Sensors 2022, 22, 6015. [Google Scholar] [CrossRef] [Scilit]
- Abdallah, M.; Joung, B.G.; Lee, W.J.; Mousoulis, C.; Raghunathan, N.; Shakouri, A.; Sutherland, J.W.; Bagchi, S. Anomaly Detection and Inter-Sensor Transfer Learning on Smart Manufacturing Datasets. Sensors 2023, 23, 486. [Google Scholar] [CrossRef] [Scilit]
- El Bouharrouti, N.; Morinigo-Sotelo, D.; Belahcen, A. Multi-Rate Vibration Signal Analysis for Bearing Fault Detection in Induction Machines Using Supervised Learning Classifiers. Machines 2024, 12, 17. [Google Scholar] [CrossRef] [Scilit]
- Suryowinoto, A.; Albanna, I.; Fachrul, A.M.R. Smart Predictive Maintenance for Centrifugal Pumps: How IoT Sensors Reduce Downtime by Monitoring Vibration, Current, and Seal Integrity. Int. J. Artif. Intell. Robot. (IJAIR) 2025, 7, 18–25. [Google Scholar] [CrossRef] [Scilit]
- Zhou, S.; Zhang, L.; Yang, X.; Luo, R.; Du, B.; Zeng, W. Remaining useful life prediction method of centrifugal pump rolling bearings based on digital twins. Sci. Rep. 2025, 15, 19513. [Google Scholar] [CrossRef] [Scilit]
- LI, Y.; LIU, Q.; LI, W. Impeller fault diagnosis method and application based on digital twin flow field contour of centrifugal pump. J. Beijing Univ. Aeronaut. Astronaut. 2025, 51, 193–201. [Google Scholar] [CrossRef]
- Dong, C.; Tao, J.; Liu, C. Digital twin-driven zero-shot fault diagnosis of axial piston pumps using fluid-borne noise signals. arXiv 2025. [Google Scholar] [CrossRef] [Scilit]
- Khan, T.; Khan, U.; Khan, A.; Mollan, C.; Morkvenaite-Vilkonciene, I.; Pandey, V. Data-Driven Digital Twin Framework for Predictive Maintenance of Smart Manufacturing Systems. Machines 2025, 13, 481. [Google Scholar] [CrossRef] [Scilit]
- Riccio, C.; Menanno, M.; Zennaro, I.; Savino, M.M. A New Methodological Framework for Optimizing Predictive Maintenance Using Machine Learning Combined with Product Quality Parameters. Machines 2024, 12, 443. [Google Scholar] [CrossRef] [Scilit]
- Yoon, S.; Choi, Y.; Koo, J. In situ virtual sensors in building digital twins: Framework and methodology. J. Ind. Inf. Integr. 2023, 36, 100532. [Google Scholar] [CrossRef] [Scilit]
- Hossain, R.; Ahmed, F.; Kobayashi, K.; Koric, S.; Abueidda, D.; Alam, S.B. Virtual sensing-enabled digital twin framework for real-time monitoring of nuclear systems leveraging deep neural operators. npj Mater. Degrad. 2025, 9, 21. [Google Scholar] [CrossRef] [Scilit]
- Garay, C.E.; Miranda Bonomi, F.A.; Mansilla, G.N.; Fagre, M.; Guzmán, S.G.; Ritorto, P.A.; Perez, F.I.; Katz, M. A Multimodal TinyML-Based Predictive Maintenance Architecture for Industrial IoT in the 6G Era. Sensors 2026, 26, 4536. [Google Scholar] [CrossRef] [Scilit]
- Rivera Velázquez, J.M.; Mailly, F.; Nouet, P. System-level simulations of multi-sensor systems and data fusion algorithms. Microsyst. Technol. 2022, 28, 1399–1408. [Google Scholar] [CrossRef] [Scilit]
- Gis, D.; Büscher, N.; Haubelt, C. Investigation of Timing Behavior and Jitter in a Smart Inertial Sensor Debugging Architecture. Sensors 2021, 21, 4675. [Google Scholar] [CrossRef] [Scilit]
- Bruinsma, S.; Geertsma, R.D.; Loendersloot, R.; Tinga, T. Motor current and vibration monitoring dataset for various faults in an E-motor-driven centrifugal pump. Data Brief. 2023, 52, 109987. [Google Scholar] [CrossRef] [Scilit]
- Amphenol Wilcoxon. 786B Industrial Accelerometer, 100 mV/g, Top Exit (Data Sheet). 2022. Available online: https://wilcoxon.com/wp-content/uploads/2022/11/786B-10_spec_99208B.3.pdf (accessed on 20 September 2026).
- Analog Devices. ADXL345: 3-axis, ±2 g/±4 g/±8 g/±16 g Digital Accelerometer (Data Sheet Rev. G). 2015. Available online: https://www.analog.com/media/en/technical-documentation/data-sheets/adxl345.pdf (accessed on 20 September 2026).
- Analog Devices. ADXL356/ADXL357/ADXL357B: Low Noise, Low Drift, Low Power, 3-Axis MEMS Accelerometers Data Sheet (Rev. D). 2024. Available online: https://www.analog.com/media/en/technical-documentation/data-sheets/adxl356-357-357b.pdf (accessed on 20 September 2026).
- Jain, P.H.; Bhosle, S.P. Analysis of vibration signals caused by ball bearing defects using time-domain statistical indicators. Int. J. Adv. Technol. Eng. Explor. 2022, 9, 700–715. [Google Scholar] [CrossRef] [Scilit]
- ISO 10816-7:2009; Mechanical Vibration—Evaluation of Machine Vibration by Measurements on Non-Rotating Parts—Part 7: Rotodynamic Pumps for Industrial Applications, Including Measurements on Rotating Shafts. International Organization for Standardization: Geneva, Switzerland, 2009.
- Jung, S.; Dagobert, T.; Morel, J.M.; Facciolo, G. A Review of t-SNE. Image Process. Line 2024, 14, 250–270. [Google Scholar] [CrossRef] [Scilit]
- Der, O.; Basar, G.; Mert, I.; Yıldırım, E. Comparative machine learning for multi-response quality prediction in CO 2 laser cutting of polypropylene. Mater. Test. 2026, 68, 1311–1328. [Google Scholar] [CrossRef] [Scilit]
- Alhawsawi, A.M.; Moustafa, E.B.; Fujii, M.; Banoqitah, E.M.; Elsheikh, A. Kerf characteristics during CO2 laser cutting of polymeric materials: Experimental investigation and machine learning-based prediction. Eng. Sci. Technol. Int. J. 2023, 46, 101519. [Google Scholar] [CrossRef] [Scilit]
- Yu, Y.; Gu, X.; Ma, W.; Guo, L.; Gao, H.; Zhang, G. A New Method for Quantitative Estimation of Rolling Bearings Under Variable Working Conditions. IEEE/ASME Trans. Mechatron. 2024, 29, 41–51. [Google Scholar] [CrossRef] [Scilit]
- Yu, Y.; Luo, T.; Guo, L.; Qian, Y.; Gao, H. A dynamics simulation-assisted transfer learning method for track condition diagnosis in urban rail transits. Struct. Health Monit. 2025, 24, 3046–3063. [Google Scholar] [CrossRef] [Scilit]

Disclaimer/Publisher’s Note: The statements, opinions and data contained in all publications are solely those of the individual author(s) and contributor(s) and not of MDPI and/or the editor(s). MDPI and/or the editor(s) disclaim responsibility for any injury to people or property resulting from any ideas, methods, instructions or products referred to in the content. |
© 2026 by the authors. Licensee MDPI, Basel, Switzerland. This article is an open access article distributed under the terms and conditions of the Creative Commons Attribution (CC BY) license.