


Abstract
A K-rich nepheline sample from Nephton, Canada, with a composition of (K1.83☐0.17)Na6.08[Al7.98Si8.04O32], was studied using in situ synchrotron high-temperature (T) powder X-ray diffraction (XRD) data and Rietveld structure refinement from 25 to 926 °C on heating and cooling on a fine-temperature (T) scale. The average structure was refined in space group P63. The sample contains satellite reflections indicative of a modulated, incommensurate superstructure. The Al and Si atoms are ordered differently in powdered samples from the same large crystal. The nepheline structure contains domains in which the Al and Si atoms are highly ordered, but the average structure of the domains gives rise to a partially disordered Al-Si distribution. On heating to 926 °C, the Al and Si atoms acquire a fully ordered Al-Si distribution, which is quenched on cooling to room T. The complete Al-Si order is deduced from the average <T-O>{4} distances. Satellite reflections associated with positional disorder of the O1 atom was not observed. A small amount (9%) of vacancies, ☐, occur on the K site. Disorder of K–☐ occurs at 320 °C where some satellite reflections disappear. Some satellite reflections associated with Al-Si order remain to 926 °C. Re-order of K–☐ occurs at 377 °C on cooling, and the associated satellite reflections reappear.
1. Introduction
The structure of three nepheline samples from the Bancroft area (Egan Chutes, Nephton, and Davis Hill), Ontario were studied [1]. The three samples contain satellite reflections and their room T average structure was reported by Hassan et al. [2] and Antao and Hassan [1]. In a study on high temperature (T) and a nepheline sample from Egan Chutes, the occurrence and disappearance of various satellite reflections give rise to a modulated incommensurate superstructure [3]. In this study, the high-T average structure of the nepheline sample from Nephton is reported.
Satellite reflections were reported in different nepheline samples [2,4,5,6,7,8]. Various structural models were proposed for the superstructure in nepheline [4,5,6,9,10,11,12], but no model explains the satellite reflections. The satellite reflections may indicate a domain structure that arises from K–☐ (vacancy) order [13], Al-Si order [4], or a displacive transformation [12]. In some studies, the satellite reflections were also attributed to the O1 atom positional modulation [2,14], or a displacive modulation [9]. Nepheline samples from Mount Nyiragongo, Africa, do not contain satellite reflections, but contain intergrowths of different phases [15,16]. Similar intergrowths were observed in garnet [17].
It was shown that the nepheline structural parameters obtained by the single-crystal method [2] and that obtained on powdered samples are somewhat different, especially regarding Al-Si order [1,3]. Because of associated Al-Si order, the Al2 and Si2 sites appear more disordered in the powdered sample compared to the single-crystal sample. On heating, complete Al-Si order is expected to be quenchable as was observed previously [3].
The average structure of natural nepheline was first investigated by Buerger et al. [18]. The single-crystal structure of nepheline was refined [1,2,9,13,19,20,21,22,23,24,25,26,27,28]. A modulated structure of nepheline was examined by Friese et al. [29]. Iron (Fe3+) in nepheline was examined recently [30]. The structure of an AlGe analog of nepheline [31] and other synthetic nephelines are available [32]. The nepheline structure was recently discussed and is not elaborated further in this study [3]. According to Hassan et al. [2], the positional disorder of the O1 atoms requires a simple rotation of the TO4 tetrahedra, involves the lowest energy, and occurs at the lowest T. K–☐ disorder along the 63 channel requires a little more energy, and occurs at a higher T. Al-Si disorder involves the largest energy, and occurs at the highest T.
Nepheline has a high Al2O3 content and is used in the glass, ceramics, leather, textile, wood, and oil industries [33,34,35]. It can be used as a filler in paints, plastics, and rubber [36]. Nepheline has also been used as a sorbent for defluorination of sewage from mining plants [37,38]. Few studies examined the high-temperature structure of nepheline, so additional studies are necessary [3,8,13].
On heating nepheline, three possibilities may occur: (1) positional disorder of the O1 atom, (2) K–☐ disorder, and (3) increase in Al-Si order. At high-T, the resulting Al-Si order should be complete. These possibilities are investigated by examining the crystal structure from 25 to 926 °C on heating and cooling a K-rich nepheline sample from Nephton, Canada. In this study, complete Al-Si order is achieved at 926 °C and is quenched on cooling.
2. Experimental Methods
The K-rich nepheline sample, (K1.83☐0.17)Na6.08[Al7.98Si8.04O32], used in this study is from Nephton, ON, Canada and was studied previously [1]. From a large single crystal (about 1 cm in diameter) of pure nepheline, a 2 mm (maximum dimension) single crystal was handpicked under a binocular microscope, and finely ground in an agate mortar and pestle for high-T synchrotron powder X-ray diffraction (XRD) experiments that were performed at beamline 1-BM, Advanced Photon Source, Argonne National Laboratory.
The sample was loaded into a quartz capillary (diameter = 1 mm) and held in place by stuffing quartz wool at both ends of the open capillary. The capillary was oscillated during the experiment over a range of 2°. The high-T XRD data were collected using in situ synchrotron radiation [λ = 0.62266(5) Å] at room pressure and from 26 to 926 °C on heating and cooling (the last data point on cooling was at 142 °C because the sample became misaligned and data could not be collected further). Elevated T was obtained using a heater and a thermocouple element placed inside the capillary and close to the sample. Data were collected at a heating and cooling rate of about 7 °C/min to a maximum 2θ of about 30° (about 2 h each for heating and cooling). An image plate (IP) detector (Mar345) mounted perpendicular to the beam path was used to collect full-circle two-dimensional Debye–Scherrer rings with an exposure time of 15 s. An external LaB6 standard was used to determine the sample-to-detector distance, wavelength, and tilt of the IP. The two-dimensional diffraction rings recorded by the IP were integrated using the Fit2d (v. 12) program to produce conventional I-2θ XRD traces [39].
The crystal structure of nepheline was modeled with the Rietveld method [40], as implemented in the GSAS program [41], and using the EXPGUI interface [42]. The chemical composition used in the refinement is K1.82☐0.18Na6[Al8Si8O32] compared to (K1.83☐0.17)Na6.08[Al7.98Si8.04O32], obtained from electron microprobe analyses (EMPAs; [1]). The initial structural parameters for the same sample were taken from Antao and Hassan [1]. Structure refinements were carried out by varying parameters in the following sequence: scale factor, background parameters, unit cell parameters, profile, atom positions, and isotropic displacement parameters. Finally, all variables were refined simultaneously. The refined structural parameters were then used as input for the next higher-T structure on heating and conversely on cooling. The occupancy factor for each site was held invariant and that for the K site was set at 0.909, as obtained by Antao and Hassan [1]. Because of the large amount of data, a few unit cell parameters and R (F2) values from the Rietveld refinement at the selected T are given in Table 1. Similarly, the atom coordinates and isotropic displacement parameters are given in Table 2, and bond distances and bridging T-O-T angles are given in Table 3. Although these tables contain data at selected T, all the data are displayed graphically.
Table 1.
Unit cell parameters and Rietveld refinement statistics for nepheline from Nephton at selected T.
Table 2.
Nepheline from Nephton: Atom positions and isotropic displacement parameters (×100 Å2) at selected T.
Table 3.
Nepheline from Nephton: Selected interatomic distances (Å) and angles (°) at selected T.
3. Results and Discussion
3.1. Unit Cell Parameters
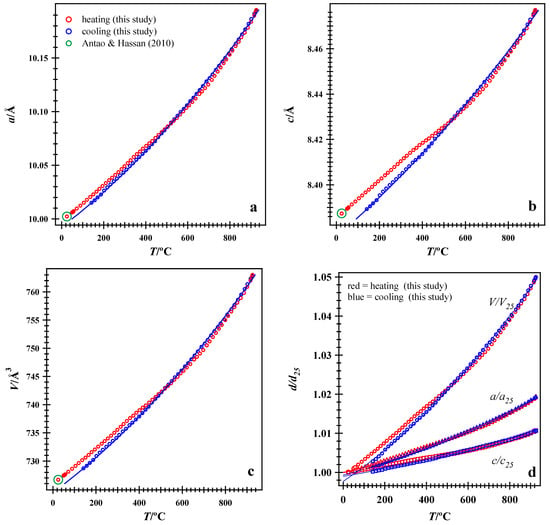
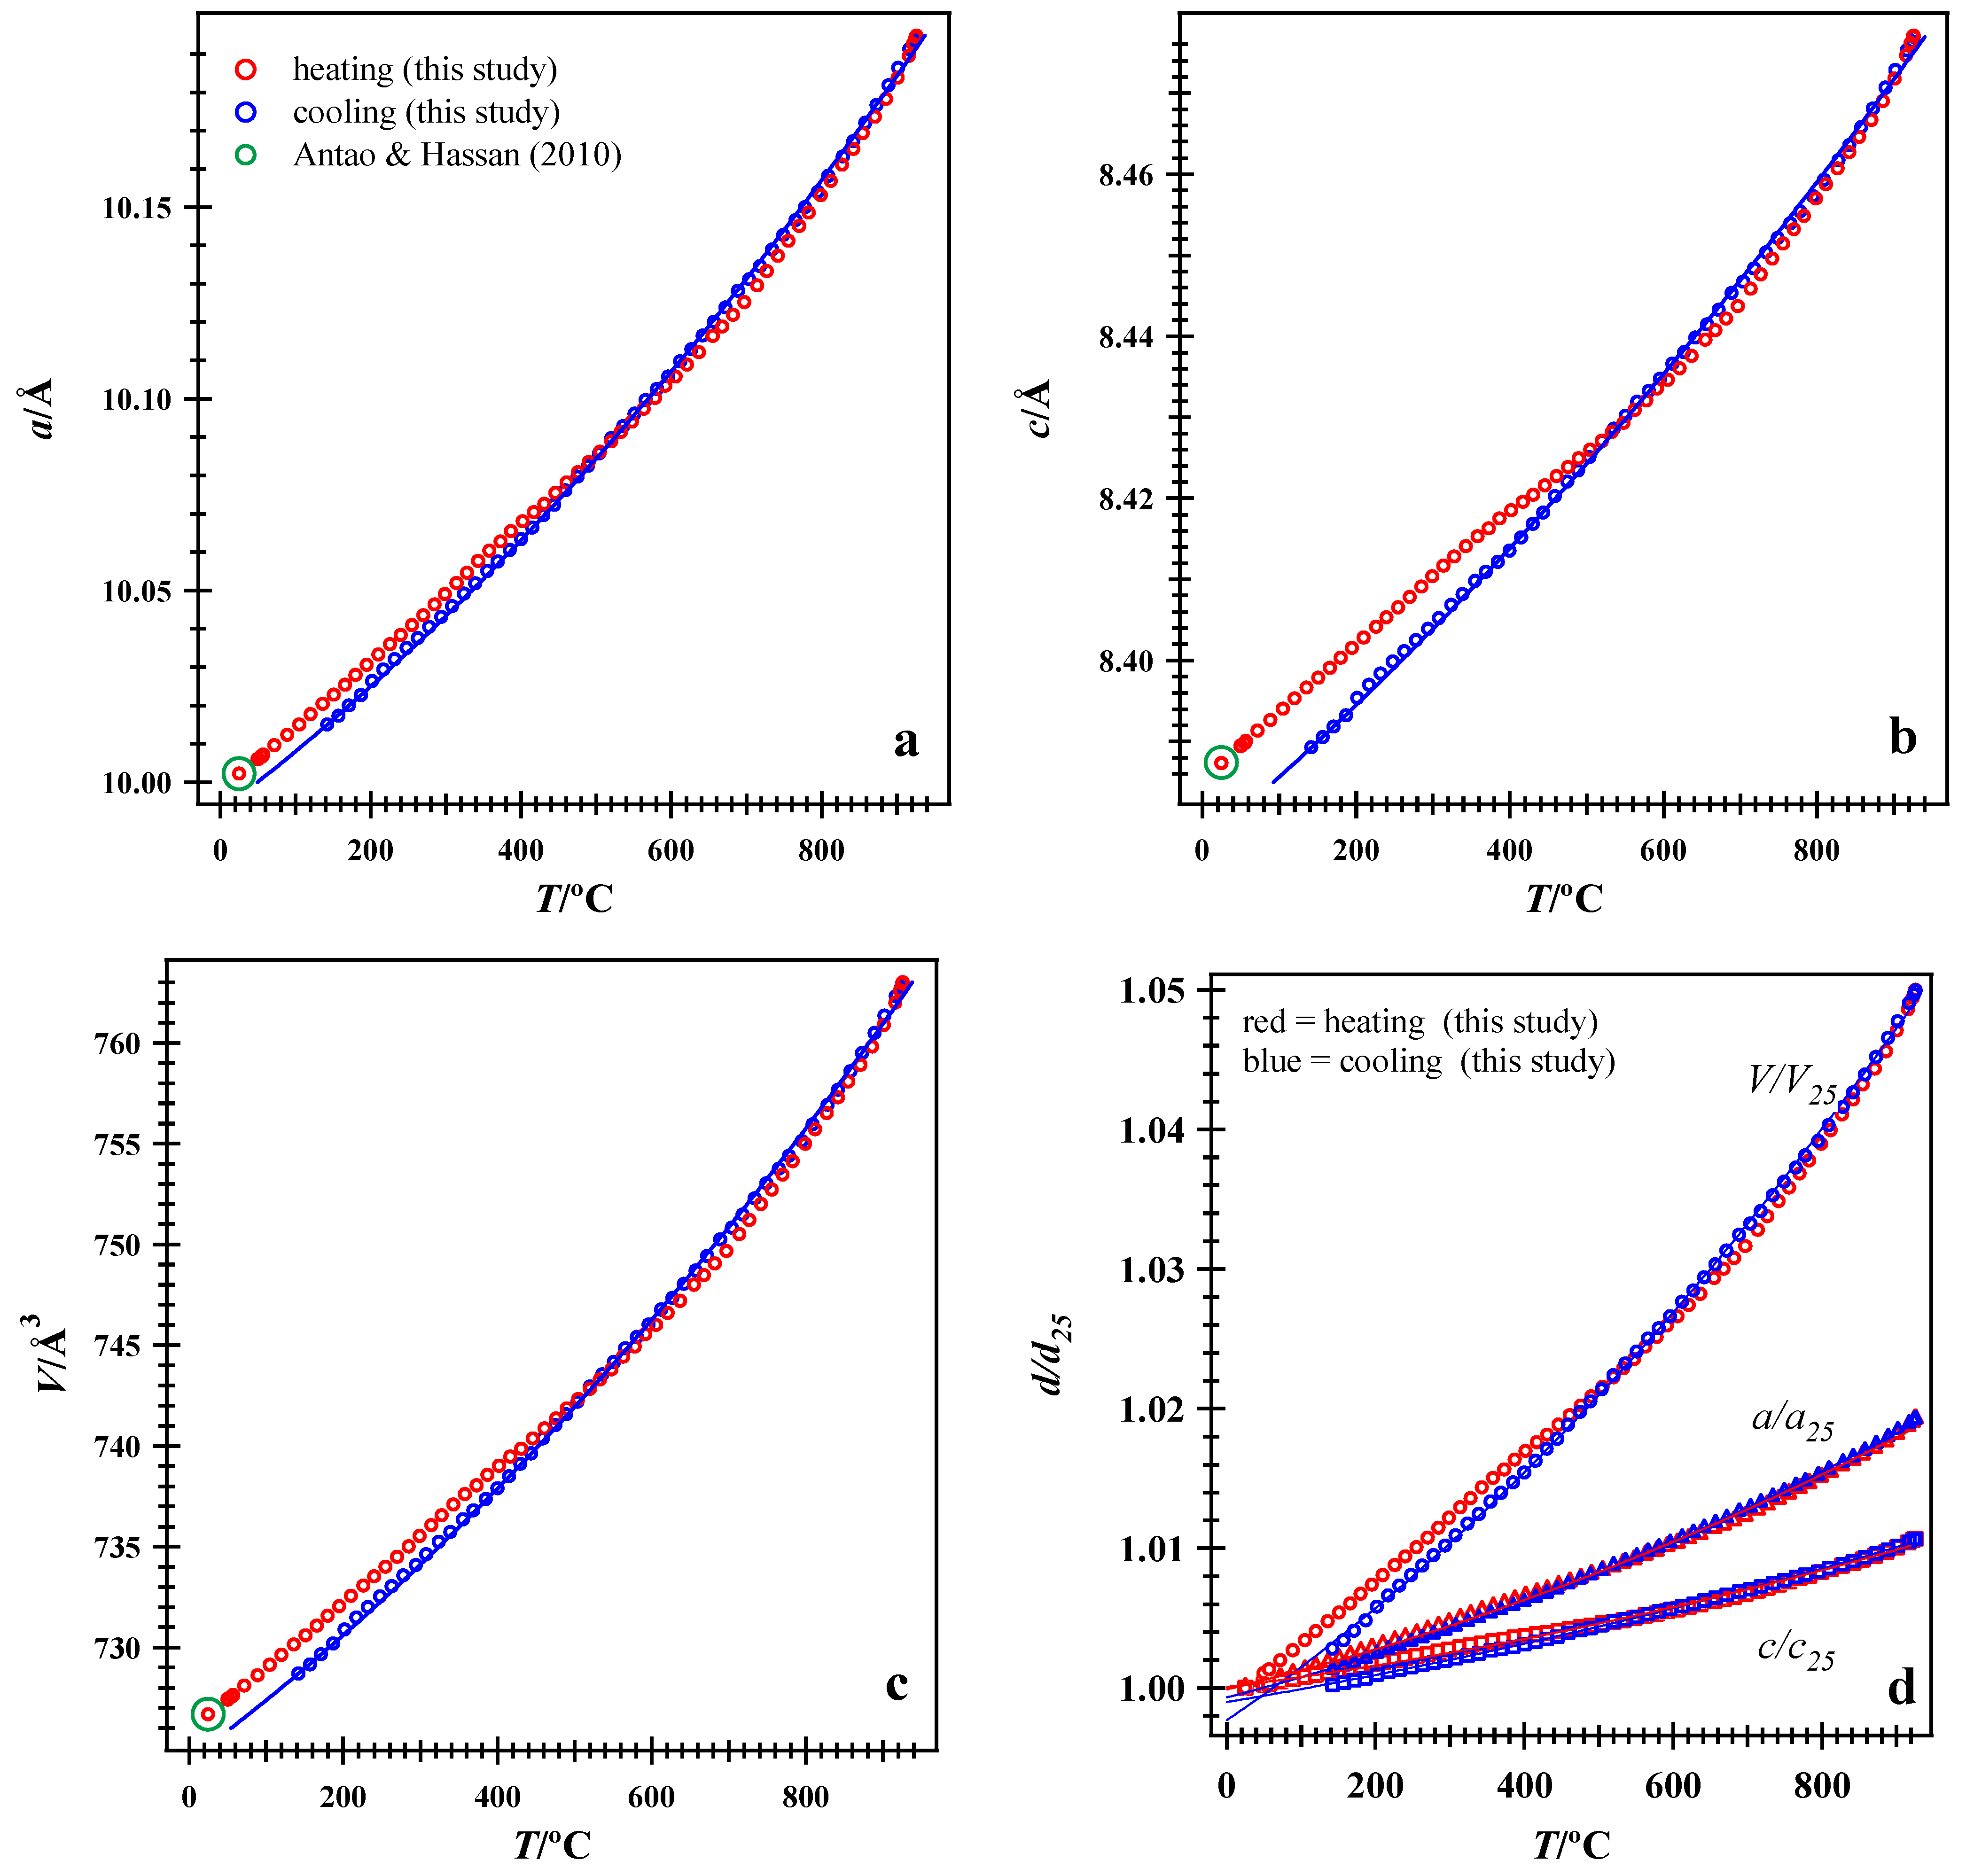
The variations in the pseudo-hexagonal sub-cell parameters with T are shown on a fine-T scale on both heating and cooling (Figure 1). At room T, the unit cell parameters agree with those obtained by Antao and Hassan [1]. On heating nepheline to 926 °C and on cooling, the unit cell parameters increase smoothly, but the heating and cooling paths are slightly different below about 460 °C (Figure 1). When the unit cell parameters are plotted as d/d0 ratio, it can be seen that the a axis expands much more than the c axis, so the c/a ratio decreases, whereas the other unit cell parameters increase with T (Figure 1d).
Figure 1.
Variations in unit-cell parameters with T. (a) a, (b) c, (c) volume, V, and (d) d/d25 ratio of axial and volume expansion of unit-cell parameters with T. Error bars are smaller than the symbols. The heating and cooling paths are different below about 460 °C and are nearly identical above that T. The a axis expands more than the c axis. The unit-cell parameters increase with T. HRPXRD data at room T from Antao and Hassan [1] are included.
The volume thermal expansivity was obtained by fitting all the unit cell volume data on cooling simultaneously to the following equation:
where V(T) is the volume at any temperature, T, VTr is the volume at the reference T, and αV(T) is a polynomial equation for the volume thermal expansion coefficient: αV(T) = αV0 + αV1T + αV2T2. Ignoring the quadratic term, the values αV0 = 3.92 (±0.05) × 10−5 °C−1 and αV1 = 3.45 (±0.11) × 10−8 °C−2 were obtained with VTr = 728.71(2) Å3 at 142 °C (blue curve in Figure 1c).
Similarly, fitting all the a unit cell parameter data on cooling, the following coefficients are obtained: αa0 = 1.48 (±0.02) × 10−5 °C−1 and αa1 = 1.40 (±0.04) × 10−8 °C−2 were obtained with aTr = 10.0150(2) Å at 142 °C (blue curve in Figure 1a). Fitting all the c unit cell parameter data on cooling, the following coefficients were obtained: αc0 = 9.61 (±0.13) × 10−6 °C−1 and αc1 = 6.30 (±0.28) × 10−9 °C−2 were obtained with cTr = 8.3893(2) Å at 142 °C (blue curve in Figure 1b).
3.2. Satellite Reflections
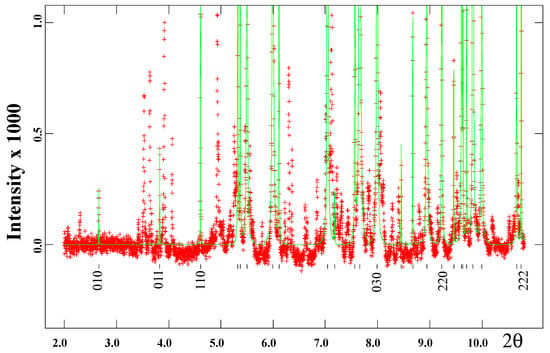
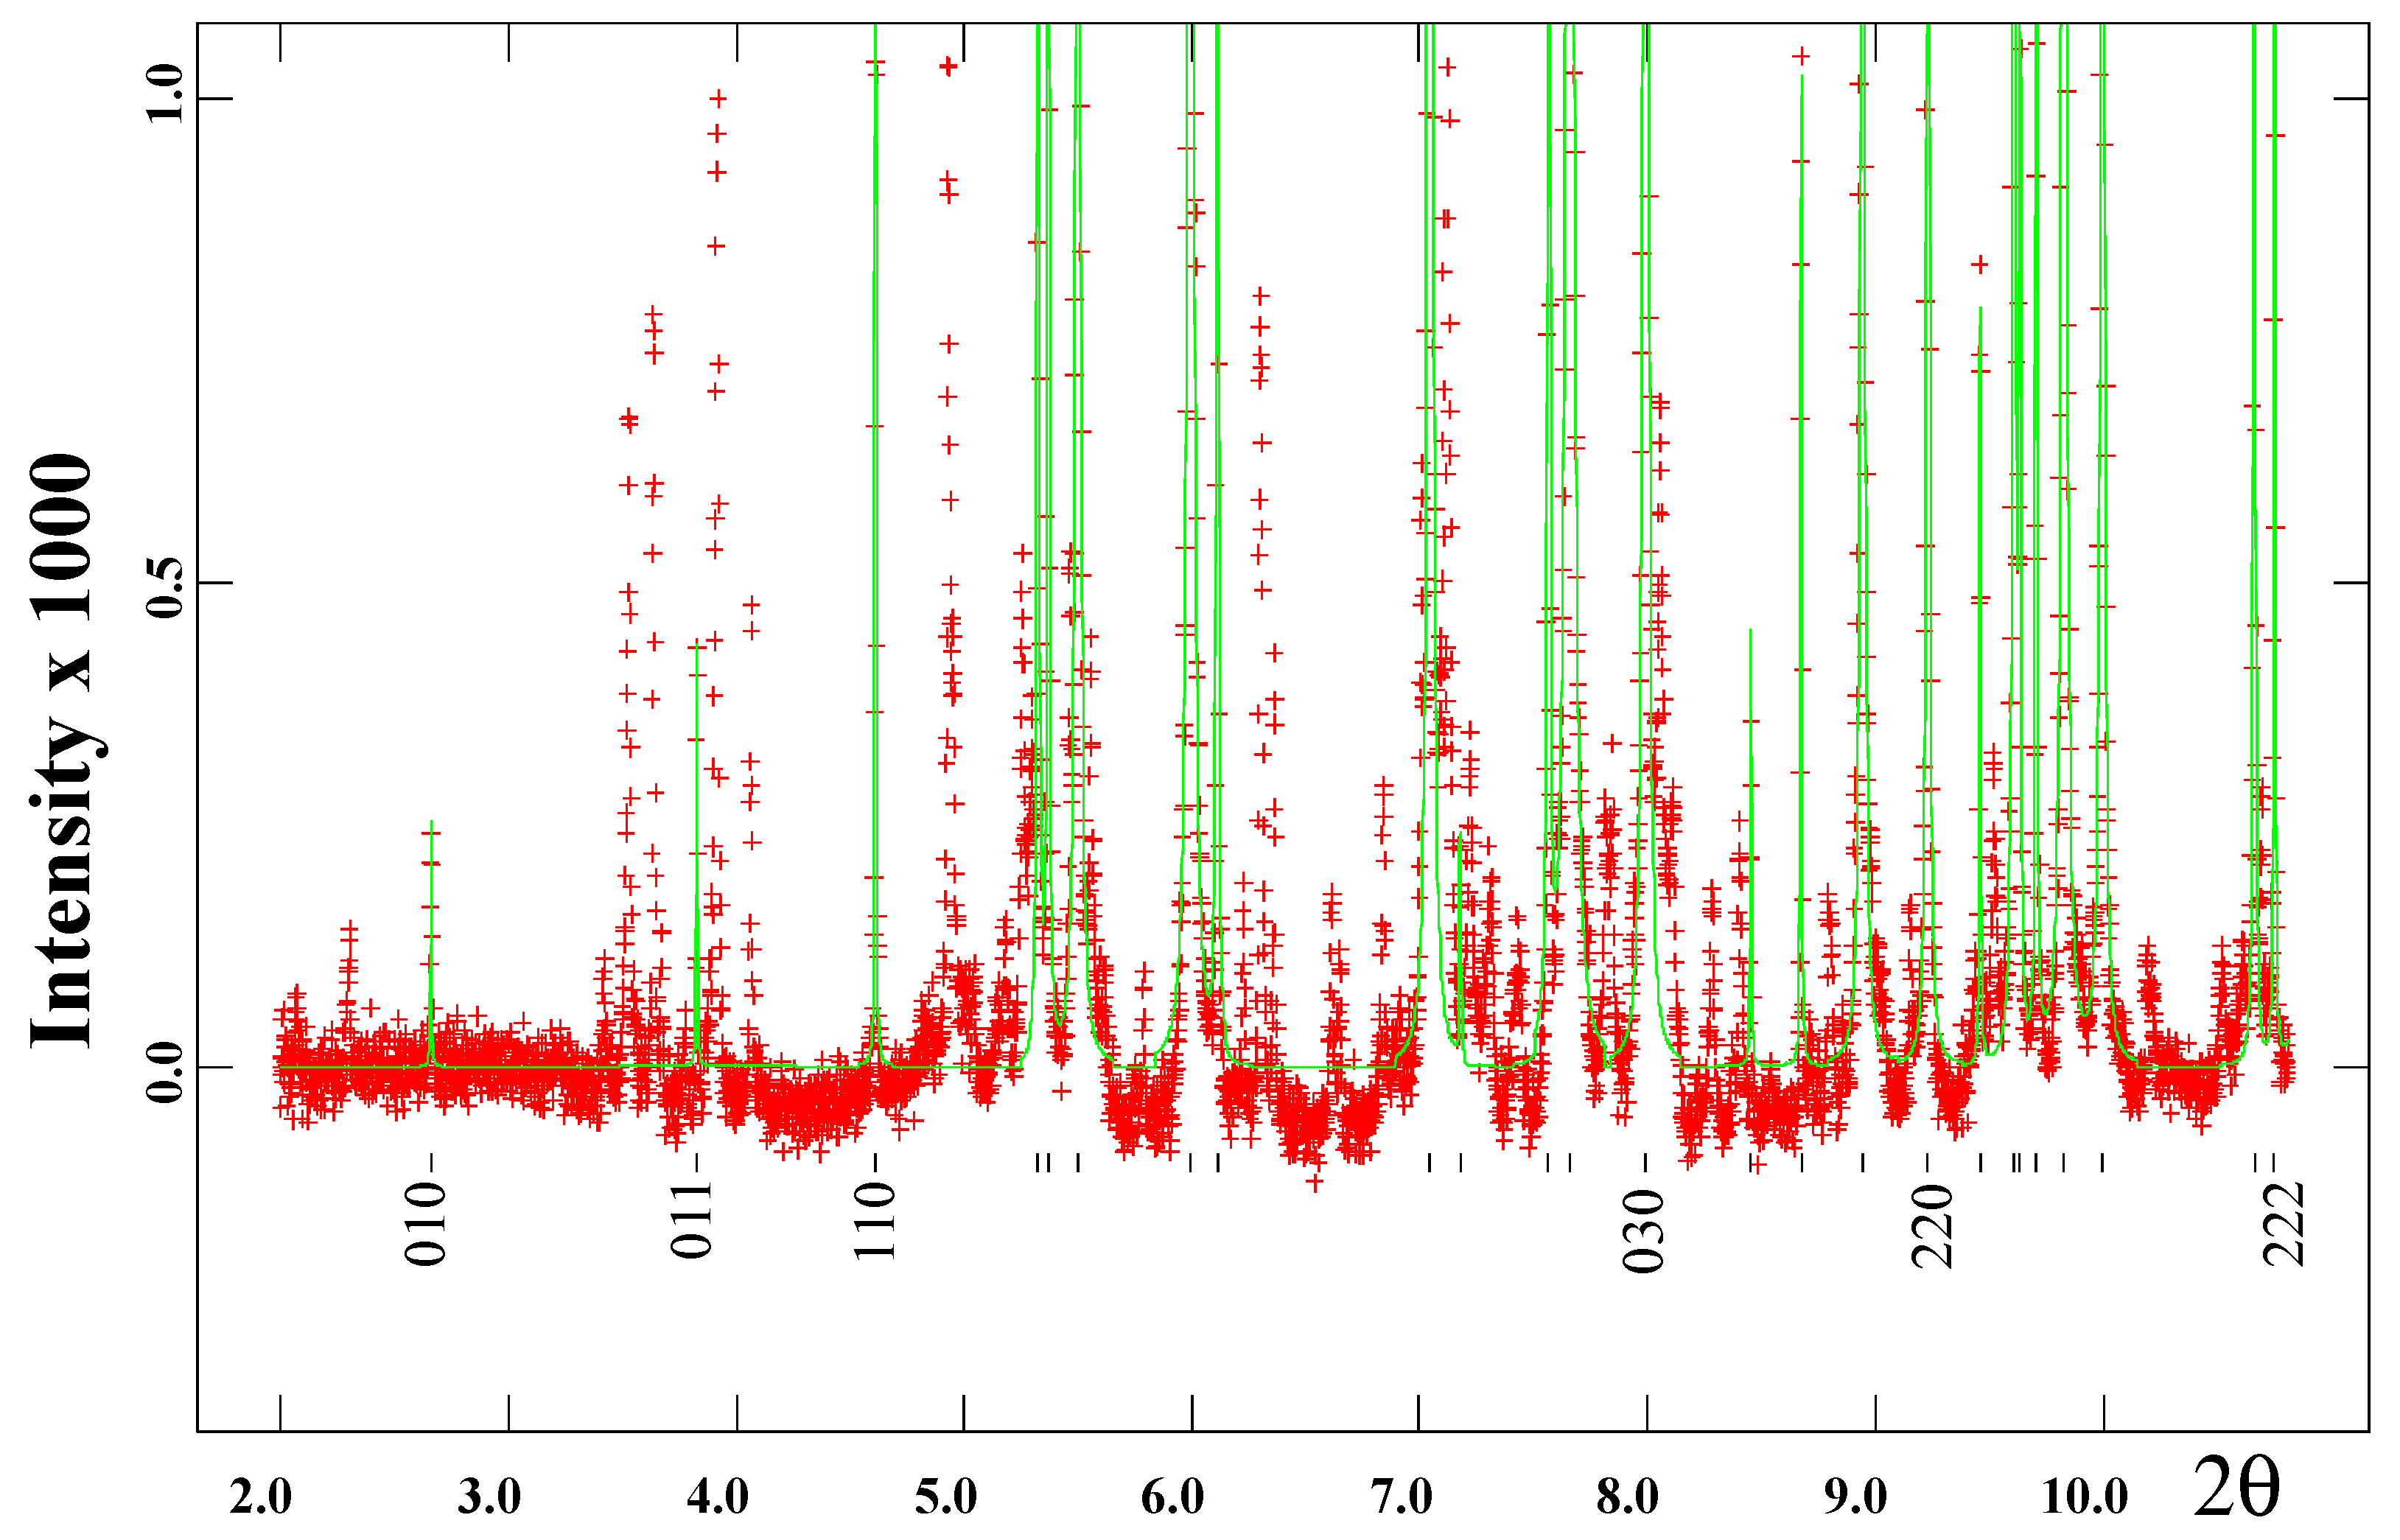
Satellite reflections are observed using high-resolution powder X-ray diffraction (HRPXRD; Figure 2). These satellite reflections are different from those in other nepheline samples [1]. The satellite reflections are not indexed and occur between the main substructure reflections, a few of which are indexed using the sub-cell parameters. The satellite reflections are highly variable in their occurrences, even within powdered samples obtained from the same large single crystal of nepheline. These satellite reflections indicate that the nepheline structure is incommensurately modulated [2,3,4,9,29].
Figure 2.
A small 2θ range of an HRPXRD trace showing satellite reflections in a pure nepheline sample from Nephton. Calculated (continuous line) and observed (crosses) profiles are shown. The short vertical lines indicate the allowed reflection positions and miller indices (no bars on any index) for a few sub-cell reflections are given. The satellite reflections are unmarked and not fitted. About 12 satellite reflections are contained in the trace.
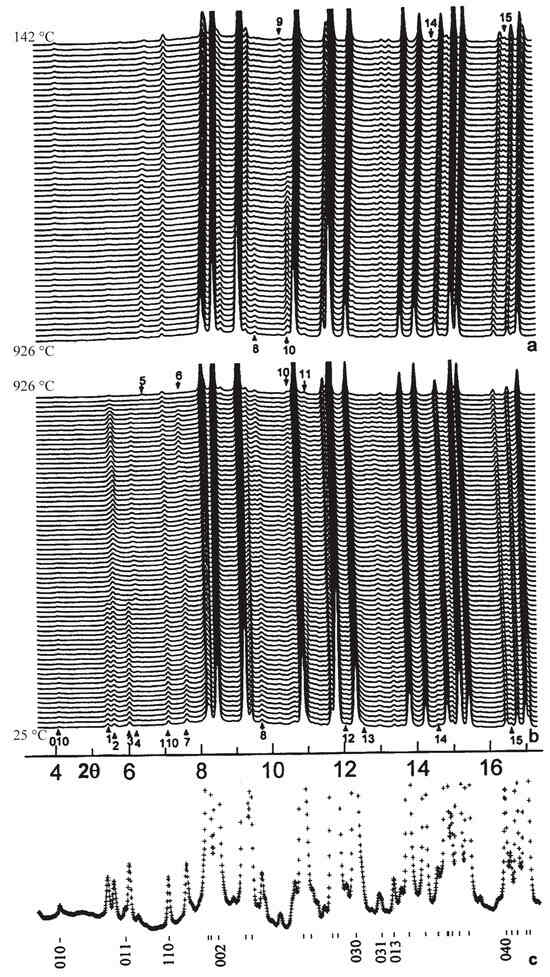
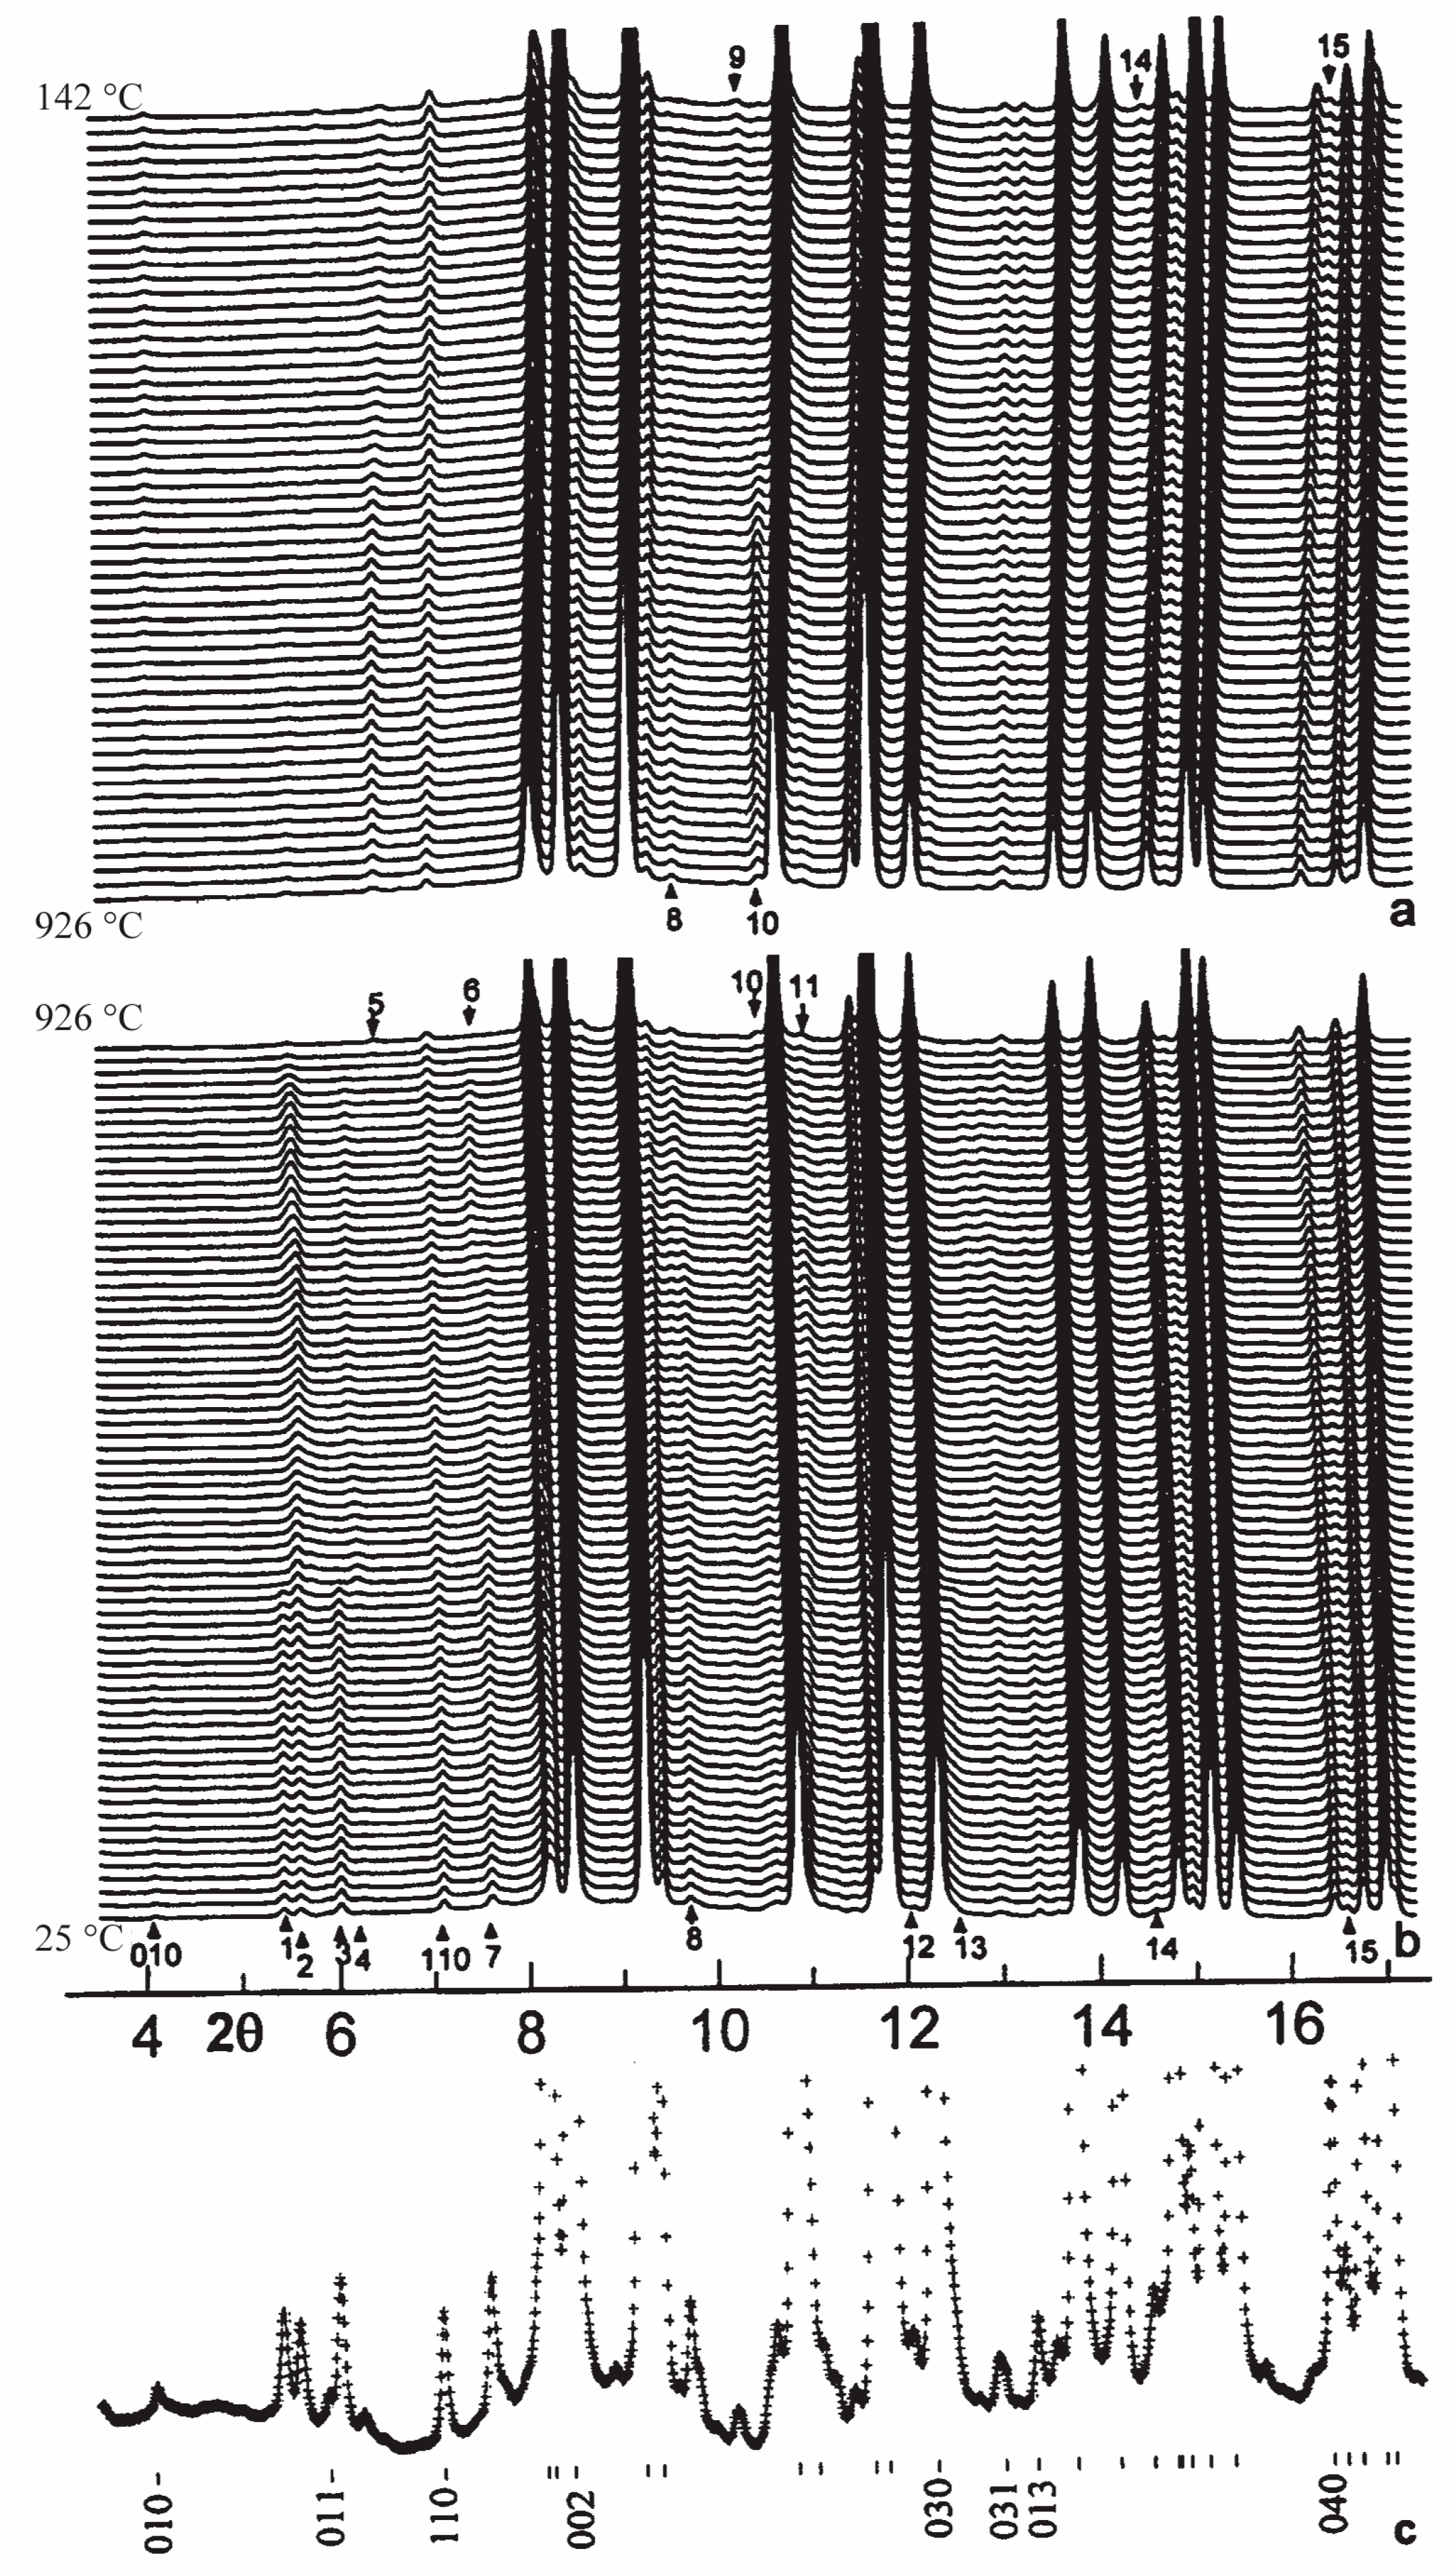
Stacks of XRD traces containing satellite reflections are shown on cooling (Figure 3a) and heating (Figure 3b). In order to locate satellite reflections, a room-T trace with some indices of main reflections from the substructure are given (Figure 3c). Some satellite reflections disappear at 320 °C (e.g., those labeled 1, 3, 12, and 13), where a transition occurs and is related to K–☐ disorder (Figure 3b). Additional subtle changes in the satellite reflections occur towards 926 °C, the highest T used in this study. Some satellites reflections (e.g., those labeled 4, 6, 7, and 14) disappear towards 926 °C, and they are related to Al-Si order. The intensity of the (010) main reflection decreases on heating and increases on cooling (Figure 3). The disappearance of satellite reflection 3 is accompanied by the appearance of satellite reflection 4, which later disappears near 926 °C. The disappearance of satellite reflection 4 at 926 °C is accompanied by the appearance of satellite reflection 5, which remains on cooling. On cooling, changes occur for satellite reflections such as 8, 9, 10, 14, and 15 (Figure 3a).
Figure 3.
Stacks of traces with T: (a) cooling from 926 to 142 °C, (b) heating from 25 to 926 °C, and (c) a trace at 25 °C to aid in location of the satellite reflections. About 15 satellite reflections are numbered in sequence with increasing 2θ in (a,b) and these change on heating and cooling.
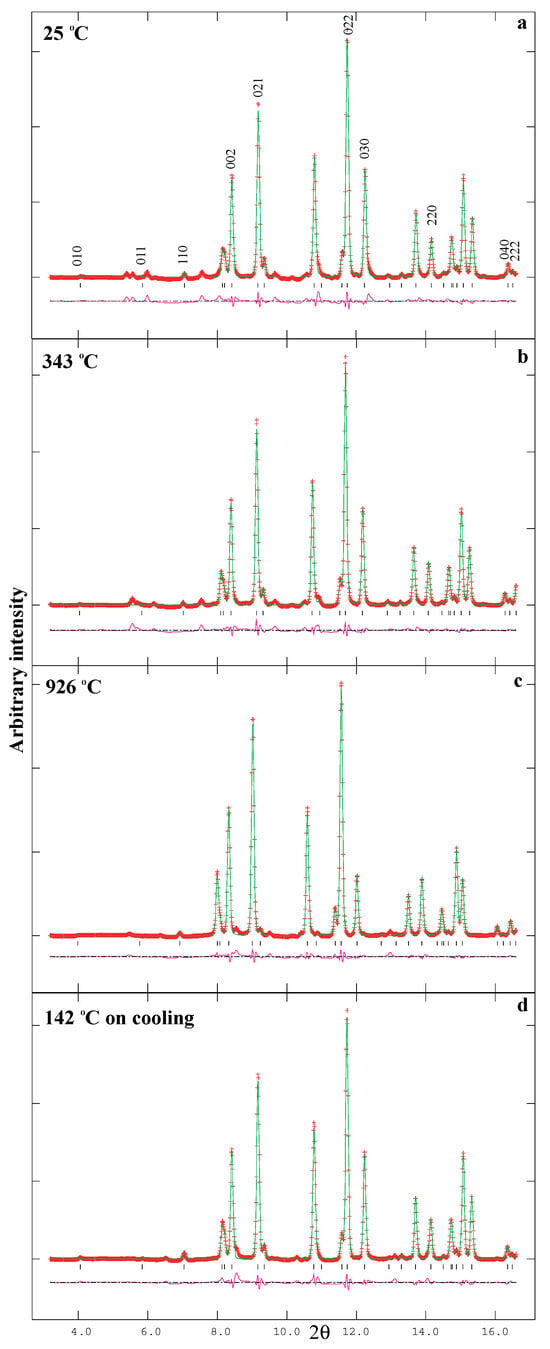
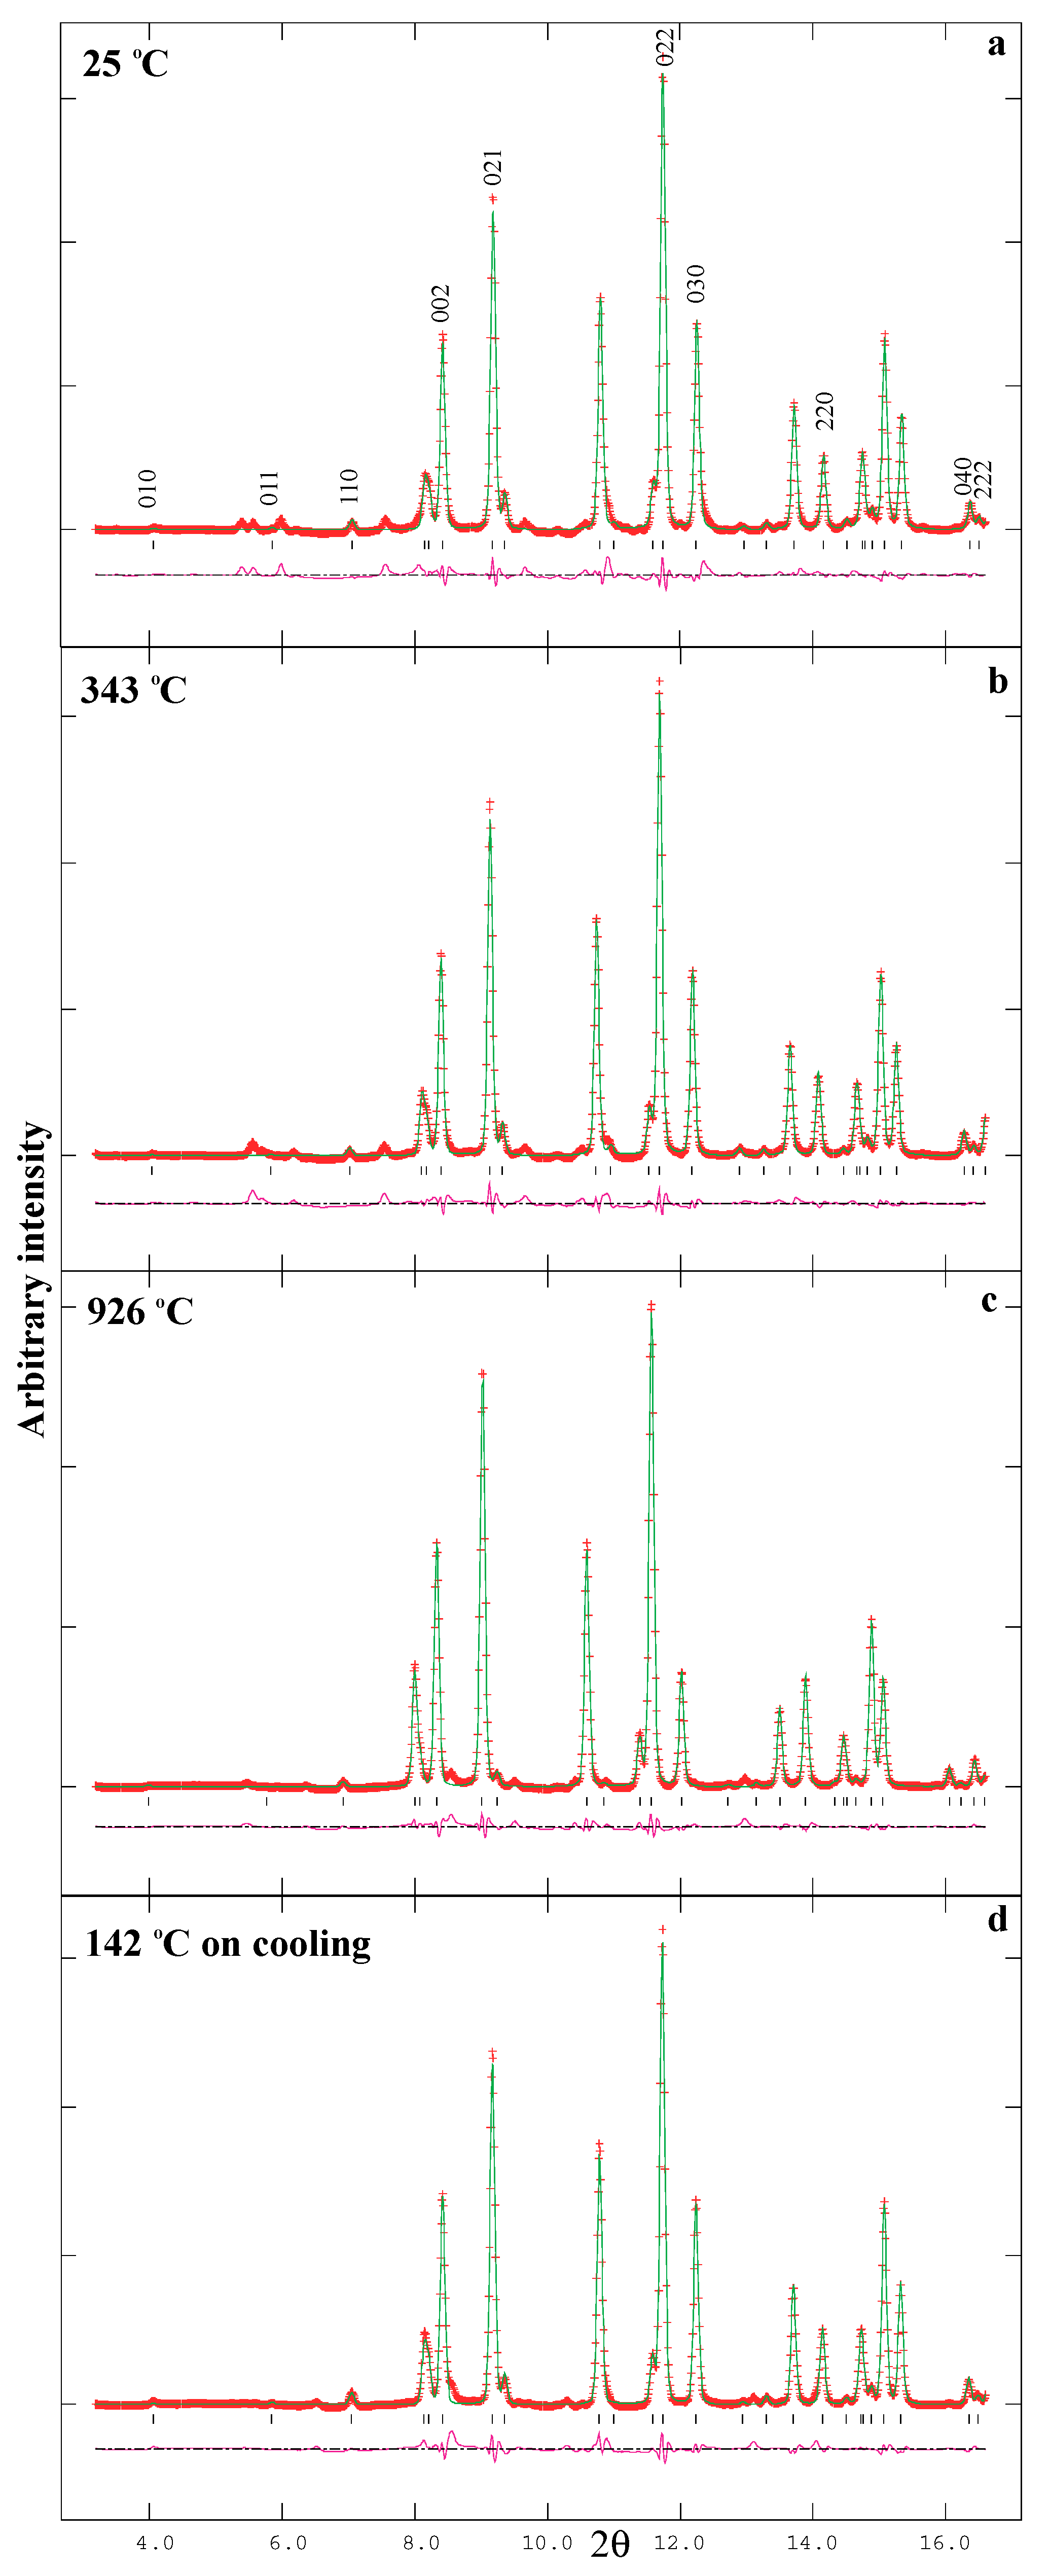
The XRD traces at 25, 343, 926, and 142 °C are displayed in Figure 4. Note the disappearance of some satellite reflections on heating and re-appearance of some satellite reflections on cooling (Figure 3 and Figure 4).
Figure 4.
Comparison of the XRD traces for nepheline from Nephton at (a) 25 °C before heating, (b) 343 °C after the transition at 320 °C, (c) 926 °C, the highest T, and (d) 142 °C on cooling, together with the calculated (continuous line) and observed (crosses) profiles. The difference curve (Iobs − Icalc) is shown at the bottom of each trace. The short vertical lines indicate indexed main reflection positions based on the sub-cell. Only the lower 2θ range of each trace is shown to indicate the location of the satellite reflections (unfitted).
4. Structural Variations with T
The room-T structural parameters for nepheline are different from those obtained by Antao and Hassan [1]. Structural parameters from this study are given in Table 1, Table 2 and Table 3 and are displayed in the graphs below for comparison. Comparing the two structural datasets at 25 °C (Antao and Hassan [1] and this study), it can be seen that the z coordinates for the Al and Si sites are interchanged because of the resulting average <Al,Si-O>{4} distances, whereas all the other atom positions are nearly the same (Table 2). Both datasets (HRPXRD and IP) were obtained from the same batch of powder obtained by crushing a 2 mm single-crystal sample.
The K site contains 0.91 K + 0.09 ☐ (vacancy) and the Na site is fully occupied by Na atoms, as indicated by the formula (K0.91☐0.09)Na3[Al4Si4O16] used in the structure refinement. The charge balance is maintained by having a slight excess of Si and Na atoms as indicated by the formula (K1.83☐0.17)Na6.08[Al7.98Si8.04O32] obtained by EMPA.
4.1. Variations in Average <K-O>{9} and <Na-O>{9} Distances with T
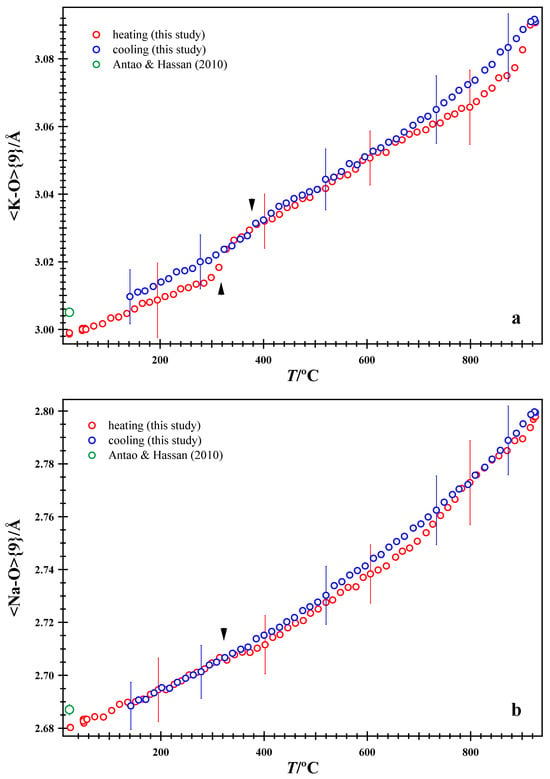
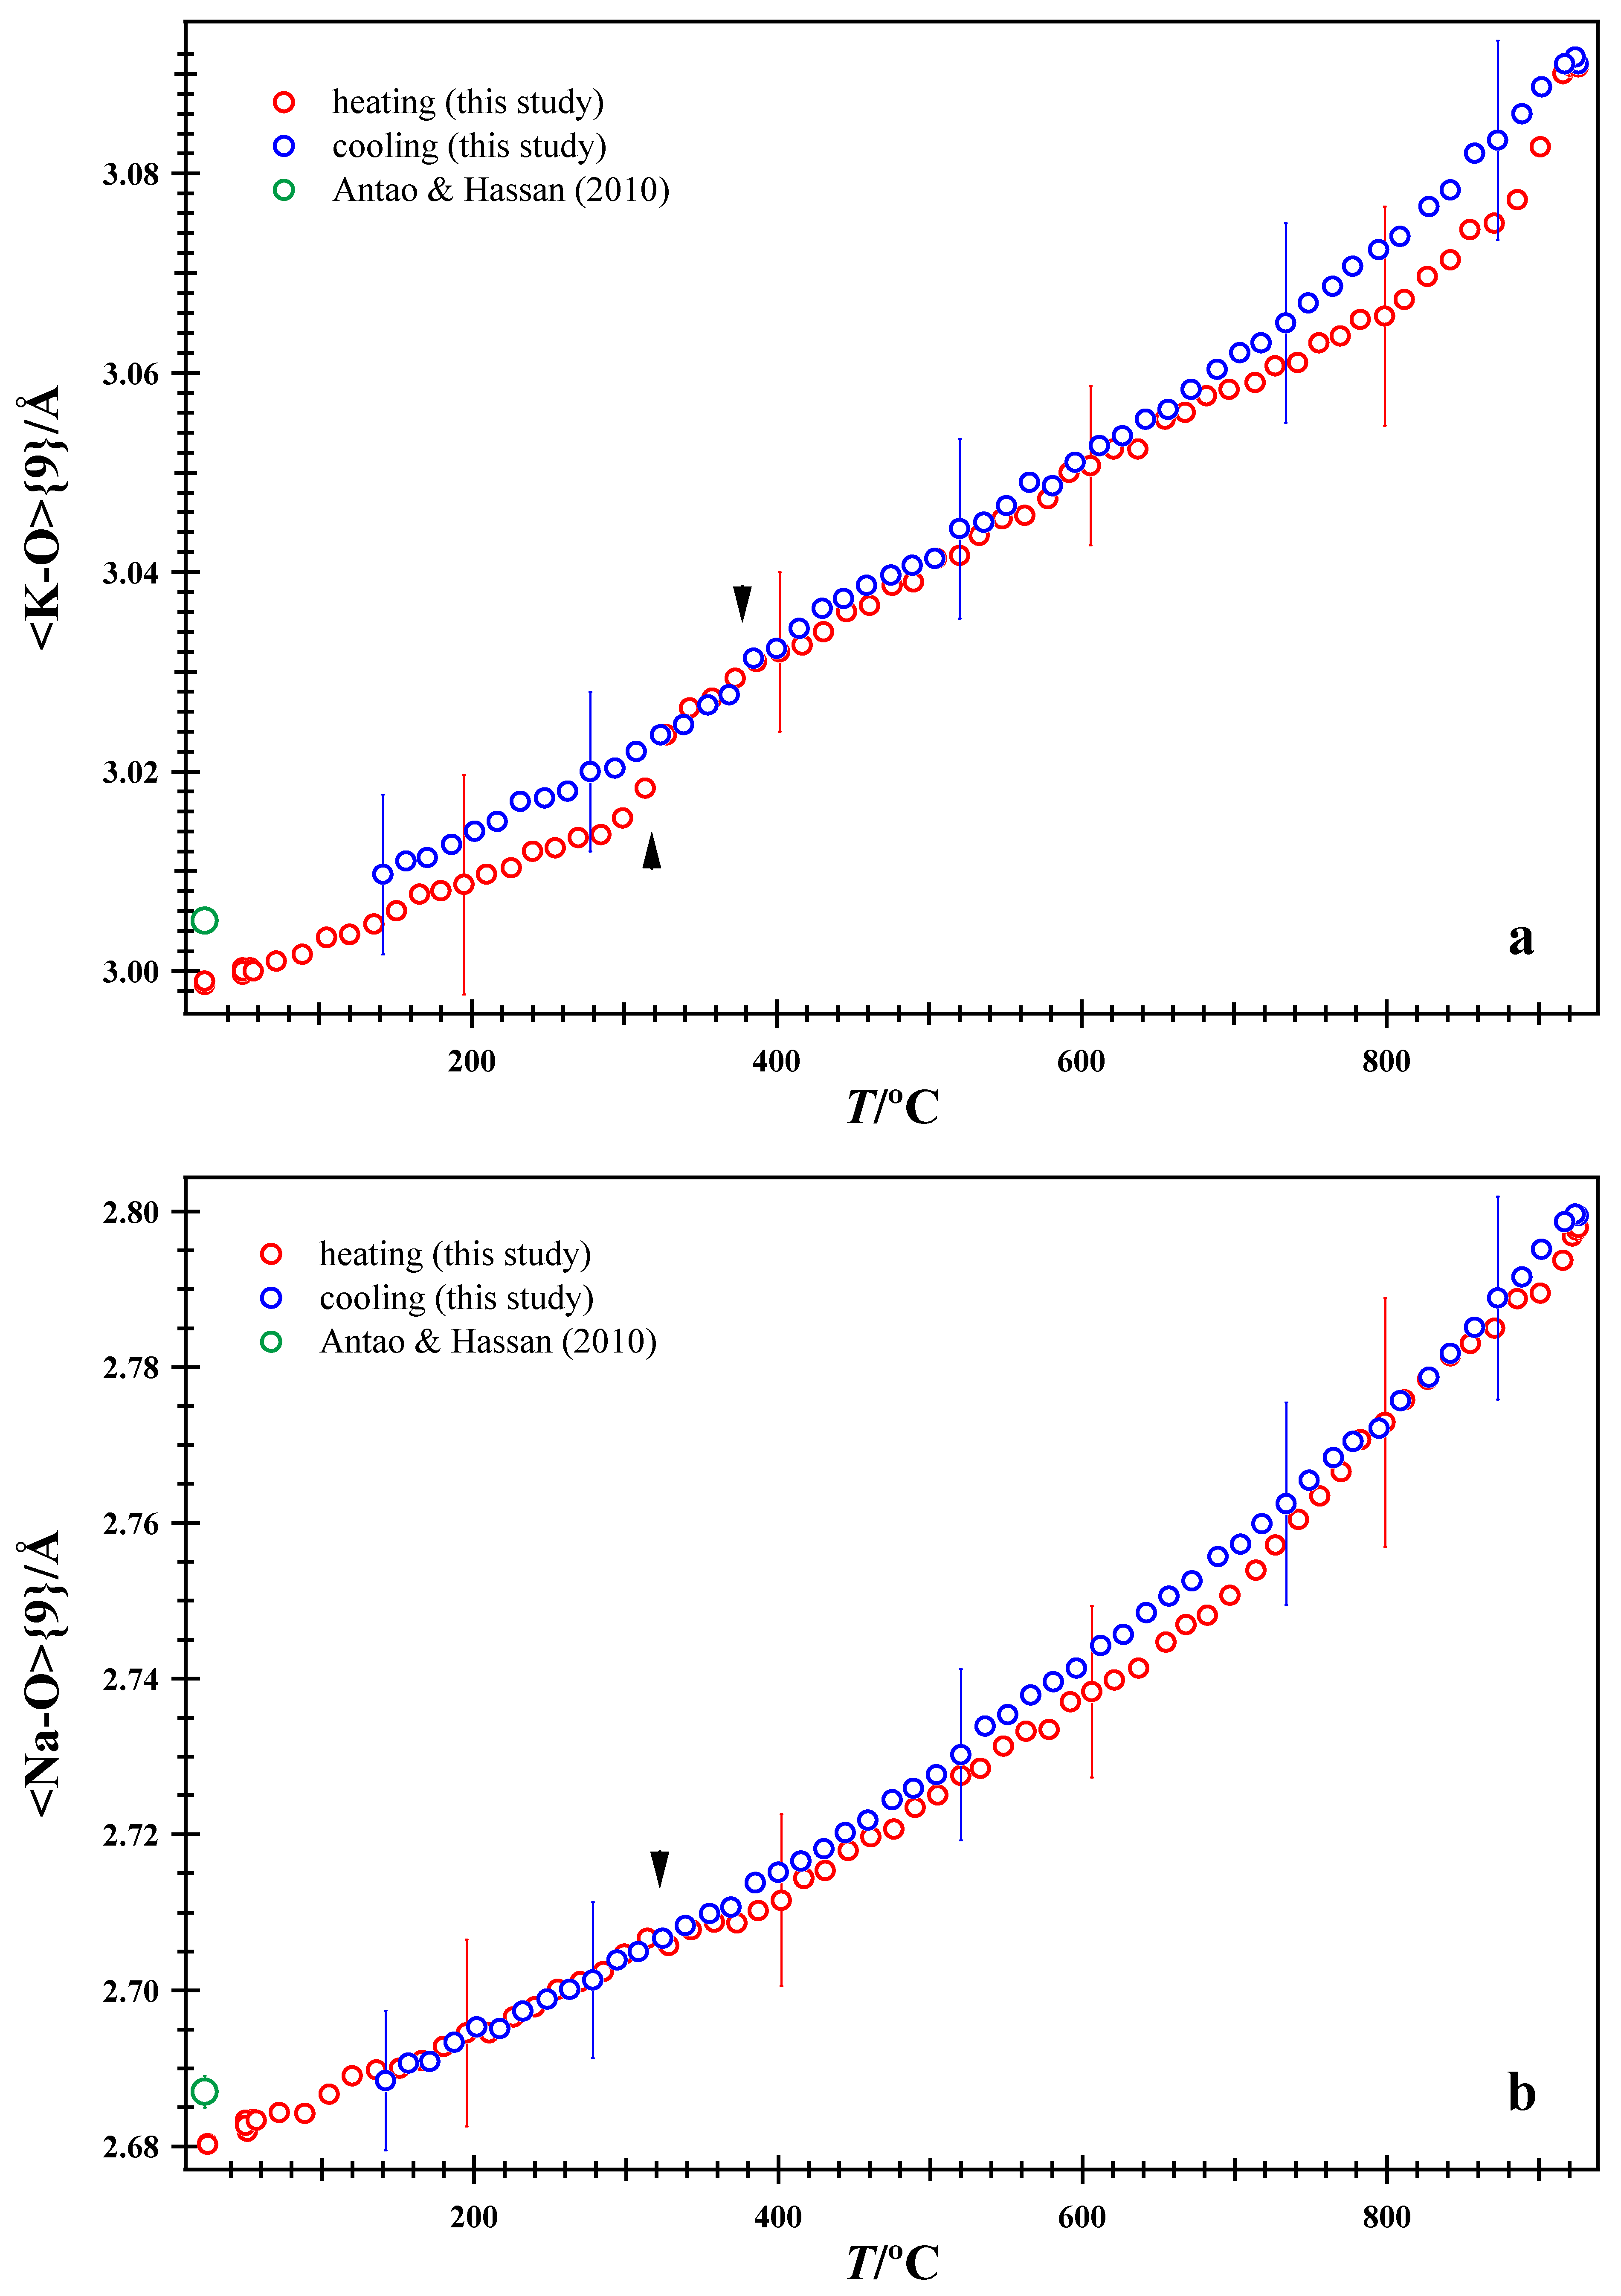
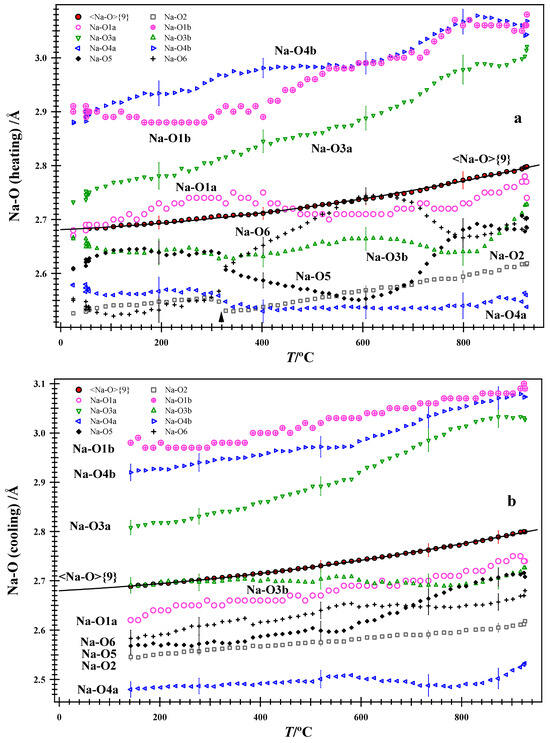
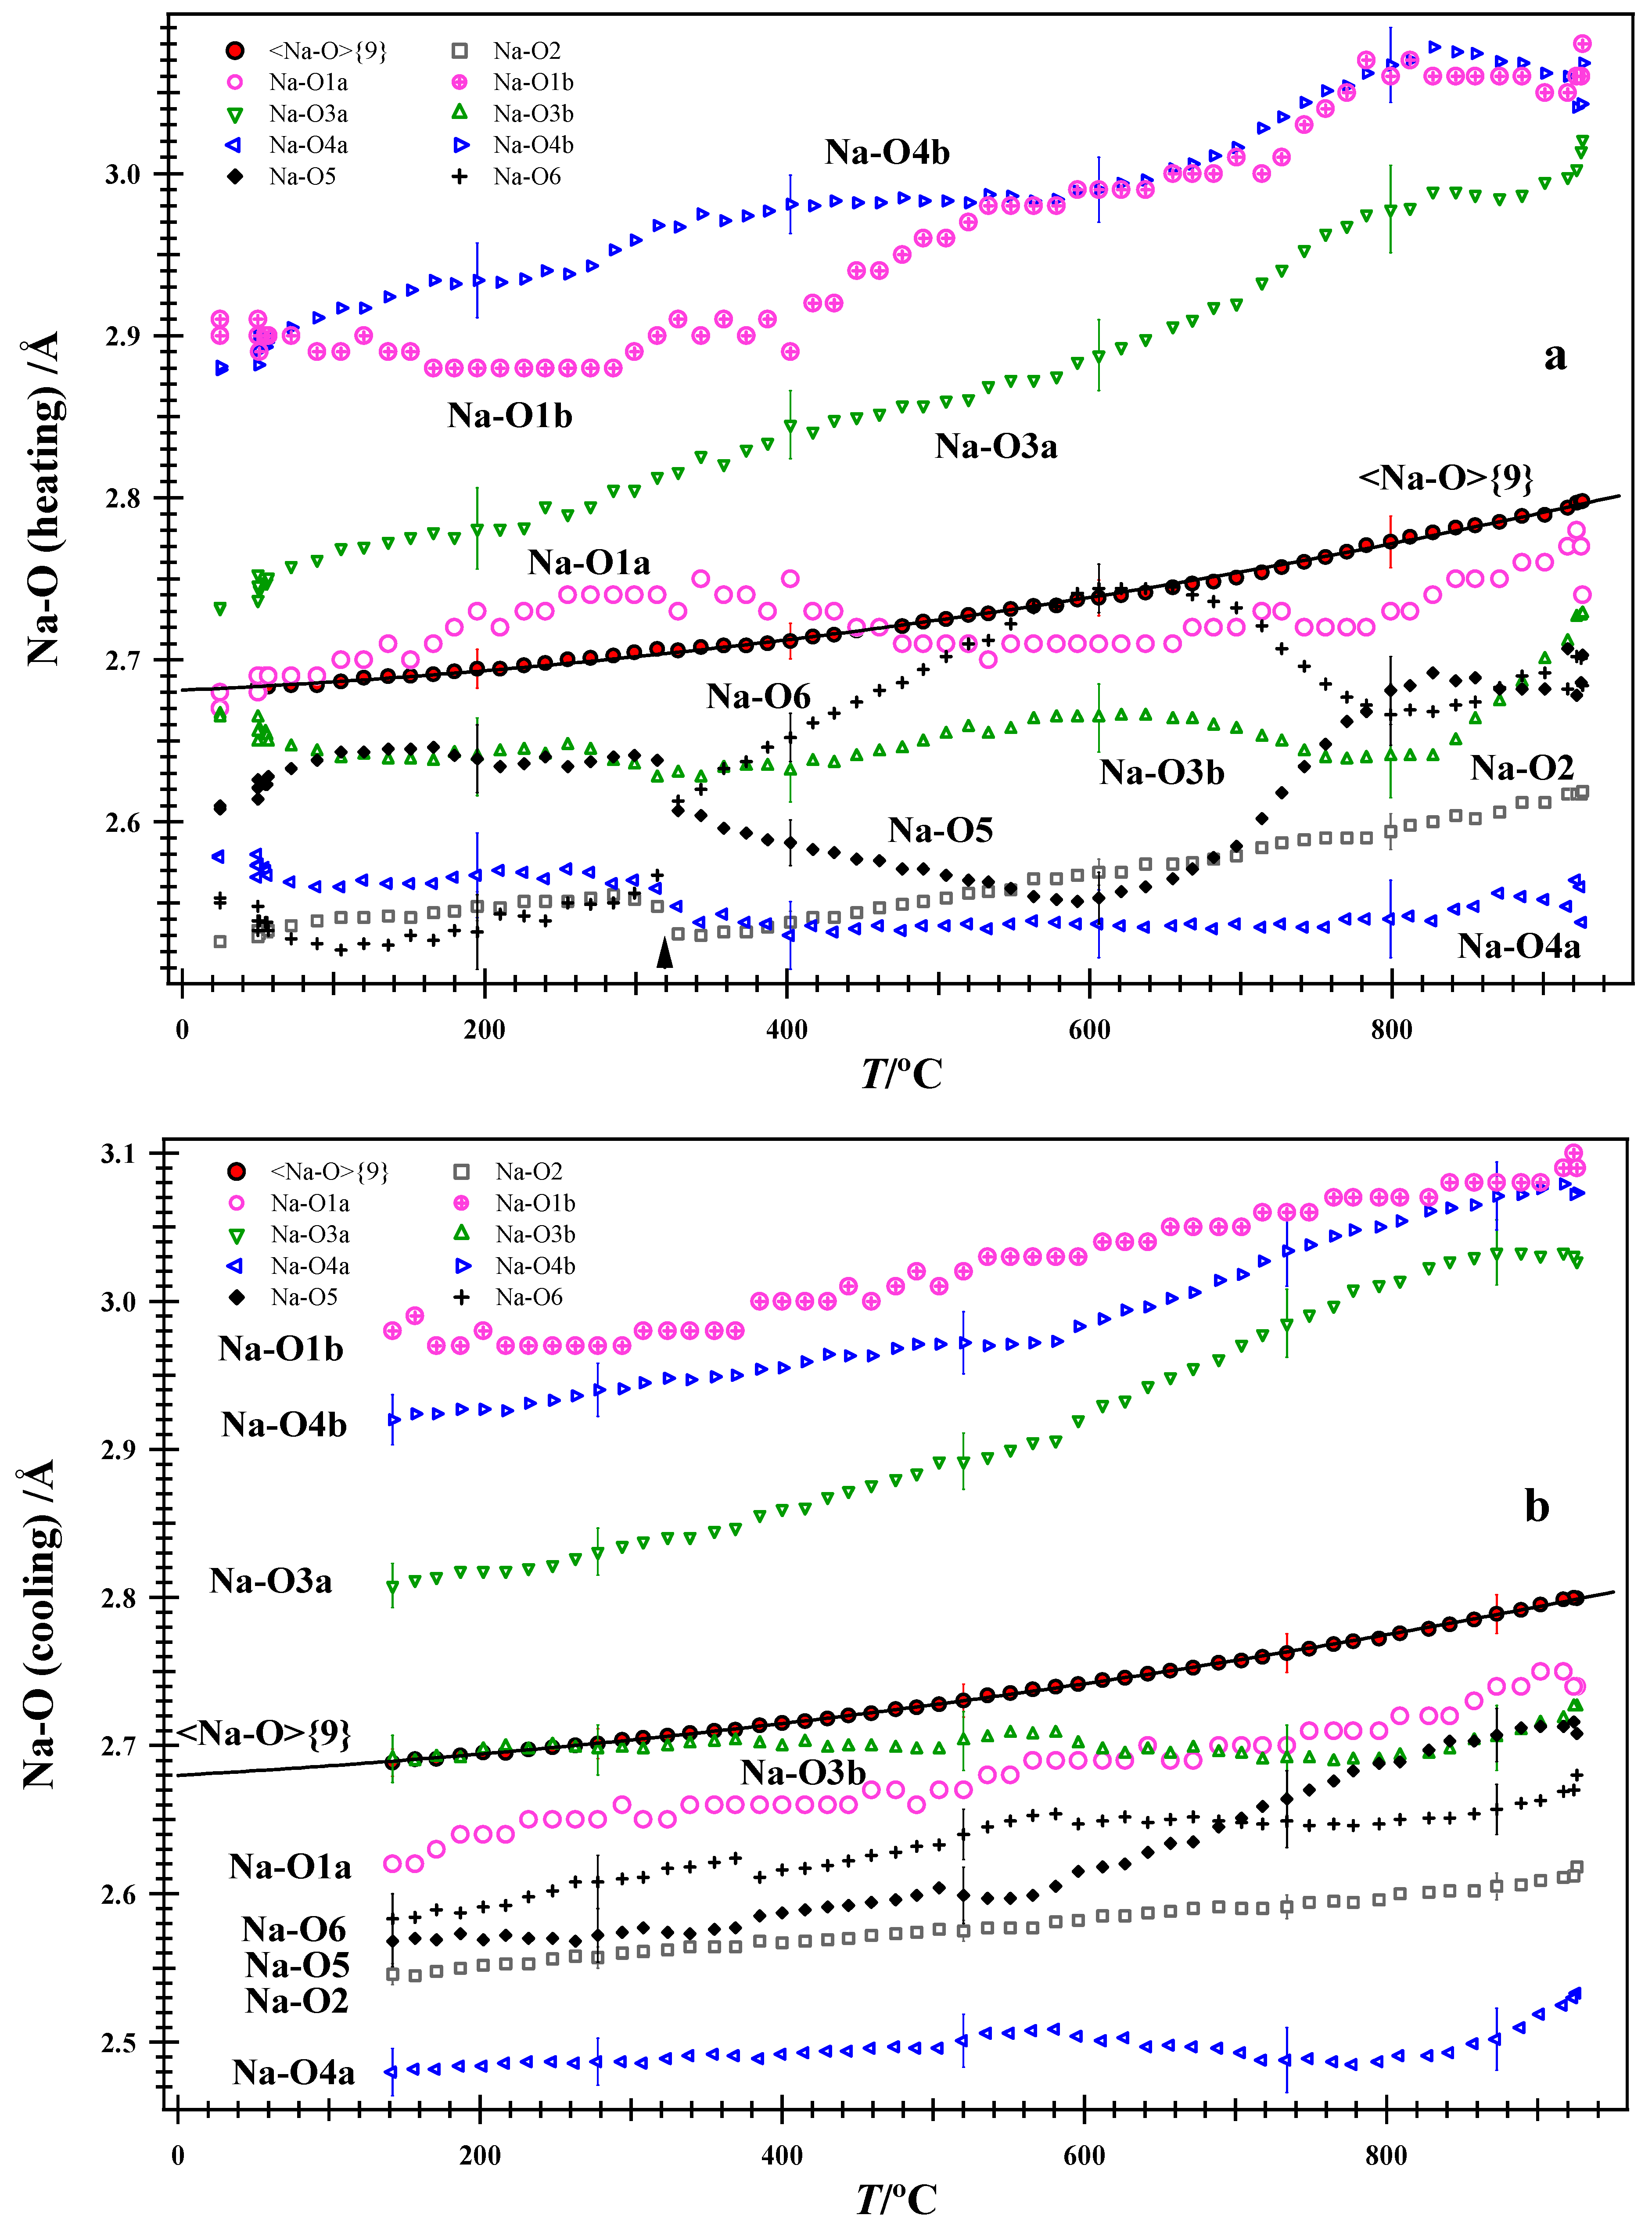
At room T, the average <K-O>{9} and <Na-O>{9} distances obtained from IP and HRPXRD data are similar, even though the Al and Si atom coordinates were interchanged (Table 2, Figure 5). The heating and cooling paths are slightly different for the average <K-O>{9} and <Na-O>{9} distances. Only a few error bars are shown for clarity. On heating, the average <K-O>{9} distance shows a break between 314 and 328 °C (hereafter, considered to be at 320 °C), which is less pronounced for the average <Na-O>{9}. This break corresponds to K–☐ disorder and gives rise to a transition, where some satellite reflections disappear at 320 °C on heating (Figure 3 and Figure 4). A thermodynamic model for this transition in the sample from Egan Chutes was presented [3]. On cooling, a less pronounced break is observed between 385 and 369 °C (hereafter, considered to be at 377 °C); these two breaks, where present, are indicated by arrowheads in the graphs. The K and Na atoms interact through the O2, O5, and O6 oxygen atoms, with which they share bonds (Figure 6 and Figure 7). Although the average <K-O>{9} and <Na-O>{9} distances show changes at the 320 °C transition, such changes are more pronounced in some individual bond distances and atom coordinates.
Figure 5.
(a) Variations in the average (a) <K-O>{9} and (b) <Na-O>{9} distances with T. In all figures below, for clarity, only a few error bars are displayed. At about 926 °C, the heating path jumps to the cooling path in (a). The arrowheads indicate breaks in structural parameters on heating at 320 °C and on cooling at 377 °C. HRPXRD data at room T from Antao and Hassan [1] are included.
Figure 6.
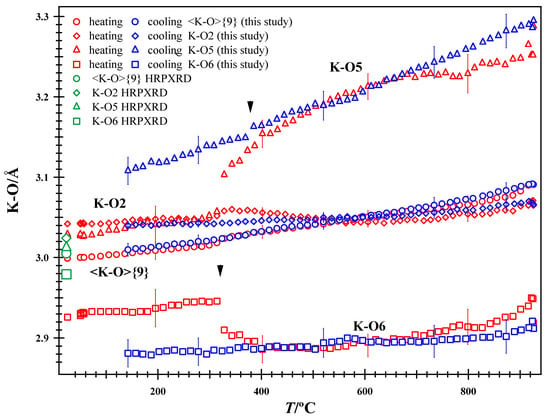
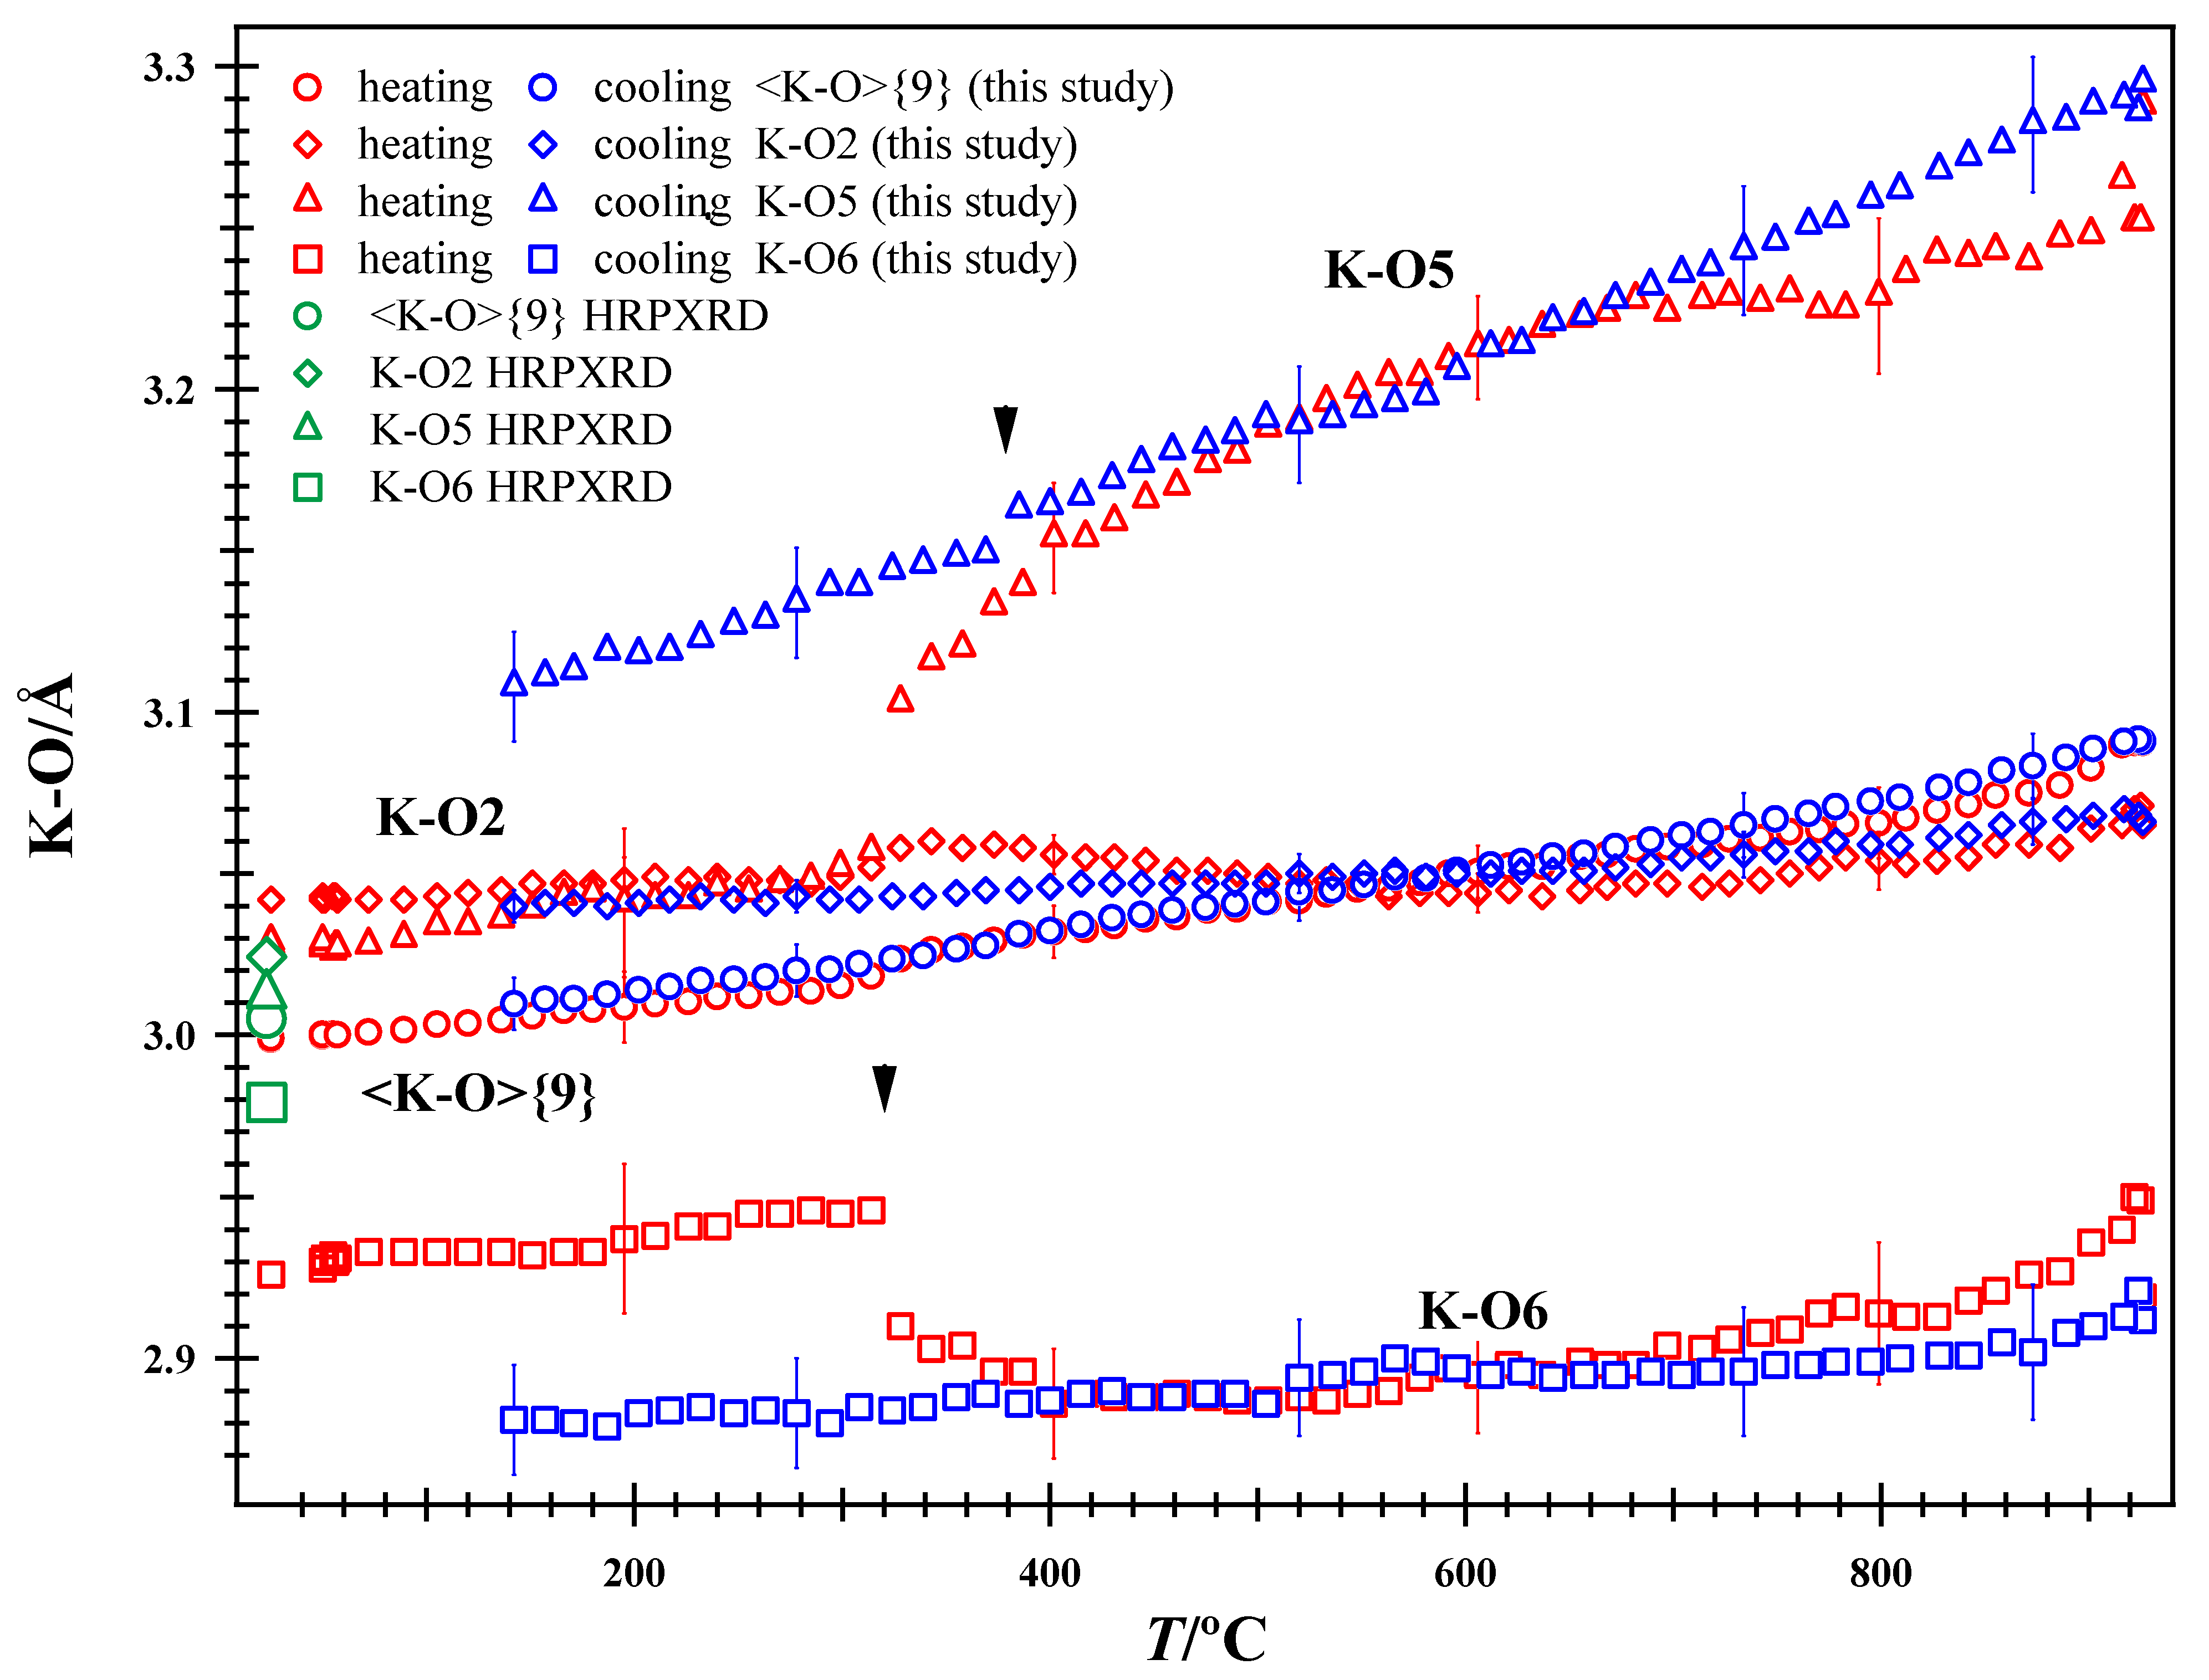
Variations in individual and average <K-O>{9} distances with T. Breaks occur for distances involving O5 and O6, but not the O2 atom (arrowheads at 320 °C on heating and 377 °C on cooling). On this scale, the average <K-O>{9} distances are nearly identical on heating and cooling. HRPXRD data at room T from Antao and Hassan [1] are included.
Figure 7.
Variations in individual and average <Na-O>{9} distances with T on (a) heating and (b) cooling. Breaks occur for some distances involving O2, O5, and O6 atoms on heating at 320 °C but not on cooling (arrowhead in (a)).
In general, the individual K-O bond distances vary more smoothly on cooling than on heating (Figure 6). The break at 320 °C on heating for K-O5 and K-O6 distances is quite clear (Figure 6). A less pronounced break occurs for the K-O5 distance at 377 °C on cooling, so K–☐ re-orders on cooling (Figure 3 and Figure 6).
The transition at 320 °C, which arises from K–☐ disorder, causes a strong response, so its effects are observed in many structural parameters. However, the K-O2 distance did not change significantly on heating nor on cooling at the 320 °C transition (Figure 6). The K-O2 distance was attributed as the main cause for the modulated structure of nepheline [9], which is not the case for the sample in this study. There are structural adjustments at 926 °C before cooling begins, and there is a jump from the heating to the cooling path for the K-O5 and K-O6 distances, which also occurs for several other distances and atom coordinates. The break at 320 °C may possibly arise from spontaneous strain but cannot be justified.
The variations in the individual Na-O distances show the transition at 320 °C on heating, but not on cooling (Figure 7). The Na-O1 distances do not show any unusual behavior. The changes observed in some individual Na-O distances are not reflected in the average <Na-O>{9} distance. In particular, changes occur in the Na-O2, Na-O5, and Na-O6 distances at 320 °C because the O2, O5, and O6 oxygen atoms are bonded to both Na and K atoms (Figure 7a).
4.2. Variations in Average <T-O>{4} Distance and Average <T-O-T>{6} Bridging Angle with T
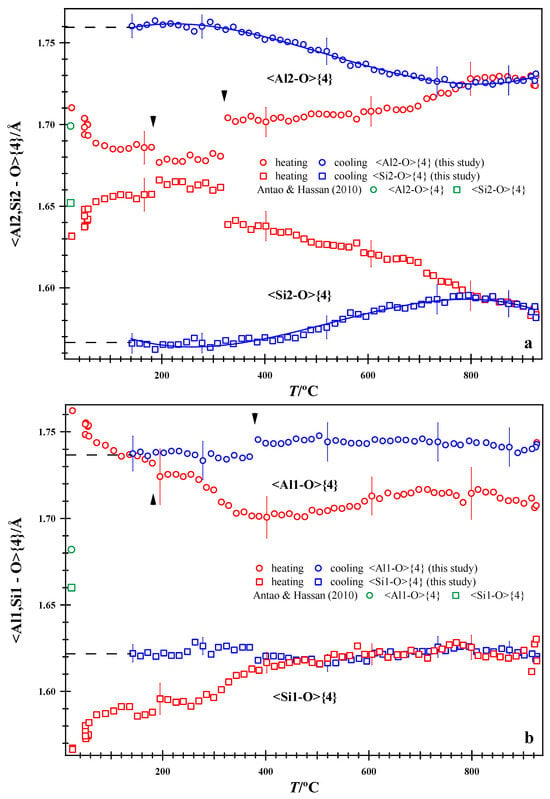
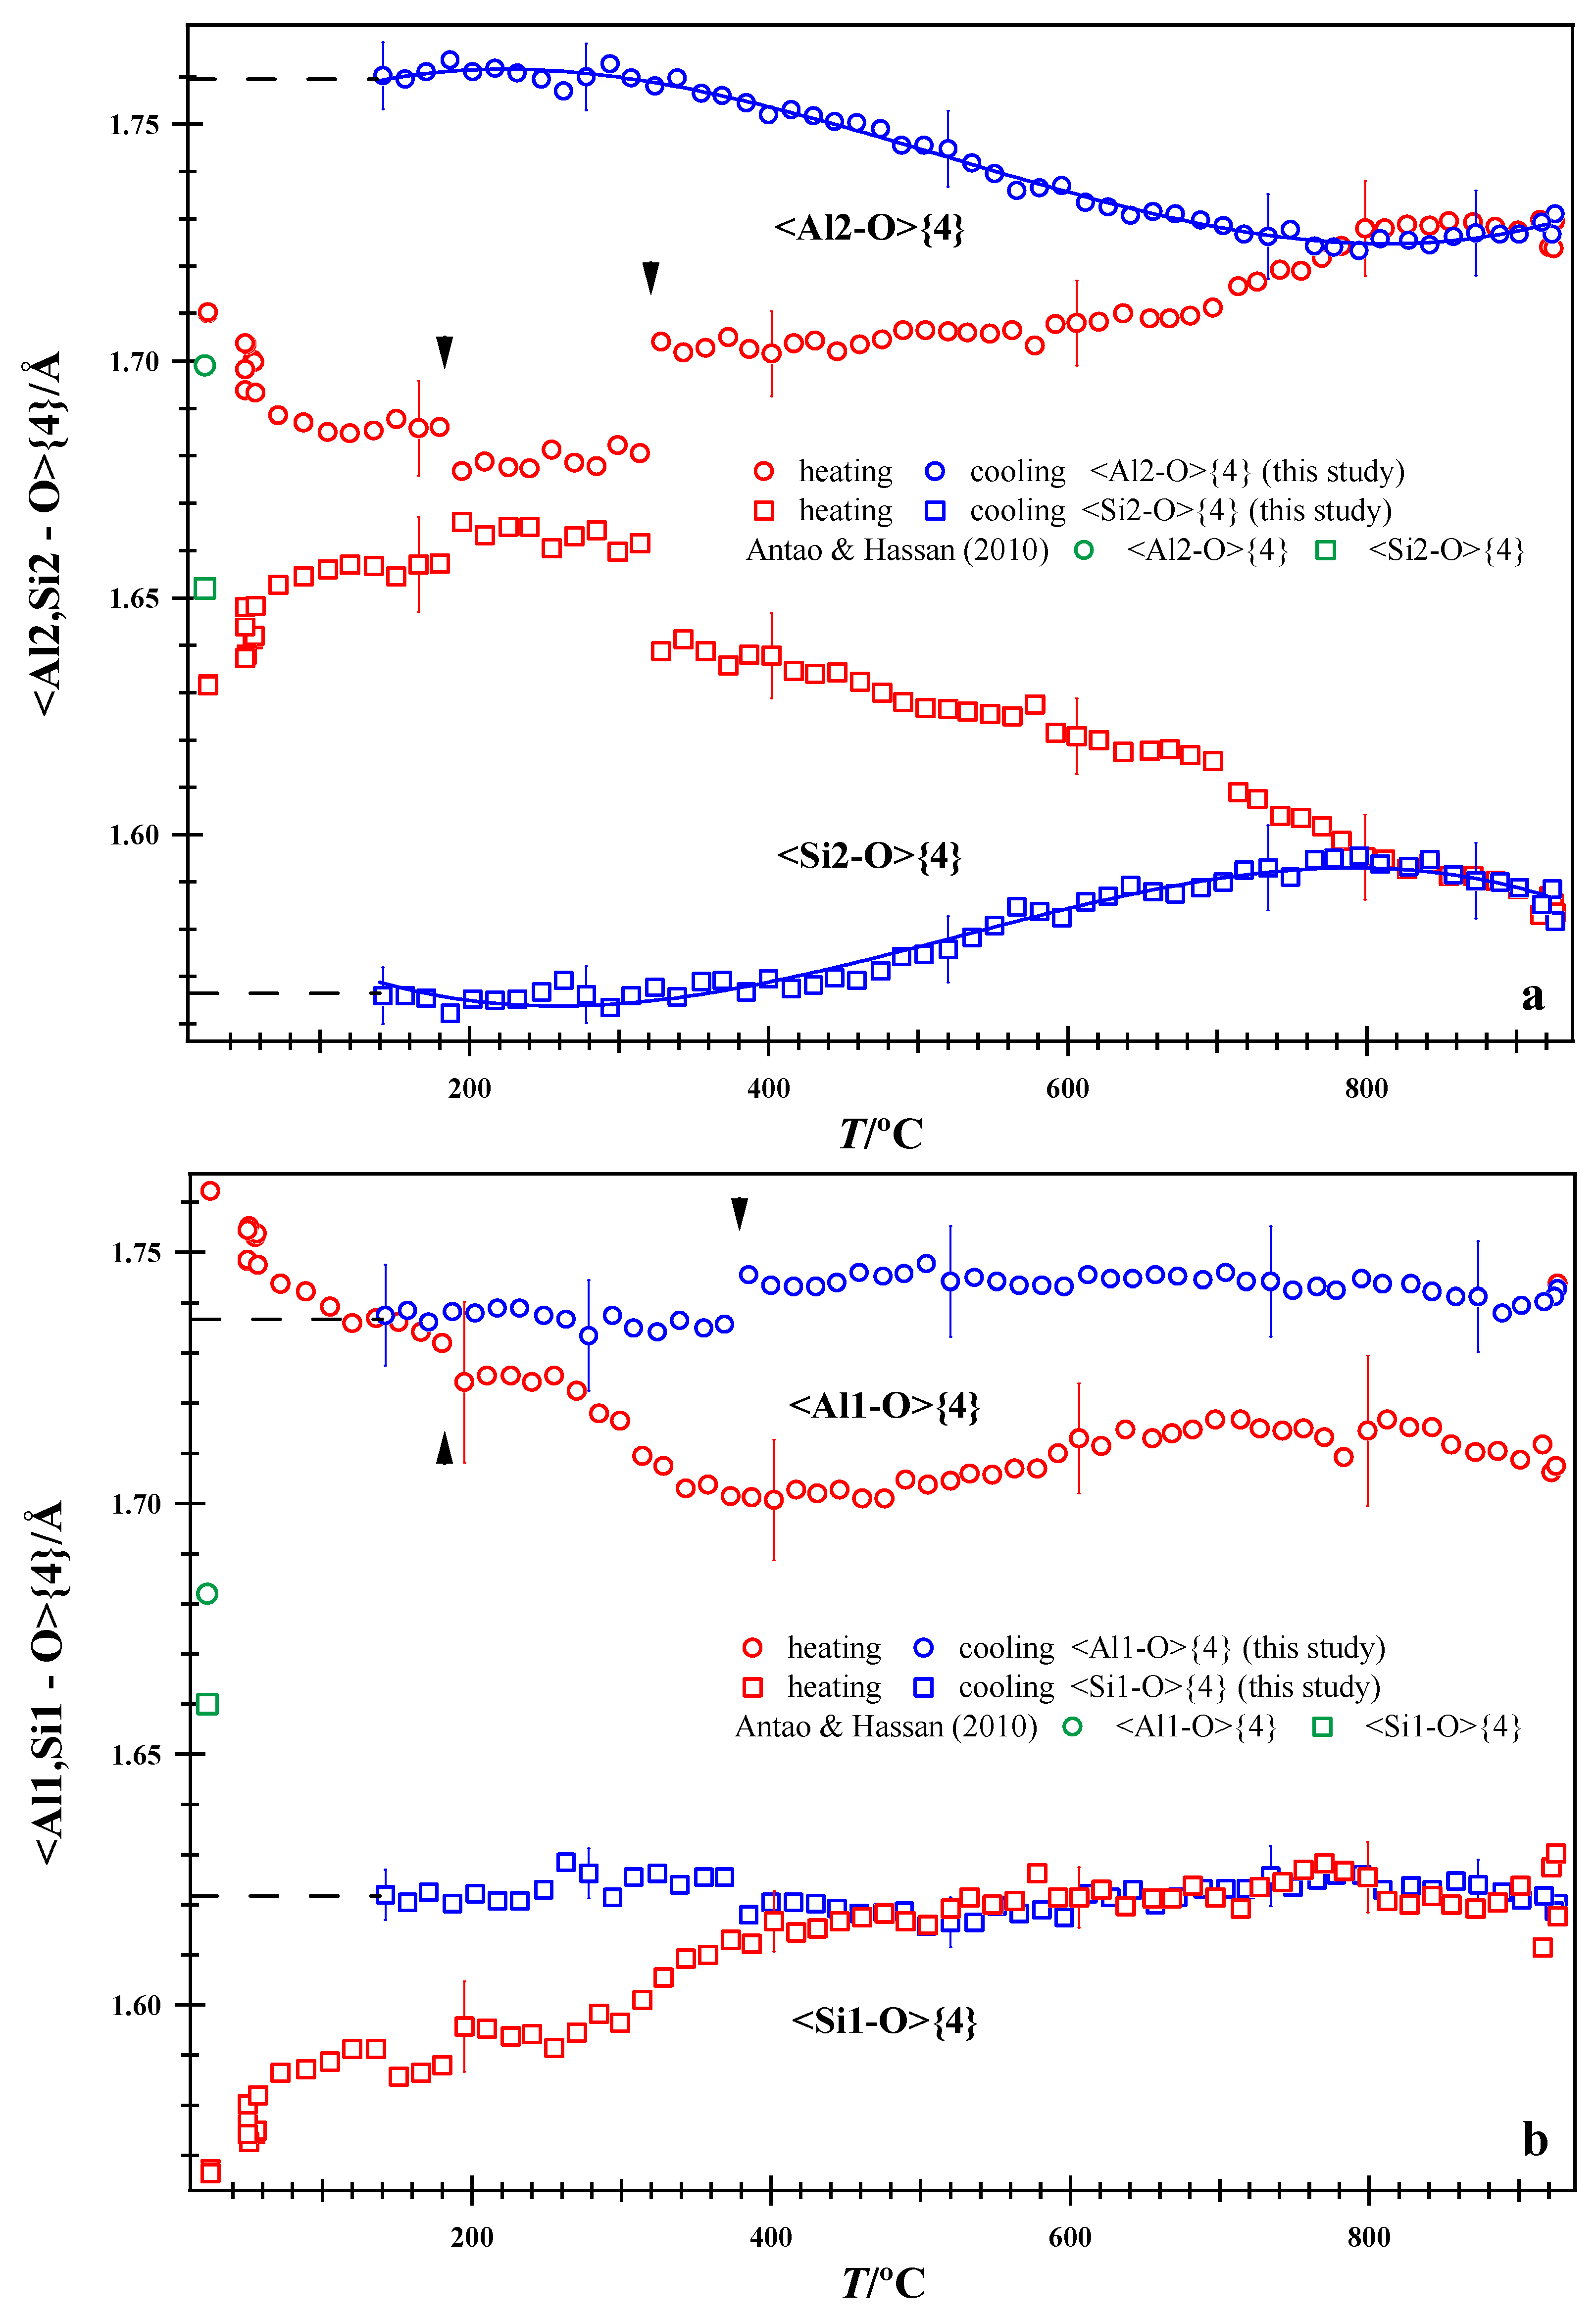
At room T, from the same batch of powdered sample, the average <Al,Si-O>{4} distances obtained from HRPXRD data are different from those obtained in this study using IP data because of the averaging of different domains by the XRD technique (Figure 8). The z coordinates for all the Al and Si sites had to be switched for the room T structure when compared to that obtained by HRPXRD (Table 2). On cooling from 926 °C, the extrapolated average <Al,Si-O>{4} distances at room T indicate complete Al-Si order (Figure 8). Initially, the average <Al,Si-O>{4} distances are inconsistent with complete Al-Si order, which is only achieved at 926 °C. Complete Al-Si order was quenched. Notice the jump from the heating to the cooling path for the average <Al1-O>{4} distance at 926 °C (Figure 8b).
Figure 8.
Variations in average tetrahedral distances with T. (a) <Al2,Si2-O>{4} and (b) <Al1,Si1-O>{4} distances. Arrowheads indicate breaks in structural parameters on heating at 180 and 320 °C, and on cooling at 377 °C. Dashed black lines are cooling data extrapolated to room T. HRPXRD data at room T from Antao and Hassan [1] are included.
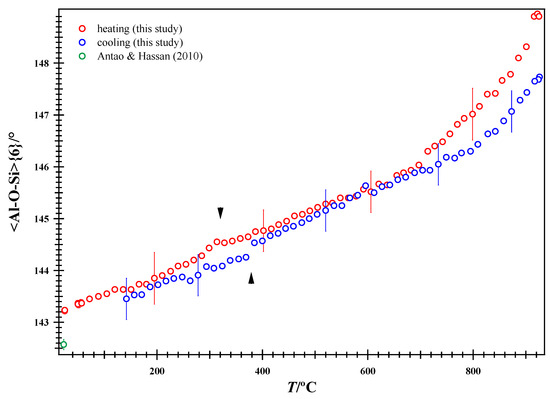
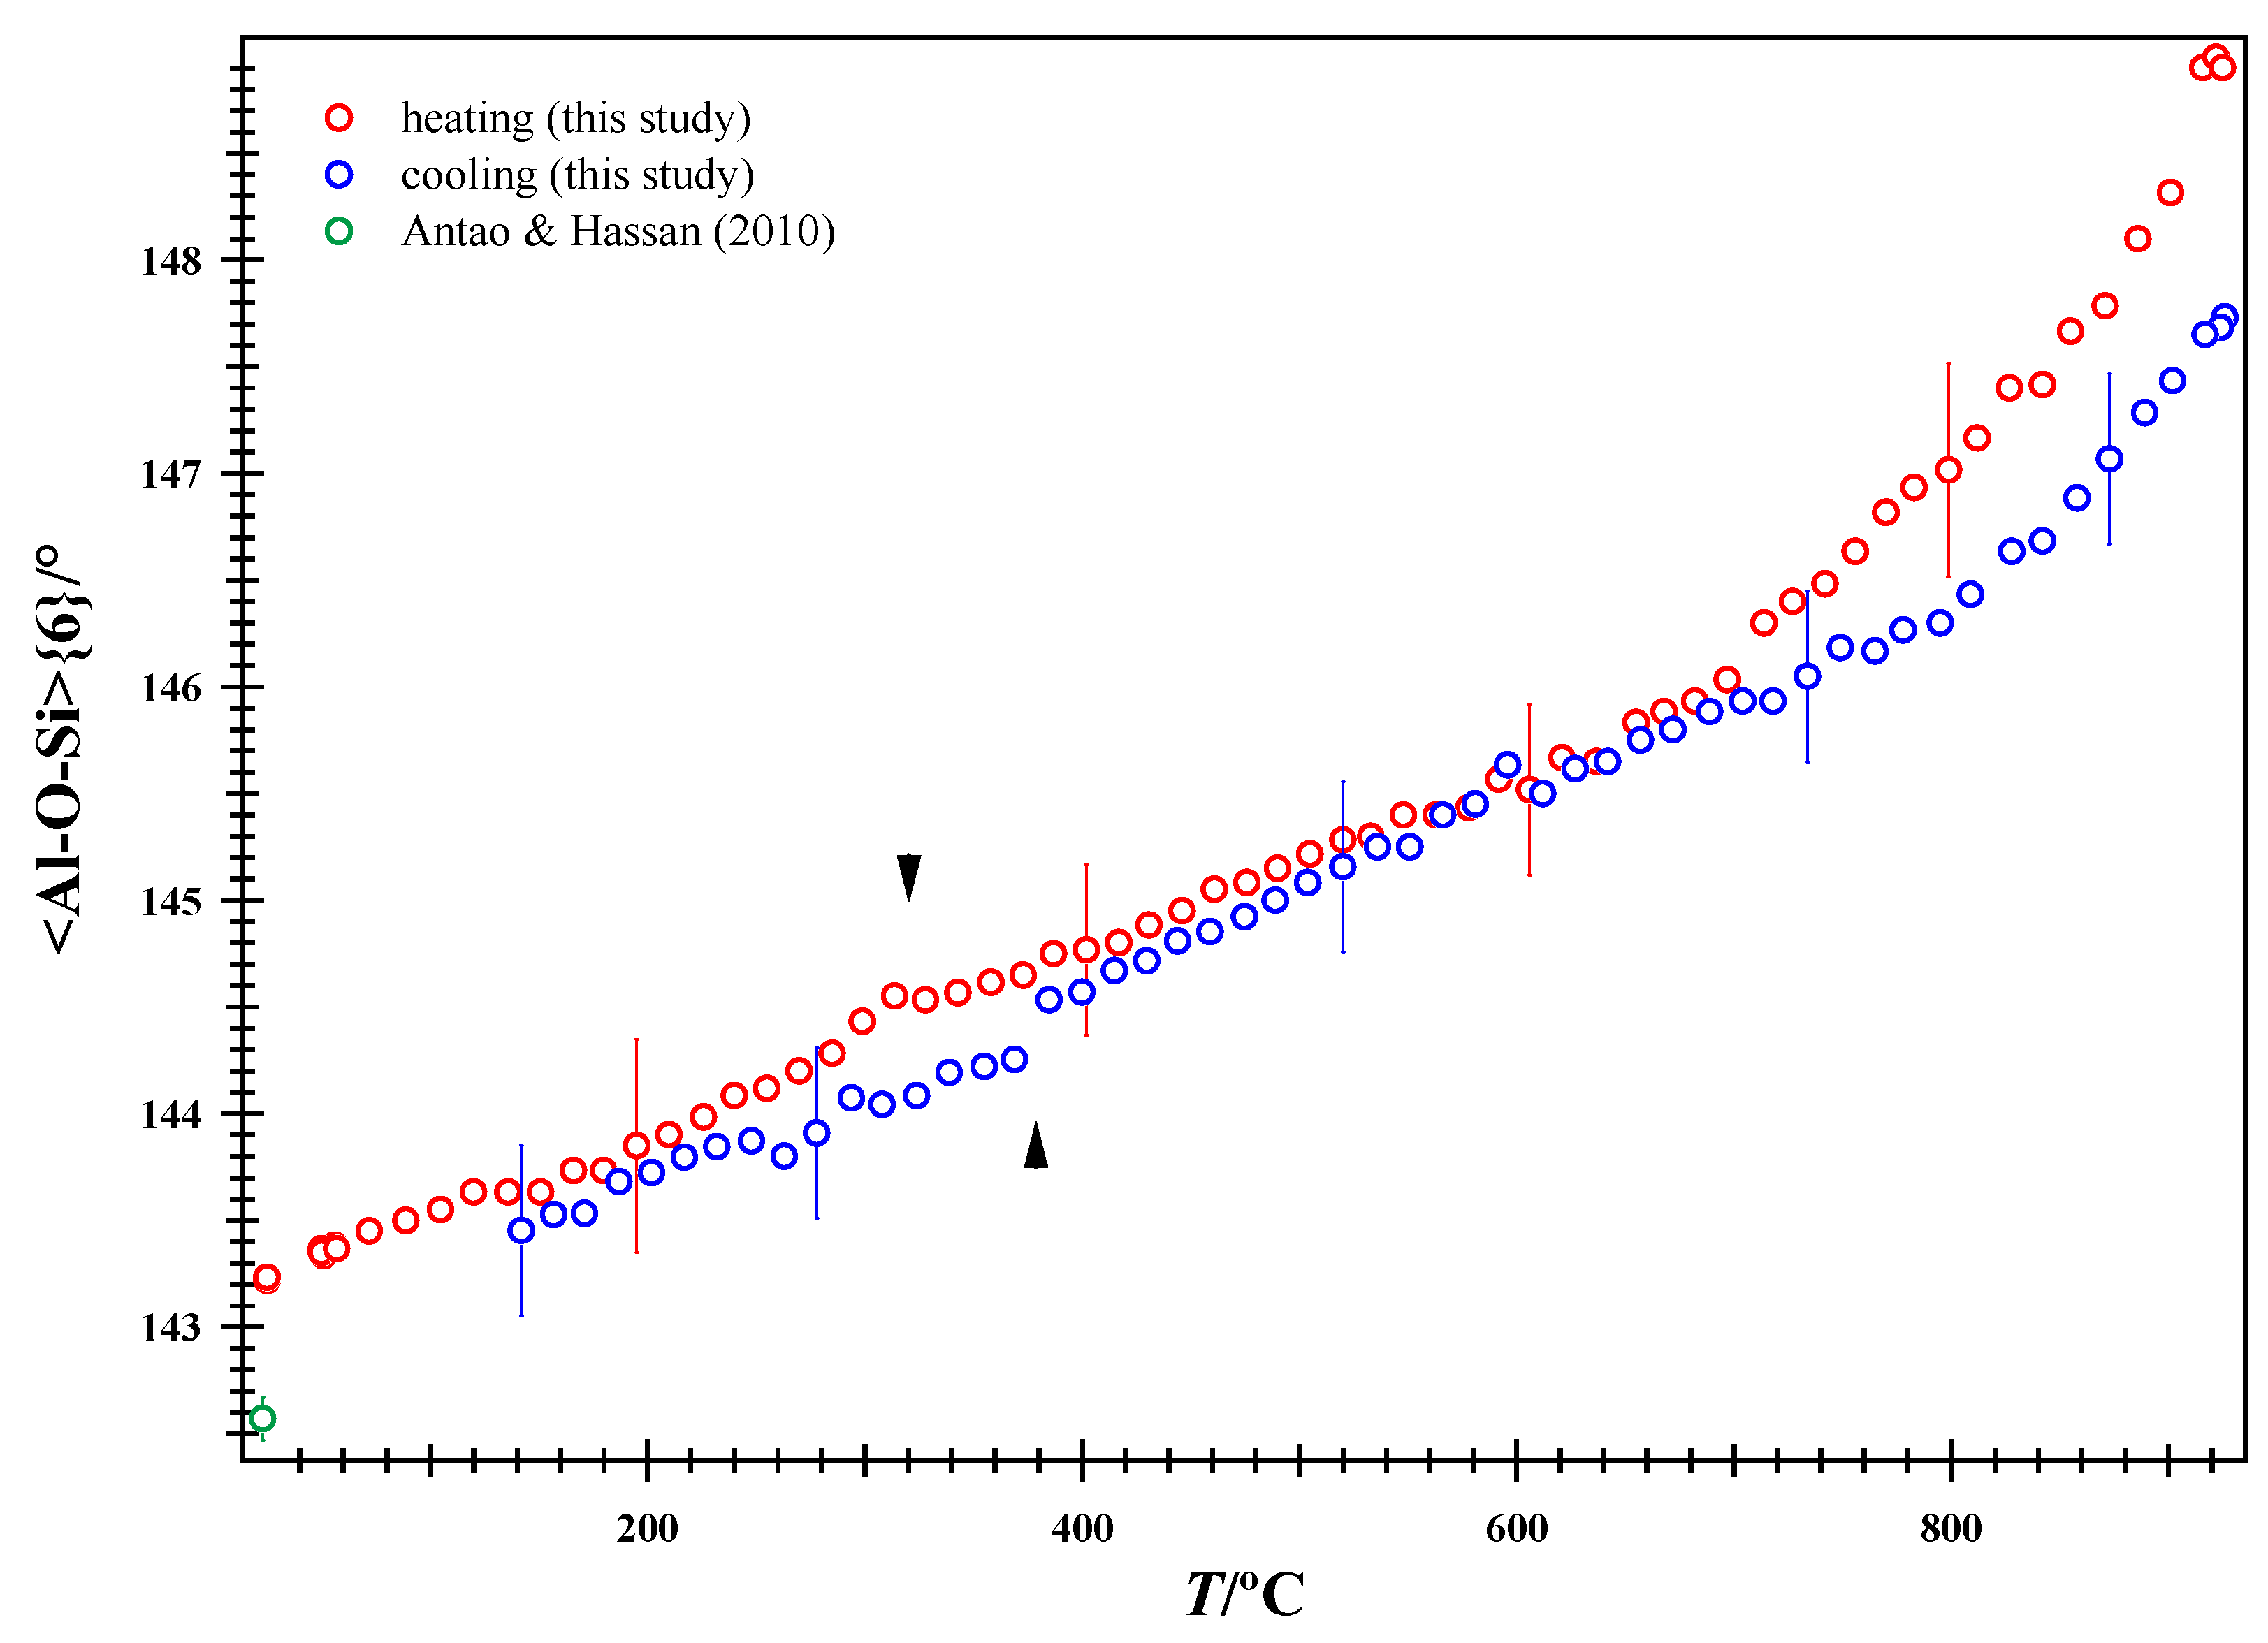
The effect of K–☐ disorder at 320 °C on heating and re-order at 377 °C on cooling are observed in the average <Al2,Si2-O>{4} and <Al1,Si1-O>{4} distances, respectively (Figure 9). In addition, a break is observed in the average <Al,SiO>{4} distance on heating at 180 °C (Figure 8). Al-Si order may be deduced from the average <Al,Si-O>{4} distances. According to Foreman and Peacor [13], the Al and Si atoms are ordered to 900 °C, despite the fact that their average <Al,Si-O>{4} distances were nearly equal at 900 °C. In this study, based on average <Al,Si-O>{4} distances, complete Al-Si order is possible only at about 926 °C.
Figure 9.
Variations in the average <Al-O-Si>{6} tetrahedral angles with T. The arrowheads indicate breaks at 320 °C (on heating) and 377 °C (on cooling). HRPXRD data at room T from Antao and Hassan [1] are included.
In another high-T study on a nepheline sample from Egan Chutes, complete Al-Si order was not evident at 900 °C, where the average <Al,Si-O>{4} distances were nearly equal, but complete Al-Si was obtained on cooling to room T [3]. In this study, the maximum temperature limit was 926 °C in order to observe Al-Si order. Based on average <Al,Si-O> distances, the present results indicate that complete Al-Si order is possible only after heating nepheline to 926 °C. This does not mean that Al-Si order is not high at room T in nepheline, as indicated by NMR experiments [43,44]. Based on Al-Si order, in the individual domains, the Al-Si order is high, but with the averaging of different domains with X-ray diffraction, especially with powder XRD, misleading Al-Si order is obtained from average <Al,Si-O>{4} distances in all nepheline structures at room T [1]. These average <Al,Si-O>{4} distances are not constant for any sample, and these depend on the different domains being averaged. Average <Al,Si-O>{4} distances at room T in all nepheline samples are affected by Al-Si order.
The cooling data for nepheline indicate that the complete Al-Si order is obtained at 926 °C. The time scale of the experiment was about 2 h for heating and 2 h for cooling. In scapolite, the average <T-O>{4} distances change in a smooth and regular manner compared to those in this study and in a study on a nepheline from Egan Chutes [3,45,46]. In scapolite Me75–Me90, ordering reflections based on Al-Si ordering were observed [47].
In general, the average <Al-O-Si>{6} angles show an increase with T and follow a slightly different path on cooling (Figure 9). The average <Al-O-Si>{6} angles indicate that the (Al,Si)O4 tetrahedra are rotated because of expansion of the (Na,K)-O bonds.
4.3. Variations in Isotropic Displacement Parameters, U, and Atom Coordinates with T
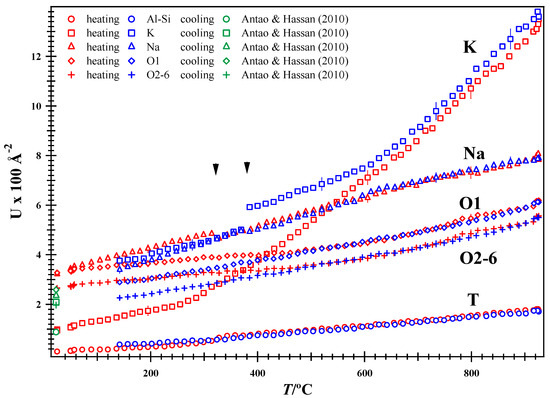
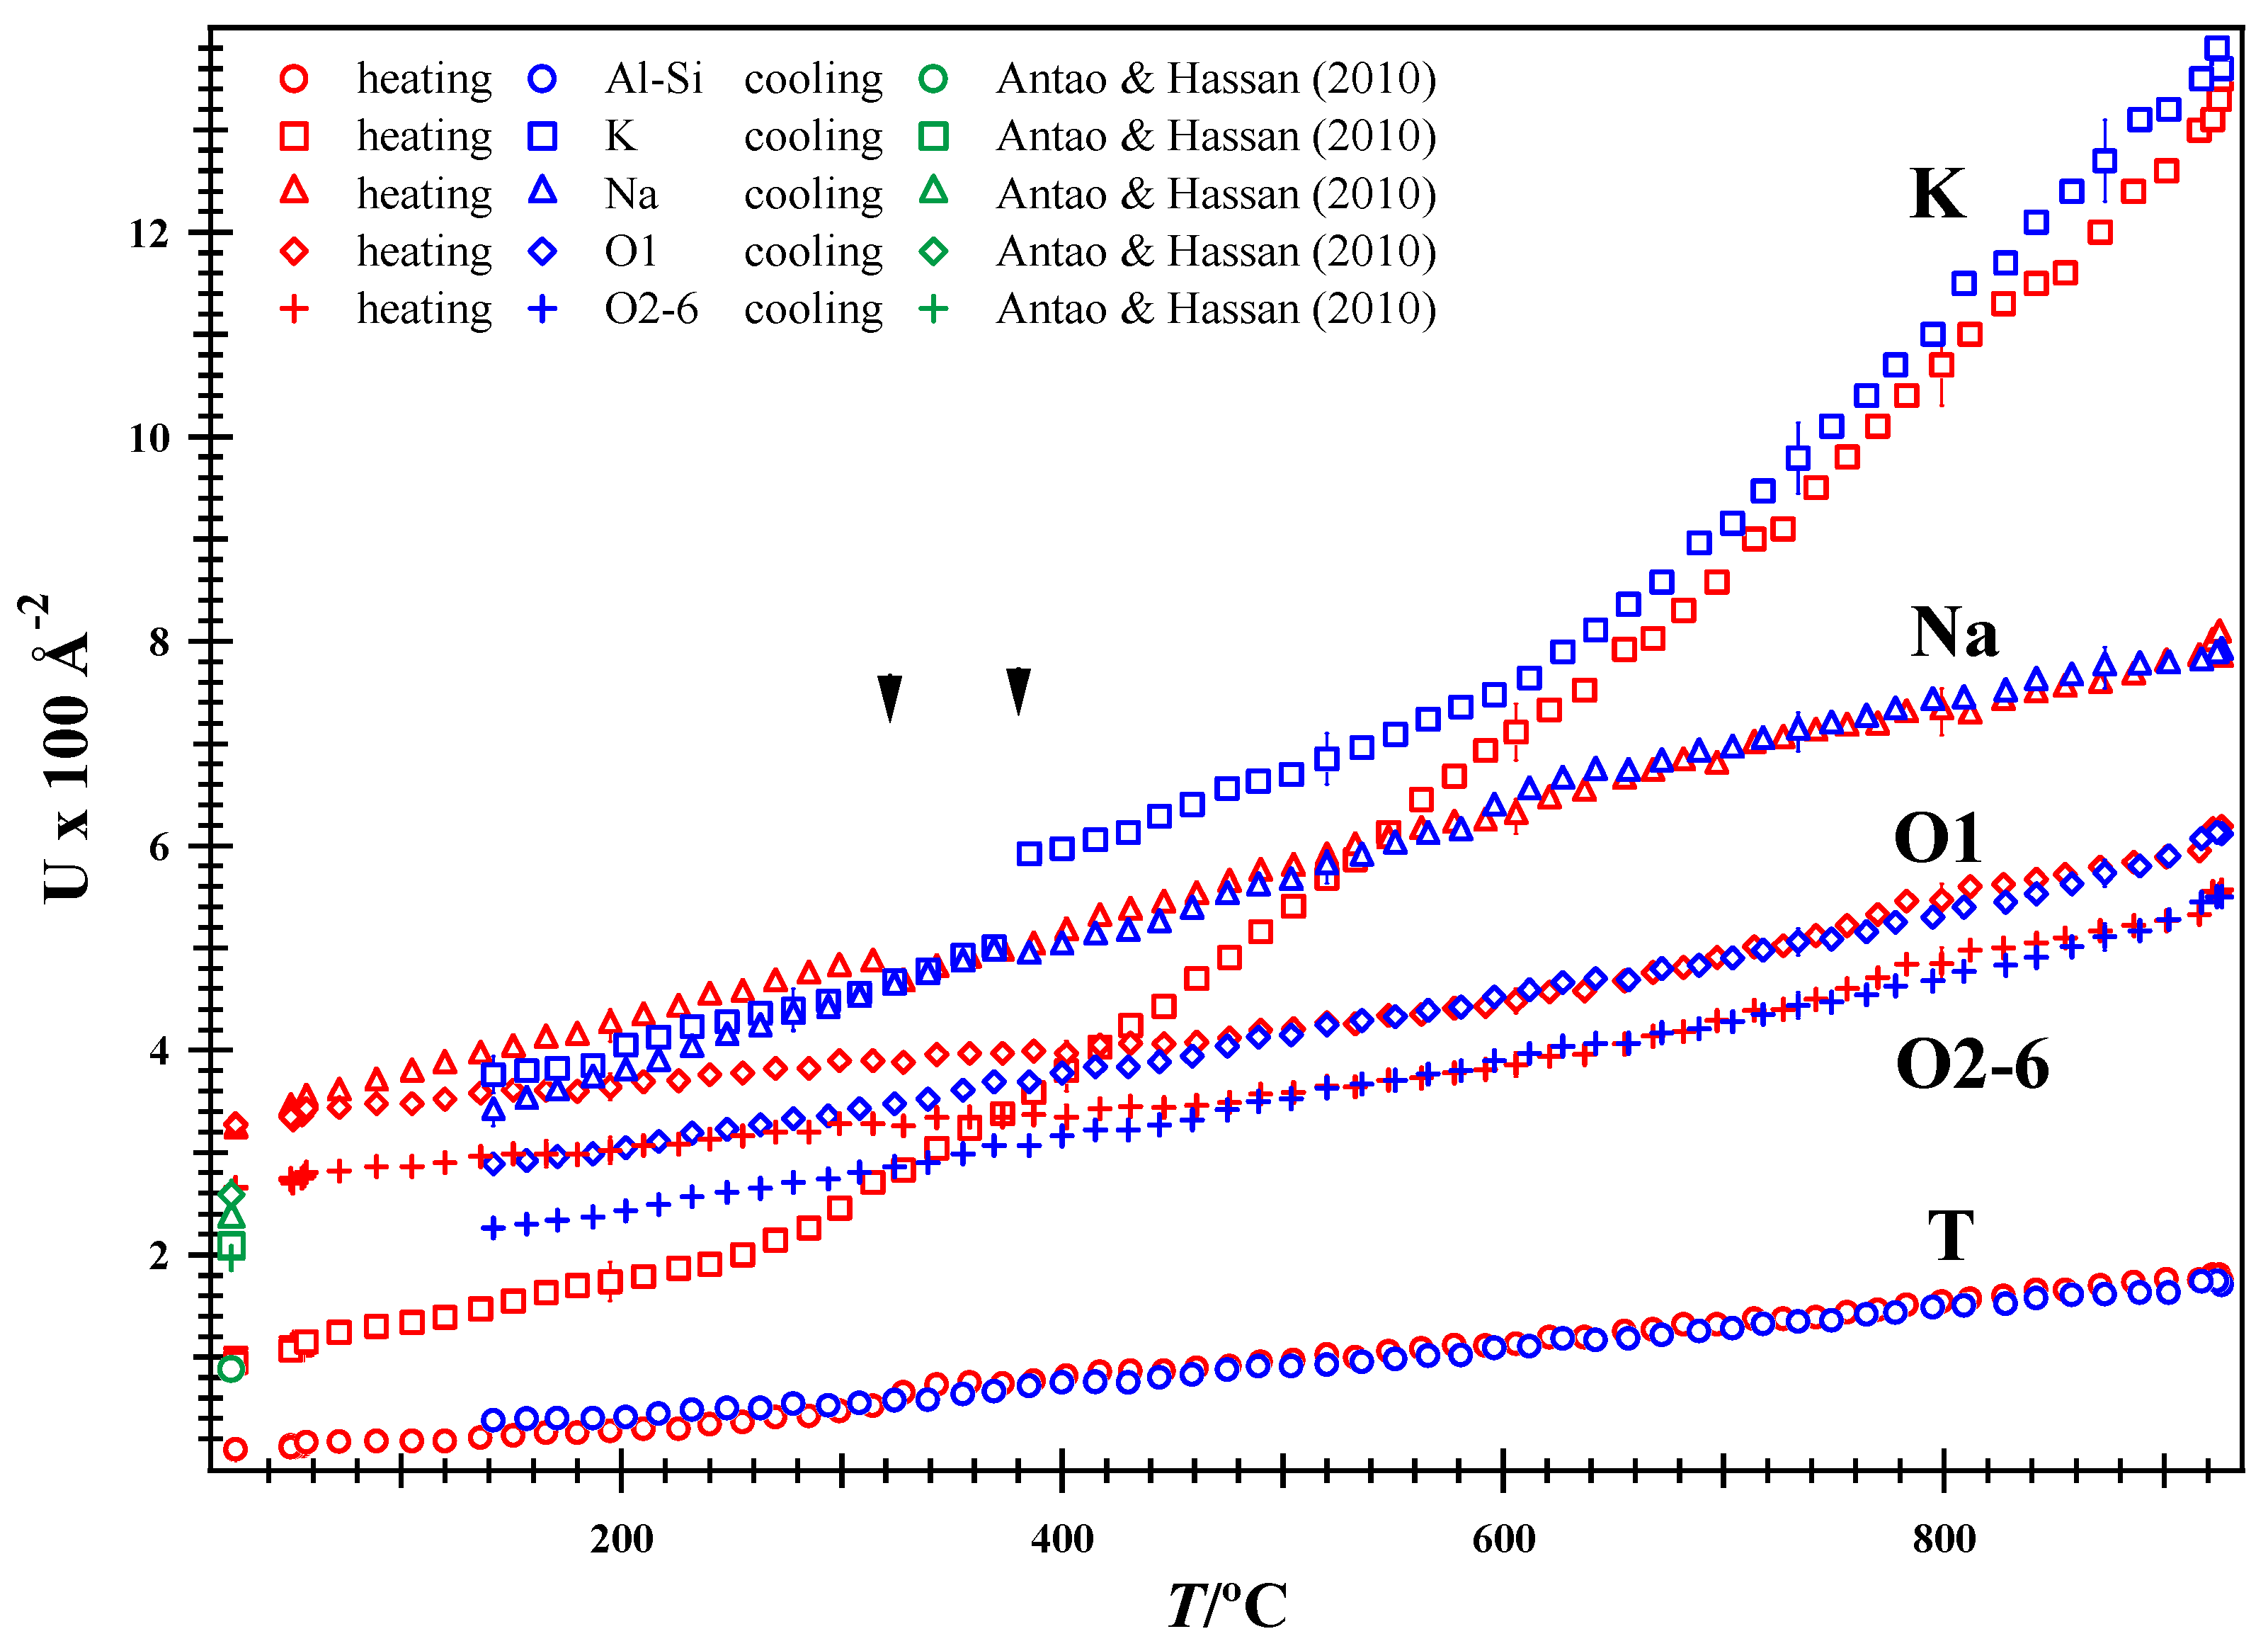
The U values vary smoothly, and are similar on heating and cooling, except for the K atoms, which remain large on cooling and follow different paths (Figure 10). Because the K atom is initially involved in K–☐ order, its initial U value is small and increases rapidly after disorder occurs at 320 °C. The U for Na site shows a minor break at 320 °C. As the K–☐ disorder remains upon cooling, the U value for the K atom is large, but a significant change occurs at 377 °C, where K–☐ orders again and the U value decreases (Figure 10). The other atoms, including the O1 atom, show no unusual U values.
Figure 10.
Variations in the isotropic displacement parameter, U, with T. The U for K atoms shows a break at 377 °C on cooling, whereas U for Na atoms shows a small break at 320 °C on heating (arrowheads). After K–☐ disorder at 320 °C on heating, the U for K increases rapidly on heating and decreases on cooling below 377 °C, where K–☐ ordering is recovered. HRPXRD data at room T from Antao and Hassan [1] are included.
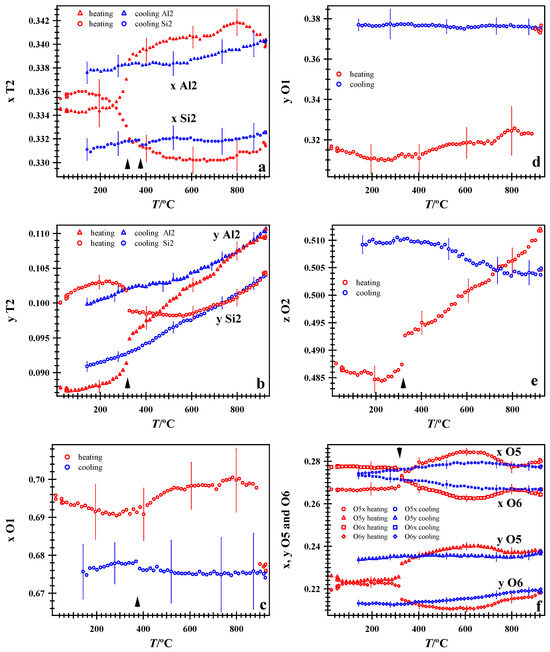
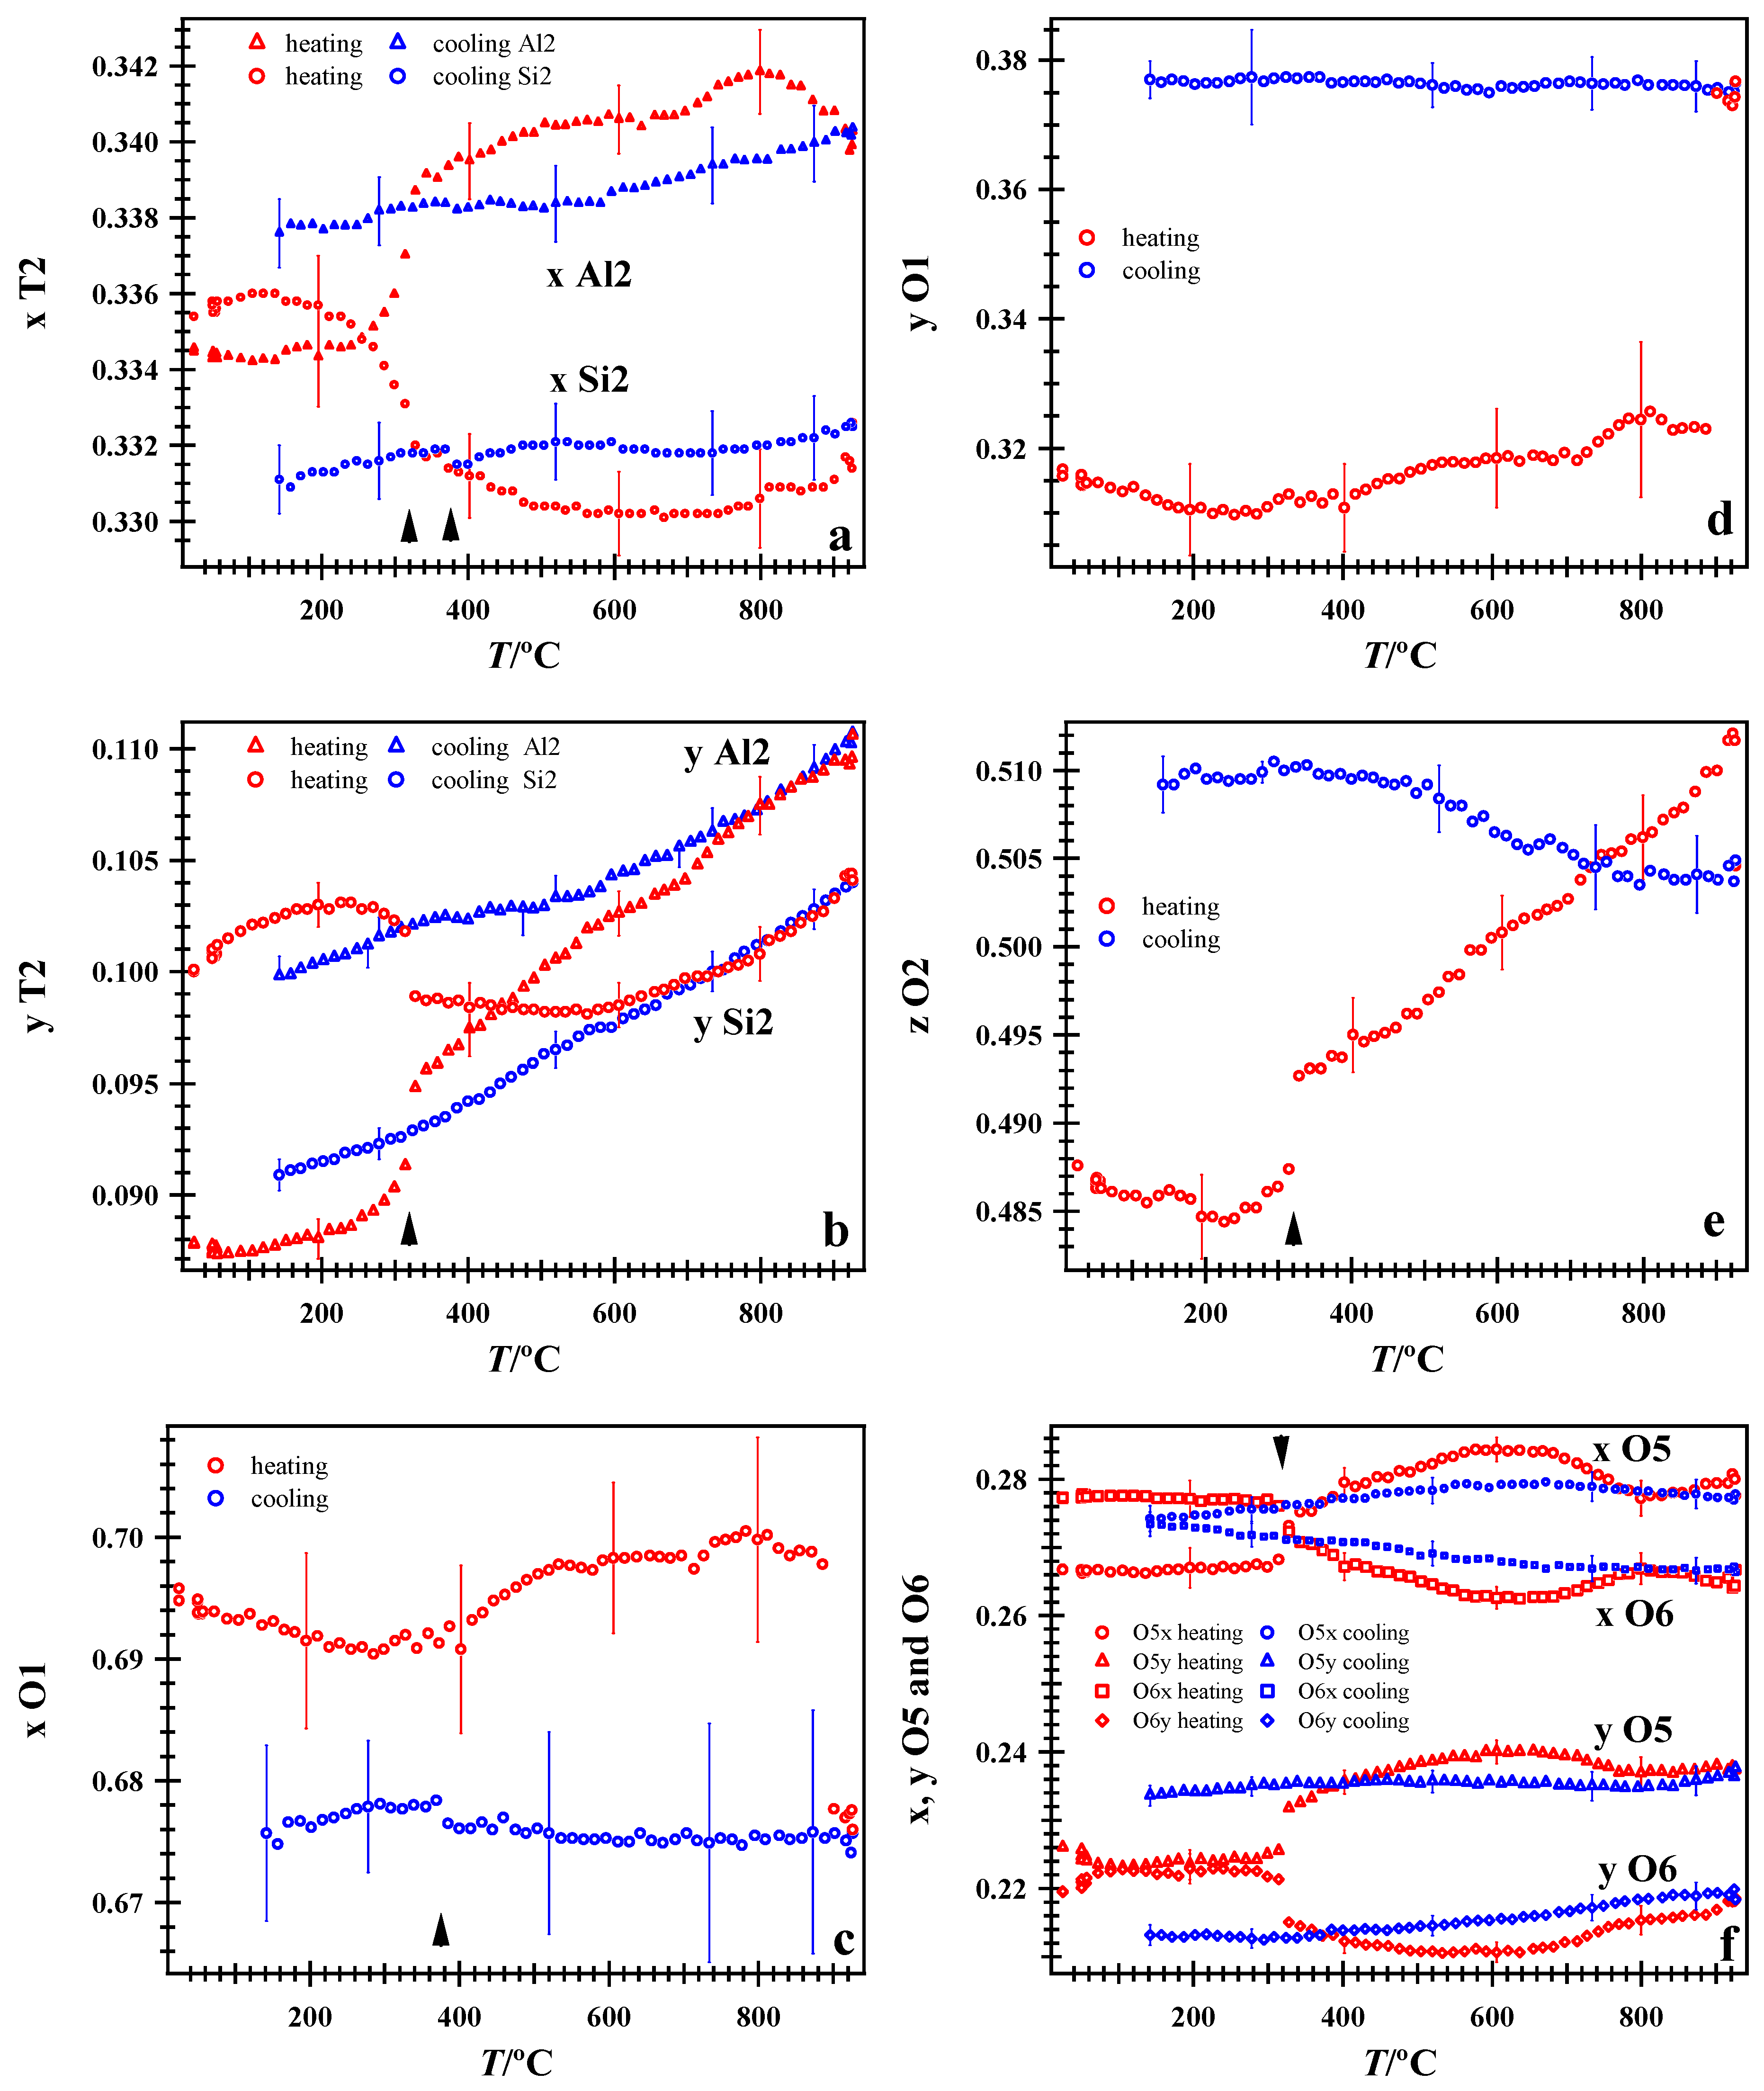
The atom coordinates in nepheline were plotted, and several coordinates show sharp changes at 320 and 926 °C on heating, and a minor break at 377 °C on cooling. The atom coordinates and bond distances are related, so these reflect similar features. However, changes in some atom coordinates are indicated because the breaks are pronounced at 320 (heating), 377 (cooling), and at 926 °C (Figure 11). These breaks are observed in the T2 sites (Figure 11a,b), O1 site (Figure 11c), O2 site (Figure 11e), and O5 and O6 sites (Figure 11f).
Figure 11.
Variations in some atom coordinates with T. (a) x for T2 site, (b) y for T2 site, (c) x for O1, (d) y for O1, (e) z for O2, and (f) x and y O5 and O6. Arrowheads point to breaks at 320 °C on heating (in a,b,e, and f) and 377 °C on cooling (in a,c). Notice the jump from the heating to the cooling path (especially in c–e).
Which atom triggers complete Al-Si order at 926 °C? At 900 °C, the x and y O1 coordinates start to switch from heating to cooling paths, whereas the coordinates for the other atoms switch paths at 926 °C (Figure 11). So, the O1 atom triggers the Al-Si order near 926 °C. This study clearly shows why Antao [3] and Foreman and Peacor [13] did not observe complete Al-Si order at 900 °C on heating: a T higher than 900 °C was needed (in this study, 926 °C was the maximum T).
A transition occurs at 320 °C in the nepheline sample from Nephton, as indicated by breaks in several bond distances and atom coordinates on heating. This transition corresponds to complete K–☐ disorder and coincides with the disappearance of some satellite reflections. On cooling to 377 °C, K–☐ re-orders and some satellite reflections re-appear. Complete Al-Si order can be deduced from average <Al,Si-O>{4} distances and can be quenched.
For a nepheline sample from Egan Chutes, ON, Canada, the satellite reflections, DSC results, and structural breaks indicate two transitions corresponding to (1) O1 positional disorder at 299 °C, and (2) K–☐ disorder at 486 °C [2,3]. Complete Al-Si order was not observed at 900 °C. On cooling from 926 °C to room T, complete Al-Si order was obtained. The positional disorder of the O1 atom gave rise to breaks in some unit cell parameters and bond distances [3]. In this study, features that indicate O1 positional disorder at T less than 300 °C are not observed, except for breaks in the average <Al,Si-O>{4} distances at 180 °C (Figure 8).
5. Concluding Remarks
In nepheline, the Al-Si atoms are partially ordered. Vacancies occur on the K site. In individual domains, the Al-Si order is complete, as indicated by NMR studies, but the averaging of domains by powder XRD gives variable average <Al,Si-O>{4} distances with misleading information on Al-Si order. The average <Al,Si-O>{4} distances indicate complete Al-Si order in nepheline. Different satellite reflections arise from (1) positional disorder of the O1 atom, (2) K–☐ order, and (3) Al-Si order. In the sample from Egan Chutes, a displacive transformation occurs at 299 °C, and represents positional disorder of the O1 atom [3]. This feature was not observed in the present study. In this study, complete K–☐ disorder occurs at 320 °C on heating and re-orders at 377 °C on slow cooling (2 h from 926 to 25 °C), whereas in the sample from Egan Chutes K–☐ disorder occurs a 486 °C and does not re-order on rapid cooling (1/2 hr. from 900 to 26 °C). At 926 °C, complete Al-Si order is achieved in this study, based on average <Al,Si-O>{4} distances. This Al-Si order is quenchable.
Funding
This research was funded by an NSERC Discovery Grant to SMA, grant number 10013896.
Data Availability Statement
The original contributions presented in this study are included in the article. Further inquiries can be directed to the corresponding author.
Acknowledgments
The three anonymous reviewers are thanked for their comments, which helped to improve this manuscript. The XRD data were collected at beamline 1-BM, Advanced Photon Source (APS), Argonne National Laboratory (ANL). Use of the APS was supported by the U.S. Dept. of Energy, Office of Science, Office of Basic Energy Sciences, under Contract No. DE-AC02-06CH11357.
Conflicts of Interest
The author declares no conflicts of interest.
References
- Antao, S.M.; Hassan, I. Nepheline: Structure of three samples from the Bancroft area, Ontario, obtained using synchrotron high-resolution powder X-ray diffraction. Can. Mineral. 2010, 48, 69–80. [Google Scholar] [CrossRef] [Scilit]
- Hassan, I.; Antao, S.M.; Hersi, A.A. Single-crystal XRD, TEM, and thermal studies of the satellite reflections in nepheline. Can. Mineral. 2003, 41, 759–783. [Google Scholar] [CrossRef] [Scilit]
- Antao, S.M. The average structure of a fine-grained nepheline to 900 °C: Disorder of O1, Al-Si, and K-vacancy. Minerals 2025, 15, 972. [Google Scholar] [CrossRef] [Scilit]
- McConnell, J.D.C. Electron-diffraction study of subsidiary maxima of scattered intensity in nepheline. Miner. Mag 1962, 33, 114–125. [Google Scholar] [CrossRef] [Scilit]
- McConnell, J.D.C. Time-temperature study of the intensity of satellite reflections in nepheline. Am. Mineral. 1981, 66, 990–996. [Google Scholar]
- McConnell, J.D.C. Incommensurate structures. Philos. Trans. R. Soc. Lond. 1991, 334, 425–437. [Google Scholar] [CrossRef] [Scilit]
- Sahama, T.G. A complex form of natural nepheline form Iivaara, Finland. Am. Mineral. 1958, 43, 165–166. [Google Scholar]
- Sahama, T.G. Order-disorder in natural nepheline solid solutions. J. Petrol. 1962, 3, 65–81. [Google Scholar] [CrossRef] [Scilit]
- Angel, R.J.; Gatta, G.D.; Boffa Ballaran, T.; Carpenter, M.A. The mechanism of coupling in the modulated structure of nepheline. Can. Mineral. 2008, 46, 1465–1476. [Google Scholar] [CrossRef] [Scilit]
- Hayward, S.A.; Pryde, A.K.A.; De Dombal, R.F.; Carpenter, M.A.; Dove, M.T. Rigid unit modes in disordered nepheline: A study of a displacive incommensurate phase transition. Phys. Chem. Miner. 2000, 27, 285–290. [Google Scholar] [CrossRef] [Scilit]
- Parker, J.M. The domain structure of nepheline. Z. Krist. 1972, 136, 255–272. [Google Scholar] [CrossRef] [Scilit]
- Parker, J.M.; McConnell, J.D.C. Transformation behaviour in the mineral nepheline. Nature 1971, 234, 178–179. [Google Scholar] [CrossRef] [Scilit]
- Foreman, N.; Peacor, D.R. Refinement of the nepheline structure at several temperatures. Z. Krist. 1970, 132, 45–70. [Google Scholar] [CrossRef] [Scilit]
- Gatta, G.D.; Angel, R.J. Elastic behavior and pressure-induced structural evolution of nepheline: Implications for the nature of the modulated superstructure. Am. Mineral. 2007, 92, 1446–1455. [Google Scholar] [CrossRef] [Scilit]
- Antao, S.M.; Nicholls, J.W. Crystal chemistry of three volcanic K-rich nepheline samples from Oldoinyo Lengai, Tanzania and Mount Nyiragongo, Eastern Congo, Africa. Front. Earth Sci. 2018, 6, 155. [Google Scholar] [CrossRef] [Scilit]
- Sahama, T.G. Kalsilite in the lavas of Mt. Nyiragongo (Belgian Congo). J. Petrol. 1960, 1, 146–171. [Google Scholar] [CrossRef] [Scilit]
- Antao, S.M.; Mohib, S.; Zaman, M.; Marr, R.A. Ti-rich andradites: Chemistry, structure, multi-phases, optical anisotropy, and oscillatory zoning. Can. Mineral. 2015, 53, 133–158. [Google Scholar] [CrossRef] [Scilit]
- Buerger, M.J.; Klein, G.E.; Donnay, G. Determination of the crystal structure of nepheline. Am. Mineral. 1954, 39, 805–818. [Google Scholar]
- Dollase, W.A. Least-squares refinement of the structure of a plutonic nepheline. Z. Krist. 1970, 132, 27–44. [Google Scholar] [CrossRef] [Scilit]
- Dollase, W.A.; Peacor, D.R. Si-Al Ordering in Nephelines. Contrib. Mineral. Petrol. 1971, 30, 129–134. [Google Scholar] [CrossRef] [Scilit]
- Dollase, W.A.; Thomas, W.M. The crystal chemistry of silica-rich, alkali-deficient nepheline. Contrib. Mineral. Petrol. 1978, 66, 311–318. [Google Scholar] [CrossRef] [Scilit]
- Gregorkiewitz, M. Crystal structure and Al/Si-ordering of a synthetic nepheline. Bull. Minéral. 1984, 107, 499–509. [Google Scholar] [CrossRef] [Scilit]
- Simmons, W.B.; Peacor, D.R. Refinement of the crystal structure of a volcanic nepheline. Am. Mineral. 1972, 57, 1711–1719. [Google Scholar]
- Tait, K.T.; Sokolova, E.; Hawthorne, F.C.; Khomyakov, A.P. The crystal chemistry of nepheline. Can. Mineral. 2003, 41, 61–70. [Google Scholar] [CrossRef] [Scilit]
- Hahn, T.; Buerger, M.J. The detailed structure of nepheline, KNa3Al4Si4O16. Z. Krist. 1955, 106, 308–338. [Google Scholar] [CrossRef] [Scilit]
- Rastsvetaeva, R.K.; Aksenov, S.M.; Chukanov, N.V. Disordering of Al and Si in nepheline from Graulai (Germany). Dokl. Chem. 2010, 435, 339–342. [Google Scholar] [CrossRef] [Scilit]
- Balassone, G.; Kahlenberg, V.; Altomare, A.; Mormone, A.; Rizzi, R.; Saviano, M.; Mondillo, N. Nephelines from the Somma-Vesuvius volcanic complex (Southern Italy): Crystal-chemical, structural and genetic investigations. Mineral. Petrol. 2014, 108, 71–90. [Google Scholar] [CrossRef] [Scilit]
- Vulić, R.; Balić-Žunić, T.; Belmonte, L.J.; Kahlenberg, V. Crystal chemistry of nephelines from ijolites and nepheline-rich pegmatites: Influence of composition and genesis on the crystal structure investigated by X-ray diffraction. Mineral. Petrol. 2011, 101, 185–194. [Google Scholar] [CrossRef] [Scilit]
- Friese, K.; Grzechnik, A.; Petříćek, V.; Schönleber, A.; van Smaalen, S.; Morgenroth, W. Modulated structure of nepheline. Acta Crystallogr. 2011, B67, 18–29. [Google Scholar] [CrossRef] [Scilit] [PubMed]
- Mikhailova, J.A.; Aksenov, S.M.; Pakhomovsky, Y.A.; Moine, B.N.; Dusséaux, C.; Vaitieva, Y.A.; Voronin, M. Iron in Nepheline: Crystal Chemical Features and Petrological Applications. Minerals 2022, 12, 1257. [Google Scholar] [CrossRef] [Scilit]
- Hammond, R.P.; Barbier, J. Monoclinic and hexagonal nepheline structures of (Na¾K¼)AlGeO4. Acta Crystallogr. 1998, B54, 211–220. [Google Scholar] [CrossRef] [Scilit]
- Antao, S.M.; Hovis, G.L. Structural variations across the nepheline (NaAlSiO4)-kalsilite (KAlSiO4) series. Am. Mineral. 2021, 106, 801–811. [Google Scholar] [CrossRef] [Scilit]
- Akhmadiyeva, N.; Abdulvaliyev, R.; Gladyshev, S.; Kassymzhanova, A. Hydrochemical Method for the Production of Alumina from Nepheline Using Effective Calcium Reagents. Processes 2024, 12, 1355. [Google Scholar] [CrossRef] [Scilit]
- Bagani, M.; Balomenos, E.; Panias, D. Nepheline Syenite as an Alternative Source for Aluminum Production. Minerals 2021, 11, 734. [Google Scholar] [CrossRef] [Scilit]
- Klein, C.; Hurlbut, C.S.J. Manual of Mineralogy, 21st ed.; John Wiley: New York, NY, USA, 1993. [Google Scholar]
- Nesse, W.D. Introduction to Mineralogy, 2nd ed.; Oxford University Press: New York, NY, USA, 2012. [Google Scholar]
- Zosin, A.P.; Priimak, T.I.; Koshkina, L.B.; Masloboev, V.A. Sorption-active materials based on an acid-nonresistant aluminosilicate nepheline, used for defluorination of industrial sewage. Russ. J. Appl. Chem. 2005, 78, 1077–1083. [Google Scholar] [CrossRef] [Scilit]
- Gurevich, B.I.; Kalinkina, E.V.; Kalinkin, A.M. Binding Properties of Mechanically Activated Nepheline Containing Mining Waste. Minerals 2020, 10, 48. [Google Scholar] [CrossRef] [Scilit]
- Hammersley, A.P.; Svensson, S.O.; Hanfland, M.; Fitch, A.N.; Hausermann, D. Two-dimensional detector software: From real detector to idealised image to two-theta scan. High Press. Res 1996, 14, 235–248. [Google Scholar] [CrossRef] [Scilit]
- Rietveld, H.M. A profile refinement method for nuclear and magnetic structures. J. Appl. Crystallogr. 1969, 2, 65–71. [Google Scholar] [CrossRef] [Scilit]
- Larson, A.C.; Von Dreele, R.B. Generalized Structure Analysis System; Report No. LAUR 86-748; Los Alamos National Laboratory: Los Alamos, NM, USA, 2000. [Google Scholar]
- Toby, B.H. EXPGUI, a graphical user interface for GSAS. J. Appl. Crystallogr. 2001, 34, 210–213. [Google Scholar] [CrossRef] [Scilit]
- Hovis, G.L.; Spearing, D.R.; Stebbins, J.F.; Roux, J.; Clare, A. X-ray powder diffraction and 23Na, 27Al, and 29Si MAS-NMR investigation of nepheline-kalsilite crystalline solutions. Am. Mineral. 1992, 77, 19–29. [Google Scholar]
- Stebbins, J.F.; Murdoch, J.B.; Carmichael, I.S.E.; Pines, A. Defects and short-range order in nepheline group minerals: A silicon-29 nuclear magnetic resonance study. Phys. Chem. Miner. 1986, 13, 371–381. [Google Scholar] [CrossRef] [Scilit]
- Antao, S.M.; Hassan, I. Unusual Al-Si ordering in calcic scapolite, Me79.6, with increasing temperature. Am. Mineral. 2008, 93, 1470–1477. [Google Scholar] [CrossRef] [Scilit]
- Antao, S.M.; Hassan, I. Increase in Al-Si and Na-Ca disorder with temperature in scapolite Me32.9. Can. Mineral. 2008, 46, 1577–1591. [Google Scholar] [CrossRef] [Scilit]
- Seto, Y.; Shimobayashi, N.; Miyake, A.; Kitamura, M. Composition and I4/m-P42/n phase transition in scapolite solid solutions. Am. Mineral. 2004, 89, 257–265. [Google Scholar] [CrossRef] [Scilit]

Disclaimer/Publisher’s Note: The statements, opinions and data contained in all publications are solely those of the individual author(s) and contributor(s) and not of MDPI and/or the editor(s). MDPI and/or the editor(s) disclaim responsibility for any injury to people or property resulting from any ideas, methods, instructions or products referred to in the content. |
© 2026 by the author. Licensee MDPI, Basel, Switzerland. This article is an open access article distributed under the terms and conditions of the Creative Commons Attribution (CC BY) license.