Article

Estimation of Uniaxial Compressive Strength of the Limestones from Istria (Croatia) Based on Visual Sample Characterization


1
Faculty of Mining, Geology and Petroleum Engineering, University of Zagreb, 10000 Zagreb, Croatia
2
Croatian Geological Survey, Sachsova 2, 10000 Zagreb, Croatia
*
Author to whom correspondence should be addressed.
Minerals 2026, 16(2), 156; https://doi.org/10.3390/min16020156
Submission received: 23 December 2025 / Revised: 19 January 2026 / Accepted: 28 January 2026 / Published: 29 January 2026
(This article belongs to the Special Issue Mineralogical and Mechanical Properties of Natural Building Stone)

Abstract

As uniaxial compressive strength (UCS) of rock material is influenced by petrographic characteristics, special emphasis is given to the visual assessment and determination of rock properties. Visual determination of properties such as lithology, fabric, defects and porosity were conducted on six petrographically different limestone varieties from Istria, Croatia. In addition to the macroscopic and microscopical determination of petrographic characteristics, measurements of ultrasound propagation velocity through samples were also conducted. According to the gained results of visual macro and micro assessment and ultrasound propagation, velocity estimation of uniaxial compressive strength was performed. Using predicted values of UCS, classification of samples according to different classifications was conducted where four out of six varieties of limestone were classified correctly. Based on the achieved results, the method has proven successful for rocks, which have uniaxial compressive strength over 100 MPa.

1. Introduction

Uniaxial compressive strength (UCS) is a fundamental mechanical parameter governing rock performance in engineering structures and natural stone application [1,2,3,4]. UCS depends on lithology, petrographic properties, textural and structural characteristics, grain size, fabric, weathering, defects and their distribution and other physical properties [5,6,7,8,9,10,11,12,13,14]. It can be determined in the laboratory according to the standard methods [15,16], but sample preparation is normally demanding and time-consuming. For that reason, point-load test, measurements of P–wave velocity propagation through samples, block punch index, Brazilian test, density and effective porosity, among many others, can be used for the UCS estimation [17,18,19,20,21,22,23,24,25,26,27,28,29,30,31].
At the field, the point-load test or Schmidt hammer test are sometimes used. These estimations are not precise, but the obtained results are preliminary information important for planning research works and initial engineering decisions.
However, visual strength estimations and classifications of rock samples before laboratory tests were rarely obtained. Previous research in carbonate rocks used the ANOVA statistical method to estimate uniaxial compressive strength and their optimal classes [32], named the lithology, fabric, defects, porosity (LFDP) method. A statistically significant model considered these four parameters and their mutual interactions. It showed that the ANOVA method is generally reliable for regional engineering geological estimations in carbonate rocks from Croatia, but more local applications should be further tested in detail. Uniaxial compressive strength can be estimated by artificial neural networks, linear regression methods [33], the artificial intelligence Gene Expression Programming model [23] and using the SSA-XGBoost Model [34,35].
Accordingly, the aim of this work is to apply visual assessment techniques to estimate relative uniaxial compressive strength directly in the field. Visual assessments were performed on six different varieties of carbonate rock samples from the Istria region in Croatia. Such data are frequently used in preliminary field investigations and provide valuable initial insight into the mechanical properties of rocks and materials, thereby supporting the planning of detailed investigations and engineering operations.

2. Materials and Methods

Analyses were performed in the Engineering geology laboratory of Hydrogeology and the Engineering Geology Department at the Croatian Geological Survey (Zagreb, Croatia) and at the Laboratory for Geological Analysis of Materials (LaGeMa) University of Zagreb Faculty of Mining, Geology and Petroleum Engineering. A total of 96 limestone samples were dimensioned from blocks of 30 × 30 × 30 cm from the following quarries in Istria: Kirmenjak Quarry (16 samples—dark variety; and 16 samples—bright variety); Kanfanar Quarry (16 samples); Selina Quarry (16 samples) and Valtura Quarry (16 samples—fiorito variety; and 16 samples—unito variety). Limestone samples were micropetrographically analyzed and classified according to classifications [36,37,38,39] for marine limestones. Several petrographic studies have also ben conducted on regional lithotypes, which have successfully described the characteristics of compact limestones, including Istrian limestones and comparable materials [40,41,42]. Thin sections (30 μm thick) were made from all samples. All samples were also treated with an Alizarin-red S during preparation of thin sections to easily distinguish carbonate mineralogies—i.e., calcite is stained red, and dolomite remains white after treatment. The micropetrographic analysis was performed on the Optika I3-1000 plain-polarizing petrographic microscope. Visual determination of rock strength and measurements of P–wave velocity propagation through the samples followed. The results obtained were compared and correlated, and classification of the rocks according to their strength was finally made.

2.1. Istrian Limestones

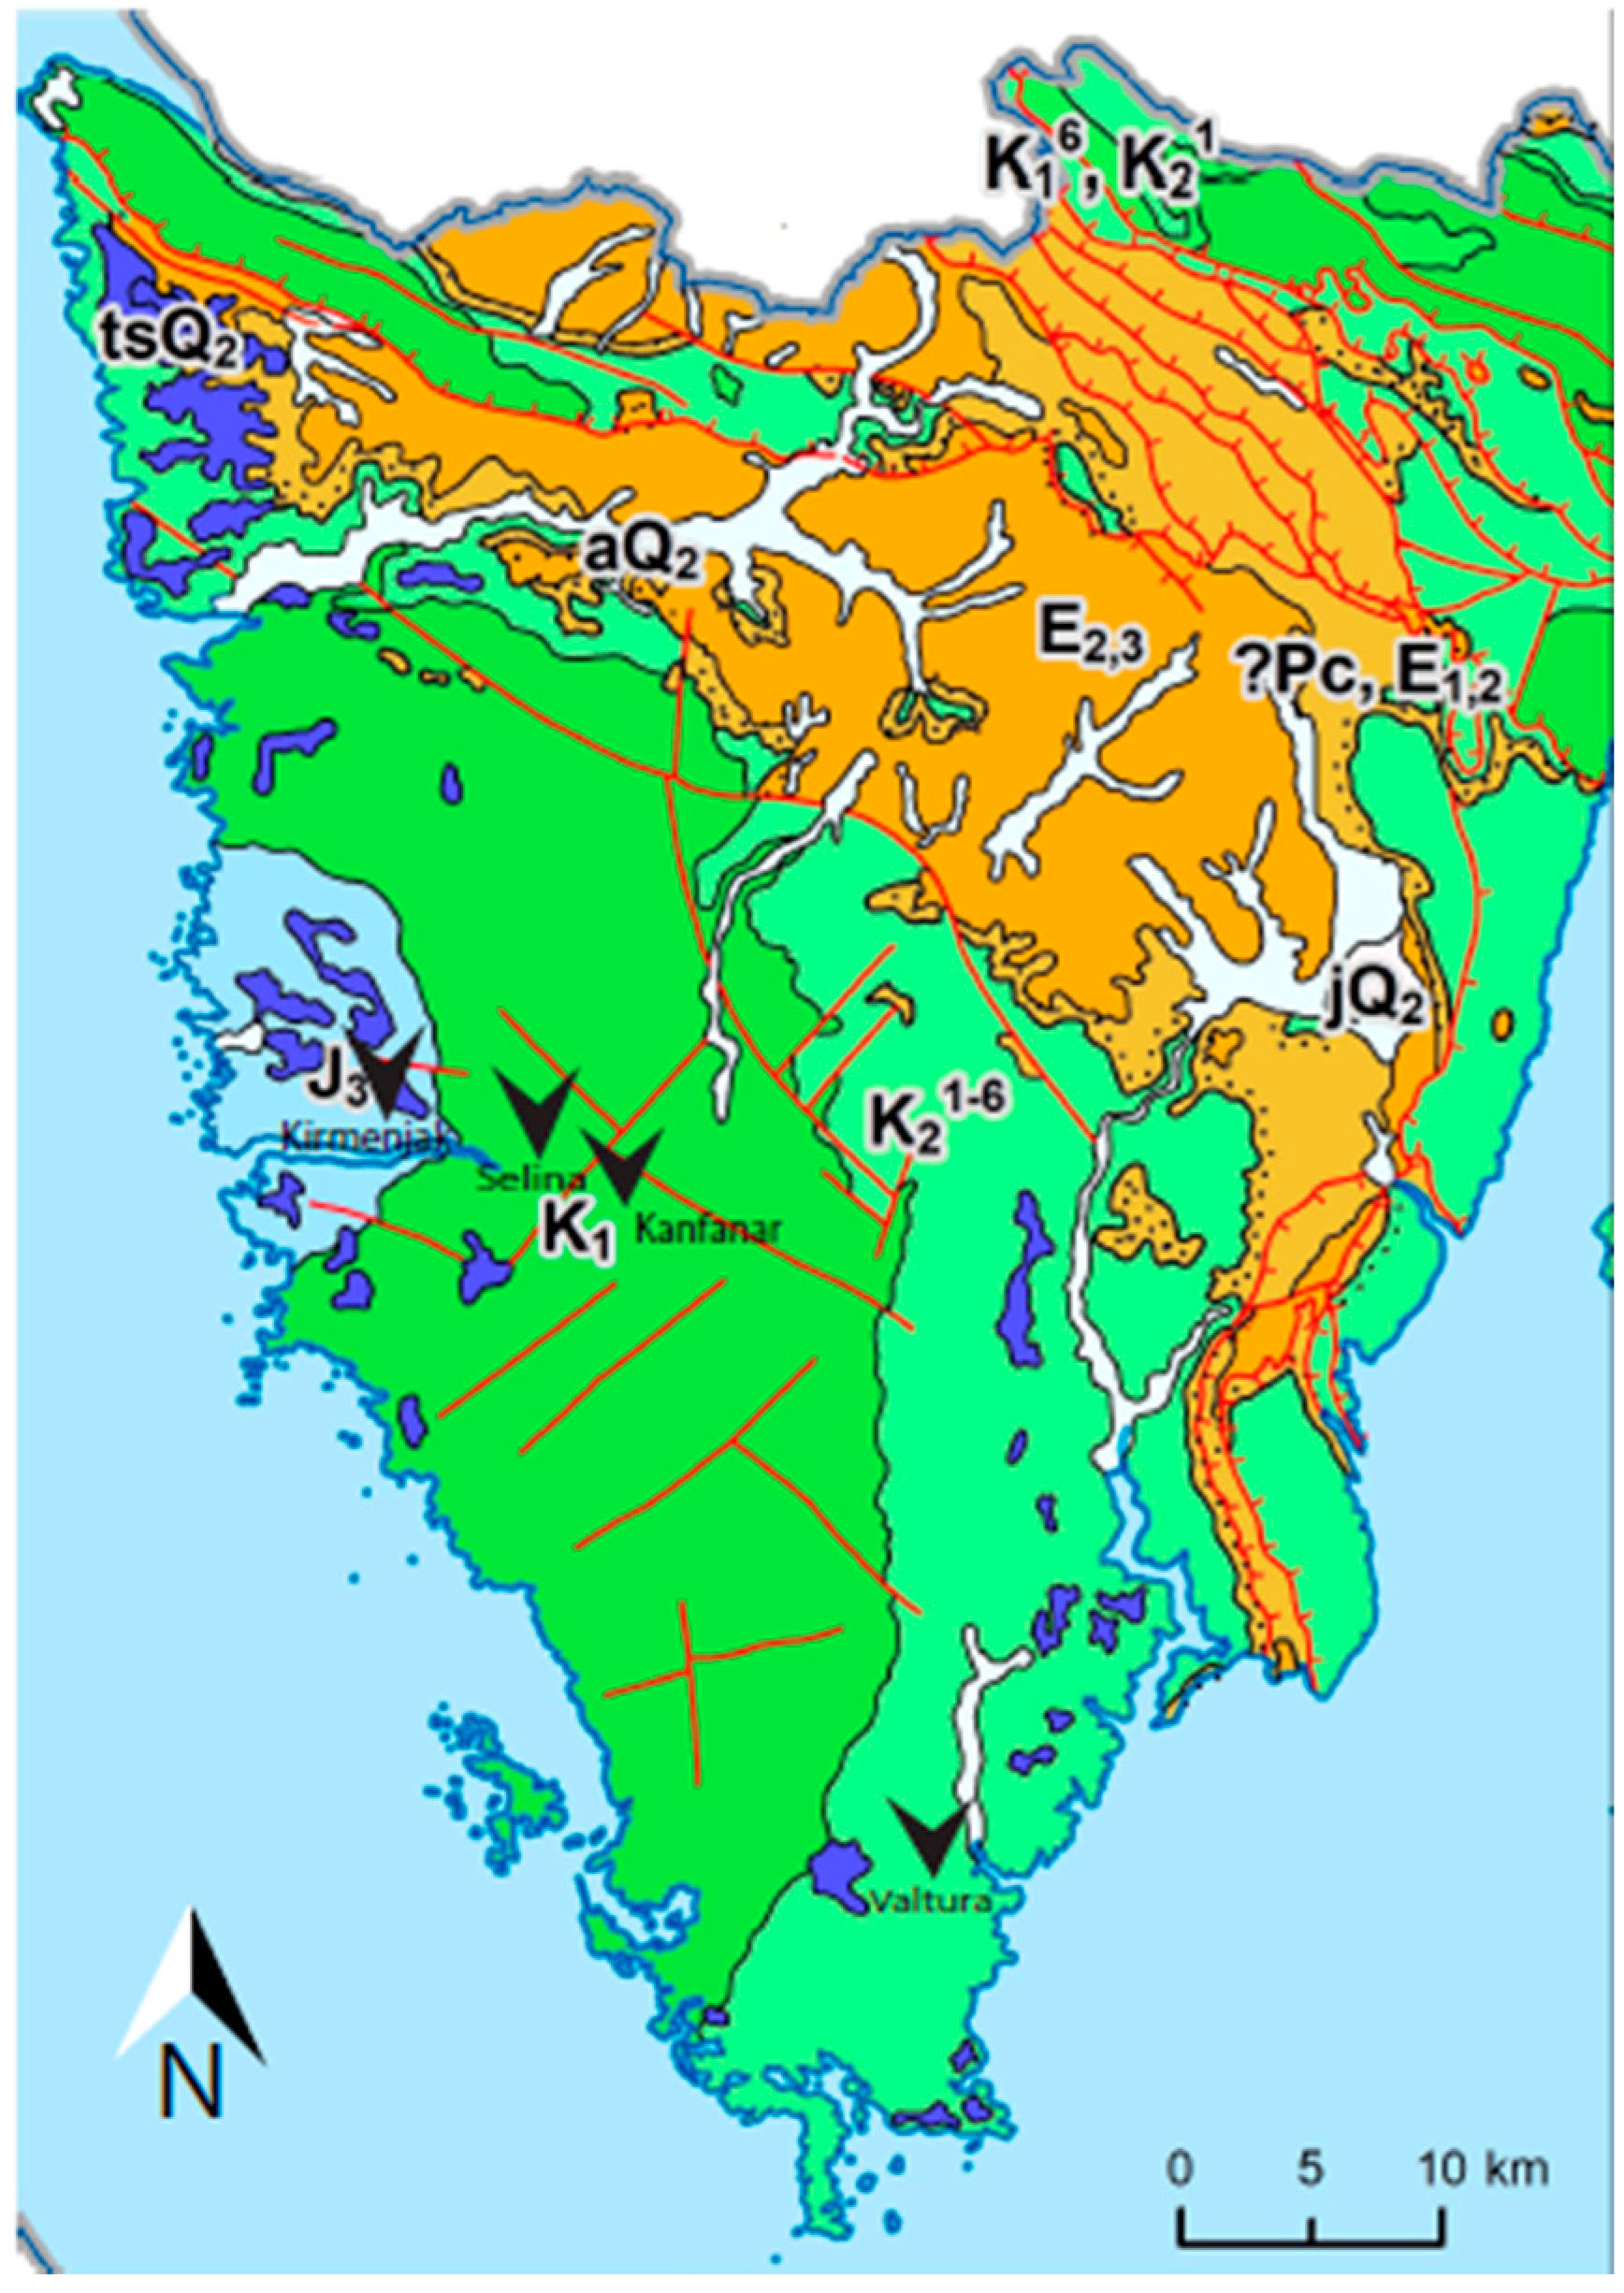
Thick Mesozoic carbonate successions are deposited in the northwestern part of the Adriatic Carbonate Platform-AdCP [43,44,45,46] outcrop in today’s Istrian Peninsula (see Figure 1). Limestones from the following quarries in Istria (see locations in Figure 1) were analyzed: Kirmenjak Quarry (Upper Jurassic age), Kanfanar Quarry (Lower Cretaceous age), Selina Quarry (Lower Cretaceous age) and Valtura Quarry (Upper Cretaceous age) [47]. Upper Jurassic limestones of Tithonian age from Kirmenjak Quarry are presented by thick bedded (100 to 170 cm) mudstones with stylolites. According to [48], the microfossil assemblage consists of only a few taxa of calcareous algae (Campbelliella striata (CAROZZI), Salpingoporella annulata CAROZZI), as well as Favreina sp. and rare unidentified benthic foraminifera, gastropods, ostracods and echinoids.
Lower Cretaceous limestones from Kanfanar and Selina Quarries (both of lower Aptian age) are represented by thick bedded (up to 18 m thick) floatstones with oncoids and rudists, accompanied with index fossil microproblematica Bacinella irregularis Radoičić 1959 [49,50]. According to [51], in Aptian limestones of Kanfanar Formation, bioclasts or complete shells of Toucasia sp. occur together with Bacinella oncoids. Fossiliferous wackestones between oncoids contain numerous benthic foraminifera (Palorbitolina lenticularis (BLUMENBACH) and Praechrysalidina infracretacea LUPERTO-SINNI, among others) and rare specimens of the green algae Salpingoporella dinarica RADOIČIĆ.
Upper Cretaceous massive limestones (up to 40 m thick) of lower Cenomanian age from Valtura Quarry [52] are represented by floatstones with Chondrodont and rudist bivalve shells, with variety alternating, commercially named as statuario, fiorito and unito. According to [53], there are alternations of bioclastic-rudist floatstones and bioclastic wackestone/packstone/grainstones, containing variable amounts of complete shell of Distefanella raricostata SLIŠKOVIĆ and/or Biradiolites angulosus D’ORBIGNY, together with bioclastic matrix. Rare thick-shelled radiolitids (Durania sp.) and very rare small hippuritids (Hippurites sp.) are sometimes present as well.
Two varieties were sampled from the Kirmenjak Quarry: bright and dark variety. Both are micritic limestones (mudstones after [36,37]) deposited in the shallow marine low-energy environments (lagoons). The bright variety have open (more pronounced) stylolites that are weathered around the edges, while in the dark variety, stylolites are closed and less weathered, giving the dark variety more strength [54,55,56].
Kanfanar and Selina oncoidal limestones are both commercially known as Istrian Yellow natural building stone. These limestones (floatstones after [36,37]) are deposited in restricted low-energy environments, favoring the bloom of cyanobacteria and algae together with carbonate mud deposition [57,58]. They also contain some stylolites that are more irregular and well-interconnected compared with the Kirmenjak limestones.
Rudist limestones (floatstones and packstones after [36,37]) from Valtura Quarry do not have stylolites or any other visible defects (like dissolution seams, cracks or veins, for example). Two varieties can be distinguished according to the size of rudist shell fragments incorporated in micritic mud, and they are commercially known as fiorito and unito. The fiorito variety contains larger (cm- to dm-sized) rudist shell fragments, as well as complete rudist shells, while the unito variety contains smaller fragments (mm- to cm-sized), which gives higher strength values to the unito variety.

2.2. Macroscopic Determination and Micropetrographic Analysis

Micropetrographic analysis is performed on a representative sample for each quarry, together with varieties within Kirmenjak bright (KIR-V-A), Kirmenjak dark (KIR-T-A), Kanfanar (KAN-IV-A), Selina (SEL-T-A), Valtura fiorito (VAL-F-A) and Valtura unito (VAL-U-A). Lithological properties of these limestones (allochems, matrix, cement, fabric, texture, etc.) were described from thin sections, previously prepared and stained by standard procedure for limestones (after [59]). Limestones are further classified after [36,37,38,39]. Determined micropetrographic characteristics are further evaluated, considering their influence on rock strength. All procedures for micropetrographic analysis [60] were made in the LaGeMa laboratory at the Department of Mineralogy, Petrology and Mineral Deposits of the Faculty of Mining, Geology and Petroleum Engineering, the University of Zagreb.

2.3. Ultrasound P-Wave Velocity and Related UCS

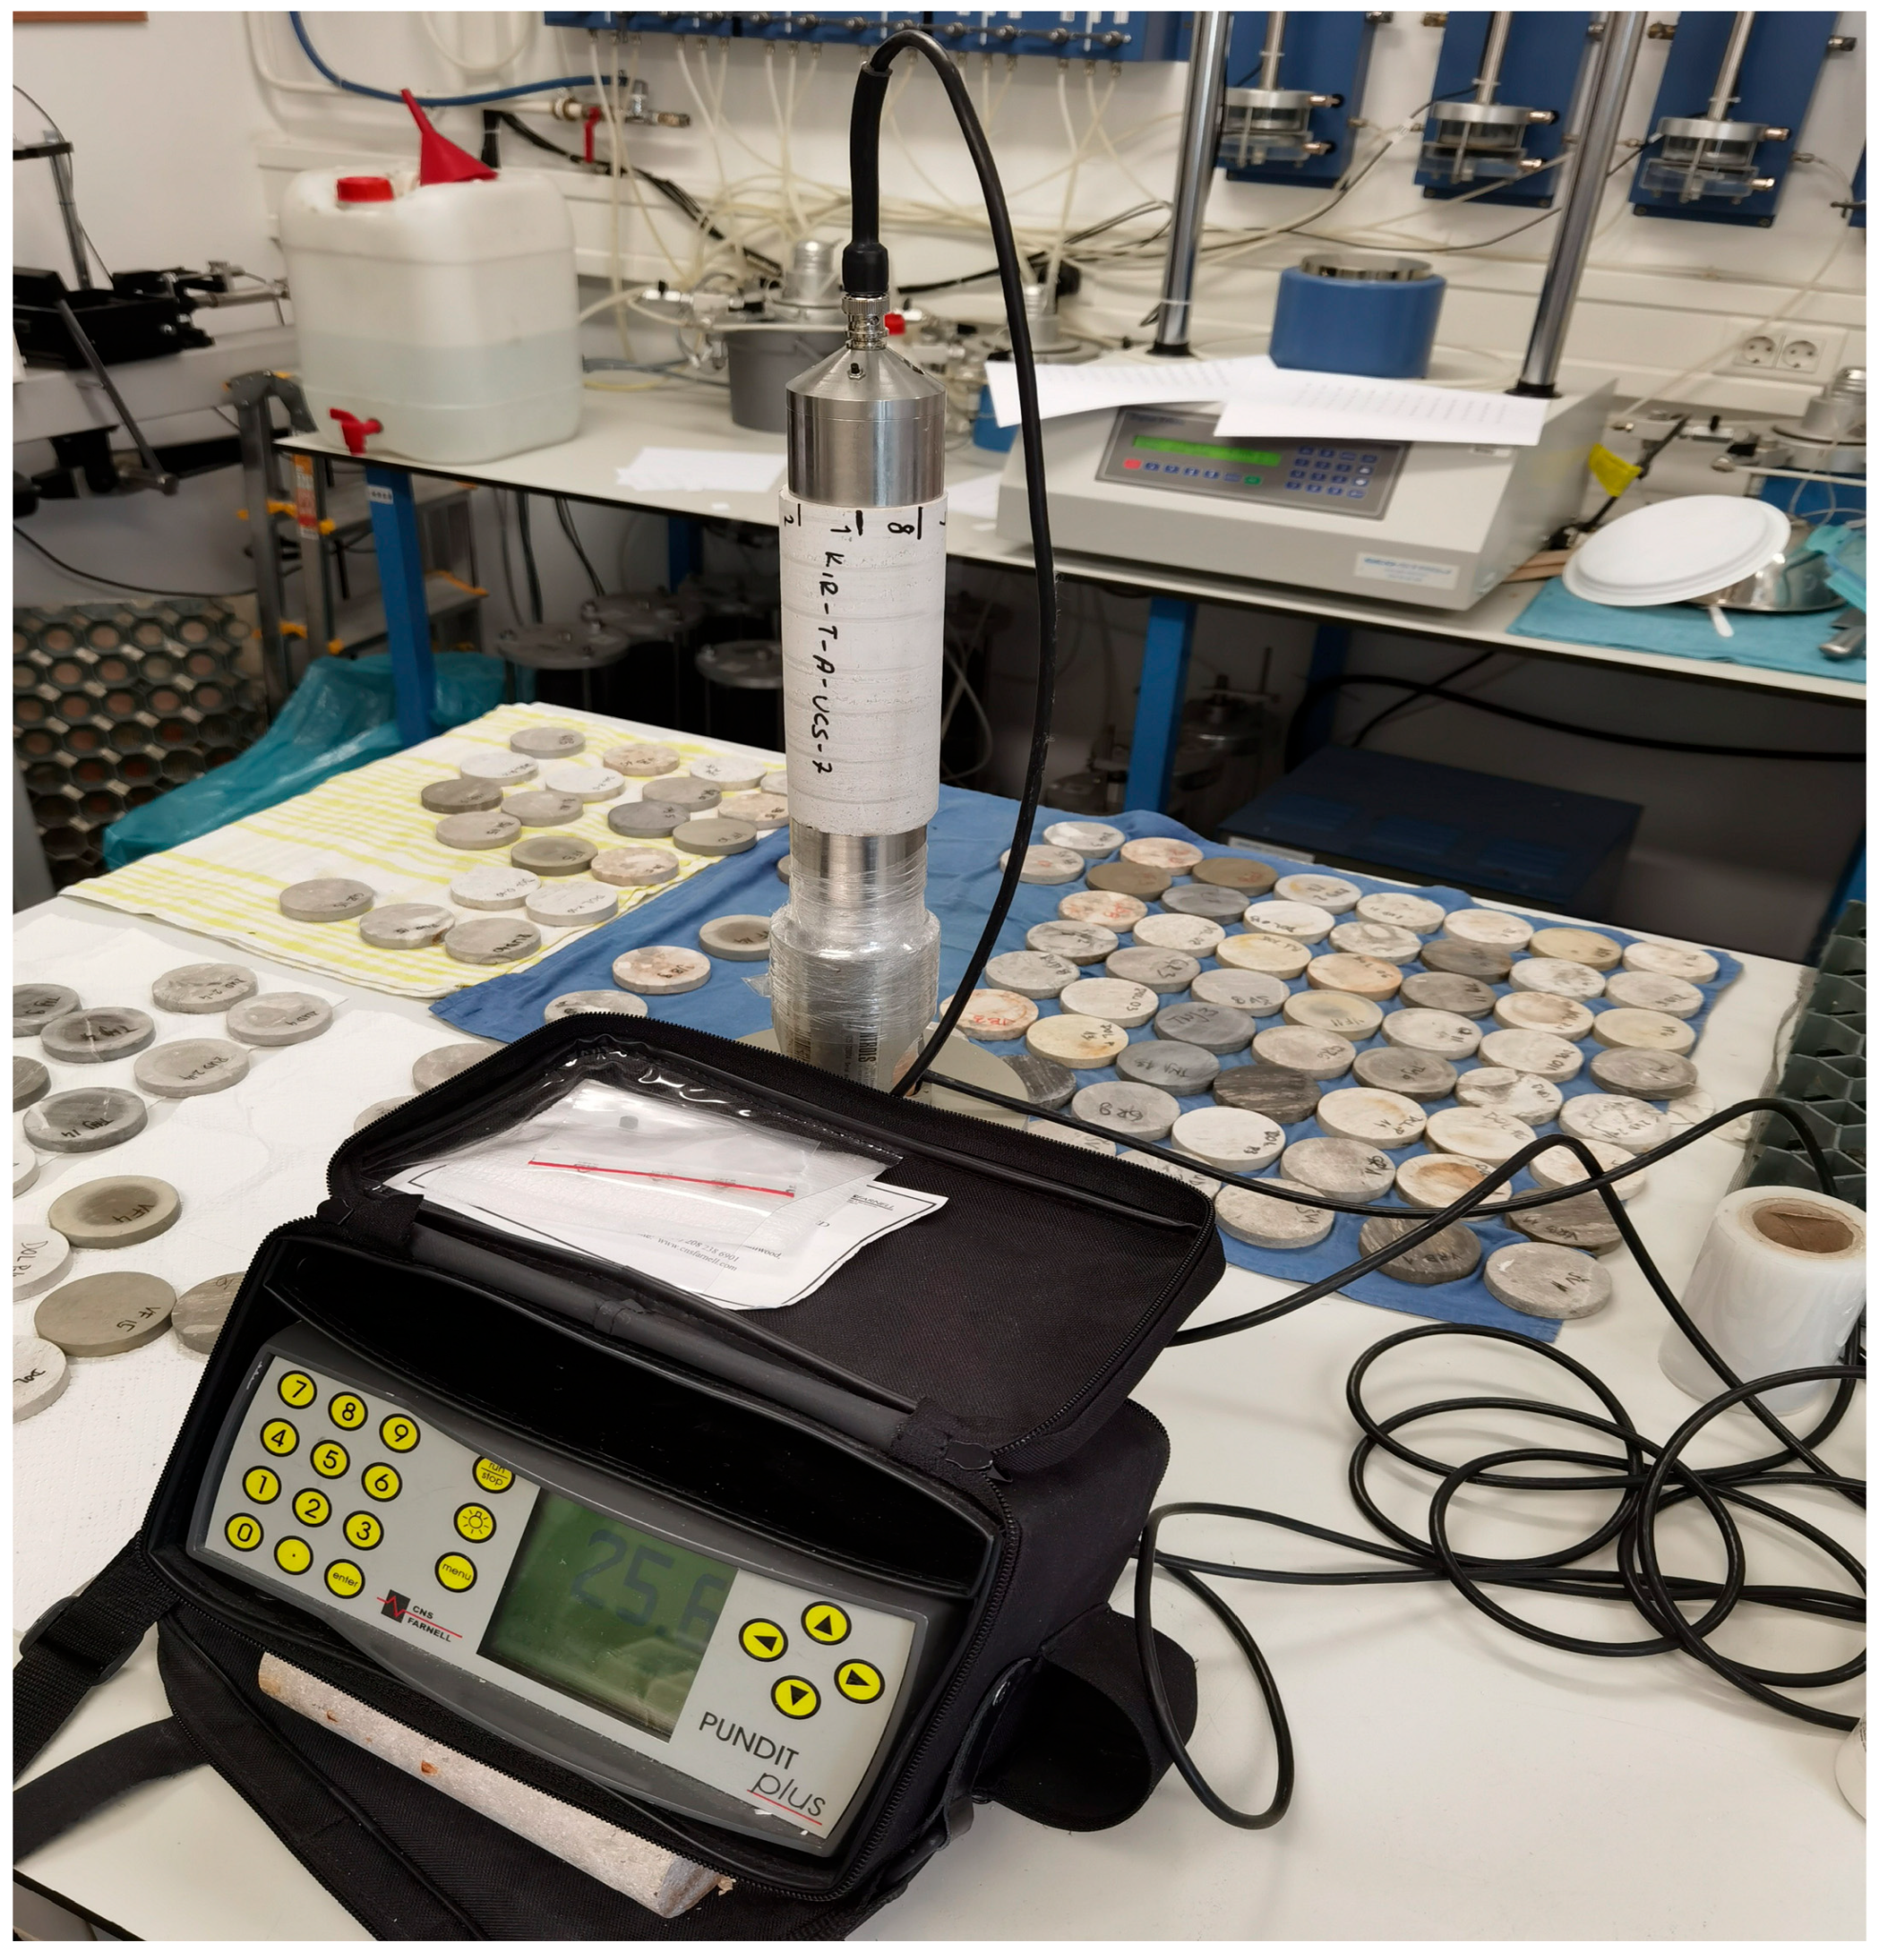
The ultrasound propagation velocity is measured using a PUNDIT plus device consisting of a control unit and two metal plates, one of which serves as a transmitter and the other as a detector of ultrasonic waves (see Figure 2). The method was carried out on all 96 samples according to the standards [61,62,63]. The aim of this method is to determine the condition of the rock material using the wave propagation velocity. Measurements are performed on cylindrical samples that have a length between 2 and 2.5 times the diameter. The height of the samples was 15 cm. The ultrasonic propagation velocity (v) is calculated by dividing the value of the height of the sample by the wave velocity according to Formula (1).
v = h t ,   ( m / s )
h—height of the samples (mm),
t—time of passage of the wave through the sample (μs)
The calculation of estimated values of uniaxial compressive strength via P-wave velocities was carried out using formulas (see Table 1) from the previous works of the authors [10,18,19,21,22].

2.4. Visual Assessment of Lithological Properties and Defects

The method is performed by visual inspection with the naked eye and a lens on cylindrical samples that have a length between 2 and 2.5 times the diameter. Samples prepared in this way are suitable for such analyses due to their cylindrical shape and polished bases, which results in better visibility of the key rock material features. The method was carried out in all varieties, i.e., a total of 96 samples. The usual visual determination determines parameters such as lithology, mineral composition, structure, texture, porosity and weathering [64,65]. For the purposes of this analysis, defects were additionally observed due to their influence on the strength of the rock. Therefore, to visually determine the strength of the rock, four basic features were observed: lithology, fabric, defects and porosity. To analyze the results in a statistical manner, the determination of the characteristics on the samples was not descriptive, but the characteristics were divided into groups (classes) and later assigned ratings, previously defined by [32].
When determining the lithology, the rock type is considered. In this study, all samples were determined as limestones. The fabric of the samples was determined, and the porosity of the material was estimated.
Fabric is defined as the physical arrangement of grains and clasts in the rock, including their texture and structure. To simplify the study, it was considered that similar textural/structural types have similar impact on uniaxial compressive strength, and such samples are considered as one group. This resulted in a simple division of 6 groups: muddy (mudstone, wackestone, microcrystalline), granular (packstone, grainstone), coarse-grained (floatstone, rudstone, bafflestone, framestone), laminated (bindstone), crystalline (fine crystalline, medium crystalline, coarse crystalline) and breccia.
In this method, defects are considered as all physical damage to the samples, such as cracks, veins, fissures and stylolites. Defects were assigned grades from 1 to 5 based on their characteristics. They are divided into groups according to the width: cracks (<0.5 mm), veins (<5 mm) and fissures (>5 mm). To assess their level of influence on uniaxial compressive strength, the following defect characteristics were observed: crack intensity, filling, roughness and weathering. A rating of 1 would indicate that there are no visible defects on the sample. To determine the intensity of the crack, the presence, i.e., the number of defects on a square surface measuring 5 × 5 cm on the sample, is considered. Therefore, there are 4 intensities of cracking: weak intensity (rating 2), moderate intensity (rating 3), strong intensity (rating 4) and very strong (rating 5).
The filling is the material found in the defects. If there is no filling, a grade of 2 is entered in the table. If there is a filling, a grade is added to it depending on the material in question. In cracks, the fillings can be the following: hard filling (calcite, dolomite) (grade 3), hard–soft filling (calcitic clay, clay) (grade 4), soft filling (clay) (grade 5).
Roughness is classified according to JRC 10 cm profiles by [66]. Considering the characteristics of the defects, four levels of roughness were considered: very rough (grade 2), rough (grade 3), slightly rough (grade 4) and smooth (grade 5).
The wear of the defect walls was determined by the change in wall color, the level of secondary porosity and the width of the wear zones around the defects. This resulted in 4 levels of wall wear: no wear or fresh walls (grade 2), slightly worn (grade 3), moderately worn (grade 4) and severely worn (grade 5).
Limestones have two types of porosity: primary, intergranular and secondary, along fractures. Both types of porosity have effect on the mechanical properties of carbonates, so the total porosity of the samples was observed. Porosity was determined based on the visibility of pores and their size. Thus, five types of porosity are distinguished: very low (no visible pores), low (small pores are rare and visible with a lens), moderate (large presence of small pores, pores of different sizes are visible), high (large presence of pores of a few mm in size) and very high (large presence of pores larger than 5 mm).
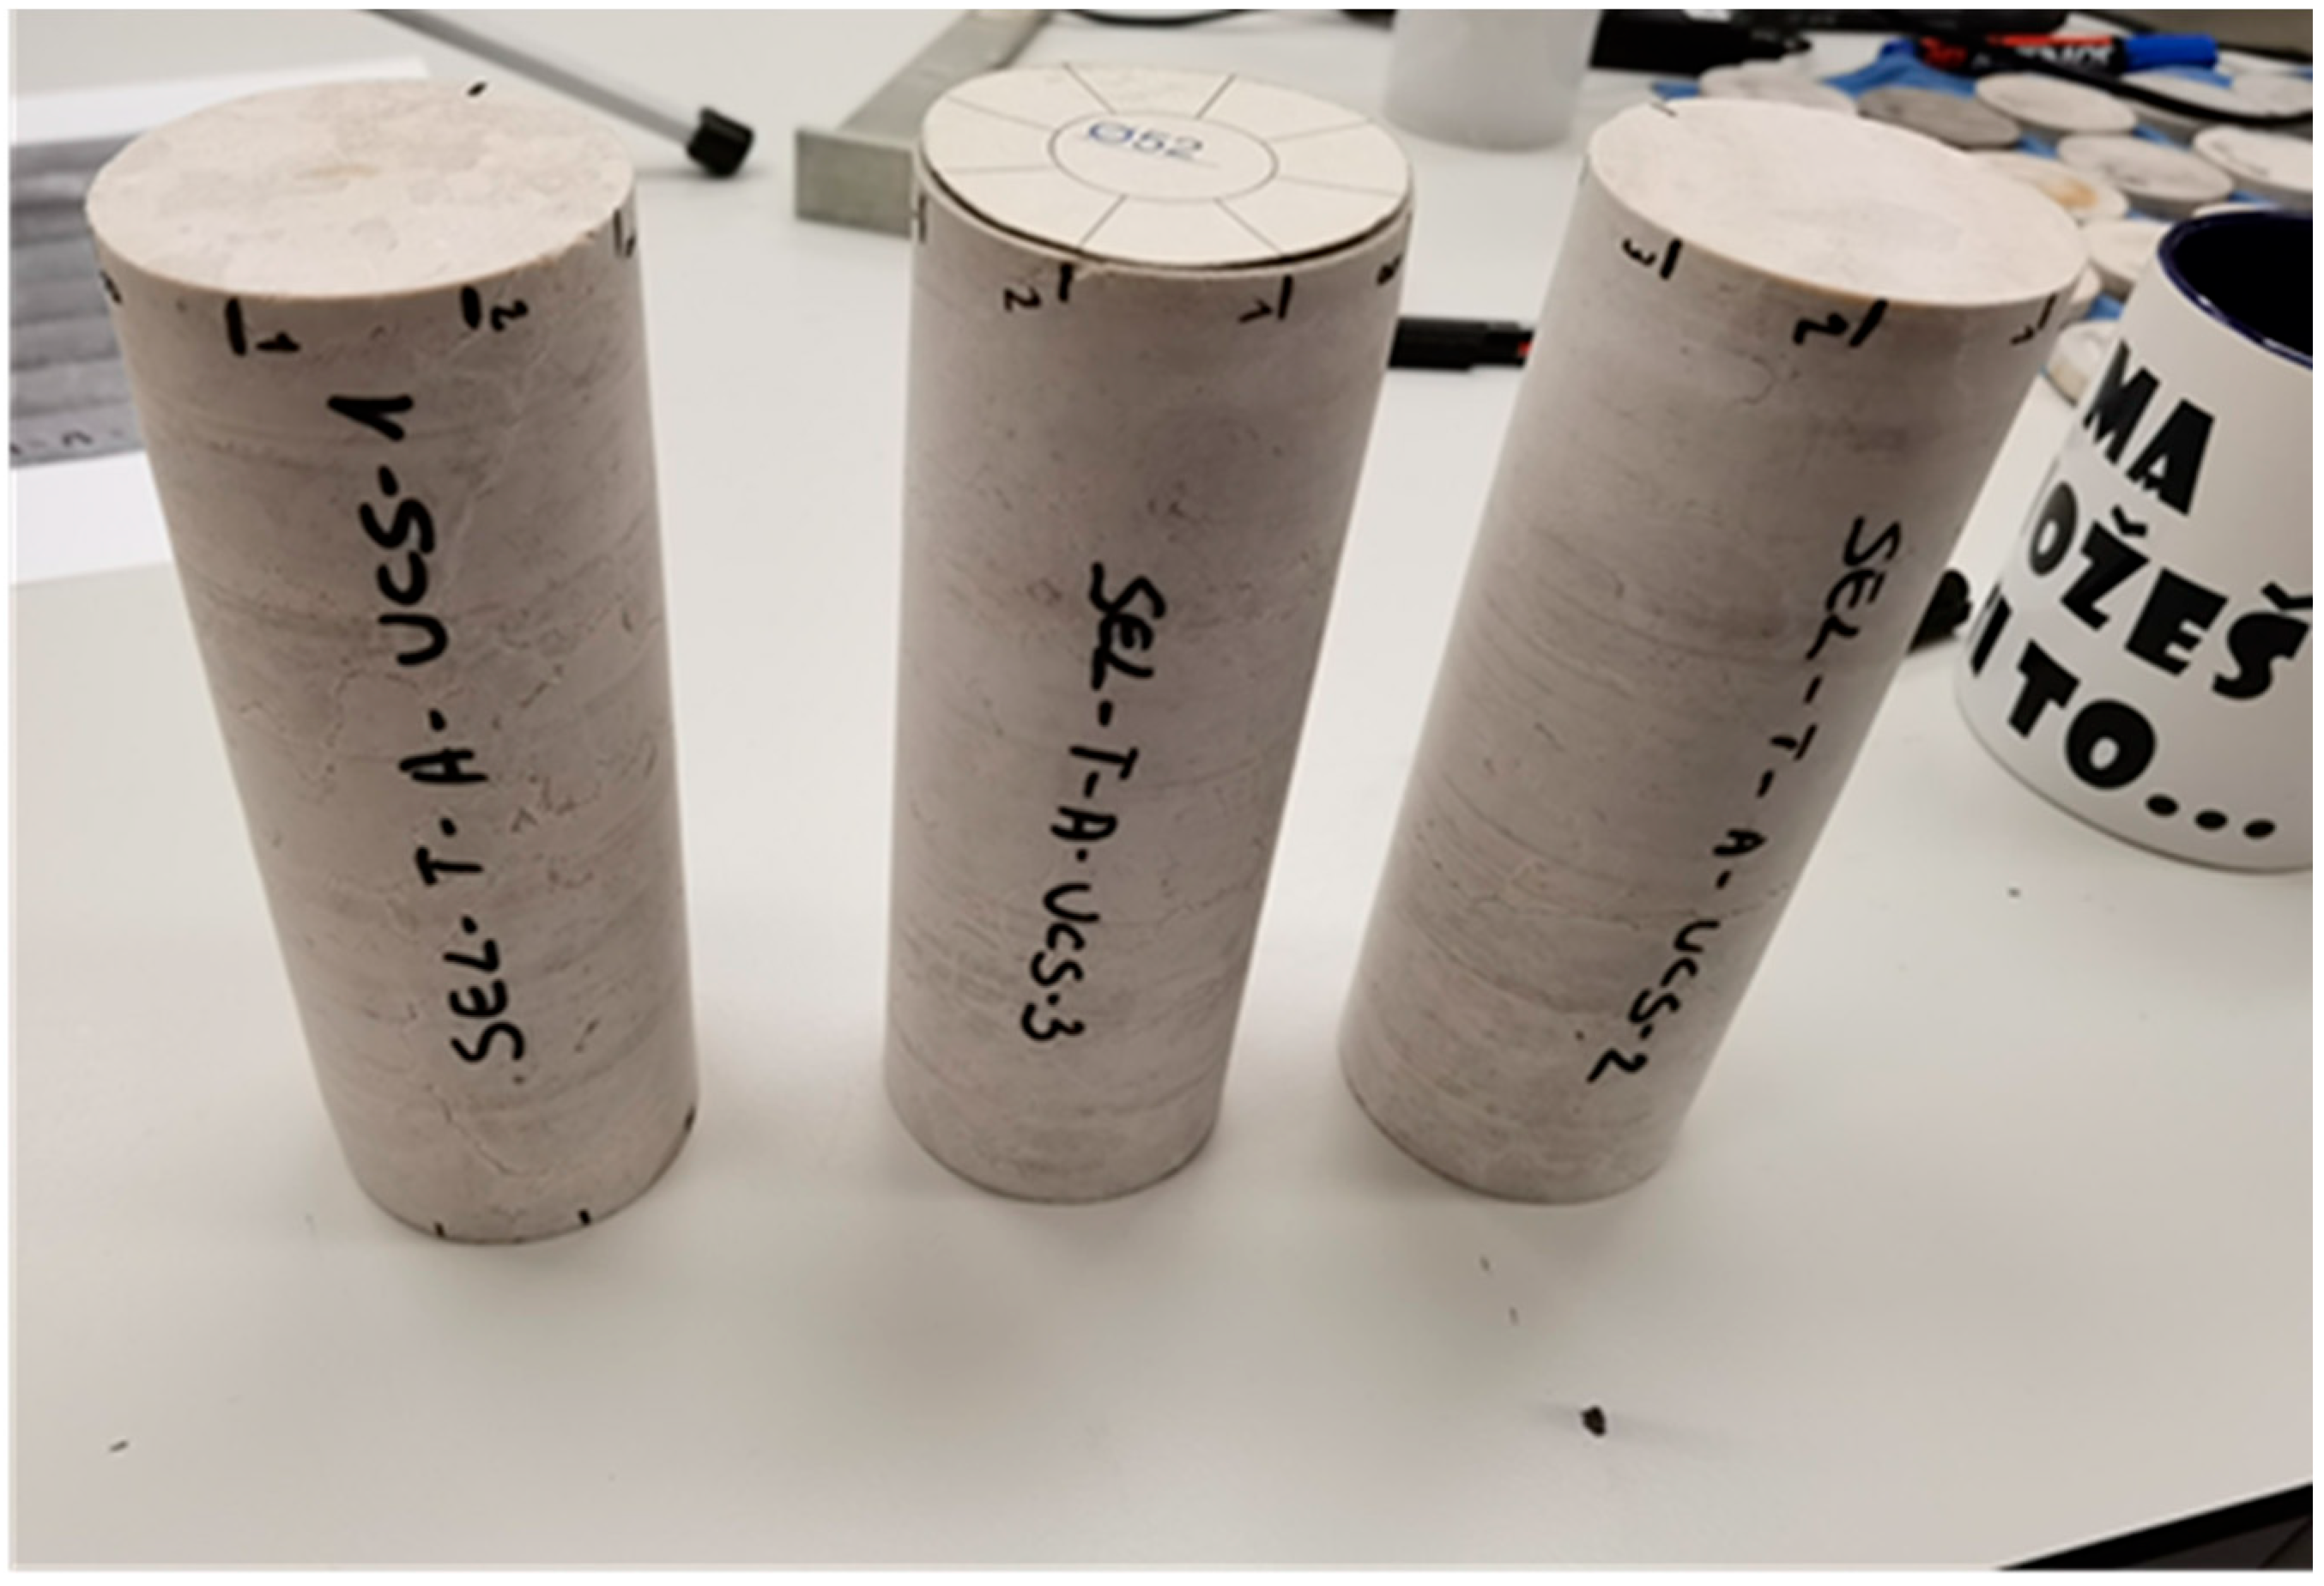
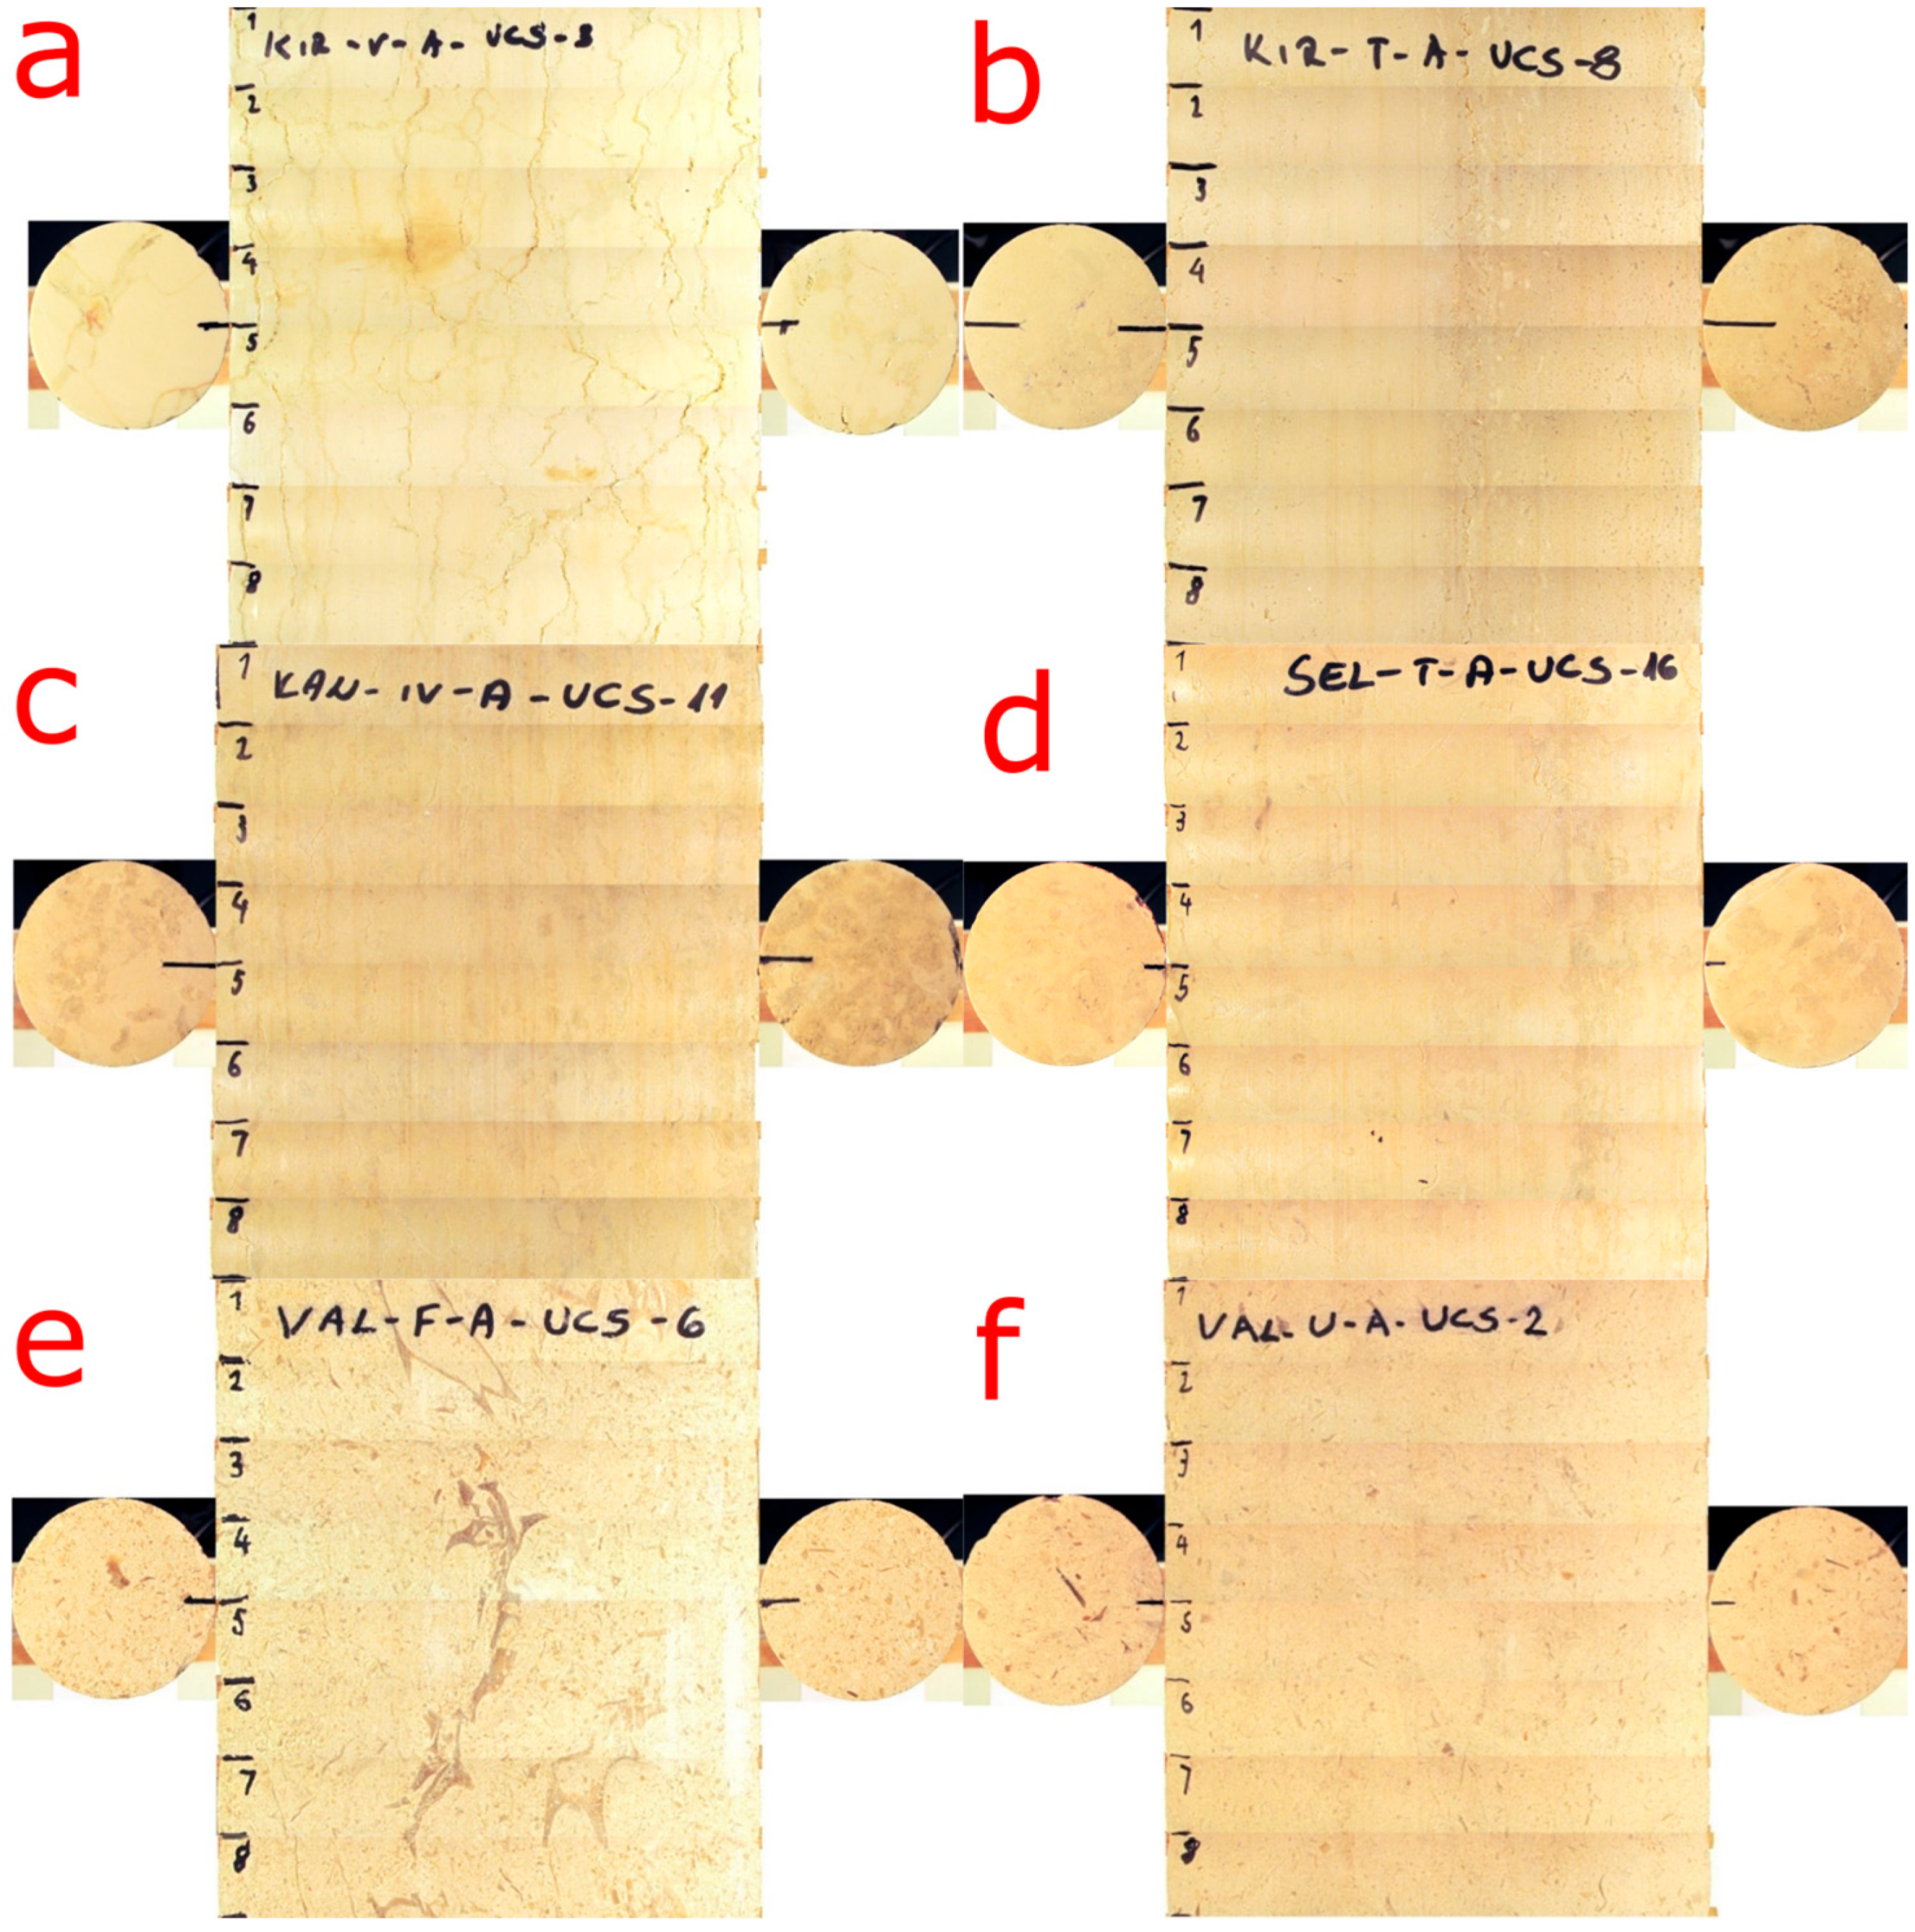
Since these features are observed on the entire sample, the samples were photographed in continuous sequences along lateral surface area (mantle) and bases of the cylinder. The unrolled cylinder mantle is obtained by marking intervals every 45° on the sample, so the samples are divided into 8 intervals (Figure 3). Before photographing, the sample is moistened to make its features more visible. The photographs are processed and merged into a single image in the Adobe Photoshop program.

2.5. UCS Estimation Based on Visual Recognition

The calculation of the estimated UCS values was carried out using data from [32]. According to authors, the following factors and combinations of rock characteristics were found to be statistically significant for carbonate rocks: lithology, fabric, defects, porosity, lithology–fabric, fabric–defect and defect–porosity.
Thus, the UCS can be estimated from Equation (2) from [32]:
UCS = UCSmean + L + F + D + P + LF + FD + DP
where
UCS—uniaxial compressive strength (response variable);
UCSmean—average uniaxial compressive strength of all samples;
L—effect of lithology;
F—effect of fabric;
D—effect of defects;
P—effect of porosity;
LF—effects of lithology and fabric interaction;
FD—effect of fabric and defect interaction;
DP—effect of defect and porosity interaction.
To determine the success of the visual strength assessment method, the results obtained by calculating UCS using the formulas were compared with the results obtained by calculating UCS using equations from Table 1.
To evaluate the effectiveness of the method for calculating uniaxial compressive strength based on the visual assessment of sample characteristics, a classification was carried out using both the calculated values and the values provided by the company exploiting these limestone varieties. The following classification systems were used: IAEG [67], ISRM [15] and ISO [65]. According to [67], rocks can be classified into 5 groups: weak < 15 MPa, moderately strong (15–50 MPa), strong (50–120 MPa), very strong (120–230 MPa) and extremely strong (>230 MPa). In addition, rocks can be classified into five categories [15]: very weak (<6 MPa), weak (6–10 MPa), moderately strong (20–60 MPa), strong (60–200 MPa) and extremely strong (>200 MPa). ISO [65] classification divides rocks into 6 categories: extremely weak (<1 MPa), very weak (1–5 MPa), weak (5–25 MPa), moderately strong (25–50 MPa), strong (50–100 MPa) and very strong (100–250 MPa).

3. Results

Results obtained from the macroscopic visual determination and micropetrographic analysis of the samples taken from various quarries are presented in this chapter.

3.1. Macroscopic and Micropetrographic Characteristics

According to macroscopic visual determination and micropetrographic analysis of rock characteristics, such as carbonate minerals, clasts, fossils as well as matrix and cement, together with porosity and defects/cracks, samples were evaluated and classified. This evaluation according to its current physical state is used to calculate uniaxial compressive strength of the rocks.

3.1.1. Kirmenjak–bright Variety

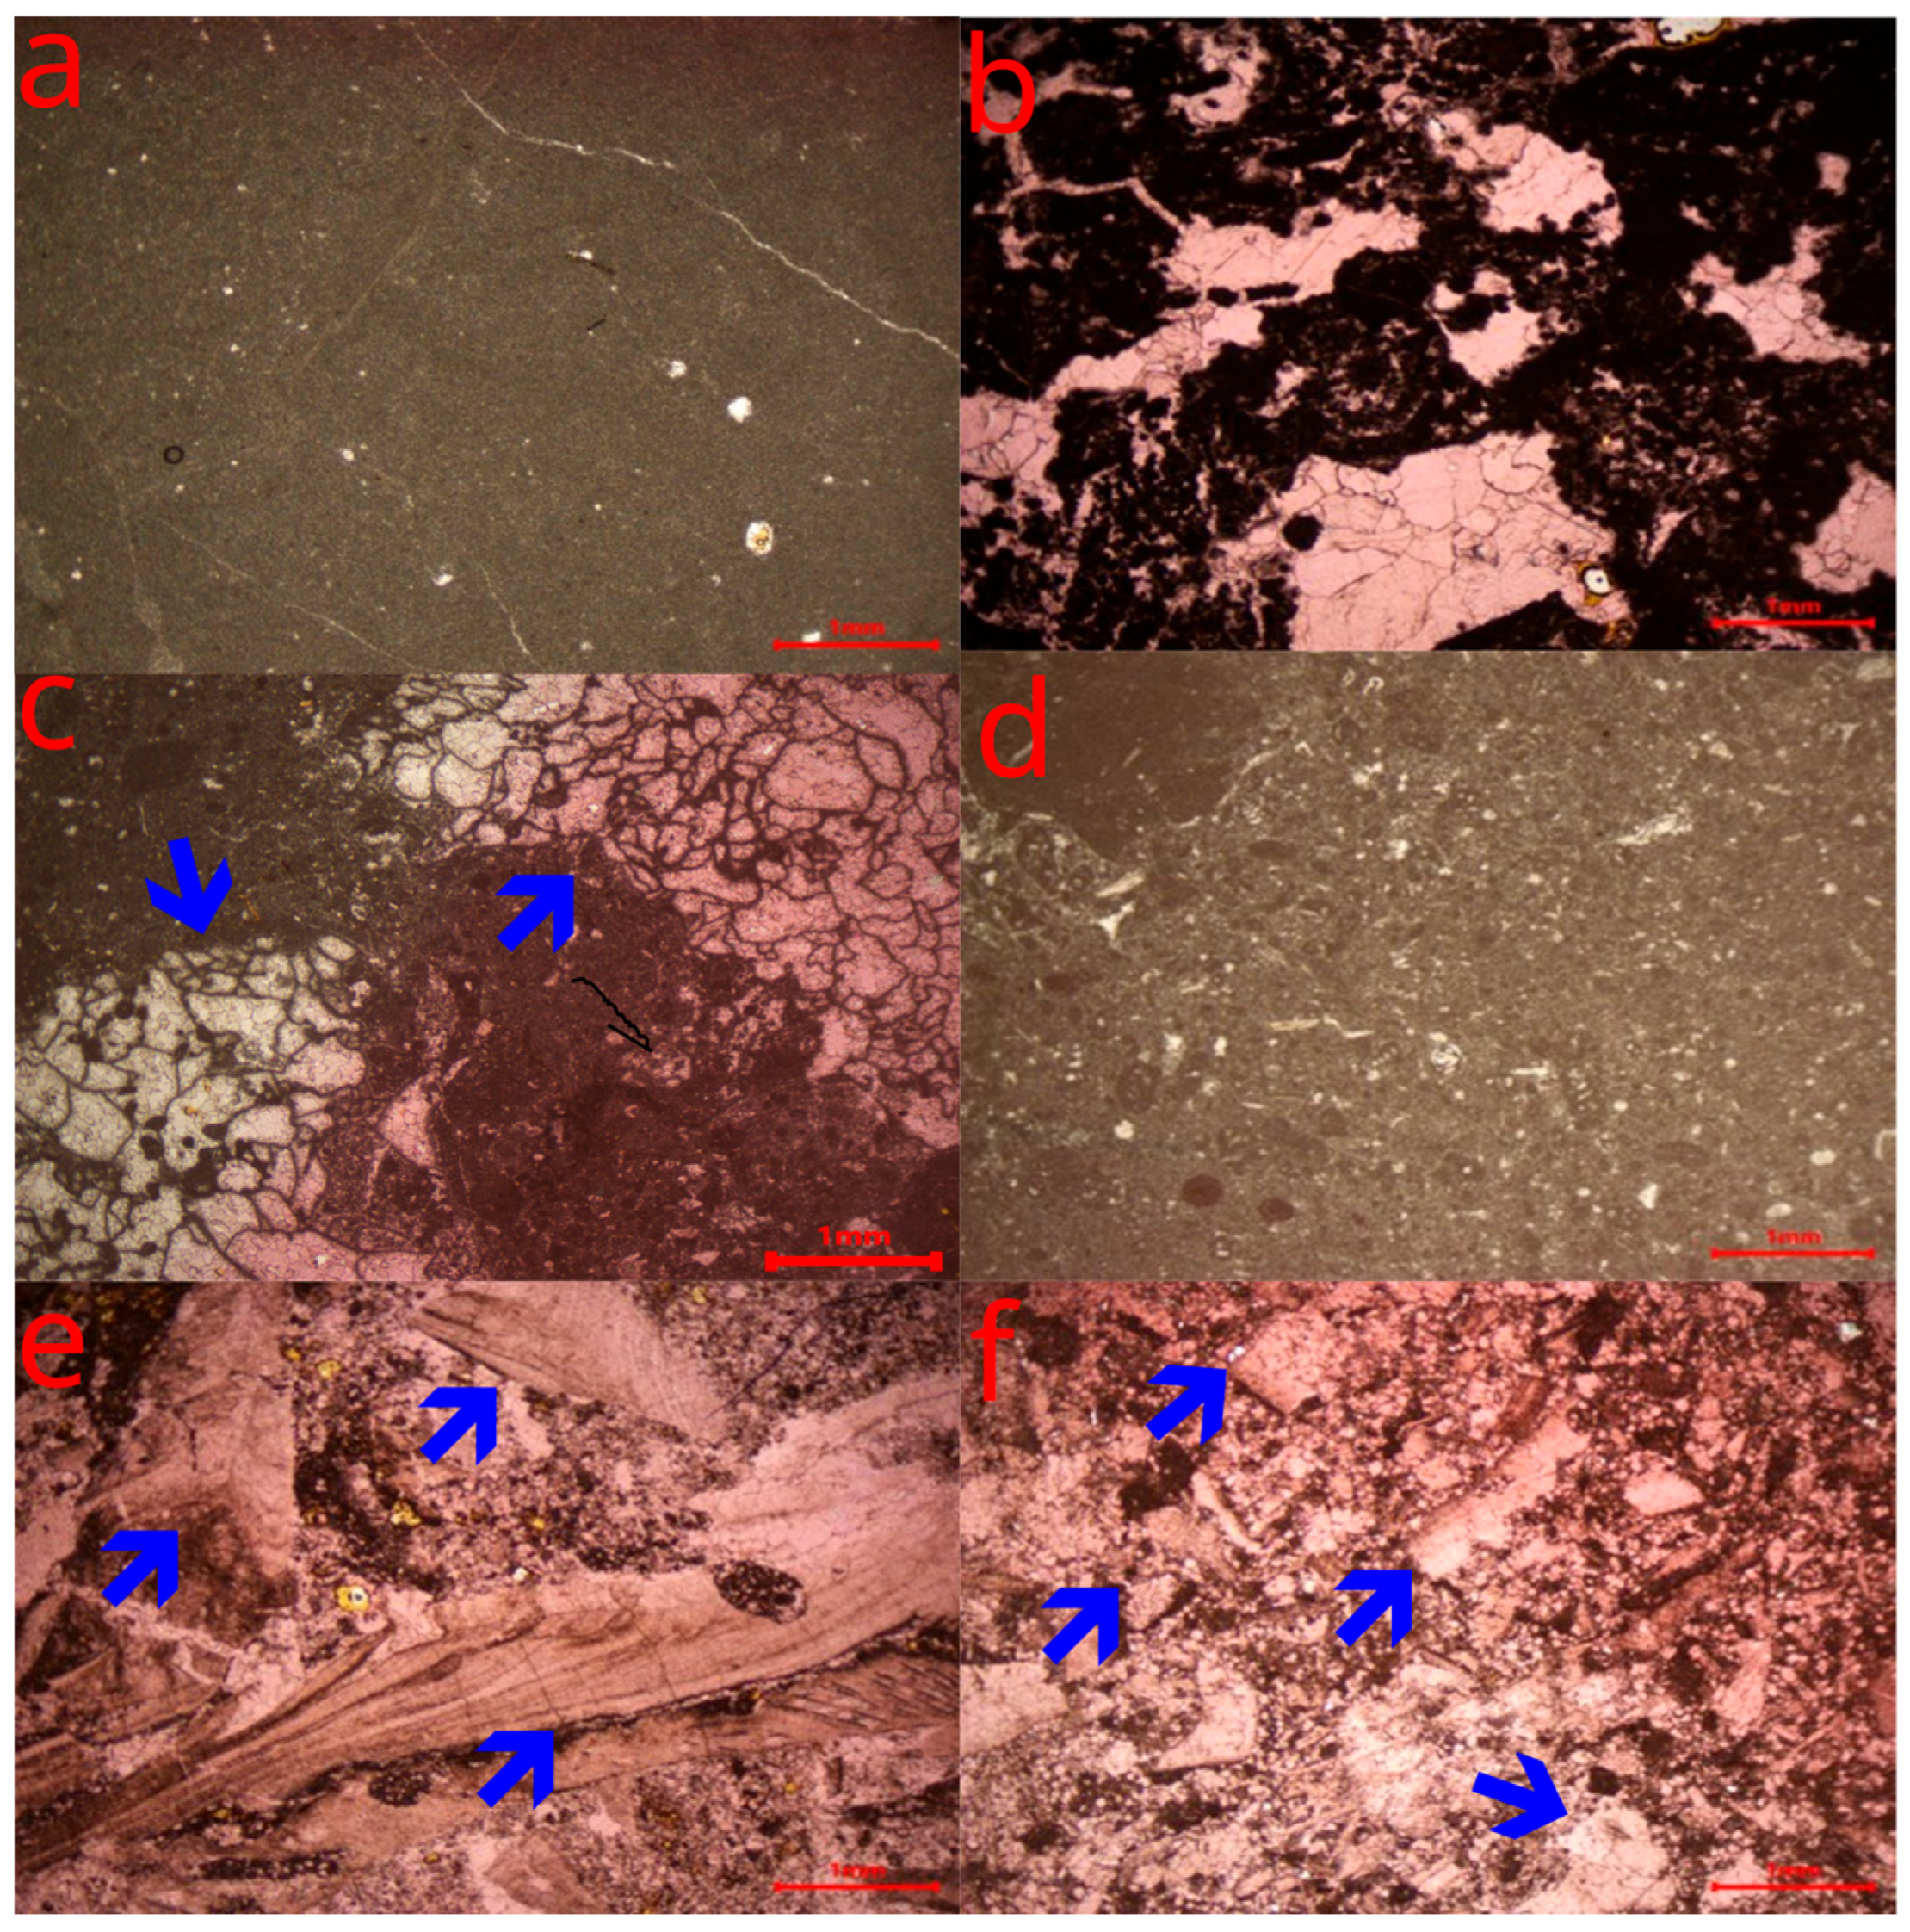
Macroscopic visual determination of the bright variety samples of the Kirmenjak limestone showed predominate micritic carbonate mud and no visible carbonate grains or fossils; therefore, they are classified as mudstones (after [36,37]). These pale-yellow-colored mudstones are heavily cracked due to well-connected stylolite development (see Figure 4a). Stylolites are up to 5 mm wide and therefore are named as veins, weathered around the edges and not cemented or filled with matrix.
Micropetrographic analysis of the bright variety pale yellow Kirmenjak limestone sample showed homogeneous micritic fabric with some veins and cracks filled with sparitic calcite, classified as (stylolitic) micrites (after [38,39] or (stylolitic) mudstones after [36,37]).

3.1.2. Kirmenjak—dark Variety

Visual determination of the dark variety Kirmenjak limestone samples identified carbonate grains (mainly bioclasts and oncoids) bound together with sparitic calcite cement in a grain-supported fabric (see Figure 4b) and therefore are classified as grainstones (after [36,37]). Pronounced stylolites are parallel laminated and mildly weathered around their edges, therefore named cracks.
Micropetrographic analysis of the dark variety pale yellow Kirmenjak limestones are determined to be oncoids (1–3 mm large) cemented with sparitic calcite (mainly 0.5–1 mm large crystals, occasionally larger than 1 mm) in a grain-supported fabric, classified as oncosparites/oncomicrites (after [38,39]) or (oncoidal) grainstones/packstones (after [36,37]). Some irregular pores (up to 0.5 mm large) are also determined in this variety.

3.1.3. Kanfanar

Visual determination of the Kanfanar limestone samples identified large oncoids within micrite in a mud-supported fabric (see Figure 4c) and therefore classified them as floatstones (after [36,37]). Pronounced open stylolites (up to 5 mm wide) are parallel laminated and not weathered around their edges, therefore named as veins.
Micropetrographic analysis of the Kanfanar limestones determined oncoids larger than 2 mm made of Baccinella irregularis Radoičić 1959 algae [49] and classified as oncomicrudites (after [38,39]) or (oncoidal) floatstones (after [36,37]). Oncoids are concentrated within discrete zones alternating with micritic bioclast zones.

3.1.4. Selina

In the pale yellow Selina limestone samples, oncoid zones alternating parallel with micritic zones were identified. All grains are bounded within micrite mud-supported fabric, and these limestones are therefore classified as floatstones (after [36,37]). Laminated open stylolites (up to 5 mm wide), which frequently appear, are classified as cracks.
Micropetrographic analysis (see Figure 4d) of the Selina limestones determined oncoid zones alternating with bioclastic micritic zones (with algae and rudist shell fragments) and therefore classified these limestones as oncomicrudites to biomicrites (after [38,39]) or (oncoidal) floatstones to wackestones (after [36,37]) Oncoids are concentrated within discrete zones alternating with micritic–bioclastic zones.

3.1.5. Valtura—fiorito Variety

Within the pale yellow fiorito variety of the Valtura limestone samples, visible rudist shells and their fragments (mainly larger than 2 mm) float in the micrite. These limestones are therefore classified as floatstones (after [36,37]). There are no visible cracks or veins present within.
Micropetrographic analysis of the fiorito (see Figure 4e) variety pale yellow Valtura limestones determined abundant large fragments of rudist shells (larger than 2 mm) floating within the mixture of micritic mud and small rudist bioclasts (smaller than 0.5 mm). These limestones are therefore classified as biomicrudites (after [38,39]) or floatstones (after [36,37]).

3.1.6. Valtura—unito Variety

Within the pale yellow unito variety of the Valtura limestones, abundant fragments of rudist shells (mainly smaller than 2 mm) with grain-supported fabric in micrite were identified and therefore classified as packstones (after [36,37]). No visible cracks or veins were detected.
In the grain supported fabric of the unito (see Figure 4f) variety pale yellow Valtura limestones, small rudist shell bioclasts (smaller than 0.5 mm) prevail, densely packed within micritic mud. Only a few larger rudist shell fragments (larger than 2 mm) were detected. These limestones are therefore classified as biomicrites (after [38,39]) or packstones (after [36,37]).

3.1.7. Visual Assessment of Lithological Properties and Defects

Although visual assessment inherently involves subjectivity, observer bias was reduced by using predefined classification schemes, discrete rating classes, and full-surface photographic documentation of each specimen. It is also important to point out that the approach emphasizes relative comparison rather than absolute quantification.
According to the visual assessment of lithological properties (see Figure 5) that influence uniaxial compressive strength, out of the six varieties, one is visually classified as grainy (Kirmenjak bright) and one as muddy (Kirmenjak dark) (see Table 2, Figure 5a,b). Two varieties are crystalline (Kanfanar and Selina)—Figure 5c,d, while two are coarse-grained (Valtura fiorito and unito).
Regardless of the variety (see Figure 5e,f), Valtura shows no defects, whereas Kirmenjak bright and Kanfanar exhibit veins, and Kirmenjak dark and Selina contain cracks. Since Valtura has no defects, all defect-related characteristics—intensity, roughness, weathering and filling—are assigned grade 1.
Based on defect characteristics, the remaining varieties show different grades. Kirmenjak bright displays defect intensity grades ranging from 4 to 5, roughness from 2 to 3, weathering grade 3 and filling grade 2. Kirmenjak dark differs from the bright variety only in intensity (grades 2–3), while the other characteristics have the same grades. Kanfanar differs from Selina in defect intensity and roughness, while weathering and filling grades are identical (see Table 2).
Kirmenjak bright has low porosity, whereas Kirmenjak dark has moderate porosity. Both Kanfanar and Selina exhibit low porosity. Valtura fiorito shows moderate porosity, while Valtura unito has low porosity.

3.2. Ultrasound Propagation Velocity

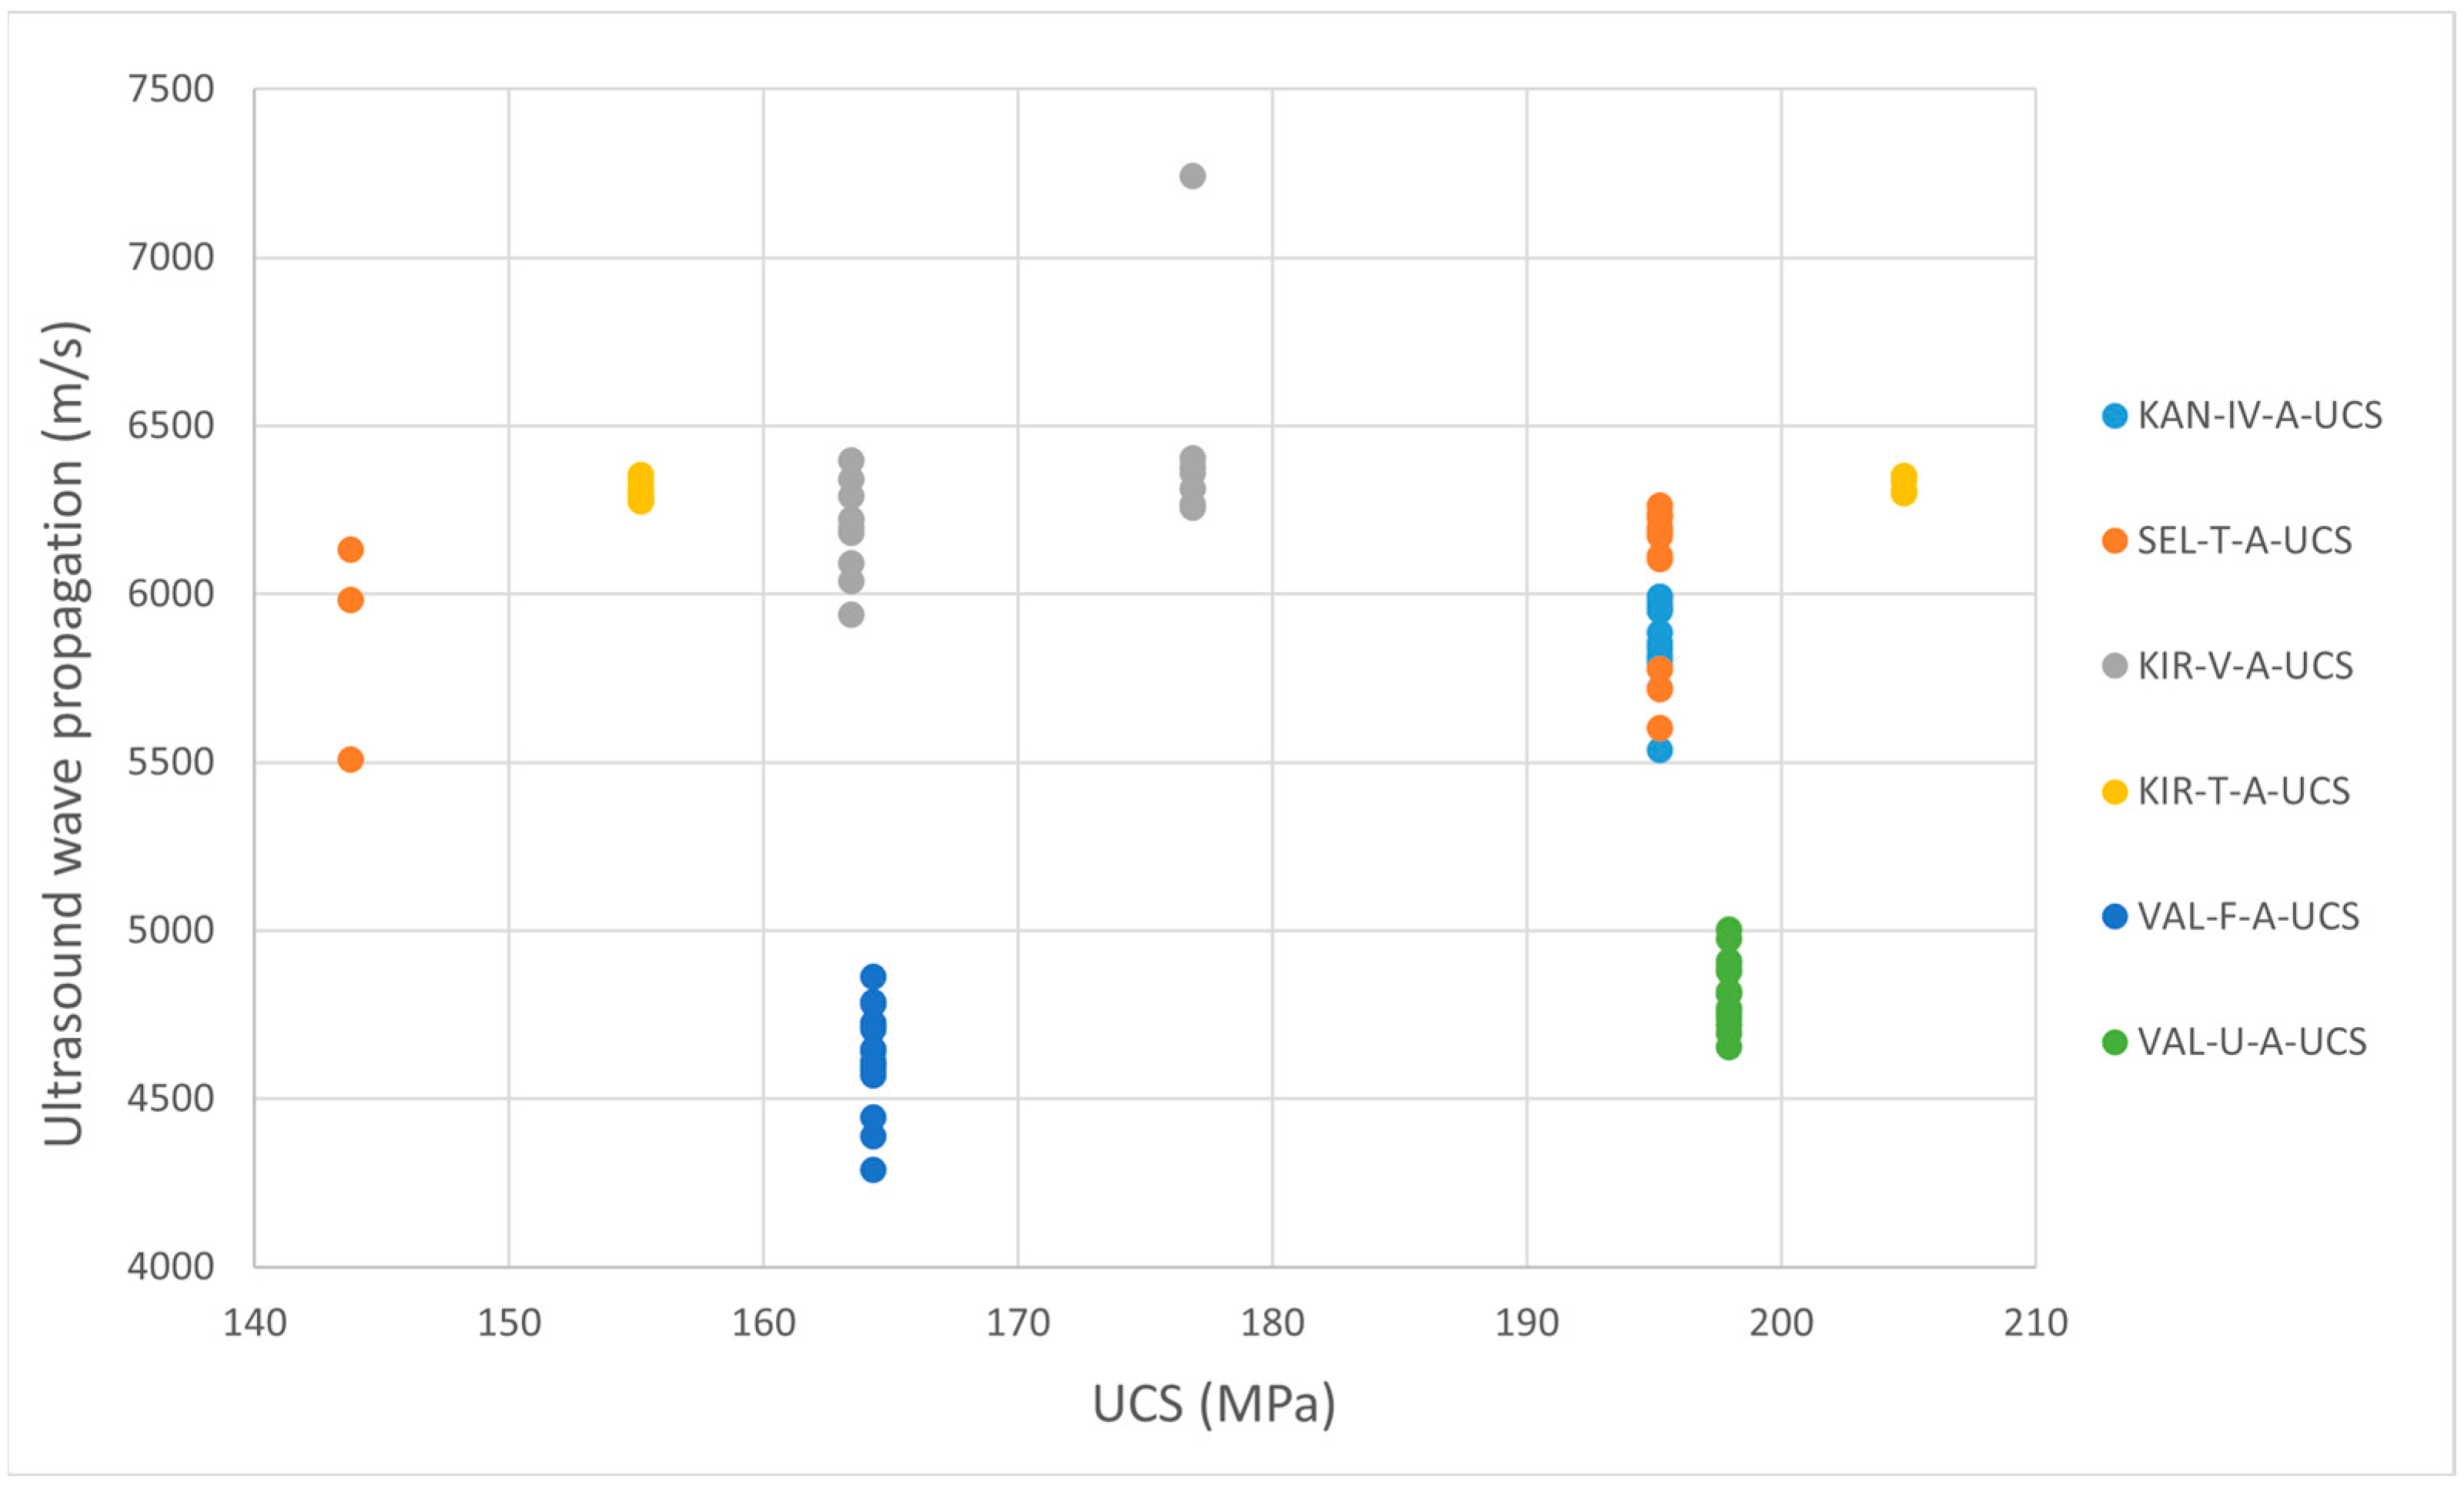
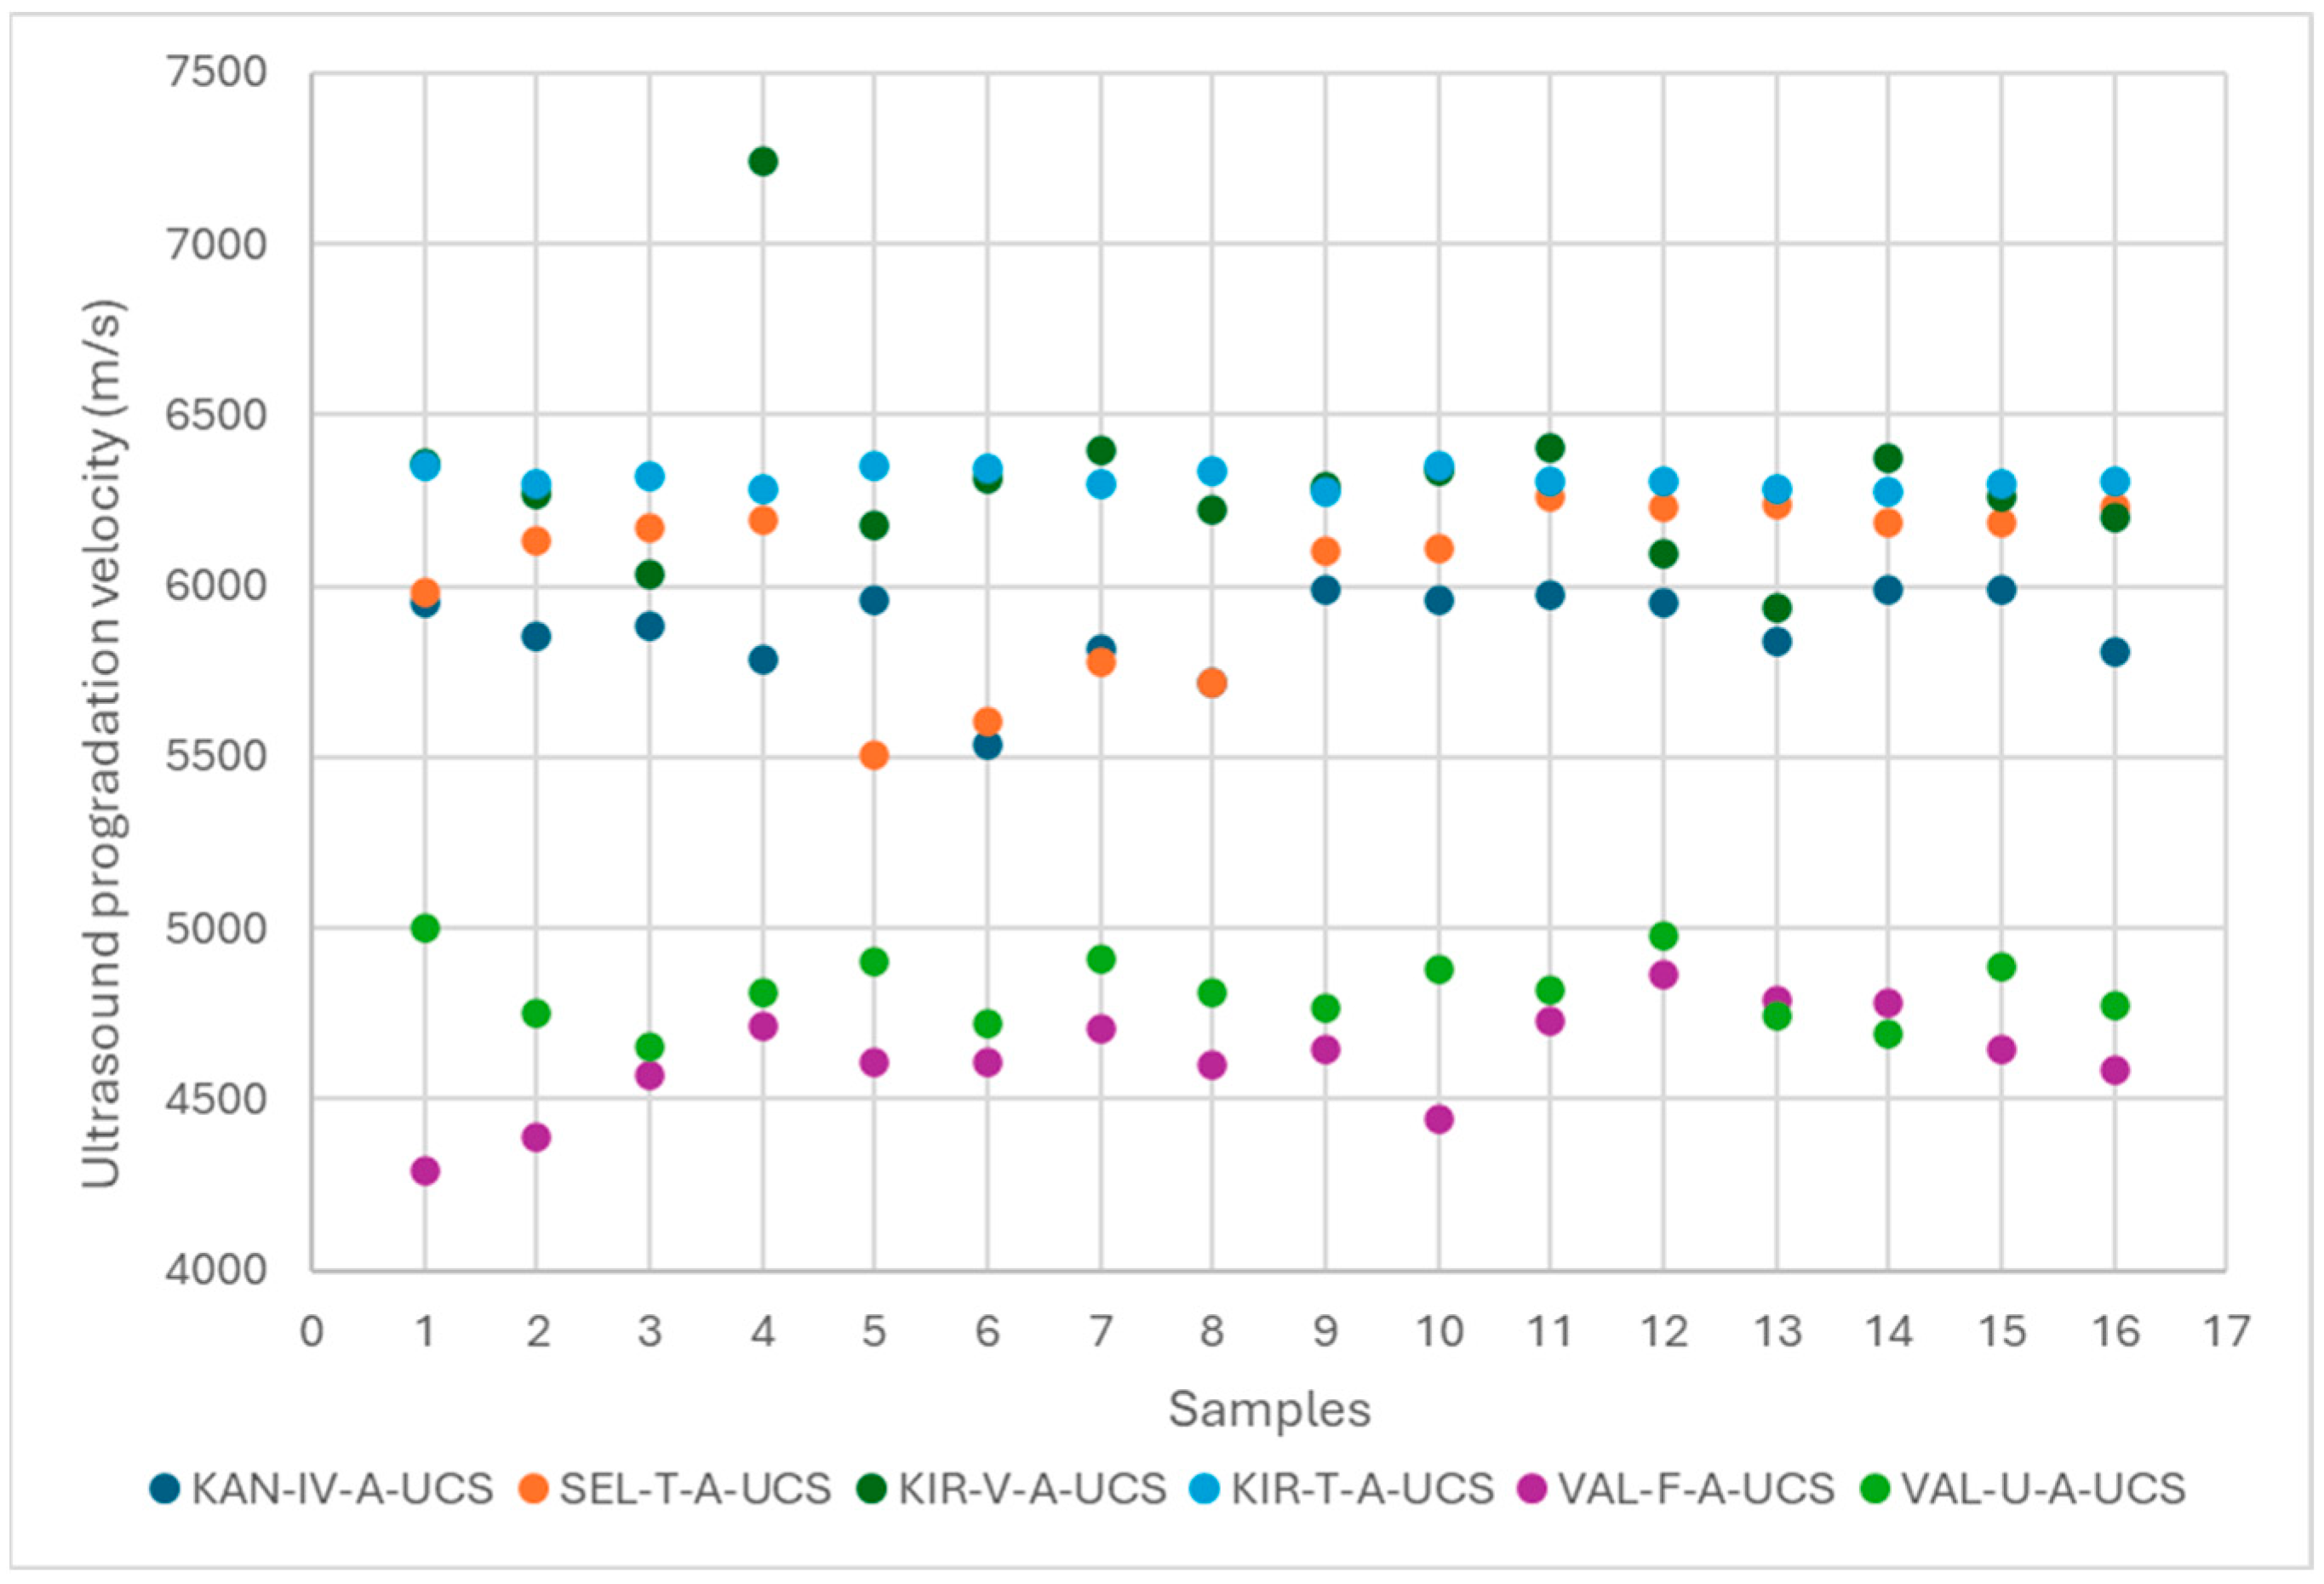
The results of the ultrasound propagation velocity measurements for all samples are presented in Table 3 and Figure 6. Among the six limestone varieties, Kirmenjak dark shows the highest mean ultrasound velocity (6312 m/s), while Valtura fiorito exhibits the lowest value (4622 m/s).
The mean ultrasound velocity for Kirmenjak bright is 6307 m/s, and for Kirmenjak dark, 6312 m/s. Although the mean values of the two Kirmenjak varieties are similar, their maximum and minimum values differ considerably. The maximum value for Kirmenjak bright is 7243 m/s, while for Kirmenjak dark, it is 6354 m/s, yielding a difference of 889 m/s. Likewise, the difference between the minimum values of the two varieties is 334 m/s. The standard deviation for Kirmenjak dark is 27, compared to 282 for Kirmenjak bright, reflecting the larger range of values in the bright variety, which spans 1303 m/s between its minimum and maximum. Both Kirmenjak varieties thus exhibit the highest and lowest standard deviation values among all the tested limestones.
The ultrasound velocity for Selina limestone averages 6040 m/s, whereas Kanfanar, a similar lithological type, has a mean value of 5876 m/s—a difference of 164 m/s. Although Selina displays higher mean and maximum values than Kanfanar, the minimum values show the opposite trend. The minimum velocity for Kanfanar is 5535 m/s, which is 28 m/s higher than that of Selina. The difference in standard deviation between these two varieties is 123.
Valtura fiorito and Valtura unito show the lowest ultrasound propagation velocities among all limestone varieties, with values of 4622 m/s and 4818 m/s, respectively. Additionally, the maximum values of both Valtura types are lower than the minimum values of the remaining four varieties. The difference between the maximum velocity of Valtura unito and the minimum value of Selina exceeds 500 m/s, while the gap between Valtura unito and Kirmenjak dark reaches 1271 m/s. Valtura fiorito also shows a higher standard deviation than the unito variety, 150 and 100, respectively.

3.3. Uniaxial Compressive Strength Calculations Using P-Wave Velocities

The uniaxial compressive strength (see Table 4) was calculated using the measured values of P-wave velocities using formulas from Table 1. According to the calculated UCS values, the highest values are shown by both Kirmenjak varieties, while the lowest average value is recorded for Valtura fiorito. The second lowest value is that of Valtura unito, while Kanfanar and Selina have medium UCS values. The maximum value is exhibited by Kirmenjak bright variety (204 MPa), whereas the minimum value is recorded for Valtura unito (43 MPa). The highest values for Kirmenjak dark and bright were obtained using the [18] formula (204 and 203 MPa), while the lowest values were calculated using the [19] formula (70 MPa for both varieties). According to the same formulas, the highest and lowest UCS values were obtained for the Kanfanar and Selina varieties. Only for both Valtura varieties were the maximum and minimum UCS values obtained using the formulas of [21,22], respectively.

3.4. Uniaxial Compressive Strength Estimation via Visual Determination

The samples were assigned parameter values based on the data presented in Table 2. The parameters and their corresponding values (see Table 5) are required for calculating the uniaxial compressive strength (see Table 5). The determined parameters are based on the samples’ fabric, porosity and defect status.
Kirmenjak bright can be divided into two groups. The first group (7 out of 16 samples) is characterized by a fabric value of 5.612, fracturing intensity of 12.15, porosity of 36.12, a fabric–defect interaction of –4.14 and a defect–porosity interaction of 5.43.
The second group of Kirmenjak bright samples (9 samples) differs in fracturing intensity, fabric–defect interaction and defect–porosity interaction, as these values are 0.
Kirmenjak dark also can be divided into two groups. The first group (6 out of 16 samples) is characterized by a fabric value of 33.17, fracturing intensity of 87.09, porosity of −22.73, a fabric–defect interaction of –67.43 and a defect–porosity interaction of 53.02. The second group of Kirmenjak dark samples (10 samples) differs in fracturing intensity (−12.01), fabric–defect interaction (−42.85) and defect–porosity interaction (77.88).
All 16 samples of Kanfanar have the same parameter values: fabric value of −55.04, fracturing intensity of −12.01, porosity of 36.12, a fabric–defect interaction of 53.48 and a defect–porosity interaction of 50.97.
Kanfanar and Selina samples are somewhat similar, as they share the same values for fabric (–55.04) and porosity (36.12). However, three Selina samples differ from the remaining Selina samples and from all Kanfanar samples. These three samples show a fracturing intensity of 12.15, a fabric–defect interaction of 23.40 and a defect–porosity interaction of 5.43.
Valtura fiorito and unito differ in their porosity and defect–porosity interaction. The porosity of the unito variety is 36.12, while that of the fiorito variety is –22.73. The defect–porosity interaction for unito is 10.52, and for fiorito, it is 35.72.
The calculated values of the uniaxial compressive strength (see Section 2.5) are presented in Table 6. The results for the Kirmenjak variety, both bright and dark, show that each type can be divided into two groups based on the obtained uniaxial compressive strength values. Kirmenjak dark shows higher values than the bright variety, with six samples reaching 205 MPa. Ten samples of Kirmenjak bright show the lowest values within the Kirmenjak group at 155 MPa.
Kanfanar samples show values of 195 MPa, while three Selina samples have the lowest value overall (144 MPa). Valtura unito shows values of UCS 34 MPa higher than the fiorito variety.

4. Discussion

4.1. Petrographic Characteristics

As petrographic properties influence physical and mechanical properties [1,3,5,7,8,9,10,11], it is important to determine all visual (macroscopic) and microscopic properties of samples. All analyzed rock samples from Istria are determined as limestones with various petrographic and physical–mechanical characteristics [43,44,45,46,47,48,49,50,51,52,53,54,55,56,57,58]. Since limestones exhibit considerable variation in visual characteristics, these samples are well suited for visual UCS estimation. Kirmenjak bright and Kirmenjak dark varieties (see Figure 4a,b) differ in micritic matrix amount, which prevail in the bright variety, while in the darker variety, a significant number of bioclasts and oncoids together with sparite cement have been detected. These differences are visible even at the macroscopic scale (see Figure 5a,b), where different fabric can be easily observed: mud-supported in the bright variety and determined as muddy, and clast-supported in the dark one, determined as having grainy fabric.
In the samples from Kanfanar and Selina, micritic zones with some algae and shell fragments alternate with restricted oncoid-rich zones (see Figure 4c,d). Tooth-shaped boundaries of sparite crystals are clearly visible, indicating recrystallization. Oncoid zones are macroscopically visible as darker interlayers within predominantly bright yellow rock (see Figure 5c,d). Since calcite crystals in the samples are clearly visible with the naked eye, both varieties are classified as “crystalline”. In Valtura unito and fiorito variety samples, micrite is present between fossil debris (see Figure 4e,f). Rudist shells (see Figure 5e,f) and shell fragments prevail, larger than 2 mm in fiorito and smaller than 2 mm in the unito variety. The fiorito variety is determined as coarse-grain-supported, and the unito variety as grain-supported and more compact, consequently with higher strength values expected. An important characteristic observed in the samples is cracking and defect (mainly stylolites) development, varying in amount and intensity. According to cracking intensity, two groups of Kirmenjak dark variety samples can be distinguished: weakly and moderately cracked, while Kirmenjak bright variety samples are distinguished as pronounced and highly pronounced. Selina variety samples are more homogeneous and, with prevailing moderate cracking intensity (only three samples showed pronounced cracking). Cracking intensity in Kanfanar variety samples is moderate and uniform, and in Valtura fiorito and unito varieties, it is weak and uniform. Generally, weakly cracked samples are expected to show higher strength values, and vice versa, although it is not the case for the Valtura samples.
According to the estimated porosity values, two groups of samples also can be distinguished: (1) low porosity varieties (Kanfanar, Selina, Kirmenjak bright and Valtura unito) and (2) moderate porosity varieties (Kirmenjak dark and Valtura fiorito). Generally, higher porosity values reduce the density of the rock, consequently influencing lower strength values for these varieties. By observing these characteristics, uniaxial compressive strength is calculated [32] for all varieties.

4.2. Ultrasound Wave Propagation with Calculated Uniaxial Compressive Strength

Due to the subjective nature of uniaxial compressive strength assessment [32], measurements of ultrasound propagation velocities through the samples were conducted. The purpose of these measurements was to determine the condition of the rock material and to compare the obtained values with the calculated uniaxial compressive strength to verify their accuracy. Table 7 presents the average velocities in relation to petrographic characteristics such as fabric, defect intensity and sample porosity.
According to the obtained results, the Valtura fiorito samples exhibit the lowest ultrasonic velocities (4622 m/s), while the dark Kirmenjak samples show the highest values (6312 m/s). These findings are consistent with the petrographic characteristics of the samples. The Valtura fiorito samples consist of the largest grains and are highly heterogeneous, making them the least compact. Consequently, their wave propagation velocities are the lowest.
The Valtura unito samples are more compact and homogeneous, which results in a slightly higher propagation velocity (4818 m/s) compared to the fiorito variety. The wave velocities measured in Kanfanar (5876 m/s) and Selina (6040 m/s) samples are higher than those in the Valtura samples. Although both have similar support characteristics, the velocities indicate that the Selina samples are more compact than the Kanfanar ones. Given that the samples exhibit similar crack intensities, the observed difference can be attributed to variations in grain size.
The Kirmenjak samples show the highest velocities, which is expected since they contain the smallest grains and are the most compact. The dark variety of Kirmenjak, on average, has slightly higher velocity (6312 m/s) than the bright variety (6307 m/s), even though the bright variety is considered more compact. An explanation may lie in the more pronounced and better-connected stylolites observed in the bright variety of Kirmenjak.
From the calculated values of uniaxial compressive strength, based on the visual assessment of rock characteristics and the velocities of ultrasonic P-waves, average values of UCS were determined for each variety. These values were then compared with data from [3]. The measured values of UCS are Kirmenjak 163 MPa, Kanfanar 165 MPa, Selina 162 MPa and for two Valtura varieties are 101 and 45 MPa [3]. It should be noted that some available data are average values for groups of varieties rather than for individual varieties. As shown in Table 5 and Table 7, the calculated values differ, in most cases, from the average values about varieties.
From the comparison between the calculated uniaxial compressive strength values—based on the visual assessment of rock characteristics—and the values from literature [3], certain deviations are evident. For samples of the Valtura variety, the strength values are significantly higher than usual, while for samples of the Kirmenjak variety, they are average. The Kanfanar and Selina samples, which are commercially classified as the Istrian yellow variety, show higher deviations from measured values.
The strength values calculated using P-wave velocity also show deviations from the usual strength values of the respective varieties. The most accurate results were obtained using formula [10], while formula [18] provided satisfactory values as well. The deviations observed when calculating strength based on velocity are most likely since these equations were tested on different rock types. Consequently, formulas with a lower exponent tend to yield more precise values for rocks with higher strength, whereas formulas with higher exponents provide more accurate results for rocks with lower strength.
Such deviations can be attributed to the inherent subjectivity involved in visually determining strength. Since the calculation of uniaxial compressive strength relies on the examiner’s assessment and ranking of the samples’ visual characteristics, it is possible for the same feature to be ranked differently across samples. The characteristics most prone to assessment error are the degree of cracking and the nature of defects, which can be observed in the enlarged images of the sample surfaces.
It can be observed that the visual differences between samples of the same variety are small, yet their crack intensities are assessed differently. Since these differences are subtle, it is possible for samples of the same variety to be assigned identical crack intensity ratings. When this occurs, the values used in the calculation can differ significantly, leading to large variations in the resulting uniaxial compressive strength.
Additional difficulties in the calculation may arise from the ratings taken from [32], which corresponds to specific characteristics. According to these ratings, samples with features such as moderate crack intensity should exhibit lower strength than samples with pronounced fracture resistance. However, this relationship does not always align with actual measurements. Similar inconsistencies appear when evaluating the combined influence of characteristics. For example, a sample with pronounced crack intensity and moderate porosity is predicted to have higher strength than a sample without defects and with low porosity, even though the latter is more compact.
These inconsistencies likely arise because the UCS calculation model relies on statistically derived factors based on a relatively limited dataset of specific sample types. An unbalanced statistical sample—meaning an insufficient number of samples representing certain characteristics—significantly reduces predictive accuracy. This also highlights the limitations of directly transferring statistically derived weights beyond their calibration domain. Therefore, the findings of this research should be used to contribute to the development of a more reliable prediction model.

4.3. Rock Material Strength Classes

To evaluate the effectiveness of the method for calculating uniaxial compressive strength based on the visual assessment of sample characteristics [32], a classification was carried out using both the calculated values and the values from literature [3]. According to the results of UCS calculated values, all samples were classified as strong [15] but also very strong [65,67]. Istrian yellow (Kanfanar and Selina) is classified as strong [15] and very strong [65,67], while Valtura is classified as strong rock according to all three classifications. Kirmenjak is classified as extremely strong [15] or very strong [65,67].
The data show that the Kanfanar and Selina (Istrian yellow) samples were correctly classified according to all three classification systems. The bright and dark Kirmenjak samples were correctly classified according to the [65,67] classifications. The Valtura samples, however, were correctly classified only according to the [15] classification.
The particularly poor performance of the method for the Valtura samples is attributed to their high internal heterogeneity despite the absence of visible defects. Large rudist fragments, variable shell orientation, and micrite–bioclast interfaces significantly affect both UCS and ultrasonic velocity but are insufficiently captured by the visual defect parameter. This demonstrates that the LFDP approach is less suitable for coarse, fossil-rich limestones, where internal fabric heterogeneity dominates strength behavior.
Discrepancies in rock classification based on uniaxial compressive strength values calculated from visual assessments of rock features can be attributed to the inherently subjective nature of such evaluations. To examine this, the calculated uniaxial compressive strength values were correlated with the ultrasonic P-wave velocity measured through the samples (see Figure 7). The graphical representation shows clear grouping of the Selina and Kanfanar samples, which are expected to be given their similar petrographic properties. The Valtura unito and fiorito samples exhibit similar P-wave velocity values but significantly different uniaxial compressive strength values. The dark and light Kirmenjak samples also have comparable P-wave velocities yet show substantial deviations in uniaxial compressive strength within the varieties themselves. These deviations are most likely a consequence of calculating uniaxial compressive strength based on visually assessed rock features. The Kanfanar and Selina samples were correctly classified according to all three classification systems. The dark and light Kirmenjak samples were correctly classified according to two of the three systems, whereas the Valtura fiorito and unito samples were correctly classified according to only one. This indicates that despite its limitations, visual determination of uniaxial compressive strength can be relatively successful for rocks with actual strength values exceeding 100 MPa.

5. Conclusions

This study evaluated visual rock characterization as a rapid method for estimating relative uniaxial compressive strength (UCS) of Istrian limestone. A total of 96 samples from six limestone varieties quarried in Istria (Croatia) were analyzed using visual assessment, micropetrography, ultrasonic P-wave velocity measurements, and UCS estimation models.
To test the reliability of the method, macro and micropetrographic analysis, measurements of P-wave velocity and uniaxial compressive strength calculation over measured velocities were performed together with visual determination of the rock strength. Obtained results were classified according to calculated values of uniaxial compressive strength, using visual recognition of characteristics and measured uniaxial compressive strength velocities. By using estimated uniaxial compressive strength values calculated from visual characteristics of the rock, Kanfanar and Selina varieties were correctly classified in all three classifications, while Valtura varieties were correctly classified only according to one classification.
The results indicate that visual assessment provides reliable UCS classification for hard carbonate rocks (approximately > 100 MPa). Reliability decreases for heterogeneous and more porous lithologies, where internal heterogeneity may govern strength behavior more strongly than macroscopic discontinuities. Therefore, further calibration using laboratory-measured UCS values and expansion of the statistical dataset are required. Extension of this approach to other sedimentary, igneous, and metamorphic rocks is also recommended.

Author Contributions

Conceptualization, A.M., D.P. and U.B.; methodology, T.B. and D.P.; validation, T.B. and D.P.; formal analysis, A.M., T.B. and D.P.; investigation, A.M., T.B., D.P. and U.B.; data curation, T.B.; writing—original draft preparation, A.M.; writing—review and editing, A.M., D.P. and U.B. All authors have read and agreed to the published version of the manuscript.

Funding

This research received no external funding.

Data Availability Statement

Data available on request due to privacy restrictions. The data presented in this study are available on request from the authors.

Acknowledgments

Authors would like to thank Vlatko Gulam. Submission is supported by the project Geomat, Matematička istraživanja u geologiji/Mathematical researchings in geology”) nr. 581100002. Analyses presented in this article were a part of Tin Berghaus’s MS thesis.

Conflicts of Interest

The authors declare no conflicts of interest.

References

  1. Winkler, E. Stone in Architecture: Properties, Durability; Springer Science & Business Media: Berlin/Heidelberg, Germany, 1997; ISBN 3540576266. [Google Scholar]
  2. Amirkiyaei, V.; Ghasemi, E.; Faramarzi, L. Estimating uniaxial compressive strength of carbonate building stones based on some intact stone properties after deterioration by freeze–thaw. Environ. Earth Sci. 2021, 80, 352. [Google Scholar] [CrossRef] [Scilit]
  3. Briševac, Z.; Maričić, A.; Kujundžić, T.; Hrženjak, P. Saturation Influence on Reduction of Compressive Strength for Carbonate Dimension Stone in Croatia. Minerals 2023, 13, 1364. [Google Scholar] [CrossRef] [Scilit]
  4. Xie, W.-Q.; Liu, X.-L.; Zhang, X.-P.; Liu, Q.-S.; Wang, E.-Z. A review of test methods for uniaxial compressive strength of rocks: Theory, apparatus and data processing. J. Rock Mech. Geotech. Eng. 2025, 17, 1889–1905. [Google Scholar] [CrossRef] [Scilit]
  5. Bell, F.G.; Culshaw, M.G. Petrographic and Engineering Properties of Sandstones from the Sneinton Formation, Nottinghamshire, England. Q. J. Eng. Geol. Hydrogeol. 1998, 31, 5–19. [Google Scholar] [CrossRef] [Scilit]
  6. Hawkins, A. Aspects of rock strength. Bull. Eng. Geol. Environ. 1998, 57, 17–30. [Google Scholar] [CrossRef] [Scilit]
  7. Tugrul, A.; Zarif, I.H. Correlation of mineralogical and textural characteristics with engineering properties of selected granitic rocks from Turkey. Eng. Geol. 1999, 51, 303–317. [Google Scholar] [CrossRef] [Scilit]
  8. Prikryl, R. Some microstructural aspects of strength variation in rocks. Int. J. Rock Mech. Min. Sci. 2001, 38, 671–682. [Google Scholar] [CrossRef] [Scilit]
  9. Přikryl, R. Assessment of rock geomechanical quality by quantitative rock fabric coefficients: Limitations and possible source of misinterpretations. Eng. Geol. 2006, 87, 149–162. [Google Scholar] [CrossRef] [Scilit]
  10. Török, Á.; Vásárhelyi, B. The influence of fabric and water content on selected rock mechanical parameters of travertine, examples from Hungary. Eng. Geol. 2010, 115, 237–245. [Google Scholar] [CrossRef] [Scilit]
  11. Güneş Yılmaz, N.; Mete Goktan, R.; Kibici, Y. Relations between some quantitative petrographic characteristics and mechanical strength properties of granitic building stones. Int. J. Rock Mech. Min. 2011, 48, 506–513. [Google Scholar] [CrossRef] [Scilit]
  12. Ajalloeian, R.; Mansouri, H.; Baradaran, E. Some carbonate rock texture effects on mechanical behavior, based on Koohrang tunnel data, Iran. Bull. Eng. Geol. Environ. 2017, 76, 295–307. [Google Scholar] [CrossRef] [Scilit]
  13. Lakirouhani, A.; Asemi, F.; Zohdi, A.; Medzvieckas, J.; Kliukas, R. Physical parameters, tensile and compressive strength of dolomite rock samples: Influence of grain size. J. Civ. Eng. Manag. 2020, 26, 789–799. [Google Scholar] [CrossRef] [Scilit]
  14. Xie, H.; Yu, T.; Lin, P.; Wang, Z.; Xu, Z. Effect of petrographic characteristics on uniaxial compressive strength of granitic rocks from Xinjiang, China. J. Cent. South Univ. 2023, 30, 2340–2359. [Google Scholar] [CrossRef] [Scilit]
  15. Bieniawski, Z.T.; Bernede, M.J. Suggested Methods for Determining the Uniaxial Compressive Strength and Deformability of Rock Materials: Part 1. Suggested Method for Determining Deformability of Rock Materials in Uniaxial Compression. Int. J. Rock Mech. Min. Sci. Geomech. Abstr. 1979, 16, 138–140. [Google Scholar] [CrossRef] [Scilit]
  16. EN 1926:2006; Natural Stone Test Methods—Determination of Uniaxial Compressive Strength. European Committee for Standardization: Brussels, Belgium, 2006; 18p.
  17. Bieniawski, Z.T. Estimating the strength of rock materials. J. S. Afr. Inst. Min. Metall. 1974, 74, 312–320. [Google Scholar] [CrossRef] [Scilit]
  18. Kılıç, A.; Teymen, A. Determination of mechanical properties of rocks using simple methods. Bull. Eng. Geol. Environ. 2008, 67, 237–244. [Google Scholar] [CrossRef] [Scilit]
  19. Babacan, A.E.; Ersoy, H.; Gelişli, K. Determination of physical, mechanical and elastic properties of the rocks with ultrasonic velocity technique and time–frequency analysis: A case study on the beige limestones (NE Turkey). Jeoloji Mühendisliği Derg. 2012, 36, 63–73. [Google Scholar]
  20. Karakul, H.; Ulusay, R. Empirical Correlations for Predicting Strength Properties of Rocks from P-Wave Velocity Under Different Degrees of Saturation. Rock Mech. Rock Eng. 2013, 46, 981–999. [Google Scholar] [CrossRef] [Scilit]
  21. Azimian, A. Application of statistical methods for predicting uniaxial compressive strength of limestone rocks using non-destructive tests. Acta Geotech. 2017, 12, 321–333. [Google Scholar] [CrossRef] [Scilit]
  22. Briševac, Z.; Hrženjak, P.; Cotman, I. Estimate of Uniaxial Compressive Strength and Young’s Moduls of the Elasticity of the Natural Stone Giallo d’Istria. Procedia Eng. 2017, 191, 434–441. [Google Scholar] [CrossRef] [Scilit]
  23. İnce, İ.; Bozdağ, A.; Fener, M.; Kahraman, S. Estimation of uniaxial compressive strength of pyroclastic rocks (Cappadocia, Turkey) by gene expression programming. Arab. J. Geosci. 2019, 12, 756. [Google Scholar] [CrossRef] [Scilit]
  24. Aldejare, A.E. Evaluation of empirical estimation of uniaxial compressive strength of rock using measurements from index and physical tests. J. Rock Mech. Geotech. Eng. 2019, 12, 256–268. [Google Scholar] [CrossRef] [Scilit]
  25. Kahraman, S. Evaluation of simple methods for assessing the uniaxial compressive strength of rock. Int. J. Rock Mech. Min. Sci. 2001, 38, 981–994. [Google Scholar] [CrossRef] [Scilit]
  26. Yilmaz, I.; Sendir, H. Correlation of Schmidt hardness with unconfined compressive strength and Young’s modulus in gypsum from Sivas (Turkey). Eng. Geol. 2002, 66, 211–219. [Google Scholar] [CrossRef] [Scilit]
  27. Yasar, E.; Erdogan, Y. Correlating sound velocity with the density, compressive strength and Young’s modulus of carbonate rocks. Int. J. Rock Mech. Min. 2004, 41, 871–875. [Google Scholar] [CrossRef] [Scilit]
  28. Sharma, P.K.; Singh, T.N. A correlation between P-wave velocity, impact strength index, slake durability index and uniaxial compressive strength. Bull. Eng. Geol. Environ. 2008, 67, 17–22. [Google Scholar] [CrossRef] [Scilit]
  29. Mohamad, E.T.; Armaghani, D.J.; Momeni, E.; Abad, S.V.A.N. Prediction of the unconfined compressive strength of soft rocks; a PSO-based ANN approach. Bull. Eng. Geol. Environ. 2015, 74, 745–757. [Google Scholar] [CrossRef] [Scilit]
  30. Aboutaleb, S.; Bagherpour, R.; Behnia, M.; Aghababaei, M. Combination of the physical and ultrasonic tests in estimating the uniaxial compressive strength and Young’s modulus of intact limestone rocks. Geotech. Geol. Eng. 2017, 35, 3015–3023. [Google Scholar] [CrossRef] [Scilit]
  31. Uyanık, O.; Sabbağ, N.; Uyanık, N.A.; Öncü, Z. Prediction of mechanical and physical properties of some sedimentary rocks from ultrasonic velocities. Bull. Eng. Geol. Environ. 2019, 78, 6003–6016. [Google Scholar] [CrossRef] [Scilit]
  32. Pollak, D.; Gulam, V.; Bostjančić, I. A visual determination method for uniaxial compressive strength estimation based on Croatian carbonate rock materials. Eng. Geol. 2017, 231, 68–80. [Google Scholar] [CrossRef] [Scilit]
  33. Dehghan, S.; Sattari, G.; Chehreh Chelgani, S.; Aliabadi, M.A. Prediction of uniaxial compressive strength and modulus of elasticity for Travertine samples using regression and artificial neural networks. Min. Sci. Technol. 2010, 20, 41–46. [Google Scholar] [CrossRef] [Scilit]
  34. Xu, B.; Tan, Y.; Sun, W.; Ma, T.; Liu, H.; Wang, D. Study on the Prediction of the Uniaxial Compressive Strength of Rock Based on the SSA-XGBoost Model. Sustainability 2023, 15, 5201. [Google Scholar] [CrossRef] [Scilit]
  35. Xie, H.; Lin, P.; Kang, J.; Zhai, C.; Du, Y. Prediction Method of Rock Uniaxial Compressive Strength Based on Feature Optimization and SSA-XGBoost. Sustainability 2024, 16, 8460. [Google Scholar] [CrossRef] [Scilit]
  36. Dunham, R.J. Classification of carbonate rocks according to depositional texture. In Ham: Classification of Carbonate Rocks; American Association of Petroleum Geologists AAPG/Datapages: Tulsa, OK, USA, 1962; pp. 108–121. [Google Scholar] [CrossRef] [Scilit]
  37. Embry, A.F.; Klovan, J.E. Absolute water depth limits of Late Devonian Paleoecological zones. Geol. Rundsch. 1972, 61, 672–686. [Google Scholar] [CrossRef] [Scilit]
  38. Folk, R.L. Practical petrographic classification of limestones. AAPG Bull. 1959, 43, 1–38. [Google Scholar] [CrossRef] [Scilit]
  39. Folk, R.L. Spectral subdivision of limestone types. In Classification of Carbonate Rocks; AAPG: Tulsa, OK, USA, 1962; pp. 62–84. [Google Scholar]
  40. Šprem, K. Micropetrography as a Key Preliminary Tool for Addressing Provenance Issues: Insights from a Roman Istria Case Study (Croatia). Minerals 2024, 14, 1233. [Google Scholar] [CrossRef] [Scilit]
  41. Dilaria, S.; Bonetto, J.; Germinario, L.; Previato, C.; Girotto, C.; Mazzoli, C. The stone artifacts of the National Archaeological Museum of Adria (Rovigo, Italy): A noteworthy example of heterogeneity. Archaeol. Anthropol. Sci. 2024, 16, 14. [Google Scholar] [CrossRef] [Scilit]
  42. Zanier, K.; Brajkovič, R.; Gale, L.; Novak, M. Stone products of the Roman municipium of Neviodunum, Pannonia (modern Drnovo, Slovenia). Archaeometry 2025, 67, 284–312. [Google Scholar] [CrossRef] [Scilit]
  43. Tišljar, J.; Vlahović, I.; Velić, I.; Matičec, D. Carbonate facies evolution from the Late Albian to Middle Cenomanian in Southern Istria (Croatia): Influence of sinsedimentary tectonics and extensive organic carbonate production. Facies 1998, 38, 137–152. [Google Scholar] [CrossRef] [Scilit]
  44. Vlahović, I.; Tišljar, J. (Eds.) Evolution of Depositional Environments from the Palaeozoic to the Quaternary in the Karst Dinarides and the Pannonian Basin; 22nd IAS Meeting of Sedimentology (Opatija 2003)—Field Trip Guidebook; IGI: Zagreb, Croatia, 2003; 256p. [Google Scholar]
  45. Vlahović, I.; Tišljar, J.; Velić, I.; Matičec, D. Evolution of the Adriatic Carbonate Platform: Palaeogeography, main events and depositional dynamics. Palaeogeogr. Palaeoclimatol. Palaeoecol. 2005, 220, 333–360. [Google Scholar] [CrossRef] [Scilit]
  46. Cvetko Tešović, B.; Glumac, B.; Bucković, D. Integrated Biostratigraphy and Carbon Isotope Stratigraphy of the Lower Cretaceous (Barremian to Albian) Adriatic-Dinaridic Carbonate Platform Deposits in Istria, Croatia. Cretac. Res. 2011, 32, 301–324. [Google Scholar] [CrossRef] [Scilit]
  47. Hećimović, I.; HGI-CGS. Geological Map of the Republic of Croatia at a scale 1:300,000. Kartogr. I Geoinformacije (Cartogr. Geoinf.) 2010, 9, 126–132. [Google Scholar]
  48. Cvetko Tešović, B.; Mezga, A.; Glumac, B. Stable Isotope Analysis of Upper Tithonian Limestones with Dinosaur Footprints from Kirmenjak Quarry (Istria, Croatia). Geol. Croat. 2008, 61, 3–9. [Google Scholar] [CrossRef] [Scilit]
  49. Radoičić, R. Some problematic microfossils from the Dinarian Cretaceous. Vesnik Zavoda za Geološka i Geofizička Istraživanja NR Srbije 1959, 17, 87–92. [Google Scholar]
  50. Velić, I.; Matičec, D.; Vlahović, I.; Tišljar, J. Stratigraphic succession of Jurassic and Lower Cretaceous Carbonates (Bathonian–Upper Albian) in Western Istria (Excursion A). In 1st Croatian Geological Congress; Vlahović, I., Velić, I., Eds.; Excursion GuideBook: Zagreb, Croatia, 1995; pp. 31–66. [Google Scholar]
  51. Vlahović, I.; Tišljar, J.; Velić, I.; Matičec, D.; Skelton, P.W.; Moro, A.; Korbar, T. Aptian deposits with requieniids below a Late Aptian-Early Albian regional emersion surface (Kanfanar and Dvigrad, Central Istria). In 6th Int. Congress on Rudists—Rovinj 2002. Abstracts and Excursion Guidebook; IGI: Zagreb, Croatia, 2002; pp. 95–100. [Google Scholar]
  52. Crnković, B. Dimension stone deposits in Croatia. Rudarsko-Geološko-Naftni Zb. 1993, 5, 1. [Google Scholar]
  53. Tišljar, J.; Vlahović, I.; Skelton, P.W.; Moro, A.; Korbar, T.; Velić, I. Turonian vast production and progradation of rudist shells and debris (Valtura Quarry, Southern Istria). In 6th Int. Congress on Rudists—Rovinj 2002. Abstracts and Excursion Guidebook; IGI: Zagreb, Croatia, 2002; pp. 129–132. [Google Scholar]
  54. Buršić, M.Š.; Aljinović, D.; Cancelliere, S. Kirmenjak-Pietra d’Istria: A Preliminary Investigation of Its Use in Venetian Architectural Heritage. Geol. Soc. Lond. Spec. Publ. 2007, 271, 63–68. [Google Scholar] [CrossRef] [Scilit]
  55. Tomašić, I.; Lukić, D.; Peček, N.; Kršinić, A. Dynamics of Capillary Water Absorption in Natural Stone. Bull. Eng. Geol. Environ. 2011, 70, 673–680. [Google Scholar] [CrossRef] [Scilit]
  56. Fio Firi, K.; Maričić, A. Usage of the Natural Stones in the City of Zagreb (Croatia) and Its Geotouristical Aspect. Geoheritage 2020, 12, 62. [Google Scholar] [CrossRef] [Scilit]
  57. Tišljar, J.; Vlahović, I.; Matičec, D.; Velić, I. Platform Facies from the Upper Tithonian to Upper Albian in Western Istria and Transition into Tempestite, Clinoform and Rudist Biolithite facies of the Lower Cenomanian in Southern Istria, Excursion B. In 1st Croatian Geological Congress; Vlahović, I., Velić, I., Eds.; Excursion GuideBook: Zagreb, Croatia, 1995; pp. 67–110. [Google Scholar]
  58. Velić, I.; Vlahović, I. Vodič Ekskurzija Prvog Hrvatskog Geološkog Kongresa; 1995; p. 182. [Google Scholar]
  59. Evamy, B.D.; Sherman, D.J. The application of chemical staining techniques to the study of diagenesis in limestones. Proc. Geol. Soc. Lond. 1962, 1599, 102. [Google Scholar]
  60. EN 12407:2019; Natural Stone Test Methods—Petrographic Examination. European Committee for Standardization: Brussels, Belgium, 2019; 21p.
  61. ISRM. The Complete ISRM Suggested Methods for Rock Characterization, Testing and Monitoring: 1974–2006. In Suggested Methods Prepared by the Commission on Testing Methods; Ulusay, R., Hudson, J.A., Eds.; International Society for Rock Mechanics, Compilation Arranged by the ISRM Turkish National Group: Ankara, Turkey, 2007. [Google Scholar]
  62. EN 14579:2008; Natural stone test methods—Determination of sound speed propagation. European Committee for Standardization: Brussels, Belgium, 2008; 13p.
  63. Aydin, A. Upgraded ISRM Suggested Method for Determining Sound Velocity by Ultrasonic Pulse Transmission Technique. Rock Mech. Rock Eng. 2014, 47, 255–259. [Google Scholar] [CrossRef] [Scilit]
  64. ISRM. Suggested methods for petrographic description of rocks. Int. J. Rock Mech. Min. Sci. Abstr. 1978, 15, 43–45. [Google Scholar] [CrossRef] [Scilit]
  65. ISO 14689:2017; Geotechnical Investigation and Testing—Identification and Classification of Rock. International Organization for Standardization: Geneva, Switzerland, 2017; p. 21.
  66. Barton, N.; Choubey, V. The shear strength of rock joints in theory and practice. Rock Mech. 1977, 10, 1–54. [Google Scholar] [CrossRef] [Scilit]
  67. IAEG. Classification of Rocks and Soils for Engineering Geological Mapping Part 1: Rock and Soil Materials. Bull. Int. Assoc. Eng. Geol. 1979, 19, 355–371. [Google Scholar] [CrossRef] [Scilit]
Figure 1. Basic Geological Map of Croatia 1:300,000—Istra region [47]. J3—Upper Jurassic carbonate rocks; K1—Lower Cretaceous carbonate rocks; K21–6—Upper Cretaceous carbonate rocks; ?Pc, E1,2—Paleocene–Eocene foraminiferal limestones; E2,3—Middle/Upper Eocene flysch deposits; aQ2—Quaternary alluvial deposits; tsQ2—Quaternary terra rosa deposits. The arrows mark sampling locations (quarries).
Minerals 16 00156 g001
Figure 2. Measuring of the ultrasonic wave velocity through the sample.
Minerals 16 00156 g002
Figure 3. Samples with marked imaging intervals.
Minerals 16 00156 g003
Figure 4. (af) Microphotographs of the analyzed Istrian limestones. Red coloration of calcite is due to staining procedure after [59]. (a) Bright variety of pale yellow Kirmenjak limestone showing homogeneous micritic fabric with some veins and cracks filled with sparitic calcite. (b) Dark variety of the Kirmenjak limestone showing grain-supported fabric with visible oncoids and laminated transition into the bright variety. (c) Kanfanar limestone (oncomicrudite/oncosparudite) showing oncoids made of Baccinella irregularis Radoičić 1959 [49] (blue arrows). (d) Selina limestone showing various bioclasts (algae, foraminifera and shells) within micrite. (e) Fiorito variety of the Valtura limestone (biomicrudite) showing rudist shell fragments (blue arrows). (f) Unito variety of the Valtura limestone (biomicrite) showing small (up to 2 mm) rudist shell fragments (blue arrows).
Minerals 16 00156 g004
Figure 5. (af) Photographs of developed mantles from the cores of Istrian limestones. (a) Kirmenjak bright limestone with sparite veins and cracks. (b) Kirmenjak dark oncoidal laminated limestone. (c) Kanfanar limestone oncoidal. (d) Selina bioclastic limestone. (e) Valtura fiorito rudist limestone. (f) Valtura unito bioclastic rudist limestone.
Minerals 16 00156 g005
Figure 6. Graphical presentation of ultrasound wave propagation through the samples.
Minerals 16 00156 g006
Figure 7. Graphical presentation of ultrasound wave propagation (m/s) vs. estimated UCS (MPa).
Minerals 16 00156 g007
Table 1. Equations for estimating the values of uniaxial compressive strength via P-wave velocity.
ReferenceEquationsRock Types
[10]UCS = 0.5474 × Vp3.109 (R2 = 0.828)travertine
[18]UCS = 2.304 × Vp2.4315 (R2 = 0.94)various (10 igneous, 7 sedimentary, 2 metamorphic)
[19]UCS = 0.012 × Vp-5.955 (R2 = 0.792)limestones
[21]UCS = 0.009 × Vp1.105 (R2 = 0.919)limestones
[22]UCS = 1.5991 × e0.7112*Vp (R2 = 0.5391)limestones
Table 2. Visual characteristics of samples: bright and dark Kirmenjak variety (KIR-V-A, KIR-T-A), Kanfanar (KAN-IV-A), Selina (SEL-T-A), Valtura fiorito and unito variety (VAL-F-A and VAL-U-A). Categories according to [32].
Sample
Description
FabricType of
Defect
Defect Intensity
(1–5)
Roughness
(1–5)
Weathering
(1–5)
Filling
(1–5)
Porosity
KIR-V-AMuddyVeins 4–5 2–332Low
KIR-T-AGrainyCracks2–3332Moderate
KAN-IV-ACrystallineVeins332–32Low
SEL-T-ACrystallineCracks3–422–32Low
VAL-F-A-Coarse-grainedNo defects1111Moderate
VAL-U-ACoarse-grainedNo defects1111Low
Table 3. Values of P-wave propagation velocity (m/s) throughout the samples.
SamplesKIR-V-AKIR-T-AKAN-IV-ASEL-T-AVAL-F-AVAL-U-A
Average (m/s)630763125876604046224818
Max724363545991626448625003
Min594062745535550742894654
St. Dev.28227124247150100
Table 4. Calculated average values of UCS (MPa) via the measured values of P-wave velocities. For UCS calculation, equations by [10,18,19,21,22] were used.
Average Values of UCS Calculated (MPa) by Equations from LiteratureKIR-V-AKIR-T-AKAN-IV-ASEL-T-AVAL-F-AVAL-U-A
[10]1691681351476473
[18]20420317118395106
[19]707065675052
[21]142142132136101106
[22]1451421051194349
Table 5. Main sample parameters and parameter values required for uniaxial compressive strength calculation according to formula 2.
SamplesNo of
Samples
FabricFracturing IntensityPorosityFabric–Defect InteractionDefect–Porosity Interaction
KIR-V-A75.61212.1536.12−4.145.43
95.612036.1200
KIR-T-A633.1787.09−22.73−67.4353.02
1033.17−12.01−22.73−42.8577.88
KAN-IV-A16−55.04−12.0136.1253.4850.97
SEL-T-A13−55.04−12.0136.1253.4850.97
3−55.0412.1536.1223.405.43
VAL-F-A16−38.1267.73−22.73035.72
VAL-U-A16−38.1267.7336.12010.52
Table 6. Results of calculation of uniaxial compressive strength (UCS) of samples according to formula 2. Values of UCS (MPa) are taken from [3].
SamplesNo of SamplesEstimated UCS (MPa)Measured
UCS (MPa) Values from [3]
KIR-V-A7177163
9163
KIR-T-A6205
10155
KAN-IV-A16195165
SEL-T-A13195162
3144
VAL-U-A16198101
VAL-F-A1616445
Table 7. Mean values of ultrasound wave propagation and mean values of calculated UCS connected to the petrographic properties.
Petrographic
Characteristics
Samples/
No of Samples
No of SamplesUltrasound Wave Propagation (m/s)Calculated UCS (MPa)
FabricCrystallineKanfanar; Selina325958190
Coarse-grainedValtura fiorito; Valtura unito324721181
MuddyKirmenjak bright166307174
GrainyKirmenjak dark166313169
Defect intensityNo defectsValtura fiorito; Valtura unito324721181
WeakKirmenjak dark66325169
ModerateKirmenjak dark; Kanfanar; Selina396054183
StrongSelina; Kirmenjak bright106285184
Very strongKirmenjak bright96189174
PorosityLowKirmenjak bright; Kananar; Selina; Valtura unito645761188
ModerateKirmenjak dark; Valtura fiorito325467166
Disclaimer/Publisher’s Note: The statements, opinions and data contained in all publications are solely those of the individual author(s) and contributor(s) and not of MDPI and/or the editor(s). MDPI and/or the editor(s) disclaim responsibility for any injury to people or property resulting from any ideas, methods, instructions or products referred to in the content.