Abstract
Tailings sand primarily consists of fine sand, silt, and other non-cohesive soil particles. Due to its persistent saturation, it exhibits a high susceptibility to liquefaction under dynamic loading or fluctuating groundwater conditions, potentially leading to engineering failures such as foundation instability and slope failure. This study focuses on a representative tailings pond located in the northwest region of China. A series of geotechnical laboratory tests were conducted to investigate the fundamental physical and mechanical properties of tailings sand. The test results indicate that moisture content increases gradually with depth and stabilizes beyond a certain depth, while dry density decreases approximately linearly with increasing depth. Owing to the presence of certain metallic minerals, the specific gravity of tailings sand materials is slightly higher than that of conventional standard sand. Particle-size analysis reveals that the non-uniformity coefficient ranges from 2.04 to 3.1, and the coefficient of curvature varies between 0.72 and 0.97, indicating poor gradation. Compaction testing determined an optimum moisture content of 13.59%, corresponding to a maximum dry density of 1.868 g/cm3. Soil-water characteristic curve analysis shows that larger particle sizes are associated with enhanced drainage capacity and lower suction requirements. An increase in dry density significantly reduces the drainage rate but has a limited effect on the matric suction at the residual stage. This research provides valuable insights into the engineering behavior of tailings sand, supports the assessment of its performance in foundation applications, and offers practical guidance for the stabilization of and improvement in tailings sand foundations.
1. Introduction
Tailings sand, a typical form of industrial solid waste, is predominantly composed of fine-grained materials like silty sand and silt, often in a highly saturated state. Its depositional behavior—shaped by discharge methods, hydraulic sorting, and sedimentation conditions—exhibits high complexity, resulting in significant spatial and depth-related heterogeneity in engineering properties. As a result, tailings sand is commonly categorized as a soft soil foundation with distinctive geotechnical characteristics [1,2,3,4,5,6,7]. Research into its resource utilization represents a vital pathway for developing green, low-carbon construction materials.
From a physical standpoint, tailings sand typically exhibits low cohesion and a high susceptibility to liquefaction, generally existing in a saturated and loose state. Its particle composition is relatively uniform, with a narrow gradation distribution and a relatively high proportion of fine particles. Moreover, due to the frequent presence of heavy metal mineral constituents, its specific gravity is generally higher than that of natural sandy soils [8,9,10,11,12,13,14,15,16]. Current academic research on tailings sand primarily focuses on its liquefaction behavior, shear strength, and deformation characteristics under static and dynamic loading conditions. These investigations provide critical insights into the stability assessment and disaster mitigation of tailings dams. For instance, Shi et al. [17] incorporated iron tailings powder and iron tailings sand at varying substitution ratios to replace cement and quartz sand in ultra-high-performance concrete (UHPC), systematically evaluating their effects on mechanical properties, microstructure, hydration products, durability, and environmental impact. Xu et al. [18] investigated the feasibility of using kaolin tailings sand as a substitute for natural river sand in cement mortar and concrete production. Material characterization tests indicated that kaolin tailings sand contained a high quartz content and possessed physical properties comparable to those of natural river sand. The fresh and hardened properties of mortar and concrete incorporating different proportions of kaolin tailings sand were experimentally determined. Zhang et al. [19] examined the shrinkage behavior of concrete made with iron tailings sand treated by three different methods, compared with river sand concrete, while monitoring internal humidity to elucidate the underlying shrinkage mechanisms. Their findings revealed that, at a curing age of 90 days, the autogenous shrinkage and total shrinkage of iron tailings concrete were 9.8% and 13.3% higher, respectively, than those of river sand concrete. Garcia-Troncoso et al. [20] assessed the technical and economic viability of utilizing mining waste or tailings sand as fine aggregates in conventional concrete mixtures, conducting a full life-cycle environmental impact analysis through numerical simulation tools. Liu et al. [21] conducted systematic studies on the static and dynamic strength characteristics of fine tailings sand from Tailings Pond No. 4 at the Dexing Copper Mine, employing consolidated undrained triaxial tests under high confining pressure and cyclic triaxial testing. The results demonstrated that the strength behavior of tailings silt cannot be fully characterized by a single failure envelope. Furthermore, the resistance to liquefaction increases with depth, attributed to a more stable fabric in deeper layers. Within a dry density range of 1.51 to 1.61 g/cm3, liquefaction resistance was found to increase with increasing dry density. Yang et al. [22] explored the potential of treating lead–zinc tailings using microbial-induced carbonate precipitation (MICP) for use as subgrade material. The unconfined compressive strength and heavy metal leaching behavior of treated tailings with varying particle sizes were evaluated from both mechanical and environmental safety perspectives. Chen et al. [23] designed four distinct concrete mixtures incorporating iron tailings sand and subjected them to elevated temperatures of 20 °C, 100 °C, 300 °C, 500 °C, and 700 °C to investigate the effects of temperature, air-entraining agents, steel fibers, and polypropylene fibers on performance degradation.
While previous studies have largely emphasized soil stabilization techniques and the strength parameters of tailings sand, research on fundamental physical and mechanical properties remains relatively limited. Therefore, based on field samples from a tailings pond in Northwest China, this study conducted comprehensive geotechnical laboratory tests on tailings sand fillers to examine the relationships among moisture content, density, particle composition, and depth. Meanwhile, compaction tests and soil-water characteristic tests were conducted on tailings sand to investigate the optimal moisture content and maximum dry density of the fillers, as well as the soil-water characteristic curves under different particle sizes and dry densities. This study investigates the engineering properties of tailings sands in the arid regions of Northwest China. Through on-site sampling and analysis, the research provides a more accurate representation of the engineering conditions in the Northwest. The findings hold crucial scientific importance for ensuring the safety of tailings dams and supporting ecological restoration efforts in this distinctive environmental setting.
2. Test Methods and Procedures
2.1. Project Background
The research site is situated within a tailings dam in the northwest region of China, which lies in the temperate continental climate zone of the North Temperate Zone. The region experiences an average annual temperature of 5.9 °C, with approximately 3056 h of sunshine annually and a frost-free period of about 130 days. The maximum depth of seasonal ground freezing ranges from 1.32 to 1.61 m. Precipitation is predominantly concentrated between July and September, with an average annual rainfall of around 420 mm. Intense rainfall events significantly influence hydrological conditions within embankment structures, increasing pore water pressure and reducing soil shear strength due to elevated moisture content [24,25,26]. Figure 1 shows the actual situation on site.
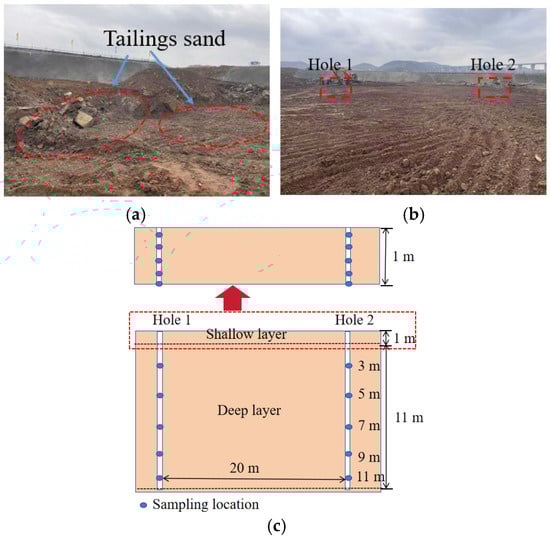
Figure 1.
The actual situation on site. (a) Tailings sand; (b) project location; (c) diagram of holes and sampling location.
2.2. Test Methods
2.2.1. Bulk Density and Moisture Content Test
Bulk density and moisture content measurements were performed using the ring-knife method and the drying method, respectively. Due to site constraints, samples were collected solely from tailings sand located 1 m below the surface. The equipment employed included ring knives, electronic balances, and drying ovens. For comparative analysis, four groups of sampling points were established, with soil specimens extracted at depths of 20, 40, 60, 80, and 100 cm from each location.
2.2.2. Specific Gravity Test
The specific gravity was determined using the pycnometer method. Testing equipment comprised a pycnometer, a constant-temperature water bath, an electronic balance, and a thermometer. To account for potential measurement variability, samples were collected from two boreholes. From each borehole, material was taken at depth intervals of 1–2 m, 2–4 m, 4–6 m, 6–8 m, and 8–10 m for analysis. The pycnometer employed in the tests is shown in Figure 2.
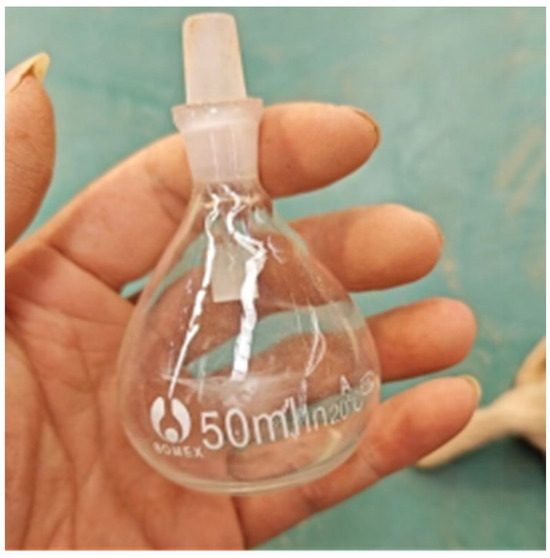
Figure 2.
Specific gravity bottle.
2.2.3. Particle-Size Analysis Test
Particle-size analysis was performed to characterize the soil gradation by determining parameters such as the coefficient of curvature (Cc) and the coefficient of uniformity (Cu). Since the mass of particles smaller than 0.075 mm exceeded 10% of the total sample mass, a combined sieving and hydrometer method was employed. The main equipment included standard sieves, an electronic balance, graduated cylinders, and a Type A hydrometer. Sampling locations and depth intervals (1–2 m, 2–4 m, 4–6 m, 6–8 m, and 8–10 m) corresponded to those used in the specific gravity tests. After retrieval, samples were air-dried and analyzed separately by sieving and hydrometry to determine the particle-size distribution at each depth. In the sieving procedure, air-dried soil was passed through a stack of standard sieves; the mass retained on each sieve was measured and expressed as a percentage of the total sample mass. The sieving setup is illustrated in Figure 3.
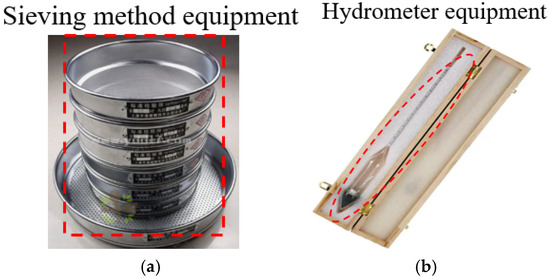
Figure 3.
Particle analysis equipment. (a) Sieving method equipment; (b) hydrometer equipment.
Particle-size distribution analysis was conducted to characterize the tailings sand, including the determination of mass percentages finer than specific grain sizes, overall particle composition, and grading parameters such as the coefficient of uniformity (Cu) and the coefficient of curvature (Cc). Since the fraction of particles smaller than 0.075 mm exceeded 10% of the total mass, the grain-size distribution of this fine fraction was further analyzed using the hydrometer method. Key instruments employed in the tests included standard sieves, an electronic balance, graduated cylinders, and a hydrometer. The volume of soil suspension used in the hydrometer analysis was calculated according to reference Equation (1).
where, m—Mass of air-dried soil; ms—Mass of soil required for the test; w—Moisture content of the soil after air-drying.
According to Stokes’ law, the calculation formula for particle size is shown in Equation (2).
where, —particle size (mm); —dynamic viscosity coefficient of water (10−3 Pa·s); —bulk density of pure water at −4 °C (g/cm 3); L—settling distance of soil particles within a certain period of time; —specific gravity of water at °C; —specific gravity of soil particles; and —sedimentation time.
The calculation formula for the mass fraction of samples smaller than a certain particle size is shown in Equation (3).
where, —mass percentage of the sample smaller than a certain particle size (%); —correction value of soil particle specific gravity; —hydrometer reading; —suspension temperature correction value; —dispersant calibration value; —meniscus correction value; and —dry mass of the sample (g).
2.2.4. Compaction Test
Representative tailings sand samples, sieved through a 0.5 mm aperture, were air-dried outdoors for 10 h. After removing surface impurities, the material was divided into 4 groups, with each group further split into 5 equal portions. The moisture content of each portion was adjusted in accordance with standard compaction procedures to target values of 8%, 10%, 12%, 14%, and 16%, respectively. Following thorough mixing, the prepared samples were sealed in plastic film and cured for 24 h. Compaction was then performed using the heavy compaction method. The equipment used for the heavy compaction test is shown in Figure 4.
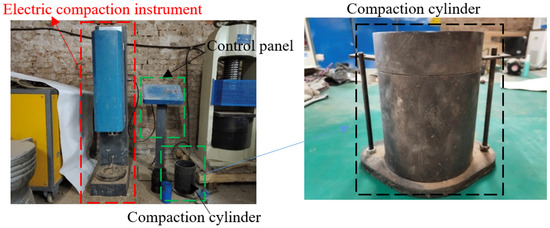
Figure 4.
Compaction test equipment.
2.2.5. Soil-Water Characteristic Test
First, the tailings sand is sieved and dried. Subsequently, based on the target dry density, the material is compacted into a ring knife using a compaction device to prepare cylindrical specimens. Finally, the prepared samples are subjected to vacuum evacuation and saturation to ensure uniform initial conditions across all specimens. During testing, each sample is placed in a sealed container together with dry, standard filter paper. After equilibrium is achieved, the moisture content of the filter paper is measured, and the soil sample’s matric suction is determined by means of its calibration curve.
3. Results and Analysis
A series of laboratory geotechnical tests, including bulk density, moisture content, specific gravity, particle-size analysis, compaction tests and soil-water characteristic tests, were conducted on the in situ tailings sand materials to determine its fundamental physical and mechanical properties. To eliminate errors, two additional comparison experiments were conducted for the same test. All experiments were conducted under constant ambient temperature conditions maintained at 20 °C. To minimize experimental errors, two replicate tests were conducted for each parameter measured in this study.
3.1. Bulk Density and Moisture Content
Bulk density and moisture content tests were performed on the in situ tailings sand. The variations in these parameters with depths within the upper 1 m were investigated.
3.1.1. Relationship of Moisture Content with Depth
Figure 5 illustrates the distribution trend of moisture content with depth at different locations in two boreholes on site. To minimize measurement errors, five sets of soil samples were collected at each depth interval.
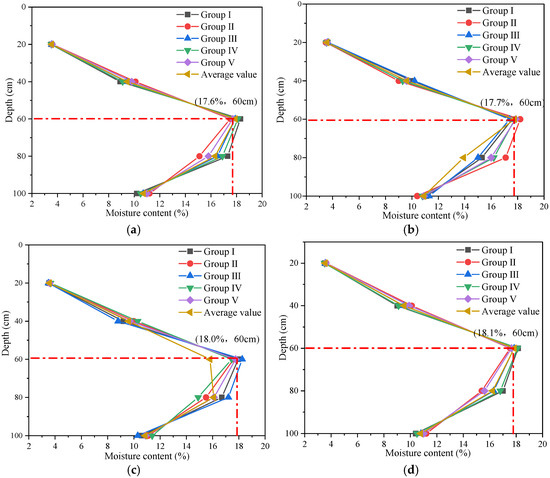
Figure 5.
The curve of the relationship between moisture content and depth of tailings sand on site. (a) Hole 1–position 1; (b) Hole 1–position 2; (c) Hole 2–position 1; (d) Hole 2–position 2.
As shown in Figure 5, the moisture content increases markedly with depth from 20 to 60 cm, reaching a peak of approximately 18% at 60 cm. Below this depth, from 60 to 100 cm, the moisture content gradually declines, falling to about 10% at 100 cm—a value still higher than that at the 20 cm depth. This distribution pattern is characteristic of tailings sand, where the combined effects of self-weight consolidation and groundwater distribution initially raise the moisture content in shallow layers. Around 60 cm, the groundwater condition stabilizes, leading to reduced variation and a subsequent slight decrease in moisture content. The high consistency between the two moisture content curves demonstrates good data repeatability and effective error control, confirming the reliability of the experimental results.
In practice, the in situ moisture content should be adjusted close to the optimum value, and compaction should achieve a dry bulk density of no less than 95% of the maximum to ensure sufficient strength and stability.
3.1.2. Bulk Density Variation with Depth
Figure 6 presents the in situ test results of tailings sand bulk density as a function of depth. To minimize measurement errors, five replicate soil samples were collected at each depth interval.
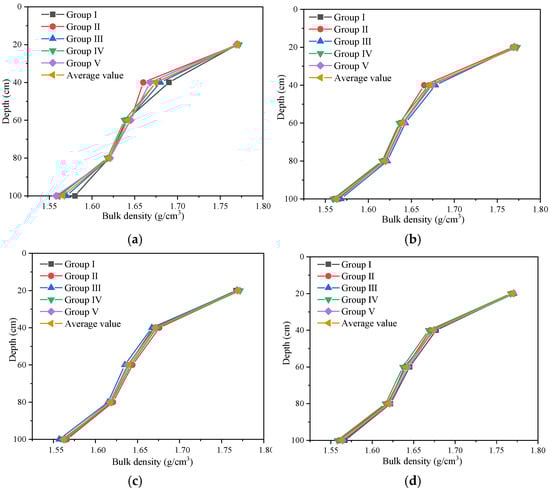
Figure 6.
The relationship curve between the bulk density and depth of tailings sand on site. (a) Hole 1–position 1; (b) Hole 1–position 2; (c) Hole 2–position 1; (d) Hole 2–position 2.
As illustrated in Figure 6, the bulk density of the soil samples gradually decreases with increasing depth, indicating a negative correlation between these two variables. Distinct inflection points are observed at depths of approximately 40 cm and 80 cm, suggesting changes in the rate of bulk density variation at these locations. Specifically, within the depth range of 0 to 40 cm, the bulk density decreases significantly with depth, exhibiting a relatively large variation range. In contrast, between 40 cm and 100 cm, the rate of bulk density change becomes more gradual, with a considerably smaller reduction magnitude. This distribution pattern can be primarily attributed to surface compaction due to external loading and the natural consolidation of soil under its own weight, resulting in a higher bulk density in the upper layers that progressively transitions to a looser state with increasing depth. Overall, the relationship between bulk density and depth can be reasonably approximated by a piecewise linear trend.
3.2. Analysis of Specific Gravity Test Results
Figure 7 illustrates the variation in specific gravity with depth for in situ tailings sand. To ensure data reliability, samples were collected from two distinct boreholes and analyzed at depth intervals of 1–2 m, 2–4 m, 4–6 m, 6–8 m, 8–10 m, and 10–12 m at each location.
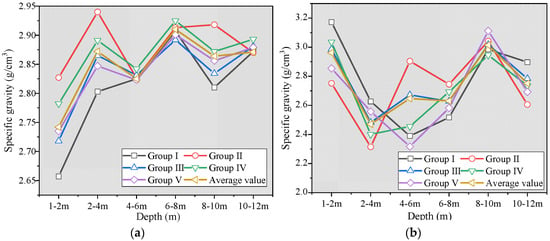
Figure 7.
The variation in specific gravity with depth. (a) Hole 1; (b) Hole 2.
As shown in Figure 7, the specific gravity exhibits differing trends with depth between the two boreholes. In Borehole 1, specific gravity generally follows an alternating pattern characterized by an initial increase followed by a decrease, whereas Borehole 2 displays an inverse trend, with an initial decrease followed by an increase. Overall, no consistent or continuous depth-dependent trend is evident. A comparative analysis further reveals that specific gravity in Borehole 2 fluctuates more significantly and over a broader range with depth.
Numerically, the measured specific gravity ranges from 2.73 to 2.90 in Borehole 1 and from 2.50 to 2.90 in Borehole 2. These values exceed the typical range observed in natural sand (2.65–2.69). Given that the study site is a tailings pond, the elevated specific gravity is likely attributable to the presence of relatively dense iron-ore constituents within the tailings material. This observation is consistent with local geological conditions and supports the credibility of the test results.
3.3. Analysis of Particle-Size Distribution
Particle-size analysis was performed on air-dried soil samples to characterize the gradation of the tailings sand. The sieving method was used for particles larger than 1 mm, and the hydrometer method was applied for particles smaller than 1 mm.
3.3.1. Sieving Test Results
Figure 8 presents the particle-size distributions obtained from sieving tests on two sets of tailings sand samples.
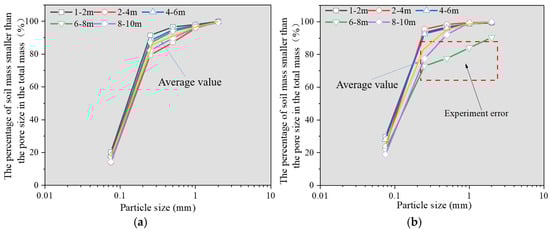
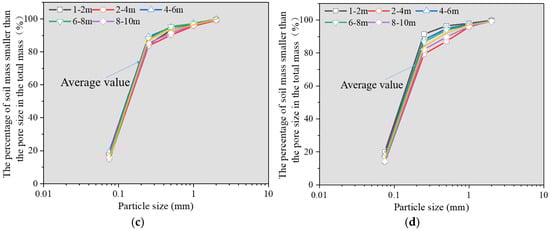
Figure 8.
Test results of the sieving method. (a) Hole 1–position 1; (b) Hole 1–position 2; (c) Hole 2–position 1; (d) Hole 2–position 2.
As shown in Figure 8, the tailings sand in this area consists predominantly of coarse particles, with most grains larger than 0.1 mm. The content of fine particles is relatively low, accounting for approximately 17%–20% of the total mass. The consistent distribution trends between the four sets of experiments indicate good repeatability and reliability of the testing procedure.
A further comparison of Figure 8a,b reveals that within the depth range of 0–6 m, the particle-size distributions of the two sample sets are relatively similar. Below 6 m to 10 m, however, the particle composition varies noticeably with depth. Overall, except for the second sample set at 6–8 m depth, the fraction of particles smaller than 2 mm in all other samples remains around 98%, indicating that the tailings sand is primarily composed of fine to medium-coarse sand, with a relatively uniform and concentrated gradation.
3.3.2. Hydrometer Test Results
The hydrometer method was employed to determine the particle-size distribution of the soil fraction finer than 1 mm. The temperature in the laboratory is 20 °C.
Figure 9 shows the cumulative particle-size distribution, as measured by the hydrometer method, for the sub 1 mm fraction of four sample sets after sieving. As illustrated, the relationship between cumulative percentage passing and particle size generally follows a negatively curved, approximately exponential pattern. Within the upper 6 m, the cumulative curves decline relatively gradually with decreasing particle size. Below 6 m, however, the curves drop more steeply, indicating a more pronounced increase in fine-particle content as particle size decreases.
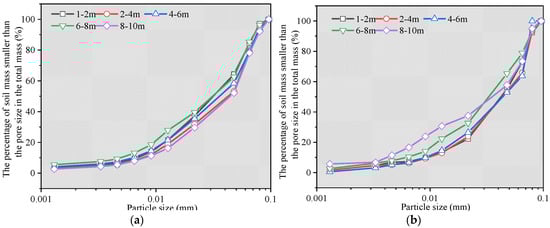
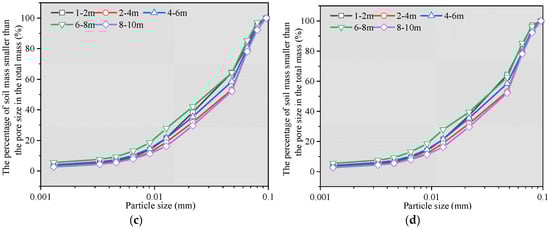
Figure 9.
Test results by the hydrometer method. (a) Hole 1–position 1; (b) Hole 1–position 2; (c) Hole 2–position 1; (d) Hole 2–position 2.
Comparison of the curves across depths reveals that, for a given particle size, the cumulative percentage passing is generally higher in deeper samples than in shallower ones. This suggests that with increasing depth, the tailings sand exhibits a more uniform gradation and a higher relative content of fine particles.
Based on standard engineering classification for sandy soils, sand containing 5%–15% fines is classified as silty sand, while sand with 15%–50% fines is termed sandy silt. Particle-size analysis of the tailings sand indicates that the material in the study area corresponds to silty sand or sandy silt, with coefficients of uniformity Cu = 2.05–3.11 and coefficients of curvature Cc = 0.73–0.98. These values reflect poorly graded soil. Cu and Cc were calculated using Equations (4) and (5), respectively. Given the poor gradation (Cu = 2.04–3.1, Cc = 0.72–0.97), which indicates a uniform and discontinuous particle size distribution, mechanical stabilization measures are advisable for foundation applications. Mixing with a limited percentage of coarse-grained aggregates is recommended to improve grain-size distribution, enhance interparticle locking, and reduce liquefaction potential.
where, d10, d30, d60, respectively, represent particle sizes with cumulative percentage contents of 10%, 30%, and 60%.
3.4. Analysis of Compaction Test Results
The compaction test was conducted on the tailings sand at hole 1, with a total of four groups. The test results are shown in Figure 10. The maximum dry density and the optimal moisture content obtained by the four groups of tests, as well as the average values of the maximum dry density and the optimal moisture content, are presented in Table 1.
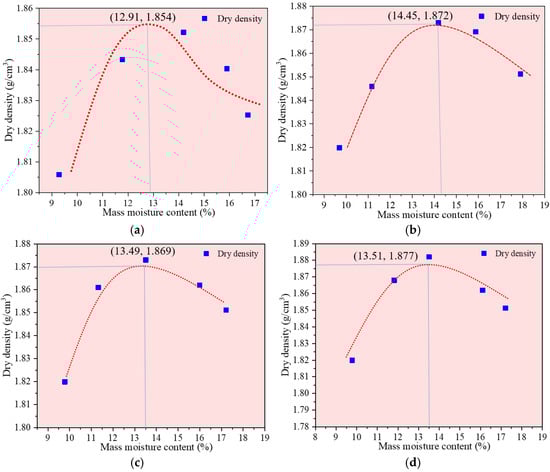
Figure 10.
Compaction test curve. (a) Group 1; (b) Group 2; (c) Group 3; (d) Group 4.

Table 1.
Compaction test results.
It can be seen from Figure 11 and Table 1 that the maximum dry density and the optimal moisture content of the first group of compaction tests are 1.854 g/cm3 and 12.91%, respectively, and those of the second group of compaction tests are 1.872 g/cm3 and 14.45%, respectively. The maximum dry density and the optimal moisture content of the third group of compaction tests were 1.869 g/cm3 and 13.49% respectively, and those of the fourth group of compaction tests were 1.877 g/cm3 and 13.51%, respectively. The average optimal moisture content of the four groups of experiments was 13.59%, and the average maximum dry density was 1.868 g/cm3.
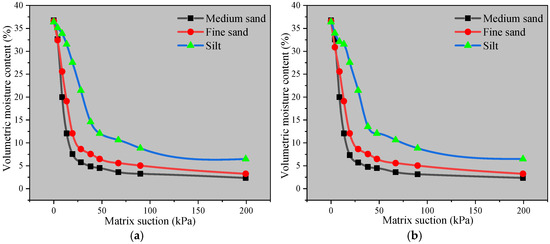
Figure 11.
Soil-water characteristic curves of tailings sands with different particle sizes. (a) Group 1; (b) Group 2.
3.5. Analysis of Soil-Water Characteristic Curves for Tailings Sand
Tailings sand is composed of fine-grained mineral particles remaining after mineral processing. Its microstructure is characterized by a wide range of particle sizes, irregular shapes, and numerous sharp corners. The particle surfaces are rough, and the pore structure is complex, often presenting a flocculent or honeycomb-like arrangement. These features result in its low compressibility, high porosity, low permeability, and significant structural properties. This section presents the soil-water characteristic analysis conducted on sieved tailings sand, with a focus on examining the effects of particle size and dry density.
3.5.1. Effect of Particle Size on the Soil-Water Characteristic Curve
The tailings sand was classified into three groups based on particle size: medium sand, fine sand, and silty sand. Specimens for each group were prepared at their respective optimum moisture content and maximum dry density. Detailed parameters for the prepared samples are provided in Table 2.
Table 2.
The sample scheme.
As shown in Figure 11, under identical dry density conditions, an increase in the particle size of tailings sand corresponds to a steeper slope of the soil-water characteristic curve and a lower air-entry value. This indicates that coarser tailings sand drains more readily, exhibits a lower volumetric water content at equilibrium, and requires less suction to maintain the same water content. These trends can be attributed to the larger particle size, which increases the number and size of pores while reducing the specific surface area. Consequently, the adsorption of water molecules onto particle surfaces is weaker, and a smaller matric suction is needed to drain an equivalent volume of water.
Furthermore, the soil-water characteristic curves of the tailings medium sand and fine sand are relatively similar, whereas that of the tailings silty sand is noticeably flatter. At matric suctions below 5 kPa, both the medium and fine sands begin to lose water. After exceeding the air-entry value, their water-loss rates during stepped pressurization are significantly higher than that of the silty sand. These results demonstrate that particle-size distribution substantially influences the soil-water characteristic behavior of tailings sand [27,28,29,30].
3.5.2. Effect of Dry Density on the Soil-Water Characteristic Curve
Figure 12, Figure 13 and Figure 14 illustrate the influence of varying dry densities on the soil-water characteristic curves for the tailings medium sand, fine sand, and silty sand, respectively.
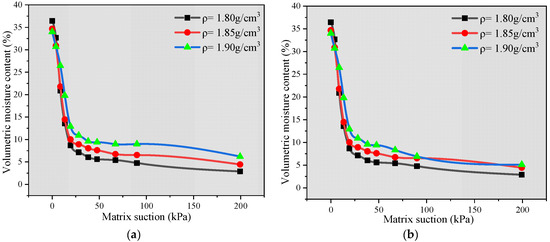
Figure 12.
The influence of different dry densities of medium sand on the soil-water characteristic curve. (a) Group 1; (b) Group 2.
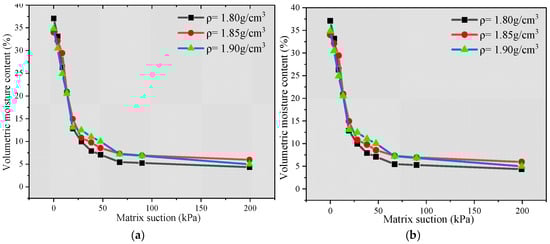
Figure 13.
The influence of different dry densities of fine sand on the soil-water characteristic curve. (a) Group 1; (b) Group 2.
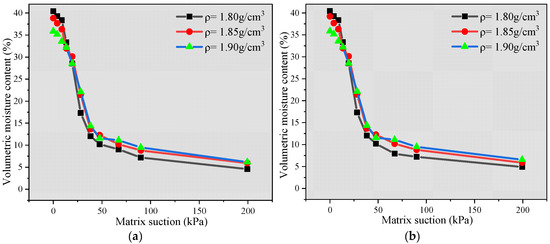
Figure 14.
The influence of different dry densities of silt on the soil-water characteristic curve. (a) Group 1; (b) Group 2.
As seen in Figure 12 and Figure 13, both the medium and fine sands exhibit low air-entry values; once air pressure is applied, the volumetric water content drops rapidly. Increasing the dry density does not significantly alter these air-entry values. This behavior stems from the fact that in sandy materials, large pores—which drain readily under low suction—dominate the water release. When the sample contains a high proportion of coarse grains, an increase in dry density mainly reduces the voids between large and small particles, while the larger inter-particle pores remain relatively unaffected. Consequently, the air-entry value changes little, whereas the residual water content rises noticeably.
In contrast, Figure 14 shows that the silty sand has a higher air-entry value, which increases appreciably with dry density. Because silt particles are fine, the pore structure consists predominantly of medium and small pores. As dry density rises, medium pores are compressed into smaller ones, leading to a more pronounced increase in the air-entry value compared with the coarser sands.
Furthermore, Figure 12, Figure 13 and Figure 14 indicate that, for a given particle-size fraction, varying the dry density has minimal effect on the matric suction at which the residual stage is reached; all specimens enter the residual stage at a similar suction level. The boundary-effect stage of the curve is not distinct, and transition to the main drying branch occurs at relatively low suction. Thus, the primary influence of dry density is reflected in the slope of the transition stage: a higher dry density yields a flatter curve, corresponding to a slower drainage rate. This is attributed to the increased number of particle-contact points in a denser packing, which requires greater matric suction to remove an equivalent volume of water [31,32,33,34].
The soil-water characteristic curve results imply that in scenarios involving drainage or unsaturated conditions, the relatively larger particle sizes facilitate drainage, but increased dry density may retard the drainage rate—a factor that should be considered in seepage and stability assessments.
4. Conclusions
Laboratory geotechnical testing and soil-water characteristic analysis were conducted to investigate the basic physical and mechanical properties of in situ tailings sand in northwestern China. The main findings are summarized as follows:
- (1)
- The moisture content of tailings sand increases with depth in the shallow layer and subsequently stabilizes, whereas the dry density decreases approximately linearly with depth across the tested range, indicating variations in compaction state under the influence of self-weight and external loading.
- (2)
- The specific gravity of the material ranges from 2.50 to 2.90, exceeding that of typical natural sand, which is attributed to the presence of iron-bearing components in the tailings. Particle-size analysis reveals a coefficient of uniformity (Cu) between 2.05 and 3.11 and a curvature coefficient (Cc) ranging from 0.73 to 0.97, indicating poorly graded material classified as silt to sandy silt.
- (3)
- Compaction testing yielded an optimal moisture content of approximately 13.2% and a maximum dry density of 1.863 g/cm3, providing essential parameters for the control of fill placement and compaction procedures.
- (4)
- Soil-water characteristic behavior is significantly influenced by particle size and dry density. Larger particle sizes enhance drainage capacity and reduce the suction required for dewatering. Increased dry density markedly reduces the drainage rate but has only a minor effect on the suction at which the residual stage is attained.
5. Limitation
This study determined the physical and mechanical properties of tailings sand at a burial depth of one meter. However, the applicability and extrapolation value of this method are limited when extended to deeper layers or to the overall engineering practices of tailings dams. It needs to be determined based on the actual situation.
Author Contributions
Conceptualization, Y.Z. and L.H.; methodology, Y.Z. and W.G.; software, Y.Z. and Y.L.; investigation, Y.L.; resources, L.H. and W.G.; data curation, J.Z.; writing—Y.Z.; original draft preparation, W.G.; writing—review and editing, Y.Z. and Y.L. All authors have read and agreed to the published version of the manuscript.
Funding
This study was funded by the National Natural Science Foundation of China (42307198). Recipient: Y.L. This study was funded by the Key Scientific Research Project Plan of Institutions of Higher Education in Henan Province (No. 25A580010; No. 26B410002). Recipient: L.H. This study was funded by the Jiaozuo Municipal Science and Technology Program Project (No. 2024410003). Recipient: L.H.
Data Availability Statement
All data, models, and codes generated or used during the study appear in the submitted article.
Conflicts of Interest
The authors declare no conflict of interest.
References
- Mitchell, R.J.; Wong, B.C. Behaviour of cemented tailings sands. Can. Geotech. J. 1982, 19, 289–295. [Google Scholar] [CrossRef]
- Fourie, A.B.; Hofmann, B.A.; Mikula, R.J.; Lord, E.R.F.; Robertson, P.K. Partially saturated tailings sand below the phreatic surface. Géotechnique 2001, 51, 577–585. [Google Scholar] [CrossRef]
- James, M.; Aubertin, M.; Wijewickreme, D.; Wilson, G.W. A laboratory investigation of the dynamic properties of tailings. Can. Geotech. J. 2011, 48, 1587–1600. [Google Scholar] [CrossRef]
- Villavicencio, G.; Espinace, R.; Palma, J.; Fourie, A.; Valenzuela, P. Failures of sand tailings dams in a highly seismic country. Can. Geotech. J. 2014, 51, 449–464. [Google Scholar] [CrossRef]
- Lai, Y.; Yu, J.; Liu, S.; Liu, J.; Wang, R.; Dong, B. Experimental study to improve the mechanical properties of iron tailings sand by using MICP at low pH. Constr. Build. Mater. 2021, 273, 121729. [Google Scholar] [CrossRef]
- Zhao, J.; Jia, J.; Liu, L.; Liu, X.; Cai, G. Research on moisture field evolution and settlement deformation mechanisms induced by infiltration at slope toe of high-fill loess subgrade based on model experiment. Transp. Geotech. 2026, 57, 101817. [Google Scholar] [CrossRef]
- Quan, W.; Huang, W.; Li, Z.; Mao, W.; Miao, X.; Hou, L.; Bu, X.; Wei, J.; Hao, L. A new approach for improving the properties of tailings sand autoclaved aerated concrete-From a mineralogical perspective. Constr. Build. Mater. 2024, 441, 137584. [Google Scholar] [CrossRef]
- Xu, W.; Wen, X.; Wei, J.; Xu, P.; Zhang, B.; Yu, Q.; Ma, H. Feasibility of kaolin tailing sand to be as an environmentally friendly alternative to river sand in construction applications. J. Clean. Prod. 2018, 205, 1114–1126. [Google Scholar] [CrossRef]
- Pan, X.; Jia, J. Time-dependent system reliability analysis of anchor-reinforced slopes based on surrogate models. Comput. Geotech. 2025, 184, 107257. [Google Scholar] [CrossRef]
- Vedoy, D.R.; Soares, J.B. Water-soluble polymers for oil sands tailing treatment: A Review. Can. J. Chem. Eng. 2015, 93, 888–904. [Google Scholar] [CrossRef]
- Cossey, H.L.; Batycky, A.E.; Kaminsky, H.; Ulrich, A.C. Geochemical stability of oil sands tailings in mine closure landforms. Minerals 2021, 11, 830. [Google Scholar] [CrossRef]
- Saborimanesh, N. Toward sustainable remediation of oil sands fine tailings—A review. J. Environ. Manag. 2021, 288, 112418. [Google Scholar] [CrossRef]
- Sari, M.; Yilmaz, E.; Kasap, T. Long-term ageing characteristics of cemented paste backfill: Usability of sand as a partial substitute of hazardous tailings. J. Clean. Prod. 2023, 401, 136723. [Google Scholar] [CrossRef]
- Foght, J.M.; Gieg, L.M.; Siddique, T. The microbiology of oil sands tailings: Past, present, future. FEMS Microbiol. Ecol. 2017, 93, fix034. [Google Scholar] [CrossRef] [PubMed]
- Small, C.C.; Cho, S.; Hashisho, Z.; Ulrich, A.C. Emissions from oil sands tailings ponds: Review of tailings pond parameters and emission estimates. J. Pet. Sci. Eng. 2015, 127, 490–501. [Google Scholar] [CrossRef]
- Ikotun, J.; Adeyeye, R.; Otieno, M. Application of mine tailings sand as construction material–a review. MATEC Web Conf. 2022, 364, 05008. [Google Scholar] [CrossRef]
- Shi, J.; Pan, W.; Kang, J.; Yu, Z.; Sun, G.; Li, J.; Zheng, K.; Shen, J. Properties of Ultra-High Performance Concrete incorporating iron tailings powder and iron tailings sand. J. Build. Eng. 2024, 83, 108442. [Google Scholar] [CrossRef]
- Xu, Y.; Dabros, T.; Kan, J. Filterability of oil sands tailings. Process Saf. Environ. Prot. 2008, 86, 268–276. [Google Scholar] [CrossRef]
- Zhang, Z.; Zhang, Z.; Yin, S.; Yu, L. Utilization of iron tailings sand as an environmentally friendly alternative to natural river sand in high-strength concrete: Shrinkage characterization and mitigation strategies. Materials 2020, 13, 5614. [Google Scholar] [CrossRef]
- Garcia-Troncoso, N.; Baykara, H.; Cornejo, M.H.; Riofrio, A.; Tinoco-Hidalgo, M.; Flores-Rada, J. Comparative mechanical properties of conventional concrete mixture and concrete incorporating mining tailings sands. Case Stud. Constr. Mater. 2022, 16, e01031. [Google Scholar] [CrossRef]
- Liu, H.M.; Yang, C.H.; Zhang, C.; Mao, H.J. Study on static and dynamic strength characteristics of tailings silty sand and its engineering application. Saf. Sci. 2012, 50, 828–834. [Google Scholar] [CrossRef]
- Yang, Z.; Liu, L.; Dong, Y.; Liu, X.; Wang, X. Analysis of unconfined compressive strength and environmental impact of MICP-treated lead-zinc tailings sand instead of sand as embankment material. Sci. Total Environ. 2024, 931, 172809. [Google Scholar] [CrossRef]
- Chen, J.; Yuan, Y.; Zhu, Q.; Duan, J. High-temperature resistance of high-strength concrete with iron tailing sand. J. Build. Eng. 2023, 63, 105544. [Google Scholar] [CrossRef]
- Chalaturnyk, R.J.; Scott, J.D.; Özüm, B. Management of oil sands tailings. Pet. Sci. Technol. 2002, 20, 1025–1046. [Google Scholar] [CrossRef]
- Fan, J.; Zhang, Y.; Peng, Y.; Xing, Z.; Yuan, K.; Cui, J.; Liu, B.; Zhou, W. Study on the disaster mechanism and prevention technology of embankment slip-collapse after extreme rainfall in the loess area. Sci. Rep. 2025, 15, 20613. [Google Scholar] [CrossRef] [PubMed]
- Polemio, M.; Lollino, P. Failure of infrastructure embankments induced by flooding and seepage: A neglected source of hazard. Nat. Hazards Earth Syst. Sci. 2011, 11, 3383–3396. [Google Scholar] [CrossRef]
- Raj, M.; Sengupta, A. Rain-triggered slope failure of the railway embankment at Malda, India. Acta Geotech. 2014, 9, 789–798. [Google Scholar] [CrossRef]
- Liu, X.; Congress, S.S.C.; Cai, G.; Liu, L.; Liu, S.; Puppala, A.J.; Zhang, W. Development and validation of a method to predict the soil thermal conductivity using thermal piezocone penetration testing (T-CPTU). Can. Geotech. J. 2022, 59, 510–525. [Google Scholar] [CrossRef]
- Li, Z.; Ma, J.; Liu, X.; Liu, L.; Cai, G.; Peng, L.; Chen, B.; Liang, X.; Xiong, H. Exploring the temperature, humidity, and deformation characteristics of gravel replacement foundations in seasonally frozen zones: A model testing study. Bull. Eng. Geol. Environ. 2025, 84, 141. [Google Scholar] [CrossRef]
- Garakani, A.A.; Haeri, S.M.; Khosravi, A.; Habibagahi, G. Hydro-mechanical behavior of undisturbed collapsible loessial soils under different stress state conditions. Eng. Geol. 2015, 195, 28–41. [Google Scholar] [CrossRef]
- Mahedi, M.; Cetin, B.; Cetin, K.S. Freeze-thaw performance of phase change material (PCM) incorporated pavement subgrade soil. Constr. Build. Mater. 2019, 202, 449–464. [Google Scholar] [CrossRef]
- Bao, H.; Song, Z.; Lan, H.; Ma, Y.; Yan, C.; Liu, S. Analysis of the mechanical effects and influencing factors of cut-fill interface within loess subgrade. Eng. Fail. Anal. 2024, 163, 108488. [Google Scholar] [CrossRef]
- Li, Z.; Lv, S.; Liu, L.; Guo, J.; Liu, T. Compressive Deformation Characteristics of Sintered Loess after Being Saturated with Water. Int. J. Geomech. 2024, 24, 04024177. [Google Scholar] [CrossRef]
- Liu, L.; Liu, T.; Liu, X.; Li, Z.; Cai, G. Key influencing factors and prediction model for the tensile strength of compacted clayey loess. Bull. Eng. Geol. Environ. 2025, 84, 404. [Google Scholar] [CrossRef]


Disclaimer/Publisher’s Note: The statements, opinions and data contained in all publications are solely those of the individual author(s) and contributor(s) and not of MDPI and/or the editor(s). MDPI and/or the editor(s) disclaim responsibility for any injury to people or property resulting from any ideas, methods, instructions or products referred to in the content. |
© 2026 by the authors. Licensee MDPI, Basel, Switzerland. This article is an open access article distributed under the terms and conditions of the Creative Commons Attribution (CC BY) license.